All September Non-OPEC Oil Production Increase from US

A Guest Post by Ovi

Below are a number of Crude plus Condensate (C + C) production charts, usually shortened to “oil”, for Non-OPEC countries. The charts are created from data provided by the EIA’s International Energy Statistics and are updated to September 2022. This is the latest and most detailed world oil production information available. Information from other sources such as OPEC, the STEO and country specific sites such as Russia, Brazil, Norway and China is used to provide a short term outlook for future output and direction for a few countries and the world. The US report has an expanded view beyond production by adding rig and frac charts.

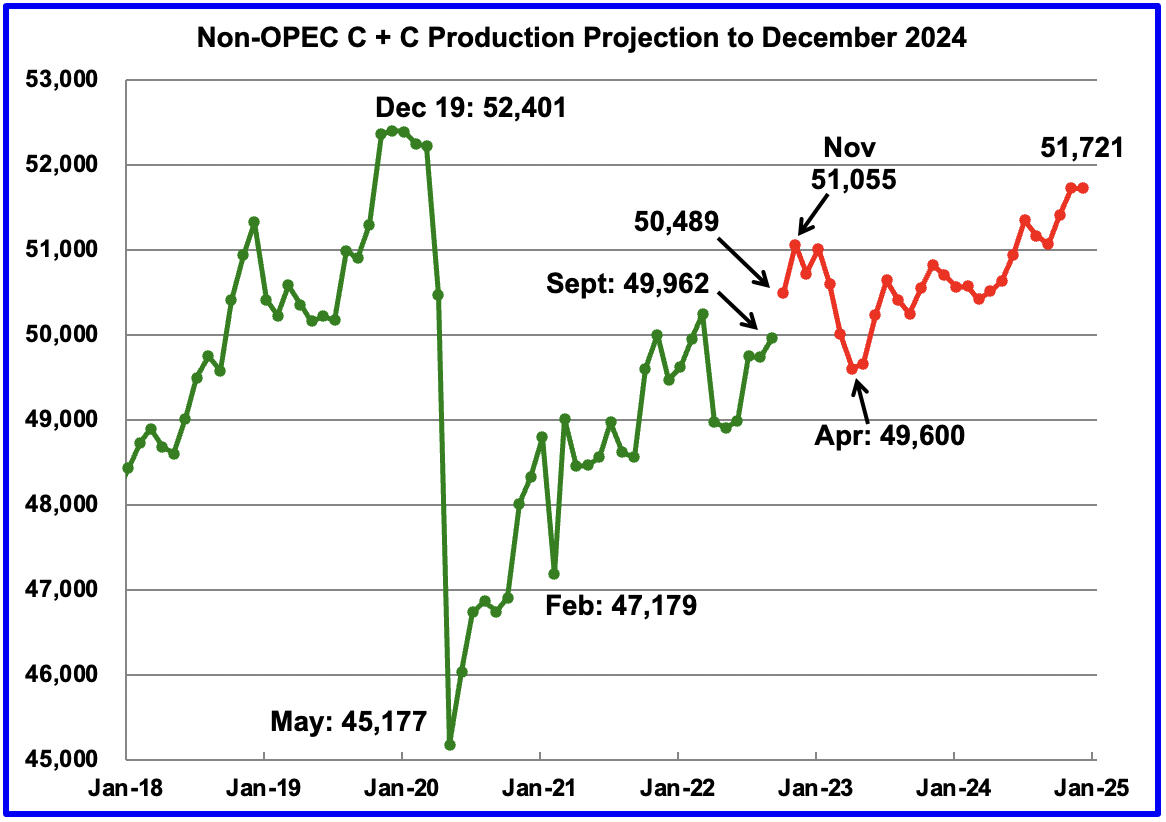
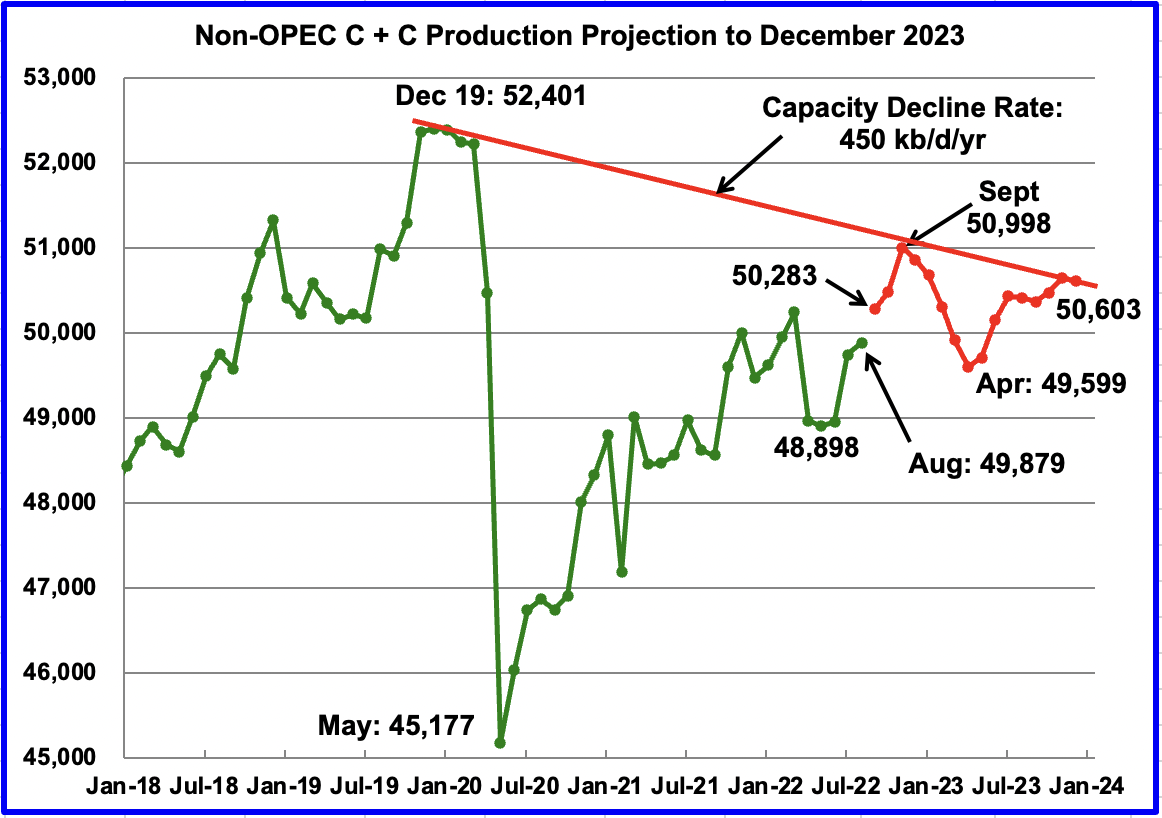
September Non-OPEC oil production increased by 229 kb/d to 49,962 kb/d. All of the increase came from the US, 289 kb/d. The largest offsetting decrease came from Norway 144 kb/d. Note that August output was revised down from 49,879 to 49,733 kb/d. This means that the September increase relative to the original August estimate is 83 kb/d.

October is expected to add 527 kb/d. This appears to be optimistic based on a few country charts below which project October production. Brazil +97 kb/d, Canada -600 kb/d, Kazakhstan +235 kb/d, Norway +100 kb/d and Russia +124 kb/d for a net of -44 kb/d. Maybe the EIA is not aware of the Canadian drop in October. The positive increments add 556 kb/d.

Read More

August Non-OPEC Oil Production Increases

A guest post by Ovi

Below are a number of Crude plus Condensate (C + C) production charts, usually shortened to “oil”, for Non-OPEC countries. The charts are created from data provided by the EIA’s International Energy Statistics and are updated to August 2022. This is the latest and most detailed world oil production information available. Information from other sources such as OPEC, the STEO and country specific sites such as Russia, Brazil, Norway and China is used to provide a short term outlook for future output and direction for a few countries and the world. The US report has an expanded view beyond production by adding rig and frac charts.

August Non-OPEC oil production increased by 138 kb/d to 49,879 kb/d. The largest increases came from Norway 147 kb/d and Brazil 124 kb/d. The largest offsetting decrease came from Kazakhstan 179 kb/d. 

Read More

May Non-OPEC Oil Production Declines Again

A guest post by Ovi

Below are a number of Crude oil plus Condensate (C + C ) production charts for Non-OPEC countries created from data provided by the EIA’s International Energy Statistics and updated to May 2022. This is the latest and most detailed world oil production information available. Information from other sources such as OPEC, the STEO and country specific sites such as Russia, Brazil, Norway and China is used to provide a short term outlook for future output and direction for a few countries and the world. The US report has an expanded view beyond production by adding rig and frac charts.

May Non-OPEC production decreased by 148 kb/d to 48,834 kb/d. The biggest decliners were Canada 193 kb/d, Brazil 120 kb/d, US 56 kb/d and Norway 38 kb/d. The biggest offsetting increases came from from Kazakhstan 148 kb/d and Russia 145 kb/d.

Read More

February Non-OPEC Oil Production Climbs

A guest post by Ovi

Below are a number of crude oil plus condensate (C + C ) production charts for Non-OPEC countries created from data provided by the EIA’s International Energy Statistics and updated to February 2022. This is the latest and most detailed world oil production information available. Information from other sources such as OPEC, the STEO and country specific sites such as Russia, Brazil, Norway and China is used to provide a short term outlook for future output and direction for a few countries and the world.

February Non-OPEC production increased by 303 kb/d to 49,926 kb/d. Of the 303 kb/d increase, the biggest increase came from Canada 225 kb/d. Offsetting the increase were decreases from Brazil 116 kb/d and China 92 kb/d. The Febuary 2022 output of 49,926 kb/d is 2,274 kb/d lower than the March pre-covid rate of 52,200 kb/d.

Read More

September Non-OPEC Oil Production Slips

A guest post by Ovi

Below are a number of oil, crude plus condensate (C + C ), production charts for Non-OPEC countries created from data provided by the EIA’s International Energy Statistics and updated to September 2021. Information from other sources such as OPEC, the STEO and country specific sites such as Russia, Brazil, Norway and China is used to provide a short term outlook for future output and direction for a few countries and the world.

Read More