A guest post by Ovi
Below are a number of Crude plus Condensate (C + C) production charts, usually shortened to “oil”, for Non-OPEC countries. The charts are created from data provided by the EIA’s International Energy Statistics and are updated to August 2022. This is the latest and most detailed world oil production information available. Information from other sources such as OPEC, the STEO and country specific sites such as Russia, Brazil, Norway and China is used to provide a short term outlook for future output and direction for a few countries and the world. The US report has an expanded view beyond production by adding rig and frac charts.
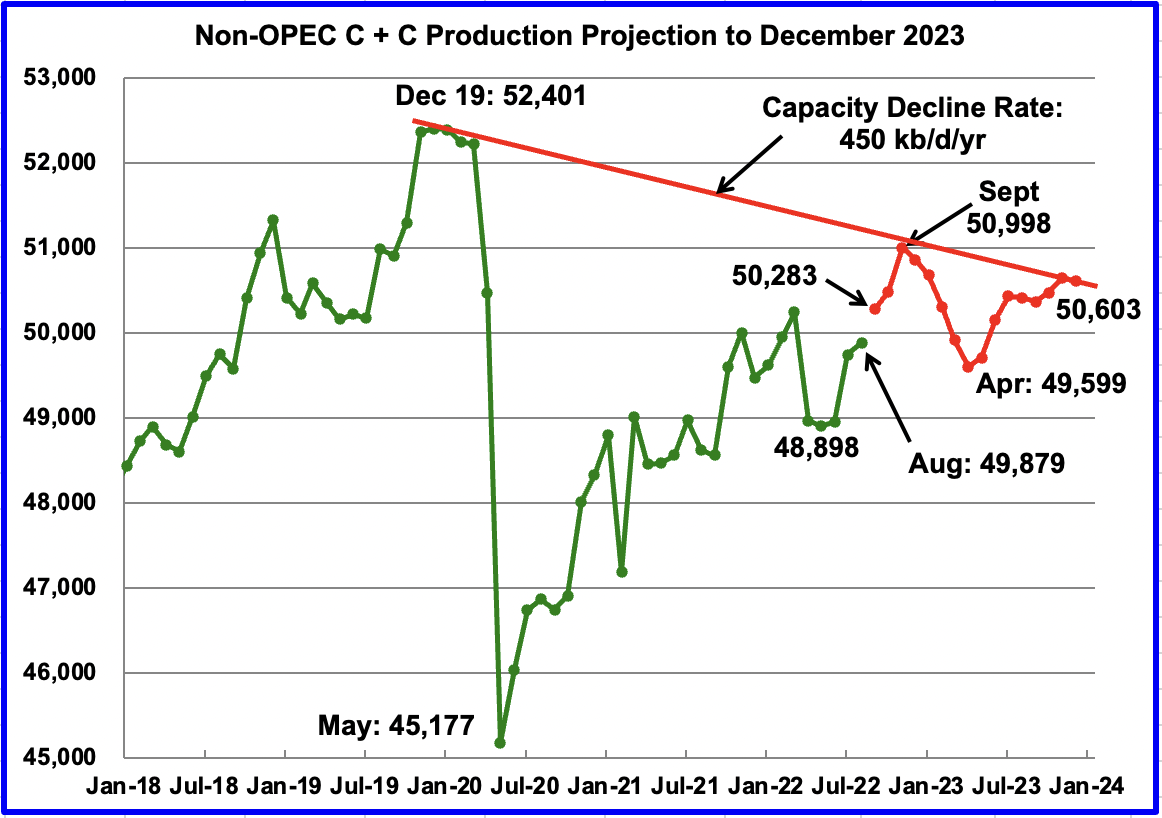
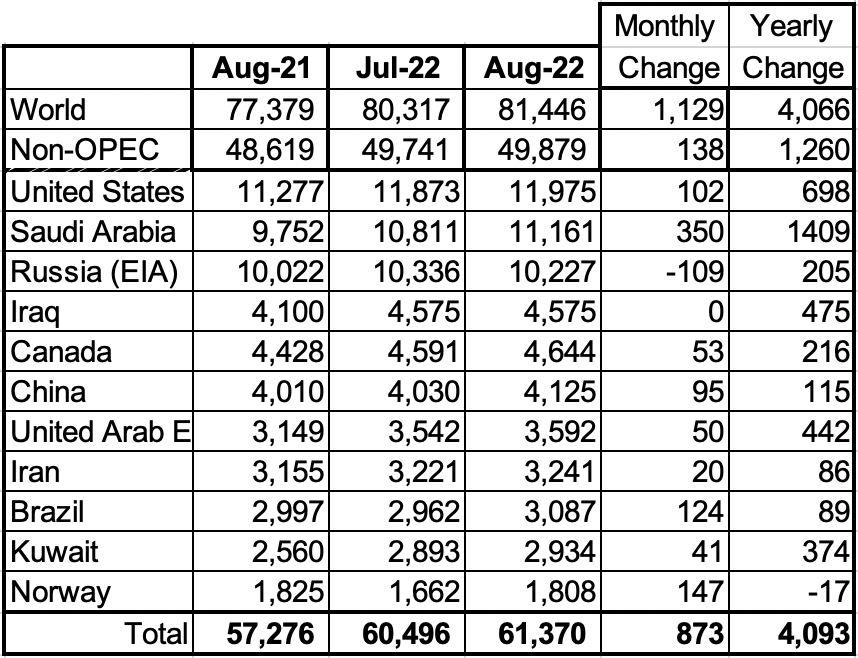
August Non-OPEC oil production increased by 138 kb/d to 49,879 kb/d. The largest increases came from Norway 147 kb/d and Brazil 124 kb/d. The largest offsetting decrease came from Kazakhstan 179 kb/d.
Using data from the December 2022 STEO, a projection for Non-OPEC oil output was made for the time period September 2022 to December 2023. (Red graph). Output is expected to reach 50,603 kb/d in December 2023, 337 kb/d higher than reported in the previous post.
Note that the September 2022 post pandemic high of 50,998 kb/d is the high for all of 2022 and 2023.
The red capacity decline line represents a two point average decline rate for Non-OPEC countries over the four years since December 2019 and is a combination of the natural decline rate plus possible reduction in exploration and production investment.
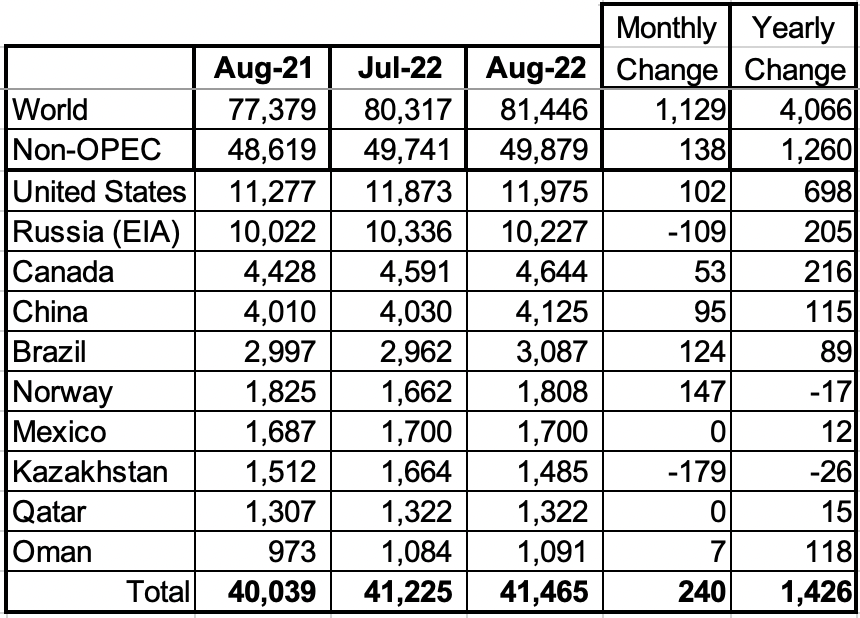
Listed above are the World’s 10th largest Non-OPEC producers. The criteria for inclusion in the table is that all of the countries produced more than 1,000 kb/d. Only Russia and Kazakhstan experienced a production drop in August. The August increase for these ten Non-OPEC countries was 240 kb/d while as a whole the Non-OPEC countries increased output by 138 kb/d.
In August 2022, these 10 countries produced 83.1% of the Non-OPEC oil. On a YoY basis, Non-OPEC production increased by 1,260 kb/d. World YoY August output increased by 4,066 kb/d.
Non-OPEC Production Charts
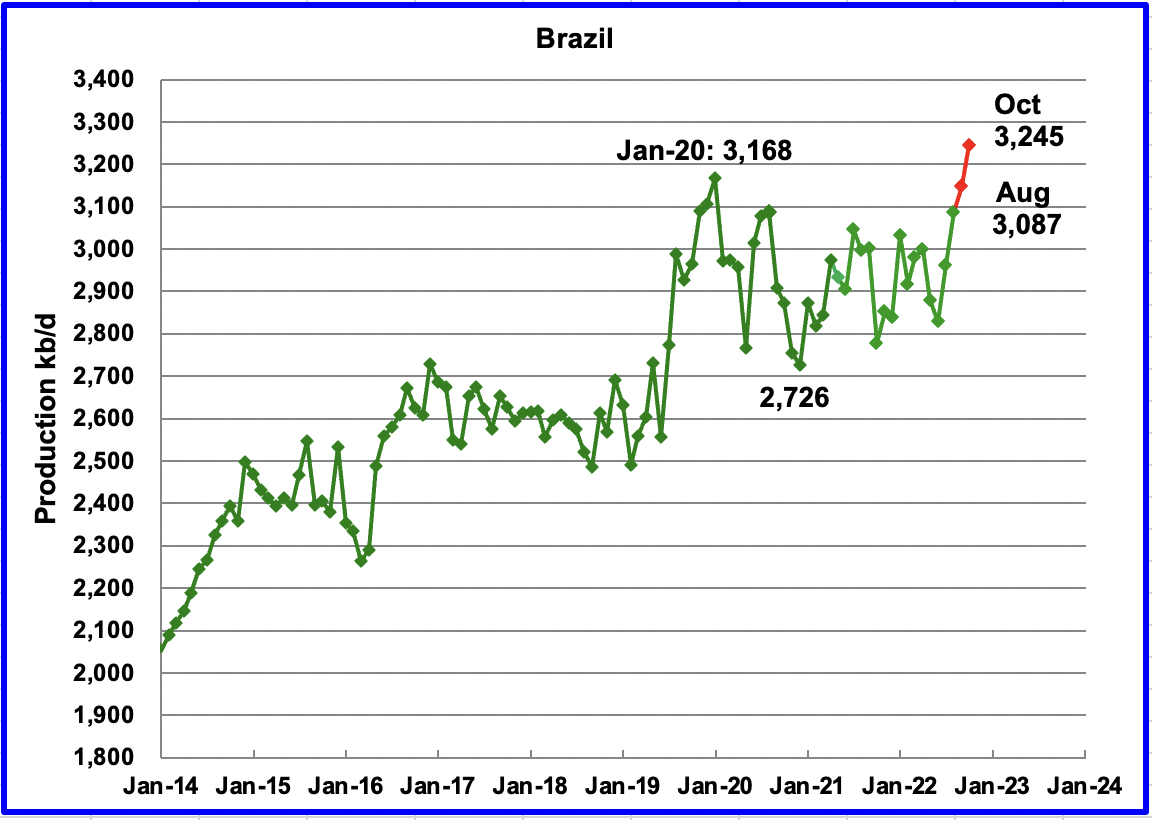
The EIA reported Brazil’s August production increased by 124 kb/d to 3,087 kb/d.
Brazil’s National Petroleum Association (BNPA) has resumed reporting Brazil’s monthly production. September’s output increased by 61 kb/d while October added an additional 97 kb/d to 3,245 kb/d. October’s production was a new record high for Brazil.
According to OPEC: “Crude and condensate production rose for the third consecutive month through September, as offshore maintenance eased and new projects, mostly fields under production-sharing contracts, continued to ramp up production.
Crude oil output is set to increase through production ramp ups in the Mero (Libra NW), Buzios (Franco), Tupi (Lula), Peregrino, Sepia, Marlim and Itapu (Florim) fields. However, offshore maintenance is expected to cause interruptions in major fields.
Much of Brazil’s production growth will be from the sub-salt frontier, where highly productive reservoirs containing light and low sulphur oil have been explored.”
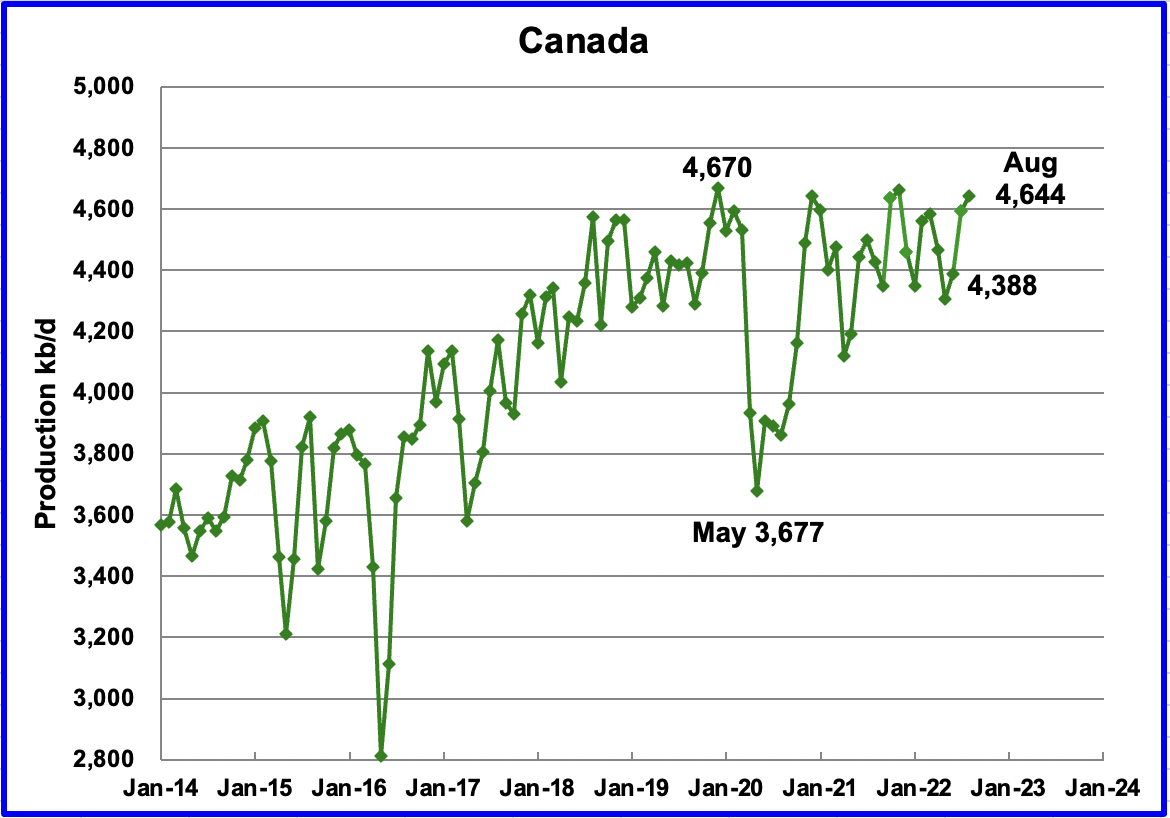
According to the EIA, Canada’s August output increased by 53 kb/d to 4,644 kb/d.
The Canada Energy Regulator reported August output of 4,940 kb/d, 296 kb/d higher than the EIA due to a difference in the definition of condensate. Preliminary estimates indicate that Canadian production could drop by 500 kb/d in September.
Rail shipments to the US in August were essentially flat at 155 kb/d but dropped 28 kb/d in September to 127.6 kb/d.
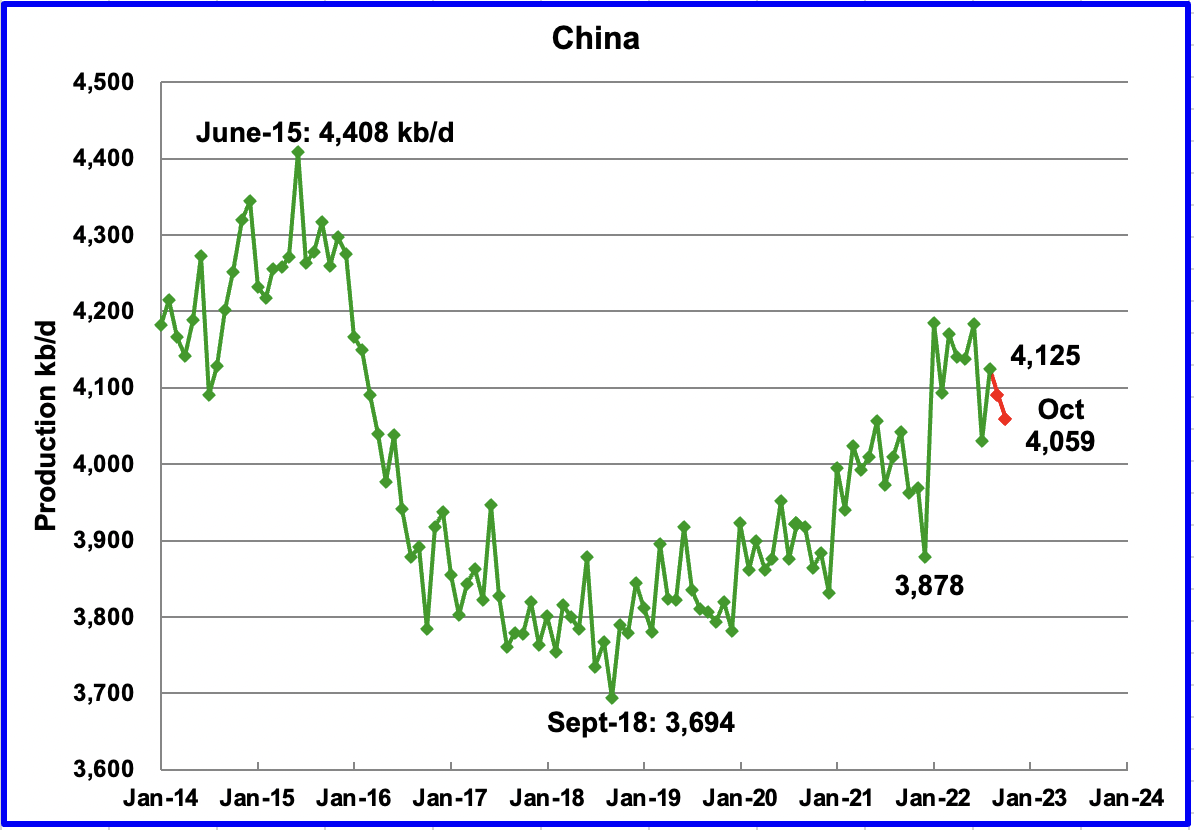
The EIA reported China’s output increased by 95 kb/d to 4,125 kb/d in August.
This August EIA production report is the first time there has been a disagreement between the official Chinese report and the EIA regarding China’s oil production. Up to July 2022, the EIA report and the China report were spot on. The National Bureau of Statistics of China published the following statement for August production, “In August, it produced 16.94 million tons of crude oil, a year-on-year decrease of 0.2 percent, an increase of 3.0 percent in the previous month, and the average daily output was 546,000 tons.”
Using 7.3 barrels per ton, the August output of 16.94 million tons coverts to 3,989 kb/d and the 546,000 daily tons converts to 3,986 kb/d. The EIA report is 139 kb/d higher than the China report. Note that the above China statement refers to crude production. The EIA may now be adding some condensate to the China Bureau “crude” production. We will continue to track this sudden change between the EIA and the China Bureau of Statistics.
The official China bureau reported that China’s output decreased in September to 4,090 kb/d, a drop of 35 kb/d. (Red markers). October output experienced a further drop to 4,059 kb/d.
China may be close to its current maximum production level of approximately 4,000 kb/d to 4,200 kb/d. To offset declines, the national oil company is investing in conventional wells, deep water wells and is also drilling for shale oil.
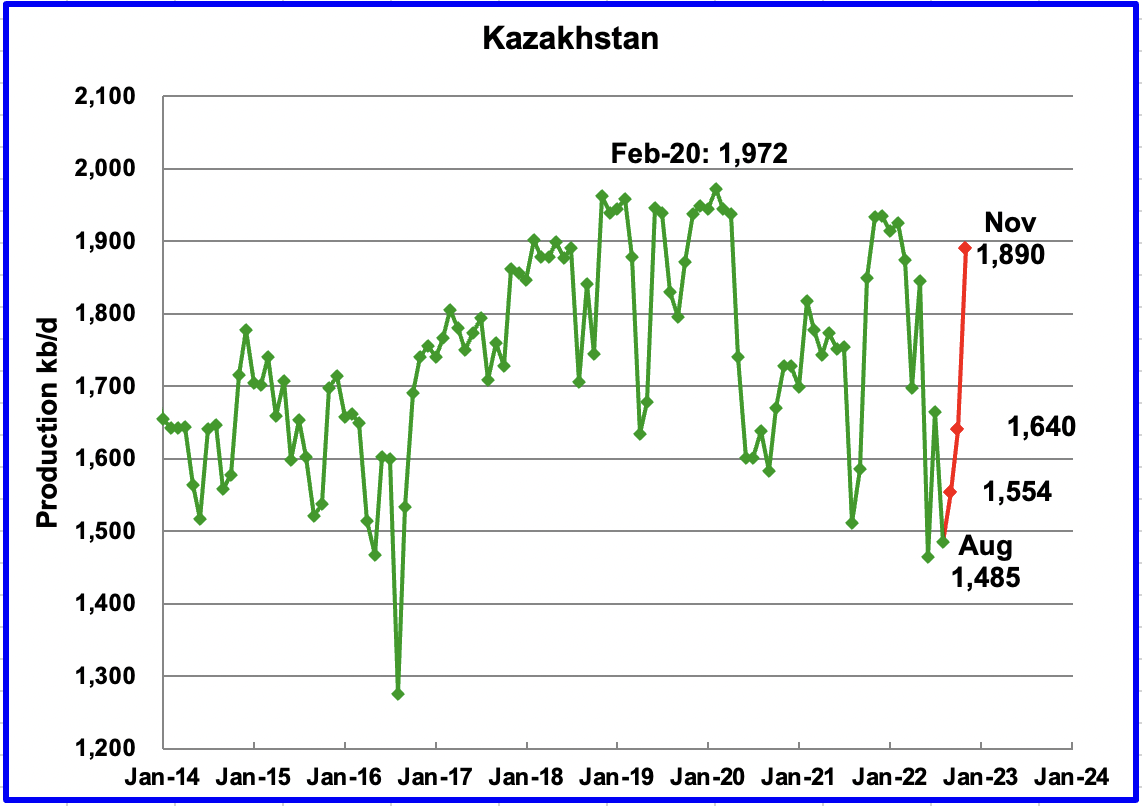
Kazakhstan’s output decreased by 179 kb/d in August to 1,485 kb/d.
According to OPEC, “The fall in output was due to a sharp decline in production in the giant Kashagan oil field after a gas leak early in August, as well as planned output curbs in the Tengiz field due to regular maintenance.”
According the this source, “production at Kashagan, one of the world’s largest oil fields, sharply declined on Aug. 3 due to a gas release. Kashagan had planned to boost output to 500,000 bpd after upgrades.”
Production is expected to recover in October according to this source. Production was restored in late October after the gas leak was repaired and reached 1,890 kb/d in early November, an increase of 405 kb/d over August.
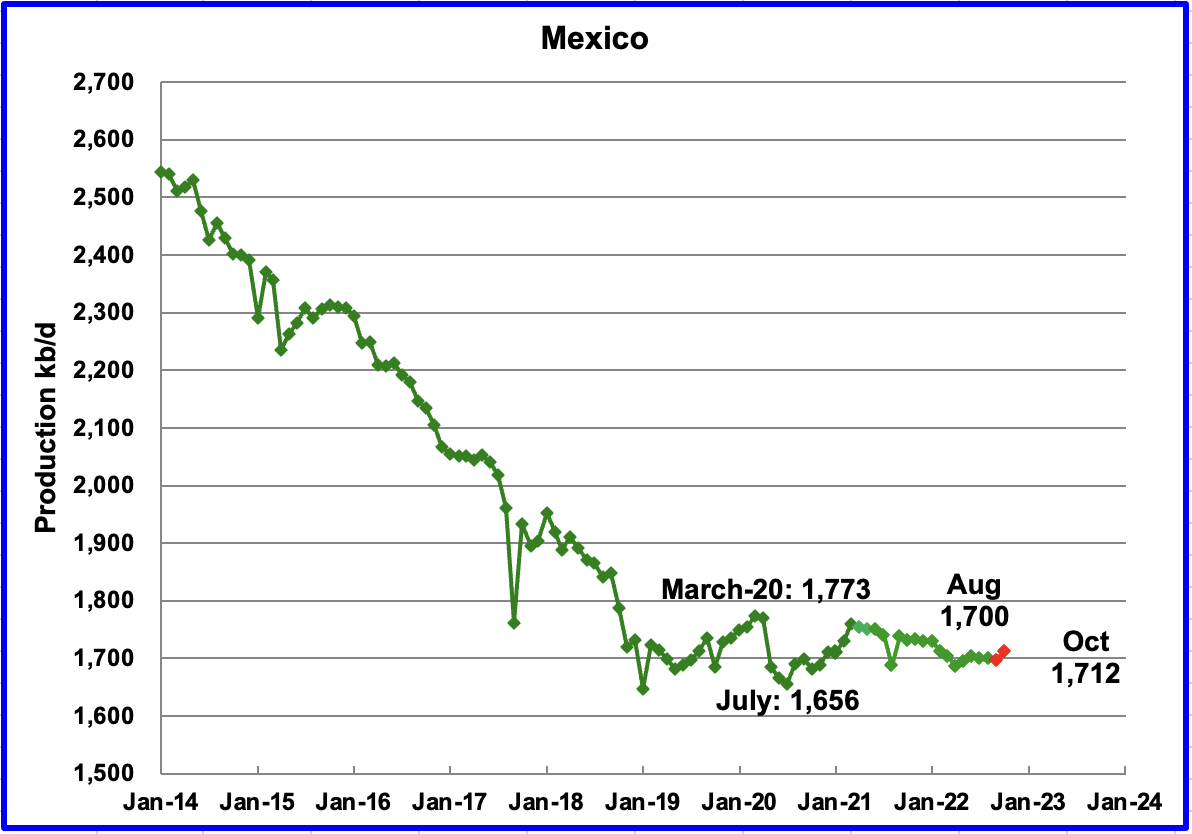
Mexico’s production as reported by the EIA for August was unchanged at 1,700 kb/d.
Data from Pemex showed that September’s output was 1,776 kb/d and October was 1791 kb/d. However, the EIA is expected to reduce Pemex’s September and October oil production by close to 85 kb/d due to a difference in definition for condensate. The September and October estimates, red markers, were obtained by using the Pemex increments over August production and adding those to the EIA’s August output.
OPEC continues to forecast flat production for Mexico due to decline rates in mature fields.
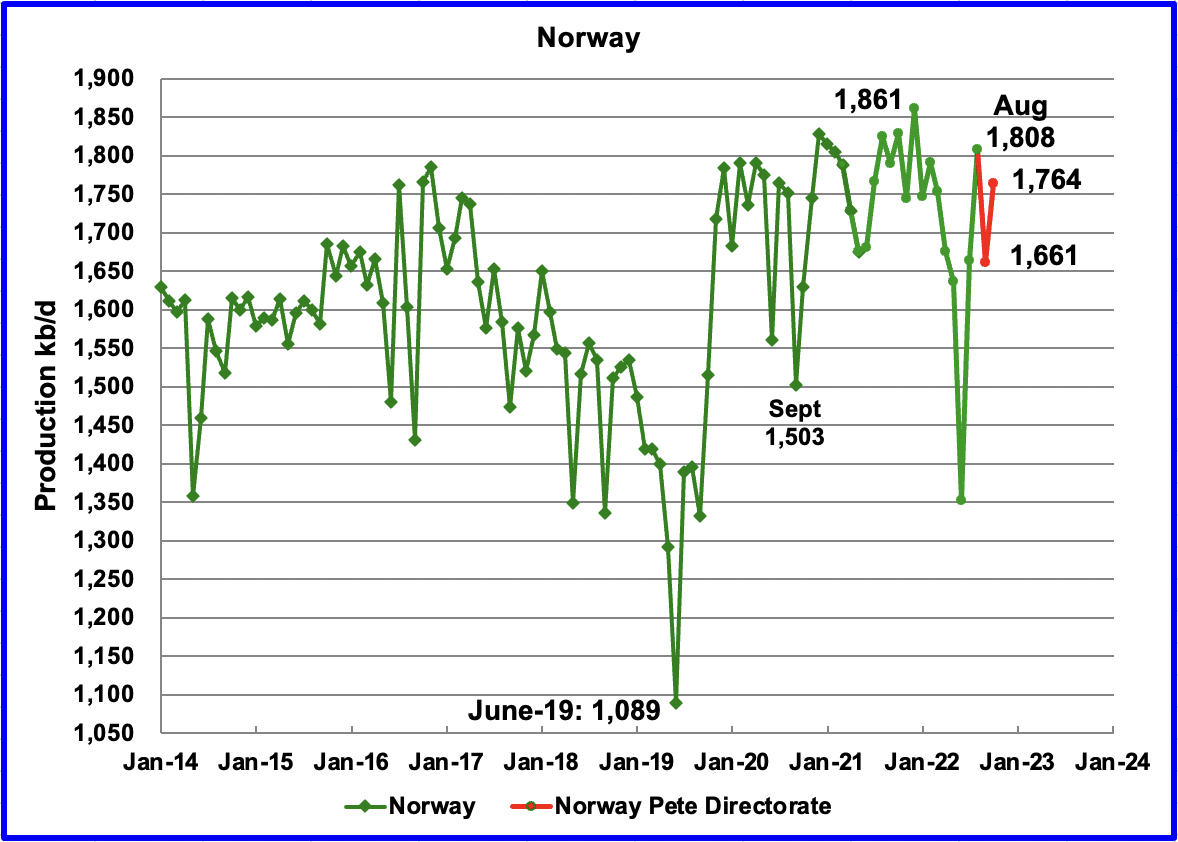
The EIA reported that Norway’s August production increased by 147 kb/d to 1,808 kb/d. Production dropped to 1,661 kb/d in September due to maintenance in the Oseberg and Troll fields.
The Norway Petroleum Directorate (NPD) reported that production increased from September to October to 1,764 kb/d (Red markers). According to the NPD: “Oil production in October was 7.3 percent lower than the NPD’s forecast and 5.4 percent lower than the forecast so far this year.”
Growth is expected in late 2022 and into 2023 when the second phase of the Johan Sverdrup field development starts production and other small fields come on line. According to OPEC “The Johan Sverdrup Phase 2 is projected to be the main source of increased output for later this year and next year. Equinor has not yet provided a firm start-up date for this phase beyond a fourth-quarter window.
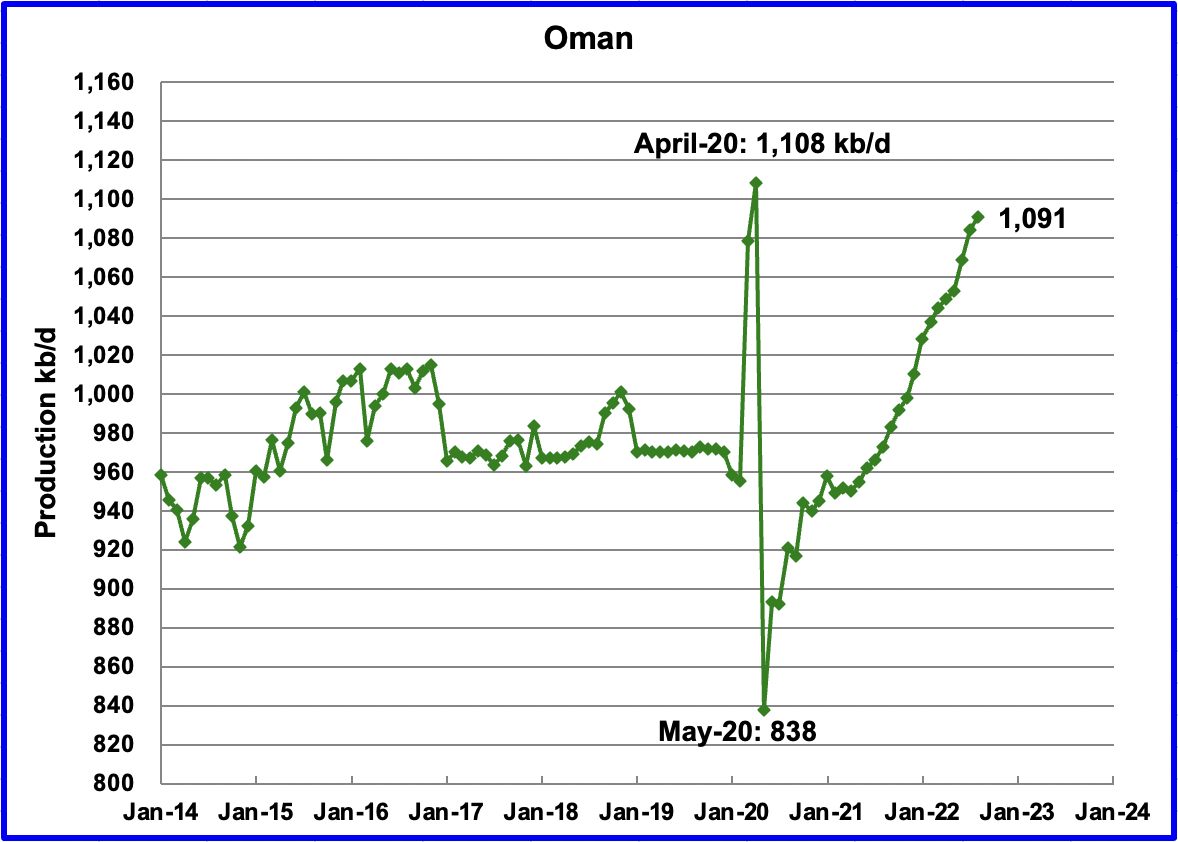
Oman’s production has risen very consistently since the low of May 2020. Oman’s August production increased by 7 kb/d to 1,091 kb/d. It is 17 kb/d short of its pre-pandemic high.
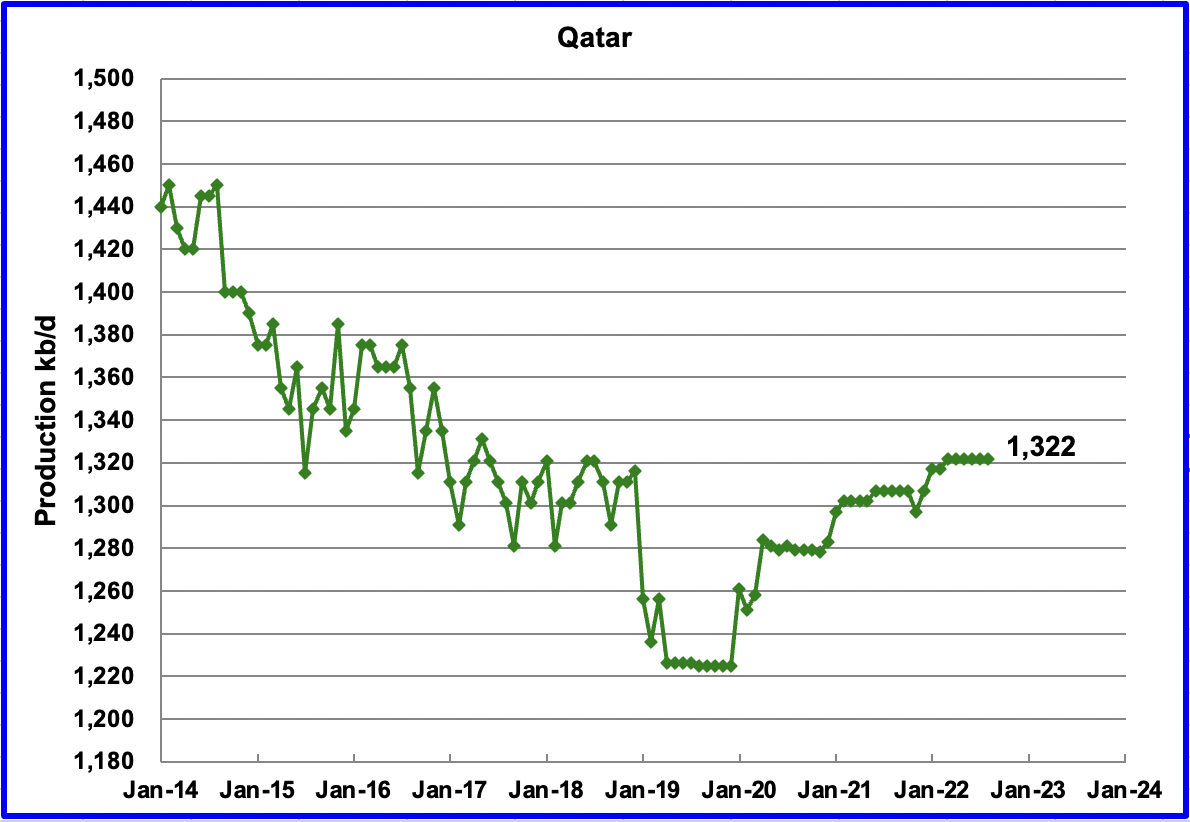
August’s output was unchanged at 1,322 kb/d.
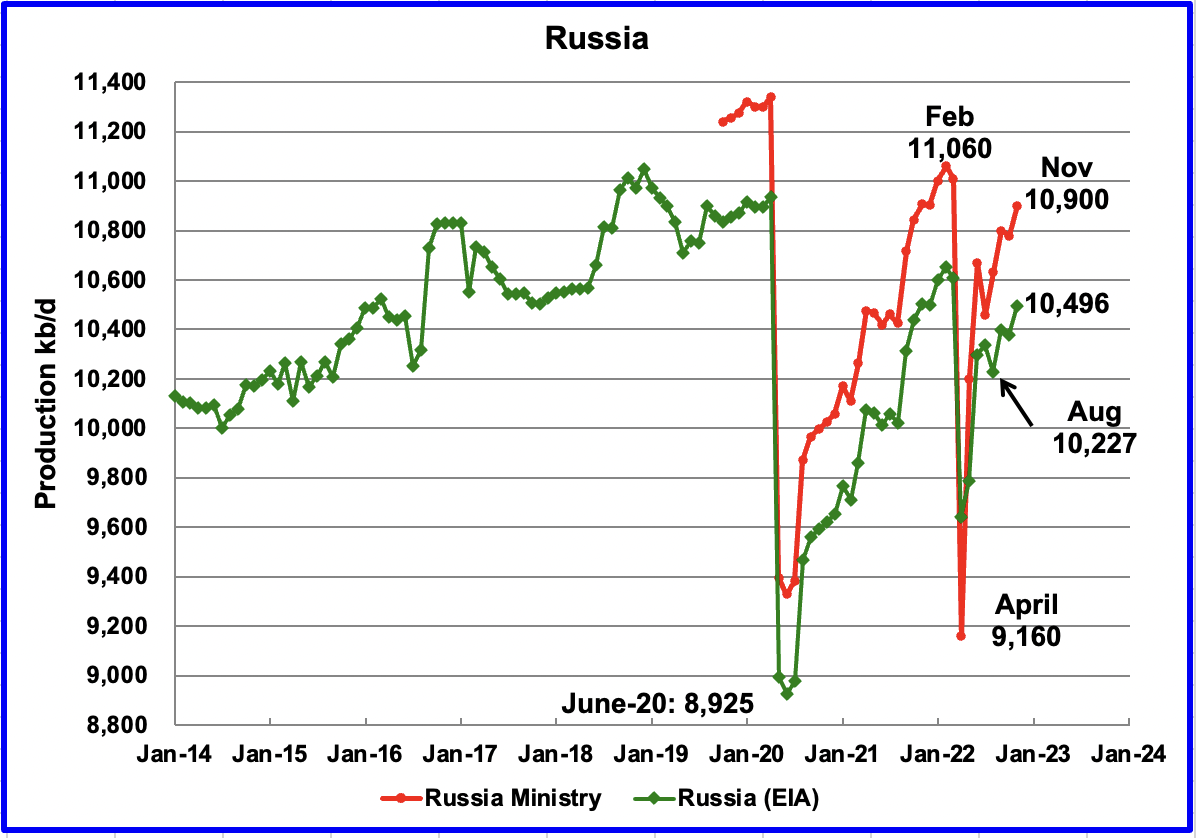
The EIA reported that Russian output decreased by 109 kb/d in August to 10,227 kb/d.
Russia Ministry data for September 10,800 kb/d and October 10,780 kb/d was taken from this source. November production of 10,900 kb/d was taken from this source. In light of all of the sanctions, it is surprising to see such robust production.
The EIA numbers for September to November are derived from the Russia Ministry data by subtracting 404 kb/d. In the past, when production data was obtained directly from the Russian Energy Ministry, it was found that the EIA arbitrarily subtracted 404 kb/d from the Ministry data.
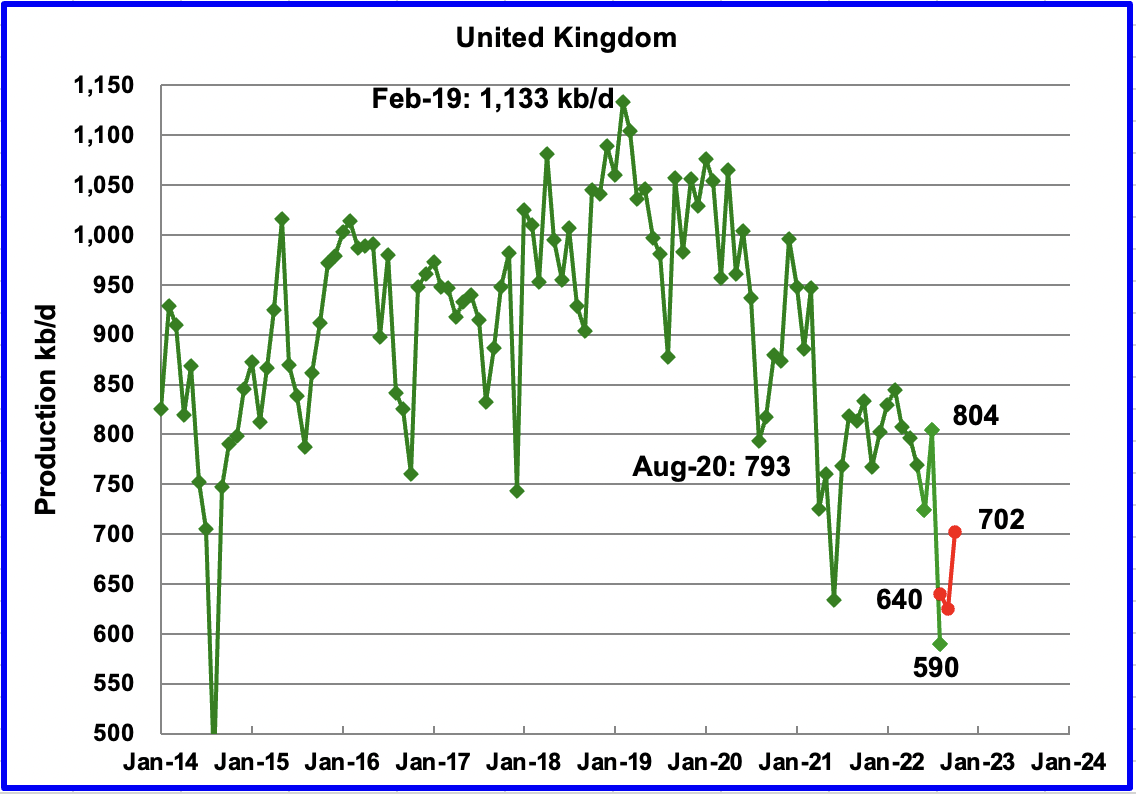
The EIA reported UK’s production decreased by 214 kb/d in August to 590 kb/d.
According to this source, North Sea Transition Authority (NSTA), August’s production decreased by 164 kb/d to 640 kb/d (Red Markers). In addition the same source provided production for September and October. It is not clear if the red markers represent all liquids production or C + C. Both numbers will be tracked and compared to see if there is a consistent difference between the two estimates.
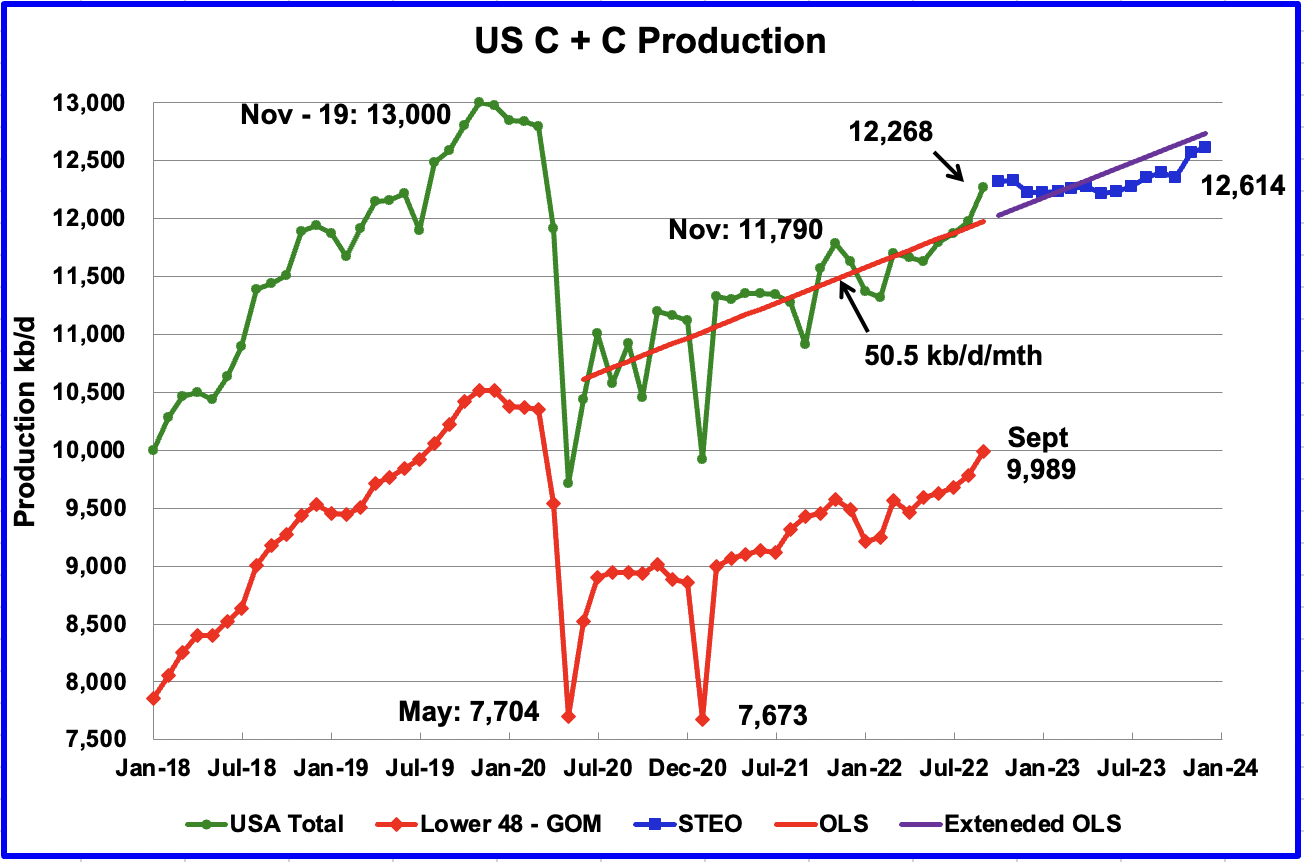
U.S. September production increased by 289 kb/d to 12,268 kb/d, a post-pandemic record. For September, the states with the largest increase were Texas 90 kb/d, New Mexico 75 kb/d and North Dakota 43 kb/d. The Gulf of Mexico added 64 kb/d.
The blue graph, taken from the December 2022 STEO, is the production forecast for the U.S. from October 2022 to December 2023. Output for December 2023 is expected to be 12,614 kb/d, 34 kb/d higher than projected in the STEO’s November report. Note that from October 2022 to October 2023, output is forecast to be essentially flat, 12,326 kb/d vs 12,356 kb/d, respectively, a minimal 30 kb/d increase.
The red OLS line from June 2020 to September 2022 indicates a monthly production increase of 50.5 kb/d/mth over that period. The first portion of red line stops at September because that is the range covered by the OLS analysis. The second portion is the same OLS line extended to see how well it fits the STEO forecast.
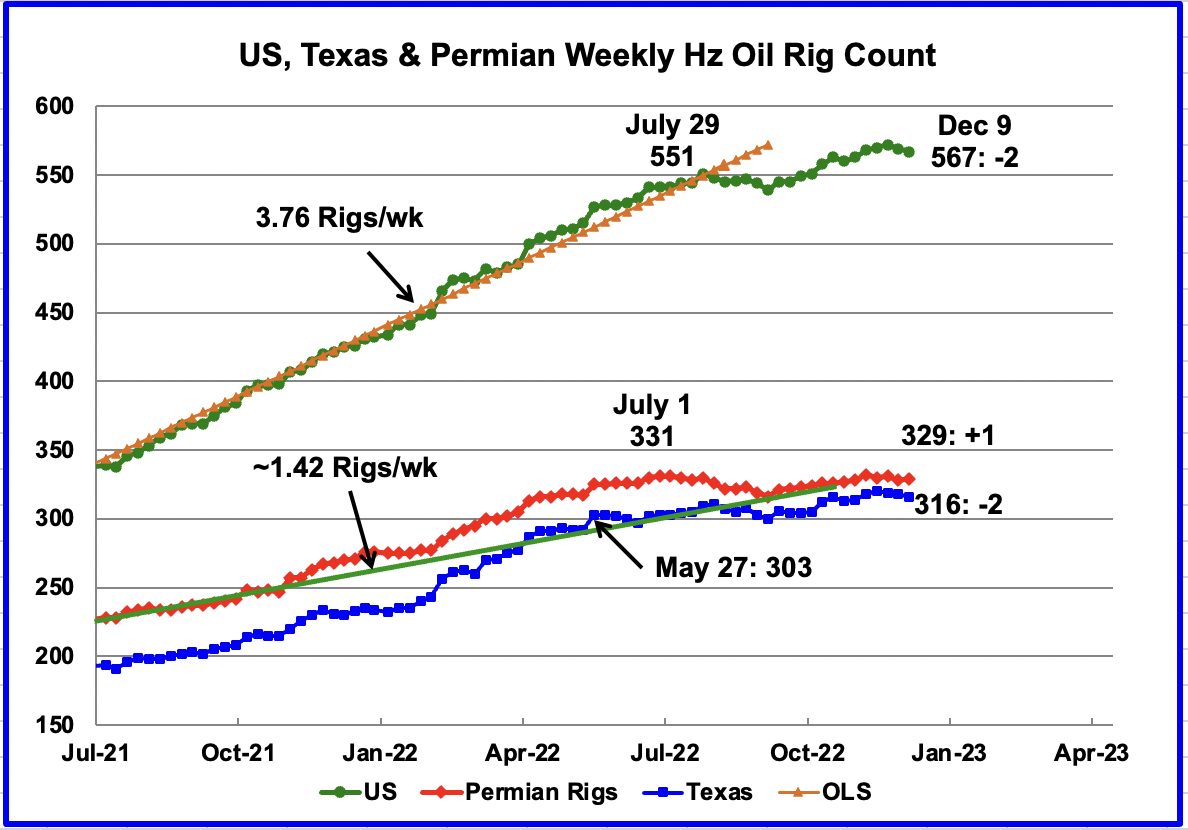
After the week ending July 29, the rate of Hz rig additions slowed. However since the low of 539 in the week of September 9, Hz rig growth returned until the Thanksgiving Xmas break period. From a high of 572 rigs in the week ending November 25, the rig count has dropped by 5 to 567 in the week ending December 9.
Permian rigs were up 1 to 329 in the week ending December 9 but still 2 below the July 1 peak of 331. With Permian rigs essentially flat since July 1, this implies that rig activity has increased in the other basins. Texas rigs dropped by 2 to 316.
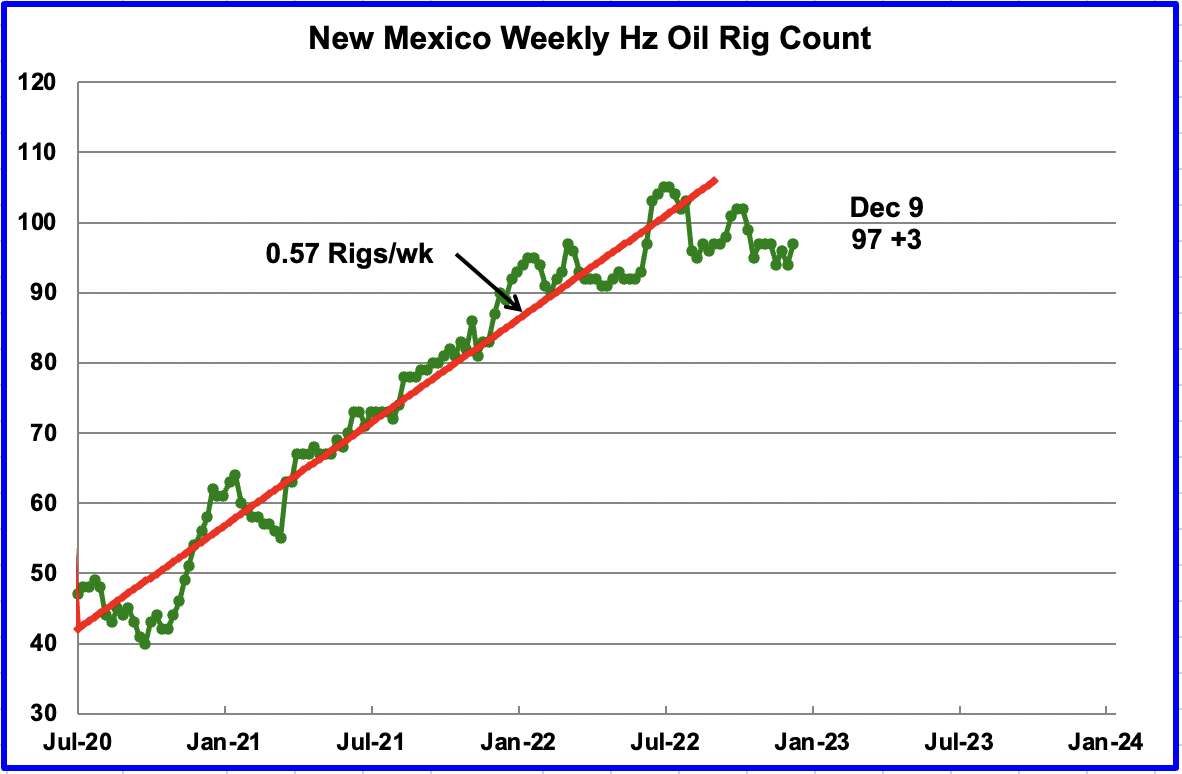
New Mexico added 3 rigs to get back to 97 operational rigs. Since mid-August, New Mexico’s operating rigs have remained close to 97.
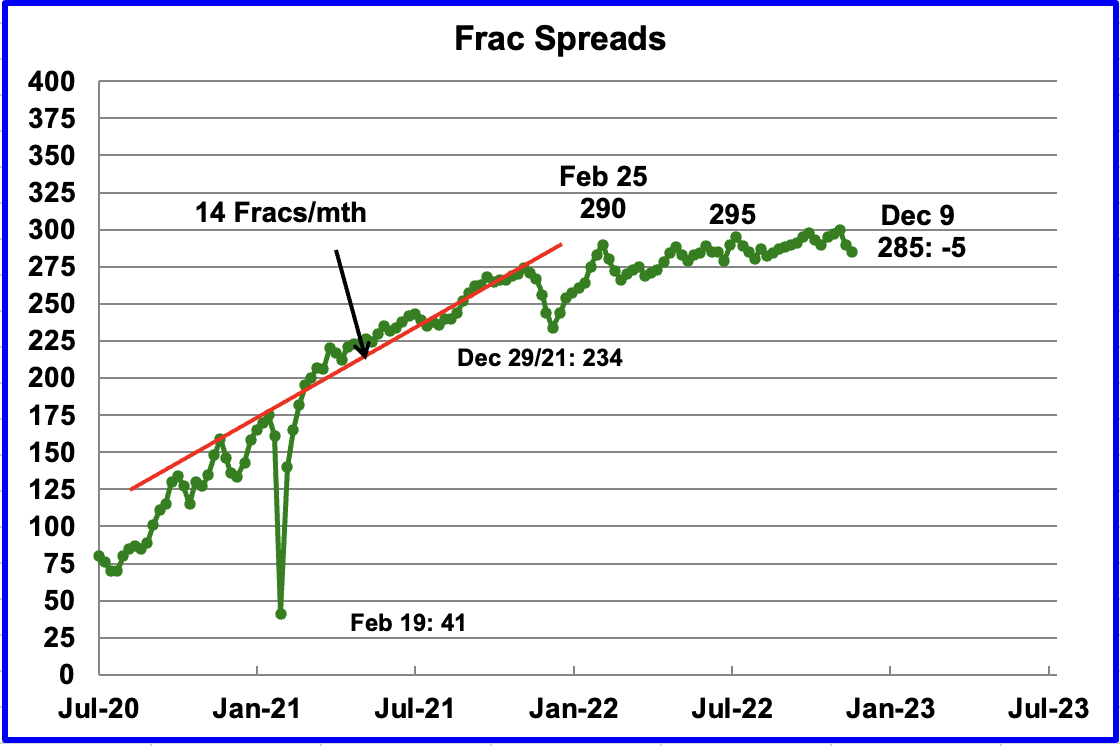
For frac spreads, the general trend since late February, when the count was 290, can best be described as essentially flat at around the 290 level. For the week ending December 9, the frac spread count decreased by 5 to 285.
Last year the frac count peaked in mid November and then headed into the Thanksgiving and Christmas break low of 234 in December 2021. This week continues the decline that started last week.
Note that these 285 frac spreads include both gas and oil spreads.
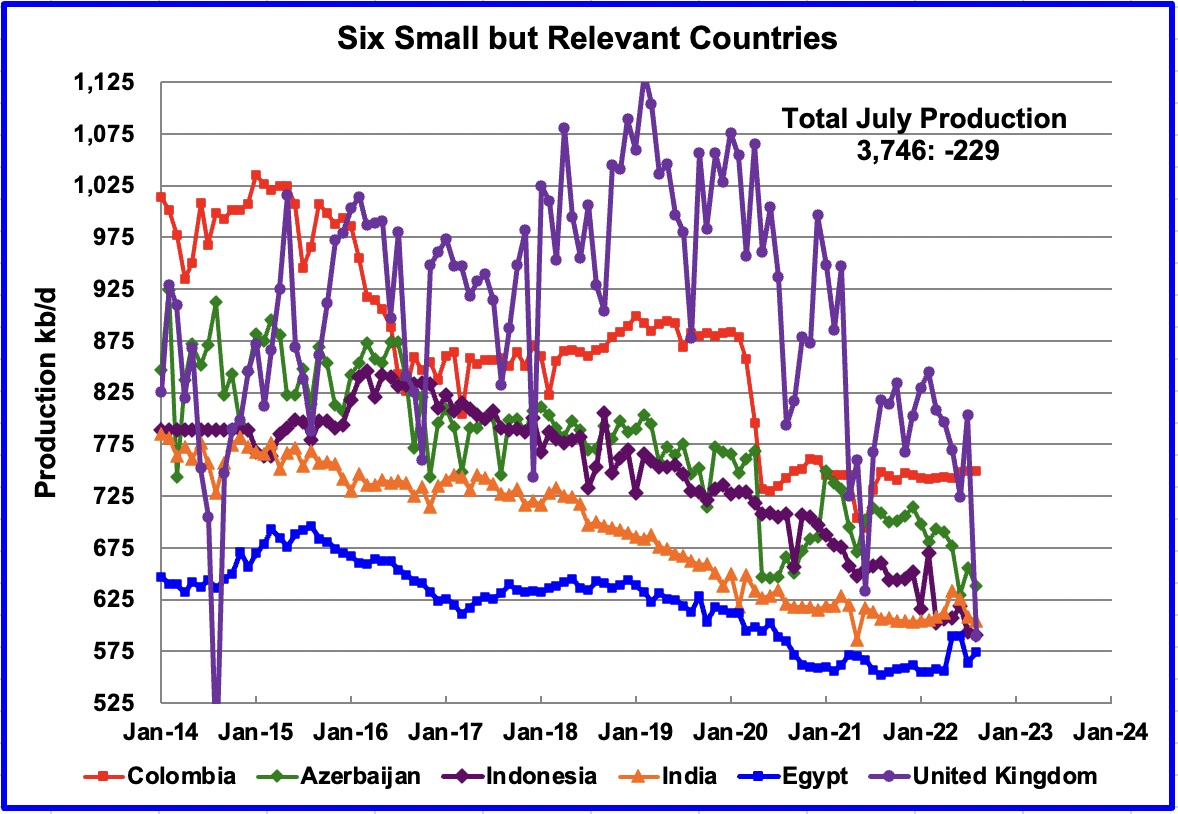
These six countries complete the list of Non-OPEC countries with annual production between 500 kb/d and 1,000 kb/d. Note that the UK has been added to this list since its production has been below 1,000 kb/d since 2020.
Their combined August production was 3,746 kb/d, down 229 kb/d from July’s 3,975 kb/d.
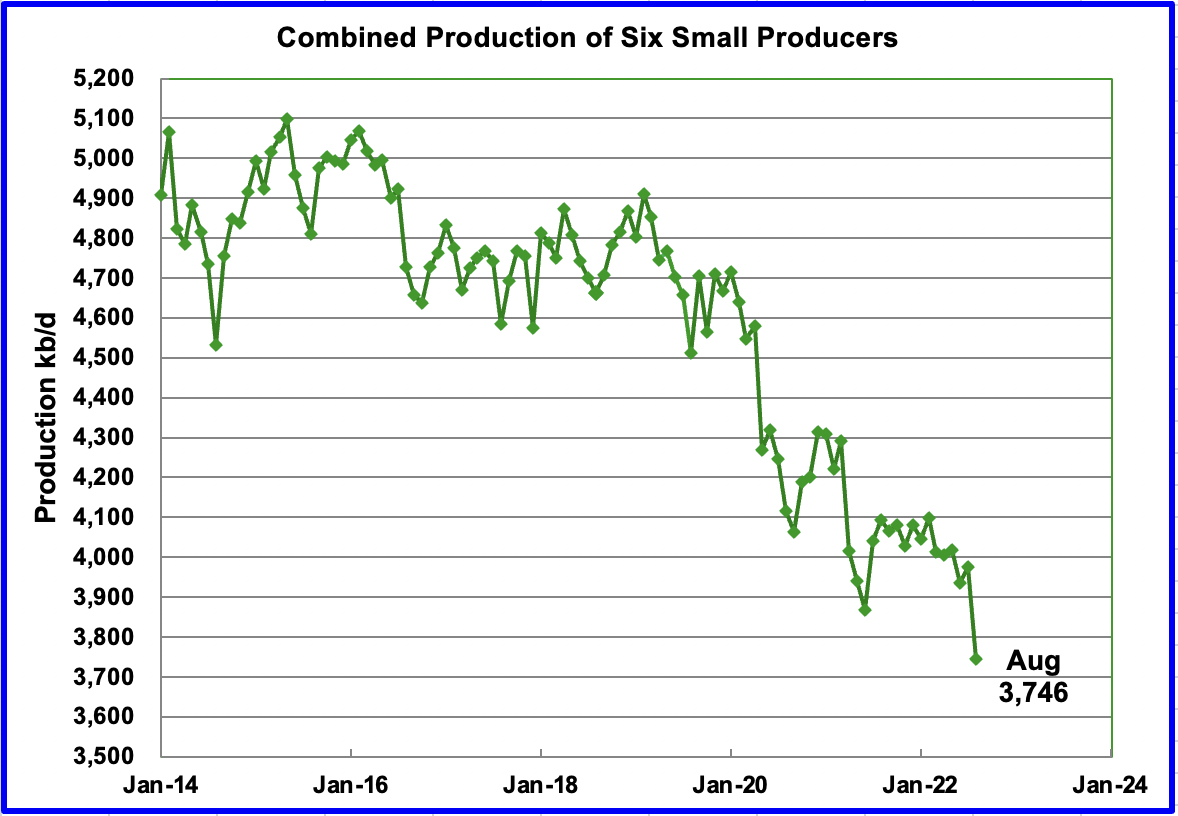
The overall output from the above six countries has been in a slow steady decline since 2014 and the decline continues.
OPEC + Production
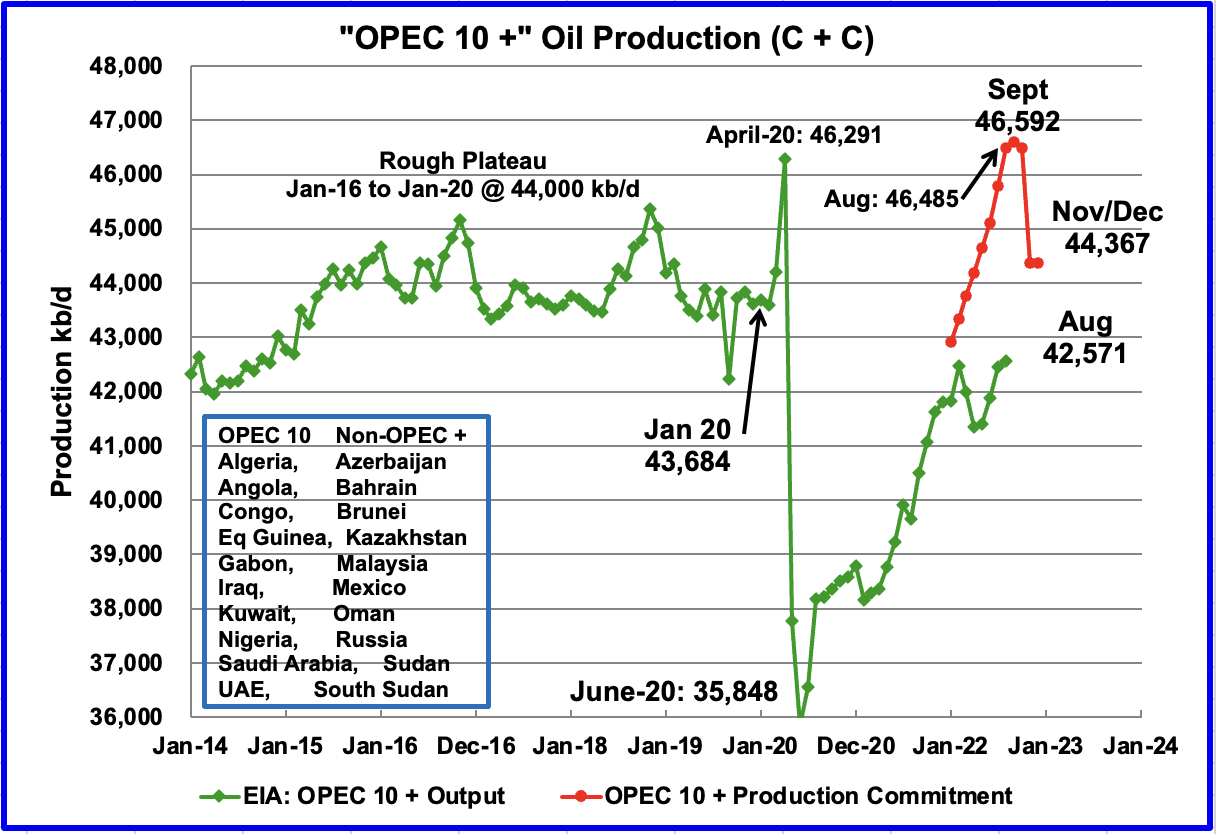
This chart compares the OPEC + commitments with OPEC + production. The OPEC + commitments are based on “Crude” production only. To adjust the OPEC + commitments to C + C, they were increased by 6%. The July and August total OPEC outputs from the MOMR were compared with the EIA C + C information. They averaged out to 6%.
Looking at August specifically, the gap between the OPEC + commitment and delivered for C + C is 3,914 kb/d.
World Oil Production Ranked by Country
Above are listed the World’s 11th largest oil producers.
In August 2022, these 11 countries produced 75.4% of the world’s oil. On a YoY basis, production from these 11 countries increased by 4,066 kb/d. Note that every country except Russia increased production in August.
The largest increase came from Saudi Arabia 350 kb/d.
World Oil Production Projection
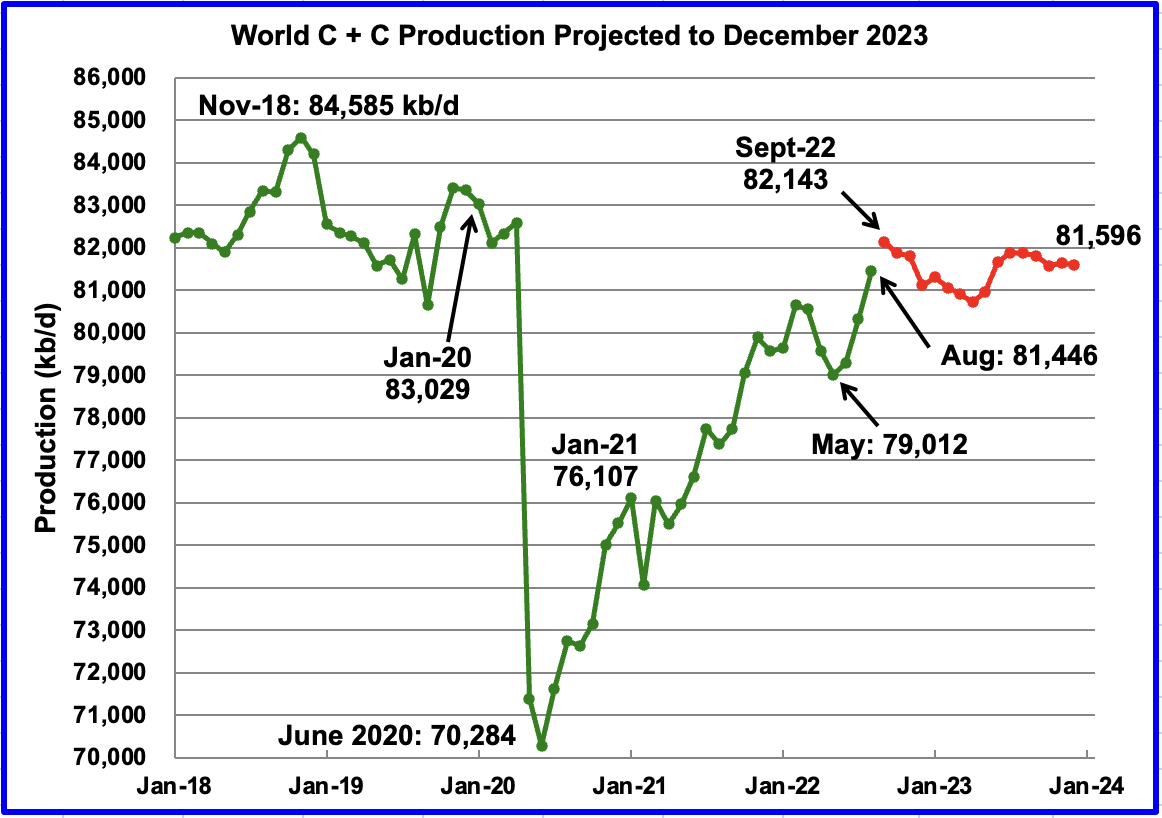
World oil production in August increased by 1,129 kb/d to 81,446 kb/d according to the EIA (Green graph). In the previous Non-OPEC post, it was forecast that August C + C production was expected to increase by 1,357 kb/d to 81,548 kb/d, high by 228 kb/d and 102 kb/d, respectively.
This chart also projects World C + C production out to December 2023. It uses the December 2022 STEO report along with the International Energy Statistics to make the projection. (Red markers).
It projects that World crude production in December 2023 will be 81,596 kb/d, an increase of 563 kb/d from the projection in the previous November report.
September production is expected to increase by 697 kb/d to 82,143 kb/d. The post pandemic peak of 82,143 kb/d will be reached in September 2022. After September 2022, World production decreases and September 2022 could be the new post-pandemic high out to December 2023. The projected September peak could change due the large expected November increase from Kazakhstan shown above and continuing monthly increases from Brazil.
Note that the post pandemic peak of 82,143 kb/d is 2,442 kb/d lower than November 2018.
175 responses to “August Non-OPEC Oil Production Increases”
Thanks for the work Ovi. You are fantastic.
Closing in on the November 2018 peak. Over 82 mbd is some serious production. Lots of interesting things going on. Europe is heading towards on interesting winter without Russian nat gas. Will European industry survive the high power prices?
Schinzy
Thanks.
That 82 Mb/d was achieved with Saudi Arabia, Kuwait, UAE and Iraq producing at levels that may not have been sustainable for more than a year. I think the new quota levels better reflect the longer term production capacity of these four countries. The new quotas of these four are close to a real 700 kb/d reduction in output.
I believe Saudi Arabia when they say investment in oil discovery and production is lagging. They are sending the message that they and OPEC are close to their production limits.
The issue is when will demand rebound to the point that it will begin to stress the supply side. That could happen in about a year from now when the world economy starts growing again.
Even though there was a spiking peak in production in November 2018 of 84,585 kb/d, the average production from Jan 2018 to Jan 2020 of around 83,000 kb/day. The current production level has risen to around 82,000 kb/d or 1 MBOD less around September 2022.
Looking at the amount of gasoline sold in the US over the number of registered cars, I calculated that the average consumption was about 1.2 gallons of gasoline/day/vehicle. If one barrel of oil is used to make 19 gallons of gasoline, that’s enough oil to fuel 16 cars. If those cars were replaced by EV’s, then the 1 MBOD oil production reduction times 16 cars would have to be replaced by EVs to keep gasoline demand steady and/or people would have to drive less. Of course, conflating US consumption with world consumption, leaves of a lot to be argued but then this is back of the envelope eye balling
I found this online:
https://www.statista.com/statistics/270603/worldwide-number-of-hybrid-and-electric-vehicles-since-2009/
Battery electric vehicles in use worldwide 2016-2021
Published by
Mathilde Carlier
Research Expert covering transportation and logistics
Jul 27, 2022
Some 11.3 million battery electric vehicles (BEVs) were in use globally in **2021**. That year, more than four million new battery electric vehicles were added to the worldwide fleet, steadily growing since 2016.
If we add an additional 5 million, we would be close to the 16 million EV figure above. So we may be seeing an effect from global EV uptake.
Found this interesting:
https://www.motortrend.com/features/truth-about-electric-cars-ad-why-you-are-being-lied-to/
Peterev, the folks most likely to switch to an EV are those who drive the most and use the most gasoline, not the average amount, because they are the most incentivized financially by the savings and willing to pay more upfront for an EV. I would guess it would take much fewer switches from ICE cars to EVs than you are suggesting to achieve the same results.
Stephen Hren,
There is also a business opportunity for an Uber or Lyft type of company that leases EVs and hires people to drive the cars with pay based on the miles spent driving paying customers. For each of those EVs we might see 7 to times as many miles driven compared to a privately owned vehicle, in addition pool type services would reduce the total number of passenger miles needed per vehicle to cover World demand for passenger vehicle miles travelled. Note that no AVs are needed for this model, just entrepreneurs trying to make a profit.
And of course delivery vehicles can profit greatly from lower operating costs.
https://img.abendblatt.de/img/wirtschaft/crop235051863/0067659199-w1200-cv16_9-q85/9794e7a8-b8ce-11ec-b32a-6e3332ff0636.jpg
There are other reasons to buy an EV other than financial. Geopolitical is one where the people we buy oil from have no hesitation to talk other people into flying into buildings and kill our kids (classmates of mine experience – I have kids who were their age) or to invade a country and devastate it (Russian into Ukraine). Environmental where the emissions from ICEs and other sources caused the polluted air over Los Angeles to make pilot’s eyes water to where you can’t see oncoming traffic (personal experience). Plus EVs are fun to drive!!
Sure glad nothing in EVs comes from foreign entities with questionable ethics or involves environmental degradation.
And before Russia invaded the Ukraine, we were purchasing Russian oil of up to 25 million barrels per month. We still may be purchasing it as oil is fungible.
https://www.eia.gov/dnav/pet/hist/LeafHandler.ashx?n=PET&s=MTTIM_NUS-NRS_1&f=M
As one of those who drives average, I was incentivized to collect 2 of them in order to minimize gasoline use, regardless of the sum total of the $$ savings involved.
As these things tend to be “inside the beltway” vehicles for most of my use, I still keep a antique ICE powered machine around for occasional Prudhoe Bay runs and whatnot.
Reservegrowthrulz,
It would be interesting to get your take on some of these scenarios (there are several if you start at the link below and skim through a few of the comments below that first comment.)
https://peakoilbarrel.com/august-non-opec-oil-production-increases/#comment-749956
Electric cars do not remove diesel fuel demand. We still need as much diesel as before, so there is no oil demand reduction by electric cars.
Smith,
Where do you think that gasoline comes from? Also in Europe a lot of personal vehicles use diesel fuel. In addition heavy duty trucks can also be powered by batteries.
Where do you think diesel fuel comes from? From crude oil. If we do not reduce diesel demand, we will not reduce oil demand.
Smith,
In 2021 about 77.8 million barrels of crude plus condensate was produced and for liquid fuel at standard temperature and pressure (pressurized gases such as ethane, propane and butane are excluded) the World produced:
23.2 million barrels of gasoline
26.9 million barrels of diesel fuel
5.3 million barrels of jet fuel/kerosene
6.7 million barrels of heavy fuel oil
The balance was other products (asphalt, coke, waxes, lubricants, etc) that are not liquid fuel.
Note that al lot of diesel gets used in passenger vehicles outside of North America, though a large proportion is used by heavy duty trucks for transporting goods. Much of the long haul goods transport could be replaced with electrified rail and short haul heavy duty trucks can be replaced with EVs.
I agree diesel fuel use needs to be reduced, but 37% of total liquid fuels is gasoline so a 37% reduction in liquid fuel use is a start and some proportion of diesel fuel, perhaps a third, may be used in light duty passenger vehicles, that can also be reduced with EVs. The transition to heavy duty EVs may take longer.
Even if you remove 3/4 of gasoline demand, we will still need as much crude oil, as before, if we also do not remove diesel fuel demand. I am sure you know how much diesel fuel can be made from a barrel of crude oil.
Smith,
The amount of gasoline from the refining process is not fixed, a lot of complexity in the process, longer chain molecules are often broken up to make lighter products, but different processes have different yields of gasoline vs diesel/jet fuel.
Many agree that diesel is much bigger problem than gasoline, as crude peaks.
I do.
We’ll see how electrification of trucking progresses over the decade.
Heavier vehicles and heavier cargo are a bigger challenge than passenger travel.
Diesel demand may be the main determinant factor for crude oil pricing over the next couple decades.
There is work going on-
https://freightliner.com/trucks/ecascadia/
https://www.moveelectric.com/e-world/new-einride-trailer-high-tech-power-bank-electric-trucks
https://www.autoweek.com/news/green-cars/a36506185/electric-big-rig-semi-trucks/
https://www.freightwaves.com/news/is-range-energys-electrification-push-the-future-of-trailers
Batteries quite simply will not compete with diesel. The Tesla Semi is indicative of the limits, which is why they’re rather quiet about the range and tonnage they can travel with it and the time it takes.
Personal travel is the easiest and least important thing to electrify, and even that is taking forever and still priced way higher than it should be.
Elon Musk confirmed on Twitter that the electric truck completed a 500-mile (805 km) trip while being loaded with a total weight of 81,000 pounds (36.7 tons).
~ the internet
If you watch the video, there is nowhere near 30 tonnes on that flatbed. It’s more like 5-10 tonnes payload. I guess Elon could be saying the entire vehicle is that weight, I mean he is the smartest man alive and very truthful at all times. Too bad there are cheaper diesel trucks today that do four times the range with four times the payload and take minutes, not literal hours to refuel.
Unless they’re transporting lithium ion batteries, these things are less than useless. Probably why all the Semis are owned by Tesla and not going to those who originally placed orders, much like Nikola’s whole thing. Also, one of them already broke down and had to be taken away by a diesel big rig. Pretty funny.
Federal law limits trucks to 80,000 lbs. While laws can be changed. There are obvious reasons to limit the weight.
“Batteries quite simply will not compete with diesel”
When diesel enters a global chronic shortage status (within 10 years), electric trucking will be more and more competitive. Its no more complicated than that.
@Kleiber, “At the current time.” Will it happen by 2026?, 2035? 2042?
I think when diesel is running short, we’ll have bigger issues than how we get our bulk Amazon deliveries shipped to warehouses. I’ll be trying to avoid dying in the water wars.
These numbers may be a bit dated, but Alice Friedemann (2021) quotes the following numbers. A truck with range of 600 miles needs a battery pack weighing 35,275 lb and can carry a freight of just 10,000 lb. If the range is 900 miles, the battery pack weighs 54,000 lb and with no cargo the truck would weigh 89,000 lb.
EVs certainly have reduced demand for diesel vehicles in Germany. Look at this chart (in German, sorry). The question was “What will fuel the your next car?” The survey was done by Aral, best known in Germany for its gas stations.
Total on the left, and then broken down by sex and age group. The white and orange at the bottom are gasoline (“Benzin”) and diesel. Those two categories fell from about 90% to about 50%.
And this is pre-Ukraine data. Since then, as the IEA points out, there has been a massive shift away from oil and gas.
https://www.aral.de/content/dam/aral/business-sites/de/global/retail/presse/bilddatenbank/original/grafiken/trends-beim-autokauf-2021/antriebsenergie-des-naechsten-autos-2021.png.img.1440.medium.png
I wonder what U.S. could produce if the oil rig count approached 1,600 rigs that it had working in 2014?
Charles
That is a question that Dennis might answer with his model.
Looking at 2014, I only see 1,100 hz rigs in operation in late 2014.
The other question to go with this is whether there are sufficient personnel to staff that many rigs. Also today’s rigs are much more productive that the 2014 rigs.
Ovi
I got the chart from a couple of places.
https://www.attenbabler.com/index.php/2021/08/19/u-s-oil-rig-count-update-8-18-21/
But you are right, more powerful rigs can drill much longer wells, so it is difficult to compare.
Charles
The 1,600 is for all oil rigs, hz, vertical and directional. The posted chart above is just for hz rigs.
The Baker Hughes rig count has been undercounting vertical rigs in the smaller production states such as Kansas, Illinois, etc.
Not sure if this was the case pre-2014 crash?
Granted, these rigs are not a significant source of oil on the whole, but some are making money for some people.
Kansas shows a rig count of 49 on the Independent Oil & Gas Service Inc. website. The IOGA reported this summer there were 10-12 rigs running in the Illinois Basin.
Shallow sand,
Do those rig counts give you rigs drilling new wells vs those doing maintenance on older wells?
They are drilling new wells.
Kansas had issued 1,556 well permits in 2022 through December 8.
You can subscribe to the Kansas site and get a lot more data.
In Illinois those were also drilling new wells. Illinois has issued permits every week this year, but some of those are well conversions from production to injection.
Shallow sand,
Interesting. Not clear why Baker Hughes doesn’t collect that data.
Charles,
A better comparison is to 2017 to 2019 when lateral lengths and well productivity was more similar to today’s level, in 2014/2015 lateral lengths were shorter and individual wells were less productive. Roughly 1100 wells per month could be completed if the horizontal oil rig count returned to the peak level (52 week average) of 2018/2019 which was about 760 rigs (I assume each rig can drill about 1.4 wells per month on average.) The peak horizontal oil rig 52 week average in 2014 was about 1038 horizontal oil rigs, that level suggests about 1450 wells completed per month.
Note that my best guess tight oil scenario has about 1085 wells completed per month at maximum, similar to what we would get with a rig count of 760 during the 2018 peak, assuming 1.4 wells per rig per month. As always, lots of assumptions all of which are likely to be incorrect. I doubt we ever return to the 2014 level of over 1000 horizontal oil rigs running in the US and also doubt we would ever reach to 1450 horizontal oil wells completed per month in the future.
For tight oil a plateau scenario is not likely as eventually tier one and tier 2 drilling locations will become scarce and average well productivity will decrease, this is likely to reduce the drilling rte due to lack of locations and lower profitability. That is the reason my tight oil scenarios have a definite peak followed by rapidly decreasing output after the peak.
In the chart below the high scenario is the one with a maximum completion rate of 1085 wells per month, each successively lower scenario has a maximum completion rate that is 50 less than the next higher scenario (1035, 985, and 935 new wells per month at maximum).
Thanks Dennis
There are many variables such as global GDP growth, oil price, sanctions, growth in EVs and scale of increase. Shale gas will be in great demand for the next 5 to 10 years, so that will aid drilling.
There are people In The industry who think shale will peak in 2024. We will just have to see.
Charles,
You are welcome. As far as a peak in 2024, I think this is a minority position within the tight oil industry, keep in mind that many who are attracted to peak oil sites are very pessimistic by nature and may not be a representative sample of “the oil industry”.
In any case, shale profile has the average Permian completion rate from Feb 2022 to July 2022 at about 426 wells per month (and this estimate tends to be revised higher as more data gets reported to the RRC). The low tight oil scenario in the chart presented assumes a Permian maximum completion rate after December 2022 of 450 wells per month, as you can see for that scenario if we assume 5 years of drilling inventory as some industry experts have suggested that takes us to December 2027 and it is clear from the chart that the low scenario peaks in 2027. In my view a 2024 peak is not really in the cards unless we assume a permanent recession from 2023 to 2035 or some other similar level crisis. My expectation is that a tight oil peak by 2024 has a probability of less than 5%.
The scenarios presented are likely to cover the range of expected outcomes with perhaps a 90% probability (with maybe a 5% chance output is lower than the low scenario and a 5% chance output is higher than the high scenario).
Chart below shows data to model comparison for Permian basin horizontal tight oil well output (data from Novi Labs) from Jan 2010 to June 2022. The correlation coefficient (cc) over this 11.5 year period between the model and data is 0.9986, the square of the cc (similar to R squared) is 0.997. It is this model that is used to project future output assuming no change in well profile after 2020 and with guesses at future completion rates after July 2022 (these guesses for well profile and completion rates in the future are certain to be incorrect.)
Dennis
There are reputable people who think it will peak in 2024 2025
https://seekingalpha.com/article/4484564-think-long-term-wheres-the-oil-supply-going-to-come-from
Charles,
We will see, I believe those forecasts will be wrong. HFI Research is trying to sell investment advice.
That piece uses pretty limited data from that Rystad forecast, the article below has a different take.
https://www.rogtecmagazine.com/rystad-energy-oil-at-100-could-trigger-an-additional-2-2-million-bpd-of-us-tight-oil-output-by-2023/
Much comes down to the price of oil, my expectation is the Brent will be at $90/bo or higher in 2022$ on average from 2023 to 2028, if Brent oil is at $40/bo in 2022$ over that period, then perhaps we get the 2024 peak some are claiming. I very much doubt tht oil prices will be consistently at $40/bo over the next 4 or 5 years.
What is your expectation of future oil prices?
Note that the Rystad scenario from Feb 2022 does not forecast a peak in 2025, that is simply the end of their scenario horizon.
https://www.energyvoice.com/oilandgas/387681/100-oil-could-unlock-2-2-million-bpd-tight-oil-surge-says-rystad/
Charles,
I may well be wrong, there are arguments on both sides, but much of the differences in expectations are due to a different expectation for future prices, my scenario for prices is on the high end and may well prove to be incorrect.
Note that the chart above from Rystad ends in 2023 with output at 8100 kb/d, 9200 kb/d and 9800 kb/d (for $40/b, $70/b, and $100/b scenarios respectively) where my scenario has output at about 8400 kb/d at the end of 2023. From my perspective the $40/bo scenario is highly unlikely and the $70/b and $100/b price range seems far more reasonable.
Bottom line is that the Rystad scenarios are far more aggressive/optimistic than my scenario.
Dennis
I do not see oil prices falling much below $70 for any length of time, OPEC cannot afford less than $70 and they can easily cut production to ensure oil is closer to $90 or above.
Now the dictatorship in China has realised they cannot stop an airborne virus the Chinese economy will pick up and internal consumption will continue to grow.
The question is; will global oil production start peaking out before you think, and will electric vehicle sales be closer to your predictions or closer to what I think they will be.
If electric vehicle sales are well ahead of global geological peak than oil prices will be around the $70, $80.
If electric vehicle sales result in oil consumption falling at around the pace of global oil decline then $100 to $140 oil is probable.
If as I believe electric sales will be behind the decline curve then we will be facing a shortage of oil by a couple of million barrels per day by 2026
https://evadoption.com/ev-sales/ev-sales-forecasts/
Then oil prices will be around the $120 to $160. It will have to be high enough to reduce consumption by that 2 million barrels per day.
Charles,
If your expectations for EV adoption is correct, then your scenario sounds reasonable.
Note however that oil prices of $120 to $160 (let’s call it an average of $140/bo in 2022$ for Brent crude from 2025-2035) might result in a relatively low decline rate of perhaps 1%. This would be an annual rate of about 830 kb/d (if we assume 83 Mb/d at the 2025 peak that seems to be your assumed date for peak oil). Also note that at the $140/bo oil price point we might see a plateau from 2025 to 2035 and it is likely that by 2035 enough EV adoption occurs that demand starts to fall below supply for oil.
The site that you linked focuses on the US which has had relatively slow adoption of EVs, Europe and China have seen much quicker adoption than the US (except for California where 4 in 10 cars sold are EVs).
For the World from 2013 to 2021 the average annual rate of increase in plugin vehicle sales has been about 40%. If we assume personal vehicles plugin sales grow by 35% per year until annual sales reach about 93 million per year we get the following for plugin fleet size in millions starting in 2021 with each new row being the following year:
17
26
39
55
78
108
149
204
278
372
465
558
651
743
836
The last year is 2035 and this is personal light duty vehicles only (gross vehicle weight under 3 metric tonnes.)
Note that I have not taken into account the likely increase in miles travelled using Transportation as a Service (TaaS) with EVs taking a large share of this market in the scenario above. In that scenario each EV used in TaaS replaces about 7 to 10 personal vehicles and demand for oil is reduced far more rapidly,
Charles, I trust you can acknowledge how utterly stupid this comment is: “….I think this is a minority position within the tight oil industry, keep in mind that many who are attracted to peak oil sites are very pessimistic by nature and may not be a representative sample of “the oil industry”.
This person’s only knowledge of the oil industry is thru the internet, the only oil men he knows is through the internet and who he has saddled up to because of similar belief systems. It is a judgemental, uneducated statement designed to give himself more credibility at the expense of others.
There are a lot of very smart people IN the oil business who are concerned about exhausted resources, decline and depletion. LOTS. There use to be lots here on AOB but they eventually get tired of how the content is controlled and leave.
Remember, please sir, the oil business today is not the oil business of just 15 years ago. Today it is full of bean counters who can go drill a shale well almost anywhere and make a little money. They do so using borrowed capital, or other people’s money, not their own. They don’t have to worry about failure, they don’t guarantee loans they make to drill wells, they all have enormous compensation packages regardless of poor decisions. History will show that many of them go bankrupt leaving behind billions of dollars, and small service providers who have been ruined…while their BOD rewards them for their failure. They have nothing at stake. Lawler, for instance, racked hundreds of millions off CHK before filing BK and getting a big bonus. Now he’s rowing Hamm’s boat. Everybody in the tight oil business is eternally optimistic about the future because they need YOUR money.
Real oil men, that work from a checkbook, are realists.
I visit here occasionally to see how dumb the comments can be and this morning I have been rewarded !
Mike,
I agree there are lots of smart oil men and perhaps yours is the majority position of most of them, I have no idea.
It seems there are many different opinions on the future of tight oil, I have no special knowledge about which is correct, I have arrived at my conclusions using available information and analysis. We have different ideas about how this analysis is best done, you like to select a set of data from the whole, I think including all of the relevant data is the best approach as that is what I learned as a student of statistics. The question is which subset of data best represents the whole picture? I don’t think we can determine the correct answer and so I use the whole set of data.
A scenario below assumes 48 months of Permian drilling inventory at the recent completion rate of 429 wells per month (past 3 month average) then completion rate decreases to zero by September 2029. URR is 28 Gb vs USGS F95 TRR estimate of 45 Gb (mean TRR estimate is 75 Gb). The scenario seems pretty pessimistic from my perspective, but it would be interesting to hear your thoughts and those of LTO Survivor, SouthLaGeo, George Kaplan, Shallow sand and anybody else who has been involved in the oil industry.
69000 total horizontal wells are completed from Jan 2010 to August 2029, with 37626 wells completed from Jan 2010 to July 2022. Of the 50 million prospective acres in the Wolfcamp, Spraberry, Bonespring, and Avalon formations identified by the USGS only about 15.7 million of the best acreage (highest productivity formations) are assumed to be utilized for the wells completed in this scenario, about 31% of all potential acreage and about half of the 30 million acres in the highest productivity benches of the areas assessed by the USGS.
The scenario is very conservative relative to the F95 TRR estimate of the USGS of 45 Gb where the expectation was that there was a 95% probability that the TRR was larger than 45 Gb.
@Mike
Additional to the bean counters (I know them from other industries) the oil chaos results at the moment from the prices created by wallstreet sharks and computer traders.
Going up and down 10$ / barrel and more per week has nothing to do with demand and supply – and no solid calculation can be done on these price volatility. Looks like some of the folk trading bitcoins or gamestop and other worthless stuff changed over to oil futures.
Much oil world wide is produced by state companies – they can act even as stupid as the OTM drillers. Together with the traders this is a mess.
And the politics. We have a lot of shale gas here in Germany (no oil), and we need gas. Still the government holds up the drilling ban due to enviromental risks and climate. But importing the stuff, after it is liquified and regasified for lot’s of energy, is ok. Instead of laying down some pads and call in the pumps and ricks.
So the reserves in the time of need doesn’t help if you are not willing to tap them.
For comparison, my best guess Permian scenario is below with completion rate increasing to 600 new wells per month by Feb 2027 and then with completion rate decreasing after June 2028 due to falling oil prices as EV transition reduces oil demand to less than supply at $100/bo in 2022$. Completion rate in Permian basin falls to zero by May 2031 when the last horizontal well is completed in the Permian basin for this scenario. The average annual rate of increase in Permian tight oil output from July 2022 to June 2027 for this scenario is 8.9%/year. For comparison the average annual rate of increase in Permian tight oil output from Jan 2017 to Dec 2019 was about 39%/year, over 4 times higher than my scenario from mid 2022 to mid 2027.
Note that this scenario’s URR is 7 Gb less than the USGS F95 TRR estimate of 45 Gb.
Tight oil scenario using the low Permian scenario (U=28 Gb). This is the minimum I would expect for US tight oil output assuming oil prices average about $90/bo or above in 2022$ on World oil market from 2023 to 2028. I expect there is about a 90% probability that actual tight oil output will be higher than this scenario.
Thanks Dennis.
That is a very brisk dropoff in production starting about 2028.
And that is primarily due to replacement of transport miles by EV (demand drop), rather than economic/geologic limitation- correct?
Hickory,
The drop is due to falling oil prices for my best guess U=38 Gb, but for the lower 28 Gb scenario, the drop is based on the assumption that tier one drilling location run out and drilling drops due to lower profits due to lower well productivity, in short it is geological limits. My guess is that high oil prices would allow about 50 Gb to be extracted from Permian basin.
Thanks for the explanation Dennis. Makes sense,
and I really appreciate your efforts to quantify the impacts of these big variables. It helps someone like me to see the possibilities in visual form very much.
And thank you for being so tolerant of insulting behavior for the sake of gathering and incorporating input from various viewpoints. That is gracious to a degree that I could never muster.
One of the ‘funniest’ things I have ever seen on this site was a recent allegation that one of your charts was posted
with “malicious intent”!
Hickory,
Thanks. There are some who are very passionate about their point of view and charts or comments that dispute that point of view are seen as “malicious, insulting, etc”, that is fine I try not to respond in kind, but sometimes fail, in many cases I need to stop and think a bit before responding, it is a problem on the internet and sometimes difficult to be as benevolent as I should be.
Every drilling season a few small operators return to the North slope of Alaska to try and unlock new resources. This has been going on for years and the usual suspect is a company called 88 energy. However there are others and the most recent is making big claims and attracting controversy.
Pantheon Resources: Heading Up To Alaska https://seekingalpha.com/article/4558616-pantheon-resources-heading-up-to-alaska
https://twitter.com/oilpipeline/status/1600091506102059008?t=M1CX5zcByJQxp3Fgnt1oCA&s=19
I think the recent increase of Kuwaiti and Saudi production is mostly due to restarting production in the Neutral Zone.
Frugal
According to this article, the neutral zone is producing 175 kb/d. A second source claims output of 250 kb/d at the end of 2021. Are you aware of an additional ramp up since then?
https://www.spglobal.com/commodityinsights/en/market-insights/latest-news/oil/070422-saudi-arabia-kuwait-discuss-boosting-neutral-zone-oil-production
https://www.mees.com/2022/1/14/oil-gas/neutral-zone-exports-jump-to-highest-level-since-2020-output-restart/2522ea20-7541-11ec-b814-cd49821404f4
Everyday Energy-Usage Comparative Analyses Website?
(Ideally With User-Input Feature)
Hi Folks, just thought to swing by and ask if anyone might know of and recommend a site that accepts assorted user-inputted examples of everyday energy uses and then makes comparisons between them…
For example how many, say, BTU’s or whatever of energy might it take for a 20-minute-long hot shower (to heat that amount of water) or to take a trip by an average-sized ICE car (the gas/petrol used) to the corner store a mile away and back again.
Shaleisgreat
Thanks
I think close to 1,500 Gb are left. Dennis, the moderator, has a better handle on this since he tracks the reserves for use in his models.
When will crude oil run out? Using the simplistic R/P ratio, gives 50 yrs using the current 30 Gb/yr usage. More realistically, Never.
Demand will peak in the next 10 years and then available supply will exceed demand. Then there will be a long tail of slowly reducing oil reserves.
Ovi,
I would say at least 1500 Gb of TRR on a high oil price environment meaning over $100/b in 2022$ through 2040, if high oil prices last to 2050 possibly 2000 Gb.
My standard scenario would have remaining resources at about 1500 Gb, exactly as you said, it might be anywhere from 900 Gb to 2100 Gb.
Much depends on future demand and prices.
F**K the EU , — Victoria Nuland .
https://oilprice.com/Energy/Energy-General/Russia-Is-Selling-Crude-Oil-To-Asia-Above-The-60-Price-Cap.html
https://mishtalk.com/economics/trading-oil-in-yuan-would-it-matter-at-all
Oil to be traded in Yuan?
Why is EIA reporting for Russia with 500kbarrel/day less than the Russian ministry. I EIA trolling the Russians to make it look that the data is unreliable?
if EIA would have other data about Russia I would expect more than just a 500kbarrel/day offset…
And then fudging numbers isn’t strange to EIA either, there were some references right on these blogs and theoildrum and don’t have any handy
Saya
There is nothing sinister in what the EIA is doing. Different countries have different definitions of Crude plus Condensate, C plus C. As noted in the post, the EIA reduces Russian output by 404 kb/d because, I assume, they can’t get consistent data from the Russians and it is possible the Russians don’t track that data. It is the EIA’s best estimate.
Note that the same thing happens with Canada and Mexico. See the notes under the Canada and Mexico charts.
On the other hand, if you go to the Norway site linked under the Norway chart, you will see how they report Crude and condensate separately and the EIA accepts those numbers.
Note that definitions are important. The OPEC cuts are Crude only. Note in the table below Russian crude output is 9.87 Mb/d.
OPEC + Crude Production
Ovi,
I don’t understand how you compute the compliance column. For example for Angola, I compute:
100 X 1.09/1.455 ≅ 75% ≠ 600%.
Schanz
They are not my calculations. They are from the Platts chart at the end of the link below. Also I think the calcs are wrong.
Also I would do the inverse of your calc and come up with 133% since they are over compliant.
https://www.spglobal.com/commodityinsights/en/market-insights/latest-news/oil/120822-gulf-producers-lead-on-opec-cuts-saudi-crude-output-at-6-month-low-platts-survey
Yes, right, thanks. I had it backwards producing under quota is over compliant.
Kengeo,
You asked in previous thread what I expected for conventional decline rate for US production.
I looked at L48 production minus Gulf of Mexico output minus tight oil output from Jan 2000 to Sept 2022. The annual decline rate using ordinary least squares on the natural log of conventional onshore L48 C plus C output over that period (tight oil data only goes back as far as Jan 2000) is 1.72% per year. That would be my estimate going forward, but as always we do not know the future we can only guess.
The 7% annual decline rate estimate that you suggest is very far from likely in my opinion.
Original comment at
https://peakoilbarrel.com/permian-pushes-us-december-oil-production-to-post-pandemic-high/#comment-749830
George
In the previous Non-OPEC post, you suggested that I should check out the NSTA to get UK oil production. I have done that and you can see what I found under the attached UK chart.
The EIA is reporting August production as 590 kb/d. That is very close to what the site I used reported:
https://knoema.com/atlas/United-Kingdom/topics/Energy/Oil/Production-of-crude-oil
This is what I wrote in my response to you at the time.
“The site I referenced stated the following. “In August 2022, production of crude oil for United Kingdom was 587.49 thousand barrels per day. Includes crude oil, shale oil, oil sands and NGLs ” It did not mention condensate.”
For August the NSTA is reporting 640 kb/d and 625 kb/d for September. The knoema site is reporting 604.55 kb/d for the UK.
I would appreciate your thoughts. Is the NSTA reporting all lipids since they are reporting August output of 640 kb/d.
The attached picture comes from this site:
https://www.nstauthority.co.uk/data-centre/nsta-open-data/production/
and is the source for the NSTA data. Note in the upper left I have selected Oil Produced.
Ovi,
I believe in the UK they define “oil” as C plus C plus NGL, but Mr Kaplan would know better than me.
Dennis
I think you are right and that is what I think. Let’s see what George says. I compared a back months and the increment was not very consistent.
NSTA reports lease condensate (produced at well head) and plant condensate (produced in pipelines to shore) but nothing downstream, so no refinery gain or natural gas plant liquids. Those numbers may be available at the DUKES site, but I’ve never had cause to look. If oil and NGLs are cited but condensate not mentioned specifically I think it is almost certainly included as an NGL (but not an NGPL, where p is for plant).
According to that consultant’s site their numbers are for “United Kingdom – Production of crude oil including lease condensate”. The reference to NGL is in a description for crude oil, which is therefore wrong. Their number for total liquids is over 690 compared with 604 for C&C, which sounds about in the right proportions, but I’d trust NSTA numbers more than their’s.
There has been concern expressed that rapid tight oil decline rates cannot be overcome.
The scenario below has no Permian wells completed after September 2022, the average decline rate through June 2027 is about 25% per year. The first year decline rate is 52%/year, second year decline rate is 29%/year, and decline rate from September 2024 to June 2027 is 18.6% per year.
Note that the model assumes well profile is unchanged from 2020 to 2022.
My scenarios take this decline into account.
Stephen,
Shaleisgreat is now gone. He is persistent, he first offers a comment that seems to be from a sane person to get in the door and then reveals his true colors. Then he is banned.
Thanks Dennis, your (and Ovi’s and Ron’s) moderation is greatly appreciated, sorry you have to deal with unstable folks like that and that there isn’t more care for them in our world.
On OVI’s OPEC crude production table above. My latest post:
11/12/2022
OPEC 10 crude production and quotas during Covid
http://crudeoilpeak.info/opec-10-crude-production-and-quotas-during-covid
Matt
Very interesting. So the current OPEC 10 commitment is 500 kb/d less than January 2019. The 500 kb/d drop for the current commitment comes mostly from dropping Ecuador.
Y’all can pack it in and go n home.
Der Fusion ist hier.
I await the announcement (and independently made this joke in the non-petroleum thread, great minds and all that).
We need to see if this is actual net usable energy output, or increase in energy gain. Will be interesting. Still not the panacea people will expect, even if it doesn’t take decades to get potentially scalable reactors with massive subsidies to make worthwhile.
Even then, we’ll fuck it up. What problem has ever been solved by humanity going “if only we had more energy?” for the 9,999th time.
Mike B,
It will take decades or more for a small experiment to be scaled up to a working commercial scale facility. From what I have read the energy input to the laser is at least 10 times the laser output, if that is correct the process remains net energy negative.
https://nymag.com/intelligencer/2022/12/how-big-is-the-u-s-fusion-breakthrough.html
Yep. Just being a little snarky.
Remember when nuclear was too cheap to be metered?
Lol
The lasers input energy has been about 500 MJ. That is a factor 200 between input and output of 2.5 MJ. The energy generated by fusion must still be converted to electricity to be useful. This gives another factor of about 2.
I assume the 500 MJ is the energy used to charge the capacitors. To generate the charge from something other (fossil fuels or solar energy etc.) , we get another factor of about 2.
All together result in a factor of 800.
I don’t know how much energy is to be spent to set up the laser device, the fusion device and the electricity generators.
Dennis
According to the article, the experiment yielded 20% excess energy. That will grow over time. The next question relates to the conversion efficiency of all of that energy. Conversion efficiency would probably be in the neighbourhood of 30%. So that 120% gets reduced to 36% which is a net negative. Thermodynamics sucks. 😡😡
I agree this will be a long wait. However, if true, it is an amazing breakthrough.
According to the Financial Times, LLNL scientists used the world’s largest laser to bombard a tiny pellet of hydrogen, creating a fusion reaction that “produced about 2.5 megajoules of energy, which was about 120 per cent of the 2.1 megajoules of energy in the lasers, the people with knowledge of the results said, adding that the data was still being analysed.”
Ovi,
Fusion may always be the energy of the future, we remain probaly a half a century ( and that might be too optimistic) away from commercial use of fusion as an energy source.
Dennis
I don’t know how much extra energy in required to charge that laser. Looking at the output side will require the output energy to be at least 250% of the input energy. Assuming 40% energy conversion, just gets us back to 100%. It will be a long road ahead.
Ovi,
I also do not know the details, but have read that a laser pulse of X MJ requires some significant multiple of X of energy input to the laser, I do not know what that multiple is, I have seen estimates of more than 10 and others that suggest the multiple is 200.
I am not an expert on lasers.
Dennis
Maybe we are not experts but we do know enough to know that it’s a long way off.
No fusion any time soon.
https://youtu.be/LJ4W1g-6JiY
I had read before that the big problem is metastability. Nothing can touch the energy source so it has to be suspended as a plasma via magnetic fields. Very difficult to keep it in place stably. The other technique of shooting a pellet with lasers I can’t visualize.
The laser itself is a pretty complicated machine. My brother worked on the NIF project for years, and he is an expert on lasers and cooling.
Usually a laser works by bouncing light back and forth inside a crystal until it gets strong enough to exit one end instead of being mirrored. The approach doesn’t work on very high powered lasers, because the crystal heats up too much. So these lasers have a wind tunnel that pushes a gas at high speed through a small chamber. This chamber is used instead of the crystal. Because the gas is moving so fast, it doesn’t overheat, and the motion of the gas doesn’t disrupt the lasing.
He is dismissive of the project as a method of generating electricity and says the energy output needs to increase a thousandfold to match the input. I suspect that’s an exaggeration. According to him, the real purpose is to understand H bombs better without violating the test ban treaty.
I did my research on the semiconductor gallium arsenide, where the saying was “Gallium Arsenide is the material of the future, and always will be”.
Well, since that time GaAs has been used in optoelectronics applications such as lasers and LEDs and high-speed electronics such as cell phones. It took about 10 to 15 years for the transition.
https://www.eetimes.com/gaas-still-dominant-in-cell-phone-rf-study-says/
Paul,
Yes sometimes the problems are solved, but from my perspective it will likely be considerably more than 10 to 15 years before we see commercial fusion power plants.
Your thoughts?
I have read that the enrgy input to the lasers to produce the 2 MJ pulse was probably around 300 MJ, does that sound like it is in the ballpark? My guess is you may be more up on lasers than me given your background.
Heard that too. Very small EROEI, similar to oil shale I imagine. The sanity test on this is to imagine collecting solar output in the desert and concentrating that as the input, so somehow recreating the sun’s fusion remotely as a secondary effect. There has to be some clever fusion trick going on as it can’t just be the sledgehammer effect that the sun’s gravity employs in its core.
Paul,
If it is 300 MJ spent to get 3.15 MJ out, I think this would be a negative EROEI, tight oil might be low, but not negative. Net energy would be around -296.85 MJ. Seems like a long road ahead.
The 300 MJ in the capacitators of the laser is exergy, generated from energy. The energy to generate so much exergy is at least 600 MJ, probably more. The 3,1 MJ of the plasma is energy. This must be converted to exergy to be useful. Again, in the best case it is possible to get 1,5 MJ exergy.
Lets assume we have only one conversion step from energy to exergy, because the input for the laser is generated from the fusion device. Then we get a factor of 600/3,1, that is about 200. The building of the laser unit, its computers etc. consume additional energy, so it is more than 200.
If it is 200, the EROI is one, because all energy generated is consumed by the fusion device itself.
To run a society, an energy source with about an EROI = 4 is required (rumours). Four times more energy must be generated than consumed. So we find, a factor of 800 is needed.
Because the laser system and fusion device need very much energy to be set up, a factor of 1000 seems more appropriate.
How long does it take to improve the experimental setup by a factor of 1000 ? I have no idea. And i have no idea, if it is possible at all.
https://www.youtube.com/watch?v=1g_A5tEApa0. Recent eval on latest fusion news. Looks like EROEI is ~0.01.
https://market-ticker.org/akcs-www?post=247626
“So the laser beams contained 2.05MJ of energy but the unit consumed 300 MJ of energy to produce the 2.05 MJ of laser beams that was aimed at the target.
In other words they produced about 1% of the energy they put in, not 120%.
The blunt word for what was allegedly reported, in other words, is bullshit“
China has lifted more or less all Corona restrictions now.
Especially travelling from one province to another is possible without the app now. This will revive a lot of traffic.
The corona infection wave is a Tsunami now – it has gotten out of control already weeks ago. I think the crest should be soon, an in January there will be falling numbers. It’s hard since there was no preparation – and people are calling the emergency hotlines already with mild symptoms since after 2 years of horror propaganda many have fear.
At the new year festival the wave will reach all small villages where it hasn’t been before, but then it will be over.
There will be deads, especially with the elderly. And the dead from the isolation of endless lockdowns will cease.
Permian Basin tight oil scenario with oil prices assumed to start declining in 2030 (thus reducing completion rate rapidly after 2030) URR is 38 Gb from 2010 to 2045. Output is presented on a log scale to show how the rate of growth and decline changes over time. On this scale the slope of the curve is the exponential rate of increase or decrease over time. The scenario has a total of 90516 wells completed from Jan 2010 to April 2031 with no wells completed after April 2031. Through August 2022 the scenario has 37853 wells completed, with 26667 wells completed up to December 2019 and 34263 wells completed through December 2021.
Dennis, what is causing the change in decline rate so many years/decade after you turned off new wells? I’ve never seen that profile from any aggregate formation or play in my career. Declines just continue to decline away to insignificant volumes, wells are plugged when they cross the economic limit, and the remainder continue declining. The aggregate decline is primarily hyperbolic until it hits the exponential decline of the slowest declining member among the wells inside the group. On a semilog plot that is then a straight line. Not that transition you show from the intial development cessation to something completely alien to the basic reservoir physics that follows. Is there logic in there somewhere that you’ve inserted that overrides such first order principles?
Reservegrowthrulz,
People in the industry have suggestedcthe economic limits of the wells are around 20 bopd. So I assume wells are shut in at about that output level for 10k lateral horizontal wells.
So it is economics that results in this behavior, at some point as wells reach economic limits, output goes from x to zero when it is shut in.
Mike Shellman claims there are only 3 to 5 years of drilling inventory for tier and 2 location remaining at current drilling rates.
That is the basis for the 28 Gb scenario, after 48 months I assume a rapid decrease in completion rates.
DC, economic limits are a function of oil prices and generally speaking, WOR. It’s more like 15 BOPD and wandering around 10 BOPD. Think I’m wrong… you and your oil buddy, whomever the hell he is, can belly up to the bar for a workover on a 15 BOPD Lower Spraberry well making 120 BW that has a hole in the tubing, parted rods and a stuck TAC. Thats $100K big boys, do the economics on that and put your money where your opinions are.
48.5% of all Permian Basin HZ tight oil wells now make <50 BOPD and 120 BWPD. They are on accelerated decline rates of 13% each year and going down.
Fellas like you are not helping America get ready.
If you think I am the only one in the world that is worried about resource exhaustion and remaining drillable locations in the Permian, do your homework. Don't blame me, DENNIS! for your unrealistic, uneducated, inexperienced analyzes.
https://www.oilystuffblog.com/forumstuff/forum-stuff/the-word-is-out
If you want to be shed of me, DC, stop insulting my industry and the good men and women in it; we did just fine without you for 125 years. Quit dropping my name. I don't do that to you. Why in the hell would I?
“Fellas like you are not helping America get ready.”
Which rises the question, what does getting ready mean to you ? Because stopping exports doesn’t fix anything. That’s just all hat and no cattle. But of course you already know that. Or is it your promoting your website ?
Stopping US oil exports leaves scarce oil resources in America for Americans. It prevents waste (water/flaring) and promotes conservation. Tight oil is vital source of long term energy security for our country. People that promote US oil exports make money from those exports. Shareholders looking for dividends from integrated majors like Chevron and Exxon, for instance. Its them first, money first, country last. Most of the oil drained from the SPR the past 15 months even got exported, some of it to China. If you think that’s all hat and no cattle you need some help, DH.
“and promotes conservation”
This is the only piece of reality in your reply, America has been an oil importer for over half of the last century. Your America oil first attitude is an entitlement personality ignorance disorder. If 4 mbpd of tight oil was removed from the global market the price of WTI would increase by 50 to 100 percent and double Exxon and Chevrons profits. Also it would hurt the poorest American consumer the most. For what, to extend American supply an extra year or two for your entitled self. That’s no cattle or plan. As far as the hat goes, you should keep it, because you need it to keep the sun off you head.
The answer is to use this opportunity of tight oil to plan a transition to a oil free transportation system. Which BTW is in the works.
Regarding your website, Dennis gets 100 times more traffic than yours. Clearly management, marketing, personality and economics isn’t your expertise.
Have a great day No Cattle
HB,
I am happy to have Mr. Shellman share his expertise with us and would prefer that you not alienate him any more than he already has been.
He refers to POB as AOB for Anti-Oil Barrel in part due to comments attacking the oil industry. The US needs oil, he plays a part in providing that oil and he believes that exporting crude oil from the United States (or perhaps outside of North America) is a mistake.
I have no skin in the game so it is not important one way or the other to me. On principle it seems free trade makes everyone better off and generally Republicans agreed on this point in the past. In addition, it seems to me that it is unfair to tight oil producers to change the rules of the game at half time. The US Congress decided to allow crude oil exports in 2015, a measure strongly supported by Republicans at the time. Tight oil companies have planned capital spending on the basis of being able to export some of the oil they produce, though if a gradual reduction of crude exports was put into place it might do little damage to the tight oil industry. Lower capital spending could rapidly reduce tight oil output as decline rates are quite steep (over 50% in first year of production) especially in the early years of a well’s production.
Oil prices would increase, that would likely be good for the industry and capital spending would be reduced to gradually reduce tight oil output to 4500 to 5000 kb/d (refinery capacity for tight oil is somewhere in this range) perhaps another 1000 kb/d could be exported to Canada and Mexico, Mike’s thinking may be somewhere along these lines.
It is possible increased output from Canada, Brazil, Guyana, Norway, Saudi Arabia, Iraq, UAE, Kuwait, Iran, and Venezuela could fill the gap from lower tight oil output.
I don’t make these decisions, that is up to Congress and the President, though Texas could perhaps act independently through the RRC, if most Texans believe this is the best policy.
HB,
I forgot to mention, this website is successful due to the setup by Ron Patterson, it has little to do with me. Ovi does most of the posts of late so he is responsible for most of the website’s current success, though comments by everyone make it somewhat of a collaborative effort to inform each other and all the silent readers of this blog.
If we all try to be king of the hill and belittle other participants, no blog remains.
Try to do better please, don’t worry about shots at me, I can take it.
OilyStuff is an excellent blog.
Dennis, understood. Enough said. BTW, you know I basically agree with most of your projections. But here is something for you to think about on the demand side. The EIA weekly balance sheet is showing gasoline supplied down year to date 3%. Yet, miles driven in the states is up. I’m guessing two factors and maybe some noise. New vehicles sales are more efficient (EV’s) and price elasticity. You maybe over estimating future demand at higher pricing which would effect your peak oil future projection.
@Hunt
There is often a lot of noise in such statistics – or a good part of it is guessed / evaluated from other data.
For example the mile driven amount. I don’t report to our government about driving, and I don’t think you, too. So these numbers aren’t as exact as metered KWHs bought from utility companies.
Other have just noise from late reporting or other effects. Oil in storage for example is hurt by tanker traffic – these supertankers have over 1 million barrels eacht, and one or tho leave or arrive extra oil storage this week is miraculous down or up. Same with products – they are ex- and imported, too.
PS: I’m reading both blogs. And some more.
Paul,
I agree Mike Shellman’s Oilystuff blog is excellent.
https://www.oilystuffblog.com/
Huntingtonbeach,
I might be overestimating or underestimating future demand, it depends which scenario you look at. Consider the two scenarios below, my guess is that reality will be somewhere between these two (U=2200 to 2760 Gb).
Eulenspiegel,
In most states in the US cars are registered with the state and mileage on the vehicle is reported, it is possible people lie about that, I don’t and I assume most others do not. This data can be used to estimate annual vehicle miles travelled. Like all data it is imperfect.
Regarding mileage metering, in the old days in Sweden diesel cars had separate mileage meters that recorded miles traveled for taxing purposes (they could be tricked by various methods, of course)
So not a stretch that it can be instated elsewhere, if you charge by your own means at home etc,. Transponders would do the job easily.
Mike,
You are an oil expert, I am not, both you and LTO Survivor suggested 20 bo/d at one point, so I use that in my analysis. I agree many are concerned about resource exhaustion, including me.
I have never insulted the oil industry, that is your imagination, though perhaps any suggestion that my opinion is different from yours is considered an insult, unclear to me what your problem is. The analysis can easily be changed to 15 bo/d or 10 bo/d or 12.5 bo/d for shut in, it really does not change the overall result by much.
You have suggested 3 to 5 years of drilling inventory on many occasions, Reservegrowthrulz may be familiar with you from your blog or this blog. He is a petroleum engineer who has been around since the Oil Drum days.
You spin it anyway you need to Dennis; I am not in the last bit offended by our difference of opinions; I have to value those differences before I am offended. You seem to be the one always wanting to control the content of your forum. I am not an expert on anything, don’t claim to be. I am just a concerned citizen.
Economic limits are a mute topic. Accelerating decline rates <50 BOPD are not. Many people believe good drilling inventory is a problem in the Permian, not just me. Things never stay the same in the oilbiz, even hour to hour. If I want to pick a fight with a PE, well known for mocking the theory of peak affordable production in the world, I don't need your help. I'll do it on my own.
Mike,
Yes I agree the inventory of drilling locations is not unlimited, I disagree that there is only 3 to 5 years drilling inventory maximum as you have stated in the past. Sheffield of Pioneer has suggested about 10 years of drilling inventory for his company, I have read that Chevron has a lot of low royalty acreage in the Permian, it is difficult to find this information without paying a lot of money for proprietary data, it is often not revealed in quarterly and annual reports and many producers are private.
Found article below which suggests about 33,000 tier one drilling locations in Permian, if we assume 60% of wells completed are tier one wells and the monthly completion rate is 430 per month, that is 258 tier one wells completed per month and about 10.5 years from 2020 or 2030 when the last tier one locations have been drilled.
https://ajot.com/news/us-tight-oil-tier-1-drilling-share-may-exceed-50-of-total-in-2020
The average well profile I use for 2020, based on Novilabs data has a 452 kbo cumulative oil output at 160 months from first flow, the well is assumed to be shut in at this point with output at 20 bo/d.
A more recent article here
https://insight.factset.com/are-private-permian-operators-really-running-out-of-untapped-acreage
This suggests 7 years of inventory for private companies in Midland and 12 years in Delaware for private companies. It does not give an estimate for public companies, but implies that the inventory may be larger for publicly traded tight oil companies.
Found yet another estimate for inventory around 5 to 6 years for private operators viable at a $60/bo oil price.
https://www.investorvillage.com/smbd.asp?mb=5028&mn=138945&pt=msg&mid=23556807
See also link below which suggests about 106k viable drilling locations in Permian at $40/bo (this seems too high from my perspective).
https://pboilandgasmagazine.com/enverus-delaware-midland-basins-have-85-percent-of-sub-40-inventory/
A wide range of estimates are out there, my guess is about 10 years at current completion rates of 430 wells per month or roughly 51.6k locations (mostly tier 1 and tier 2) for all operators (public and private) in the Permian basin.
Mike,
My analysis of the economics assumes an operator plans for maintenance by setting aside 25k per month for downhole repairs, so for the average well 100k is set aside from cash flow every 4 months to cover these types of future problems. The average Permian well from 2013 would reach 15 bo/d after about 8.5 years (103 months) and about 2.6 million would have been set aside over 104 months for downhole maintenance, if each repair averaged about 100k, that would cover about 26 of these events over the 8.5 year period. If we also assume plugging the well costs 500k, then only 2.1 million would be available for downhole maintenance allowing for 21 repairs at an average of 100k per event or about one repair every 5 months, not sure if this would cover it, but perhaps you could enlighten us based on your professional experience.
It is clear that at 15 bo/d a big repair would likely not be done and the well would likely be plugged instead. So 15 to 20 bo/d seems reasonable for the terminal rate for these wells.
Mike,
Sorry about dropping your name, I have learned a lot from you and other oil pros.
Didn’t realize you didn’t want your name revealed, you post links to your site here which would lead people to
https://www.oilystuffblog.com/about-the-hand
I will refer to what I have learned from you as being from an oil professional if you prefer.
The only way for America to “get ready” for the end of the age of oil is to wean consumers off oil. That manes raising taxes at the pump, and rezoning the cities so people aren’t forced to use cars to get on with their daily lives.
Reservegrowthrulz,
I forgot to mention that my scenario assumes oil prices start decreasing in 2030 from $90/bo to $28/bo by 2042, at $28/bo and natural gas at $5/MCF and NGL at 35% of crude price per barrel, the average well in my scenario reached its economic limit at this set of prices at 28 bo/d at month 138 from first flow.
So the assumption of 20 bo/d shut in is likely too optimistic for my oil, natural gas, and NGL price scenario. The average well in my scenario reaches economic limits at about $40/bo at refinery gate (wellhead price assumed to be $5/bo less than refinery gate) at 168 months.
Reservegrowthrulz,
The average well with first flow from 2020 to 2031 has an economic life of about 161 months or 13.4 years, the last well is completed in April 2031 and 13.4 years later output ceases as the final wells completed in April 2031 reach their economic limit.
Reservegrowthrulz,
Chart below shows completion rate for Permian wells for the scenario on the right axis. The last wells are completed in April 2031 and by September 2044 output falls to zero. The wells reach 20 bo/d at 161 months based on a revised well profile also if we assume oil prices fall to $35/bo in 2022$ by 2039 from $90/bo in 2022$ in 2030 my analysis suggests the economic limits of the well are indeed reached at about 20 bo/d as predicted by oil experts.
Well profile for average Permian well from 2020-2031, hperbolic coefficients at top of chart from month 1.5 to month 90.5, first month is 0.5 for the middle of month 1 (output is 12962 b/month for first month). After 91 months I assume exponential decline at an annual decline rate of 12.5% per year up to month 152 (or 151.5 in model). EUR is 433 kbo.
RGR said:
Hyperbolic is just an exponential (maximum entropy) distribution of exponential declines, demonstrated this mathematically in several chapters of Mathematical Geoenergy. A very general result.
There’s also the Ornstein-Uhlenbeck model, which combines a hyypebolic initial decline with an exponential decline in the tail. This comes out of solving the statistical math of diffusional flow, which is anticipated in a porous shale environment. see Chapter 6.15
Lots of good stuff in there that is likely proprietary info of oil companies such as Reservegrowthrulezzzz works for 🙂
Dennis, there was a very good reason logarithmic charts were designed. To display data that can far better be displayed with linear charts was not one of them.
Ron,
A logarithmic chart shows exponential increases and decreases very clearly and is one of the important uses of such a chart. For a semi-log plot (vertical axis only has a logarithmic scale) vs time on the horizontal axis the slope of the line indicates the percent increase or decrease with respect to time.
A logarithmic chart shows exponential increases and decreases very clearly…
Yes Dennis, that’s exactly what it is supposed to do.
Ex·po·nen·tial
adjective
1. (of an increase) becoming more and more rapid.
However… though the Permian started off quite rapidly it is predicted to increase more and more slowly during the next few years. At any rate it is not predicted to increase so very rapidly that it would require a logarithmic chart to display such a rapid increase.
Ron,
The idea was to show changes in the exponential rate and note that an exponential can be positive or negative. The chart shows that the past rate of exponential increase was quite rapid (steep slope) compared to my scenario from 2022 to 2030 where the increase is slower (a flatter slope). After the peak, the negative slope of the curve shows whether the decline rate is fast or slow and it shows it much more clearly than a linear vertical scale.
Russian authorities have decided on the answer to the oil price ceiling
December 13 / 12:28
Moscow. The Russian authorities have decided on the form of response to the price ceiling for Russian oil. The draft presidential decree describing the mechanism has been agreed.
The document reflects the refusal of supplies to countries that have joined the restrictions. Thus, it is forbidden to sell oil if the contract specifies a country that has joined the ceiling as a recipient. Also, raw materials cannot be exported if a ceiling is specified in the contract as a condition or reference prices are set equal to the ceiling.
There is also a clause in the document that allows you to circumvent any prohibitions on transactions, with the permission of the government.
The decree will not apply to relations that arose before December 5. It comes into force from the moment of publication and will be valid until July 1 next year with the possibility of extension, Vedomosti reports. The document is still being finalized in the presidential administration. The details of the implementation of the decree, in particular the procedure for monitoring compliance with the ban, the range of goods, the list of countries, etc., should be prescribed by the government.
December 13 / 13:26
Moscow. The search reserve of the Russian Federation will allow the country to provide at least 27 billion tons of profitable hydrocarbon reserves by 2050. This was announced by the head of the State Commission for Mineral Reserves Igor Shpurov.
The existing balance of energy sources shows that today about 85% of global and Russian energy consumption comes from fossil fuels. The increase in energy consumption by 30% by 2050 sets the task of a sharp increase in its production. At the same time, at least 64% of energy consumption should be provided by fossil fuels, he writes in his article in the journal Energy Policy.
“This means that by 2050 oil production should remain at the current level, and the absolute increase in gas production will be 35%. Therefore, the assessment of the current resource base of fossil fuels and the possibility of geological exploration to fill it in accordance with the necessary needs is one of the most important tasks of the world energy supply,” the publication says.
The author notes that the resource base of Russia, confirmed by the successful geological exploration of recent years, shows that the country has a prospective reserve that allows it to provide at least 27 billion tons of profitable hydrocarbon reserves by 2050.
“But even this will not be able to fully meet the needs of future energy consumption. It is necessary to attract renewable energy, but not as the main, but as an auxiliary source of energy,” the publication says.
It is assumed that the share of RES will be approximately 36% in the overall balance of energy consumption. Achieving this indicator should be ensured by a multiple increase in the production of critical minerals for production, which will need to be mined ten times more than now.
“It is important to name such an accent, which excludes revolutionary energy futurism,” the article notes.
Hi Alexander . Long time no see . Glad to see you return .
Hi Hole in the Head !I didn’t leave. I come here once a week. I’m interested in our topic. Now I don’t see the need to write.
IEA December Report
World oil supply fell 190 kb/d in November to 101.7 mb/d
World oil demand is set to contract by 110 kb/d y-o-y in 4Q22, reaching 100.8 mb/d, up by 130 kb/d compared with last month’s Report. Strong gasoil use in key consuming countries outweighs weak European and Asian petrochemical deliveries. Oil demand growth has been increased to 2.3 mb/d (+140 kb/d) for 2022 as a whole and to 1.7 mb/d next year (+100 kb/d), when it will reach 101.6 mb/d.
World oil supply fell 190 kb/d in November to 101.7 mb/d, breaking a five-month uptrend, after Saudi Arabia and other Gulf countries curbed supply in line with lower OPEC+ output targets. A steeper drop is expected next month as the EU ban on Russian crude imports and the G7 price cap take effect. Following annual gains this year of 4.7 mb/d, growth of 770 kb/d in 2023 will raise supply to 100.8 mb/d.
Attached are the IEA Production Estimates for December
OPEC 10 output declined by 770 kb/d.
Note the Saudi Arabia and UAE spare capacities, 1.74 Mb/d and 0.83 Mb/d respectively. I think the IEA has increased Saudi Arabia’s spare capacity by 0.22 Mb/d to 12.22 Mb/d because, if my memory serves me right, it used to be 12.0 Mb/d.
It will be interesting to compare these estimates with those from the OPEC MOMR.
Ovi,
MOMR has OPEC13 crude oil output a bit lower at 28.83 Mb/d for Nov 2022, also October 2022 is estimated at 29.57 Mb/d and OPEC13 crude oil output decreased in November by 744 kb/d according to MOMR.
Dennis
OPEC has both November and October lower by close to 200 kb/d. I presume the result of different sources.
What I would like an answer to is: What is IEA’s definition of Saudi Arabia’s sustainable capacity.
Is the SA 12.22 Mb/d a name plate capacity or is it a true sustainable capacity. Here is the critical question that needs answering. Does a Saudi producing oil well need regular maintenance?
If the wells need regular maintenance, then 12.22 Mb/d of sustainable capacity would imply possibly 13 Mb/d of name plate capacity. On the other hand, if the 12.22 Mb/d is name plate capacity, then sustainable capacity is closer to 11 Mb/d to 11.25 Mb/d?
Ovi,
Perhaps it is name plate capacity. I define sustainable capacity as the amount that has actually been achieved over a 12 month period which was 10634 kb/d for C plus C in the 12 months centered on June/July 2016. Perhaps Saudi Arabia will be able to increase sustainable capacity in the future, I will only believe it when I see it. The more recent 12 month maximum was 10597 kb/d centered on June/July 2018. These are based on EIA C plus C data.
I think this chart best shows how the oil industry is running out of opportunities and/or appetite for maintaining production of oil and gas. These data are the costs incurred in oil and gas production as reported in 10k, 20f and 40f annual reports. They have four components: development costs, exploration expenses, acquisition of proved acreage and acquisition of unproved acreage. Acquisition of production areas includes purchase of new leases but also purchase from other companies. The largest blocks show either complete company take-overs, such as ExxonMobil of XTO in 2010, Occidental of Anadarko in 2019, COP of Concho in 2021, or buy outs of geographical sections, such as Shell and BG in Brazil in 2016 and COP and Shell properties, again in 2021. Even as the average oil price has remained fairly constant since 2015 the activity has declined. Without the COP take-overs, last year would have been very low. This year hasn’t seen take-overs on a similar scale and there hasn’t been much discussion of increasing investment (lease sales have certainly not been very exciting) except some small increase in the Permian. Expectations for next year are also subdued and declining as the prospect for a long recession becomes more apparent. Therefore the downward trend seems likely to continue.
This chart shows the same costs for oil and gas production for the companies that are reliant mostly on tight oil and shale gas in the USA. COP is shown for comparison but also because it has been moving more towards a tight oil reliant business. One of the IOCs could swallow all these companies some times over. There is still a noticeable trend down from 2014 to 2020. For 2021 the increase is mainly due to purchases of existing assets that are not shown for previous years (Pioneer of private companies Parsley and Doublepoint, and COP of the Shell properties in the Permian). The picture will be clearer as the numbers come in for this year and next. I have seen little to indicate that there will be a sustained rise, the money men call it “capital discipline” but it’s really a lack of opportunities and the growth of fear over ambition.
Great stuff, thanks. Have you looked at debt for these companies over the 2006-2021 period? Supposedly some of it is being paid back since oil prices have risen in 2021 and 2022, but much of the cash flow may be going to dividends and share buybacks instead. It may be too early to tell as prices and cash flow increased more strongly in 2022.
I don’t have that data.
Very True George. I have never known an oilman to have capital discipline unless it is thrust upon him or her. Economics rule and the economics simply are not great currently due to much higher capital costs and lower product prices. $75 dollar oil is not sustainable for LTO unless costs fall dramatically.
I think it is the usual boom bust cycle now again.
Costs will only fall dramatically when the drilling stops – and then even more workers will leave the oil states forever. So the next boom cycle has to attract new ones – perhaps go almost completely on immigrants with special recruting and training programs.
Hiring and firing won’t work in rural areas – you can do this in towns where are enough people, or fired workers can work one year somewhere else. Companies here learned it the hard way in the year 2000 bust – their trained workers left for good after being fired and never came back. The next down turns they tried to hold their core workforce, even at a cost. They have “short work” here together with the employment state office. It’s a win / win – after firing unemployment money would have to be paid anyway by the office in a recession.
LTO Survivor,
It seems to me that Shallow Sand, Mike Shellman, and you are all very smart people and would likely have the proper amount of capital discipline. Are you all exceptional in that regard? My guess would be that there are a lot of very intelligent people in the oil industry as it is a very challenging field, I would think there would be only a few that don’t have capital discipline. Perhaps I am wrong as I have never met an oil man in person.
We are optimists at heart otherwise we wouldn’t be in this industry. The price cycles have been shortened and violent. In 2019,2020,2021 Wall Street demanded distributions via dividends. in order to protect shareholder value, companies, like Pioneer and others promised dividends. In so doing, capital budgets must be cut in order to make room for dividends and debt repayment. Now once again with Prices retreating, I anticipate a continued decline in the drilling rig count in the first quarter of 2023 or until Oil prices move up again.
To answer your question more completely, we make capital allocations based on the price of the product, costs and expected reserves at a moment in time. Due to the tremendous volatility in pricing, it is almost impossible to make decisions for long term planning.
Today our new company is drilling mostly out of cash flow which means, slower development for a longer period of time. We have over 100 drilling locations in East Texas and plan to drill only 10 wells per year. This could change, but our debt level will never exceed 1.5 x EBITDA and based on our economic model it suggests only 10 wells per year.
LTO Survivor,
Thanks.
Equinor boosts Johan Sverdrup oil output
OSLO, Dec 15 (Reuters) – Norway’s Equinor (EQNR.OL) has begun pumping oil from the second phase of its giant Johan Sverdrup development, it said on Thursday, boosting output from Europe’s biggest producing field by at least 185,000 barrels per day.
The startup comes just days after European Union sanctions on Russian seaborne crude took effect.
“At plateau, the (full) Johan Sverdrup field will produce 720,000 barrels of oil daily, aiming to rise to 755,000 barrels per day,” Equinor said in a statement.
It will be interesting to see if the addition of 185 kb/d will exceed the recent peak of 1,861 kb/d, shown in the Norway chart in the post, when the EIA January numbers are published.
https://www.reuters.com/business/energy/equinor-boosts-johan-sverdrup-oil-output-2022-12-15/
Dennis
With your global production graph peaking in 2035 or so.
How much adjustment have you made for countries that have not followed a classic production curve such as the U.K or Norway.
For instance Iraq which could have reached 12 million barrels per day if it were a decent law abiding country without corruption. Obviously countries like that have a much lower peak and much earlier.
They can also produce oil for longer at a consistent level.
There are many such countries
Charles,
The oil shock model considers conventional production from the top down. It takes discoveries and reserve growth historically and assumes the total will be about 2800 Gb of conventional discoveries (including future reserve growth). The past discoveries have been developed at a historical average rate of about 39 years between discovery and becoming a producing reserve over the period from 1918 to 2020, I assume this average rate continues in the future. On top of this model I match historical output using an extraction rate from producing reserves and assume future extraction rates will be similar to the recent past (2012 to 2022) over the 2022 to 2035 period and then will decline due to falling demand. I do not do a country by country projection. I model unconventional oil separately with a specific US tight oil model and extra heavy oil mostly following the Canadian government’s projection for oil sands with Venezuela’s Orinoco output assumed to be flat and then decreasing after 2050 (true also of Canadian oil sands, the government projection is only to 2035).
It is possible those that decline quickly like UK, Norway, and Mexico are balanced out by others with lower flatter peak like Russia, and Middle Eastern nations. There is huge uncertainty in these projections. Development rates could be different than my guess (either higher or lower), and extraction rates could be different, and discoveries might be higher or lower than my guess at the World level.
If we did this for the 30 largest producing nations plus the rest of the World lumped together we would have 30 more instances of guesses about the future times the number of diferent important variables (discoveries, development rates and extraction rates in the type of model I use). That is a ton of work and is done by EIA, IEA and OPEC with huge staffs of analysts. I use the top down approach to save time, it may not be the best approach, but any approach is likely to fail. Infinite possibilities and any single scenario has zero chance of being correct.
The scenario below assumes demand for oil remains at least as high as the supply of oil until 2080. My expectation is that output is unlikely to be much higher than this scenario (it could be a bit higher potentially from 2025 to 2030 by maybe 2 Mb/d) especially after 2030 when at some point I expect demand for oil will fall below supply (likely in the 2035 to 2040 time frame). For that best guess scenario extraction rates would fall as oil prices fall in order to balance supply and demand.
Thanks Dennis
Taken in total I think Peak Oil date will not change much by what happens in Iraq and other countries that have had political turmoil in the past. What probably will happen is the decline rates will be less than otherwise but it will still be a very difficult transition.
Charles,
Your welcome. I agree on all counts.
Great article linked at http://www.oilystuffblog.com
Thank you Mr. Shellman.
https://www.oilystuffblog.com/news-stuff
Dennis
I am surprised by this statement. “We estimate that a company with high-quality Permian acreage can generate $38 mm in undiscounted cash flow from a well given $80 WTI, compared with $8 mm in drilling and completion costs.”
I thought that with the shortage of material and inflation that the drilling and completion cost was $12 M and increasing.
As a side note, the STEO is showing no US production growth from October 2022 to October 2023, as noted under the US chart above.
Ovi,
I get my estimates by listening to oil pros and last I heard a 10k lateral well in the Permian was about 40% higher than before the pandemic when the capital cost of such a well was about 9.5 million so I get about 13.3 million, it may be that drilling and completion costs does not cover everything there is land cost (though all of this might be covered by royalties unless there is an initial signing fee or legal fees for a lease agreement, I don’t know)and there is other overhead such as gathering lines, storage tanks, etc (all the stuff I am not aware of). LTO Survivor, Mike, or Shallow sand could probably enlighten us.
I took a quick look at my economic analysis and I get about $24 million (2022$) of undiscounted cash flow at $80/b WTI, $5/MCF natural gas and NGL at 35% of WTI price. So if my 13.3 million capital cost for the well is correct this is about a 10.7 million profit on a 13.3 million investment. When we do a discounted cash flow analysis we find about a 32% annual return on investment for the assumed costs and prices over the life of the well. It is likely that in nominal dollars the undiscounted net cash flow would be higher, but I always do my analysis in real dollars (adjusted for inflation) rather than in nominal terms. Another difference is that I am using the Permian average well, a “high quality” well would have higher productivity and higher return. For me the average well is of more interest,
As to STEO, they may be expecting oil prices to drop or drops in GOM or Alaskan output, I haven’t looked closely.
The article is very good but their estimates of drilling costs at $8 million per well is about $3 million short of the new AFE costs of $11 million dollars.
LTO Survivor,
Thanks.
Up hole Mike discusses exporting shale.
I might be wrong, but I think we need to tie his argument to the cash burning drilling of 2015-19.
In those years, once the export ban was lifted, the US exported a lot of oil at a loss. A tremendous amount. On top of that, a tremendous amount of natural gas was flared into the atmosphere.
The low prices of 2015-19 weakened the industry’s employment base, as many retired or found new industries to work in. New workers didn’t enter the industry either.
Of course, the COVID pandemic was the final nail in the coffin for the industry workforce. I’m not seeing a near term scenario where it will recover.
I also think it needs to be tied into complete lack of spacing rules for shale, which is contrary to oil development policy in the US from the 1930’s until around 2010. So much stranded oil. So much waste.
Stripper operators have a conservationist streak. I’m sure that sentence will receive some push back. However, stripper operators live in the communities where they produce. They many times own the surface where they produce. They are trying to squeeze the oil out and extend the life of wells. Lowest footprint production. They always try to used new equipment before buying new.
Also, keep in mind the fields we operate in. They have been on the decline for decades. Our personal viewpoint has never been “energy abundance” which many still subscribe to.
Most of us are over 50. We worry about the future for our kids and grandkids. Most of us see how hard it is to find and produce more oil these days. Most of us aren’t convinced this transition will be easy. The future is so uncertain. The politics are more difficult than ever. The oil price is so volatile.
When I read Mike arguing for an export ban, it’s from the above perspective. In particular, 5+ years of selling oil at a loss, which gutted the labor force, plus complete lack of spacing rules, which stranded so much oil that we will someday wish we had.
Shallow sand,
Does it seem to you that I am arguing that we have an abundance of oil? My aim is simply to create realistic scenarios based on the best information I can find.
Does it strike you as contradictory that on the one hand oil producers sometimes argue that the government should not create obstacles for oil producers, but also arguing that the government should decide where the oil producers should be able to sell their oil?
Likewise a private enterprise makes decisions about how to run their business, if they fail they declare bankruptcy, those are the rules in most capitalist economies.
I agree with the analysis that tight oil producers overproduced in 2015-2019. Didn’t something similar happen in the eighties which had nothing to do with tight oil? It seems that some oil producers run their businesses prudently (you and Mike for example) and some do not.
I agree with the spacing rules being put in place, that is up to state regulators. I also agree with the wasteful flaring of natural gas not being allowed, also a State regulatory matter (though possibly Federal regulatory enforcement would be in order here to comply with the Clean Air Act, though I am not a lawyer and this would no doubt simply be tied up in court.)
Does a ban on oil exports seem like something a majority of the oil industry would support? It seems to me in the current political environment this is not very likely to have enough support to become law.
Thank you, Shallow; that is precisely the way I feel about the issue. Resource preservation and conservation buys us valuable time to manage a very uncertain future. We should think of that as life insurance, as a desire to leave something for our family’s well being when we are gone. To imply that our nation will not need the 7G BO it’s already exported since 2015, or what now appears to be 90% of all Permian tight oil production going forward, is difficult for me to comprehend. It’s like not believing a savings account is necessary because somebody else will take care of you when you get old. I suppose there are indeed a lot of Americans that feel that way.
And there is nothing hypocritical about being opposed to oil exports; the American oil “industry” has never been one big happy family joined together in mutual cooperation. The tight oil sector, for instance, has almost destroyed the American stripper well sector by doubling costs and creating leveraged oversupply of product that made prices low and unstable. The offshore Gulf of Mexico sector, the same. The tight oil sector feels no remorse whatsoever in the increase in market share it gained, from its own country, with borrowed capital.
And finally, if you believe in something you don’t quit because it’s bigger than you, or you think you can’t make a difference. You carry on fighting the fight. The ‘generalizations’ made about our industry here is indicative of knowing nothing about it.
Merry Christmas, buddy. Stay warm up there!
Mike,
Wouldn’t a ban on crude exports hurt oil service providers? Doesn’t it seem that it would be difficult to get politicians on board because it would likely result in higher oil prices? If we take 3000 kb/d off of the World oil market, we might be short on oil and the price of oil would likely be bid higher.
Would such a ban be gradually phased in to allow the market to adjust, maybe reduce exports by 3.5% per month to allow other producers to increase output to prevent an oil price spike, this would also roughly match the rate of decrease of tight oil output if no new wells were completed (though that might hurt the oil service industry).
Just trying to think about how this works to minimize disruption. An alternative would be to reduce the tight oil completion rate by 10% per month, but tight oil output falls more slowly in that case (the 3.5% decrease in exports would correspond to a cessation of all tight oil completions for a period of two years or more to reduce tight oil output as quickly as possible. For the Permian output would fall from 4500 to 1980 kb/d over a 24 month period for the no new wells completed scenario, to reach 1500 kb/d would require about 39 months. This simplified rough guess ignores other tight oil basins, in practice all tight oil regions would decrease output, I just haven’t run all 5 scenarios (Permian, Bakken, Eagle Ford, Niobrara, and other tight oil basins).
Trying to understand the plan for how a crude export ban might be best implemented.
Also note that in a sense the idea of not allowing crude exports essentially is an argument for leaving the oil in the ground, if I were to argue for that someone might accuse me of being anti-oil.
At some point the transition to other forms of energy will occur (perhaps by 2035 or maybe not until 2050) and the more fossil fuel that remains in the ground the better and also the higher oil prices that would result from a crude export ban might speed the transition to other types of energy. I would agree that the future is uncertain.
Hope you have a good holiday.
The notes above by Shallow Sand and Mike Shellman are well thought out and reflect what most “conventional” oilmen think about oil and gas in America. I give full value to “unconventional” oil and gas, but there is no doubt it has all but destroyed the core business of finding and producing medium-weight oil in this country. When you go to write a check for the drilling into a fault block, straight down for 10,000 feet, and the cost is sky-high and so is the risk, you begin to appreciate just how profoundly this LTO spree has affected the common sense of oil exploration. It is important to treat this as a blip, an aberration that will someday be over.
The “regulatory” commissions have contributed mightily to this debacle. By strictly enforcing Statewide Rule 32 (or its counterpart in ND, Oklahoma and Colorado), the TRRC could’ve let pipeline capacity dictate the pace of LTO in the Permian. Instead, they allowed some of these operators to vent methane, and others to flare it, almost indefinitely. The greenhouse gas index of CH4 is 27 times that of carbon dioxide. Look up the satellite images of the Permian at night, compared to London at night.
The world has learned to hate oil and gas producers–even though the average age of death prior to electricity was only 47–because of what they see as reckless behavior. The world is going to sop up all the oil and gas it needs–until something else comes along. And then the world is going to do its best to kill us off. Many “oilmen” know this and are trying to make hay while the sun shines. This is a bad conundrum that the world is in, and—call me a pessimist–it’s not likely to end well.
By the way, an “oilman” is one who loves this stuff. One who knows a little geology, a little welding, a little pipefitting, a little accounting, a lot about working with and handling hard-working men and women. The average CEO of a large oil or gas company would be just at home running PetSmart. A “real oilman” is cost-conscious, doesn’t boast (at least about his wealth), loves the land, his family, and the environment. Pretty soon, when this LTO craze is over, we’re going to have a few real oilmen left–but damn few. And that’s the horrible collateral damage of LTO.
What has been the US net oil export each year since 2015?
Its only ‘net’ that matters, since the nations oil refineries can only handle the input stock for they have been designed (for those who might not be aware of this base condition).
The major problem with the export ban is that we don’t have the refining capacity in the US to process the Light Tight Oil. If we had been able to build new refineries, we would not have to export any crude oil. Without the export band, the prices would be at a low level due to a permanent domestic production glut but the rig count would be around 100 and production would be only 1/3 the amount we are producing today which would mean more imports.
If a moratorium on US crude oil exports were to occur it would take less than a year for tight oil production to decline to levels equal to US refinery absorption rates. It would NOT change import rates. 4.8MM BOPD would still take 250 rigs to maintain, gas gathering infrastructure would get caught up to production, flaring would STOP, stress on vital groundwater sources would slow, the sector could be forced to learn to reuse water, produced water disposal that is now leading to more significant earthquakes would improve, D&C costs would go down, product prices would rise and likely become less volatile, less stress on the electric grid, less stress on Texas highways, crime would go down, well productivity would improve on greater spacing requirements, RR of OIP would improve (5% sucks !) the rest of the domestic industry in America benefits, as would Canada, and I could go on until dark why short term pain equates to long term gain.
BTW, I’m with Berman, I don’t think gasoline prices would jump, like some say, because of the quality of the crude coming off the market.
Wait, there’s more…because its in a big damn hurry to drain America first, most of the HZ wells now being drilled in the Permian are allocation wells and against Texas law; if the TSC rules unfavorably on that pending case, the tight oil sector is in deep shit.
Its interesting to me how many people are so deathly worried about the poor little ‘ol tight oil sector when half of what it does, does nothing for the American consumer. Its the tight oil phenomena that has led to the demise of the offshore industry, the stripper wells sector, failures in foreign policy decisions and bad things going on between us and VERY important neighbors to our north, and to our south. Underinvestment gets the blame for a lot of supply issues these days, consider why those “underinvestment’s” occurred in the first place the last 12 years. It was too hard for the rest of the world to compete with America’s money printing machines and the tight oil industry’s grow or die plan.
Whatever might happen to the tight oil industry IF exports were to cease it was going to happen anyway, much sooner than people think. Its’s shot itself in both feet and one knee already. Draining the rest of the Permian, for exports, is the last knee.
Best of all…American oil stays in America for OUR long term energy security and our kids and grandkids. So they can have the options we had.
Mike,
You’re saying overinvestment in tight oil has led to underinvestment in the offshore industry (I assume you mean offshore GOM), leading to the demise of the offshore industry. I have to disagree with you.
First of all, with very few exceptions, the operators in tight oil are different from offshore operators – Chevron being the biggest exception (Exxon is another exception, but they’re not too active in the GOM, but, of course, very active in Guyana.) And both companies have deep enough pockets that they can invest in both.
Second, regarding the demise of the offshore industry – I just don’t see that. Production is doing quite well, and with the large queue of projects either just coming on line, or set to come on line in the next 2-6 years, the GOM has a fairly healthy oil production future ahead of it, at least until the early to mid-2030s or so.
If there is to be a demise in offshore, (after these projects come online, reach peak production, and start declining) it won’t be because of tight oil, but because of the exploration maturity of the GOM. I’m only aware of 1 announced discovery in the GOM this year, and when I inquired a bit about it, I heard it was a fairly marginal one (Huron – drilled by Hess).
Bob, I would never debate your observations about the GOM. In fact, I respect them. I would say, however, that I have many Texas and Coon-ass friends still on the beach, out of work and I still see short-legged jack ups stacked by the dozens, everywhere, all this a decade old phenomena. You are zero’d on deep water, I was referring to shallow water prospects on the shelves…very much out of reach now because of a major shift in capital to short investment cycle tight oil and tight gas. THAT has hurt everyone in the oil and gas business in America, as has leveraged price volatility. I suggest that the US tight oil phenomena, and its willingness to operate under, and through debt, has disrupted the entire world oil order.
If your statement regarding the lack of remaining economic prospects in the GOM is true, and I have NO doubt that they are, all the more reason to cease the unfettered exports of tight oil from the Permian Basin.
If your family is starving I don’t believe you “share” the last of your food cashe with the community.
Mike,
For those who might receive royalties on the tight oil under their land, those resources may be forever stranded as the World transitions to other forms of energy resources to avert catastrophic climate change. This is good for the climate, but perhaps not for the oil industry, although maybe an early retirement for the oil industry is what you are advocating. Your proposal would certainly be best for the environment, on that point I agree. It does not seem realistic from a political perspective in the US and especially in Texas.
You are correct that it would only be about a year if all completions ceased in tight oil plays immediately, but a more realist gradual ramp down in the completion rate would lead to a 18 to 24 month period for tight oil output to fall to 5400 kb/d (I assume 4800 kb/d to US refineries and 600 kb/d exported to Canada and New Mexico).
Below is an earlier scenario I did with a gradual ramp down in completions where I aimed for 4000 kb/d of tight oil output. The scenario reaches 5400 kb/d after about 15 months.
Try as you may, Dennis Coyne, you are not going to embarrass me, or “shame” me into changing my mind about US oil exports. I don’t care about <1% of the American population that has earned $600 B of free money from tight oil and tight gas and I understand my position is not popular with my industry…and why. Everything you think I need help sorting out, I have already sorted out.
I became a successful stripper well operator over the past 60 years by thinking long term. I explained just a few reasons why I believe ceasing exports would benefit ALL of America, including, in the long term, the tight oil and gas industry itself.
I consider myself a good parent and a good American by worrying about my nation's oil future; I don't for one minute believe the future will turn out like you think, or I think, for that matter. So I believe in savings accounts and life insurance, in being prepared for the worse and happy if it never occurs. I believe in giving our kids the same chances we had when we were kids.
I don't want my country to fail, like many seem to want. Draining America of its remaining natural resources for exports is short sighted, greedy and, in my opinion, very 'un-American.'
And I consider myself a good Texan:
https://www.oilystuffblog.com/forumstuff/forum-stuff/west-texas-takes-another-one-for-the-team
Take comfort in knowing you are exactly like almost everyone else in America in favor of continuing oil exports, for whatever reasons they believe are true. We'll see how many of those people have a plan B, and what it is.
LTO Survivor,
My understanding is that it is possible to refit existing refineries to accommodate higher levels of tight oil capacity, but refiners don’t believe it is worth the expense as they need 30 years of tight oil output to make the investment viable. It would mean higher net imports, but the export ban would have little effect on crude oil imports to the US.
Does an export ban on crude oil make sense from your perspective? I imagine it would reduce investment in the tight oil sector, but you may not be in that sector any longer.
U.S. begins buying back oil for strategic petroleum reserve -official
WASHINGTON, Dec 16 (Reuters) – The U.S. Energy Department said on Friday it will begin buying back oil for the Strategic Petroleum Reserve, or SPR, the first purchase since this year’s record 180 million barrel release from the stockpile.
The department will buy up to 3 million barrels for delivery in February, a senior official told reporters.
https://www.reuters.com/business/energy/us-begins-buying-back-oil-strategic-reserve-official-2022-12-16/
https://market-ticker.org/akcs-www?post=247639
A different perspective of things that will be agreed and disagreed with on this site
“Carbon is why we have a modern society. Every single human advance through history of any note has come as a result of exploitation of carbon, one of the most-abundant elements on the planet”
“Physics and Chemistry are not the 10 Suggestions, everything in the Universe is predicated on those two things and both are deterministic in every case, if you think something you’re observing isn’t deterministic the reason is that you don’t understand what you claim to be an expert in and in fact you’re guessing and those who claim to have some back-fit mathematical model that will predict outcomes in the future are nearly always full of crap.”
New posts are up
https://peakoilbarrel.com/opec-update-december-2022/
https://peakoilbarrel.com/open-thread-non-petroleum-december-16-2022/
Oil Wells Creeping Into Texas Cities Herald Shale Era’s Twilight
(Bloomberg) — Each morning when Michael Quinn pulls into the parking lot of the luxury apartment complex he manages in West Texas and looks across the street, an unsightly vision blots the horizon: a 24-foot-high insulated wall.
Quinn, who works at the Midway Station Apartments in Midland, isn’t troubled by the eyesore. The barrier, covered in a sand-colored tarp, is designed to muffle noise from an oil-well site across the road. To Quinn, it’s a symbol of a flourishing industry that’s the lifeblood of the local economy.
But it actually tells a very different story: The wall, and an accompanying surge in urban drilling, is the latest sign that America’s shale fields are reaching middle age.
An uptick in drilling within the city limits signals that the very best rock in one of the world’s most prolific oil fields has already been tapped. In the shale boom’s early days, with so much crude-soaked land up for grabs elsewhere in the Permian Basin, there was little reason to deal with the red tape needed to bore underneath populated areas. But with over two-thirds of the Permian’s premium land now drilled, according to BMO Capital Markets, producers are seeking more permits than ever to burrow beneath Midland and its 130,000 residents.
Wells drilled this year produced between 8% and 13% less oil per lateral foot than a year earlier, according to BloombergNEF, the first major reversal after a decade of productivity gains. Pioneer Natural Resources Co., one of the biggest Permian operators, recently overhauled its drilling plan after executives were “not satisfied” with its well performance this year. Laredo Petroleum Inc. said some of its production was hurt by interference from other wells nearby.
A higher proportion of drilling is now done by private companies, which aren’t beholden to shareholder pressure to boost buybacks and dividends. But that’s contributing to lower productivity, according to Phillip Jungwirth, an analyst at BMO Capital Markets.
Though the Permian is running out of premium rock, it isn’t grinding to a halt by any stretch. Production there is expected to keep growing for at least the next few years, although at a more measured pace compared with the height of the shale boom.
https://www.bnnbloomberg.ca/oil-wells-creeping-into-texas-cities-herald-shale-era-s-twilight-1.1858125