A Guest post by Ovi
All of the Crude plus Condensate (C + C) production data for the US state charts comes from the EIAʼs November Petroleum Supply monthly PSM which provides updated information up to September 2022.
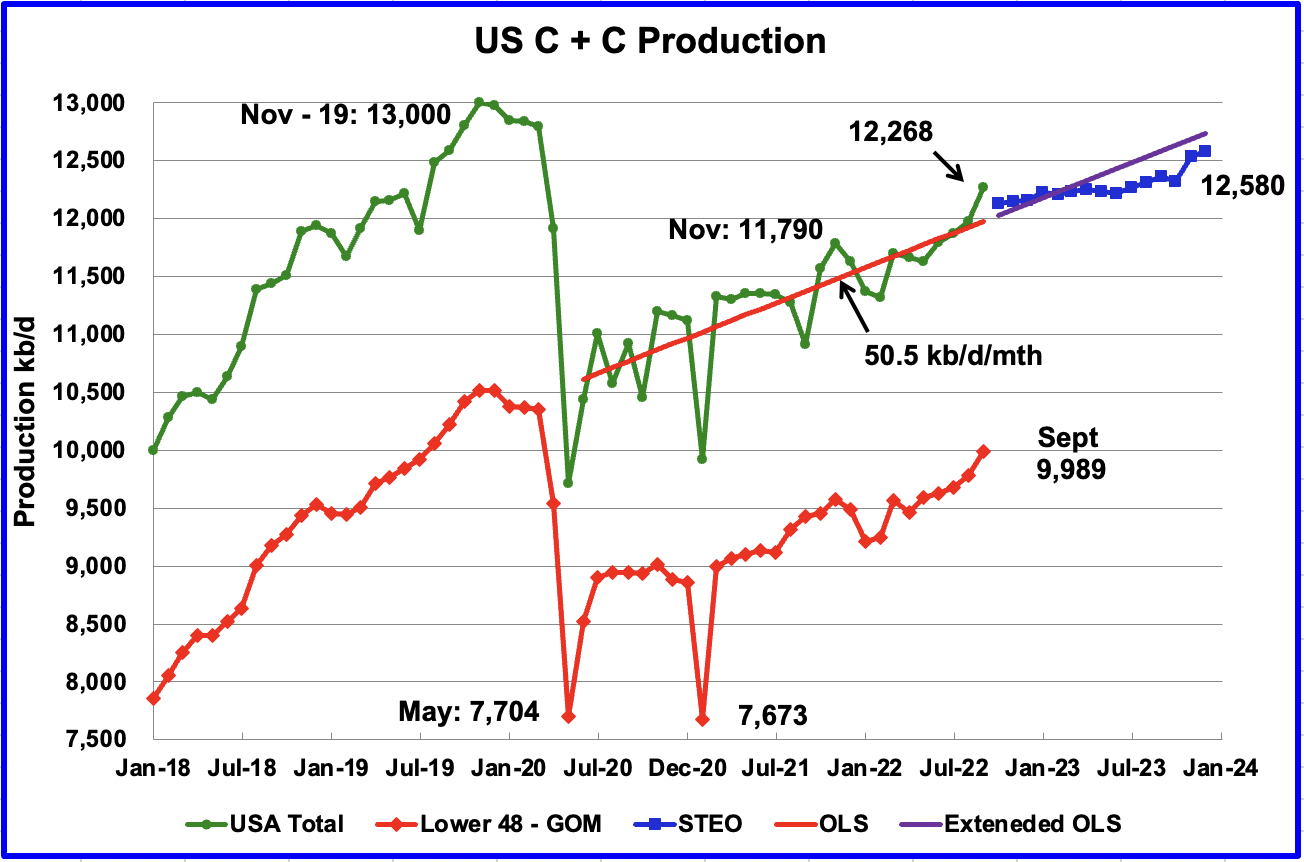
U.S. September production increased by 289 kb/d to 12,268 kb/d. It should be noted that August’s oil production was revised up by only 4 kb/d in the current September report. The large increase over the August update is real. For September, the states with the largest increase were Texas 90 kb/d, New Mexico 75 kb/d and North Dakota 43 kb/d. The Gulf of Mexico added 64 kb/d.
September’s production was at a new post pandemic high and crossed 12,000 kb/d. It is now 732 kb/d below the pre-pandemic high of 13,000 kb/d
While overall US oil production increased, a clearer indication of the health of US production can be gleaned by looking more closely at the Onshore L48 states. In the Onshore L48, September production increased by 208 kb/d to 9,989 kb/d. This means that 72% of the increase in US production came from the Onshore L48.
The blue graph, taken from the November 2022 STEO, is the production forecast for the U.S. from October 2022 to December 2023. Output for December 2023 is expected to be 12,580 kb/d.
The red OLS line from June 2020 to September 2022 indicates a monthly production increase of 50.5 kb/d/mth over that period. The first portion of red line stops at September because that is the range covered by the OLS analysis. The second portion is the same OLS line extended to see how well it fits the STEO forecast.
Oil Production Ranked by State
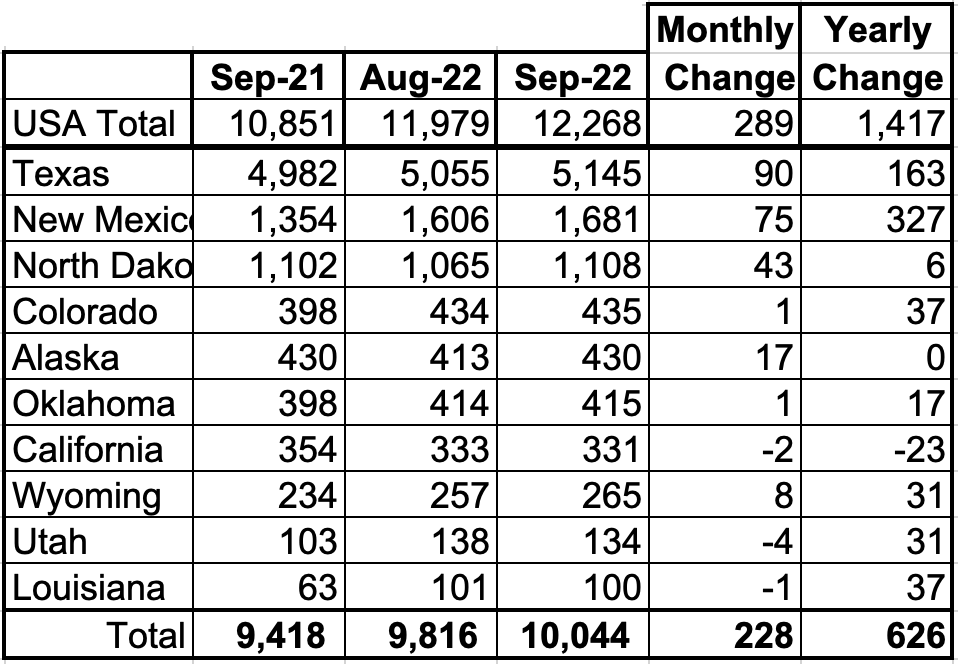
Listed above are the 10 states with the largest US production. These 10 accounted for 81.9% of all U.S. oil production out of a total production of 12,268 kb/d in September 2022.
On a YoY basis, US production increased by 1,417 kb/d with the majority having come from Texas and New Mexico. Note that only California is producing less crude this year than a year ago.
State Oil Production Charts
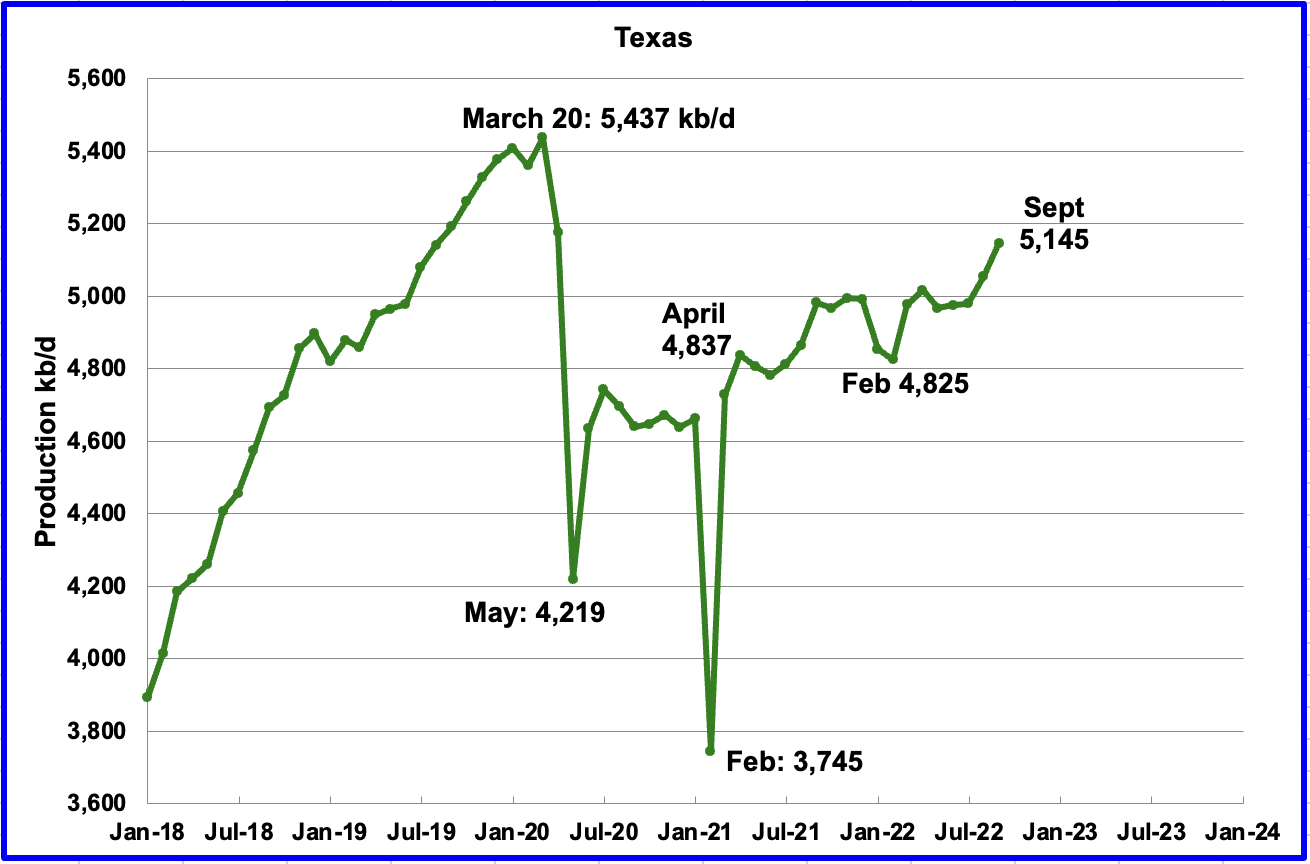
Texas production increased by 90 kb/d in September to 5,145 kb/d, a post pandemic high. Part of the increase is due to a 41 kb/d downward revision to August output from 5,096 kb/d to 5,055 kb/d.
In September 2021 there were 205 Hz oil rigs operating in Texas. By September 2022, 305 Hz oil rigs were operational, an increase of 100 rigs.
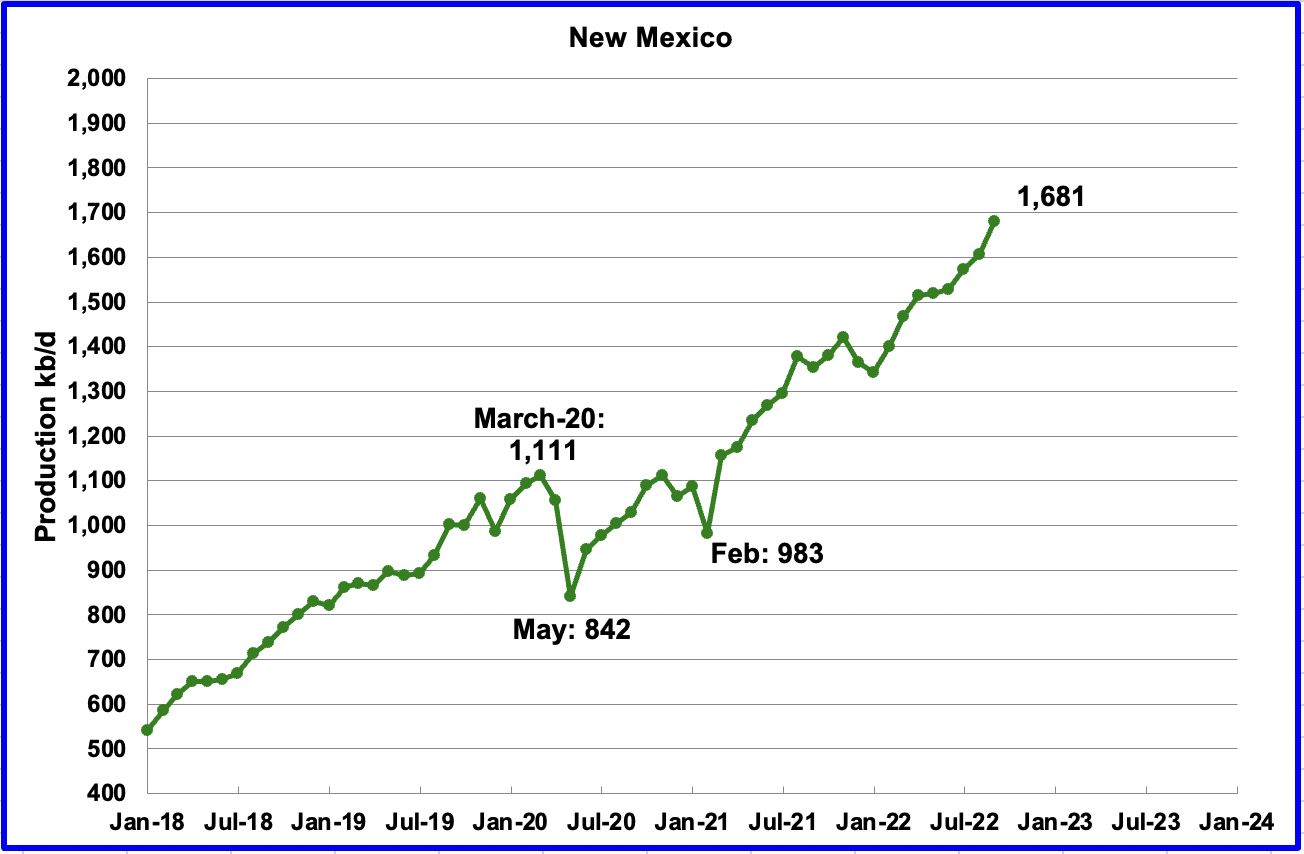
September’s New Mexico production increased by 75 kb/d to 1,681 kb/d to a new record high.
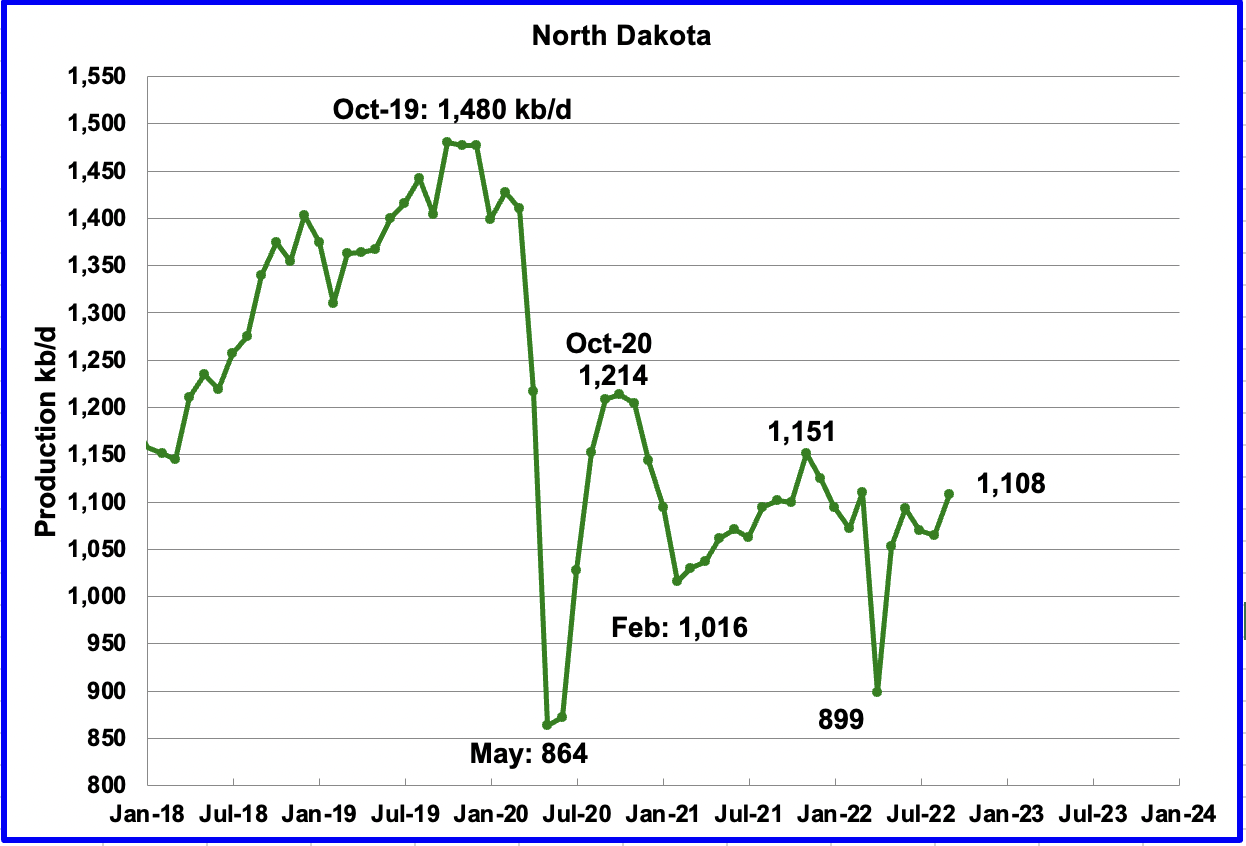
North Dakota’s September output increased to 1,108 kb/d, an increase of 43 kb/d from August and appears to have fully recovered from the severe April storms.

The North Dakota Oil and Gas Division reported September production of 1,079 kb/d, 29 kb/d lower than the EIA’s 1,108 kb/d?
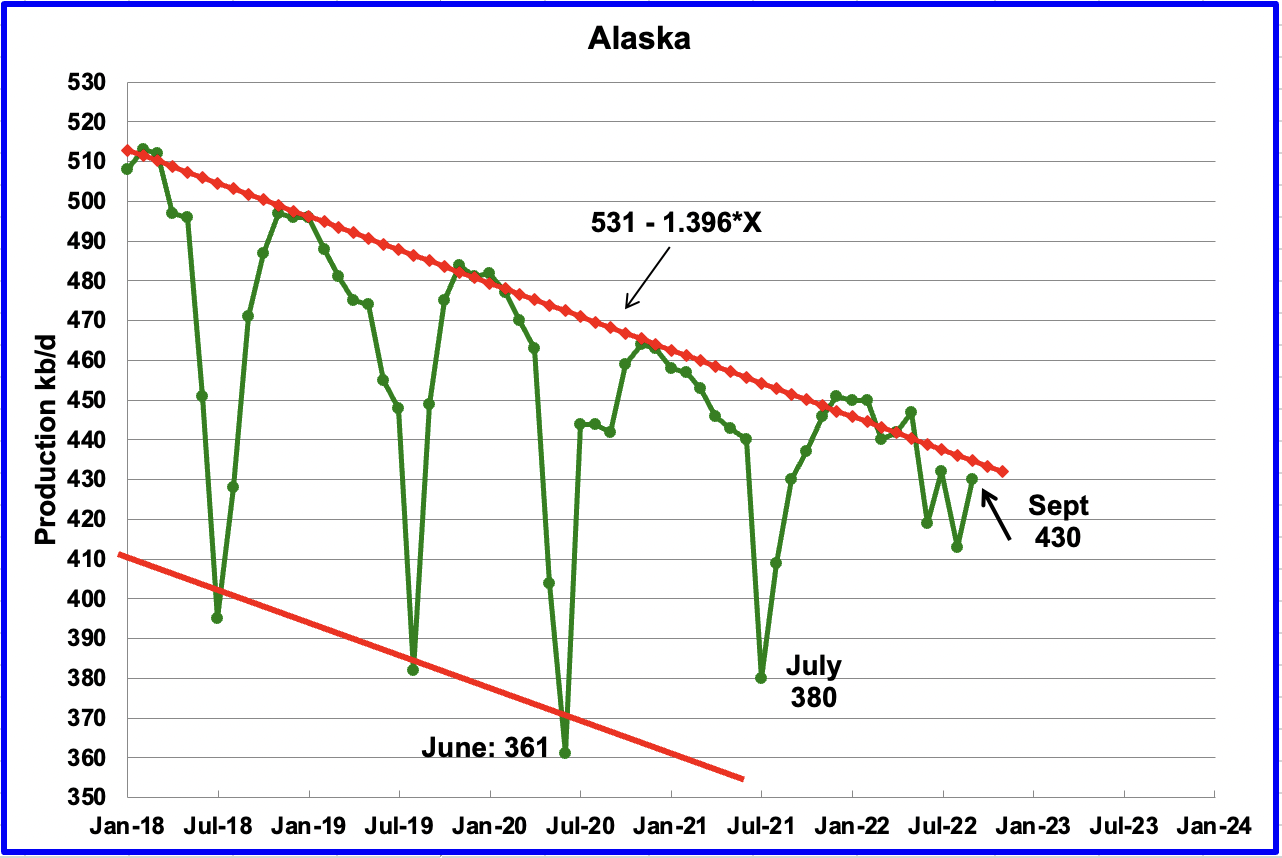
Alaskaʼs September output increased by 17 kb/d to 430 kb/d, the same output as last September.
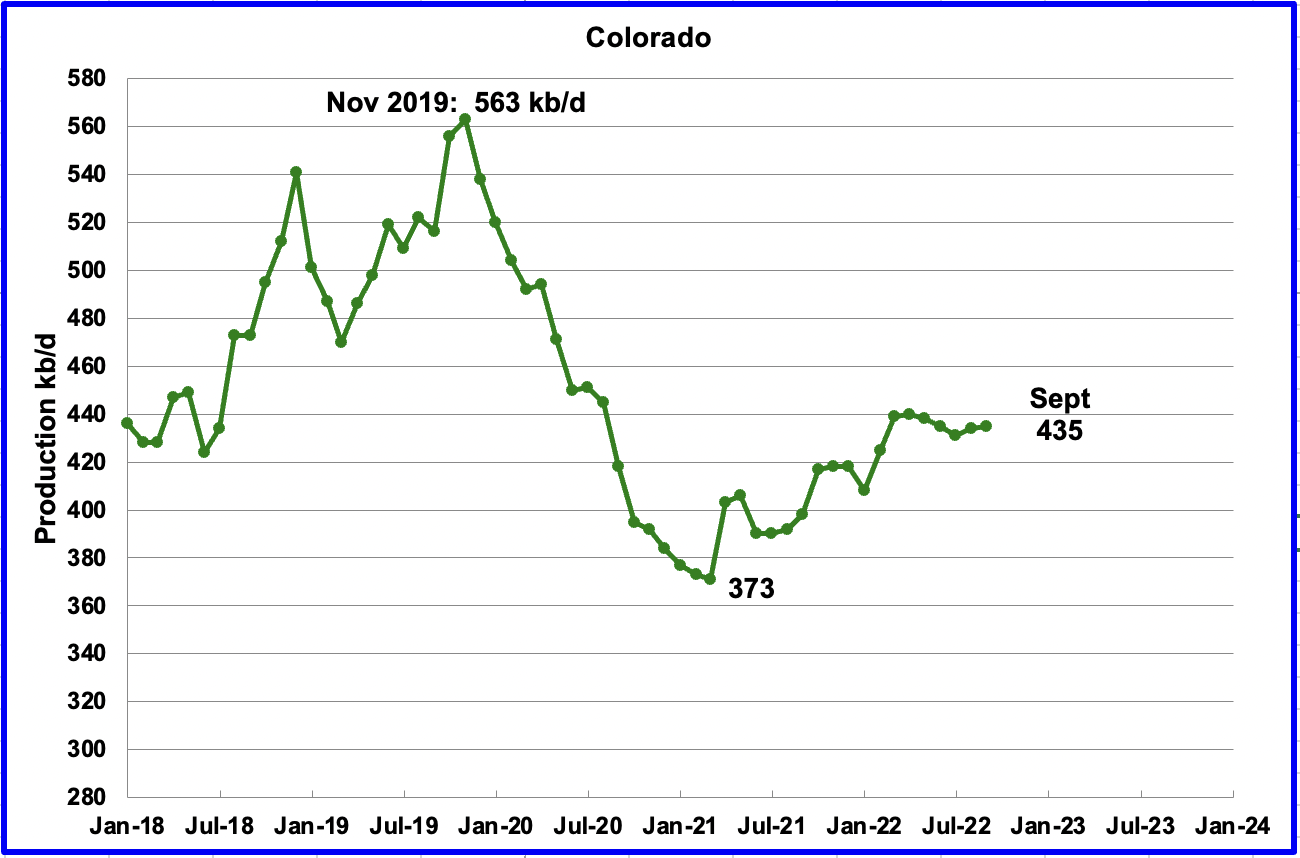
Coloradoʼs September production increased by 1 kb/d to 435 kb/d. A recent Colorado report forecasts little oil growth is likely in Colorado for 2022.
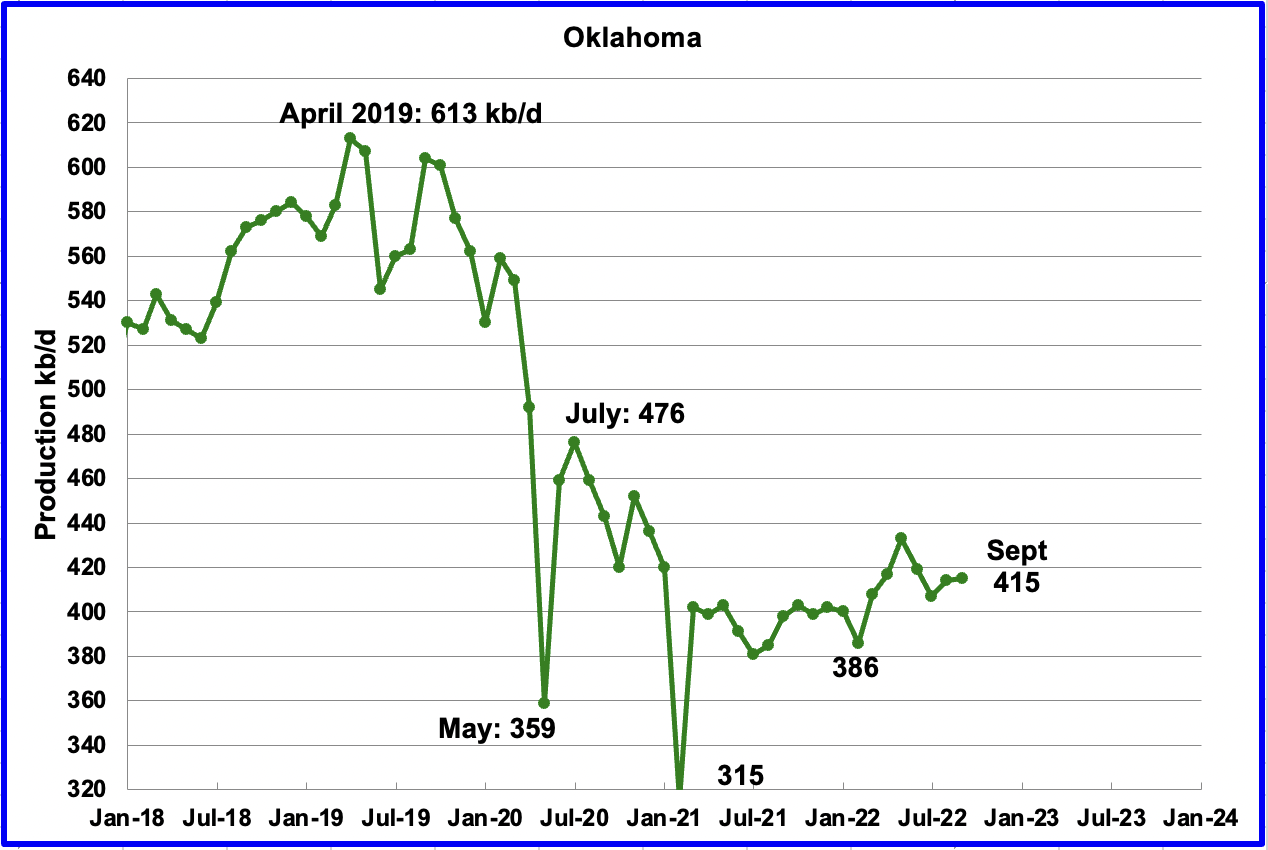
Oklahoma’s output in September increased by 1 kb/d to 415 kb/d. From January to April, close to fifty rigs were operating in Oklahoma. By late September the rig count had increased to 61. Production remains 61 kb/d below the post pandemic high of 476 kb/d.
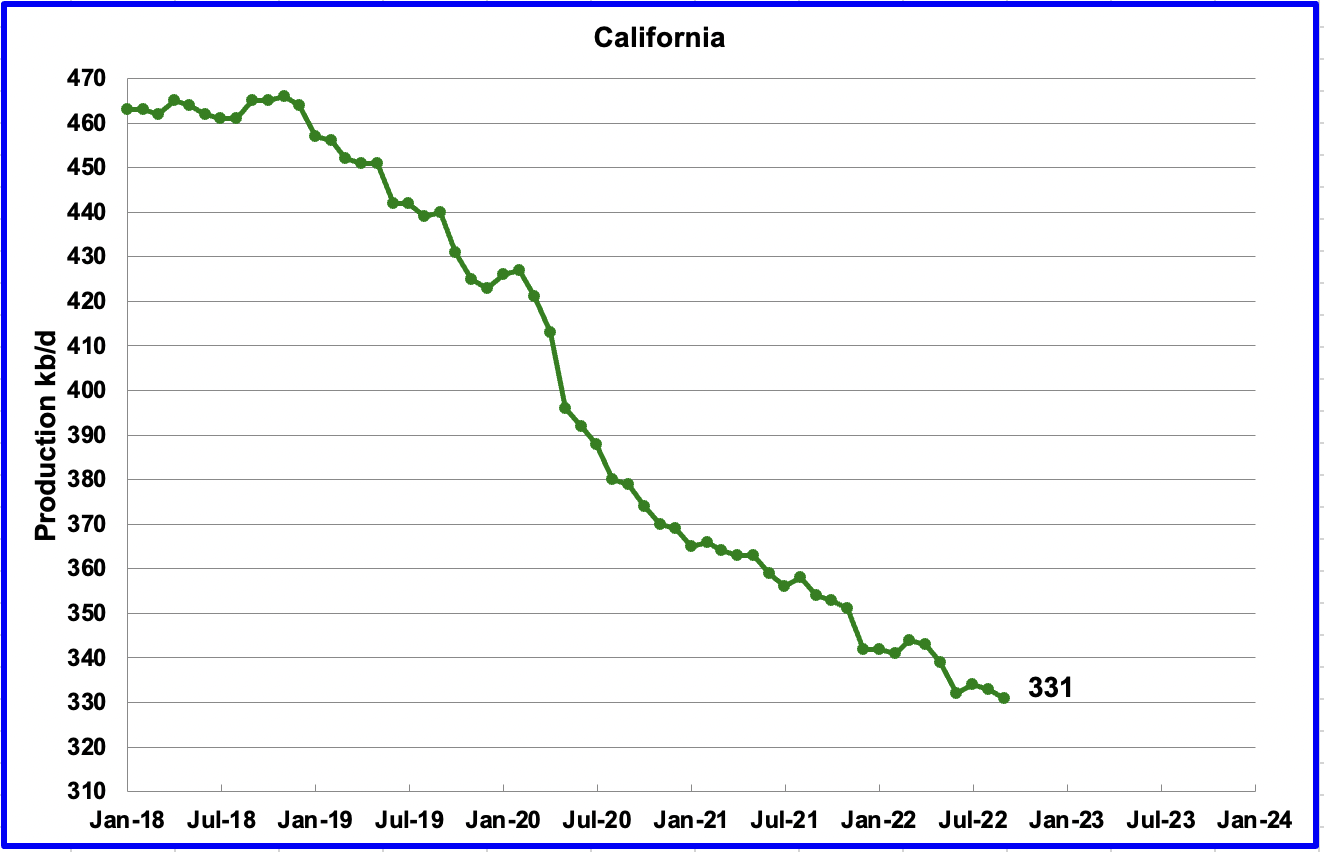
Californiaʼs slow output decline continued in September. Output decreased by 2 kb/d to 331 kb/d.
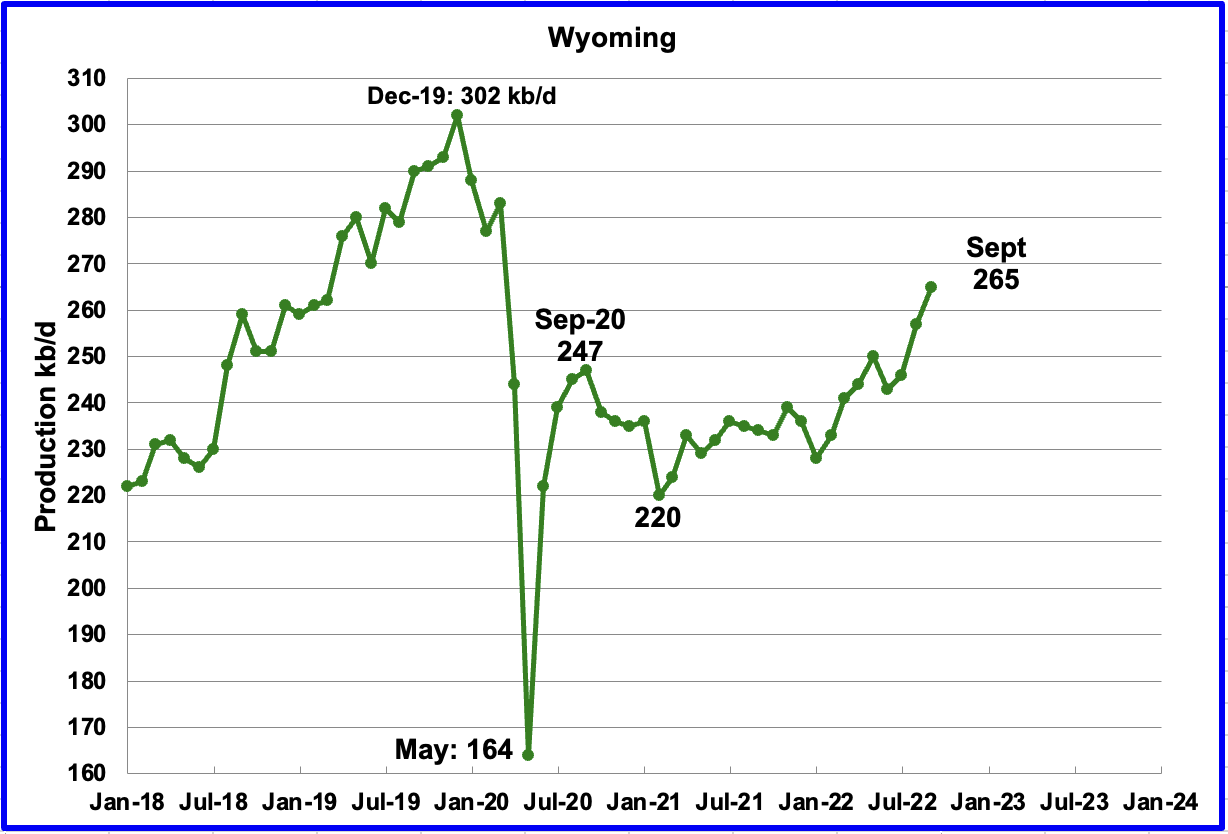
Wyoming’s oil production has been on a slow unsteady uptrend from the low of 220 kb/d in February 2021 due to increased drilling. September’s output reached a new post pandemic high of 265 kb/d, an increase of 8 kb/d.
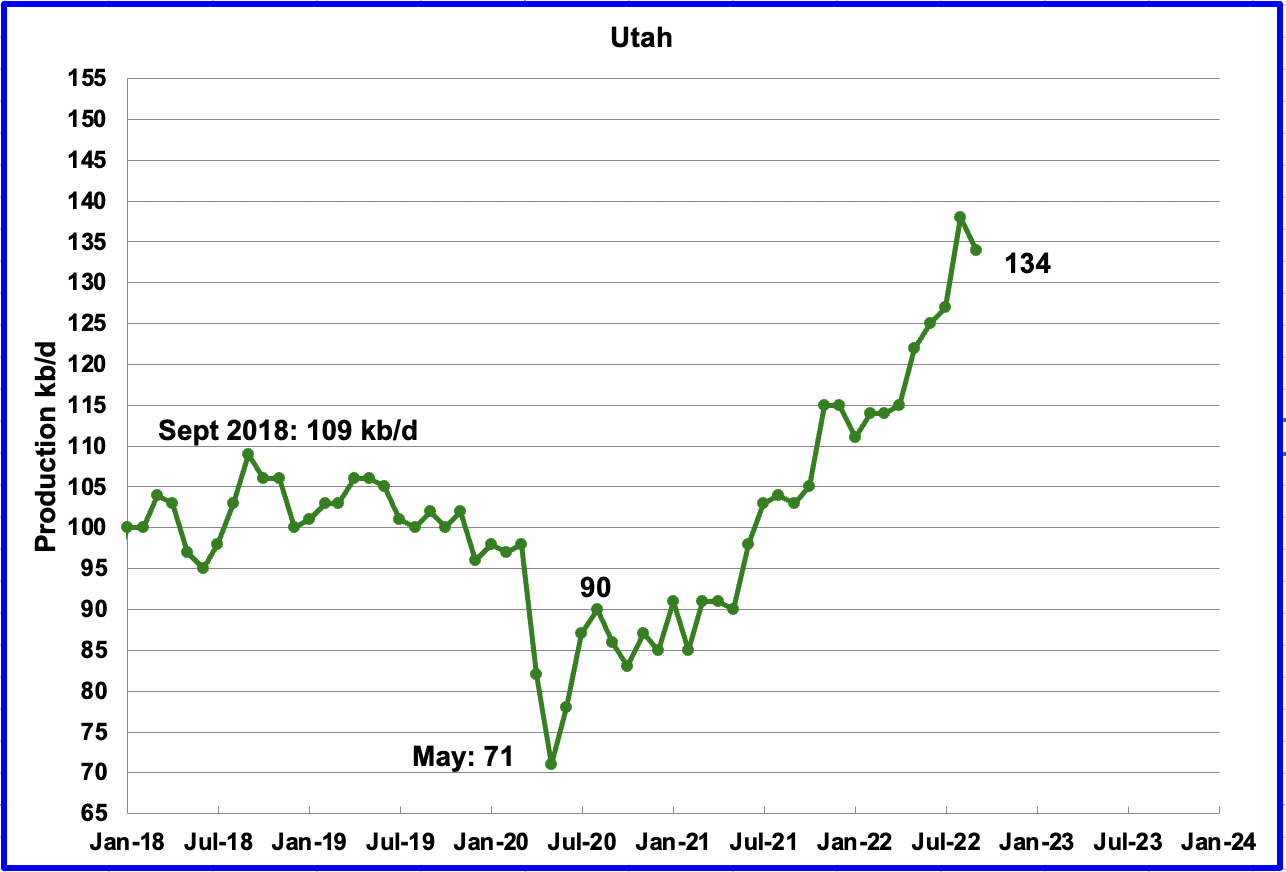
Utah’s oil production had been increasing steadily since January 2022. Production hit a new high in August of 138 kb/d after adding 11 kb/d to July’s output. September saw the first drop in many months. September production dropped by 4 kb/d to 134 kb/d/. Utah had 7 rigs operating in September.
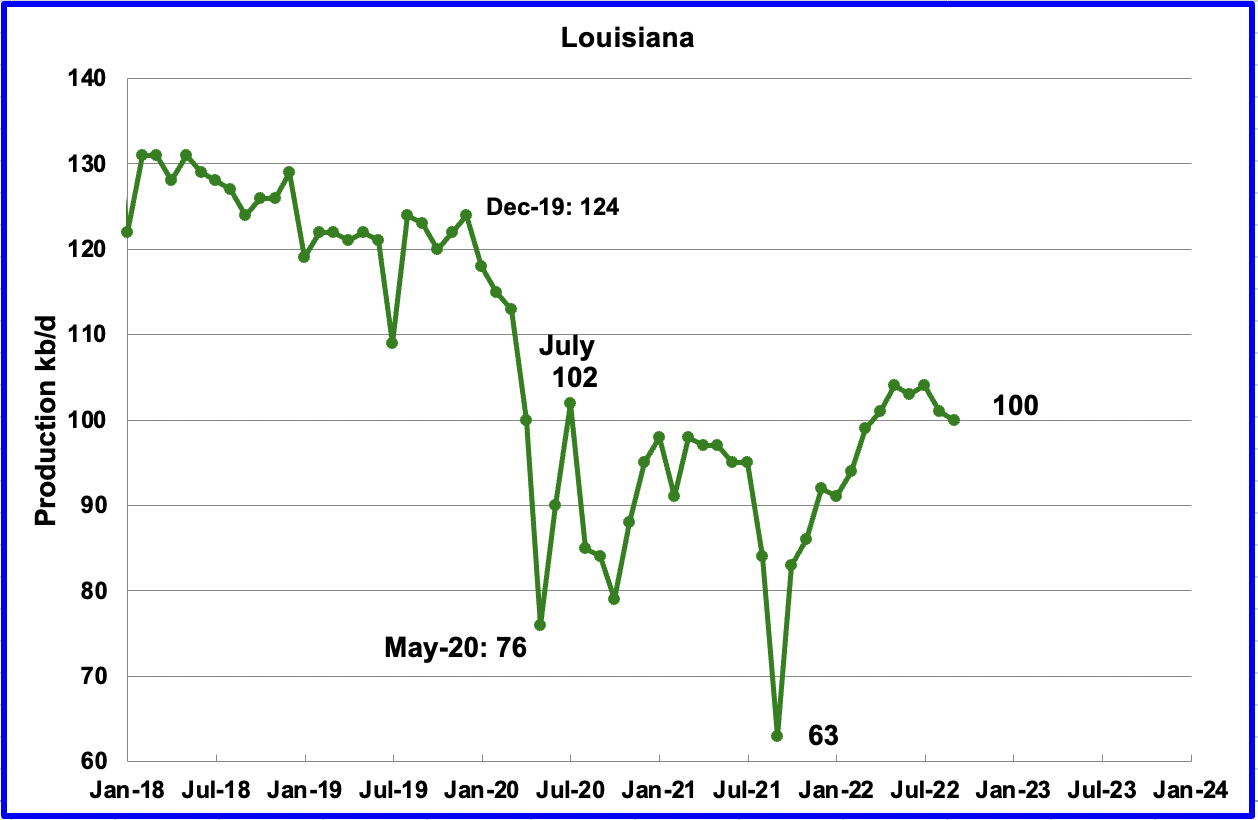
Louisiana’s output appears to be plateauing around the 100 kb/d level. September’s output dropped by 1 kb/d to 100 kb/d.
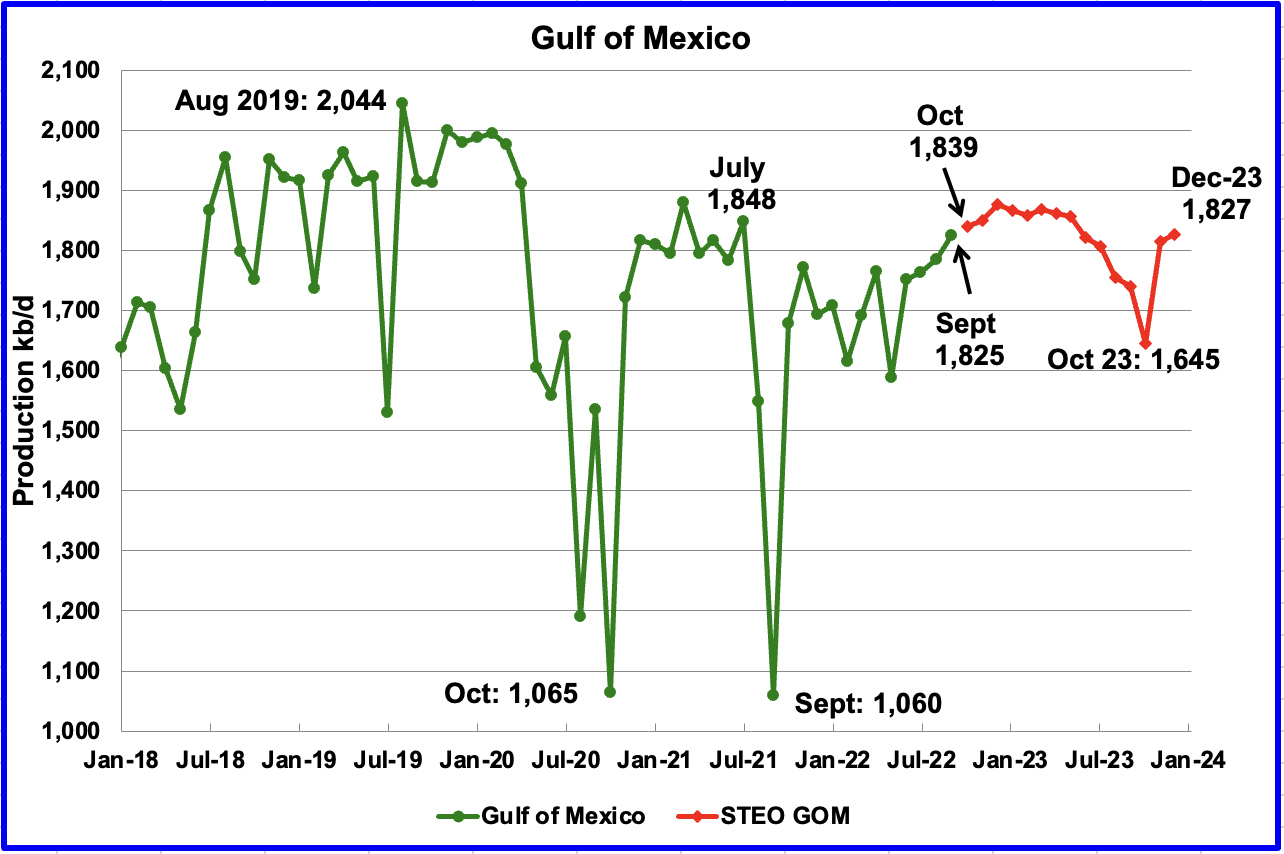
GOM production increased by 64 kb/d in September to 1,825 kb/d. If the GOM was a state, its production would normally rank second behind Texas.
The November 2022 STEO projection for the GOM output has been added to this chart and projects output will be 1,827 kb/d in December 2023, 16 kb/d lower than in the October report.
In the October report, the STEO was projecting October production would to drop to 1,650 kb/d, possibly associated with Hurricane Ian which hit the GOM in late September. The current November STEO has revised up its October output forecast to 1,839 kb/d.
According to this source, two new oil drilling platforms in the GOM are scheduled to come online in late 2022. “BP Plc’s Argos and Shell Plc’s Vito — floating production platforms that are taller than 20-story buildings and have decks the size of football fields — will start pumping crude off the Louisiana shore later this year.
Vito has been delayed till early 2023 according to this source.
A Different Perspective on US Oil Production
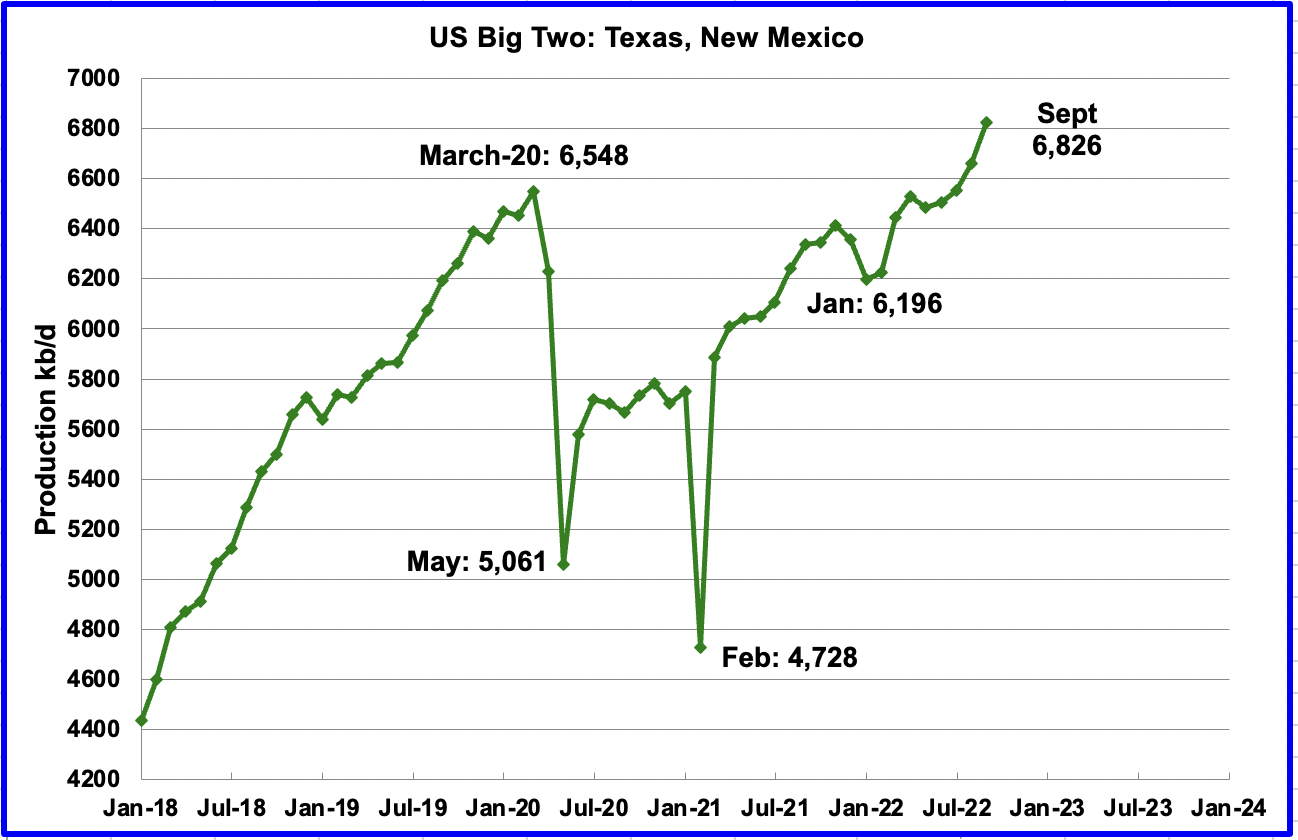
The Big Two states, combined oil output for Texas and New Mexico.
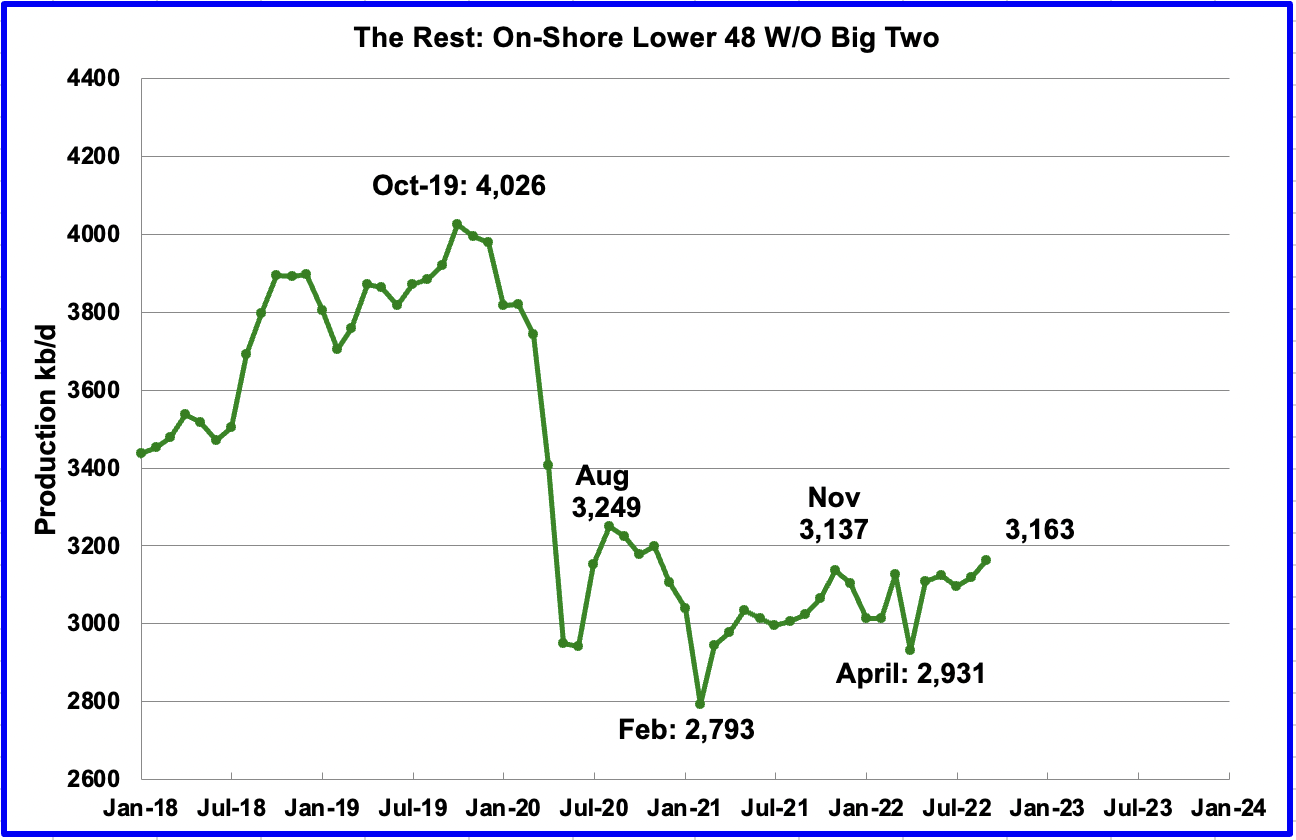
Oil production by The Rest
September’s production in the Big Two states increased by a combined 165 kb/d to a new high of 6,826 kb/d with Texas adding by 75 kb/d and New Mexico 90 kb/d. In September The Rest increased output by 43 kb/d to 3,163 kb/d, most of which came from North Dakota.
The main thing to notice in the Rest Chart is that current production is 900 kb/d below the high of October 2019. The question we need answered Is “Is this a permeant loss that will never be recovered?
Rigs and Fracs
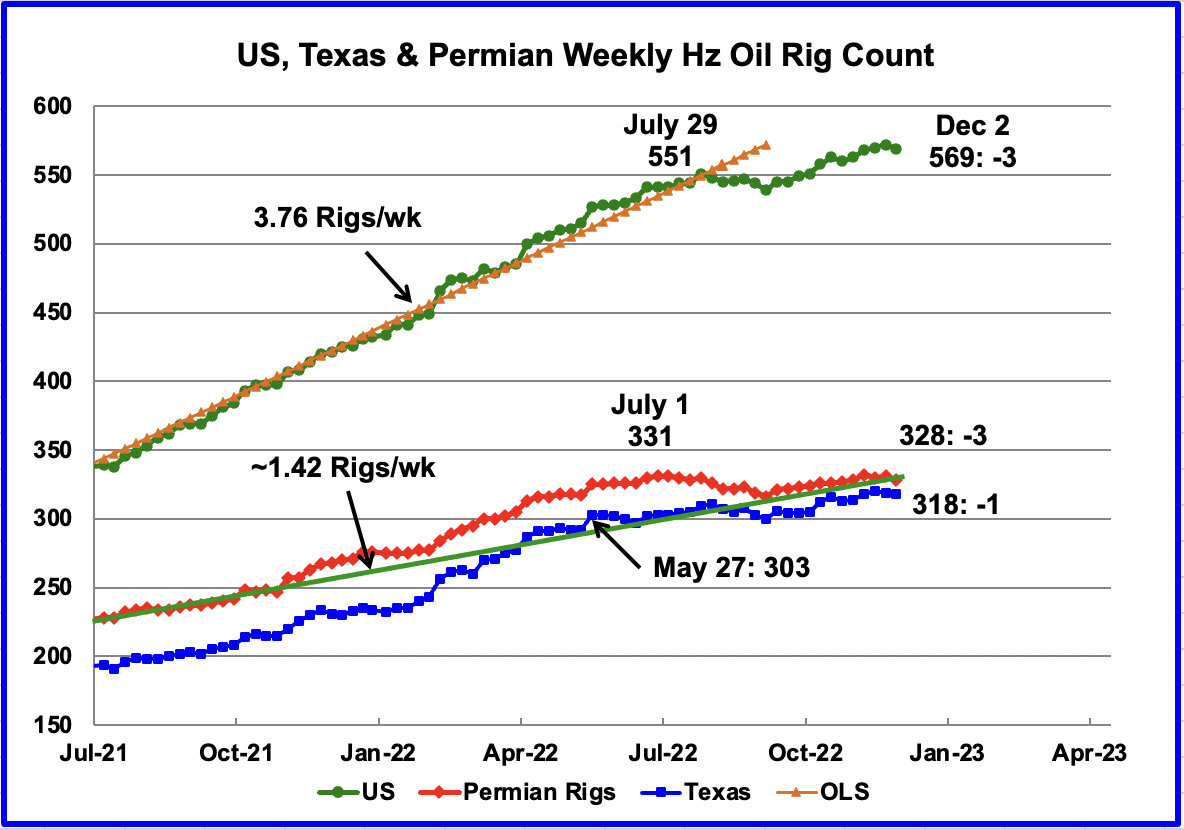
Since the beginning of April 2021 through to the week ending July 29, 2022, the US has been adding horizontal oil rigs at a rate of close to 3.82 rigs/wk, orange OLS line, and peaked at 551 rigs in the week ending July 29. However since then the number of operational rigs has wondered sideways. In the week ending December 2, the number of rigs decreased by 3 to 568.
In the Permian and Texas, the general trend for the number of operational rigs since July has been flat. In the week ending December 2, the Permian was down 3 rigs and Texas was down 1.
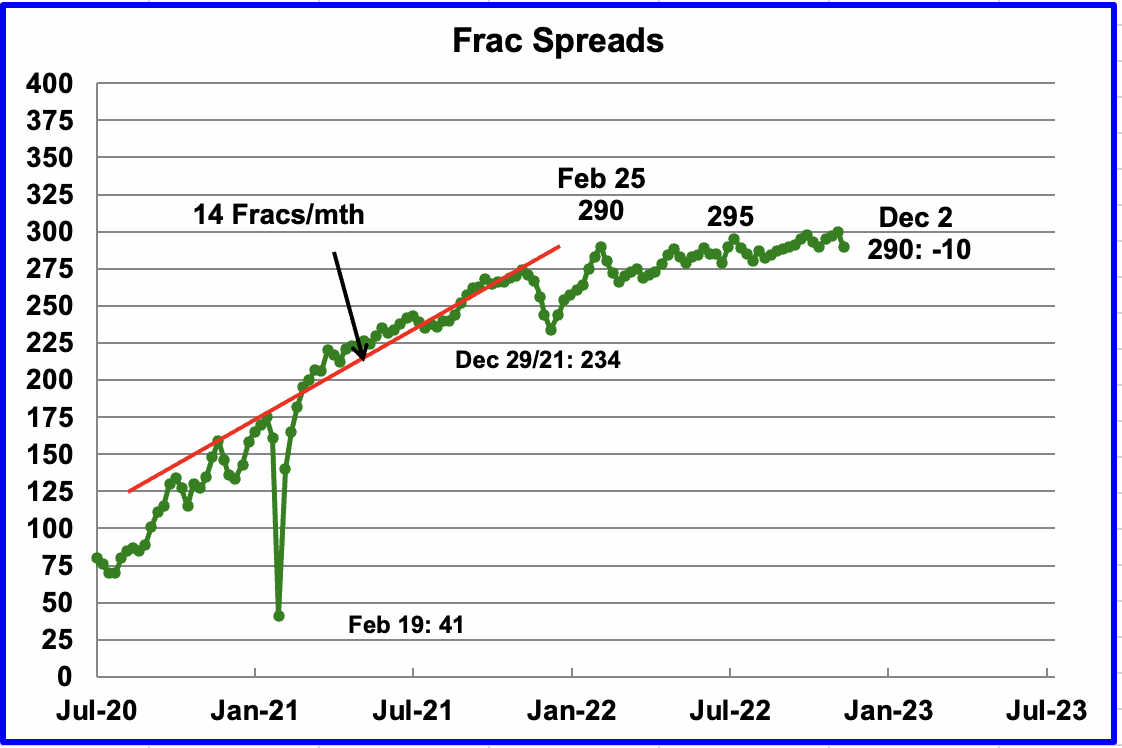
For frac spreads, the general trend since late February can best be described as essentially flat around the 290 level but with a hint of a slow increase toward 300 frac spreads. However for the week ending December 2, the count dropped by 10. This is the beginning of a drop down into the 270 area as this is the slowdown associated with Thanksgiving and Christmas. A similar trend occurred last year.
Note that these 290 frac spreads include both gas and oil spreads.
Drilling Productivity Report
The Drilling Productivity Report (DPR) uses recent data on the total number of drilling rigs in operation along with estimates of drilling productivity and estimated changes in production from existing oil wells to provide estimated changes in oil production for the principal tight oil regions. The November DPR forecasts production to December 2022 and the following charts are updated to December 2022.
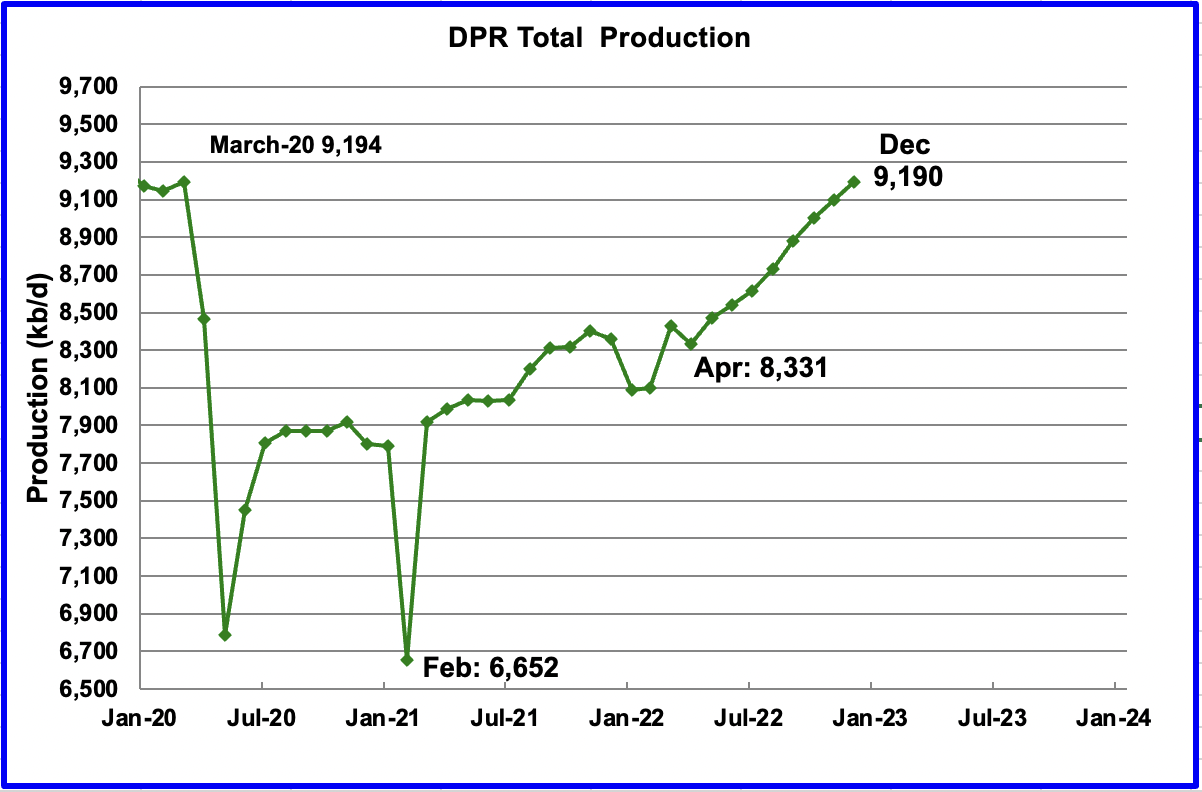
Above is the total oil production projected to December 2022 for the 7 DPR basins that the EIA tracks. Note that DPR production includes both LTO oil and oil from conventional wells.
The November DPR report made made minimal revisions to the the October report. The DPR is projecting that oil output for December 2022 will increase by 90 kb/d to 9,190 kb/d. From April’s output of 8,331 kb/d to December’s 2022, output in the DPR basins is forecast to increase by 859 kb/d or by an average rate of 107.4 kb/d/mth.
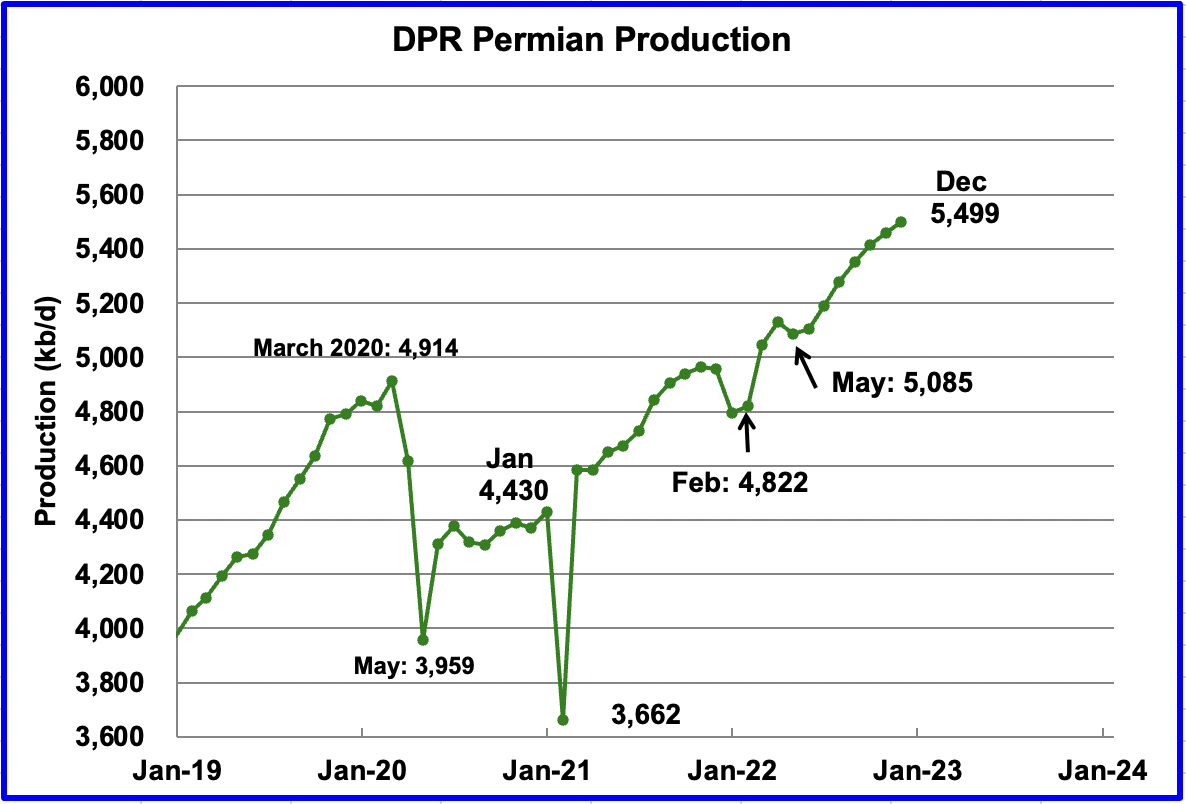
Permian output continues to increase in December. Production is expected to increase by 39 kb/d to a new high of 5,499 kb/d. From May to November, production is forecast to increase by 414 kb/d or at an average rate of 59.1 kb/d/mth.
If the Permian were part of OPEC, at 5,499 kb/d it would be the second largest producer after Saudi Arabia.
Looking at the output from May to December, there is a hint that the monthly increase in production in the Permian may be slowing. In August, output increased by 87 kb/d. The December increase is less than half of that at 39 kb/d. More charts below hint at production growth slowing in the Permian.
During October, 421 wells were drilled and 434 were completed in the Permian. (Note that October is the latest month for DUC information). The completed wells added 373 kb/d to October’s output for an average of 860 b/d/well. The overall decline was 311 kb/d which resulted in a net increase for Permian output of 62 kb/d. Of the 434 completed wells, 362 were required to offset the decline. The completion of 13 extra DUCs over the drilled wells contributed 11.2 kb/d of the overall 62 kb/d increase.
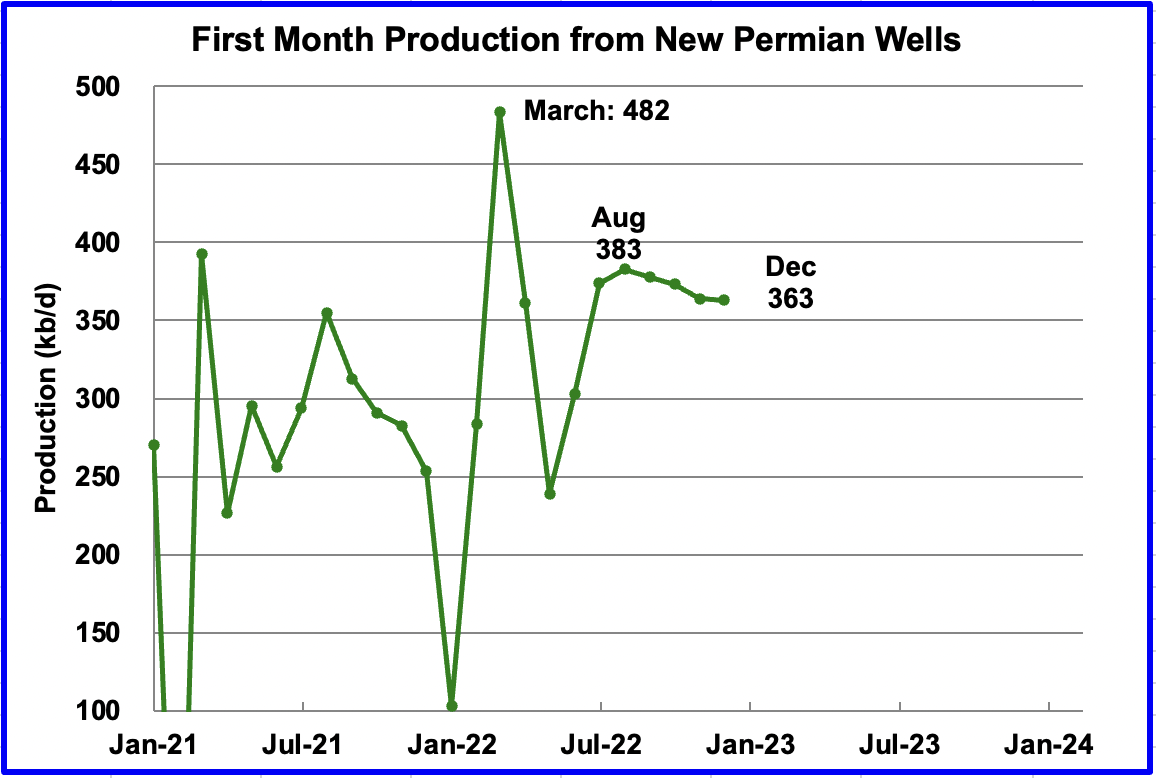
This chart shows the average first month total production from Permian wells tracked on a monthly basis. Since July 2022, the volatility shown in prior months has stopped. The reduced volatility, may be related to the first upgraded LTO report released in September. Assuming the latest information is correct, total monthly production from the newest Permian wells may have peaked at 383 kb/d in August. Part of the decline shown is related to fewer wells being completed.
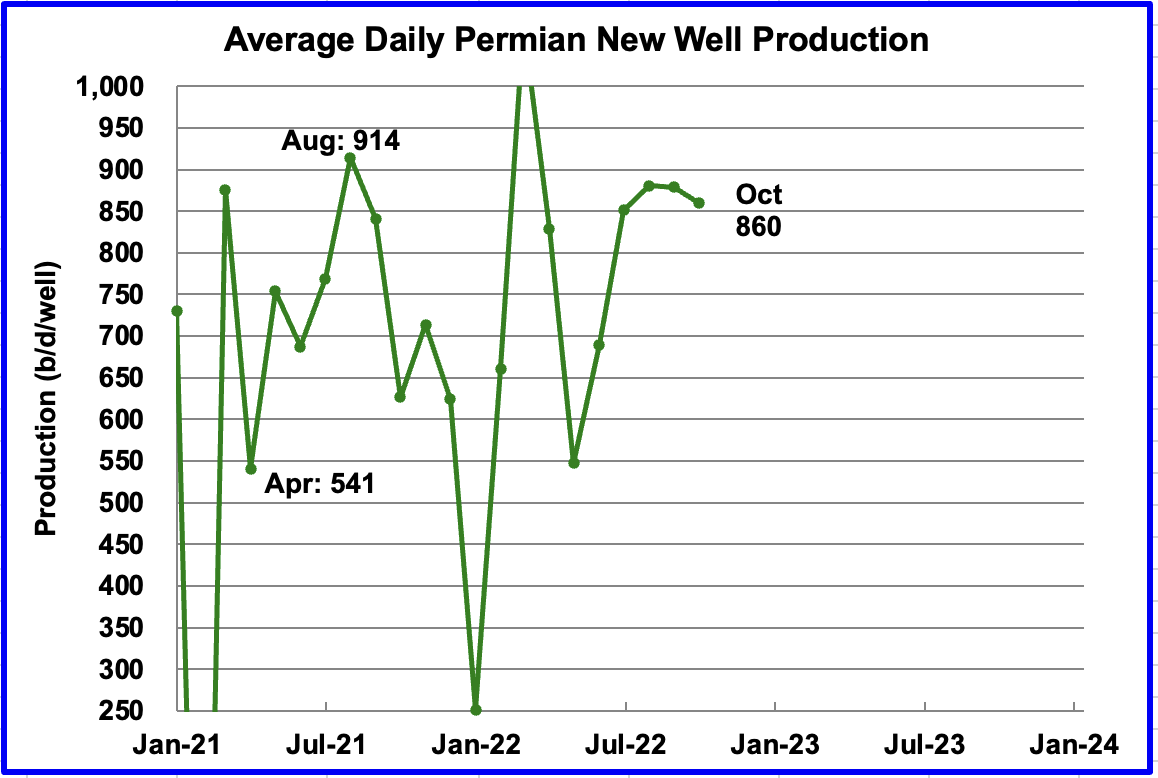
Average daily production for first month Permian wells also shows reduced volatility and indicates average production is 860 b/d in October and could be stabilizing in the 850 kb/d range. Note that October is the latest month for reported completion data.
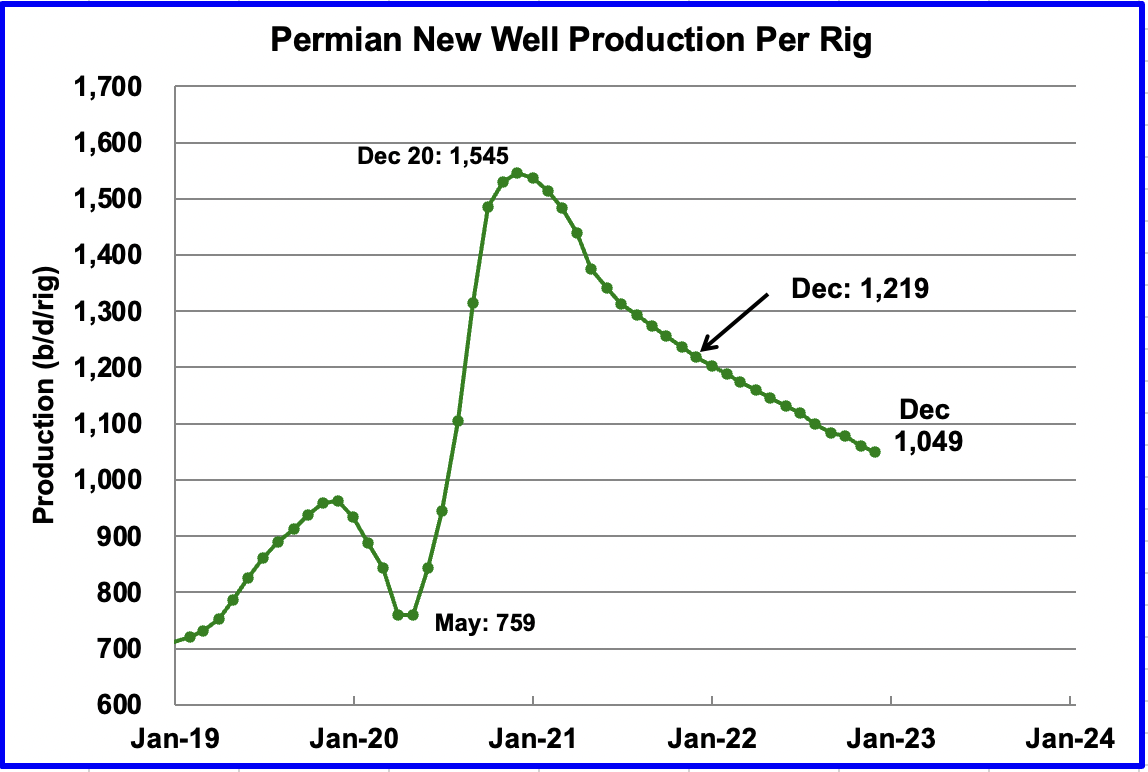
This chart shows that the productivity of Permian rigs has been decreasing since December 2020. In December 2020, at peak productivity, there were 170 rigs in operation. (See next chart) By October 2022, the rig count has doubled to 346 and the productivity had dropped by 30%.
Is this another indication that rigs are moving from Tier 1 areas to lower productivity Tier 2 areas? Since the average new well production shown in the previous chart has stayed close to 860 kb/d, this may also indicate a good blend of Tier 1 and Tier 2 wells are being used. It will be interesting to see if the downward trend of the last 12 months continues. Over this period, rig productivity has dropped by 170 b/d or at an average of 14.2 b/d/mth.
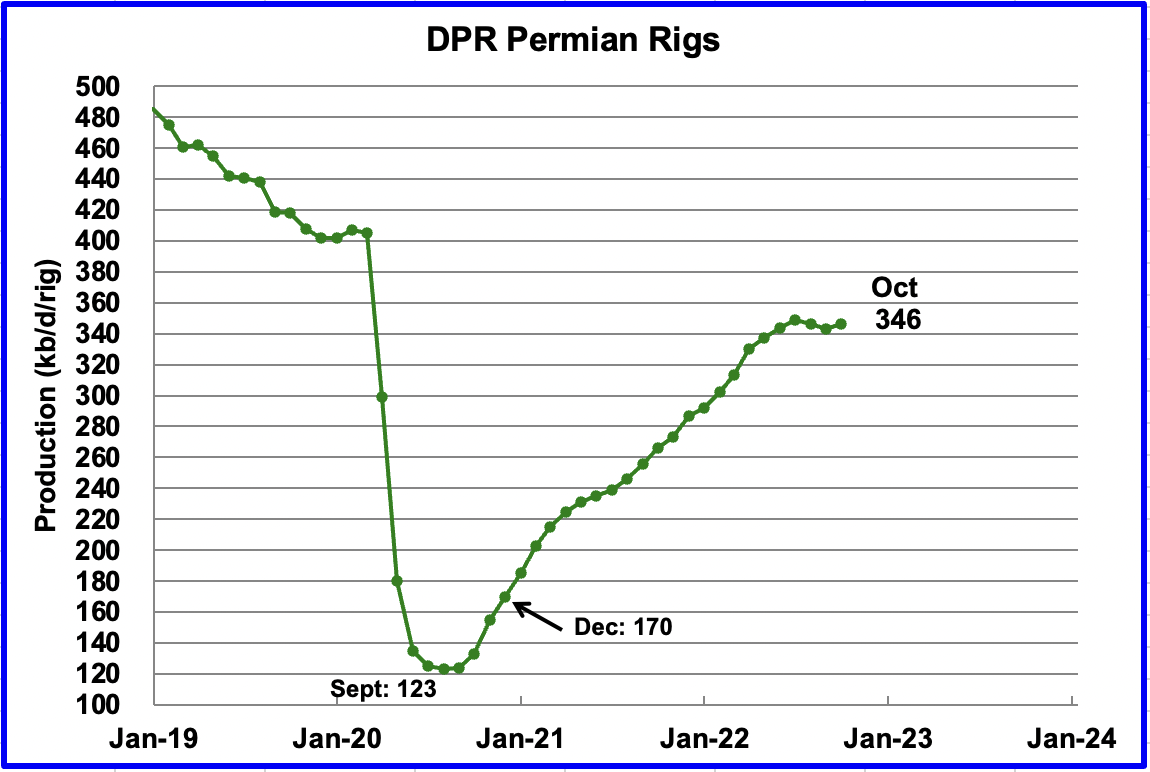
Permian rigs doubled from December 2020 to October 2022 while rig productivity dropped.
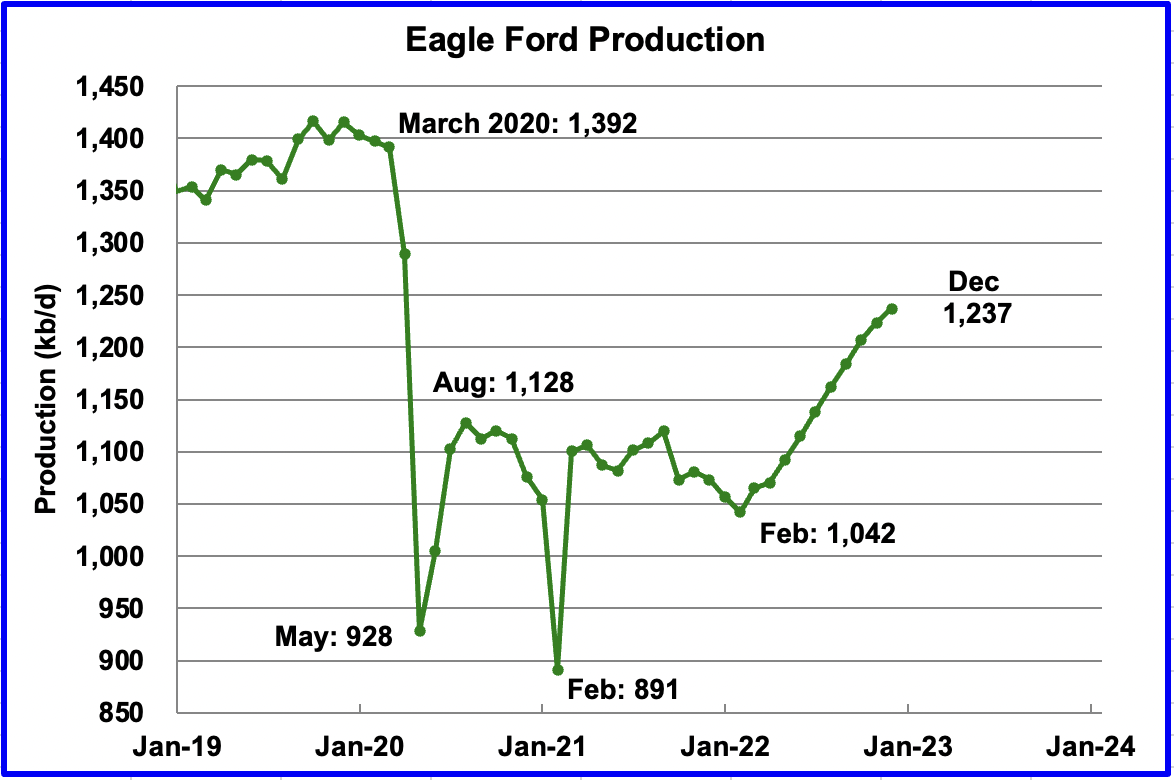
Output in the Eagle Ford basin has been showing an increasing trend since March 2022. For December, output is expected to increase by 14 kb/d to 1,237 kb/d. At the beginning of the year, 43 rigs were operating in the EF. As of November, 66 are operational and account for the increasing production.
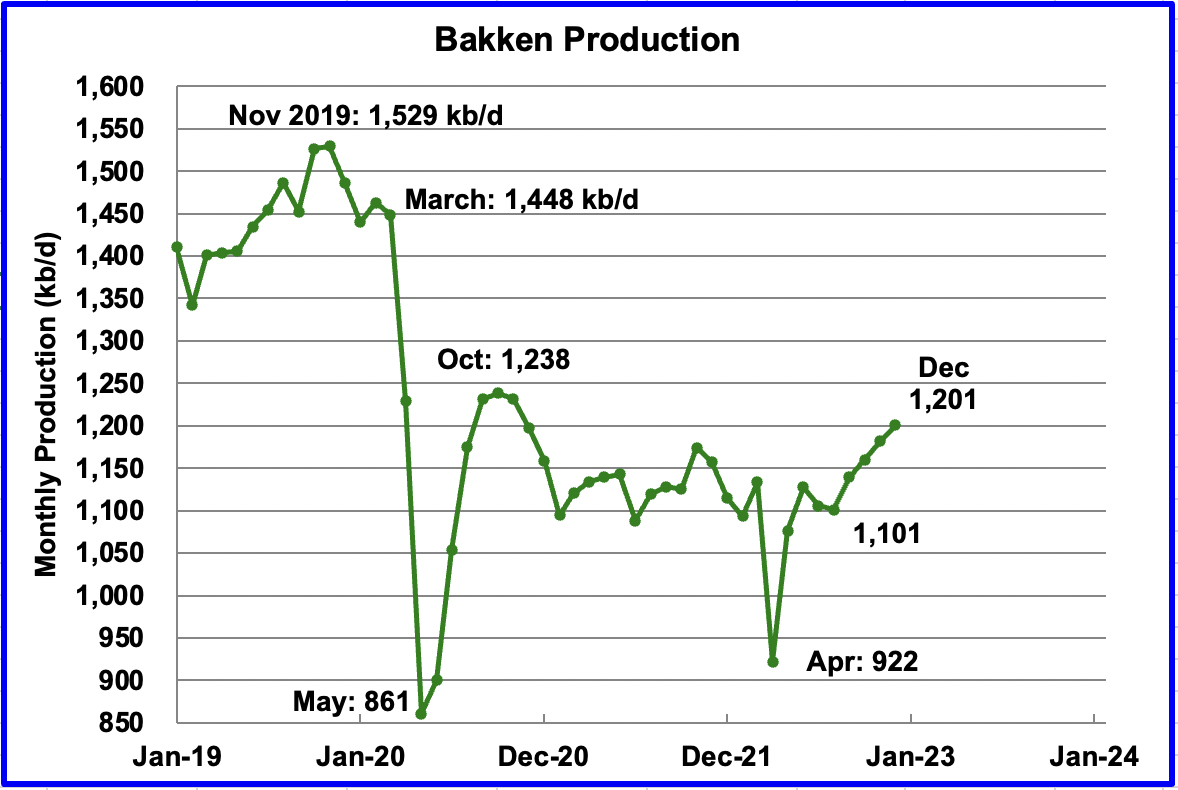
The DPR forecasts Bakken output in December to be 1,201 kb/d an increase of 19 kb/d over November.
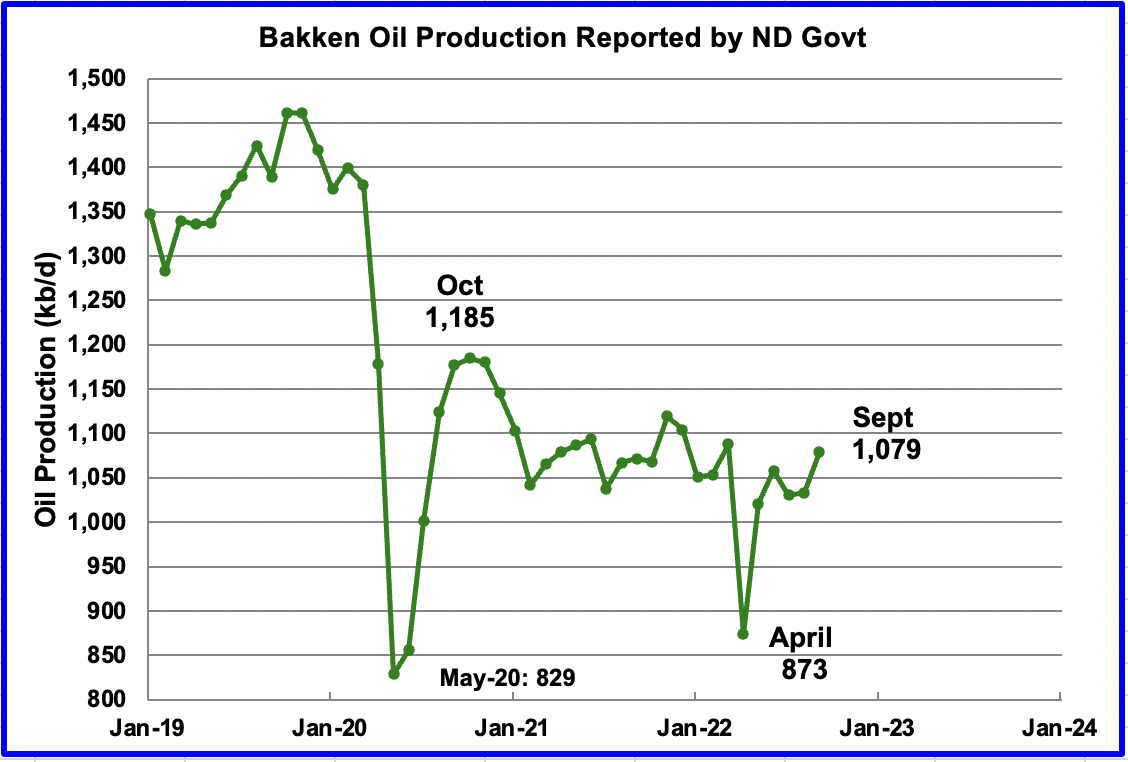
This chart shows the Bakken’s output as reported by the North Dakota Oil and Gas Division. September production increased by 46 kb/d to 1,079 kb/d. The DPR Bakken chart above shows September production to be 1,140 kb/d, 61 kb/d higher due to part of the the Permian basin located in Montana. The trends in the two charts up to September are essentially the same.
In the November DPR report, it was stated that production would increase in September. The projection for increased production was due to this source indicating a steady stream of completed wells would increase production in September. The source’s forecast was correct.
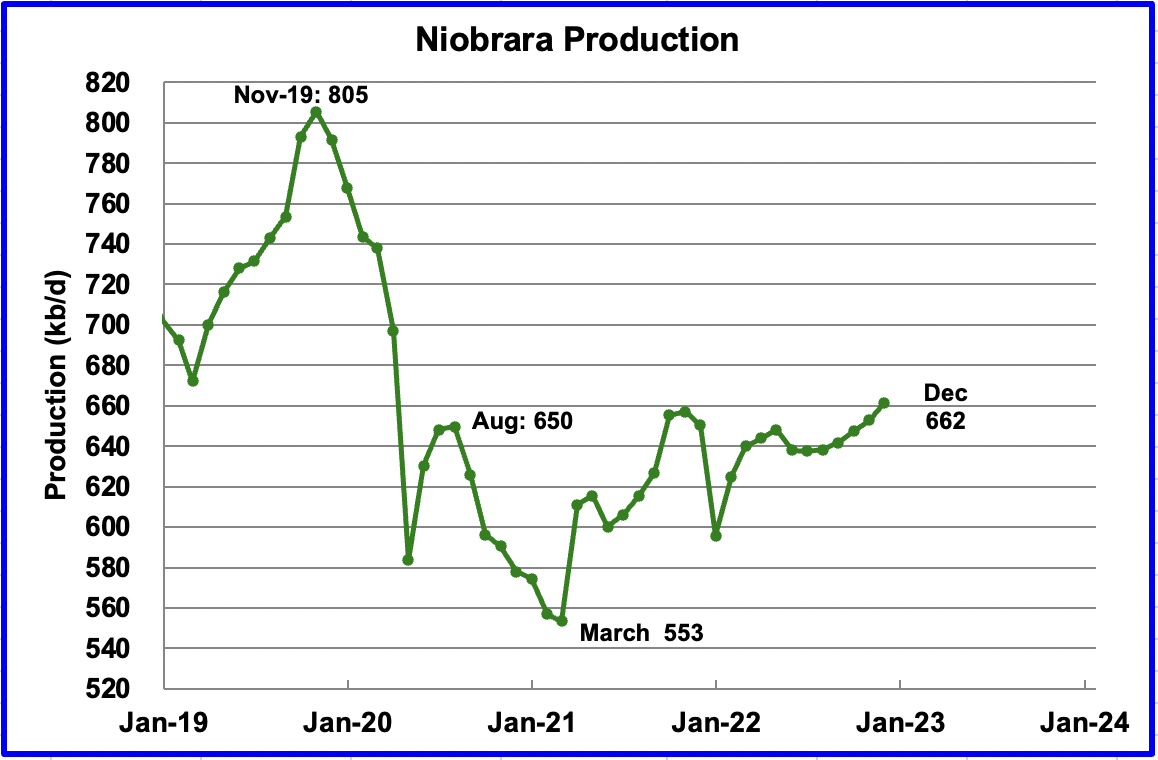
Output in the Niobrara continues to increase slowly. December output increased by 9 kb/d to 662 kb/d and set a post pandemic high. The Niobrara had 12 rigs operating in January. By November, the count had increase to 19. In January, 95 wells were completed. By October monthly completions increased to 112, which accounts for the increasing production.
DUCs and Drilled Wells
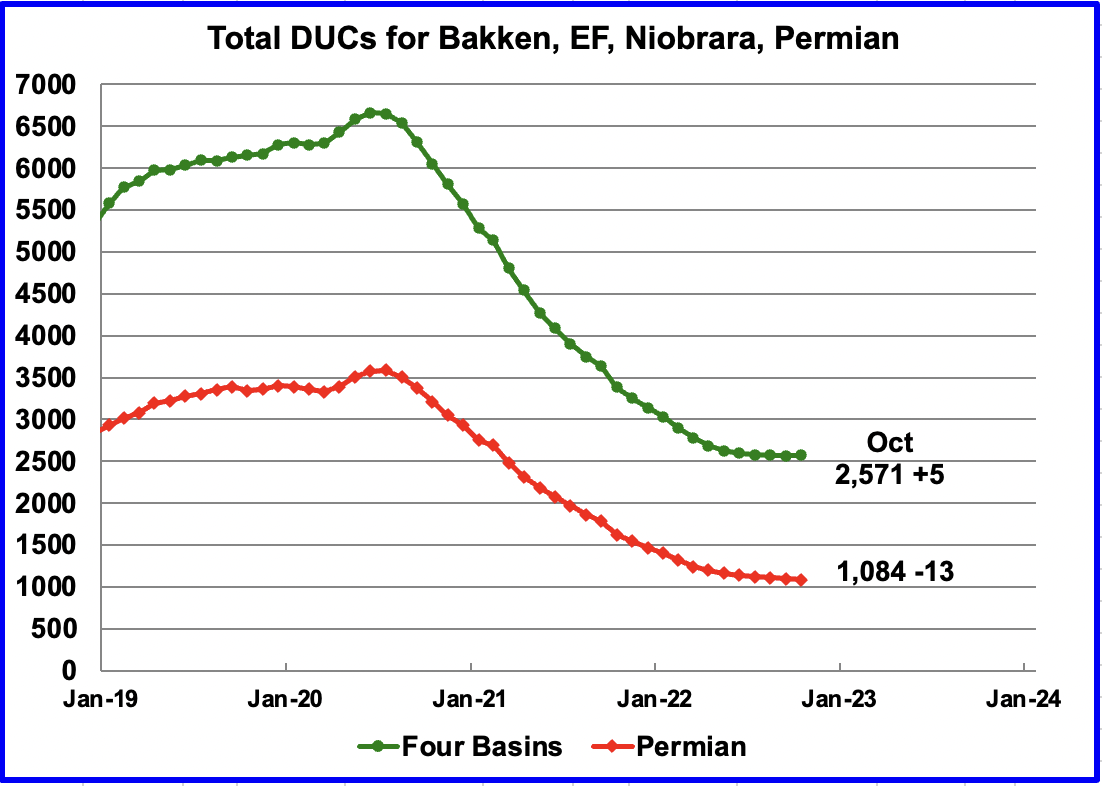
The number of DUCs available for completion in the Permian and the four major DPR oil basins has continued to fall every month since July 2020. Prior to July 2020 more wells were drilled than were completed. However in October the trend for total DUCs changed and increased by five.
In the Permian, the change in the monthly completion rate for DUCs has been essentially unchanged for the last three months at 13. In October, the number of remaining DUCs fell by 13 to 1,084. However in the Niobrara, 133 wells were drilled and 112 were completed for a net increase of 21 DUCs to 414.
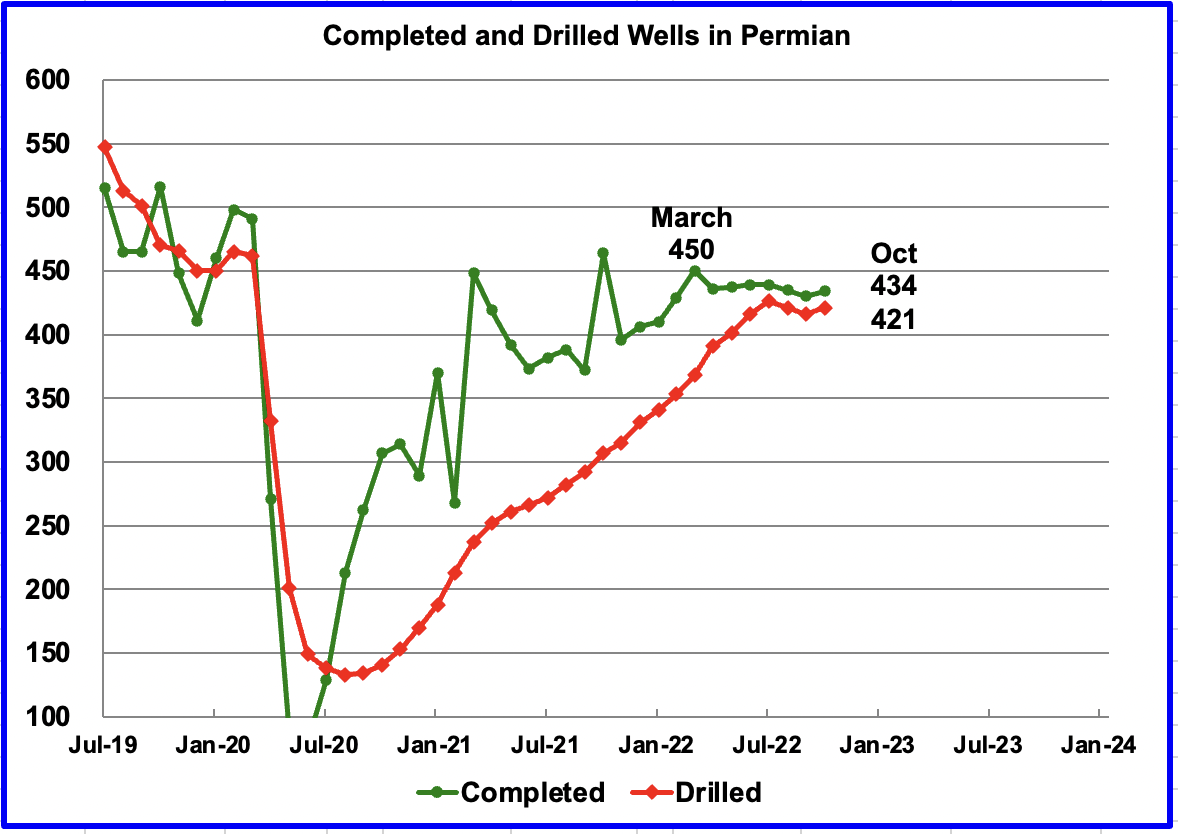
In the Permian, the monthly completion rate has been showing signs of slowing since the recent March peak of 450. This is consistent with the frac spread chart shown above where there has been little to no growth in frac spreads since February.
In October 434 wells were completed, 4 more than in September and 16 fewer than in March. During October, 421 new wells were drilled, an increase of 5 over September. The gap between drilled and completed wells in the Permian has remained essentially the same for the last three months at 13.
November Light Tight Oil Update
The EIA’s LTO database provides information on LTO production from seven tight oil basins and a few smaller ones. The November 2022 report updates tight oil production to October 2022.
This is the Third LTO report published after it was updated because of operational issues. While the first report revised production down, a bit much it appears, the second and third reports have revised production up.
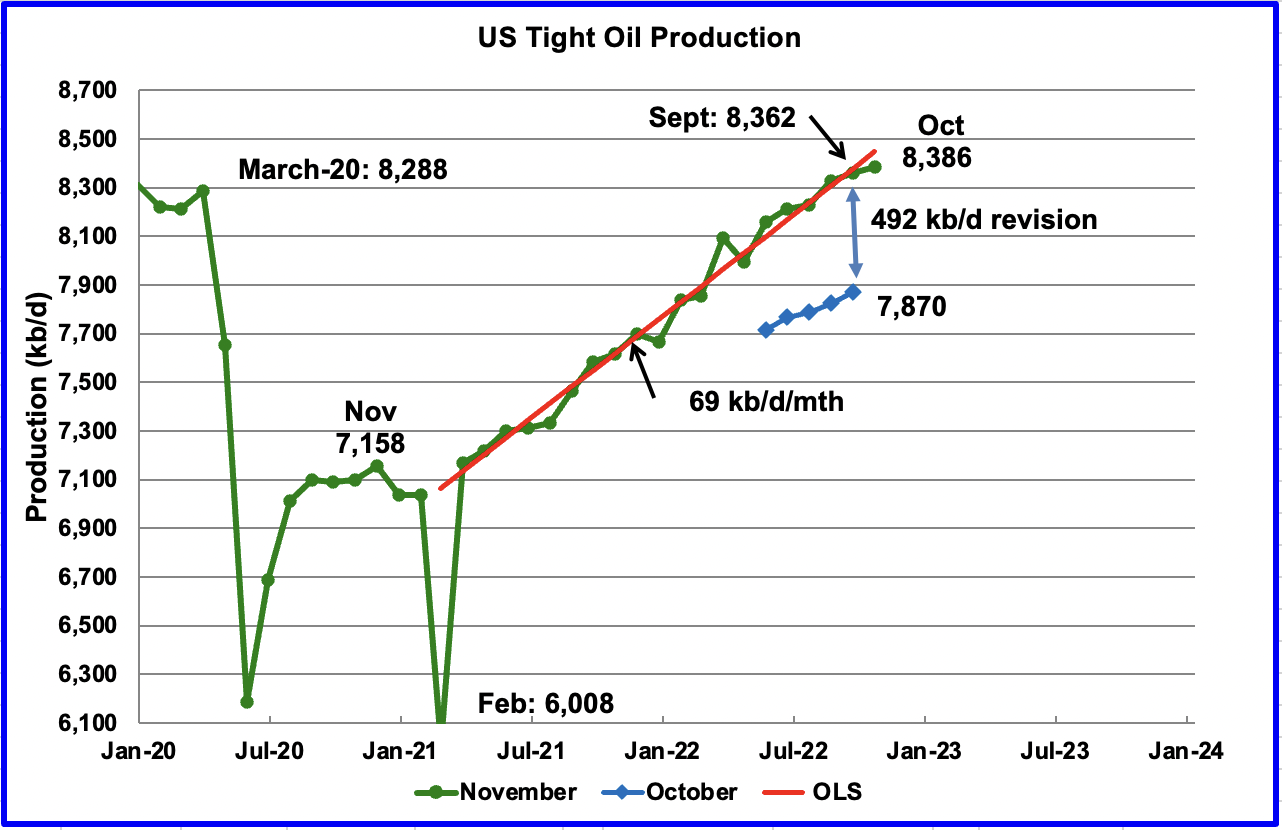
October’s LTO output increased by 24 kb/d to 8,386 kb/d.
This latest November report made a significant upward revision to its projected output. For instance September production in the October report has been increased from 7,870 kb/d to 8,362 kb/d, an increase of 492 kb/d. Due to the large revision, an inquiry has been sent to the EIA requesting a review of the published LTO data. At this time, the EIA has indicated they are reviewing the data.
The red OLS line from March 2021 to October 2023 indicates a monthly production increase of 69 kb/d/mth, double the rate reported in October.
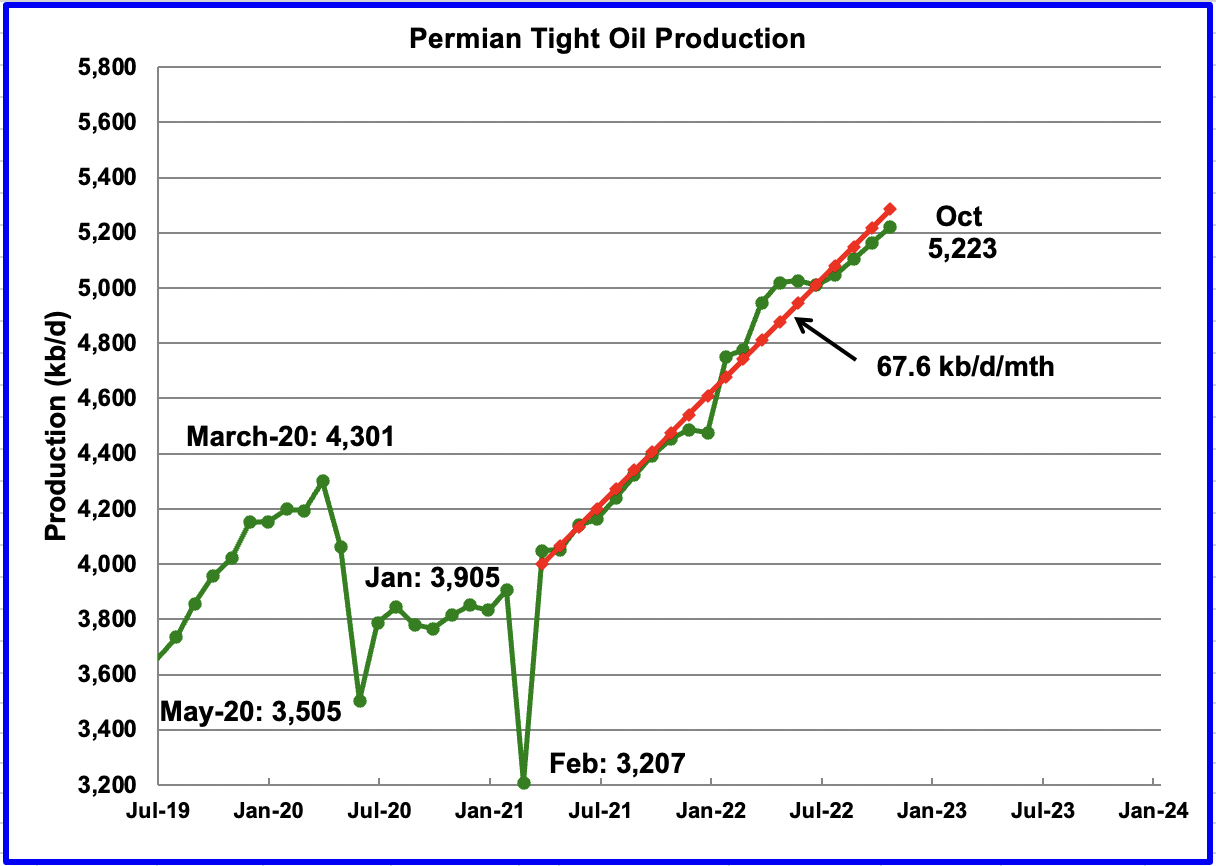
October’s output increased by 60 kb/d to 5,223 kb/d and is 922 kb/d higher than the high of 4,301 kb/d recorded in March 2020. Interestingly the Permian’s rate of production increase is essentially the same as the total for the LTO basin.
According to this source the Permian may have seen its best days. For Top U.S. Oil Producers, Permian Shale Output Is Losing Steam.
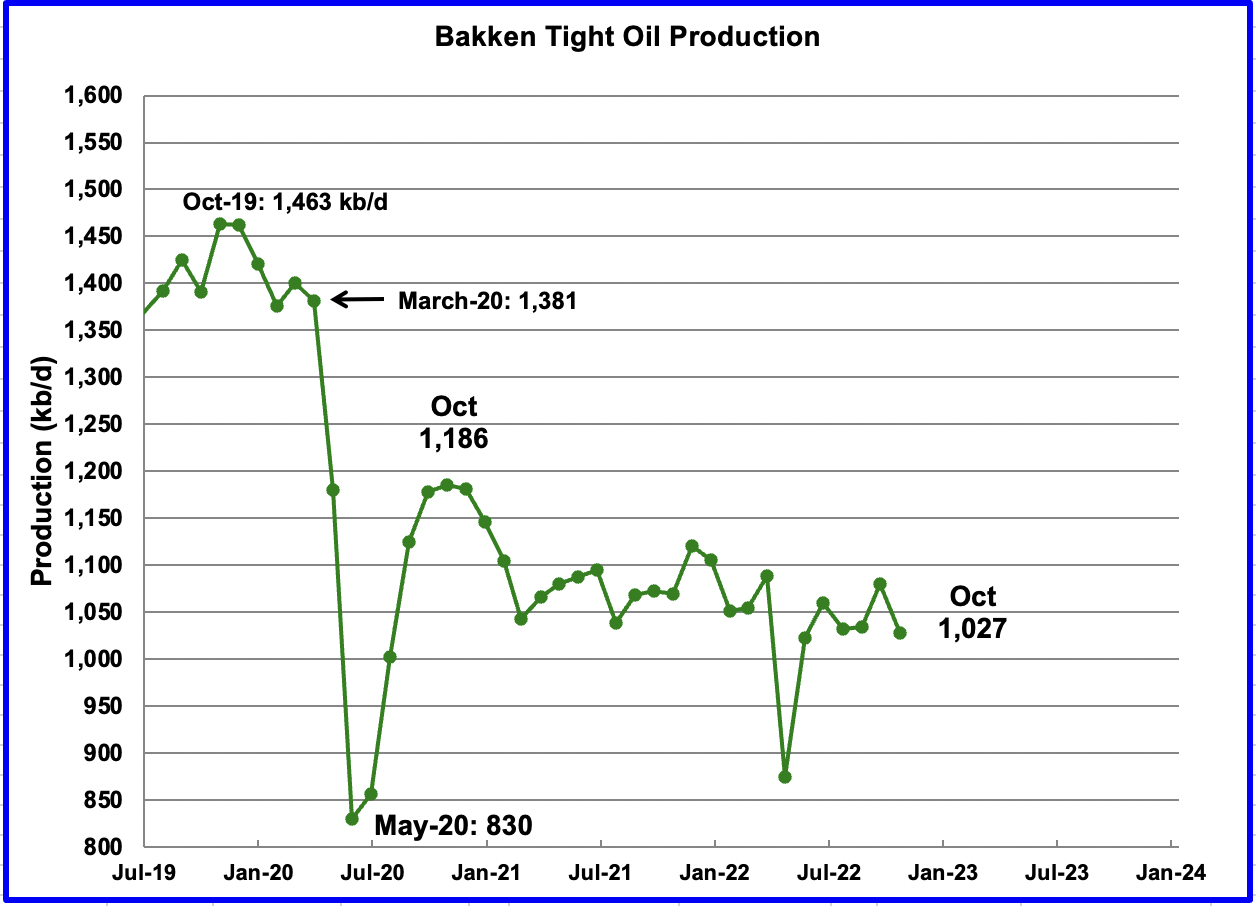
The Bakken’s October LTO output decreased by 53 kb/d to 1,027 kb/d. Note in the DPR Bakken report, October production increased by 20 kb/d and increased steadily from August to December.
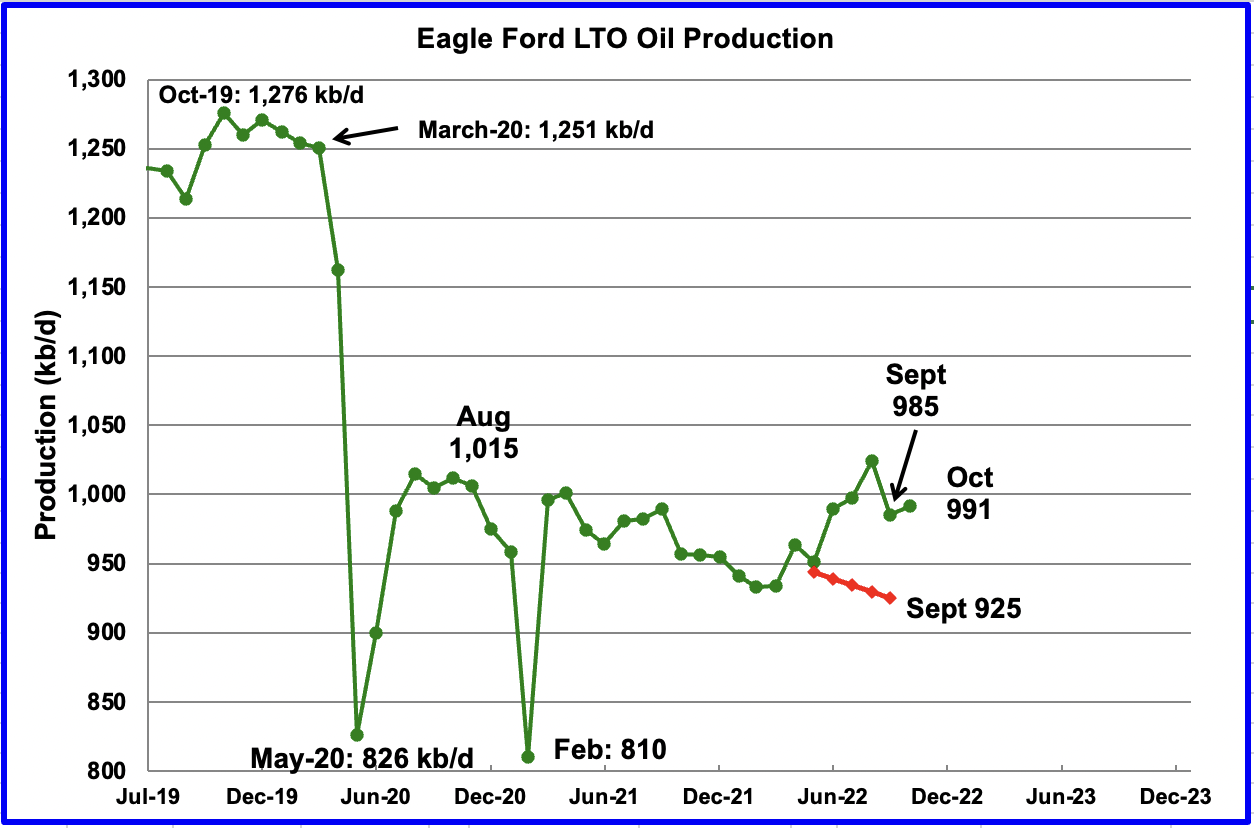
Production in the Eagle Ford basin increased by 6 kb/d in October to 991 kb/d.
As can be seen there has been a significant change in the EF production data in going from the October report to the November report. The November report has revised up all of the production data from June to September. September production has been revised up by 60 kb/d. More significantly, the updated data indicates that the EF basin is not in decline as the previous data indicated.
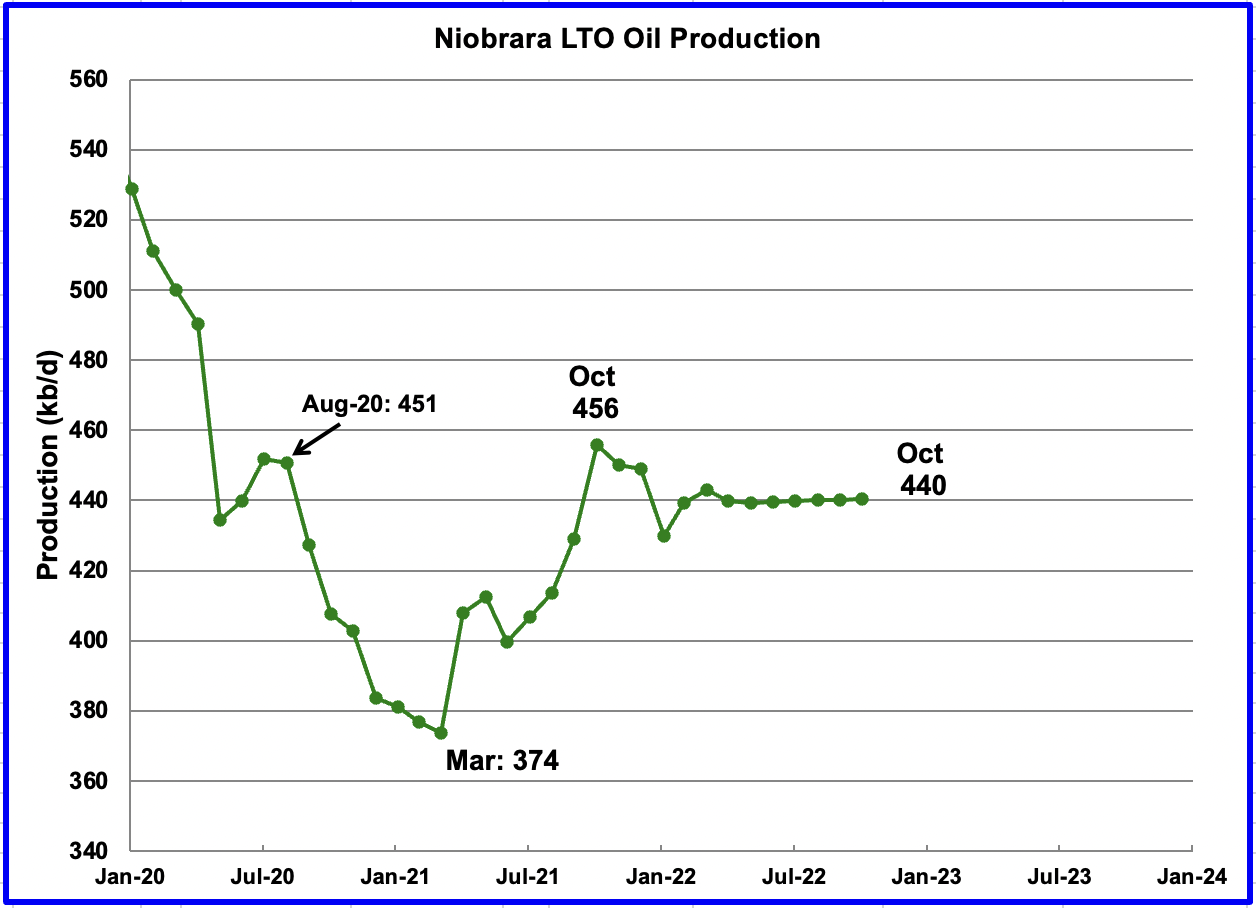
After increasing production from March 2021 to October 2021, output in the Niobrara began to drop in November 2021. Production since April has shown little growth. October’s output was unchanged at 440 kb/d and has been flat for the past seven months..
Onshore L48 Conventional Production
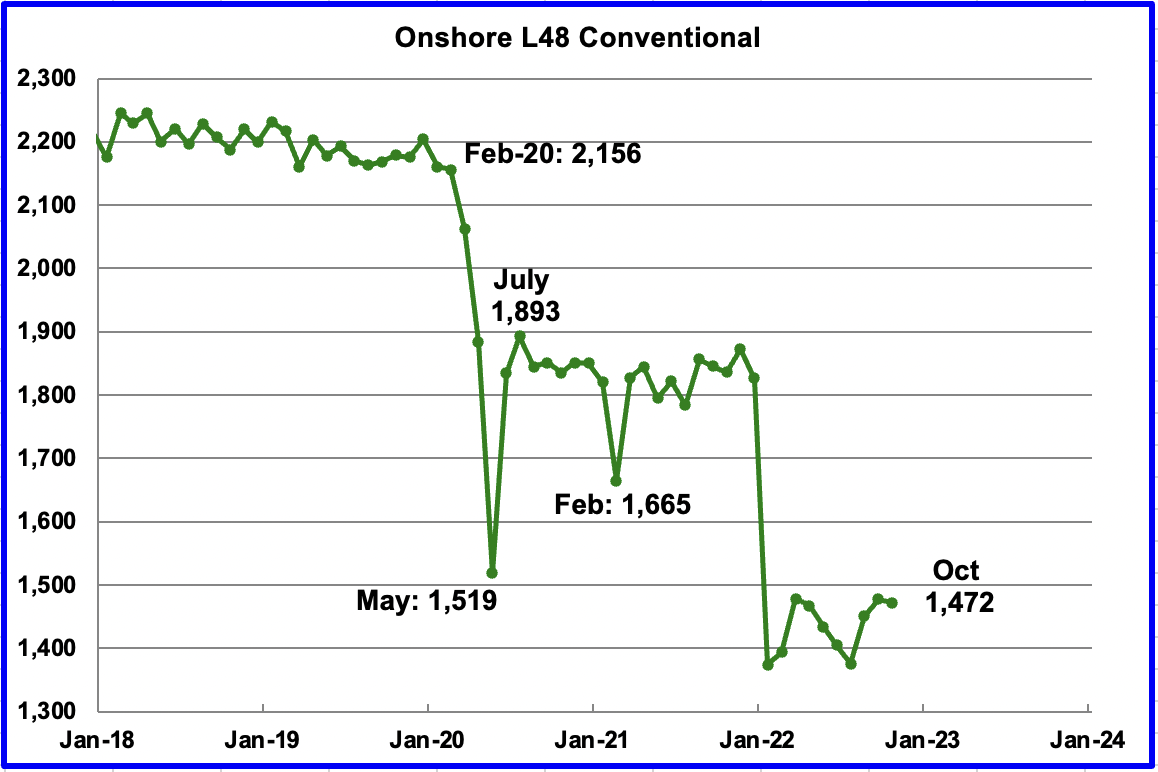
Conventional oil output in the Onshore L48 dropped by 6 kb/d in October to 1,472 kb/d. This estimate is based on a combination of the expected October LTO output and the November 2022 STEO report that has an October 2022 forecast for the US Onshore L48 output.
The big production drop in conventional crude in January is due to the the massive upward revision to LTO production shown in the first chart of this section. We will have to wait for the next LTO report to see whether these November figures are revised.
Production Decline
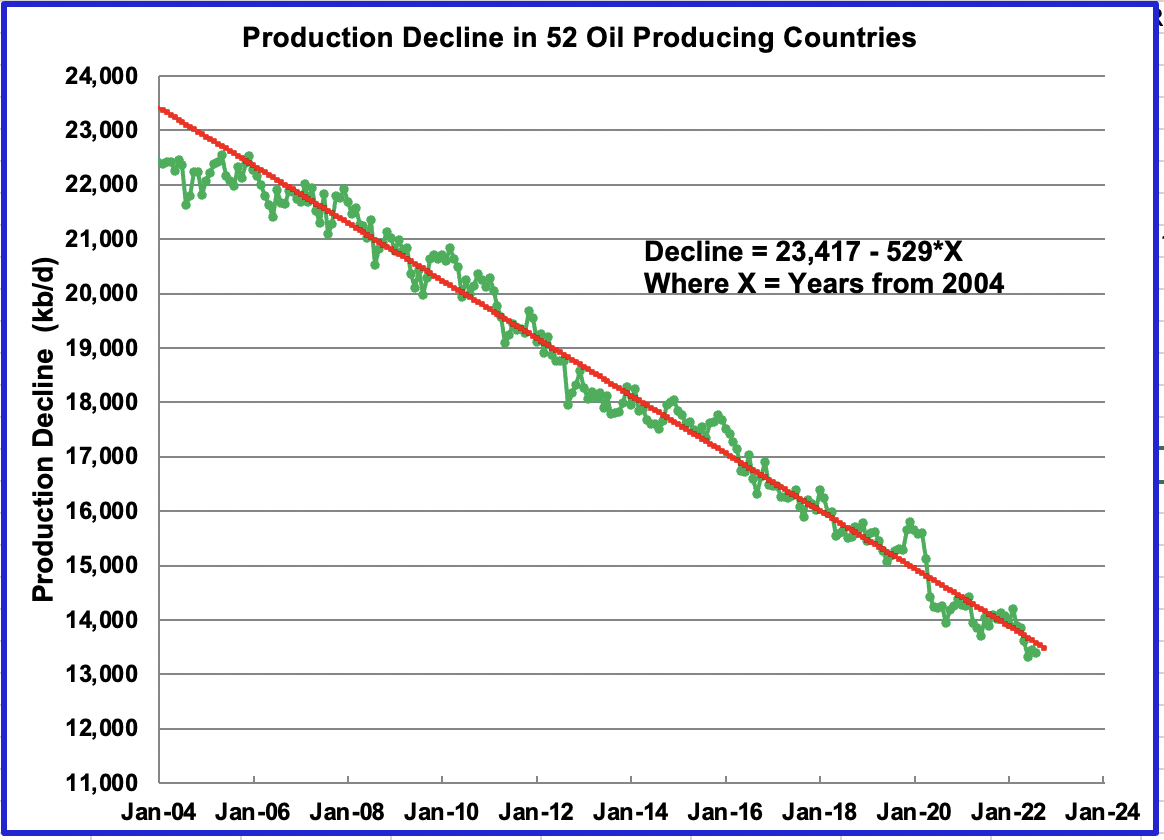
This chart shows the production decline in 52 small countries where many don’t reinvest much capital to maintain production. The annual decline rate over the period November 2005 to August 2022 is 529 kb/d/yr.
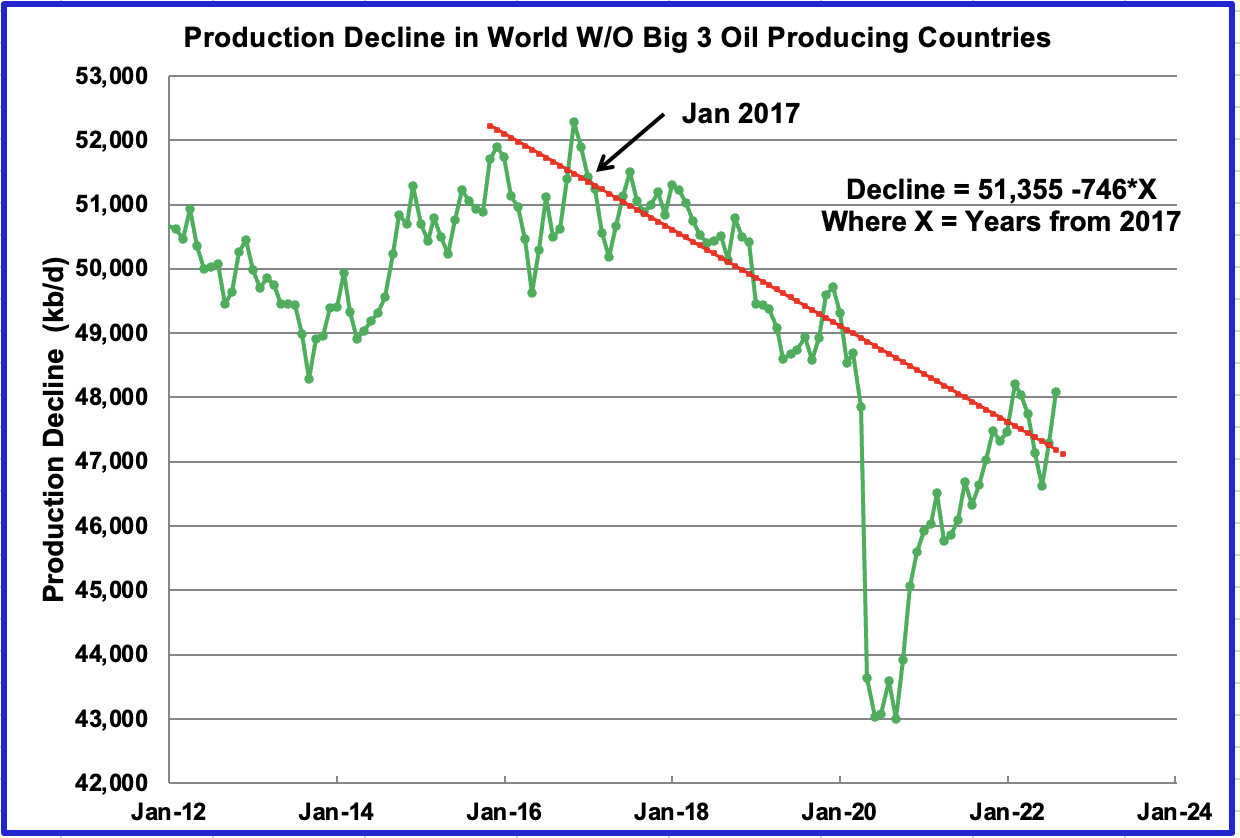
This chart shows the production decline in the world without the Big 3, US, Russia and Saudi Arabla over the period January 2017 to August 2022. February 2020 to September 2021 was left out of the analysis for the OLS line. The annual decline rate is 746 kb/d/yr.
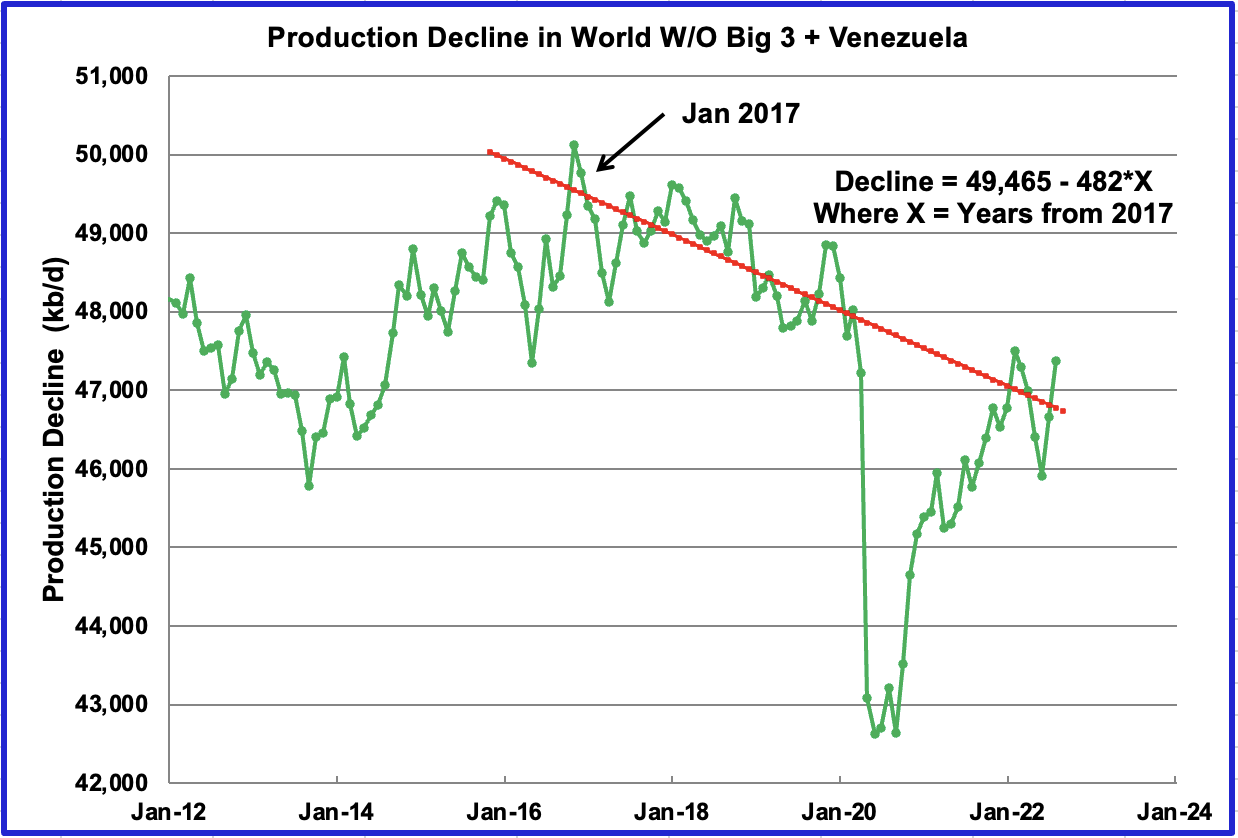
This chart shows the production decline in the world without the Big 3 plus Venezuela. The annual decline rate is 482 kb/d/yr. The point of this second chart is to show the impact of Venezuela on world oil decline rates. The OLS analysis is the same as done in the previous chart and provides a more recent decline rate, i.e. the time frame January 2017 to August 2022.
In looking at other combo’s for checking decline rates, I have decided it is best to leave out Venezuela because its historical production loss is related to sanctions as opposed to geology. Comparing the first and third charts, it appears that the world decline rate, excluding the Big 3 and Venezuela is in the neighbourhood of 500 kb/d/yr.
114 responses to “Permian Pushes US September Oil Production to Post-Pandemic High”
Great work!
My only suggestion would be to number your charts and refer to them by number. For example, when you noted that “the big production drop in conventional crude in January is due to the the massive upward revision to LTO production shown in the first chart. We will have to wait for the next LTO report to see whether these November figures are revised”, I’m still not sure which one is the “first chart”.
Joe
Thanks
I usually try to keep comments to the chart immediately above. NumberING would add additional work, especially when I find new info and insert a new chart.
I can understand your confusion in this case. As an alternative when referring to a far away chart, I would consider labelling it as Visual A and then refer to it as Visual A in section XX.
In answer to your specific question, I was referring to the first chart in the LTO section that showed the large upward revision of 492 kb/d in output from last month.
I presume you draft these posts using a word processor (MS Word would be my guess). In this case, automatic numbering is just a couple of clicks away. Same for cross-referencing within the text.
This chart chows long term debt for IOCs and larger independents against Brent price. The lower line shows debt to total equity ratio. They managed to pay off a large chunk last year but with interest rates rising the companies are quite exposed to any downturn in prices, which probably explains why they are not planning much increase in capital spending as much as the fact that they don’t have many shovel ready projects to invest in or discoveries going through development approval gates.
The big debt taken on by OXY to buy Anadarko (large dark blue box about three quarters up in 2018) still looks a bit reckless but is going down.
Spending
George,
Great charts, as always. This is especially, an excellent one on the Major Oil Companies’ CAPEX vs. the Brent Crude Price. Something did change after the Pandemic Shutdown.
Regardless, with the world now finding about 20 billion barrels in five years, while that was the minimum amount ANNUALLY from the 1950s-1980s, it doesn’t take a brain surgeon to figure out, the LOW HANGING FRUIT has already been picked… for the most part.
steve
Interesting chart George. 6 years of low capital spending and extraction rates keep chugging along with the exception of 2020. It will be interesting to see the numbers for 2022, higher oil prices and interest rates. Capital spending increases, or just share buy backs and paying down debt in 2022?
I think the latter. There’s usually some narrative in annual reports about next year’s spending and I’ve seen nothing to indicate much of an increase. There is a lot about increased buy-backs – these could easily total over $60 billion this year (highest since 2008) based on ‘maximum’ provisions from all the companies shown. Whereas investments are a multiyear commitment buy-backs are an expectation from year to year and can easily be stopped if prices fall.
Production from the companies shown has been falling slightly but could be about to decline more quickly. The S-curve followed for development spending means that the money is relatively lower in completion, commissioning and ramp-up years, but those are when the new production shows up.
Concentrating on near field exploration and tie-backs, and in-field drilling gives short term benefits in production boost but single wells generally don’t have much of a plateau and quickly start to decline, whereas new greenfield projects might stay at or above nameplate for ten years or so.
I used to keep track of new oil projects that were named on the larger companies’ websites with expected start-up dates, throughput etc., but have now stopped as there. just aren’t that many (still a few major gas ones around).
This capex scenario sets up the stage for higher prices. Once the Brent price gets up and over a $100 for awhile we’ll likely see a brisk uptick in capex, going after the smaller fruit left yet unpicked.
Where do you think this low hanging fruit is? Most remaining difficult discoveries were already hoovered up in the fever years (2012 to 2014) when oil was over $110, interest rates were negligible and ESG wasn’t a thing (whether virtue signalling or not). Discoveries since then have been low, most attractive ones of any size were immediately fast tracked. The greenfield projects started within about the last six or seven years ago are still on plateau so have no capacity to accept tie-backs, even if there had been near field exploration, which there usually hasn’t. Russia, Iran, Iraq, Venezuela, Nigeria and parts of Alaska and offshore USA are all mostly off limits to these companies for various reasons. Some projects are beginning to look marginal at any price because their ERoI is so low that any increase in oil price just means development costs go up accordingly. Risk aversion in the oil companies is getting worse and their experienced work force is shrinking. I should think the decline of globalisation will also make it more difficult to get specialised labour and equipment when required, assuming that isn’t happening already.
“Where do you think this low hanging fruit is?”
If you were asking me George….I don’t think there is any low hanging fruit.
Oil pockets still to be found and or developed will be more expensive to bring to market than those from the past century,
High pricing of oil may encourage some of that development.
The explanation you give includes the main reasons that I conclude that URR that has been projected will unlikely to be achieved. Simply unaffordable and or unfeasible.
I’ll add collapse of credit availability in parts of the world, international political and trade conflict in the form of tariffs and sanctions, and resource nationalism to the list of impediments to future oil production.
An example of credit as an issue- Argentina has a big slug of oil and gas to develop, but they have worked hard to gain a high level of credit unworthiness over the decades. This will not get easier for them in a world with decreasing level of credit availability.
It looks to me like stranded (untapped) oil and gas will be a big occurrence.
That country has great prospects for other energy sources that they can slowly develop with less cost- their solar and wind energy reserves are massive.
My own view is that abandoned/untapped reserves of oil and gas will be a major factor in determining the shape/slope of the Seneca curve when we drop off the present production plateau.
Sorry, force of habit – $100 is not low hanging, I meant “unpicked”, which I took to mean undeveloped discoveries.
The larger companies try to show an increase in dividends every year but that pattern was broken in 2020, possibly also a sign of wanting to save money in case of future volatility.
The “Permian New Well Production Per Rig” chart also means the Permian oil is getting more expensive, which isn’t great news for oil companies when oil prices are falling.
I wonder how prices relate to debt.
Note that new production per rig does not take account of DUCs, it looks at new well output divided by number of rigs. If we have a large number of wells being completed by depleting the inventory of DUCs, the new well productivity per rig increases as we saw in 2020. As the rate of completions that occur by reducing the inventory of DUCs decreases, the new well productivity per rig decreases. Note also that the DPR is a model based on rig counts and past well productivity (current well productivity is assumed to just follow the trend of the recent past). That is the reason for the recent lack of volatility of average new well production for recent months, it is simply a model estimate that will tend to be less volatile than real data.
Also notice that the new well productivity per rig is higher in Dec 2022 (1049 b/d/rig) than it was in Dec 2019 at 963 b/d/rig (though this is also a model estimate in Dec 2022 that will be revised in the future. The high levels of new well productivity per rig in early 2021 is simply an artifact from the high rate of DUC inventory decrease during the 2020/2021 period.
On the revision of new well productivity per rig, in Nov 2021 the Dec 2021 new well productivity per rig was estimated at 795 b/d/rig and in November 2022 it had been revised to 1219 b/d/rig.
Chart with changes in Permian DUC count each month from Jan 2019 to Oct 2022.
Dennis
Happy to see this new chart has caused some discussion
I was surprised to learn that rig productivity would include production from DUCs. However I would think that completion of a well would require a rig. Hopefully someone with on hands oil experience could clarify whether a rig is required to complete a well.
Attached is a chart that shows total Permian production calculated two ways. The green graph calculates total production by multiplying rigs times rig productivity. The red graph uses the DPR data for month end production and monthly decline to estimate total new well production. As can be seen only the last three months correlate well.
In those 3 months, the contribution from DUCs was in the order of 12 kb/d or 3.2% of 373 kb/d. So for the more recent data, DUCs play a very small roll in rig productivity. As for the rise in rig productivity from the low of 759 b/d in May 2020 to the high of 1,545 in December 2020, I wonder how much is related to the increase in lateral length.
Ovi,
I doubt increased lateral length has been a big factor over the short period of May 2020 to Dec 2020.
The chart below ajusts for production increase for newly drilled wells vs increased output from the decrease in the DUC inventory for the Permian basin. As an example if 50% of wells completed are due to a reduction of the DUC count we assume only 50% of the increase in new well output is due to rig efficiency and we divide that 50% of output by the number of rigs 2 months earlier (that’s how the DPR model works, it assumes a 2 month lag between drilling and completion) to determine rig productivity. If the DUC count is increasing (DUC count is building rather than decreasing) we simply take all new well output and divide by number of rigs 2 months earlier,
Dennis
Sounds like you are telling me that the DPR rig productivity information is misleading since the above chart shows rig productivity is increasing???
Ovi,
I am saying that the DPR method oof calculating rig productivity gives misleading results because it does not account for the decreasse in DUC inventory that has occurred since August 2020.
My chart attempts to do that, though the measure is imperfect.
Ovi,
New well production is change in output minus legacy production decline. Rig productivity is new well production divided by rig count from two month earlier. All wells completed are DUCs, some DUCs were drilled recently (two months ago) and others may have been drilled more than two months in the past and the completion reduces the DUC count by one.
The report at link below covers the DPR methodology in detail.
https://www.eia.gov/petroleum/drilling/pdf/dpr_methodology.pdf
On the revisions in the EIA’s official tight oil estimate from October 2022 to November 2022, the chart below takes the November estimate and subtracts the October estimate to find how it changed for data from Jan 2019 to Sept 2022. The big changes occurred for Jan to September, prior to that the numbers are very similar, this suggests a potential data processing error at the EIA for the November 2022 estimate. I would ignore the November 2022 estimate for tight oil.
I have to say these numbers make zero sense to me from what I am seeing in real time. All of my peers have seen lower oil per day during the first month of full 30 day production. If the well volumes per lateral foot are going down then why would the wells be more productive than previous months.
The conspiracy theory in me says that the more optimistic numbers , provided by the governmental agency, the lower the price of oil short term.
There is no valid reason I know about that has raised the production anomalously high in Texas and New Mexico for September 2022 and subsequently leads me to doubt their numbers entirely. I guess we will see in a few months when revisions are actually made.
LTO Survivor
I think it is best to ignore the LTO data and let’s wait for the revisions. The DPR data looks better and there are hints that the Permian is rolling over.
Attached are some charts recently posts at Novi Labs. They also hint that the Permian may be near the peaking area. Three charts are attached from the Novi Labs site.
The first one is major producers. Note how Pioneer and COP have peaked. A few are still growing but I don’t know them.
https://novilabs.com/blog/permian-update-through-august-2022/
Permian Cumulative production
2022 is not as good as 2021. Dark blue vs light blue on the left
Average production/10,000 ft vs time in Two Major counties.
Ovi,
Those are sub-basins of the Permian, the Midland Basin and the Delaware basin. I see what Enno Peters sees on this chart:
Well productivity has increased significantly in the Permian Basin over the past decade, with lateral lengths almost doubling during this period. After normalizing well production by lateral length, we find that well results have stagnated in recent years, in both the main subbasins:
(two charts shown including the chart from your comment, the first chart of two)
The top chart reveals that well productivity, as measured by the cumulative oil recovered during the first year of production for every 10k feet of lateral length, appears to have plateaued since 2016.
Well productivity has been pretty flat since 2016 in the two major sub-basins of the Permian basin.
There is a Midland county in the Midland basin, it is the second highest producing county in the Permian basin after Lea county in New Mexico.
On Permian basin flattening in output, I just don’t see this in the DPR data.
Dennis
Production cannot continue in a straight line forever.
In the DPR Permian chart, I was just looking at the last six months. In the post I noted the big difference between the August increment of 87 kb/d vs the 39 kb/d in December. I also considered the charts at Novi Labs which show that 2022 wells are not as productive as 2021 wells
The big unknown is the the price of oil and its affect on drilling and managements decision on returning capital to share holders.
As they say, predicting the future is difficult.
100% Ovi. But at some point even money isn’t going to help.
https://www.oilystuffblog.com/forumstuff/forum-stuff/oblivion
Nobody is “drilling” the entire basin; what is happening in the cores of a few counties in the Permian Basin is vital to understanding the basin’s future. North America’s oil future. If the “analyst” dilutes the picture by using basin wide data it does so with an agenda in mind. Its deceptive and designed that way, intentionally. For instance, you are selling good news to make a buck, like data sell companies. Or you are defending a dumb model.
The EIA is not called the Energy Inaccuracy Agency for nothing.
If you want to be a bear, be a grizzly; if you want to be an analyst don’t be lazy, don’t blame your omissions on not having enough time, or not having the data available to you. GET the data or quit calling yourself an analyst. ALL the data, not just hand picked data.
Almost everybody is now suggesting the Permian is getting ready to roll over, even tight oil companies themselves. Who in their right damn mind now wants to deny that?
And why?
MIke,
Ovi is correct that things won’t continue on a straight line forever. Of course I have never said that was the case. Tight oil companies have said they don’t expect the rapid growth of 2017 and 2018, I agree with that as well.
At one point LTO Survivor suggested tight oil output would grow at about 5% per year, my guess is that growth for US tight oil might be 6.5% per year from 2023 to 2027, not that different from LTO Survivor’s estimate (which heavily influenced my model, along with his suggested optimal well spacing of 1320 feet in the Permian, as well as all you have taught me).
Time will tell who is correct. Below is my US tight oil scenario which assumes oil prices in 2022$ average about $85/bo or higher from 2023 to 2028.
Of course nobody is drilling the entire basin, almost all production and data comes from where the drilling occurs. which is mostly in the core areas. My model scenarios assume that only the best benches in the core areas get developed. Your assumption that I don’t listen to what you say is not correct.
Just because I don’t agree with every word you utter, does not mean I do not listen to what you have to say.
I don’t expect you to buy into my “utterances,” Dennis. That is precisely what I hope for your readers, that they don’t necessarily buy into yours. Your above chart, for instance. The annualized decline from tight oil that would have to be replaced to reach that 3MM BOPD growth is staggering.
By the by; I don’t need to be right. I only want folks to be ready for scenarios that won’t even come close to those you predict. If you are “right,” good for you. If I am wrong all of my ranting about resource waste, lack of conservation and exports will be for naught. Then good on America
Mike,
Yes the decline rate has to be replaced, I realize that, the model accounts for declining output from wells over time. Note the URR of my permian senario is about 38 GB (about half of the USGS TRR) and only about 21.5 million acres of the 50 million prospective acres in the USGS assessments of the Permian basin (about 43% of the total) are developed. About 87,500 wells are completed from Jan 2010 to April 2031in this scenario (no wells completed after April 2031 due to assumed low oil prices after that date.
New wells per month are read from right axis (forgot that on legend on chart, sorry.)
@Mike
I heard many times US has at most 5 years of tight oil to stick around do you see these 5 years:
– each year with less oil than the previous;
– after this 5 years US total prod to 4 or 5 mbarrels per day similar to US 2005 levels
Svaya, I hate to speculate about the future but I essentially agree with your premise: 3-5 years of remaining Tier 1/2 Grade A/B locations left in the Permian; south of 5. When those are gone, well quality in the Permian will tank and production drops will be dramatic. I also agree it unlikely that Permian growth will continue even with 3-5 years of good/fair stuff to drill.
Fewer than 4% of Tier 1/2 locations exist in the Bakken (Novi) and less than that in the EF on a strictly liquids basis; the so called, “green oil” leg (Karnes & Gonzales Ctys.) is mostly drilled up, they are now poking at rich gas wells down regional dip. More gas doesn’t help much at the moment. It just gets exported. Or flared.
The Permian Basin is America’s Alamo. “In October, 421 wells were drilled and 434 were completed in the Permian (Ovi). ” Not 500, not 600… but 436 including a few old DUCs. Wells are getting gassier and liquids productivity is going down, as is the price of oil nowhere near $90. D&C costs are up 35%. “Of the 434 completed wells, 362 were required to offset the (YOY, or annualized) decline (Ovi). ” Those 70 new wells each month account for current Permian growth. THEY decline at the rate of 85% the first 32 months of production life.
Readers here need to make up their own mind how in God’s name the Permian Basin grows 3 MM BOPD, to 11 MM BOPD, in the next six years.
A common mistake made by people interested in their oily future, but with no experience, insights or knowledge of the industry before the tight oil phenomena, is to assume past results will continue to be indicative of future performance. It ain’t true, no sir. NEVER in history has that proven to be the case. Nor has it EVER been the case that wild ass guesses about oil in the ground means it actually exists, or that it will come out of the ground even if it does.
Mike,
My scenario assumes only the core areas of the Permian and higher productivity benches are developed, of about 50 million prospective acres in the Permian in the USGS assessments from 2016, 2017 and 2018, with a TRR of about 75 Gb, my scenario assumes 38 Gb is produced with only about 21 million acres developed over the 2017 to 2040 period. I assume wells are spaced at 1320 feet and average lateral length is 9500 feet.
Scenario below for Permian has 26100 wells completed over 59 months, then completion rate falls very fast with total wells completed after Sept 2022 at 28260 (35270 wells completed from Jan 2010 to Sept 2022). Maximum completion rate assumed to be 450 wells per month.
I doubt this scenario will be right.
I would also note that Pioneer claims they have 10 years of high quality drilling inventory rather than the 3 to 5 years that some suggest.
Now I know people are very selective about claims by CEOs, when they say output will not increase by very much they are truthful, but when they say they have a lot of drilling inventory they are lying. Seems you cannot make such selective claims and be taken seriously, or not by me.
Article on drilling inventory in Permian
https://insight.factset.com/are-private-permian-operators-really-running-out-of-untapped-acreage
ho can they have “lots of drilling inventory”, yet cannot increase by much.
lots of drilling inventory, is the kind of thing you say that will make you get away with it…
and not alienate the investors
Mr. Coyne, I really don’t give a rats ass if you take me “seriously” or not. I was asked a question, I took the time to answer the question the best I could using information/data I have available to me, personal, on the ground observations, long standing friendships with engineers and actual operators working in the Permian, all with the benefit of 60 years of experience IN the oil and gas business as a Texas operator myself. I wish to help people make rational decisions about their oily future.
Mike Shellman,
Perhaps the tight oil companies are not truthful about their drilling inventory, there is also the fact that the models for the North Dakota Bakken/Three Forks match quite well with the 2013 USGS petroleum assessment, so it seems doubtful that my Permian model which has far lower output of 38 Gb out of a TRR estimate of 75 Gb for the Permian basin is overly optimistic. For reference, the USGS 2013 Bakken/Three Forks assessment had a mean TRR estimate of about 11 Gb for the North Dakota part of the Williston Basin and my model for the North Dakota Bakken/Three Forks has URR at about 7.4 Gb, or roughly 67% of the USGS mean TRR estimate. The Permian model has a URR of 38 Gb with the mean USGS TRR estimate of 75 Gb or about 51% of the TRR.
It may be that the USGS estimate is very far off for the Permian and less so for the Bakken, or perhaps oil prices will be far lower than I foresee.
Time will tell.
Thanks MIKE for the answer to the question
I am sorry you are taking flack over it
Svaya, I hope it helped a little. The “flak” is SOP. Never have so many known so little about oil and gas, yet think they know so much.
https://www.oilystuffblog.com/forumstuff/forum-stuff/justin-mikulka
There is an image from 2016 in this link that will knock your socks off. It is actual tight oil decline rates from production data filed with state regulatory agencies, then algo’ed out to the end of life, assuming no more wells were drilled. Volumes are now much higher, of course, but annualized decline rates are much steeper. The image would actually look worse today.
Now ask yourself, how likely is it that 2-3 M BOPD of annualized decline can be replaced every year for the next 5 years, and another 3 MM BOPD added, all of that coming from very centralized core areas in 2-3 counties in the Delaware Basin and 2-3 in the Midland Basin, most of which are already over drilled, gassing out from pressure depletion and where individual well liquids productivity is in decline?
@Mike
Thanks for the great article
Ovi,
For the 13 months from Dec 2021 to Dec 2022 in the most recent DPR the OLS trend is about 56 kb/d per month for the Permian region. My scenario has Permian output increasing at an average monthly rate of 48.4 kb/d from Dec 2022 to June 2027, so the rate does slow down from the Dec 2021 to Dec 2022 period as you have suggested and it stops increasing at that rate after 4.5 years. Peak is in July 2030, but the monthly rate of increase from July 2027 to July 2030 is only 23 kb/d. After that decline is steep.
Dennis
How many wells are drilled in the Permian each month for this year?
and you have new wells drilled reaching 600 in 2028 and then falling, yet production does not start to fall for another 2 years. Not sure how that is possible.
Charles,
Fewer than 600 wells per month are needed to keep output flat. Note that the model matches output quite well from 2010 to 2022. In fact the model under estimates recent Permian output. If new well productivity holds steady as I assume and the completion rate in the future is close to what I assume then the output will be what I show in the scenario.
Of course we do not know what future well productivity will be or the future completion rate. For this year the EIA estimates about 425 wells per month were completed, slightly fewer have been drilled.
Also notice that when the completion rate is 600 per month that output continues to increase.
Thank you Ovi for this work! Very interesting approach to separate political and geological decline. But what‘s about Iran, Nigeria and Lybia? How would a chart look like without them? By the way, you wrote „December“ in your headline, shouldn‘t it be „September“?
Westexasfanclub
Thanks. CHANGEd it. Those viewers at seeking Alpha will not see the update. Can’t believe the error in the title. I guess being in December didn’t help to wake me up.
As for Iran, you are right in that I should have included it. Being focussed on Non-OPEC may have been part the problem. Regardless attached are two more charts.
Adding Iran to the big three gives almost the same answer as adding Venezuela a decline of 469 kb/d/yr vs 482 kb/d/yr. Adding both Venezuela and Iran to the big three shows the rest of the world is slowly increasing production at a rate of 130 kb/d/yr, This second analysis stopped at January 2020.
Iran and Venezuela
The graph WWO big3 Iran Venezuela surprises me Ovi. I had expected something flatter or even a decline. Should our actual situation be rather political than geological? This is certainly worth a second thought.
Westexasfanclub
I still think there is a good amount of geological decline that can be gleaned fromm the EIA data. I prefer my small 52 countries decline chart because I think those smaller country’s decline is related to geology.
That last chart stops at pre-pandemic January 2020 and there are countries growing production in that group outside of the big 3 plus Venezuela and Iran. I think that the post-pandemic period is also different due field damage associated with shutting wells.
From the TV: Breaking News! OPEC has just agreed to keep the 2 million barrel per day cut they had agreed on earlier, until the end of 2003. But I have searched the net in a vain effort to find: A cut of 2 million barrels per day from what level? That is, if they hit that 2 million bp/d on the nose, what would then be their production level? Frustrating!
Another OPEC show, Ron. First there was that recent spike with its artificial scent, now followed by a „voluntary“ cut, low enough to taper over their natural decline. Especially with Russia sancioned, it will make them look strong and stable for a coulpe of months/years, while the global recession under way (or at least a low growth scenario), will serve them as their justification. Depending on the future development of economies and politics, it will take at least till 2024 before the MSM might even consider the remote possibility of a peak in 2018.
Ron
Is this what you are looking for?
Saudi Arabia gets closer to its comfort zone, 10,500 kb/d
Interesting. I didn‘t know the 2 mb/d-cut was announced by OPEC . I thought it was just OPEC. So Russia and SA make up for more than the half of it.
Yeah, I think that is it. Thanks. And, like WTFC I didn’t know whether it was just OPEC or OPEc+. I guess now we know.
Do you know if this is crude only or C+C? It must be C+C.
Ron
Crude only. Look at the OPEC report for August production and compare the big guys, SA, Kuwait, UAE and Iraq and the outputs are very close, especially for Kuwait and the UAE.
Yeah, but look at the difference in Angola, Nigeria, And the Total.
I think I get it now. This was “required production”, not actual production. So what we see in the sheet you posted is what we can expect if they hold to their cuts.
In October, they were already 311 kbpd below their 25,416 kbp/d target.
Oct-22 25,105
Target 25,416
311
Ron
As best that I can recall, I think I read that the real cut would be be close to 1,000 kb/d, about 1/2 the official cut.
I would expect that theywill remain, for the next year, some where near their November production.
The big drop will show up in the upcoming December OPEC report.
The Organization of the Petroleum Exporting Countries (OPEC)pumped 29.01 million barrels per day (bpd) this month, the survey found, down 710,000 bpd from October. In September, OPEC output had been the highest since 2020.
Their decision for November called for a 2 million bpd cut in the OPEC+ output target, of which about 1.27 million bpd was meant to come from the 10 participating OPEC countries.
https://www.reuters.com/business/energy/opec-oil-output-drops-november-after-cut-pledged-survey-2022-11-30/
A Few Words on the EIA’s (Wishful Thinking) Drilling Productivity Report
The folks at the EIA must have employed a few ENERGY TOOTH FAIRIES to push up the production curves on several of the shale fields because the data from Shaleprofile (Novi) DOES NOT confirm.
This is especially true in the Eagle Ford. With the data from Shaleprofile accurate up until at least June 2022, we see a continued lower trend in production. But, somehow, the folks at the EIA show a nice near 45-degree uptrend.
Furthermore, the Eagle Ford’s completions per month are not much more than in 2021, So, how the Eagle Ford has added about 250,000 bd of production, as per the EIA DPR Report, since the beginning of 2022… must, again, be due to the ENERGY TOOTH FAIRY.
First Chart is EIA DPR Eagle Ford Chart.
steve
The Second Chart is from Shaleprofile, showing a clear downward trend in Eagle Ford oil production.
steve
I really appreciate all the charts and the good work everyone puts forth in providing information. Dennis I wanted to comment on my post a few months ago when I suggested that the LTO production “may” increase incrementally 5% over the next few years. I made that prediction assuming reasonable drilling and completion costs and oil prices stable at the $100 per barrel range.
Recently as we have seen oil and gas prices fall rather precipitously over the last several months, I can assure you that all of the Permian E&P companies are quickly reassessing their CAPEX budgets for 2023. While I couldn’t fathom oil and gas prices cratering in the midst of the Russia\Ukraine fiasco, it seems like the futures market is falling in step with the stock market and predicting a really ugly recession which I believe is already well under way.
{As an aside. I own some Amazon seller businesses and starting in October we have seen a 20% decline in revenue almost immediately across the board, no exceptions.}
As an operating partner in East Texas, with gas prices falling, I would expect our activity in the gas basins will also be diminished as well.
These charts will definitely be affected negatively by lower prices in an impactful way. It’s very hard to plan for both the short and long term with this kind of price and cost volatility.
Why I continue to invest is a mystery to me because it is really difficult to endure these volatile and shortened cycles. I guess this is why I get so frustrated with the predictions and production numbers supplied by these governmental energy agencies. Their optimism is so detached from reality.
Oil prices are going to follow growth and inflation expectations. It doesn’t matter if China decides to open back up. They don’t have orders and are canceling ships because there is a record glut in inventory already in the US.
It doesn’t matter if the US decides to refill the SPR at $70. It doesn’t matter if OPEC makes more cuts. Prices are still going lower. Until growth and inflation bottom out in this cycle.
HHH I totally agree.
I don’t understand why we have to have cheap energy prices if there’s low economic growth.
Several times in the past there have been strong energy prices with low/negative growth, especially when supply is constrained, as appears to be the case now.
HHH,
No disrespect, but SPR refill, OPEC cuts, and opening China do matter… and significantly. Each is a major current variable on demand swing. Cumulative of the three is a massive influence on crude price, either way.
In my opinion, the above three matter more than economic growth rate and inflation numbers. Those negatives are already baked in…. recession is 100% for 2023 and China is shut in…. Yet we still hold $70/BBL. The crude market already reflects these negatives and eventually, the market will look beyond them and focus on the looming problem of oil delivery volume. … with a likely China reopening as a sideshow.
HHH
US SPR level has always had an effect on price and it is at it’s lowest level in 30 years.
If OPEC cut production by another 2 million barrels oil prices would go up to around $90.
The worst prediction for global GDP is for a growth of 1.4% which still requires more oil.
Fact is oil at $70 or $80 is far too cheap, we need oil over $100 to get people to use it wisely and not buy F150 trucks to go shopping in.
LTO.
I don’t know how you and others keep drilling wells. Things must be better both material and labor wise in the larger producing areas than in niche places.
I don’t see labor recovering here. The factories are paying so much more and they can’t find labor. They are taking almost all of the labor out of our field.
Costs are extreme here too, no relief. Most of our wells have 2 3/8” tubing. A few high volume have 2 7/8”. The local supply store wanted $16 per foot for new 2 7/8” tubing last week. We located some used, tested for $9.
We have an electrical project that has been waiting on parts since June. I could go on and on.
But the one that blew me away was the quote I heard from a well service company owner that does work for us. The company does a lot of gas storage well work. The utility always uses new steel, which I assume all of the shale companies do as well. $43 per foot for 4 1/2” casing!
We have been searching around for 2 3/8” tubing and have been able to secure used tested for $4-5 per foot, which is still double what it should cost.
Unless we are an anomaly, I would think these steel prices and labor shortages would cause a big drop in 2023 activity. Raw steel prices on the exchanges have dropped, tubing and casing is still in very short supply apparently.
We are drilling gas wells but getting ready to shut it down and quit drilling after our two well commitment. The economics of drilling LTO are not viable at these prices. I believe we will see a massive drop in the Drilling Rig count starting now.
The Fed is committed to killing the economy. There will be no soft landing. Housing market is falling apart, bad real estate loans will affect the baking system, retail sales are dreadful, the stock market decline will continue with overall general contraction with no where to hide.
It is amazing how we became so dependent on low interest rates to the point where a 300 BP increase can destroy the economy. We haven’t even seen the lag effect yet.
It will all cycle again but this recession in my opinion is more systemic and I anticipate it will last longer than most.
I would like to see Dennis’ charts at $60 oil and rig count dropping by over 50%. Mike knows this but the industry will move way more quickly to drop rigs as the inflated drilling and completion costs are not sustainable.
LTO Survivor,
At $60/b for oil we might see something like this scenario below for tight oil. This only occurs if we see sustained oil prices at $60/bo for the foreseeable future (say until 2030). Seems a highly unlikely scenario from my perspective.
It will be interesting to see if the horizontal rig count to decrease as you expect. Do you have a prediction for how much we will see it decrease and how long you expect it to last. I could easily create a scenario based on your expectations if I knew what they were.
For example when does the horizontal oil rig count reach 50% of the current level? In 6 months, 12 months? How long does it remain at that level, 12 months, 36 months, 60 months? There are an infinite number of possibilities, I would prefer you just pick your best guess so I do one scenario rather than 5.
“It is amazing how we became so dependent on low interest rates to the point where a 300 BP increase can destroy the economy. We haven’t even seen the lag effect yet. ”
On this general subject, some people who do believe that there are limits to perpetual growth in the human real economy raise the possibility that one of these central bank cycles of tightening to reign in inflation may no longer work as we have become accustomed to, or that a followup attempt at quantitative easing/stimulation will be ineffective. In the past tightening has been effective in slowing the bus or even causing contraction, which then has been followed by a return to growth on firmer footing.
A forced contraction to reign in inflation may not necessarily be followed by a return to expansion- ever. And in that scenario inflation may remain high and higher despite economic contraction.
Many here can imagine that lack of inexpensive energy could lead to such a scenario. Add indebtedness and fragility of the global financial system, aging populations, greenhouse warming costs, fighting among the worlds tribes, nationalism, and poor management decisions by corporate or political decision makers to the list of challenges that could add up to a derailment of the ‘normal’ economic growth train.
I am not making a specific timeline prediction or progression of events on this, but I do think the likelihood peak real economy on an involuntary basis is in the cards for humanity, and probably while whoever reads this is alive.
note
– “Climate change could cost the global economy as much as $23 trillion by 2050”-SwissRE, for example
– by ‘real economy’ I mean to exclude paper or digital and frivolous/optional sectors that are always included in GDP. Things like financial and real estate transactions, insurance, advertising, political spending, gambling/gaming, entertainment and sports, media, social media, video gaming, and many services that are not related directly to productivity, etc. Pretty much anything a dog would see as invaluable, or that has no detectable mass.
Thanks LTO Survivor,
The scenarios I have developed assume that oil prices will tend to be above $90/bo and natural gas above $4/MCF, with NGL at about 35% of the crude price over the next 4 years. I agree the volatility in petroleum prices may be a problem, but lower output is likely to lead to higher prices. I doubt my oil price predictions will be correct.
Several Permian scenarios below with output increasing from a low of 5.4%/year to 9.8%/year over Jan 2023 to Dec 2027 period.
Dennis I applaud your efforts in graphing future production. Unless there is a quick reversal in prices, CAPEX budgets will be slashed and you will see another step down in LTO production in 2023. It happens this quickly. I think someone on the blog predicted $30 per barrel. I am now believing we will bottom out below $60 (which means it may be closer to $30 because I cannot predict algorithms of the traders) which will slam the brakes on the domestic E&P industry. This price volatility makes it an uninvestable commodity in any “rational” world. Watch for the Rig count to start shedding next month.
Thank you LTO Survivor.
I think the predictions of an oil price crash are likely wrong, if prices do crash as some expect, supply will fall and prices will increase, oil prices for oil have been volatile since at least 2005, perhaps it is worse today than before. Below I show scenarios for US tight oil using the Permian scenarios presented earlier (for the rest of US tight oil the same scenario is used for all 4 of these scenarios. The average annual rate of increase in US tight oil for these scenarios from June 2022 to June 2027 ranges from 4%/year to 6.7% per year (medium low is 4.9%/year and medium high is 5.8%/year). The linear annual rate of increase is 343, 431, 519, and 607 kb/d respectively from low to high scenarios.
So far we have seen tight oil production increase since mid-2020 after the initial pandemic crash in output. By a step down in tight oil output, I assume you mean slower growth, but note that from August 2020 to September 2022 US tight oil grew at an annual rate of 12.9% per year. So my scenarios (considered very unrealistic by many) have annual growth rates at 2 to 3 times lower than the past few years, already a significant step down in growth rate. They are likely conservative for the oil price scenario that is my best guess.
Dennis
All your graphs have a defined peak and decline soon after.
However there are many factors that could lead to a plautaux in 2025 which would extend for 5 to 8 years or so.
Why do you not consider this possibility?
Charles,
I assume oil prices decline due to transition away from oil for land transport. The scenario could be wrong, but this is my best guess, the scenarios are mostly based on this type of future oil price scenario.
I have considered the possibility of a plateau in World output and do not think it likely beyond 2030. I have presented many scenarios at the World level with a plateau from 2025 to 2030 or so.
Dennis
This is all very difficult. There are so many variables, for instance global gdp growth being one. If things are good then more people will be able to afford to buy an expensive electric car and that will take pressure off oil prices. However if there is a wider slow down, more people will stick with their ICE car. You can buy a lot of petrol for £34,000, about 20 years worth.
Then there is the trade in second hand cars, many go to Africa and other poorer countries if oil prices do fall that low then more people in those countries will be able to drive.
https://www.scientificamerican.com/article/used-car-exports-threaten-climate-goals/
The Jevons Paradox teaches us that the more efficient a system is the more gets used.
The graph below shows that to be a fact.
https://ourworldindata.org/energy-mix
Look at China, even though it has more solar capacity than any country and more wind it uses more coal than ever. I think we will start running out of production before we reduce consumption.
Charles,
I agree there are too many variables whose future values are unknown which makes accurate predictions impossible.
It is possible that you are correct and I am not, we do not know the future we can only guess (it is very likely, virtually certain in fact, that we are both wrong imo). My experience over the past 40 years has been to underestimate the speed that new technology is adopted in the future. My guess is that my scenarios will tend to be conservative in this regard, but just as I have been wrong in the past, this will continue in the future.
For a “plateau scenario” with a slow transition to electric transport, consider the following chart (this was done on November 23, 2022).
Note that in this scenario we assume that we have peak oil supply which implies high oil prices rather than low oil prices, this supply curve is about the maximum output we would expect in a high oil price scenario (say average annual Brent oil prices between $100 and $120/bo in 2022 US$ until 2040.)
U.S. Shale Growth To Disappoint In 2023 Bold mine.
Despite the fact that U.S. crude oil production has recently hit the highest level since the pandemic low of below 10 million barrels per day (bpd) in May 2022, the growth rate has markedly slowed this year as the shale patch struggles, labor shortages, supply chain delays, and the high cost of supplies while producers focus on returns instead of drilling. U.S. oil production hit nearly 12.3 million bpd in September, the latest month with comprehensive data published by the EIA in its Petroleum Supply Monthly report last week. Between January and September, daily U.S. crude oil production averaged 11.733 million bpd, and 11.7 million bpd is the administration’s current projection for average U.S. crude oil production for this year.
Although output is growing, the pace is half the growth rate seen in the rebound after the 2015-2016 oil price slump when American oil production in 2018 and 2019 soared by 1 million bpd—and even more—per year.
Those days of surging growth rates may be gone forever as producers continue to prioritize payouts over drilling, while cost inflation and supply chain issues hold back even those who are willing to boost output.
The September production was much higher than the 9.7 million bpd seen in May 2020, when American producers curtailed output after global and U.S. oil demand plunged at the beginning of the pandemic.
Since then, output has grown, but not at the same pace as in 2014 or 2018-2019.
There is a lot more to this article. Just click on the headline above to read it.
Ron,
The annual rate of growth from Jan 2017 to Dec 2018 for US tight oil was 43% per year. From August 2020 to September 2022 the annual rate of growth was about 12.9% per year for US tight oil (more than 3 times lower than 2017 to 2018). My scenarios for future US tight oil output from July 2022 to June 2027 range from 4% per year (about 3 times lower than the past two years) to 6.7% per year (almost 2 times lower than the annual rate from the past 2 years).
So yes, future growth rate of tight oil will be lower than in the past imo.
Dennis – Looking at 6 month period in 2022 from May to November, I get ~3% production growth, is that below the level you are expecting?
In past 20 years, there have been several different phases to U.S. oil production growth as follows:
-slow growth between 2006-2012 (~3% annually).
-first shale boom leg up from 2012-2015 (~12.5% annually); followed by ~1 year of dropping production.
-second wave of shale boom from 2016-2020 (~11.5% annually) ;followed by the covid demand drop.
-post-covid demand rebound from Feb 2021 to Feb 2022 (~14%).
-now the current flat production profile for past 6 months.
I believe that looking at the 2020 to 2022 period and thinking it is growth is a mistake.
I suspect much of it is simply rebound from the covid demand drop, if it was truly growth then it wouldn’t have stopped 6 months ago (specially when considering the oil price over past 6 months).
What does an analysis of shale oil for past 6 months tell you, something similar or different?
Kengeo,
I do not think looking at a 6 month period tells us very much, I also focus on tight oil growth rather than US output growth so we are not comparing apples with apples. From Sept 2021 to Sept 2022 the annual growth rate for US tight oil was about 3.5% per year. For the past 7 months (March 2022 to Sept 2022) US tight oil grew by about 5% per year. As to high oil prices, the high oil prices were very temporary and only a sustained period of high oil prices will lead to an increase in the rate of drilling and completion, typically there is about a 6 month lag between a rise in oil prices and an increase in the completion rate (if the high oil prices are sustained for a 6 month period).
The high level of oil price volatility and the high level of uncertainty about future economic conditions will tend to reduce the level of investment in the oil industry and is consistent with the relatively low growth in tight oil output of the past 12 months. I looked at April to Sept 2022 for US tight oil (last month’s estimate because current month’s estimate seems flawed) and annual growth rat for tight oil was about 7.5% per year during that period (I used OLS on the natural log of tight oil output to estimate).
Using 2016 to 2019 is an interesting choice as tight oil output was decreasing in 2015 and 2016, from Jan 2017 to Dec 2019 the average annual rate of increase in US tight oil was about 27% per year. From Jan 2012 to Dec 2014 the average annual rate of increase was about 33% per year for US tight oil output. The average annual rate of decrease in Jan 2015 to Dec 2016 was about 6.5% per year.
Thanks Dennis – Sounds like shale is the only growth that’s occurring, right?
I guess at some point the shale growth line and the conventional decline cross each other (next year?) and that results in continuation of no growth, is that where we are at?
I think the key recognition in this entire debate is that US conventional oil is declining at a rate of ~7% each year, therefore, just for total US production to stand still we need shale growth of a greater percent since shale is 5.5MBpD and conventional is 6.7MBpD. This means that even if a solid 6-8% shale growth can continue then it still wont be enough to offset conventional decline rates.
By the end of next year, shale and conventional oil stand to be nearly the same production level of ~6 MBpD each (if shale growth can continue for that long).
Even if shale growth takes off at 10% annual growth the best we can hope for is 12.5 MBpD all the way in 2025…
What do you assume for conventional decline???
I make no assumptions about future decline rates for conventional or unconventional oil. I look at the rate that resources have been developed in the past and extraction rates of the past for conventional oil and assume development rates remain similar to the past and that rates of discovery gradually diminish. Historically for the US non-tight oil L48 onshore output has declined at about 3.5% per year.
https://www.msn.com/en-au/money/other/russia-is-concerned-over-oil-tankers-build-up-in-bosphorus-ria/ar-AA150oMg?ocid=msedgdhp&pc=U531&cvid=14ad6126b46c4341bbe3963ed847b843
Russian tankers stuck at sea due to insurance
Dennis
I think that graph above with higher oil prices is close to what will happen.
You say that this represents a low electric uptake.
Remember cars only use 20 million barrels per day, the rest is used by chemicals, aviation, shipping etc. All these other sectors are growing to supply a population that will be 600 million higher in 2030.
Twenty million new electric cars sold reduces oil consumption by hardly anything, in comparison to 1,400 million vehicles.
A graph with Three options of new electric car sales against oil demand would be useful.
Remember increasing consumption in other areas need to be taken into account.
You will see that consumption does not fall as quickly as you think.
That graph shows oil production being above 80 Mbpd until 2035 (projected world population of 8.9 Billion that year).
My guess is that its a best case scenario (for production),
assuming best behavior and incentive to achieve.
It also indicates a huge additional slug of global warming to be added to the mix.
It shows 10 years to get your alternative energy options deployed- don’t be last in line.
Hickory,
I don’t think that scenario is very realistic, my expectation is that lack of demand will lead to falling oil prices and falling output with URR more like 2500 Gb and hopefully less (though 2500 Gb would be my best guess).
Charles,
In 2018 about 83 Mb/d of crude plus condensate was produced in the World. and about 52 Mb/d of gasoline and diesel fuel was consumed, it is likely that at least half of the crude plus condensate that is produced is used for land transport as airplanes use jet fuel and most ships use bunker fuel rather than diesel. My expectation is that both cars and heavy duty trucks may move to mostly electric transport (some long haul trucking may be replaced with electrified rail). If Transportation as a Service (TaaS) becomes more wide spread due to the cheaper cost per mile for EVs, then much of the privat transport miles travelled might be replaced very quickly with EVs. Remember that each fleet EV driven with taxis or Uber like services can replace 6 to 10 cars as far as miles travelled (100k per year rather than 10k or 15 k per year). Also keep in mind that sales of plugin vehicles has been growing at an average annual rate of 42% per year from 2012 to 2021. If the sales growth of plugin vehicles is 35% from 2022 to 2027, the the plugin fleet grows to 149 million by 2027 and if most of these are used in TaaS type services then nearly all private vehicle miles travelled could be replaced by plugin vehicles by 2027. Likewise heavy duty trucks might be replaced fairly quickly by EVs as costs of batteries continue to fall, especially in a high oil price environment.
Earlier you commented on cars going to third world, many of todays cars cannot be easily repaired like the old cars from the 60s common in Cuba, lack of parts availability will make many ICEVs not worth purchasing as used cars due to lack of spare parts, so I think a lot of the existing car stock will go to the scrap yard rather than being shipped to developing nations.
Charles,
The oil price scenario I presented assumes the transition to EVs is fairly rapid, for the 2980 Gb URR World scenario I presented, oil prices would remain at $100/b until at least 2035 and then start to decline.
The oil price scenario I presented might have an output scenario like the one in the chart below. Note that this scenario has a URR which is 650 Gb less than the previous scenario. (2980 Gb vs 2330 Gb).
Dennis, good eve. I disagree on your demand comments.
TaaS will mostly only work to cannibalize Uber. Private owned transportation will persist and energy for creating, energizing and maintaining these vehicles will remain. Folks will passionately not want to abandon their transportation independence and security just to save a buck…. remember, humans are vain and full of emotion.
Further… on ICEV longevity and the vintage car parts… they are easy to find and are mostly still manufactured today. Old cars will linger longer. There is solid demand for vintage car parts to revive and repair old cars. If you have specs, they will make it. My dad refurbed a 57 Chevy truck a couple of years ago. He ordered parts made custom based on specs from the original plans. So, spare parts are not a problem and likely never will be,,,, as also supported by observations of my middle son programming his 3D printer….
Gungalonga,
The very wealthy car enthusiasts may continue to have vintage cars. In the developing World it will be cheaper to use EVs in the future. TaaS similar to Uber, EVs will make a fleet owned Uber-like service very cheap and most rides in the future for middle class folks will be with TaaS, for longer trips rental EVs might be used. Only trades people (carpenters, plumbers, electricians, etc) and the wealthy are likely to own their own vehicle in the future. Using TaaS will be 5 to 10 times cheaper.
Dennis
According to BP cars use 20 million barrels and IEA says trucks use 17 million and truck use will increase substantially. Every million units of electric cars sold will reduce oil consumption by around 20,000 barrels per day.
A graph showing 3 scenarios of electric cars sales low, medium and high with consequent oil demand reduction, ie. minus a million, would be very helpful.
Rough calculation by 2030, electric car sales could reduce oil demand by 2, 3 or 4 million barrels per day. A graph of annual sales will be easier to analyse against possible geological decline rates.
Can anyone provide more context on a graph like this?
https://twitter.com/JavierBlas/status/1600526584129196033
Does this mean we’re headed for a shortage in the US?
Kansas oil leak shuts down massive Keystone Pipeline
https://www.ksn.com/news/state-regional/kansas-oil-leak-shuts-down-massive-keystone-pipeline/
Things happen, I guess
A lot of the controversy about the Keystone XL and the pipeline transfer of Dilbit didn’t have to occur–if only the US had established a reasonable energy policy drawn up by real oil men and women. And by the way, the “Little Keystone” is getting on in years.
The stuff from the Canadian oil sands is bitumen, which is about the consistency of peanut butter and is immobile in a pipeline. It has to be heated to move, but you can’t heat it all the way, so a diluent is added to make it DILBIT (DILuent + BITumen). Nobody but the company knows for sure what is in that diluent.
This could all have been avoided if the light sweet oil from the Bakken had been diverted in sufficient quantity to help transport the bitumen through the Keystone XL. After all, LTO is a pretty good diluent for bitumen. The Gulf Coast refineries need a heavy oil. This would have been an environmentally friendly fix.
Oh well, we’re going to experience total incompetence until something big breaks–like a refinery producing diesel or aviation fuel–and an existential crisis results. The greatest ally of the United States has been the reliable stalwart named Canada, and the Canadian tar is going to be the last great oil asset.
But no, let’s keep the Keystone XL off the pipeline grid. Let’s not build any new pipelines outside Texas.
How’s that working out for us?
Gas is $2.84 a gallon here in NC. Hard to convince anyone there’s much of a problem.
Hard to believe, since peak oil production was likely over four years ago. Yet there they are, still giving it away cheaper than bottled water.
The price of any commodity depends on the cost of delivering it, not on the amount that can be delivered in the future.
Looks like China is lifting the Corona policy now:
https://www.ft.com/content/abefb06e-a5a7-432b-85bf-b3250b53836f
The rising infection numbers will be no problem – since they are not reported.
When the wave is through and travel restriction can be lifted, oil consumption of China will rise.
They have outbreaks in every province now – so they either put the whole country on a multi month lockdown or let it go. The first option will cause a famine shutting off all transportation.
It will not be easy to revive the Chinese economy at this point. Simple saying there is nothing to worry about after three years of equating a Covid infection with assured death will not be effective in encouraging people to venture out, especially as faith in government in very low. Household formation and fertility rates are plummeting due to demographics and the uncertainty caused by repeated lockdowns. This will keep the long overheated property market from recovering, likely forever. Multinationals like Apple are fleeing as the business climate is atrocious. China will slowly become like Russia and North Korea. A military threat but not an economic competitor. Especially given high rates of EV adoption in China, it is highly unlikely they will ever be a significant contributor to oil demand again.
Interesting comments on China.
Rather than outright decline, they may just enter a phase of much slower growth.
That leaves them as a huge economy.
On oil, China is far and away the biggest importer of oil in the world.
It will be a landmark moment when indeed their imports peak- perhaps this current 5 year period.
The beginning of the end of China’s zero-COVID
https://www.aljazeera.com/podcasts/2022/12/9/the-beginning-of-the-end-of-chinas-zero-covid
Audio file in link
; should be “interesting”.
Gulf producers lead on OPEC cuts, Saudi crude output at 6-month low: Platts survey
Attached is a chart that shows OPEC Plus November production and the cut relative to October.
The OPEC oil producer alliance shrank crude output by 700,000 b/d in November, the steepest monthly decrease since April when Russian production plunged due to sanctions, the latest Platts survey by S&P Global Commodity Insights showed.
OPEC’s 13 countries produced 28.87 million b/d, a fall of 850,000 b/d from October, while Russia and eight other allies pumped 13.70 million b/d, up 150,000 b/d.
The gap between the group’s quotas and actual production remained fairly wide at 1.89 million b/d in November, the survey showed. But this is a huge improvement compared with October, when the shortfall reached 3.273 million b/d.
In total, only 14 of the 22 countries in the coalition actually reduced production last month, the survey found.
Gulf producers Saudi Arabia, the UAE, Kuwait and Iraq led the way, with all of them carrying out hefty cuts, as demand concerns have led to a very bearish sentiment in the oil markets.
These four producers cut a cumulative total of 780,000 b/d last month, accounting for almost all of the group’s supply reduction.
Saudi Arabia cut output by a weighty 440,000 b/d, averaging 10.46 million b/d last month, its lowest since May. The kingdom significantly reduced exports and also drew steadily from its crude inventories, survey panelists said.
The UAE also saw a sharp fall in its exports, with production slumping 130,000 b/d last month, while Kuwait trimmed output by 120,000 b/d, the survey found.
Iraqi crude output fell 90,000 b/d to 4.49 million b/d in November as exports from the federal region and also from the semiautonomous Kurdistan region dipped. OPEC’s second-largest producer also drew from its crude inventories, survey panelists said.
Russian crude output continued to recover ahead of the EU’s embargo and the G7 price cap, both of which went into force Dec. 5. The sanctions-hit producer pumped 9.87 million b/d in November, its highest since March 2022, as output from Sakhalin-1 field rebounded.
Russia’s seaborne crude exports were little changed in November but flows to India surged to a record high, absorbing barrels displaced from Europe where imports sank to all-time lows.
https://www.spglobal.com/commodityinsights/en/market-insights/podcasts/oil/120822-crude-oil-price-cap-russia-china-india-opec-eu-g7-ban
Table. OPEC Plus November and October production.
Will be interesting to compare against the OPEC MOMR. The sixth column is OVER/UNDER.
I asked an AI chat bot (OpenAI’s ChatGPT) if peak oil has already happened:
John
A Non-OPEC post will go up late tonight and it will also include a chart of World oil production. It will show pretty clearly that November 2018 was a peak.
There is also another question of what is called “Conventional Peak”. According to the IEA peak production of conventional oil occurred in 2004. There is some dispute as to the definition of conventional crude. It doesn’t include tight oil and oil sands. It may include shallow off shore but not deep offshore. Regardless the game changer was US tight oil.
“AI”
Does the “I” stand for inanity?
This response is a direct quote from the Wikipedia article on Peak Oil. Word for word.
Every drilling season a few small operators return to the North slope of Alaska to try and unlock new resources. This has been going on for years and the usual suspect is a company called 88 energy. However there are others and the most recent is making big claims and attracting controversy.
Pantheon Resources: Heading Up To Alaska https://seekingalpha.com/article/4558616-pantheon-resources-heading-up-to-alaska
https://twitter.com/oilpipeline/status/1600091506102059008?t=M1CX5zcByJQxp3Fgnt1oCA&s=19
Ukraine crisis: Who is buying Russian oil and gas?
Following its invasion of Ukraine, Russia had fewer buyers for its Ural crude oil, with some foreign governments and companies deciding to shun its energy exports, and its price started to fall.
At one point earlier this year, Russian Urals crude was more than $30 a barrel cheaper than Brent crude (the global benchmark).
The discount fell to $20 a barrel cheaper in September, but increased again reaching a discount of $33 a barrel compared with Brent crude in November.
The Indian government has defended its purchases from Russia, saying it has to source oil from where it is cheapest.
Could the availability of this cheap Russian oil be affecting WTI or is it just plain low demand?
https://www.bbc.com/news/world-asia-india-60783874
A new thread reporting on August Non-OPEC oil production has been posted.
https://peakoilbarrel.com/august-non-opec-oil-production-increases/
A new open thread Non-Petroleum has been posted.
https://peakoilbarrel.com/open-thread-non-petroleum-december-9-2022/