All data for this post is from the EIA’s
Petroleum Supply MonthlyAll USA data is through July and the World data is through June 2019. All data is in thousand barrels per day.
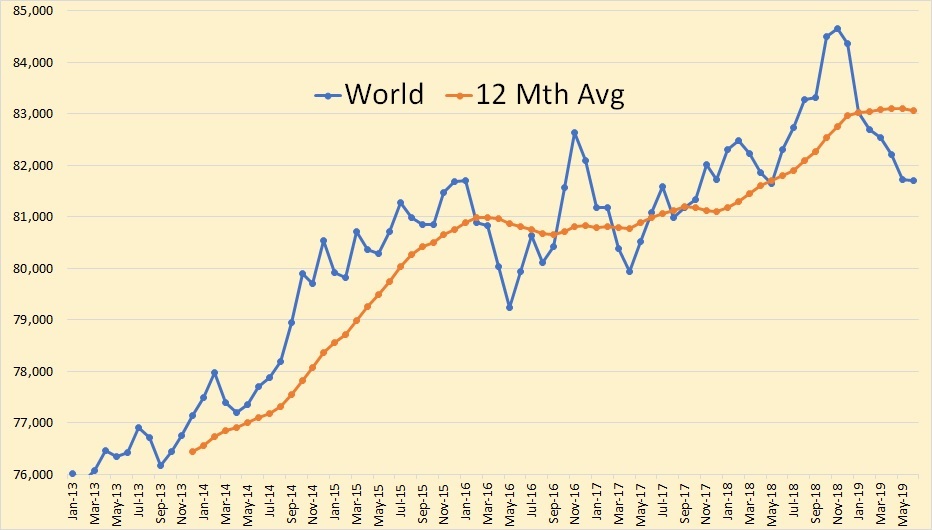
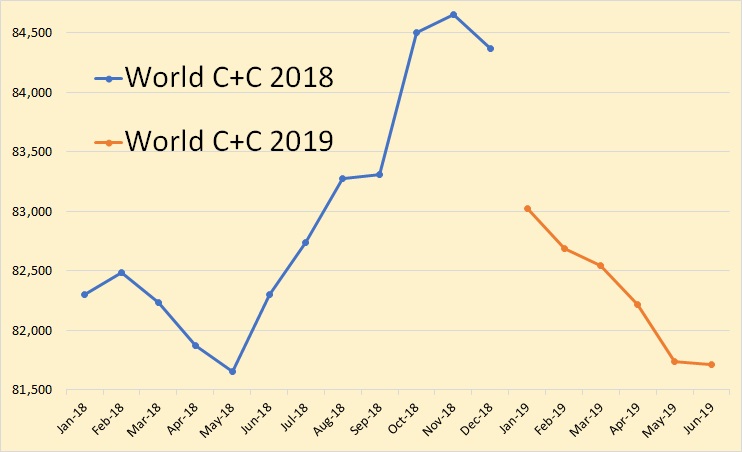
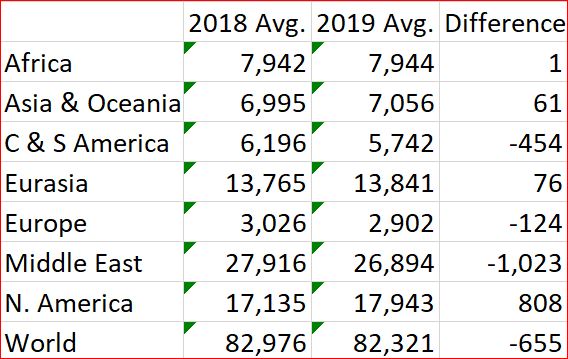
Average World C+C production for 2019 is, so far, 655,000 barrels per day below the total average for 2018. I expect July World production to be down slightly, August production to be up slightly and September production to be down again. But the average for the rest of the year will likely be around 81,700,000 barrels per day. That would put the average for 2019 at about 82,000,000 barrels per day, give or take 100,000 barrels per day.
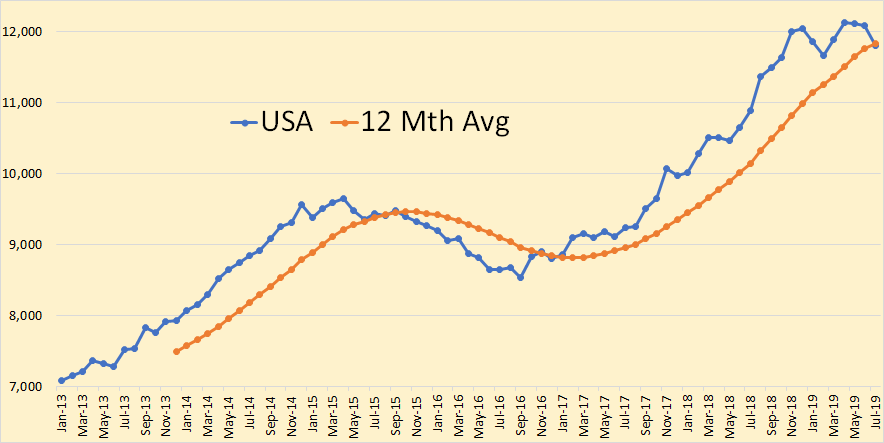
All the below USA data is through July 2019.
How bad are things in the Permian basin? You can actually book a hotel room in Midland, Texas, at a reasonable price.
A finance source I speak with contacted me this week with the news they were paying $250 a night for their room at a decent hotel chain there. This isn’t the usual sort of thing they text me about, I assure you. The reason they wrote was that a similar room had cost them about $800 six months ago – Ritz prices in a town with no Ritz.
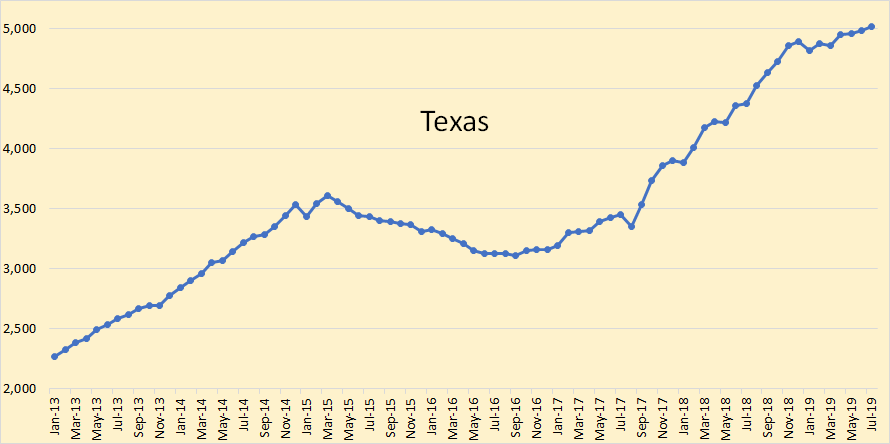
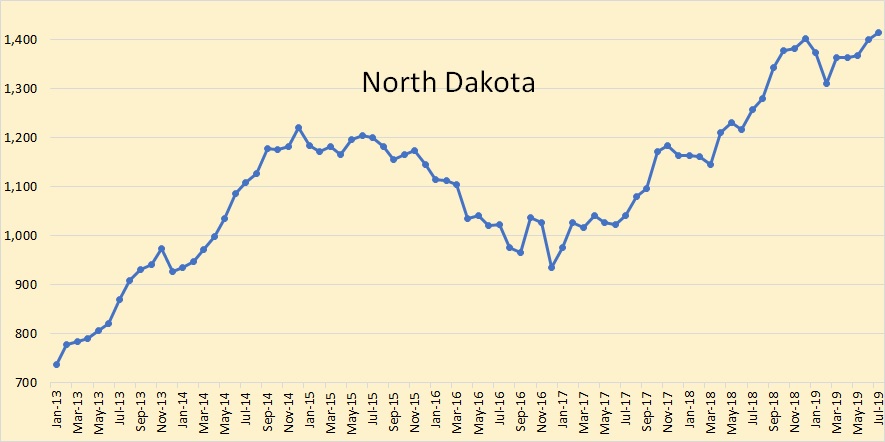
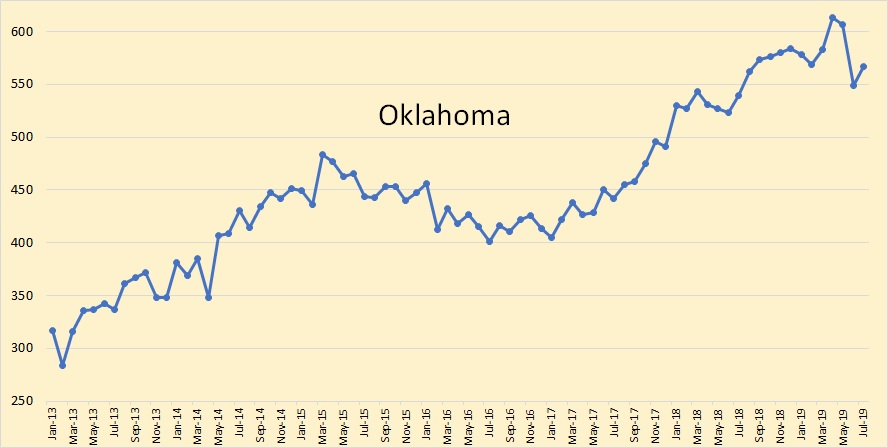
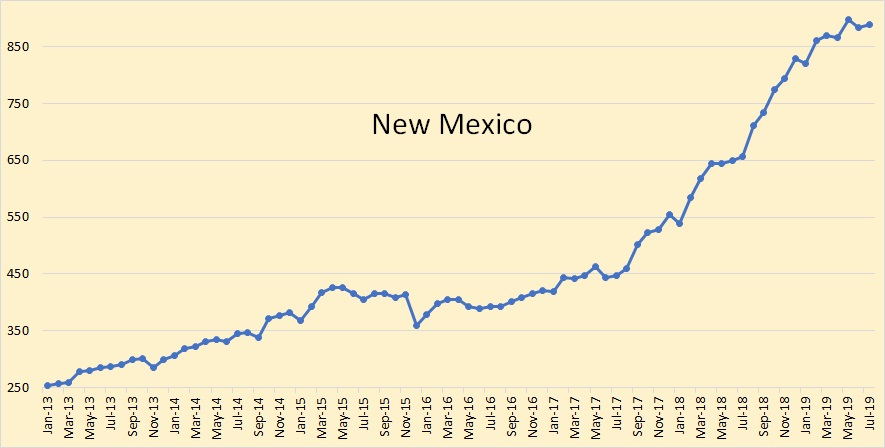
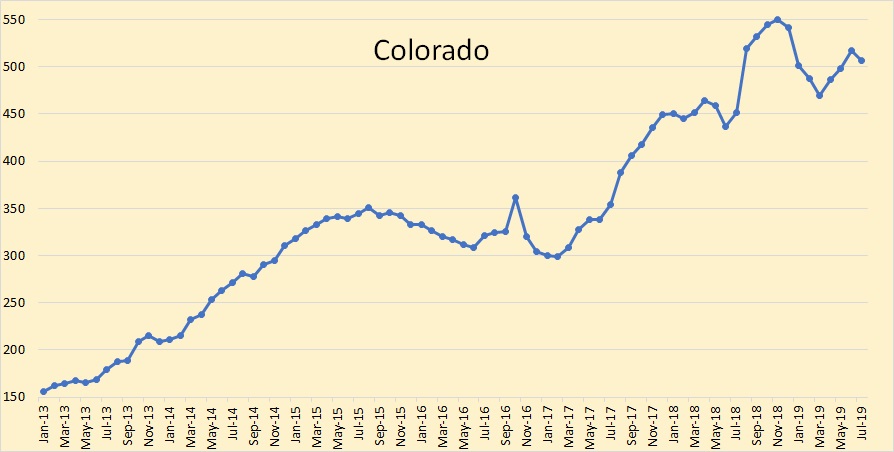
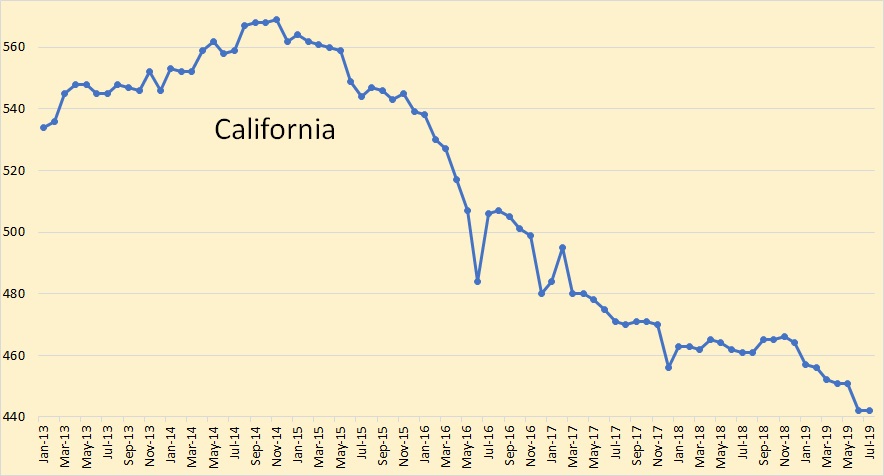
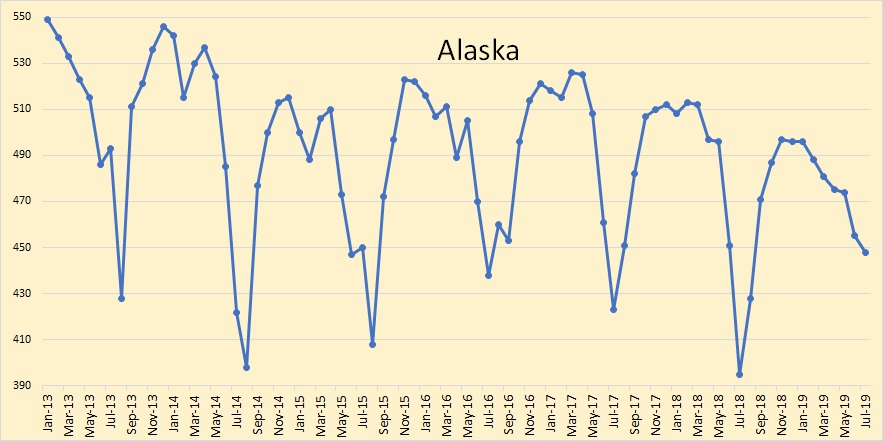
Okay, what’s happening in the shale oil patch? Well, it’s petering out. Look at every state above where the primary source of oil is shale. They are all petering out. Not just one but every damn one of them. And there are prognosticators out there, the EIA, IEA, BP and a dozen others, who are predicting shale oil to continue to rise for the next 20 years.
I, for one, just ain’t buying it.
208 responses to “USA and World Oil Production”
New post on my website
1/10/2019
The Attacks on Abqaiq and Peak Oil in Ghawar
http://crudeoilpeak.info/the-attacks-on-abqaiq-and-peak-oil-in-ghawar
Thanks for shearing Matt. Very interesting…
Matt, Very good article on the attack, its an excellent summary of the situation, I haven’t seen anything nearly as comprehensive. If anyone on this blog hasn’t read Matt’s post, please do!
It’s amazing that after such attack oil prices have drifted lower to less than prior to the attack.
One thing that is not clear to me. It appears that the way KSA has restored “capacity” is to simply go around the processing units and send unprocessed oil directly to storage while using previously processed oil to export. Is this your understanding? If so, do you have any information on volumes which are processed, aren’t processed, or don’t require processing. It would also seem very dangerous if gassy, high H2S, oil is sent to storage which is designed to store stabilized cleaned up oil.
More attacks certainly seem to be lurking.
In order to get data, you’ll have to subscribe to:
https://twitter.com/TankerTrackers
Thanks Matt,
A Hubbert Linearization(HL)for KSA from 1998 to 2018 gives a URR estimate of 330 Gb.
Historically the HL has tended to underestimate URR as the underlying logistic use to model output is likely incorrect as the data forms more of a concave up function whose slope becomes less steep over time. In short, Mr Laherrere’s 350 Gb URR estimate is likely his best estimate.
SA claims it has restored all capacity:
https://www.zerohedge.com/energy/aramco-crude-production-restored-pre-attack-levels-official-says
Don’t know what they have done, re-routing some oil to other pre-processing plants, improvisations, just welding the holes somehow, waiting for the next explosion?
Eulenspiegel,
An article at s%p global this morning reports Aramco assuring especially Chinese customers that all nominated volumes will be met but (!) grades may vary. They could ship raw crude, if that’s the case.
The Chinese have surplus teapot refineries that only take sweet light oil. So, they can not take unprocessed oil or sour oil for some volumes most likely. SA are messing with the oil markets right now, and the US are messing with the price (or are they?). The full confrontational style of Trump will hit him in the face is my feeling going forward. The lack of oil supply is a very obvoius and untold story. Weakness due to trade restrictions and too strong dollar could also be a key area.
The extent of the damage was probably exaggerated. The media likes it, it’s politically useful for attacking the Iranians, and it has the potential of driving the oil price up. I can’t think of any reason why they would play down the extent of the damage in initial reports.
“We’re getting closer to peak production and we are reaching the peak of the general physics of these wells,” said James West, a managing director at Investment bank Evercore ISI.”
US shale is peaking. Global oil production already peaked
Of course. How long ago did IEA state that regions in decline did so at 6.7%? Now that virtually every oil region is in decline (including OPEC), and the few increases are tiny and of little consequence, that function goes exponential.
Peter,
It was fields rather than regions. For large regions such as the US L48 onshore conventional output decline was about 2.7% from 2000 to 2005. From 1985 to 1999 the rate of decline for US lower 48 onshore output was about 3.8%. For offshore fields in decline the rate may be higher than 3.8%, but I doubt for most regions where the oil is produced onshore that decline rates for the region will be 6.7% for conventional oil. Tight oil may decline at that rate on a field wide basis.
A trip down memory lane to 2017
HSBC Peak Oil Report
Video synopsis
https://youtu.be/7KfVJBNX2U4
Document linked here-
https://drive.google.com/file/d/0B9wSgViWVAfzUEgzMlBfR3UxNDg/view
Great study thanks.
When weighted by output fields in decline as a whole were at about 5%, but this is expected to increase over time as fields reach their end of life and as fields on tertiary recovery regimes go into steep decline. It is not clear when this begins.
Hi Dennis, you’re welcome! Ron had posted other links to it a couple years ago in the comments when it came out. HSBC seems to have perhaps put it behind a paywall now, but I think it was free to the public when it first came out.
FWIW- I perhaps remember reading here in comments that Dennis likes to mark the peak by Month in accordance with 12 month trailing average. I like this idea too. Although, there will be a peak day, a peak week, a peak month, a peak year, hell there’s even a peak hour, a peak minute and a peak second I suppose. So far, by my eye, peak monthly data is November 2018, and peak month in accordance with 12 month trailing average is May 2019. It seems reasonable to suggest that the various peaks will be somewhat near to each other in time.
I’m not sure how one defines plateau, it’s a matter of degree I suppose, but I feel monthly data has been fluctuation within a narrow enough bandwidth, that we could perhaps say the plateau began in 2016 ‘ish; to wit, steady between 80 and 85 for approx 36 months, or between 79 and 85 for about 50-something months. Depends how flat a plateau has to be in order to be one I suppose.
Survivalist,
One definition might be +/-2% for plateau. I actually prefer the centered 12 month average, so it would be Nov 2018 for centered 12 month peak for World C+C at present and the peak would be 83114 kb/d. Using the 2% definition for plateau and assuming the average level of the plateau is 83 Mb/d then the plateau would be defined as World C+C 12 month centered average output between 81.3 and 84.7 Mb/d.
Of course the 2% definition is arbitrary, we could easily say plus or minus 1 Mb/d (an alternative arbitrary definition) or 82 to 84 Mb/d. Ron has left his “bumpy plateau” rather vague.
If we make the range large enough (say +/- 10 Mb/d) we could claim we have been on a bumpy plateau for many years.
In fact for my 3100 Gb shock model the average output from 2003 to 2043 is 79 Mb/d with output between 69 and 87.3 Mb/d and a peak in 2025, so a bumpy plateau of sorts for 40 years. That assumes 79+/-10 Mb/d defines a “plateau”.
An alternative might be +/- 2 Mb/d for the plateau which for my 3100 Gb shock model would give an 85 Mb/d plateau with a peak in 2025 and plateau of 85 +/-2 Mb/d from 2018 to 2032.
As others have suggested the exact date does not matter and the difference between 83 and 85 Mb/d will likely be of little consequence. Bottom line, we are not far from the peak and my already be on the “bumpy plateau”, depending upon definition.
Chart below uses log scale (base 10) for vertical axis.
“Bottom line, we are not far from the peak and may already be on the “bumpy plateau”,
That is the the big take home point, and secondly- how long does that plateau last (such as production holding up to at least 90% of peak)?
If that plateau holds for 10-15 yrs, we should all consider ourselves extremely lucky, from an energy supply standpoint.
It is entirely possible that some places will find it is very hard to import sufficient (to match their desired demand) supplies of oil in this coming decade.
These countries will likely become leaders in electrification of transport as a natural response to the oil shortfall.
China comes to mind, and they are rapidly establishing a dominant position in this new big (huge) global market.
No surprise here, they do take longterm industrial planning seriously.
Hickory,
For the shock model above the peak is 87.25 Mb/d in 2025 for annual output, 90% is 78.53 Mb/d and the scenario has output at 78.59 in 2036, so 11 years beyond the peak, if we want to call “plateau” from 78 to 87 the period for this model’s plateau would be 2014 to 2036 and average output over that 23 year period would be 83.47 Mb/d. Roughly 83+/-5 Mb/d.
Thanks Dennis.
It will be a lucky world of oil consumers if that level can hold up that long, IMO.
Hickory,
You’re welcome. A lower URR scenario such as my low scenario with URR= 2800 Gb peaks in 2022 at 84 Mb/d with 90% at 76 Mb/d. The plateau for this low URR shock model is 2012 to 2031 with average output over that period of 81 Mb/d and a range in output from 76 to 84 Mb/d.
I think there is about a 34% chance the URR will be between 2800 Gb and 3100 Gb and a 50% chance it will be higher than 3100 Gb for a total of 84% that the URR will be more than 2800 Gb and only a 16% chance the URR will be less than 2800 Gb.
Mr. Laherrere’s mean estimate is about 3000 Gb for World C+C URR. His estimates have tended to rise over the years (as have my own estimates).
Dennis
What decline rate are you using?
It does not appear to agree with actual decline rates we know about.
Hugo,
The shock model does not use simple decline rates. See below for several pieces I have written on this:
https://peakoilbarrel.com/category/shock-model/
an introductory piece below:
http://peakoilbarrel.com/oil-shock-model-dispersive-discovery-simplified/
Note that the book that I referenced in the post is no longer available. A detailed explanation of the model can be found in the book linked below:
https://www.amazon.com/Mathematical-Geoenergy-Discovery-Depletion-Geophysical/dp/1119434297
You may also be able to find it at a local University as below at Oxford, Bodleian Library Computer access only:
http://solo.bodleian.ox.ac.uk/primo-explore/fulldisplay?docid=oxfaleph021393883&context=L&vid=SOLO&lang=en_US&search_scope=LSCOP_ALL&adaptor=Local%20Search%20Engine&tab=local&query=any,contains,mathematical%20geoenergy&offset=0
Hickory
China are not taking peak oil seriously enough, they are just doing a little bit more than nothing.
Look at the consumption graph.
https://www.ceicdata.com/en/indicator/china/oil-consumption
For China to be prepared for peak oil by now, they would have to be selling 15 million fully electric vehicles per year, at least.
https://qz.com/1706084/chinas-ev-sales-declined-16-percent-in-august/
They dramatically cut subsidies a couple of months ago.
Hugo, I’m not sure if even one country is doing enough or taking things as seriously as the risk deserves, including China.
They do seem to recognize their risk somewhat, and perhaps this explains why they are the dominant player in this big new industry [electric vehicles]. That, or they are just better at reacting to new opportunities in industry than all the other countries.
This is also a good look at Peak Oil from Robert Hirsch a few years ago.
https://www.youtube.com/watch?v=PVoDYha8ZRM
That report was really scary. Claimed that it would go to 20-30 mbd in 2040.
However, we may be on the track. The C+C decline 2018/2019 may be around 3-5% rate; it is all obfuscated by shale. Maybe we could get diagrams without shale too, a third line, besides blue and red? 3 is a perfect number anyway…
This doesn’t jive with Exxon’s graph showing peak supply around 2040 but it does jive with Exxon’s depletion of developed conventional crude and condensate from their 2016 graph here:
Dennis
Looking at countries that have already peaked, many of them show a relatively high decline rate at first. The decline rate then slows down after around 10 years or so. Creating a fatter and longer tail.
https://www.ceicdata.com/en/indicator/norway/crude-oil-production
https://www.ceicdata.com/en/indicator/nigeria/crude-oil-production
https://www.ceicdata.com/en/indicator/australia/crude-oil-production
https://www.ceicdata.com/en/indicator/mexico/crude-oil-production
All these countries had a decline rate of over 2% and most around 3.5% to 4.5%.
Between 2020 and 2030 pretty well every country that has not peaked yet will, and almost certainly will display similar decline profiles.
The US with high decline shale could fall initially even faster.
A very real possibility is that we do not have a decline rate of 1% but a decline rate of closer to 4% for the first 10 years or so.
The reason why this high decline rate is likely is because Saudi and other Middle East giants are very old and they are holding up production with relatively small new fields. Russia is the same, using East Siberian and offshore finds.
This is why some academics who first warned about peak oil said, we needed to make substantial preparations for peak oil, 20 years before it happened. Otherwise it will overwhelm us.
Yeah, just like the energizer bunny, shale oil will just keep growing and growing and growing.
The C+C decline 2018/2019 may be around 3-5% rate; it is all obfuscated by shale.
Let’s not get over-enthusiastic. The decline in 2019 will be about one million barrels per day or about 1.2%.
1,2% without shale ?
No, total World C+C will decline by about one million barrels per day in 2019. However, without US shale your figures are pretty close.
Average US C+C in 2018 = 10,987 kb/d
Average US C+C in 2019 = 11,934 kb/d (first 7 Months)
Difference = 948 kb/d (so far)
So without US Shale total World C+C will likely be down by about 2 million barrels per day in 2019.
This is a chart created by and once posted in the comments section by Mr. George Kaplan.
George wrote a few paragraphs pertaining to his analysis. See here if interested.
http://peakoilbarrel.com/eias-latest-usa-world-oil-production-data/#comment-651548
The info on that chart that looks critical to me, is the projected world C+C exports [the declining black solid or dashed line at the bottom left].
If this is anywhere close to reality, then we are already beyond peak export.
This is going to hit the big importers hard the next 5-10 years.
Many are big allies or trading partners of the USA- think EU, Japan, Korea, for example. None are ready for this, and will have to compete with China and other very hungry (for oil) countries.
Get ready for a big geo-political shuffle.
The Asian angle on this is extremely well covered in a recent article by Matt-
http://crudeoilpeak.info/peak-oil-in-asia-where-will-the-oil-come-from-for-the-asian-century
post-script the link provided by Survivalist to discussion last Sept on this topic is very good
This site hasn’t updated in a couple years. Too bad I think. Anyway, global exports (green bit) looks pretty flat for a while now.
http://mazamascience.com/OilExport/
Only Europe has reduced oil consumption in the last 10 years.
https://www.bp.com/content/dam/bp/business-sites/en/global/corporate/pdfs/energy-economics/statistical-review/bp-stats-review-2019-full-report.pdf
The middle east consumption is 2 million barrels a day more. China has increased from 8 to 14 million barrels per day.
US shale has covered up the fact that available exports peaked a couple of years ago. Simply because the US did not need to compete for it. The imports the US had to buy have gone to China, India, Europe and internal consumption of exporters.
I would say available exports could decline by 5/6% per year by 2025. There is no way any country can reduce consumption by that much with large scale unemployment.
Courtesy of Matt-
http://crudeoilpeak.info/peak-oil-in-asia-where-will-the-oil-come-from-for-the-asian-century
The George Kaplan scenario assumed a pretty low World URR of about 2600 Gb for C+C, it used the low end of Mr.Laherrere’s estimate I think. A shock model with 2750 Gb, gives a somewhat similar result with low extraction rates.
OneofEU,
Here is World C+C less tight oil (LTO). Based on a 3100 Gb shock model scenario (3000 Gb without tight oil).
Let me sum it up:
– Rigs are 15-20% down from 2019 peak, and even more from 2018 levels
– Frac Spreads are around 20% down from 2019 peak, and even more from 2018 levels
– Completions are down 17% compared to 2018 (until August), last two month undershoot it with over 20%
– Latest Dallas Fed business activity index for Oilfield services firms slumping to -21.8 from 6.6.
Among oilfield services firms, the equipment utilization index plummeted 27 points to -24.0 in the third quarter, its lowest reading since 2016.
So – NO, based on the sum of this ACTUAL indicators it does not look very well for the shale patch, but I’m not yet on the boat that production is already declining, we will see.
Bright spots are the plenty of new pipeline capacity coming online right now in the Permian, with price dumping already taking place which will add a few bucks per barrel for the shalers, but maybe the dumping is also an indication for the ongoing slowdown (capacity no one really needs at todays pricing/activity.)
So far through August tight oil output is higher, but conventional oil output is lower in the US since the start of the year. The rate of increase in US tight oil output is much lower than last year, about 700 kb/d annual rate in 2019 vs 1400 kb/d in 2018. This is due to a slow down in the rate of oil completions.
For tight oil the increase in 2019 has been mostly accounted for by the Permian basin. If we look at horizontal oil rig counts in the Permian basin the peak from Jan 2018 to Sept 2019 was in Jan 2019 at 443 (2019/01/11) rigs and the most recent week (2019/09/27) the horizontal oil rig count in the Permian basin was 381, a drop of 14% from the high of 2018/2019. The high rig count in 2018 was 441 horizontal oil rigs in the Permian basin. August output likely reflects the rig count from the month of April at 423 rigs for the 5 week average, this was about 4% below the peak 5 week average horizontal rig count of 440 rigs in January 2019, which would have been reflected in May 2019 output.
where do you get completion data? The drilling productivity report is not very accurate, though based on the major tight oil basins (Anadarko, Bakken, Eagle Ford, Niobrara, and Permian) the DPR has completions at about 99% of their maximum from Jan 2018 to August 2019.
Can you give me a link to completion data? If you are using shaleprofile.com the completion data is not accurate past about November 2018, with the exception of the North Dakota Bakken/Three Forks.
using EIA DPR for Anadarko, Bakken, Eagle Ford, Niobrara, and Permian plays I get completions in chart below from Jan 2018 to August 2019.
Can’t quote hotel room price at Qingcheng oil field. Can’t find it on Google maps because the articles say the oilfield is in northern China. Google Maps shows Qingcheng Shan ( I think a mountain) in the center of China.
Room availability sounds like an excellent way to determine oilfield focus, as opposed to activity.
Some numbers have appeared from PetroChina concerning their estimate of oil reserves in that Qingcheng shale oil field. A bit over 2.5 billion barrels. It’s a new field and that estimate will probably change, but for now it’s nearly 1/2 Bakken. No telling what the assay will be, but it is co-located with a gas field also just recently announced. That suggests this will not be diesel rich oil.
Just start Booking.com and enter Odessa or any other boomtown in the middle of the drilling frency.
In Odessa you can sleep for 60$ a night if you want, up to 200. Nothing more with 600+.
Its a fascinating location geographically, right at the junction between two extremely distinct zones. One on side (east) you’ve got a very big and fertile valley (Szechuan) at 1-2000 feet elevation.
On the other (west) a huge mountain range- up to over 18,000 ft.
You can go from 1700 ft to 18,000 in just 52 miles.
I wonder how much of the field is under these extremely steep mountains.
Gives the idea of horizontal drilling a whole new meaning.
Generator tanks a soft target? Media blackout?
https://www.zerohedge.com/geopolitical/massive-mystery-blaze-engulfs-saudi-high-speed-rail-station
For first 6 months of 2018 average World C+C output was 82,142 kb/d and for the first 6 months of 2019 average World C+C output was 82,321 kb/d. It is difficult to predict future output, but perhaps it will be a little less for the 12 month average in 2019 than in 2018, in part this will depend on the price of oil. My guess would be 82,250+/- 250 kb/d for 2019 average output of World C+C. In 2020, I expect output will be higher than 2018.
To average 82,225 kb/d for 2019, then the next six months average would have to be 82,125 kb/d or 414 kb/d above World production in June 2019. Quite possible but I really doubt that is going to happen. Of course, you give yourself half a million barrel per day window to hit. You are pretty safe there I would say.
Ron,
as I said I doubt I can predict future oil output, doubtful I would hit even a 500 kb/d window as trends often change as has been the case at least 6 times from Jan 2016 to June 2019. Doubt that I can predict when the next change in trend for World C+C output might occur. The 12 month average trend is a bit more stable and the long term trend from 1982 to 2019 is an average annual increase of 811 kb/d each year. That trend, which has been stable over 46 years, I think will continue until 2025. Peak would be about 87 to 88 Mb/d.
I am thinking you meant 414 kb/d as 414,000 kb/d would be 414 Mb/d. 🙂
As for tight oil petering out.
Chart below has US tight oil output from Jan 2018 to August 2019. The average rate of increase in tight oil output over that 20 month period was about 1242 kb/d. For the Jan 2019 to August 2019 period, the rate of increase slowed to 975 kb/d, so a bit less than I had previously estimated. For 2018 the annual rate of increase in tight oil output was 1820 kb/d, so the 2019 rate of increase is considerably slower than 2018.
I do agree tight oil is not likely to increase for the next 20 years, the peak will likely be from 2024 to 2026 so 5 to 7 years of increase with the rate of increase gradually slowing to zero over time.
Well we know September will be low because of the Abqaiq attacks in KSA, so that makes it more likely 2019 will be lower than 2018, right? 2020 might be higher but plenty of black swan hatchlings trying to make it out of the nest…
Stephen, there is no doubt that 2019 will be below 2018. The question is just how much below 2018 it will be? Dennis is guessing it will be about 725 kb/d below 2018 average, (82,250 kb/d). I am guessing it 2019 average production will be about 1 million barrels per day below the 2018 average.
Who will be the closest? Wait and see.
Edit: It must be noted that both Dennis and I made our predictions well after the attacks on the Saudi oil infrastructure.
Stephen,
Also note that I am far less certain of my estimate than Ron who has a 200 kb/d window for his estimate and I have a 500 kb/d estimate for my window. Perhaps Ron will be closer as he said we will know in the future.
I am not too worried about the value of World output in any single year the long term 12 month average trend is of more interest.
My guess is that the probability that the long term peak in the centered 12 month average World C+C output will fall between Jan 2018 and Dec 2018 is less than 5% and there is about a 50% probability the peak (in 12 month centered average World C+C output) will occur on July 1, 2025 or later with roughly a 70% probability the peak will be between Jan 1, 2023 and Dec 31, 2027. We won’t know until at least June 30, 2028 whether my guess is correct as there have been many apparent peaks in the past that were later surpassed. I think if we have high oil prices and an annual decline rate in World C+C output of more than 2% for 3 or more years running we can be fairly certain of a peak. A long plateau in output could be confusing.
Did you notice: The value of the 12-month average for World oil production in May was 83,114 kb/d. The value in June was 83,065 kb/d. It just turned negative Dennis.
I believe the average World oil production for the last six months of 2019 will be around 81,700 kb/d. That would put the average World oil production for 2019 at around 82,000 kb/d.
Ron,
Yes I noticed that, this often happens during recessions or during low price environments as applies currently.
I think if Brent oil price remain $65/bo or less from now until Dec 31, 2019 (or perhaps the average price for Sept to Dec 2019 averages $65/bo or less), you may be correct.
I never get future oil prices right so I am less confident that I can predict future output with any precision. If oil prices rise, I think World oil output will also rise. This may not occur until 2020 or even 2021, that depends in part on the World economy, which is also difficult to forecast.
Holy moly! Thanks, Ron. No comment. It speaks for itself. But, I think everyone else realizes that it is within my predictions.
GuyM,
What is the difference between your predictions and Ron’s? Seems they are pretty similar.
Do you expect 2018 will be the peak in World C+C output as Ron does?
Dennis, I have never been absolutely convinced that 2018 will be the peak. I just think there is at least a 75% chance it will be the peak. I, of course, am certain of nothing… except …. well, that’s another story for another day.
However, I am even more convinced that if 2018 is not the peak, it will be the start of the bumpy plateau. That is, even if it is not the peak, it will be damn close to the peak. There will definitely not be an onward and upward climb of oil production as predicted by the EIA, the IEA, and Dennis Coyne. 😉
Ron,
Thanks for the clarification. A bumpy plateau is possible under a low oil price scenario due to recession, but I expect oil demand is likely to grow, oil prices will rise and output will increase until at least 2023 and possibly until 2027. My best guess is a gradual increase in World C+C output to about 87 Mb/d in 2025 at the peak, followed by decline to 83 Mb/d by 2033 and 74 Mb/d in 2040. A bit different than the EIA’s forecast.
Note that under a low URR scenario of 2800 Gb consistent with Mr. Laherrere’s low estimate from his 2018 oil forecast, a bumpy plateau at around the 2018 output level is reasonable, my medium URR estimate of 3100 Gb is fairly close to his mean estimate of about 3000 Gb. My low URR scenario peaks in 2022 at 84 Gb using a reasonable extraction rate scenario (6.4% in 2018 increasing to 6.5% in 2025) and is roughly on a plateau from 2018 to 2025 at between 82.85 and 84.12 Mb/d.
Possibly the difference in our outlooks is that I expect my medium URR scenario is more likely (3100 Gb) and you may expect a lower scenario (2800 Gb or less) is more likely. Cumulative World C+C output through the end of 2018 is about 1365 Gb so a 2800 Gb World URR does suggest a peak in 2019 or 2020 if the peak occurs at cumulative output of 50% of URR.
Our estimates are not that far apart.
The exact date of the peak doesn’t really matter to me. I’m more interested in what decisions will be made based on the realization that we are entering or have entered the final days of the oil age.
I know oil won’t suddenly stop, but if the majors are looking for ways to get their money out of gas and oil, and if transportation companies are already planning the transition to non-petroleum based vehicles and equipment, the shift is occurring even without peak being declared.
Boomer,
I agree exact date is not important, but whether it is in 2019 or 2027 may affect public perception and personal vehicle buying decisions. We won’t know the peak has arrived until a few years after the peak, particularly if there is a bumpy plateau. High oil prices and stagnating World C+C output may be a clue that the decline in World C+C output is near, also the longer the plateau the steeper the decline will be once it arrives.
“I agree exact date is not important, but whether it is in 2019 or 2027 may affect public perception and personal vehicle buying decisions.”
I think the public may be the last to perceive peak oil. I think certain companies already see it coming, but I don’t anticipate that companies other than those selling alternatives to gas and oil will announce it.
The public will grasp rising oil prices if it happens, but I think they won’t be aware of peak oil until forced to confront it.
Boomer,
I agree with that as well, once it becomes a topic of discussion in the mainstream media, perhaps people will look into it. I also agree that higher petrol prices (maybe $4/US gallon or more in the US) will be needed for anyone to pay attention.
Anybody know when the next update to the Saudi inventories is? These satellite analysts show big draw downs: https://www.ursaspace.com/single-post/2019/09/27/Aramco-races-to-finish-repairs-as-inventories-dwindle
Jodi data will be released on Oct 17th: https://www.jodidata.org/oil/. JODI data is self-reported, latest inventory data for KSA was 180mb.
In your link, URSA estimates average inventory in 2019 until the attacks as 70.3mb. That figure is for monitored inventories inside KSA. KSA have inventories in foreign countries and probably some domestic inventories that are not monitored. If that ends up to 180 in the end is anybody’s guess.
IMHO. If KSA continues to buy more crude and products from its neighbors than usual and do not supply the same qualities as usual than processing capacity is not fully restored.
Thanks, Jeff.
I didn’t check all of Saudi Aramco’s overseas storage, but Okinawa is about 7 million barrels. That’s two days of Japanese consumption.
It’s also not clear what’s in that storage. That special magical processing that was occurring at that plant remains a bit undefined. But I suppose we can presume that Saudi Arabia would not ship unprocessed oil for storage.
Anyway, tracking a draw or build of some percent of 2 days of consumption doesn’t really look like profoundly important data.
They are indeed many signs showing that US LTO is struggling (rig count, wells performance, stock market). But there are no clear signs of the amplitude of this demise.
July PSM saw LTO production increase. And we know that the August-November period is usually the most active for LTO patch. Not just from the last two years numbers, but since the inception of LTO.
I would be cautious to claim that we are at the end of the second LTO boom. Slower, yes… Down? Probably not. It’s maybe the beginning of the end…
It’s a thing of oil price and money supply.
Money supply is dwindling – and now price is falling. So less money from cashflow by pumping oil. Lot’s of drilling and frack job plans will be postponed or canceled because the lack of money.
When oil price would jump 20$, most companies will at least be able keep up drilling from cash flow. So only the big ones with the best technic and the best acres can do this.
In my opinion – if there would be a big gulf conflict with many outages and high oil prices for a few years, you would see lots of US shale growth, much more than the scenarios here. Investors will drown the companies in money when oil is > 120$ for more than a few months.
@Eulenspiegel
Yes of course… I also think that US LTO has still some potential if oil prices are high enough.
But we would not be talking about a second LTO boom if oil prices didn’t crashed in 2014… We would still be in the same boom that started in 2010.
I was just looking at the current context, and perspectives in the short term (1 year). Oil prices are down. So this could be the beginning of the end of the second boom. And a third may come later.
Tita,
I would say the boom ended in Nov 2018 when oil prices crashed, so we have seen less investment and fewer completions, but so far I would not call it a bust, simply a slowdown. What many fail to realize is that the completion rate in the tight oil sector will need to fall further in order for tight oil output to fall.
Also what many fail to realize is the the slow down in oil output in the US is in the conventional oil patch. The completion rates were higher during the run up in oil prices in 2017 and 2018, when oil prices crashed so did the number of oil completions in the conventional oil sector (L48 onshore) and this led to a fall in US conventional oil output. This fairly rapid annual decline rate in US conventional output is likely to subside by the end of 2019. Also there is the fact that a lot of Permian basin pipeline capacity has come online which will reduce transport costs for Permian tight oil producers so potentially Permian basin output could increase in response to this development.
https://www.reuters.com/article/us-usa-permian-pipeline/new-us-pipelines-poised-to-start-price-war-for-shale-shippers-idUSKCN1UY2EG
Dennis,
“Also there is the fact that a lot of Permian basin pipeline capacity has come online which will reduce transport costs for Permian tight oil producers so potentially Permian basin output could increase in response to this development”
Yes but what are or where those costs in average per barrel before the increase in capacity? A couple of dollars/barrel?
In that case they might now be able to produce a larger volume at a loss and as a bonus by doing so keeping price down for a longer time.
I think Mike called this one right many years ago it will be produced and exported at a loss and the debt accumulated will never get paid.
Even if price increases i cant see they will be able to pay down all that debt before geology runs out. (Sweet spots)
Baggen,
The transport costs get reduced from $10/b to $5/b. Essentially this is an increase in the wellhead price of $5/b. It is often the difference between a profitable well and an unprofitable well.
I have run the numbers and at an average full cycle cost of $10 million per well a gradual rise in oil prices to $90/b (in 2017$) by 2021 and oil prices remaining at that level until 2052 before gradually decreasing to $40/b by 2065 allows all debt to be paid back in a scenario where the USGS mean TRR estimate of 74 Gb is correct for the Permian basin, economically recoverable resources are about 60 Gb in this scenario.
Of course the scenario does not work at $60/b0, but I think a scenario that assumes the price of oil remains $60/bo in 2017$ is pretty far fetched.
Oil price scenario below.
Realized that was an older oil price scenario which I had modified. The correct price scenario is below where oil prices reach $90/b in 2027 rather than 2021.
Wow, that graph goes until the year 2065 ?! Almost half a century from now. And the price stays the same for three decades. One can give a hundred or more different scenarios.
Han,
The number of possible scenarios is infinite.
The idea is that there may be some long term price where price is high enough to make oil production profitable and low enough that there is demand for the oil produced. Clearly the oil price will fluctuate above and below that price in ways that are impossible to predict (essentially random noise superimposed on the flat line at $90/b). The $90/b is a guess, as is the 25 year period (2027 to 2052) where oil prices are assumed constant, probably a better guess might be 2027 to 2045 or 18 years, but this is controversial, many believe that oil can never be replaced by alternatives.
I expect there is about an 80% probability 12 month average Brent oil prices in 2017 US$/bo will fall between the 60max oil price scenario and the 135 max oil price scenarios in the chart below, an infinite number of scenarios can be created between these as well as higher or lower than the 60 max and 135max oil price scenarios. Just showing what I have assumed for my low, medium and high oil price scenarios for tight oil.
click on chart for larger chart.
Dennis,
“The transport costs get reduced from $10/b to $5/b. Essentially this is an increase in the wellhead price of $5/b. It is often the difference between a profitable well and an unprofitable well.”
I thought this sounded high if previous average was 10/b so i googled it and found this article.
https://www.reuters.com/article/us-usa-permian-pipeline/new-us-pipelines-poised-to-start-price-war-for-shale-shippers-idUSKCN1UY2EG
“Rates for most Permian pipelines have ranged between $4 a barrel and $7 a barrel for the past year because of soaring shale production and a lack of pipeline space. Some companies have turned to railcars for transport, which can cost $6 to $8 a barrel.
EPIC halved its spot rate to $2.50 a barrel on a pipeline from the Permian, prior to even beginning to load oil onto the 400,000 bpd line. The rate was “more in line with market conditions,” and will let the company achieve volumes “at a level we’re happy with,” said President Brian Freed.”
So seems a tad bit lower then 10 in average then before and about a 50% decrease in spot prices that will probably benefit those who dont already got contracted volume witch i guess most of the bigger players already have signed. But probably the spot will fall further then with even more pipe capacity so we might reach that 5 dollar/ barrel savings considering spot price then for those without long term contracts sometime in the future. So average savings will probably be quite a bit less for as long time as current contracts run then.
I know you have made a prediction before that the debt will be payed back, i just think reality will play out differently. I dont think the intention is even there to pay it back in many cases and it never were.
What average volume of oil per well have you assumed if debt is going to get payed back in your scenario, and is that BO or Boe?
In what time frame have you estimated that oil to be recovered per well, 30 years?
Baggen,
I was going from memory, which I guess is not very good. 🙂
I was remembering about a $5/b decrease in price, maybe the $7/b rail price and the 2.50/b lower price which is close to $5/b.
I assume $5/b transport cost for my Permian tight oil model, probably I should reduce that to $3/b based on that article.
For the Permian basin the average well for 2018 is assumed to have an EUR of 379 kbo and it produces for 17.4 years and is shut in at about 6.3 bo/d of output. Cumulative output is 240 kbo at 36 months, 264 kbo at 48 months, and 286 kbo at 60 months. I focus on the oil and simply assume the gas revenue offsets some of the OPEX. Average OPEX per barrel (before considering offsets from natural gas (at an assumed wellhead natural gas price is $1.50/MCF) is $13/bo. Well cost is assumed to $10 million in 2017$, annual discount rate is 10%, and annual interest rate is 7%. Royalty and taxes assumed to be 28.5% and transport cost $5/bo.
Debt is paid by 2028 and maximum debt for the play as a whole (debt assumed to be zero in Dec 2009) is 166 billion in 2017$ in 2022.
Note that the $10 million well cost in 2017$ is assumed from Jan 2010 to the end of the scenario, well cost was likely lower from 2010 to 2016 so debt over this period is overstated, OPEX, royalties, taxes, transport cost, well cost, discount rate and interest rate are all held constant over the Jan 2010 to Dec 2040 period.
Note that EUR changes from 2010 to 2018 as reflected in the data from shale profile and EUR decreases based on completion rate such that a 250,000 well TRR scenario (where economics is ignored) will result in a URR of 74 Gb which is the mean USGS estimate. The new well EUR falls from 379 kb in Dec 2018 to 240 kb in 2047 (no completions after Nov 2047). The URR for the medium price ($90/bo max price) scenario is 59 Gb and 191,900 total horizontal wells are completed.
Oil prices are the $90/bo in 2017$ maximum price scenario I have presented elsewhere in this thread.
If oil prices remain under $60/b long term then debt never gets paid back.
Dennis,
Thanks for reply, great one.
“I assume $5/b transport cost for my Permian tight oil model, probably I should reduce that to $3/b based on that article.”
Yes i think you should but probably with a delay of say 12-24 months and then a decline in transport costs.
“I focus on the oil and simply assume the gas revenue offsets some of the OPEX”
I like that.
“Debt is paid by 2028”
I agree with you that oilprice is going to increase i probably think it will go higher then you have assumed in your model, and i have nothing to protest against regarding your numbers, yet i dont think debt will be paid by 2028 even if your oil price assumption comes true.
I think reality will disappoint in the future, i think geology is going to be worse then expected and its going to happen earlier then expected also, the assumed resources wont match reality more or less.
Also i dont think even if oil price increases that it will automatically be a vast increase in profitability for the producers given the steep declines of shale that might be even worse with time the producers always get to produce in “current” price environment, what i mean with that if price goes up the oil service sector is likely to increase prices also with a bit of delay, but this delay will be a lot shorter compared to conventional production witch may get lucky and do investments in low price years and then produce for 10-20 years when prices are on a different level. Shale will more or less produce bulk in proximity to the years where investment was done. So a higer price will ofc mean better margins but some of that will be cannibalized by service sector and that together with my belief that geology will disappoint and the cost of servicing already accumulated debt will lead to end result of debt not being payed back.
8 more years and you can perhaps remind me with an “I told you so” 😛
Baggen,
Perhaps costs will increase by more than the rate of inflation in general. Note that I do the analysis in real dollars.
It is possible the TRR estimate is incorrect. Note the difference between the TRR and ERR especially for the low price scenario. 74 Gb vs 41 Gb.
If the USGS F95 estimate proves correct at 43 Gb for TRR then clearly output will be lower. Even in that case debt gets paid, remember fewer wells are drilled so less capital spending. When I get a chance I will run that scenario at the medium oil price scenario.
Note that we could think of your higher cost scenario as similar to a low oil price scenario.
Baggen,
Chart with Permian scenario described above (right axis for output and cumulative net revenue (left axis) in billions of 2017$.
click on chart to make it bigger.
Alternative scenario where only the oil price assumption has been changed to a scenario with maximum price at $75/bo in 2017 US$ from 2024 to 2056 and same as previous scenario before and after these dates. URR falls from 59 to 41 Gb and completed wells fall from 192k to 124k. Debt is not paid back until 2031 in this low price scenario and cumulative net revenue at the end of 2040 is 263 Billion 2017US$ vs 543 Billion 2017US$ in the previous medium price scenario.
Tita,
I took a closer look at US L48 onshore(OS) conventional output.
In the June 2018 to Nov 2018 period US L48 OS conventional output increased at an annual rate of 17% and from Dec 2018 to July 2019 has fallen at a 10% rate. From Jan 2017 to June 2018 US L48OS conventional oil output was pretty flat (an annual rate of increase of 0.2%) after USL48OS conventional fell at an annual rate of 12.6% from Jan 2015 to Dec 2016. From Jan 2011 to Dec 2014 US L48OS conventional rose at an average annual rate of 3.7% per year.
Output of conventional oil is more sensitive to the price of oil than many that are not in the oil industry appreciate.
Increased cooperation is the best recipe for overcoming intensified uncertainties and heightened volatility on the global oil market, OPEC Secretary General Mohammad Barkindo said this week, inviting all 97 oil producing countries in the world to join the OPEC/non-OPEC alliance that has been managing oil supply in the market over the past nearly three years.
https://oilprice.com/Energy/Energy-General/OPEC-Chief-Invites-All-97-Oil-Producers-To-Join-OPEC-Coalition.html
A very interesting read:
U.S. shale oil boom ends as lower prices take toll: Kemp
LONDON (Reuters) – U.S. oil production growth is decelerating gradually in response to lower prices, which should reduce predicted over-supply in 2020 and force the global oil market back toward balance.
Domestic crude production fell 276,000 barrels per day to 11.806 million bpd in July, according to data published by the U.S. Energy Information Administration on Monday.
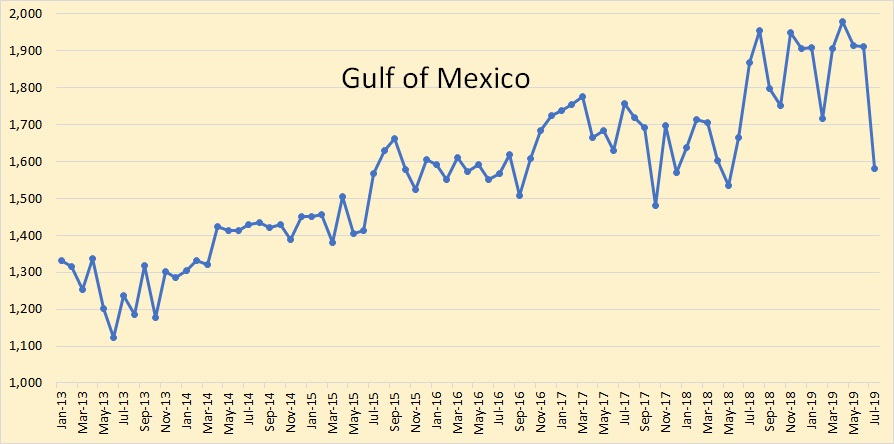
The month-on-month reduction was entirely attributable to the Gulf of Mexico, where output fell 332,000 bpd, because many offshore platforms were shut due to the threat from tropical storm Barry.
Onshore production from the Lower 48 states, much of it from shale plays, actually increased by 63,000 bpd to a multi-decade high of 9.778 million bpd (“Petroleum supply monthly”, EIA, Sept. 30).
Even onshore, however, there were signs the frenzied production growth of 2017 and 2018 has run out of momentum, as shale firms throttle back in response to lower prices (tmsnrt.rs/2o8imVk).
Onshore output was up by 1.149 million bpd in July compared with the same month a year earlier, but growth has slowed progressively from 1.900 million bpd in August 2018.
Of the major oil-producing states, Texas has reported the sharpest and most consistent slowdown, with more gradual decelerations in New Mexico and North Dakota.
There is more to this article by Kemp, but you will have to go there to get it.
Ecuador leaves OPEC at the end of the year.
OPEC Is Dead: What’s Next?
Keith Kohl Photo By Keith Kohl
Written Oct. 02, 2019
The dominoes are falling all around OPEC.
In three months, the 14-member group of oil exporting countries will be down to 13.
No, it really shouldn’t come as a shock to us.
I’ve told you before that OPEC as we know it is dying. The cracks in the oil cartel have been showing for years, and for us it’s only a matter of time before it collapsed.
How could anyone NOT see this coming?
One of the first red flags occurred back in 2015, when Indonesia was re-given its membership card — despite the fact that it didn’t export a single drop of oil!
For the record, Indonesia had been a net petroleum importer since around 2004. The country just couldn’t adjust for the fact that its crude consumption had soared over the last two decades.
It didn’t last long.
Indonesia was kicked out less than a year later.
When Qatar left OPEC on January 1, 2019, most people looked the other way because it wasn’t a major oil producer anyway. Although Qatar is the largest LNG exporter, it was disgruntled over Saudi Arabia’s control of OPEC.
Now we know another OPEC member is making a run for the exit.
This time it’s Ecuador.
And it couldn’t have left at a worse time for the group.
This announcement was incredible [huge oil discovery revealed]
I just got off the most exciting conference call in recent memory.
A tiny Texas oil company just discovered $185 billion worth of oil under their land. That’s more than 1,200 times as much as this little company’s market cap, or $2,500 worth of oil for every $2 share of this company’s stock.
That’s right — you can still grab shares for $2 each — but that won’t last long.
Go here for the full story.
So Long, and Thanks for No Oil
Yesterday, Ecuador’s Resource Ministry announced the country was leaving OPEC.
According to them, the reason was due to deeper issues and internal challenges regarding its fiscal sustainability.
We’re not talking about the biggest fish in the OPEC tank, mind you. Ecuador only extracts roughly 540,000 barrels of crude oil per day.
That’s a little more than Colorado’s current production.
In fact, Ecuador only contributed about 10,000 barrels per day to the production cut deal… and only achieved 5,000 bbls/d of that amount last month.
So they’re really only a drop in the bucket to the group’s combined output of 28.9 million barrels per day, but one has to wonder, “Who’s next?”
The answer may be a little more unsettling than you might think.
Perhaps Venezuela is next on the chopping block.
After all, Venezuela’s oil production has been in free-fall for well over a decade, with output falling to around 670,000 barrels per day in September.
I don’t think it’ll be long before another crisis hits Venezuela’s beleaguered oil industry. I’m afraid that one day in the near future, we’ll be talking about PDVSA’s production falling to zero.
From the way things have been going lately, however, Maduro may not be next in line to fall from OPEC.
EIA weekly oil inventory and production has just been posted. Lower 48 production for the week of September 27 is estimated be be 11,900 kb/d. This production level was first achieved on the week of May 31 and then on July 5. While production was estimated to be 12,500 kb/d during the week Aug 23, today’s number implies the increasing challenge to grow production in the lower 48.
Inventory increased by 3.1 M bbls. and the price of WTI has dropped by $1.16 to $52.46. Not conducive to growing production further.
Now the falling WTI price has already wiped out all pipeline gains for Permian – so no earning barrels full of money as hoped. The cheaper pipeline fees already gone.
And when the pipelines aren’t filled – I hope the pipeline companies have long running cheap credits they don’t have to pay the next years.
Posts not appearing again.
Watcher, I found your post in the trash file. I don’t know why it was there but make sure you are not sending it there yourself.
How does one do that? I see only a Post Comment button. I don’t see a Send To Trash File button.
I thought it was the presence of the word “boom” but other comments above have the word. This happened a few weeks ago, maybe from presence of a URL link as the very first line. But probably not.
Dunno.
No, that was not it. No word will kick your comment to the trash. Nothing should do that. URLs will put a new user’s post in the spam file, but not into the trash file. But if it happens again just let me know and I will pull it out and post it.
Pipeline companies will reduce their prices until pipes are filled. You are correct, prices are low and at some point they fall to a point where fewer wells are completed and eventually the completion rate may fall to a level where output decreases. This may have already occurred in some tight oil plays and is already true of conventional oil in the US.
Future oil prices are difficult to predict, but I am skeptical that they will remain low for the next 12 months.
Seems L48 and US shale play have reach the top production for this 50-60 WTI usd world as the Pioneer Mark Papa told in 2018. The best of US shale is already past as the sweet spots was used..
Than as EIA , Rystad have stated the rest is up to the oil majours they veliece will invest trillions of dollars in new wells , exspansion , refineries in a Buisiness they have told still is highly profittable ecen with oil price below 40 usd WTI. That remain to see…
Freddy,
I believe a low price environment could result in an earlier peak for US output, perhaps 2023. Although I remain skeptical of a long term low price environment, one possibility is that OPEC/Russia decide it is too risky to hold back output for fear that high oil prices will speed the transition to alternative forms of energy for transportation, particularly land transport.
Although I believe it is a low probability scenario, the thought is that OPEC/Russia go for maximum market share and produce all out driving oil prices to $50/b or less.
US tight oil producers and likely many oil sands producers will not be profitable at oil prices under $60/b so unconventional oil output would be much lower than my typical scenarios in such a low oil price environment.
Currently I believe there is less than a 1 in 10 chance such a scenario would play out prior to 2035. There seem to be cracks in OPEC these days, if it falls apart, the scenario likelihood rises to 1 in 4.
Y’all need to get your definitions in order.
What is a boom? If oil production were increasing, and it was taking place as a consequence of the use of robots and automation, no one would call it a boom. If oil production were decreasing (or increasing), but employment was strong and there was lots of visible activity of trucks driving around, that would be a boom.
If output from the fields is increasing but at a lower rate than previously, this does not have anything to do with whether or not a boom is underway or finished.
Only the human activity around the field determines a boom. If it is intense and frantic there is a boom. If not, no boom.
There is also a bizarre bit of phrasing we are seeing in the articles of oil pundits. “Oil production growth is slowing . . . In response to lower price.” Absurd. Contrast this with “oil production growth is slowing.”
See the difference?
Iraq as the next Libya?
https://www.reuters.com/article/us-iraq-protests/gunfights-rage-in-southern-iraq-protests-spread-nationwide-idUSKBN1WH0YF
What, Iraq just produces about 4.5 million BOPD. Little to no effect on world oil supplies if they have a civil war.
Heck, prices dropped after KSA was bombed.
Per Wall Street, US will just pump the shale wells faster.
No biggie.
2nd consecutive month EVs just posted a Y/Y sales decline. This won’t move NYMEX either.
There doesn’t need to be a rationale. Personally I am watching the BoJ, who Sunday night suggested a reduction in QE. That nudges a flight to safety, and oil is not safety.
The key is somewhat to reject most things you hear, particularly any references to economic history. There is QE in most of the world and the US may restart soon at which time it would be in all of the world. That ain’t capitalism and all oil price history, along with all other history, can be safely ignored. Might also want to track down all the historical precedents for 5% GDP deficits in the US. Maybe 1? 10 yrs ago?
Those who ignore history are doomed to repeat it? Ha. People will be desperate to have that doomed history reappear in the not too distant future when the gas station lines form, and price hasn’t moved.
They won’t stand in lines. They will order gasoline on Amazon, delivered to their doors by drones.
Amazon Prime customers can be bombed thus with no charge for shipping.
Watcher,
Likely there were big government deficits during World War 2 and perhaps the Civil War.
Well, first of all there are no huge war expenditures underway. Afghanistan spending last year was sub $200million.
DoD spending in general 3.2% of GDP and that spending is GDP growth positive. Not to mention some of that has definition issues regarding VA benefits — which is spending that is not funding current defense. KSA spends 8.8% btw. Russia 3.9%. Neither count their oil assets as a GDP segment (and note what Norway’s SWF recently did in their portfolio wrt North Sea **assets** as a balancing parameter.)
But second and third of all, it’s a legitimate inquiry, and here’s the deal. The Civil War has its own definition issues in GDP. So a deficit as % of GDP measurement is shaky, not to mention loss of such a big chunk of agricultural territory in doing the measurement, and loss of the asset value of slaves. But in general, the Civil War wasn’t a huge economic reality because of the Comstock Lode in Nevada. Gold and silver were available at $23/ounce (decreed price) to back the currency. Nevada somewhat funded the Civil War. A lot more “flow” than California’s ’49ers were doing because panning was not efficient. The shiny metal moved east. Both states were states before the war ended. (probably because of the flow, Calif in 1850 and Nevada in 1864)
Civil War era deficit to GDP measures get to 10%, but GDP definition then was different and the numbers are almost certainly not legitimate. Post Civil War govt expenditures had a bigger problem because Congress people voted pensions for everyone who had fought and most of them claimed injuries (that they did not have), but those expenditures went straight to GDP growth with no moderation in the equation, so . . . pretty much the only legitimate measurement is gold/silver flow out of Nevada and how it greatly increased US GDP and changed the deficit/GDP ratio. There was a surprising sharp increase in US exports during the war (some of it gold at global prices for a profit).
Similar definitional things exist in WWII. The measurement of GDP was different from now. You can find 30% deficit/GDP ratio quotes, and you can find 4%.
GDP growth 1941 to 1945 was 18%/yr (lets give that some !!!! marks).
Oil flow out of California and Texas did not get into GDP the way Nevada silver/gold did. We just don’t have legitimate measurements for then. And note there was still a gold standard at decreed $35/ounce, so even the definition of dollar is a question mark.
The most profound item in the matter is how increases in government spending during war events actually spiked GDP growth. They were the ultimate form of fiscal stimulus. It was stimulus that stimulated. We now have 5% GDP fiscal stimulus (deficit) that generates 2% GDP growth.
Watcher,
Population needs to be figured into your calculations. Currently population is growing more slowly than earlier periods in the US so one need to look at real GDP per capita. We could raise taxes or cut spending or both and that would reduce the deficit. Tax the wealthy and it has little effect on GDP because the wealth simply is saved and does little to stimulate output.
Checked deficit and I get about 4% rather than 5%, the Government deficit to GDP was higher during the 1983 to 1986 period than today. Though the worst period was 2009 to 2012 over the 1960 to 2018 period, the average over that period was 8.3% with a high in 2009Q3 of 9.8%.
FY 2019 deficit 1.09 Trillion
https://www.thebalance.com/current-u-s-federal-budget-deficit-3305783 Maybe you grabbed a number lacking September
US GDP20.49T 2018. X 1.025 = 21T the 1.025 will revise all the way out to April (and indeed years from now back revisions), but that’s a probable 2.5% growth for 2019 and 21T it is.
1.09 / 21 is 5.2% fiscal stimulus and that’s the goal post position not 4%. Good luck finding non crisis periods
Watcher,
I used
https://fred.stlouisfed.org/series/NA000334Q
and
https://fred.stlouisfed.org/series/M318501Q027NBEA
Federal Government budget data only available through 2018Q4.
Projections are often wrong, so we cannot say much about 2019 until taxes are collected in 2020, data might be in by July 2020.
Note I am using data (2018 where we know what has occurred), you are citing a projection as fact, tax revenue for 2019 is unknown until July or August of 2020 when most tax returns have been filed.
Watcher,
Nobody counts assets as a part of GDP. Income is GDP, a flow of money, an asset is a stock of wealth. Nobody counts assets in GDP, that is not the way it is done.
See
https://en.wikipedia.org/wiki/Gross_domestic_product
Assets lost are a loss. Just like oil depletion. Just like real estate depreciation. It’s negative income. Trading of assets too and fro generates income or loss. If the asset is lost altogether, there will be a loss of income from sales of that asset vs last year. It will look like negative production.
Same thing appears in GDP from crop failure. The crops can’t be sold like they were last year. It’s negative income wrt last year. Drags down growth.
Watcher,
One looks at changes in assets for GDP, that is a flow.
You seem to have trouble with the difference between a stock and a flow.
Only problem is when FED does QE for any extended amount of time oil goes above $100. That doesn’t happen when other CB’s do QE. Any new FED QE can’t have the same effect on oil price as it did last time. So we are talking watered down QE at best which will highly disappoint markets.
Shit watch payroll data tomorrow. My guess is WTI will make a quick trip to trendline support which is somewhere between 46-47$ if payroll data shows a contraction.
Then next week China will reject Trump’s trade deal. Technicals have all along been pointing to a move to the $20’s for WTI, don’t mean it’s set in stone or has to happen. But that is the way the charts read.
Certain European countries will likely impose a few tariffs on the US before months end also.
There is one way to get a weaker dollar. That’s if US equities head south. And technically all 3 major US indices are set up for a fall.
Trump painted himself into a corner with this trade war. Doesn’t matter whether or not you agree with it or not. He can’t back down and out of it when they tell him no deal. He has to up the ante. And up the ante he will.
I keep expecting Trump to declare victory with China and Europe and drop the tariffs even if nothing has changed. He has a habit of doing that. His supporters won’t know the difference. They’ll believe whatever he tells them.
Yes, as usual, the oil markets responded in a way I never would have guessed. I could be a rich man if I just bet on oil in the opposite direction of the way I thought it would go after such events, but I doubt I have that discipline. Markets seem to be only pricing in the odds of a recession and not any geopolitical stuff…
I think the Arab Spring numbed traders to worries about political risks in the Mideast. They used to get super twitchy every time something happened over there that made it to American TV news. Now they just look at demand numbers.
The crowds appear to be Shiites and the counter terrorist squad are part of the Iraqi government which I understand is Sunni based. Is this a part of the ongoing Saudi Arabia – Iranian proxy war?
Iraqi government is also dominated by Shia.
OPEC exports were down in sept by 736 Mbbl/day, particularly those heading for US. KSA made up slightly more than half of the drop. This should affect inventories in a few months time.
From bloomberg: https://www.bloomberg.com/news/articles/2019-10-02/opec-gulf-tracker-flows-shrivel-after-saudi-oil-plants-attacked
“Observed flows from Saudi oil terminals were down month on month by 394,000 barrels a day, or 6%. The additional shipments needed to meet the kingdom’s commitments to its customers may have come from stockpiles built up in Rotterdam, Sidi Kerir on Egypt’s Mediterranean coast and the Japanese island of Okinawa.”
“Flows to the U.S. slumped in September, with shipments from Saudi Arabia falling to just 100,000 barrels a day, down from 1 million barrels a day during the same month last year. Last month’s figure may yet rise, if some of the 14 million barrels of crude heading from the kingdom to unknown destinations eventually go to the U.S”
Sometimes you find an article on the net that is so full of bullshit it just blows your mind.
‘The Horse Is Out Of The Barn’ For Aramco’s IPO
Summary
Saudi’s MbS is in a hurry to launch the Aramco IPO.
But a new study argues that the long-term price of oil will drop to $10 to $20 per barrel.
Europe’s electric utility industry is transitioning rapidly to renewables.
Governments worldwide are making strides to adopt renewables.
The market’s appetite for long-term fossil fuel investments has waned.
Now I know this story will warm the hearts of many contributors to this blog. And I truly wish it were true. I wish we would get completely off fossil fuel, and soon. And I am truly sorry when I say: “It just ain’t gonna happen.” We will convert to all renewables when we run out of fossil fuel.
I have complained about the environmental destruction of our planet for half a century. Others have also sounded the alarm. But nothing has been done. The destruction has not wained, it has increased. It is all about human nature but I will not go into that again here.
Yes, renewable use has increased. But fossil fuel use has increased even faster. The price of oil will go up, not down. The destruction of the environment will get worse, not better. Fossil fuel use will increase as long as the supply continues to increase. When the supply starts to dwindle, then fossil fuel use will dwindle in lock step with the supply… and not one day before.
Ron,
I disagree. There will come a time when prices for fossil fuel will fall due to lack of demand. In 1900 the United States Leather Company was one of the largest in the US, it went out of business in 1952 and it was not due to a lack of leather supply.
https://en.wikipedia.org/wiki/United_States_Leather_Company
I agree the price of oil will likely rise and the higher they rise the faster the transition to electric land transport will occur. Likewise, rising coal prices are leading to a switch to natural gas for electric power and eventually natural gas prices will also rise (likely around 2030 as the peak in 2035 is approached) as that occurs and the price of wind power and electric power continue to fall the growth in EVs, and wind and solar power will overtake fossil fuel to the point that demand will fall below supply and prices will fall, probably around 2035. In the mean time, I agree the environmental damage is likely to continue.
Dennis.
You have cited this company without really telling what happened. You infer the company went BK, when in fact the wiki article states the company went through an organized liquidation. The shareholders received cash, plus shares in, ironically, an oil and gas subsidiary of the liquidated parent.
The subsidiary was then sold, with shareholders again receiving cash and undivided interests in fee minerals which appear to be in the Marcellus shale formation.
From the Wikipedia article, I cannot tell how much shareholders made or lost. As always, probably depends on when shareholders bought and sold.
It would be interesting to know more financial detail regarding this company.
shallow sand,
Correct, I should have said they went out of business (actually that is what I said, did not mean to imply bankruptcy). The point is that it was a business that was no longer viable. Not much detail on the company it was removed from the Dow in 1928 and as of 2007 was the only member of the original Dow 12 to have been liquidated. I provided the link to the Wikipedia entry because that is all I know.
Generally when a company is liquidated it occurs because it is no longer a viable ongoing enterprise. At some point, maybe in 2075 we may be saying the same about Exxon Mobil or it may exist as a shadow of its former business like Kodak and Sears.
Dennis, your leather company is really an awful example. Liquid fossil energy came along and the horse and coal-powered economy just could not compete. There is no cheap and easy replacement for portable liquid fossil fuel. Air and sea travel will be totally dependent on liquid fuel as long as they exist.
However: Renewables Will Make Up 50 Percent of the World’s Energy by 2050
That is really nothing to cheer about. Peak oil will be history in 2050. But energy demand will continue to rise while the oil supply continues to decline. In 2050 we will be consuming every barrel of oil we can possibly produce. And the price will not be cheap, not by a long shot.
Even if wishing that half the world is powered by renewable energy in 205o you are only wishing that renewable energy will replace liquid fossil energy as fast as it declines.
Hi Ron,
The example is indeed imperfect because the leather industry moved to other nations, like textiles, shoes, and other clothing which is mostly made in other nations, probably had little to do with buggy whips and saddles as we still use shoes and belts, etc, though synthetic materials have replaced a lot of leather use. In any case cheaper alternatives are likely to reduce demand for fossil fuel over time, just as synthetic materials may have reduced much of the demand for leather products.
I have run numbers with reasonable assumptions. Supply is using my medium URR (3100 Gb) scenario and assumes demand is equal to supply, I assume oil used to produce liquid fuel besides gasoline and diesel remains flat, either due to demand destruction from high oil prices or greater efficiency. For land transport (the main use of C+C) I do an EV scenario where autonomous vehicle approval is not assumed (that makes the transition at least 3 times faster when it arrives).
Chart below has a “high demand/slow transition” and a low demand/fast transition” scenario and the average of the two scenarios compared to a no transition scenario which I call “supply”. Clearly demand cannot be higher than supply, but it can be lower which occurs in 2029, 2037, or 2043 for the different scenarios, by 2070 there will be a need to reduce demand from air and water transport, but 50 years is a long time to innovate and we can choose to use less if fossil fuel prices are too high.
Also note the renewable question is separate, the electricity for EVs can come from natural gas, nuclear, power or coal.
Renewable electric power has grown at a very fast rate based on BP Statistical Review of World Energy consumption numbers.
Wind grew at an annual rate of 14% per year from 2013 to 2018. Solar power grew at 28% from 2013 to 2018. If these rates of increase continue until 2032 and the rate of increase from coal and natural gas continue at the 2007-2017 rates of increase then all coal and natural gas power generation would be replaced by wind and solar by 2032.
Rates will undoubtedly be slower than this, but replacement of at least 50% of power generation from fossil fuels will be very likely. For home and water heating as natural gas prices rise heat pumps will replace natural gas boilers and water heaters, also homes will be built with more insulation and better sealing and windows and doors as well as utilizing passive solar design to reduce energy use. There is much that can be done and higher energy prices will be the incentive that drives these changes, good public policy can help.
The EV and renewable power will replace fossil fuel energy use just as iCEVs and oil replaced the horse and buggy. My grandfather was a local delivery man in Ireland before he came to the US, he used a horse and buggy. I imagine he thought in 1910 those new fangled infernal combustion engines would never replace his horse.
When he was older he drove a bus. 🙂
Water transport can use wind or nuclear power, air transport perhaps biofuel for takeoff and batteries for cruising, or there may be a number of solutions that neither of us has envisioned.
Some considerations on replacement jet fuel can be found in paper linked below from 2016,
https://www.nap.edu/read/23490/chapter/8#79
I imagine high jet fuel prices will lead to more intensive research.
Dennis, it’s not just EVs, it’s everything. It planes, trains, automobiles, ships, and a thousand other things petroleum is used for. Your scenario, using only EVs, is almost comical.
Right now, petroleum use is increasing much faster than solar and wind is increasing. I don’t expect this trend to reverse anytime soon.
There are a lot of petroleum based raw materials used to manufacture a Tesla Model 3, and other electric and ICE vehicles.
Likewise a lot of the other raw materials in both EV and ICE require a lot of petroleum for mining, manufacturing, transport to the auto factory etc.
Just as petroleum is used quite a bit by both the wind and solar industries.
Yes, transportation fuel is the big one. But google the uses for petroleum. Some surprising ones.
Yes, there are some surprising ones.
But…do you know any chemical engineers? I’d be surprised if you didn’t. So, ask them: how hard is it to convert plant based hydrocarbons into feedstock for plastics, and all of those other things for which we commonly used petrochemical feedstocks?
Now, if that’s not so hard, then the remaining question is: how hard is it to satisfy the scale of feedstock needed? And…that’s where we get back to the question of relative market share: if an application of oil is small, then biomass can handle it.
true Nick, the list of synthetic materials you can derive from just soybeans is huge, but you hit the crucial question when you mentioned scale-
“then the remaining question is: how hard is it to satisfy the scale of feedstock needed?”
Lets keep it simple- extremely hard is the answer. Try providing the feedstock without petrol to drive the whole process (ever grown 640 acres of soybean without petrol? What was your net yield and were you able to pay wages to all the dozens of laborers? How much land was devoted to the work animals?) Feasibility for ‘at scale’ is very weak. If expectations for various end products drop by 90%, then perhaps we could give it a shot.
And to the point Shallow brings up- yes indeed. Many of these non-transport (especially light vehicle transport) uses of petrol will be critical and irreplaceable long beyond the time when electric vehicles dominate the worlds roads. Indefinitely.
Gas would be possible.
First natural gas,
later biological gas from mostly agrar waste substances or much more efficient green feed.
Here they create electricity with this stuff, but I thing agricultural machines would be better on the long run. A bit like feeding your tractor with cow dung.
Even with your soy beans 90% of the biological substance isn’t sold. Fill this in your tractor.
Can you imagine a future with ‘classic EVs’ for restoration?
Open your garage thirty years hence and discover a pile of oxide and sticky chemical residues.
At least oil has a preservative effect on metal, which sometimes helps turn IC wrecks into valuable vintage vehicles.
Not so with EVs, I fear. Turns restoration into HazMat disposal.
Someone took a look at car sales and found that all cars saw a reduction in sales year-over-year for September.
But the percent decline was not the same for conventional vehicles versus electric. It looks like conventional car year-over-year decline for September was about 12%. And over 40% for electric. Don’t know if that was US only or global. Probably the former because of data availability so soon after end of September.
Second consecutive month of this. Third for US sales. Maybe oil scarcity is first showing up in electric vehicle parts. That would be amusing.
Tesla set an output and delivery record in 2019Q3.
In the third quarter, we achieved record production of 96,155 vehicles and record deliveries of approximately 97,000 vehicles.
https://ir.tesla.com/news-releases/news-release-details/tesla-q3-2019-vehicle-production-deliveries
Losing money on every sale but trying to make up for it with volume.
Tesla will report third-quarter financial results in about a month.
The company claims to have delivered a total of 97,000 vehicles, up about 2% over the second quarter. Tesla is a long way from the 500,000 vehicles Musk promised early this year to produce in 2019. At one time, Musk had talked about building a million cars a year by the end of 2020.
Tesla wrote in the 2019 second-quarter delivery report “we reaffirm our prior guidance of 360,000 to 400,000 vehicle deliveries in 2019.” That statement did not appear in the third-quarter report.
While deliveries did rise, the company faces revenue and margin problems. The Model S sedan and Model X SUV, whose prices can easily exceed $100,000, deliver higher profit margins than the Model 3. As the less expensive Model 3 gains favor over the S and X, the company’s average selling price declines, affecting revenue growth. According to Factset, Tesla’s average selling price for all models declined from $97,600 in December 2018 to $55,600 in this year’s second quarter.
https://www.latimes.com/business/story/2019-10-02/tesla-reports-small-sales-growth-for-the-third-quarter-wall-street-isnt-pleased
Survivalist,
A growing capital intensive business is a tough one to be profitable in early on.
The estimate was 350k to 400k cars produced in 2019.
They expected to be at a 500k annual rate at the end of year.
That would be a weekly rate of about 9600 cars per week. They are still ramping production the Giga factory 3 may help a bit by Dec.
Shallow sand,
If one looks at World C+C production and World gasoline and diesel production, about 65% of World C+C was used to produce gasoline and diesel fuel, most of this is likely used for land transport. (Air transport uses jet fuel and ships mostly use residual fuel). I mentioned that I assume use of C+C that is not petrol or diesel (gasoil) remains flat.
If we look at the data from 2000 to 2018 the trend is indeed flat, so I assume that trend continues and focus on replacing gasoline and diesel.
Mining can be done with electric vehicles, I do not assume petroleum falls to zero in my EV scenario, output is 40 Mb/d in the average scenario in 2060. The point is that we need to do something when C+C output declines.
Wouldn’t you agree?
What do you envision?
Dennis.
I think I have posted before that I am bad at predicting the future of oil.
Clearly this is true, if I could predict anything I would have had us sell everything we own in oil and gas, except for royalties and our handful of “Saudi” LOE leases, in the year 2013.
My prediction is there will be a long, slow, transition away from oil, similar to coal, with no energy investors making much money on any of it, with some CEO’s and other top management making multi-millions a year, and with governments paying big subsidies for most of it, just like they do for agriculture.
I have tried to figure out what wind and solar investments to make.
General Electric has been big in wind. It has been one of the worst investments I have ever made.
I can’t see that any of the pure play wind and solar companies are much better.
I guess I feel that Watcher isn’t as crazy as most here believe.
KSA just took a direct. Further, before this hit, we learned that KSA’s largest field has declined much more than most thought.
Iraq is on the brink of civil war. Iran is very unstable. Venezuela is on its last legs. Libya is still unstable. US and Canadian producers haven’t made money in several years. The oil service companies are in tatters.
It wouldn’t surprise me at all if someday there is a serious fuel shortage and prices for fuel are very low.
Thr world financial system is a mess.
Understated, but yes.
Shallow sand
If free markets continue to exist I finf it hard to imagine low prices and shortages. Perhaps you envision the Soviet States of America, I am highly skeptical of such a scenario, only nutters like Limbaugh believe that nonsense.
“I have tried to figure out what wind and solar investments to make.”
there are some good ways to invest in this industry. here are few stocks as examples-
NEE (big utility with heavy renewables portfolio)
ENPH, SEDG (solar energy equipment suppliers)
a few others -BEP,TERP,TAN
Saudi Aramco and partners are intent on building an oil to chemicals plant that will consume 400,000 barrels of oil per day.
https://cen.acs.org/business/petrochemicals/future-oil-chemicals-fuels/97/i8
and other oil to chemical plants are being built
https://www.saudiaramco.com/en/news-media/news/2019/aramco-sabic
They have no intention of leaving the oil in the ground.
Hugo,
Yes the cheap oil is likely to be produced, the expensive oil will be left in the ground (tight oil and extra heavy and some deep water oil) once the EV transition and transition in other transport sectors occurs and oil prices start to fall (probably around 2050) to under $50/b in 2019 US$.
In the mean time, enough oil will be supplied to meet demand at the prevailing price of oil.
Potentially as the writing on the wall becomes clear to OPEC nations they will produce all out in an attempt to gain market share, this will drive oil prices low enough to make the expensive oil no longer viable, this is the $10 to $20/b scenario envisioned by some. Much of the OPEC oil is no longer viable if oil prices fall to that level so in that case oil gets left in the ground because it is no longer profitable to produce. Again not likely before 2050 and perhaps not before 2070 as it will take time to replace oil in water and air transport.
Dennis,
You wrote already that the longer world oilproduction stays (more or less) on a peak plateau level, because of (tertiary) EOR, the steeper will be the decline. Of course the EOR methods are high tech, so a long lasting plateau and rather steep decline is to be expected. That’s one reason why I guess a smooth transition will not occur.
Han,
Not all oil is produced with EOR
Look at decine rates for conventional oil onshore L48 output in US. About 3% decline this will be a more typical World rate. Prices will rise and demand will fall eventually faster than supply. In the meantime prices rise to a level that matches supply and demand.
Dennis,
3% world decline I consider a rather steep decline and could be a disaster for net world oil exports, and will be a disaster when oil exporting countries don’t ration their own oil use. Yes, oilprices are going to rise and demand goes down obligatory, but it isn’t going to be pleasant. The chances for a smooth transition away from crude oil are not high in my opinion to repeat myself again.
For past peak events/consequences I’m more in the direction of the camp of Ron and Hugo
Han,
Don’t think it will be smooth, just possible, especially if free markets are allowed to operate. High prices are a pretty good incentive for both efficiency and substitution.
Difficult to predict how it plays out. If URR is 3100 Gb, decline will not be 3% under most reasonable scenarios.
Fuels are burnt, which directly creates GHG emissions.
Chemicals are not burnt, so it doesn’t create the same problem.
Ron,
The rates of increase for wind, solar, and EVs are far higher in percentage terms. No doubt there was a time that the use of horses for transport was increasing much faster than the use of ICEVs.
Petroleum use (C+C) is growing at about 1% per year, wind 14%, solar 28%, and plugin vehicle sales grew by 64% in 2018.
Things can change fast. Remember that about 65% of World C+C is used to produce gasoline and diesel fuel, EVs and plugin hybrids take care of most of that problem. The scenario has about half of the 2018 C+C output (40 Mb/d) still being consumed in 2060. The focus was on liquid fuels for land transport. If demand grows for other uses, prices will be high and we will see transition to other forms of energy in air and water transport and possibly less of those forms of transport and more efficient use of energy in those sectors.
It is a difficult task to do everything, perhaps someone else could look at water transport and air transport. Chart with World use of Jet fuel plus fuel oil from 2000-2018 below.
Data from BP statistical review of World energy (see Oil-Regional Consumption tab)
“I imagine he thought in 1910 those new fangled infernal combustion engines would never replace his horse.”
Like Ron said, you confuse applications and ressources.
The best example is probably coal. Until 1900, it was the most common energy ressource for transport applications, industrial production and household heating. Internal combustion engines, electricity and central heating using fuel oil gradually replaced the old bulky coal use… So, you would think that coal consumption would decrease.
Well, it did not. Coal became a cheap way to produce electricity and consumption never decreased on a global POV.
Of course, there is a global movement to decrease its usage and replace it with other ressources for electric generation. Many countries phased out their coal production/consumption, the best example being UK. In the mind of people, coal is a ressource from the past and they think oil is next.
But growing needs of energy, especially from countries that can’t afford complex technologies, is sure to keep coal and oil demand staying there for a long time.
Tita,
Yes coal use has increased in absolute terms. It was once called King Coal, because it dominated the Energy industry. I imagine not much of the land transport of people was done by rail in 1910, but I might be wrong. Especially in rural areas (such as where my Grandfather grew up) there was not a lot of train transport.
World coal consumption peaked in 2013 according to BP stats.
Chart below shows the percentage of fossil fuel energy from coal used by the World from 1900 to 2018. Coal is no longer king.
Also fossil fuels are likely to peak, when they do they will become expensive and lower priced alternatives (EVs, solar, wind) will gain market share. Eventually the dangers of climate change will be widely recognized and more effort will be placed on the task of eliminating fossil fuels entirely, probably will not be achieved until 2080 or later.
True Ron.
Although I suspect that renewable will be over 50% by 2050, but not like many people see it.
Barring some technological breakthrough (I’m not holding any breathe) the overall energy pie will be smaller. The energy supply will decline, to meet up with a growing renewables output on the charts.
Maybe people will be talking peak population by then.
Hickory,
Yes energy use will be much lower, consider that primary energy use with fossil fuels results in about 62% of the energy being wasted as heat that is put to no productive or useful purpose. A world with no fossil fuel use and close to 100% of energy being produced from wind, solar, and hydropower, would use 40% of the energy of a 100% fossil fuel energy world with little change in total useful work (exergy) produced.
Its a very good point Dennis.
A wise H.sapien culture would figure out how to use the precious stuff with less waste, and only for important purposes.
We on the other hand will be forced to cherish the incredible energy source the hard way- primarily via the hard economic lessons of reliance on a depleting resource.
Either pathway, the energy pie will get smaller I’d wager.
Dennis,
What do you mean by “primary energy use”? I assume your not talking about cars here as the “waste” heat is kinda nice in some situations like winter.
Do you mean burning fossil fuel to create electricity in power plant causes 62% of energy as waste in heat?
City i live in i think more or less every house is connected to a pipe network and supplied with piped heat. (waste heat from the power plant). So i dont know if that can actually be considered waste in that case, however the piped heat is kinda expensive compared to options in my case (but depends on how much heat you use, if you dont use that much the piped heat makes more sense), you also are forced to pay a fixed service fee just for having your connection.
Baggen
In the case where the heat is utilized there is less waste.
In summer part of the spring and fall the heat from an ICEV is wasted. Typical year round efficiency for ICE is about 30%.
Average thermal power plant about 38%.
Home heating systems can be 95% efficient for condensing boilers that are properly sized.
Ground source heat pumps do much better at about 5 units of heat per 1 unit of elecrtical energy.
So in the future energy use can be reduced as fossil fuel is eliminated, with no reduction in utility. In fact reduced pollution increases overall social utility.
Dennis,
Im not sure i understand you correctly so please elaborate.
“Average thermal power plant about 38%”
So do you mean the plant that for insurance supply the town i live in only has 38% efficiency even though excess heat from the electric generation is used to supply homes?
Or is this in plant types where the waste heat is wasted and not collected and used for anything useful?
“Ground source heat pumps do much better at about 5 units of heat per 1 unit of elecrtical energy.”
Yes that is what i get on the heat pump i had installed this summer, i think it might actually be more efficient than that in a way since heat gets more concentrated now towards the areas i spend most time in compared to using all radiators. So far i havent used radiators at all and we are at about 0 degrees Celsius now. Will se how it turns out at -20, and since i do keep track of all the numbers it will be interesting to compare this winter against last one. Piped heat cost decrease vs electric increased cost.
Baggen,
In most of the World the waste heat from a thermal power plant is not utilized, in those power plants (probably at least 95% of fossil fuel electric power in the World) 62% of the energy in the fossil fuel is put to no use.
No idea what the typical efficiency is when the waste heat is used for district heating, but such systems are not widely utilized Worldwide. A great idea where there is sufficient population density near the power plant.
With my very limited vision and forecasting power. I honestly can’t see oil prices rising (in the near term) unless war breaks out in the mid east. I can see Brent going to $40 by the end of next year.
Interesting article with good photos documenting the cratering of Venezuela’s oil industry:
https://www.bloomberg.com/news/articles/2019-10-03/three-days-in-venezuela-s-oil-belt-show-the-price-of-pillage?srnd=premium
The Wall Street Journal this week had an article about how people are buying cars with longer loans. The real business for the auto industry these days is creating loans.
“So far this year, dealerships made an average of $982 per new vehicle on finance and insurance versus $381 on the actual sale, according to J.D. Power, a data and analytics company. A decade earlier, financing brought in $516 per car and the sale made dealers $837.”
So when people here talk about how people can’t afford EVs, that may not be true. Auto companies might be content to sell the vehicles at a loss if they generate reliable monthly payments. And when the time comes, getting people to change from ICE vehicles to EVs might be just the reason to get them into new loans.
Boomer,
A lot of money is made by dealerships on service after the sale, this will probably be reduced with EVs so car dealers may not want to sell them.
Good point.
“A lot of money is made by dealerships on service after the sale, this will probably be reduced with EVs so car dealers may not want to sell them.”
I tend to dislike these cheap thoughts reading of what people want. IMHO, customers and dealers are just used to do something and don’t easily reconsider doing it differently. Buying an EV is quite a step, with some uncertainty.
It’s probably more carmakers, under the threat of regulations and competition, that are currently reconsidering their production. There is quite a lot of new EVs Models from almost every brands. They need to sell them to be within regulations.
Customers have also incentives to buy EV cars, along with higher taxes for owning an ICE car.
Dealers have not much choice but to do what carmakers tell them to do and to sell what customers want to buy.
Sales people can have an influence. In many US states laws have been passed to get tax revenue from EVs to balance the fuel taxes they don’t pay. Federal tax benefits for Teslas end on Dec 31 2019 and most states have no incentives for EVs.
I realize things are different in Europe and California.
The rest of the World is far behind.
Things may become better if US voters Dump the Chump named Trump.
https://www.bloomberg.com/news/articles/2019-10-04/signs-of-shale-patch-slowdown-found-even-on-the-west-texas-wind
Seems the increase in activity EIA and Rystad have annonced will disapear. Guess if there shall be a strong increase in production in 4th quartile they need more pepole to frack, drill, complete DUCs not less…
Rig count is dropping, prime acreage is getting depleted, financing is drying up and LTO stock and bond prices are cratering, jobs are drying up, oil price is stuck in the $50s… hard to see where much more increase comes from for the foreseeable future.
https://oilprice.com/Energy/Energy-General/Impeachment-Victim-Energy-Secretary-Perry-To-Resign-In-November.html
Ok. Perry was the smarter one, after all. But, not by much. Fits gonna hit the Shan, big time. Rats leaving a sinking ship, not a unusual signal. But, I would hate do be the poor dunce who takes over. God give him grace.
Rossneft will no longer accept US Dollars as payment for Russian oil exports.
https://www.rt.com/business/470192-russia-dumps-dollar-oil/
Interesting—–
Why should they? We are dead. Trump has insured it. I’m sure there wa a lot of big oil money, recently, to go into his coffers. But, his efforts and theirs are antithesis.
Well, he has been bankrupt 6 times——
Long time lurker….
Great summary on the US Shale players can be found here. Their bonds had a bloodbath on tuesday
https://www.desmogblog.com/2019/10/03/fracking-revolution-peak-without-profits
Thanks, Boson Hunter, this is a great and scarey story titled:
Will the Fracking Revolution Peak Before Ever Making Money?
This one line from the Journal sums up the problems: “Unlike several years ago, when shale production fell due to a global price collapse, the slowdown this year is driven partly by core operational issues, including wells producing less than expected after being drilled too close to one another, and sweet spots running out sooner than anticipated.”
The shale revolution is not petering out just because of low prices, but also because the sweet spots are drying up. To believe shale production will continue to increase until 2040 is just totally delusional.
Lots of waste in pursuit of short-term profit.
Took this pic the other day of a likely patch refugee
Just another stranded assets at $5 a gallon
Tight oil in the US will peak in 2025+/-2.
There is a great article in the latest SRSrocco Report. Half of the Permian 2081 production increase has declined in the first seven months of 2019.
Let’s look at the Permian oil production just for 2018. Permian oil production for 2018 peaked in December at 2,136,000 bopd or 2,136K bopd, and declined to 1,056K by July 2019. That is a STUNNING 50.5% decline in just seven months:
Ties into this:
https://finance.yahoo.com/news/shale-jobs-drying-permian-basin-100023633.html
Nothing new here. Anybody who has followed is site already knows new shale production falls by 50 percent after 12 months. Thus is just a deceitful attempt to make it look like now 12 months has turned into 7 months.
What is new, now it looks like Steve has moved on from selling gold and silver to refinancing home mortgages.
Thus is just a deceitful attempt to make it look like now 12 months has turned into 7 months.
Bullshit! The figures do not lie. There is nothing deceitful here. 2018 production did decline by 50.5% in 7 months. A lot of wells are being refracked. Refracked wells decline two-three times the typical well. Sweet spots are playing out and the “not so sweet spots” have a much higher decline rate. The decline rate has clearly increased. End of story.
What is your point HuntingtonBeach? Why are you trying to discredit the actual data? And what is your problem with Steve? If he wishes to change the emphasis on what he wishes to express, that is his prerogative. I do that occasionally myself. One’s primarily points of concern can change from day to day. That is nothing but human nature.
Ron,
First… it seems as if HuntingtonBeach doesn’t realize that the Google Ads I have on my website put those ads in based on each individuals search habits. I have no control over those ads. Those ads help pay the maintenance on the website.
Second, the important take-away that ole HUNT didn’t mention is that the staggering 5,132 wells it took to push 2018 production up 2,136K bopd now needs 20-30% more to grow production.
Thus, the RABBITS pumping out shale in the Permian need to bring on about 6,300-6,600 wells in 2019 to increase production moderatly. Unfortunately, because there are only about half the amount of wells drilled (2,500 +/-) so far 1H 2019 versus last year, production has plateaued.
Lastly, ole HUNT maybe doesn’t realize that the 2018 average cumulative production in the Permian for the first 6 months has declined 46% versus 42% compared to the average cumulative production for 2017 during the same period.
Which means, the Permian Decline is picking up SPEED because the SUM-BITCHES are now doing 15K well-heads with two+ mile long laterals and 60-stages to try to offset the declines.
THIS WILL END BADLY.
GOD HATH A SENSE OF HUMOR.
Steve
Let me repeat, “Nothing new here” except your advertising. Shale has had abnormally high decline rates from day one and has flooded the market depressing pricing now for 5 years. Steve’s article is written like something I would expect from Tverberg. Full of fear and one sided facts without detail.
“doesn’t realize that the 2018 average cumulative production in the Permian for the first 6 months has declined 46% versus 42% compared to the average cumulative production for 2017 during the same period”
If that’s the point you wanted to make in your article. Then I would suggest you should state it in your article. Instead of “50% of the mighty Permian’s 2018 oil production has vaporized” without the facts of prior decline rates, annual well competitions history, cost per well, efficiency changes, prior decline rates and cost of equity it’s meaningless. Just because this is the age of Trump. Doesn’t mean coloring your hair orange is in style.
“THIS WILL END BADLY”
Again, “Nothing new here”. I would suggest buying an EV with solar panels on your roof to limit your risk.
Rocco’s article is good data. Thanks for posting a link to it Ron, and thanks for writing it Steve! Honestly, I like it when guys like Steve and Ron take the data and make great charts and synopsis. Saves me a lot of frickin’ time in trying to get my head around a few things. But hey, I’m thick. David Hughes made some interesting comments on Steve’s article; to wit, huge decline rates for one year old wells are nothing new.
naive optimism ~ the belief that good outcomes are more likely, and bad outcomes are less likely, to happen.
interesting comments – huge decline rates for one year old wells are “nothing new”
If one compares the 2017 decline over 6 months with 2018 decline over 6 months, it is clear that Steve is correct, the rate rose from about 40% in 2017 to 50% in 2018. That is what the data shows so far, note that the 2018 data may be revised.
“Let me repeat, “Nothing new here” except your advertising”
To old for internet, well at least you didn’t complain about steve moving into porn.
I stopped careful focus on the individual production rates of the shale fields when the assays began to change.
Shallow, has anyone carefully traced gross revenue for a company and compared that to the specific oil production claimed by that company. It should be essentially easy to declare a quantity of oil production and then have the refinery reject some portion of it or adjust the price they will pay for it to be something other than Nymex. Because it’s not all oil.
The meaning is it would seem possible to declare a quantity of oil production but not get paid for all of it, and royalties and taxes are based on revenue, not barrels.
How easy would it be to obscure things and make it appear normal and proper and whatever?
Russian Energy Minister: World Oil Demand To Grow By 1.4 Million Bpd In 2020
Damn! With all those EVs hitting the road and with solar and wind power growing by leaps and bounds, World oil demand should be going down, not up. /sarc
Which makes one wonder if the Russian minister has some inside information regarding China’s trade negotiation and today’s economic slowdown.
No, the Russian Minister just wants to sell oil at the highest possible price. This may just be wishful thinking on his part. No one knows how much oil demand will increase next year. This is just his wild ass guess. And that is what we all do.
“Russian Minister just wants to sell oil at the highest possible price”
The only thing that statement is going to do is encourage the Americans to keep drilling.
1.4 mbpd was last year’s increase in consumption, too.
That’s about 1.5%. Global population growth is 1.1%.
On presumption that certain age groups burn oil more than other age groups, I gotta look into this. If the 1.1% is concentrated in high burner ages, we have a more close alignment of consumption to population.
Watcher
The oil consumption increase is more to do with increased standards of living.
China has gone from this
http://english.cri.cn/6566/2009/09/22/1881s517621_1.htm
to this in 30 years and they are still going strong.
Just one project is to build a highway from China to Europe
https://www.worldhighways.com/sections/emergent/features/europe-asia-road-link/
and India, the country of the cart horse 30 years ago is catching up.
https://www.bbc.co.uk/news/world-asia-india-46557662
Long term trend for C+C demand increase is 811 kb/d annually from Jan 1982 to June 2019. That would be my WAG.
The author of this book would say that power laws mean that we need to find an entirely new oil province in order to improve our situation:
https://www.amazon.com/Bursts-Patterns-Everything-mail-Crusades/dp/0452297184
We find oilfields as series.
Seems more shale Areas will be open up for rental. Could this add more sweet spots to cover up for the one that is getting dry..?
https://www.upstreamonline.com/exploration/us-opens-up-california-onshore-fields-for-leasing/2-1-683663
That article is behind a pay wall but here is how this story started over two years ago.
Trump moves to open up more public land to drilling in California, July 6, 2017
This is not shale territory but conventional oil. However, some counties have passed laws against fracking just in case. Their laws are being challenged in the courts. I don’t think this will make much difference. They have been arguing about this for over two years. Nothing much has happened or is likely to happen.
Trump has a really hard on for California.
This is more about revenge, than energy.
Could this add more sweet spots to cover up for the one that is getting dry..?
Sorry Freddy, but there are no shale sweet spots in California.
A third of Russian oil recognized unprofitable
Oct 5, 2019 at 19:15
knowledge-1
A third of the recoverable reserves of Russian oil are unprofitable in production, an inventory of deposits conducted by Rosnedra showed.
“In total, we have 2700 oil fields. This is 28.9 billion tons of oil, ”Deputy Head of the Department Orest Kasparov summed up on Friday at a session of Russian Energy Week.
The vast majority (74%) are small deposits with reserves of less than 5 million tons. Even the full extraction of such volume to the surface is only 1% of the current annual production in the country.
If we exclude deposits that are already being developed, have a duty exemption, are in the NI system, or have strategic importance for the industry (for example, Samotlorskoye), 719 deposits remain with recoverable reserves of 17.2 billion tons. “The preliminary results are as follows: 11.5 billion tons, or 67% of recoverable reserves, are profitable,” Kasparov said.
Theoretically, while maintaining current production – about 550 million tons per year – this volume could be enough for about 20 years.
But in practice, everything is much worse: deposits are depleted and watered – on the giants Samotlor and Priobsky, the mixture extracted to the surface consists of only 10% of oil, and the rest is water and dirt.
Peak production in Russia can be reached already in 2021, Deputy Energy Minister Pavel Sorokin said at the same energy week.
If no measures are taken, in three years a steady decline will begin, which will reach 40% by 2036 – up to 339 million tons per year; in Western Siberia, where oil is light and low in sulfur, production will fall by almost two, he warned.
The problem is not so much in the volume of stocks as in their quality. New reserves, which put on the state balance, are getting worse from year to year, said Sorokin: “A large share, almost half of the reserves are now unprofitable in the current conditions.”
A critical point for the budget with a sharp reduction in income will come, according to Sorokin, in 2025: by this time, it will be necessary to move on to the production of hard-to-recover oil, which is much more expensive.
As a result, it will no longer be possible to collect the previous amount of taxes from the oil industry. And to prevent a drop in production, the provision of benefits will be required, Sorokin said.
In the baseline scenario, by 2036 the federal budget’s oil revenues will collapse by 40%, the Russian Ministry of Finance calculated in the “Budget forecast of the Russian Federation for the period until 2036”.
If last year they amounted to 8.8% of GDP, then after 18 years – only 3.3% of GDP. In the base case scenario, the Ministry of Finance lays down prices from 50 to 60 dollars per barrel and a smooth decline in the ruble – to 75 per dollar in 17 years.
link: https: //sozero.livejournal.com/5309053.html
We have encountered quoted water cuts before.
90% is by no means a disaster. There are wells in the United States operating with a 97% water cut and it’s still economical despite the cost of water disposal. I’m sure by now the Russians have pipelines from their major fields to carry water away.
Declaring things uneconomical because of a 90% water cut . . . Nah.
Already burning for five weeks, fracked gas blowout in Louisiana could last two more months
https://desdemonadespair.net/2019/10/already-burning-for-five-weeks-fracked-gas-blowout-in-louisiana-could-last-two-more-months.html
Oh well—–
Johan Sverdrup have started production.
https://www.lundin-petroleum.com/first-oil-from-the-johan-sverdrup-field/
Seems the current situation is that the world might go into reduced growth that if not the trade war will be solved soon means instead off oil demand anualy grow 1,2% it might grow 0,8% / 800k bpd in 2019 and 500 kbpd in 2020. Johan Sverdrup will add about 400kbpd but think other fields have decline so perhaps 350k bpd is more correct. Still there is lots off oil stored Saudi will get their production online and have some spar capacity. Russia dont have much barrels to add and in a oil world off WTI 50-60 signs shows decline or at the best flat US production. Guess soon EIA and Rystad will update their forcast regarding US oil production. My guess is than we will see a oil price remaining 2019 at 50-55 WTI/ Brent 55-60 and 2020 if trade war still is unsolved WTI 55-60 / Brent 60-65. This senario will keep US shale activity at current level or some lower as the best DUCs have veen used , running out of sweet spots and activity offshore might have a moderate growth as many fields are profittable with this oil price but only limited exsploration drilling will be done. Perhaps in 2021 if trade war still not is solved and if not the world go into a resession with negative oil growth we might see oil prices WTI 65-75 , Brent 70-80 usd that might give a moderate increase in both Shale and offshore. I think there is already a clear picture in future there will be great movement in oil prices year on year as US will take a role as swing producer because of the fundamental of US shale and investors want to see a profit as they get dividend and payed back their investment.
New post up by Ovi.
Thank you!
http://peakoilbarrel.com/non-opec-production-according-to-the-eia-international-energy-statistics/
also a new Open Thread non-Petroleum
http://peakoilbarrel.com/open-thread-non-petroleum-october-6-2019/
[…] don’t seem to tell the whole story in this case. One possible straw in the wind has been the persistent decline in world oil production since November 2018 even in the face of a growing world […]
[…] seem to tell the entire tale in this instance. One feasible straw in the wind has actually been the relentless decline in globe oil manufacturing because November 2018 also in the face of an expanding world economic […]
[…] don’t seem to tell the whole story in this case. One possible straw in the wind has been the persistent decline in world oil production since November 2018 even in the face of a growing world […]