Below are a number of Non-OPEC charts created from data provided by the EIA International Energy Statistics.
Since the EIA site is still in the Beta stage, the data and countries listed change from month to month.
Ron has been doing a lot of work with OPEC production data and the EIA US data. I am adding the EIA’s Non-OPEC charts to provide a world overview of how the production from a range of countries is progressing.
The charts below are primarily for the world’s largest Non-OPEC producers and are updated to June 2019, except for the U.S., which is updated to July 2019. If you are interested in additional countries, let it be known.
The first set of charts is for Non-OPEC countries and the last few provide a world overview. Under some charts, I will add country comments from the IEA since I have updated data from them up to August 2019. While the IEA production numbers reflect “all liquids”, their June to August increments provide an indication of how the trend in the EIA charts will change by August, since that is their latest data.
A personal note: I am not an oil expert. However, I do enjoy playing with numbers and looking at charts. I am a follower of this great site because of my interest in the Peak Oil question/issue. I do appreciate the info and insight provided by the experts on this site and want to thank Dennis and Ron and other posters and followers for keeping this site active and current.
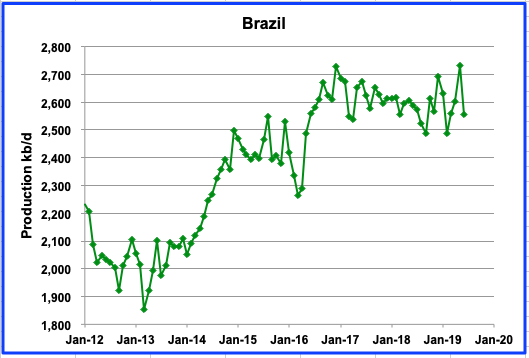
While Brazil production is indicating the beginnings of a plateau starting in December 2016, the IEA states that 400 kb/d were added between June and August 2019 and will approach 3.0 Mb/d by the end of the year. The IEA June production for Brazil of 2.66 Mb/d is 100 kb/d higher than the EIA value since the IEA reports all liquids.
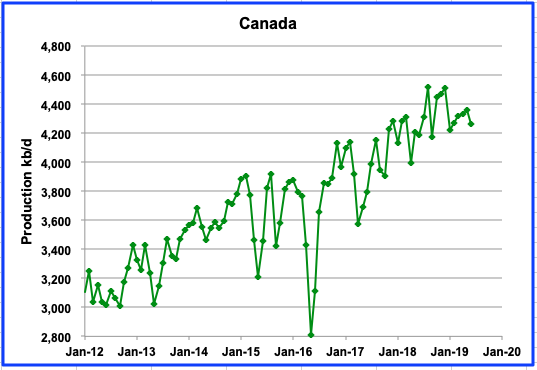
Since Alberta production is still under curtailment restrictions and pipeline constraints, Canadian production will continue to see limited growth. At this time, the curtailments are likely to be in place till December 2020.
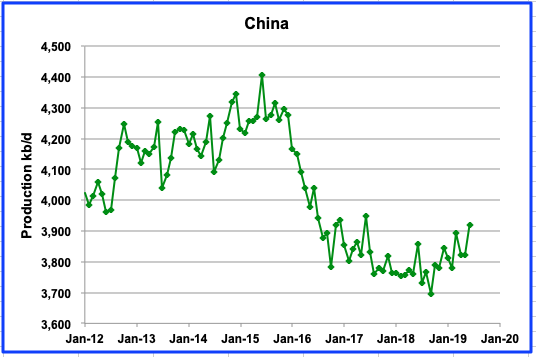
China seems to be recovering, however it is not clear how long this may continue. The IEA is showing declining production starting in July.
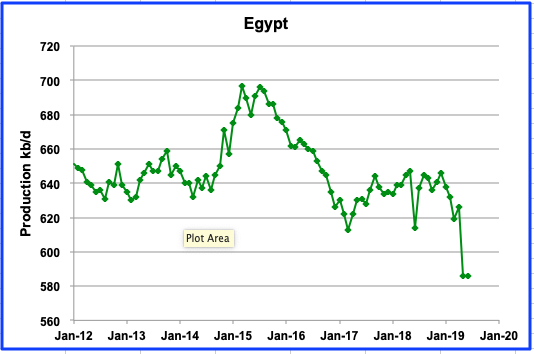
While the EIA is showing a sharp drop in Egyptian production, the IEA is indicating flat production from June to August.
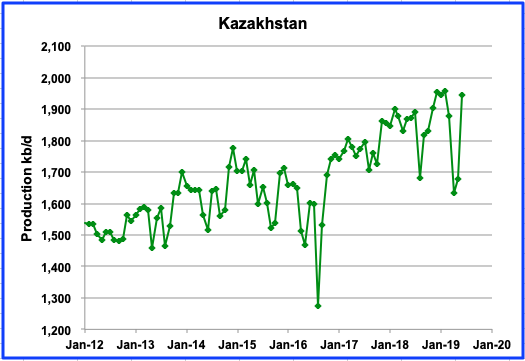
Kazakhstan production has been on the rise since September 2013 when the Kashagan oil field began oil production after years of delay. Problems with high sulphur content re-emerged in 2015, corroding pipelines, and the field was shut to make further repairs. Projected maximum capacity for Kashagan is 370 kb/d. Kazakhstan production may be near its peak and the IEA is projecting that it will start to decline in 2020.
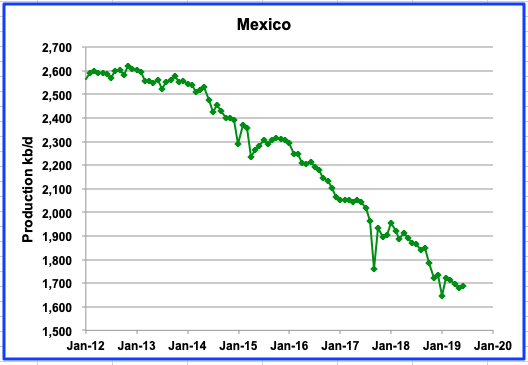
Mexican production continues to decline. The start up of a few small fields will slow the decline but not stop it.
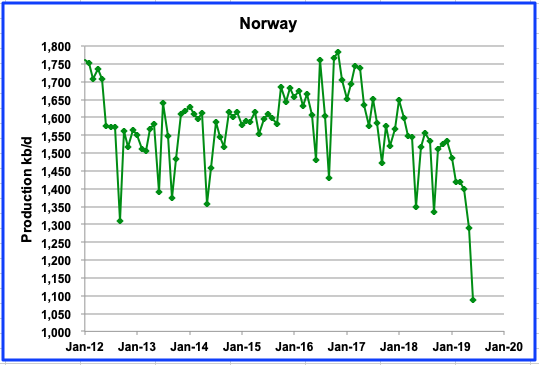
While Norwegian production shows a big drop over the last few months, the IEA is showing July production increasing by 320 kb/d. IEA: “Preliminary production data from the Petroleum Directorate show that Norway’s oil output rebounded by 320 kb/d m-o-m in July as field maintenance was completed”. Equinor’s Johan Sverdrup field is expected to start producing oil this month and is expected to add 440 kb/d by mid 2020.
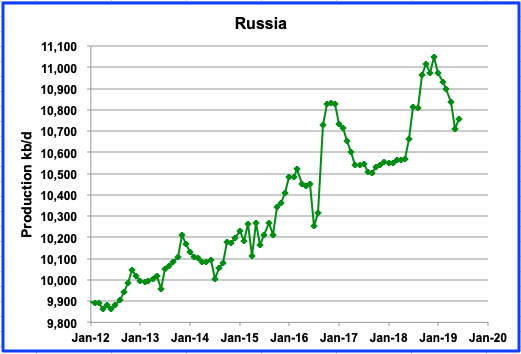
Seems that Russia has started to increase its production above its OPEC+ commitments. Recently it has indicated that it will try to comply with its quota in October.
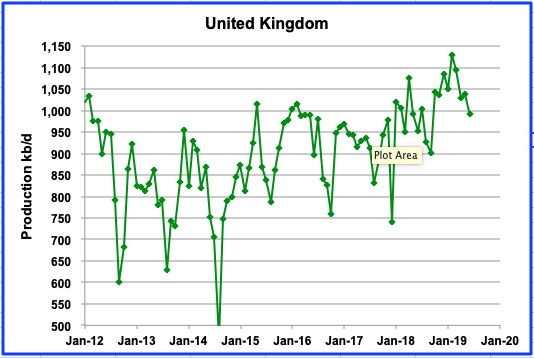
For the UK, the IEA is predicting essentially flat production out to 2020. The current drop is due to summer maintenance.
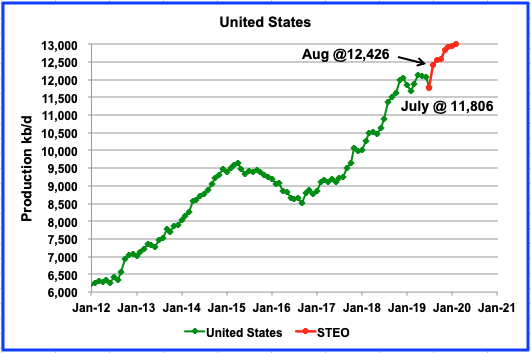
A number of us are still debating whether U.S. production will plateau in the near term or continue to rise? I have added the STEO projection out to Feb 2020 to show the EIA’s latest estimates for future production. While the July numbers agree, the STEO foresees an increase of 620 kb/d in August to 12,426 kb/d. A little difficult for us to digest. Let the discussion continue.
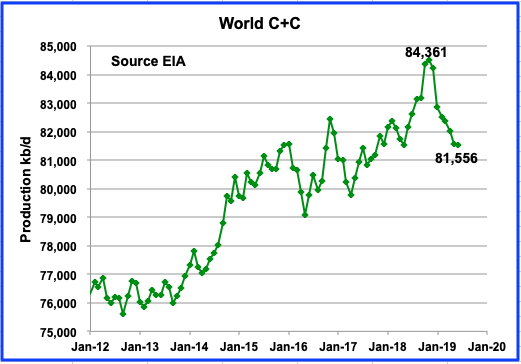
World C + C production is down from 84,361 kb/d in November 2018 to 81,556 kb/d in June 2019, a drop of 2.805 Mb/d. June saw a small change in production.
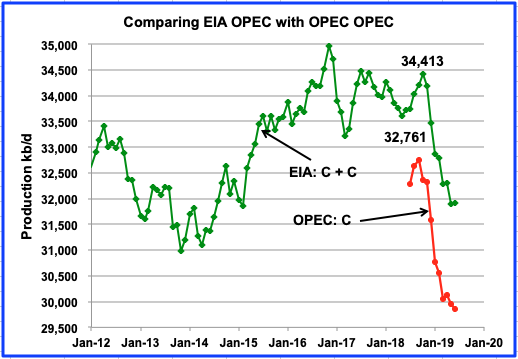
This chart compares OPEC’s oil production as reported by the EIA and by OPEC. The difference between the two is condensate. OPEC’s compliance production targets are strictly for crude and that is what they report. The EIA reports C + C. The difference between the two 2018 peaks is 1.652 Mb/d. The 2018 OPEC peak occurs in September 2018 while EIA’s occurs in October 2018
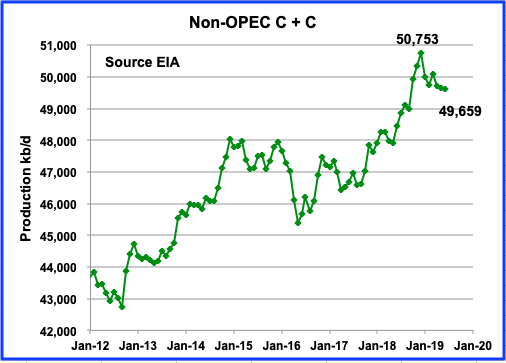
Non-OPEC production is down by 1.094 Mb/d from Dec. 2018 to June 2019. Primary contributors are Canada (-247), Norway (-448), Russia (-295), UK (-93), Egypt (-60), for a total drop 1.143 Mb/d.
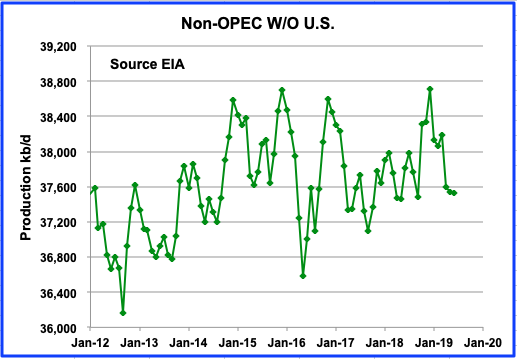
This chart indicates that the Non-OPEC countries, excluding the U.S., have been on an undulating plateau since Dec 2014. Note that of these four peaks, three have occurred in December and one in November. I assume that the declines, in general, are related to summer maintenance and the recovery is from the fields being put back on line.
The production drop from Dec 2018 to June 2019 is 1.172 Mb/d. The main culprits are the same as listed above. Since Canada and Russia are not expected to increase production by December 2019, to get back to a new high of let’s say 38,800 kb/d, the Non-OPEC countries excluding the U.S. will need to see significant production increases from Norway and Brazil and no significant declines from other countries.
This chart demonstrates the importance of US production on world oil supply. Once U.S. production plateaus, Non-OPEC production will be close to plateauing and OPEC will reclaim control of the oil market. 2019 could turn out to be a pivotal year for Non-OPEC oil production.
177 responses to “Non-OPEC production according to the EIA International Energy Statistics”
Ovi, great post. Thanks.
I would like to point out that the EIA’s STOE, from nine months ago, when the last confirmed US production was November 2018, it showed US production climbing ever upward. They completely missed this nine-month plateau. They have always been overly optimistic concerning US oil production.
Bottom line, the EIA’s Short Term Energy Outlook is not worth a bucket of warm spit.
Thanks Ron
I just thought that the graphic, added to the latest EIA 914 data, would help to emphasize your thoughts on the STEO. It will be interesting to see what their next Outlook predicts. Specifically, will be curious to see how much of the future curve shifts down.
Ron,
When I look at STEO forecasts from the past, they mostly estimate too low rather than too high.
Dennis, I went back and found the November 2018 STEO. They had the reported data for November 2018 way too low. Not their projection but the reported data. I will keep researching it and get back to you.
Edit: I checked a several past STEOs, both from 2018 and 2019. Sometimes their projections were too low and sometimes they were too high. Seldom were they very accurate. They seemed to be guessing and their guesses were seldom very good.
Ron,
Predicting is hard, especially the future.
The EIA often revises their estimates, the STEO shows the reported data at the time the outlook is published.
Attached is the latest quadratic projection for the September 2019 STEO. The one encouraging sign is that it is indicating slowing growth and a peak around July 2021. It will be interesting to see if the next STEO might pull that potential peak into 2020
Everything about the Permian except abstract estimates is screaming slowdown/peak. Rig count is down, the Dallas Fed report was ugly, labor demand is drying up and it’s because, with the business unprofitable in cash money, the capital cutbacks are going to force less work. And the market hates frackers right now for failure to perform, so the capital chokehold will continue at anywhere near these prices.
With no growth in productivity (for the past three years, per Shale Profile), hard to see how the basin grows with there being less physical work done for inability to pay for it.
https://shaleprofile.com/2019/09/26/permian-update-through-june-2019
PolyProp
Everything you have stated has been mentioned before and it is making it increasingly difficult to sort out the truth. Below you can see what the problem is.
Attached is a chart of Permian production, as reported by the EIA LTO site up to August. The average slope for the Permian indicates a growth rate of 57 kb/d/mth. However checking the increment from July to August shows that it went up by 82 kb/d, a significant increase above the trend line.
I wonder if there is a delay in Enno’s data. June was the first month in which he showed a decline. Shortly there should more updated data to ruminate on.
I see from RRC homepage that the period Jan – Aug 2018 compared to same period 2019 was a decline in Texsas of total completations of 16,9 % and oil wells completations of 13,5 % . Some of this might be able to offset by longer latherals but to keep oil production flat it will be needed significant increase to offset general decline from old wells.
Freddy,
The RRC completion data is based on the date the paperwork gets filed with the RRC, often the actual completion data is 12 months earlier, sometimes the completion date is 3 months earlier. The data is useless and should be ignored. The rig count data is useful and the frack crew data. Enno Peters does a great job, but for Texas he is relying on the RRC data available. Often the reporting to the RRC for completions and such are quite late so any Permian data from shale profile on completions after about October 2018 is not very accurate because the data is incomplete. The same may also be true of the New Mexico data, though I am not as familiar with that data.
Also it is sometimes claimed that the rig counts will lag completions by 4 months or perhaps more. So basically we would have to look at April rig counts in the Permian to see what completions might look like in August. The recent Sept rig count data would likely be reflected in January completions and output.
All we know is that the EIA tight oil estimates by play show increasing Permian output through August, potentially that estimate will be revised lower in future months.
Ovi,
There is definitely a delay in Enno’s data as it relies on RRC and other state agencies whose data is incomplete initially.
If you look back at earlier updates and compare with more recent updates this is quite clear.
For example his Aug 1, 2019 Permian update had April 2019 Permian output at 3285 kb/d, his most recent Permian update from 9/26/2019 has April 2019 output at 3401 kb/d (about 3.5% higher).
He states that he expects after revisions that June 2019 Permian output will be about 3500 kb/d, a bit lower than the EIA estimate, which includes tight oil output from vertical and horizontal wells (Enno considers only the horizontal well output).
Propoly,
Transport costs have decreased due to pipeline expansions, so this will help the smaller independents who were having to pay high costs to move their oil. Transport costs have fallen by as much as $4.50/bo from about $8/bo to $2.50/bo.
That was predicted though, pipelines are much longer leadtime than frack crews. Work metrics are still down significantly, not up, as is the equity in the publicly traded companies.
Propoly,
Yes it was predicted to occur in the future and that future is arriving. My point is that reduced transport costs will make wellhead prices higher and help producers, not more than that. Activity levels seem to be down, but somehow output is up, especially in the Permian. Of the 422 kb/d increase in tight oil in the US in 2019 through August, 399 kb/d or 95% of the US tight oil increase was due to Permian basin tight oil increases in output.
It is for this reason that my focus remains squarely on the Permian basin.
Permian horizontal oil rig count has fallen at an annual rate of about 16% per year since the peak in early January. If there is about a 4 month lag between rig count and completions, the 4 week average horizontal rig count was about 3% lower in April than at the peak in Jan. Output in August was higher than May (Jan rig count would affect May output) by 6% so there may have been increased rig efficiency (assuming DUC count was stable.) The rig count fell another 2% from April to May, eventually rig efficiency will reach some maximum and we will see rig count start to affect completion rates.
The recent completion rate in the Permian has been about 495 new wells per month based on my model (in other words if I assume the completion rate is 495, the model matches the output data). Even if the completion rate falls to as low as 400 new wells per month, Permian basin output continues to increase. It is for this reason I expect in the near term that Permian basin output will continue to increase. Scenario below assumes 495 new wells per month are completed until Dec 2020, if the scenario is extended to 2030, Permian output peaks in 2029 at 5250 kbo/d.
Ovi,
An interesting chart. Any particular reason why we might expect that a quadratic would model future output correctly?
How well does your quadratic work from Jan 2015 to Dec 2017?
Dennis
In this case I am more interested in the future than the past. The STEO tracks the EIA 914 very closely for past production up to July 2019. I have added the EIA 914 data to the previous chart and it virtually sits on top of the STEO data.
So I wanted to get some idea of what the analysts behind the STEO were projecting. So I split the data set into two. 1/2 before June 2019, real data, and half to the future to Dec 2020. The slope of the production curve from Jan 2018 to Jan 2019 is a lot steeper than the STEO projection from Jan 2020 to December 2020. So I just decided to fit a quadratic to the data and then projected it to July 2021, when it appears to peak. At this point it is a purely mathematical exercise with no physical data to back it up.
As we both know, curve fitting does not predict the future. However the fit to the future months does show a slowing in the growth rate in the lower 48. I am looking forward to the next STEO to see if there is a significant change to their forecast.
Ovi,
Sometimes analysts use past data to test their model, thats what I do. For the Permian my model works pretty well from 2010 to August 2019 with r squared of 0.999.
Gives me some confidence in the model.
Couple that with USGS TRR estimates 43 to 113 Gb for the 90% confidence interval with a mean of 74 Gb along with reasonable economic assumptions and we can make reasonable future scenarios.
Much depends on future completion rates which depend in part on the future price of oil. We have to guess on that. Complaints that guesses of the future are not very good are silly.
Dennis
Your model is a what I refer to as a “Bottoms up model”. It is made of real data on the production profile of wells and and the number of wells, along with economic data and the TRR. Back checking this type of model makes sense and is required to verify it is a reasonable model of the physical process being modelled.
As I mentioned the quadratic is simple curve fitting and as such has limited predictive powers. What I will be looking for is how the next set of data compares to the current set. It will provide an indication of whether the STEO analysts are revising their thinking on future growth and in which direction?
Could be that the STEO simply curve fits, the fact that the match is so good may be coincidence, as Ron has suggested they don’t get it right very often, but that is true of 100% of forecasts.
Ovi,
The match is quite good from 2017 to 2020 actually, suggesting a peak in 2022. I expect the peak will be later, likely 2025 if the mean USGS TRR estimates for tight oil are roughly correct.
A lower TRR for tight oil (closer to F84) might lead to a 2022 peak, a higher TRR (F16) might lead to a later 2028 peak.
What ever model is used to forcast US shale will have huge factors that is uncertain but during time might give certain factors that could be implemented in a model. As now the most important is change of perspective from a borroved funded growth to a profit driven growth where all exspensives, loan ballons , interest , dividend should be payed first. Another factor is the fact increasing number child wells increase decline rate and the fact shale runs out of sweet spots. Also drilling , completation effectivity have reach a top , max. lenght of laterals. On the other side solving pipeline constraint is positive, same with Exxons new processing plant for Ethane that could be used to resin production i.e.
But all in all what comes out from Permian , EIA monthlies data show a slow down that is significant and this is good as it might lead to stability between demand and production , higher oil prices that will be important to find new barrels that can be produced profittable in a oil price environment that not will be to high with lots off suffering consumers…
Freddy,
I agree there is much uncertainty. The model I use assumes new well productivity starts to decrease starting in 2019, through 2018 I use data from shaleprofile.com to estimate new well productivity (though for the 2018 well there are few data points so I use the 2017 well data tacked on to the 2018 data to give enough data points to estimate the well profile, not a big difference in productivity between 2016 and 2018 wells. The mean USGS TRR estimate and an assumed 250,000 total wells completed (when profits are ignored) are used to estimate EUR decrease for each well drilled in order for the model to match the mean TRR. Essentially a higher completion rate means EUR decreases faster relative to a low completion rate.
Then economic assumptions are applied so that only profitable wells are drilled based on a discounted cash flow analysis. The resulting ERR is about 59 Gb (TRR is 74 Gb) and about 190,000 total wells are drilled for the medium oil price scenario (where oil prices rise to $90/b in 2017$ by 2027 and then remain at that level for 25 years before declining to $40 in 2062.
Any or all of these assumptions might be incorrect, TRR might range from 55 to 99 Gb (68% confidence interval), oil prices might be higher or lower, costs may increase, technology might improve.
As you said the uncertainty is large, the sweet spot and child/parent problem might be addressed somewhat by the decreasing EUR assumption, but this is likely not the optimal solution, just a simple one that is easy to model.
Relevant to China, the results of the massive capital investment in domestic production are underwhelming at best. The big three producers have so far averaged a 1.4% increase (including Sino still being in slight decline).
https://oilprice.com/Energy/Energy-General/Chinas-Big-3-Struggle-To-Ramp-Up-Oil-Production.html
This does not look on pace to do anything material to Chinese import demands. It may temporarily stop the production decline.
Blow for Iran as Chinese oil group pulls out of flagship gas field project
Iran’s oil minister Bijan Namdar Zanganeh told local reporters on Sunday that state-owned CNPC would no longer help develop phase 11 of South Pars, the world’s largest gas field.
Total of France quit the multi-billion-dollar South Pars scheme last year to escape US penalties.
Iran’s quasi private-owned “Petropars Company will be the only one which will continue development of this phase [of the gas field],” Mr Zanganeh said, according to domestic press. “We wanted to lure foreign investments for this project . . . and Petropars was supposed to learn from these companies.”
Actually, that thing is part of the shared field with Qatar. Sort of surprising they needed any Chinese involvement. Hell, they can probably get help from Qatar.
How can I find out lease information I want in the business.
Ecuador declares state of emergency as fuel protesters battle police
https://desdemonadespair.net/2019/10/ecuador-declares-state-of-emergency-as-fuel-protesters-battle-police.html
A taste of the future?
It looks like a taste of what happens when government is incompetent.
First, previous governments have controlled prices, which leads to all sorts of perverse results, including shortages.
2nd, this government has abruptly removed fuel price controls, apparently without any PR, public preparation, or substitutes for low income folks.
That’s the path to political chaos.
Places like Egypt and Haiti also had fuel price riots because, well….everyone there hates their government, and for good reason: the level of inequality between rich and poor is high, and the poor are blocked by bad education, medieval business licensing and non-existent property ownership. But they also handled the price increases really, really badly. In particular, they didn’t substitute some kind of subsidy for the working poor. Ration cards would have been far cheaper and far fairer. Cheap fuel is a terrible way to help the working poor. It’s very expensive and inefficient because most of the subsidy goes to the middle class and wealthy.
Both India and China have raised fuel costs sharply in the last few years (by lifting price controls and reducing subsidies), and they’ve done pretty well.
And, of course, Europe has had high fuel costs for passenger vehicles basically forever.
Ecuador ends fuel subsidies to keep $4.2bn IMF programme on track
https://www.ft.com/content/69bed0ce-e52b-11e9-9743-db5a370481bc
Egypt will be back on the brink pretty soon.
A revolution is brewing in Egypt – and this time it will spread far beyond Tahrir Square
https://www.independent.co.uk/voices/egypt-revolution-tahrir-square-president-sisi-a9139686.html
as will be Iraq
At least 109 people killed and over 6,000 wounded in less than a week of anti-government unrest, interior ministry says
https://www.aljazeera.com/news/2019/10/iraq-protests-latest-updates-191004085506824.html
Capital Flight Is Killing The US Shale Boom
Saudi Aramco has fully restored the damaged production from the Abqaiq and Khurais facilities from just a few weeks ago, an impressive turnaround in such a short period of time.
But now, Riyadh faces another challenge that could prove more daunting.
The oil market has demonstrated its inability to sustain a price rally as market traders are giving no premium to geopolitical risk. Instead, weak demand dominates, and oversupply looms. Brent fell below $60 per barrel this week as a wave of dismal economic news deepened fears of a global economic slowdown.
Oil demand forecasts have already been slashed several times this year, and the IEA’s executive director said this week that another downward revision was likely. “Looking at the global economy weakening…China, the driver of global oil demand, experiencing the lowest economic growth since 30 years. The advanced economies are slowing down. We may well revise down our demand numbers in the next days or months to come,” the IEA’s Fatih Birol said.
Top officials from OPEC and the non-OPEC partners recognize the predicament. “Of course, demand is affected by the status of the global economy, and the economy is slowing down,” Russian Energy Minister Alexander Novak said in Moscow. But for now, there appears to be no change of strategy. “There are no crisis events that call for an emergency meeting.”
That may change if things continue to worsen. In a report on October 3, Standard Chartered marveled at how oil demand growth has plunged to a 10-year low. “This is the third consecutive month of y/y demand falls according to our disaggregated monthly balance model, the first time this has happened since 2009,” the investment bank wrote. “Over the past 10 years, oil demand has risen y/y in 113 months and fallen in just seven. However, five of those seven falls have occurred in the past eight months.
In short, not since the global financial crisis has oil demand growth been this weak. Standard Chartered estimates that seven countries have posted year-on-year declines in demand of at least 100,000 bpd – Mexico, Canada, Saudi Arabia, Italy, the Netherlands, Turkey and Korea.
There are a few surprising and notable aspects about the current slide in oil prices. First, it comes just a few weeks after the largest supply disruption in oil market history. After a brief spike, prices fell back and the lasting impact has been negligible.
But another intriguing issue with the current downturn is the fact that the U.S. shale industry is being squeezed by poor financials, and production has already slowed dramatically. The recent fall in prices will put even more pressure on embattled drillers.
One would think that oil traders would begin factoring shale production growth undershooting expectations, which, all things equal, would put upward pressure on prices. But that is not the case.
That brings the focus back to demand. “For the market to be pushing prices lower at a point when the US oil industry is already in distress implies a more pessimistic market view of the global economy than is currently priced in most other asset markets in our view,” Standard Chartered said. WTI is not far away from a sub-$50 price.
Saudi energy minister Prince Abdulaziz bin Salman drew a similar conclusion in comments to reporters in Moscow this week, but seemed more confident that the market would wake up to the fact that shale will disappoint. “There are things that are real, and things that are perceived. We are driven by negative expectations,” Prince Abdulaziz said. “On the demand side, yes it’s been lower, but people need to understand that supply also may become lower.”
For now, lower-than-expected shale output is not sowing the seeds of a price rebound, not with the global economy slamming on the brakes.
If oil continues to lurch downwards, OPEC+ may have to revisit its plan of staying the course. As of now, the production cut agreement is set to expire in March, but an economic downturn may require deeper production cuts, or at a minimum, an extension of the current arrangement.
By Nick Cunningham of Oilprice.com
“how oil demand growth has plunged to a 10-year low. “This is the third consecutive month of y/y demand falls according to our disaggregated monthly balance model, the first time this has happened since 2009”
Remarkable to me, is how this demand growth decrease for oil has occurred despite any significant economic slowdown- the global GDP growth has been over 2% since 2010.
Hickory
Dennis has talking about the world consuming less oil. We are starting to see the reality of how global oil consumption is reduced.
https://markets.businessinsider.com/news/stocks/germany-italy-uk-are-headed-for-recession-and-ecb-is-out-of-tools-2019-8-1028435638
https://uk.reuters.com/article/us-japan-economy/key-japan-economic-index-falls-government-changes-view-to-worsening-idUKKBN1WM0CI
Hugo,
Yes a recession will reduce oil consumption, World Bank forecasted 2.6 % World economic growth in June 2019 and the IMF forecasted 3.2% World economic growth in 2019 in July 2019.
https://www.worldbank.org/en/news/press-release/2019/06/04/global-growth-to-weaken-to-26-in-2019-substantial-risks-seen
https://www.imf.org/en/Publications/WEO/Issues/2019/07/18/WEOupdateJuly2019
From 2015 to 2018 World real GDP growth ranged from 2.6% to 3.1% according to World Bank
For the IMF using real GDP growth at market exchange rates they predict 2.7% growth in 2019 (similar to World Bank) and World Real GDP growth was 2.5% to 3.2% at market exchange rates from 2015 to 2018 based on IMF estimates.
Bottom line, at the World level a recession was not expected by major international agencies midyear 2019. Forecasts often change.
Dennis
Predictions are very often wrong.
I am looking at real recent news, which explains why oil consumption growth has slowed so much.
https://www.wsj.com/articles/china-says-growth-is-fine-private-data-show-a-sharper-slowdown-11567960192
Hugo,
Yes predictions can be too high or too low, one only knows which after the fact, your guess may be good or it may not, time will tell.
Keep in mind the “consumption” numbers are often a combination of output estimates and stock estimates, the stock estimates in particular are notoriously bad especially at the World level.
We don’t really know what recent consumption has been, so the “slowdown” in consumption may not be real. In addition “consumption” of all liquids is of little interest, the important numbers are C+C, light and middle distillates, and residual fuel (aka fuel oil), the propane and ethane and other NGL output (with the exception of C5) is of little importance for transportation, the EIA’s C+C and OPEC’s crude output numbers are the only important numbers.
Based on EIA C+C data the long term trend in the rate of increase in oil output is 811 kb/d from Jan 1982 to July 2019. Over the long term consumption increase is the same as output increase because if that were not the case stocks would either build to beyond capacity or be drawn to zero it consumption and production were not balanced over the long run.
The other consumption predictions thrown around such as 1200 kb/d or 1400 kb/d are all liquids numbers including biofuel, NGL, and other oils not used for transportation, I ignore those estimates a they are of little consequence.
Dennis
I am going by the link you sent me.
https://www.eia.gov/beta/international/data/browser/#/?pa=00000000000000000000000000000000002&f=M&c=00000000000000000000000000000000000000000000000001&tl_id=5-M&vs=INTL.57-1-WORL-TBPD.M&vo=0&v=T&start=197301&end=201906
It is obvious that C&C consumption has stalled for many months. I think a lot of GDP growth is due to luxury things being bought by the super rich, and GDP driven by ordinary people has stalled.
https://www.payscale.com/compensation-today/2019/04/payscale-index-q1-2019
This says it all, how do people buy more with less money?
Hugo,
In the short run, consumption can be higher than output by drawing from oil stocks. We have output data that is pretty good, we do not have very good oil stock data for the World, consequently it is far from clear that oil consumption has stalled, we do not know.
An alternative view of income (real GDP per capita), average rate of growth over past 5 years is 2.3% per year for the US.
https://fred.stlouisfed.org/series/A229RX0Q048SBEA
Dennis
and you believe what the Fed says?
average includes everybody, which includes the top 1%.
https://www.thebalance.com/income-inequality-in-america-3306190
52% of total growth was taken by top 1%
https://www.cnbc.com/2019/10/07/bloomberg-businessweek-wealth-number-ranking-shows-inequality.html
26 people are a wealthy as the bottom half
The world economy is limping by on more and more debt borrowed by the poor.
It is coming to it’s limits.
I know you disagree.
We will see who is right
Hugo,
I agree income is very unequal in the US.
Median real personal income has grown by 2.36% per year on average from 2013 to 2018.
https://fred.stlouisfed.org/series/MEPAINUSA672N
Yes I believe the data from the US Government. Do you distrust the information from your nations government?
Hugo- certainly we all expect global recession to cut into demand for all industrial materials, like in 2009.
But there has not been a global recession lately, with over 2% gdp growth/yr since 2010.
The sources you quote anticipate growth slowdown upcoming, but this does not relate to the oil consumption growth slowdown already experienced in the recent past.
Hickory
The articles are talking about the economies slowing down in recent months and now.
quote regarding Europe ” as three of the largest economies are tanking at the same time”
and India
https://www.bbc.co.uk/news/world-asia-india-49470466
and China
https://www.scmp.com/economy/china-economy/article/3022685/china-slowdown-persists-industrial-economy-posts-worst-growth
Hugo,
China growing at about 6% annually and India at 8%, so a slowdown could mean 5% and 7% in those nations. Advanced economies are growing more slowly, especially Japan with shrinking population, per capita real GDP growth was close to 2% for the World in 2017 and 2018, average rate of growth in real GDP per capita (2010 US$) at market exchange rates from 1975 to 2018 was 1.46% per year.
For China, real GDP per capita grew at 8.9% per year from 1990 to 2012, from 2012 to 2018 the rate of growth slowed to 6.2%. India’s real GDP per capita growth has been 6.1% from 2012 to 2018 (an increase from the 4.6% annual growth rate of real GDP per capita from 1993 to 2013.)
The piece on India is an opinion piece, growth has slowed from 7% to 6%.
For China consumption growth (typically about 2/3 of GDP) was 7%, down from a blistering 9.8%. Industrial growth is not the only measure that is important, in fact consumption growth is what drives an economy especially in a huge market like China with almost 1.4 billion people.
Denise,the info on India is incorrect . The last quarter growth was 5 % . Core sector growth was -0.5% yes negative . It is in a slowdown of MASSIVE proportion . By the way an ex member of the prime ministerial economic council has said that the government is inflating growth by anything from 1.5-2% . He resigned because he would not toe the govt line .
Hole in head,
I only have annual data from World bank and in 2018 growth using PPP measure was 6.98% for real GDP. IMF has 2018 real GDP growth at 7.3% and projects 7.5% for 2019. RBI is saying 6.1% for real GDP growth.
http://www.newindianexpress.com/nation/2019/oct/05/rbi-finally-gets-real-on-gdp-growth-raises-concerns-about-indian-economy-2043332.html
In any case 5% growth is pretty damn good IMO.
You ignore the fact that the ex chief economic adviser admitted that growth is overstated by 1.5-2.0 % . So it could be anything between 3-3 .5% ,which is paltry for the nation of it^s size and a sizable decline from peak of 9.8% .
Hole in head,
Most estimates are around 7%, so if it is overstated by 2% we would be at 5%, nobody has said it is overstated by 4%. Forecasts change and sometimes there are recessions, just the way capitalism works.
Capitalism is not perfect, but when properly regulated and combined with a highly progessive tax system, it is likely better than any other economic system humans have come up with.
Hugo wrote:
“Dennis has talking about the world consuming less oil. We are starting to see the reality of how global oil consumption is reduced.”
Is it strange, with so much consumer debt and economies on steroids by what the central banks are doing ?
Somehow the monetary system is sick and a bubble is waiting to burst. That’s my simple view of it.
Han,
Chart below uses data from https://www.bis.org/statistics/totcredit.htm?m=6%7C380%7C669
This data is from BIS, often called the central bankers bank
https://www.bis.org/about/index.htm?m=1%7C1
Even more remarkable that anyone would care about a model.
Last weeks low on the Brent price chart touched the major supporting trendline that supports the entire up trend since lows of 2016. WTI is still 4-5 $ away from it’s major supporting trendline from 2016. That little bounce we got last week was just a technical bounce. The only way to $20’s oil is through these trendline. Do they hold or not? I think they both have to give way to get to $20’s not just one of them. Brent can break below it’s trendline and be a false break if WTI never confirms the move.
HHH,
Can’t imagine $20/bo would last more than a week or two. All oil development will cease at that price level and shortages would develop within a month. Only people that believe the Saudi America hype think $20/bo is possible. Perhaps there are enough fools who believe that hype to make $20/bo a reality before 2050. Some day we might get to $20/bo, but it will be 20 or 30 years down the road, before we see a 12 month average Brent oil price under $30/b0 in 2019 US$, perhaps even 50 years when we consider the difficulty of replacing petroleum liquid fuel in air and water transport.
I don’t think 20$ for more than a month even in 30 or 50 or 100 years. More wells will be closed, there is less economy of scale, oil field equipment and service will be much more expensive than now, enviromental regulations will be more strict to the black stuff since it’s less important. So less and less lobby influence.
And running all these injections on old wrestled out Saudi oil fields will cost much, so the few barrels being squeezed out won’t be cheap. Fracking a few D-Class Permian wells with old museum-equipment won’t come cheap, too.
Piplelines will be stopped, so only rail and truck transport – all adds up.
If you need oil as an exotic chemical feedstock and fuel for ancient museum cars and planes in 100 years (normal energy is perhaps mainly from fusion plants and deep geothermal power plants) it doesn’t matter it costs 100$ a barrel. It will be produced from old stripper wells – no oil industry left to explore new fields (and collapse price with this).
There isn’t any application that truly requires oil. Hydrocarbons (and therefore diesel, jet fuel, etc.) can come from biomass, coal, kerogen, or from electrolytic H2 and carbon extracted from air and water.
As you point out, as volumes fall economies of scale will reverse and the true costs of pollution will be recognized, and oil will no longer be burnt.
Petrochemicals might grow, but oil will have trouble competing with coal and natural gas – they’ll no longer be burnt as fuel, so they’ll be dirt cheap. China is already using coal as a chemical feedstock.
Eulenspiegel,
There may come a time after 2040 (possibly not until 2050) where OPEC nations compete with each other for market share and the price of oil might fall to the marginal cost of the cheapest middle east barrels, which might be as low as $20/bo in 2017 US$. In any case I doubt it would be higher than $40/bo in 2017$, much depends on if it is possible to replace fossil fuels in air and water transport, if not then oil prices might rise as oil demand for petrochemical, air transport and water transport might be higher than oil supply by 2065 which would drive oil prices higher. Guesses for 2020 are not good, guesses for 2065 are pretty ridiculous and are likely to be far wide of the mark.
Maybe trendlines hold Dennis. The Brent chart is very clean. Meaning price touched the underneath side of the original trendline coming off of Jan 2016 during Saudi attacks. Price kissed the underneath side and got rejected. And went straight down to the secondary trendline coming off Jan 2016 and bounced a bit.
We should find out fairly soon if this trendline hold. I’ve been telling you since April that price was going to revisit these trendline before either gathering enough support to move higher or break lower opening the way up to the $20’s
WTI still has a ways to go to reach it’s supporting trendline. If Brent has a break below here. WTI should reach it’s trendline.
Wed. should be a important day. No trade deal is not good for oil. A trade deal of some sorts is not really good for oil as the dollar will rocket higher on a trade deal. 10y Bond yields will go higher on a deal. Unless market views a trade deal as bad for US equities. Since a deal probably means no more rate cuts any time soon. That could very well happen.
And if US equities happen to have a negative reaction to a trade deal i can’t see it being any good for the price of oil.
If you need lower bond yields to roll over a bunch of debt yet you know making a trade deal will in fact send them higher. Do you make the deal? Personally i think stocks are going to get taken to the woodshed sooner or later in order to save government bonds.
This is where Watcher tells me they can just QE it and have both.
$100 pops every bubble created in wake of 2009. That is what will happen if QE is done again like it was done before.
Platts is reporting that OPEC pumps 28.45 Mb/d in September, down 1.48 Mb/d on month.
https://www.spglobal.com/platts/en/market-insights/latest-news/oil/100719-opec-crude-output-plunges-on-saudi-attacks-sanctions-sampp-global-platts-survey
Great post Ovi! Thanks so much.
Much appreciated Survivalist. ?
India consumption. Kemp posted article somewhere picked up by Yahoo.
He is saying things like:
“Diesel, used for moving road and rail freight, as well as on farms and in small-scale power generation, and the fuel most closely linked to economic activity, is increasing by just 1.3%, down from more than 9% in early 2018.”
The problem is the regional consumption tab from BP lists diesel consumption for the whole year, not just early 2018. It was 4.4%. Rather less spectacular a decline.
“Gasoline, used by private motorists, is now growing less than 10% year-on-year, down from more than 13% in the first quarter of last year, according to the Ministry of Petroleum and Natural Gas (https://tmsnrt.rs/2n7ns3y).”
Dunno why he’s doing this. Full year gasoline consumption in India last year was 8.9%.
Maybe BP has a diff calendar year defined, but I’ve never seen any mention.
Saw a blurb noting India now has about 50K troops in Kashmir. That’s 19 yr olds not at home burning gas. For domestic deployment one would not expect additional army consumption. One would expect more air sorties.
India military is 3.4 million of which 1.36 million are active duty. 2.1 M reserves. That’s out of 494 million fit for service men (correct age, not disabled).
Fairly important item — you gotta understand India’s consumption and the role of LPG. Their “others” category is 40% of their total consumption (world as a whole, 24%). Middle distillates 38%, Gasoline 12%. So even if we had solid military measurements and noted these gasoline and diesel numbers, we still don’t really know the Indian consumption story without an LPG measurement.
https://www.businesstoday.in/current/economy-politics/india-is-consuming-lpg-like-never-before-what-is-driving-this-phenomenon/story/324554.html dated March 2019
India total consumption last year +5.9%. “Others” category, +6.4%. Gasoline increased 8.9% but from above, this is only 12% of total. For India, one must watch Others.
Latest Shaleprofile update for all of US shale indicating a plateau of 7 mbd
https://shaleprofile.com/2019/10/08/us-update-through-june-2019/
Yepp, also interesting to look at ultimate recovery and well quality (select quarter or month of first flow to see the recent developments). LTO’s best days are to be found in the rear view mirror.
Jeff,
So far the new well productivity has held up, at some point it may decrease, but so far that is not evident. There are occasional months or quarters where output is anomalously high or low, but that is likely simply statistical variation.
Chart below shows 2015 to 2019 well profiles, annual view. I think this gives the best perspective.
Dennis, has somebody the advanced account there? He has these values normalized per foot of the wells inside there.
The per well values still profit from companies going to longer laterals, old drillingrigs not able to drill these phasing out.
Enno writes “Normalized for lateral length (which is possible in our advanced analytics service), and averaged for all the oil wells in these basins, we see no clear improvement since 2016.”
So the peak, or better the plateau is already there?
Eulenspiegel,
If we assume lateral lengths increase no further and that number of frac stages and proppant load has been optimized then yes there would be no further increase in new well EUR.
In my Permian model I assume new well EUR starts to decrease in Jan 2019 as earlier Enno had stated that productivity normalized for lateral length had started to decrease for the Permian (this may not be true for all US tight oil basins). For my modelling I do Permian, ND Bakken/Three Forks, Eagle Ford, Niobrara, and then a catch all for other US LTO (US tight oil minus the 4 basins I model separately). The other US LTO model is the weakest part of the analysis as I don’t have great completion or well profile data and need to create a well profile and completion data to try to match what we see for shaleprofile completion data, DPR completion data, and EIA tight oil data. Also the USGS does not have recent estimates for all US tight oil basins so I don’t have a complete US TRR estimate for tight oil (only Bakken, Eagle Ford, and Permian) so I have to guess at TRR for Niobrara and “other US LTO”. In the past my guesses have been pretty conservative, for example I guessed the Permian basin TRR would be about 40 Gb and the USGS mean TRR estimate was about 74 Gb. We won’t know if the same holds true for other US basins (not including Bakken, Eagle Ford, and Permian) until USGS does new estimates. Currently my medium URR estimate for those other areas are 2.5 Gb for Niobrara and 4 Gb for “other US LTO”, assuming a $75/bo maximum oil price in 2017$. Total URR for US tight oil would be about 60 Gb with a peak in 2024 at about 8.7 Mb/d. Permian basin output is about 41 Gb for this scenario with a peak in 2028 at 7 Mb/d.
Nice Model Dennis. If your model is close to accurate, we should see a material slowdown in US tight oil growth from 2021 onward, if so, this will have a noticeable impact on prices.
Ivan,
There are many assumptions in my models, any of which could be incorrect, so if the assumptions are not too far off, the model may be ok. Assumptions about the future are incorrect roughly 100% of the time, so I would discourage any investment decisions based on these assumptions about the future. I think a 2022 to 2024 peak in US tight oil output is likely, but the model above assumes oil prices no higher than $75/bo in 2017$ so it is likely to be on the low end of reasonable scenarios. I think $90/bo by 2027 is a more realistic scenario. That scenario peaks at 10 Mb/d in 2025.
Alternative scenario with higher completion rate in Permian basin and higher oil prices reaching $90/b in 2017$ in 2027 and then remaining at that level until 2052. URR=89 Gb, peak in 2026 at 11.2 Mb/d.
“If one compares the 2017 decline over 6 months with 2018 decline over 6 months, it is clear that Steve is correct, the rate rose from about 40% in 2017 to 50% in 2018. That is what the data shows so far, note that the 2018 data may be revised.”
http://peakoilbarrel.com/usa-and-world-oil-production-4/#comment-689366
Dennis, at first glance your first graph above looks like there is little change between the years. But when one look close, one realizes your graph isn’t linear and there could be as much as a 50 percent increase in production in the first few months of production from the years 2015 to 2018. This additional production in your graph also shows the wells in 2018 out performing wells of 2015 to 2017 after 12 months.
In conclusion, the decline rate may be larger during the first 12 months. But because of the increased performance output in 2018 wells vs. 2015 wells from day one. This makes SRSrocco blog post mostly fear mongering and unwarranted.
“Lastly, ole HUNT maybe doesn’t realize that the 2018 average cumulative production in the Permian for the first 6 months has declined 46% versus 42% compared to the average cumulative production for 2017 during the same period.”
http://peakoilbarrel.com/usa-and-world-oil-production-4/#comment-689305
Your first graph is very misleading and seems to confuse those like Steve. Like I said a few days ago. Steve isn’t accounting for all the facts.
It would be nice to see the top graph on a linear scale.
Huntington beach,
The chart came straight from shaleprofile.com.
See https://shaleprofile.com/2019/09/26/permian-update-through-june-2019/
for Permian data.
For Dec 2018 2018 wells produced 2128 kb/d and in June the 2018 wells produced 1205 kb/d. For decline I take 1-1191/2128=0.44 for 2018 wells over the first 6 months of 2018 (not sure how I got 50% before, I must have miscalculated (my apologies).
For Dec 2017 output from 2017 wells output was 1379 kb/d and for 2017 wells in June 2018 output was 827 kb/d, so the decline over 6 months was 1-827/1379=0.4.
So the difference is 44% in 2018 and 40% in 2017, probably not that big a deal as there will be statistical variation.
If we look at individual well profiles, the 2018 average well declines by 51.6% from month 1 (peak month) to month 7 (6 months of output after peak) and the average 2017 well has a decline rate of 48.7% from month 1 to month 7, here the difference is even smaller (a difference of 2.9%).
Great post at Mike Shellman’s blog ( https://www.oilystuffblog.com/ )
https://www.oilystuffblog.com/single-post/2019/10/06/2019-Dumb-As-a-Stuffing-Box-Rubber-Award
Rystad says spuds and completions are holding flat through Q3 despite a sizable decline in the rig count:
https://www.rystadenergy.com/newsevents/news/newsletters/UsArchive/shale-newsletter-sept-2019/
In this article:
“The pace of decline has been quite stable recently, averaging 3 rigs per week.”
They make it sound like it was an average for several weeks. But that was just the decline of last week. In the last 4 weeks, the oil rig count declined by an average of 7 rigs per week. Which is a bit faster than the decline of the last 5 months.
Iran still producing at full steam of 3,9 mbd, even though underrerporting and playing victim at the same time.
https://oilprice.com/Energy/Energy-General/How-Satellites-Revolutionize-Oil-Trading.html
‘Genscape ingeniously tracked gas flaring at Iran’s oil fields and based on that, concluded that the country was producing about 3.9 million bpd in August, just 15 percent down from the first quarter of the year. Now, while this is not an export figure, it did suggest, according to Genscape’s global director of petroleum intelligence, Devin Geoghegan, that, like production, exports had fallen less than many estimated.’
It somehow explains the stability of market (and price).
However, at the same time Iran defensively plays the ‘belly up’ move:
https://oilprice.com/Energy/Crude-Oil/Iran-Admits-US-Sanctions-Dealt-Deadly-Blow-To-Its-Oil-Industry.html
Seems to what Rystad and EIA have suggested is about to happen as Exxon seems to scale up activity and add lots off riggs.
What remain to see is the ballance sheet if outcome and profit is as exspected.
https://www.google.com/amp/s/www.rigzone.com/news/woodmac_bullish_on_exxon_permian_growth_campaign-08-oct-2019-160004-article/%3famp
Pressure on the petrodollar reserve status? Does exporation of US Oil provide creditability to King Petrodollar? The founders warned us that paper is poverty.
https://peakoil.com/production/russia-dumps-u-s-dollar-countrys-top-oil-producer-chooses-euro-for-all-future-deals
I’m very interested in this topic also, although perhaps a wider discussion of reserve status belongs on the non oily side.
To put it mildly, I’m not an economist; I just read the best. If anyone with expertise and opinions wants to chime in, please do, if nobody minds.
The reserve currency stuff is a non-event. Currency conversion was going to happen anyway, to Rubles. There have been analyses suggesting that the United States gets advantage by having its currency be the medium of exchange, but this doesn’t have any particular impact on Fed decision-making, and it is they who determine the money supply.
A rather more significance is the ending sentences of the article noting that Rosneft bought 60% of Venezuelan output over the last couple of months. Of course they resell it. This would suggest that gradually there will be incentive to increase Venezuela’s output, especially since Rosneft will make a substantial profit on that sale
One of the main advantages of being the world’s reserve currency, and primary medium of exchange, is that the US can export debt, with no likelihood of repayment any time soon.
But, there are obvious disadvantages to this.
First, the US may not have to repay the principal, but it has to pay interest. That’s an increasing burden.
2nd, exporting debt raises overall exports, and raises the value of one’s currency. This makes other exports less competitive, and creates “dutch disease”, where “tradables” like manufactured goods decline, and overall US manufacturing declines. That’s not good.
So…perhaps Trump’s war on the rest of the world is a good thing. It reduces trust in the US and it’s currency, which reduces the value of it’s debt as a reserve, which will make exports cheaper (and imports more expensive) and help US farming and manufacturing in the long run.
I don’t think that’s what Trump has in mind, but sometimes there are unanticipated consequences, and occasionally they’re beneficial!
The October STEO was released today and the main message is that US production increases will be slowing in 2020.
In the US production chart in the Post above, it shows guestimated production for August-19 of 12,426 kb/d. In the October STEO, it is projecting August-19 production to be 12,353 kb/d, a reduction of 73 kb/d. Out of curiosity, I checked the EIA weekly production data for August-19 and it averages 12,371 kb/d. Just wondering if this is the STEO source for the more recent months and whether they have access to slightly updated data.
Below is a chart that shows the Sept and Oct STEO production data for the Lower 48, along with the associated quadratics. Of particular note is the small increase in production from Dec-19, (12.51 Mb/d), to Oct-20 (12.69 Mb/d), an increase of only 180 kb/d over 10 months. There is a much larger increase in production from Oct-20 (12.689 Mb/d) to Dec-20 (12.890 Mb/d), of 210 kb/d. Difficult to explain.
Ovi,
You said “There is a much larger increase in production from Oct-20 (12.689 Mb/d) to Dec-20 (12.890 Mb/d), of 210 kb/d. Difficult to explain.”
Your lower 48 production include Gulf of Mexico.
The STEO forecasts GoM Oct 2020 crude oil production of 1.88 mbd and Dec 2020 2.10 mbd. That’s a difference of 220 kbd which is almost same as your 210 kbd.
Your Oct quadratic fit indicates a peak crude oil production plateau for the US.
Tony
Thanks for the explanation. I was under the impression from previous posts that the GOM would not exceed 2.0 Mb/d. The quadratics are indicating a peak in Mid 2021. Interestingly, your post below is indicating that the world peak will occur in 2022. If true, is it a coincidence that it happens after the US peaks. This seems to imply that there is not much reserve left in OPEC.
The DNV ETO is also forecasting no growth for 2mbd of NAM offshore crude production, which is US and Canada. As US offshore production is mostly GoM production and Canada production is small, it’s reasonable that the DNV is forecasting no growth for GoM production.
Tony
Do you know, or does anyone else know, what new fields are coming online in the GOM in Nov 2020?
George K., who used to post here, kept track of future projects and probably still do. I think this was one of his last posts here on GoM: https://peakoilbarrel.com/gom-first-quarter-2018-production-summary/
also interesting is: https://peakoilbarrel.com/gom-cc-production-november-update/
Ovi,
I do not have information on specific fields, but SouthLaGeo has said he expects GOM output to rise to 2 Mb/d then plateau for year or two and then decline, or something like that.
Hopefully he will correct me if I am way off base.
Ovi,
I couldn’t find specific fields coming online in Nov 2020 but Rystad has the forecast below which aligns with DNV GoM forecast.
https://www.oilfieldtechnology.com/drilling-and-production/03062019/rystad-energy-us-gulf-of-mexico-production-on-course-for-record-year/
Appomattox and Vicksburg are shown in the chart below contributing to future oil production. Note that the production is stated as 175 kboed so not sure how much is oil and how much gas.
https://www.shell.com/media/news-and-media-releases/2019/shell-starts-production-at-appomattox-in-the-gulf-of-mexico.html
The chart also shows how GoM shallow oil production continues declining.
Thanks Tony
Maybe it is just platforms coming back on line in October after maintenance.
Here is a quote from the October STEO.
“However, EIA expects growth to pick up in the fourth quarter as production returns in the Gulf of Mexico and pipelines in the Permian Basin come online to link production areas in West Texas and New Mexico”.
What I read from this model is EIA revived the producttion line forcast significant down from Sep. to Oct. From EIA weekly it seens US now strugeling to increase production and it mostely in past month ended below 12.4 Mbpd. Think this EIA forcast will be reviced furter down in Nov and Dec. with oil orice WTI still in the 50 usd range. This might also indicate the huge production increase from the Majours investment like Exxon is delayed or will be much smaller than exspected and will not add much after the huge decline in US shale is offset. But as I understand Exxon is still ramping up both production and investments, number off drilling riggs. They also are selling assets offshore to invest in shale as I believe they have huge problem with investors but perhaps US Goverment will invest…tax payers money…
Jean Laherrere just published a world oil production update, in French, but charts in English
https://aspofrance.files.wordpress.com/2019/10/jl-oilprod-2oct19.pdf
Jean uses recently released DNV Energy Transition Outlook 2019
https://eto.dnvgl.com/2019
The DNV ETO chart shows world crude oil peaking at 87 mbd in 2022, using Rystad data.
Jean’s chart below compares DNV crude oil production forecast to his own
NDV think oil consumption will peak in 2022, they obviously cannot count.
https://eto.dnvgl.com/2019/peak-hydrocarbons
Thanks Tony,
Those estimates are a big departure for Mr. Laherrere. I think the main point of his piece may have been that even if unreasonably large estimates for fossil fuel are made, we still don’t get close to the higher IPCC estimates for carbon emissions.
I do not speak French so I may be incorrect.
Yes, quite a departure considering that he was stuck at URR=2100 GB for a long time IIRC
Paul,
Mr. Laherrere’s paper last year had World C+C URR at about 3000 Gb (2800 Gb for C+C less extra heavy (XH) oil and 200 Gb for XH oil). An old paper he did quite a while ago with another author had a pretty high URR case (maybe 4000 Gb from memory). Most of his work has been in the 2000 to 3000 Gb range with the estimates slowly creeping higher over time (from 2005 to 2018).
@Dennis
Indeed, in the last part of his piece, he tells that in the 5 “Shared Socioeconomics Pathways”, the IPCC doesn’t take account of any oil peak until 2100 (the farthest year of their prediction)
He show that in the SSP5, which is called “if we do nothing scenario”, coal production would be 10 times the current production.
He then compare with his own scenario, and find that coal production is 10 times his predictions, while oil and gaz are 7 times his predictions.
He called that a shameless lie! I plead for using “accurate” data.
Tita Thanks.
It seemed to be something like that but je ne comprends pas bien francais.
Approx 50 Mb/d by 2050 seems similar to George Kaplan’s findings.
The UK is showing quite a fat-tail in production
Interesting piece.
https://www.msn.com/en-us/news/politics/former-national-security-officials-fight-back-as-trump-attacks-impeachment-as-deep-state-conspiracy/ar-AAIu7Ju?ocid=spartanntp
Former national security officials fight back as Trump attacks impeachment as ‘deep state’ conspiracy
…
“What is happening currently is not normal,” said Andrea Kendall-Taylor, who served as a U.S. intelligence officer on Russia and Eurasia before stepping down in 2018. “This represents a deviation from the way that these institutions regularly function. And when the institutions don’t work, that is a national security threat.”
She was among 90 national security veterans who signed an open letter published Sunday in support of the anonymous whistleblower who filed a complaint that Trump had acted improperly in asking the Ukrainian president to investigate Biden in a July phone call.
Trump has attempted to intimidate other government officials into not cooperating by casting those who offered information to the whistleblower as “close to spies.” The open letter emphasized that the whistleblower “is protected from certain egregious forms of retaliation.”
…
Dennis, seems you intended to put this in the non-petroleum thread.
Niko,
Sorry, my mistake.
Dennis
The Republican led Senate Intelligence Committee released a report yesterday confirming the Mueller report findings that the Russians interfered in the US election on behalf of Trump. At the same time Trump and his GOP friends and AG deny this and are saying that it was the Ukraine that interfered in the election and the current impeachment hearings are a hoax. Crazy US politics. Not saying that ours in Canada are any better.
https://www.npr.org/2019/10/08/768319934/senate-report-russians-used-used-social-media-mostly-to-target-race-in-2016
Some good quality Vaca Muerta hype.
https://www.marketwatch.com/press-release/madalena-announces-production-test-of-horizontal-multi-frac-well-case-101h-at-coiron-amargo-sur-este-in-vaca-muerta-formation-2019-09-26
“The CASE-101(h) was drilled with an approximate horizontal lateral length of 2,000 meters at a vertical depth of approximately 3,160 meters. The well has been connected to early production facilities and achieved a 30 day average initial production (“IP30”) rate of 1,020 barrels of oil per day with a wellhead flowing pressure (“WHFP”) ranging from 4,900 psi to 2,700 psi.”
1000 bpd out of a 6000 ft lateral. Hard to find issue with that in comparison to Bakken norms. And that’s not day 1. That’s month 1. The quoting of wellhead pressure is frown inducing. Smells of choke.
It’s hype, but pretty good quality hype.
Complacency & Nothing To Be Concerned About
After my article on the Permian, some more notable oil folks came out of the woodwork to reply. Here is the link: https://srsroccoreport.com/more-than-50-of-the-mighty-permians-2018-oil-production-has-vaporized/
It seems as if ole David Hughes, which I have a lot of respect, decided to come on the website and leave a few comments. Basically, Hughes’s reply was, “WHAT’S THE BIG DEAL IN 2018?” He went on to say that we all know these wells decline 50+% in the first year, so why start to make a STINK about it now?
I also had several email replies from some other folks. And then we had a bit of a TIT for TAT here in this blog with HUNTY.
However, what is going on in the Permian is only a small part of the overall situation. Regardless if we bicker about the future Permian revisions due to the incomplete TRRC data, the fact remains, if you look at the “Annual Compounded Decline Rate” presently, it resembles a 70-75% STEEP CLIFF. And, the Permian isn’t the only one that looks like that. You can add the Bakken and Eagle Ford to varying degrees.
So, while a portion of the “OIL FOLKS” and a large percentage of the “DUMBED DOWN PUBLIC” believe there is NOTHING TO SEE HERE, they couldn’t be more wrong.
Furthermore, the U.S. public debt just ballooned by $227 billion in less than two weeks and $814 billion since August 1st. While everyone has seemingly become NUMB to the amount of these figures, the rate at which debt is being added in the United States and globally is heading up in an exponential trend. But, there is nothing to see here.
And, then we have the fun taking place in the REPO MARKETS when, according to a specialist in the field, a large BLOCK of CASH has been removed from the market and hasn’t come back, I gather it’s just another sign that EVERYTHING IS OKAY…. .nothing to see here.
Also, ExxonMobil, the largest U.S. oil company, had to borrow $7 billion in August to repay the huge $11 billion in short term paper it borrowed 1H 2019 in order to pay dividends and fortify its balance sheet as its Permian stake is destroying its bottom line.
And today, we see that ExxonMobil just sold its $4.5 billion upstream assets in Norway. Yes, this is part of Exxon’s plan to sell $15 billion by 2021 to focus on KEY ASSETS. I gather that really means, they are going to have to fill in the RED they will be suffering in the Permian as its U.S. upstream earnings continue to suffer. But again… nothing to see here
Lastly… while the NOTHING TO SEE here mentality will continue even as the U.S. and global economy heads over the cliff, taking the highly leveraged debt-based financial system down with it, I’ll make sure that I schedule some time from my day to come in here and read all the “I TOLD YOU SO” comments.
steve
Keep plugging .Steve . Too many people worldwide smoking hopium .
US debt repayments are now $479 billion.
https://www.thebalance.com/interest-on-the-national-debt-4119024
More debt means less spending on roads, schools, police etc. The trouble is the debt is so big that it would take some big policy changes to shrink that debt.
The US did once have a president who knew that wealth could not be built on debt.
https://www.npr.org/sections/money/2011/04/15/135423586/when-the-u-s-paid-off-the-entire-national-debt-and-why-it-didnt-last?t=1570639768867
and then the banks messed things up, who would have guessed.
The interest on us debt today could build 1 million new homes each year, demolish all the derelict buildings and slum dwellings.
Hugo,
479 billion divided by an economy with an income of 21340 billion or about 2.2%.
If people want to pay down the debt, they simply need to vote for politicians that will raise their taxes.
I wonder why that doesn’t happen. 🙂
Perhaps it is different in your country.
Oh and state and local government debt is used to pay for roads, new schools, and other infrastructure.
State and local government debt is about 3 trillion and at 2% interest rates another 60 billion in interest is paid out each year to finance state and local government debt. The total would be about 2.5% of total national income.
Dennis are you saying States do not get any Government money at all?
If GDP goes up by $2 billion most people say that is good.
What many may not understand is, what counts as GDP.
https://www.airforce-technology.com/features/most-expensive-military-aircraft/
When the government buys a B2 bomber, this counts as GDP. This GDP comes from tax money which has already been counted as GDP once.
When the government borrows a billion dollars it does not have and spends it, that counts as GDP, even though that money has been printed out of thin air.
So GDP is a fake, used by governments to fool people.
What is very real is the US debt is $22 trillion and government tax take is only $3.5 trillion!!!
https://en.wikipedia.org/wiki/United_States_federal_budget#Federal_budget_data
If all taxes went up 20% it would take 500 years to pay down that debt and interest. Trouble is a 20% rise in tax for businesses and people would kill the economy.
A totally different picture to the one you try and paint.
“GDP is a fake”
Hugo, are you fake too? If you think that GDP is fake, then you must believe that money is fake. I believe money is fake because it’s printed, but I can buy food with money.
Tony
GDP figures are for people like you.
and people like you never see things like this coming
https://www.dailymail.co.uk/news/article-5088405/When-cash-worthless-Germany-World-War.html
Hugo,
The problems in Germany after WWI were due to a very poorly thought out Treaty of Versailles, and a poor understanding of economics at the time. The money supply certainly needs to be carefully controlled, we can have hyperinflation like Germany or deflation like in the United States in 1929 to 1932. For those in debt, deflation increases the real value of their debt, mild inflation (2 to 3%) tends to keep the credit system intact.
You may naively think that debt is bad, but the Global Financial Crisis was due to a lack of credit. The credit markets froze and without credit markets the World economy grinds to a halt.
Too much credit is bad, too little credit is much much worse.
Try
https://en.wikipedia.org/wiki/Financial_crisis_of_2007%E2%80%932008
Hugo
How do you suggest the debt be paid?
Money spent by government provides income for those producing whatever government buys whether roads, schools or aircraft carriers.
Suggest an introduction to economics. Try
https://www.amazon.com/Economics-Paul-Krugman/dp/1572591501
Hugo,
You clearly don’t understand economics, take an introductory university level course or find one online.
Also try fiscal multiplier at link below.
https://en.wikipedia.org/wiki/Multiplier_(economics)
Hugo,
If I borrow 100,000 pounds to build a home, does that mean it is not really there when it is finished?
Maybe I can get my tax rate reduced, I will tell them my home is imaginary. 🙂
Dennis
You do not have a clue about what I know or do not know.
As I said already the interest payments on debt could build one million homes per year. Which could house families on low incomes in decent homes.
https://www.businessinsider.com/american-slums-2011-4?r=US&IR=T
The trouble with rich people like you, is you are too removed from the grinding poverty that needlessly effects ten of millions of Americans.
The debt has been built up by rich politicians and their mates.
Armaments companies owned by the elite, taking trillions of tax payer money to kill 100 thousand Iraqis. Weapons of mass destruction was a lie concocted by politicians.
https://www.cnbc.com/2018/11/14/us-has-spent-5point9-trillion-on-middle-east-asia-wars-since-2001-study.html
CEOs of banks and financial institutions who could not run a brothel in a naval port rewarded for crass incompetence.
https://www.forbes.com/sites/mikecollins/2015/07/14/the-big-bank-bailout/#624e8fa02d83
and the debt built up deprives ordinary people of the things such as social housing and enough police.
Perhaps you should read some other economic books
Hugo,
I understand economics very well, by your comments it is clear that you do not know the basics. I will leave it at that, don’t believe everything you read on the internet, there is a lot of magical thinking. National debt cannot be eliminated by magic. So complaining about interest on the national debt is a bit like complaining about green grass or blue sky, if one proposes no solution to the problem.
Krugman is a good source, it can probably be found at your local library.
Dennis
You obviously do not understand how governments work.
Most people know that the Iraq war was an illegal invasion costing trillions of dollars. The US government lied to it’s people and the world and invaded a country and 200 thousand people died.
https://www.iraqbodycount.org/database/
Telling people that this huge debt is how things should be is perverse.
The behavior of the banks was criminal and when these criminal organizations failed the government did not take them over as they should rewarded them with trillions in bailouts.
criminals helping criminals and you are too blind to see it.
Hugo,
The “huge debt” is what is, it is not about how it should be, it is about how it is.
You should consider doing some reading, try this very influential book.
https://www.amazon.com/General-Theory-Employment-Interest-Money/dp/198781780X
I am sure you can find it at the library or buy the kindle edition for 99 cents and read with the free app.
You may not realize that a lack of debt is more of a problem than too much debt, in fact the EU prolonged the recession in 2009, by following a policy of low government spending and balanced budgets in the face of a severe recession, much like Herbert Hoover from 1929 to February 1933 (FDR took office in March 1933.)
Perhaps an online class would help
https://www.masterclass.com/classes/paul-krugman-teaches-economics-and-society
I agree the war in Iraq was a bad idea, and perhaps some bankers should have been prosecuted. I think taxes on the wealthy should be higher so that income was more equal.
Last I checked we do not live in a perfect World and I have little control over how things play out.
I notice that you still have not proposed how to reduce government debt.
I proposed a potential solution, you did not like the proposal, but offered nothing as a substitute.
Deal with the World as it is and propose how to improve things instead of complaining about the past. We cannot change what has occurred, only what might occur in the future.
Hugo,
There is no need to eliminate government debt entirely, the economy continues to grow over time and if government budget was simply balanced by increasing tax rates and reducing spending the debt burden is reduced over time as the economy grows.
Taxes can be increased on higher income citizens who spend less of their income, for example in the US dividend and capital gains income is taxed at a lower rate than interest and wage income (24% vs 43% marginal rates at the higher income levels), this is an advantage mostly for very wealthy families who might have a considerable portion of their income in the form of dividends and capital gains rather than wages.
That tax break for the wealthy could be eliminated and raise revenue for the government. The wealthy spend a far lower proportion of their total income and save proportionately more than lower income families so economic output is affected much less by tax increases on the wealthy.
Dennis you confuse income with GDP. GDP measures a lot of things, but it is not “income.” You have made this mistake before, so I doubt you will change your thinking about this.
DuaneX,
See https://en.wikipedia.org/wiki/Gross_domestic_product
From the link above (read the entire entry for a full understanding):
GDP can be determined in three ways, all of which should, in principle, give the same result. They are the production (or output or value added) approach, the income approach, or the speculated expenditure approach.
…
The second way of estimating GDP is to use “the sum of primary incomes distributed by resident producer units”.[5]
If GDP is calculated this way it is sometimes called gross domestic income (GDI), or GDP (I). GDI should provide the same amount as the expenditure method described later. By definition, GDI is equal to GDP. In practice, however, measurement errors will make the two figures slightly off when reported by national statistical agencies.
Perhaps you can correct the Wikipedia entry along with every Macroeconomics text written since 1960.
You are correct that I generally will not change my thinking on what I learned as an undergraduate and graduate student in economics unless someone points me to a reliable source showing that I am incorrect.
Dennis,
There is the personal debt issue also. In the U.S. most people have either a small saving account or no savings at all. Many have no sufficient health insurance and each year many families go bankrupt because of unexpected high healthcare expenses. Probably in many countries the same problems exist. The credit card debt is higher than ever before in many countries. Apart from the general debts graphs, it is interesting to see graphs from this personal problems issues also. There is an increasing amount of very rich people who keep the economy ‘healthy’, but under the surface something is brewing.
If all the people with debts and few or no money in saving accounts are expected to buy an EV rather sooner than later….
Dennis this is not accurate. Government revenue for fiscal 2019 is $3.42T. We are running a trillion dollar deficit this year. That is roughly 30% debt to income, which is astronomical. Pretending the government could appropriate all revenue from the economy and then using this wishful figure is bad economics.
When a Company like Exxon need to sell parts off tjeir buisiness to pay dividend and fund investments that so far and might only give limited profit it is a very bad signal abd next might be years with increasing losses as they might get stuck in Permian and like most other shale Companies loosing money their stocks will plunge..
Steve,
The 2018 wells have higher initial production and slightly higher decline rates. I include those findings in my models. Which are not terrible, imo.
Dennis,
Honestly, I would be shocked if you had said anything different.
However, the point I am trying to make is that when an individual has climbed up different levels of the mountain and has finally reached near the top, the view down is much different than when you look at each step of the way.
The annual compounded decline rate for the Permian is now 70-75%, according to the Shaleprofile chart. While the Eagle Ford has continued with a very high annual compounded decline rate, they are only adding about 2,000 +/- wells per year. However, the Permian was nearly 5,200 wells in 2018.
Again, at some point, drilling 14,000+ wells a year to grow oil production will not be sustainable because no one is making more land anymore. The acreage will dry up along with the overstated reserves.
This is my point… not to bicker about percentages in decline rates.
steve
Steve,
Not a huge difference between 2017 and 2018, about 4% over 6 months.
If the Permian completion rate remains constant (495 new wells per month) until 2041 and EUR starts to decrease starting in Jan 2019, we get the following scenario.
Dennis,
I have copied and pasted that chart for future reference. So, let me ask you this. If we experience a SENECA CLIFF decline in Permian Shale production, rather than your nice rounded two-decade peak, would you be a BAD SPORT if I rubbed it in when it came true?
steve
Hi Steve,
I made an error in my program for the low completion scenario in the chart above. The correct scenario is in the chart below along with a more realistic scenario where completion rate increases and then decreases after the peak (as wells become less profitable with decreasing new well EUR. The scenarios have URR of 41 and 42 Gb and 122k and 126k wells. Both scebarios assume relatively low oil prices that rise to no more than $75/bo for Brent, I think oil prices will be considerably higher as the peak approaches, probably more like $90/b by 2027 (in 2017$).
That type of oil price scenario results in a URR of about 60 Gb with a fatter tail after the peak.
All my models have output peaking and then declining and the higher the peak the faster the decline, so your point is one I have been making for a long time, not really something new.
Steve,
Which of the curves in the chart below has the steepest decline rate?
Steve,
It is not that there is nothing to see, it is that it is not anything new. You seem to think the decline rate has become steeper, when it has changed very little.
Chart below has three curves that all have the same rate of exponential decline. Do you see why your chart with the dashed lines does not convince anyone that there is cause for alarm?
We have known about the steep decline rates for tight oil wells since at least 2012.
More data to ruminate on. Production was up by 200 kb/d this week over last week, according to this morning’s EIA inventory report. This increase can’t come out of thin air. Could this be a GOM platform coming back on line after maintenance or is it the same old story that the Permian continues to defy gravity and the experts.
Ovi,
Statistical variation is one possibility, wells go down for maintenance, etc, new wells come on line, lots of variability in the 350,000 oil wells producing in the US.
Probably a big platform. Much too large of a swing to be fracking completions.
Maybe this:
Giovanni Staunovo
?
@staunovo
This week’s domestic crude oil production estimate incorporates a re-benchmarking that affected estimated volumes by less than 69,000 barrels per day, which is about 0.7% of this week’s estimated production total.
KSA has been opaque about the capacity, actual production, and exportable production after the recent attack on Abqaiq and Khurais.
The following is a copy of a posting by WRS on the oilprice discussion board. It seems to be a very good summary of the known facts regarding the status of KSA production after the September attack.
“Well there are differences in production capacity and processing capacity and it was the latter that was impacted. There are two important levels of processing that were being discussed. The first level is called a GOSP, gas oil separation plant. That component is the first stage in processing the oil by removing the water and then separating the oil and gas which flow to different processing facilities or if oil, to storage tanks. The GOSPs for some fields are distributed around the fields which is the case for Khurais. So no loss of production occurred at Khurais other than what had to be shut in temporarily. What was lost at Khurais was 600kbbl/day of stabilization capacity. That is the part of the processing that removes H2S from the oil and also reduces the vapor pressure so that the oil can be put on ships for export or stored in tanks long term. There is enough oil used domestically in KSA that not all of it needs to be stabilized because it can be sent directly to a refinery instead of on a ship for export.
So what has been lost at Khurais is 600kbbl/day may not even be needed but very likely it was being used because that stabilization plant has been expanded by 300kbbl/day in the last 5 years. Why expand if you don’t use the capacity?
OK so now to Abqaiq where 7mmbbl/day can be processed directly from the oil fields if I understand correctly. The facility at Abqaiq can process 7mmbbl/day from the GOSP phase to the export phase. The oil from the fields first must pass through the spherical oil separators or spheroids as they have been referred to. There are 11 of those at Abqaiq and 8 were damaged which is 72%. The oil must first be passed through those in order to reach the stabilizers. Thus, 5.1mmbbl/day of both production and processing capacity were lost and will not be restored in short order unless some of the 8 were not seriously damaged. However, we can see that at least 5 of the 11 were seriously damaged and will be out of commission for quite some time, that is 45% or 3.18mmbbl/day of production AND processing that is impacted.
The media reported on the 5.1mmbbl/day plus 600kbbl/day of lost processing capacity which was correct. Now maybe they don’t need all of that processing capacity and weren’t using it but they weren’t exporting up to their normal levels when this happened. They were at around 6.7mmbbl/day or so for August I believe. In any case, they have certainly lost 3.2mmbbl/day of production processing. So supposing that Abqaiq has 18 stabilizers and five of them were severely damaged. This amounts to 27% of the export processing capacity or about 2mmbbl/day of lost export processing at Abqaiq. However, the remaining stabilizer towers may not all be operable due to proximity to towers that have to be repaired. It may be unsafe to operate the rest of the towers in close proximity that were not damaged. I believe that is part of the obfuscations that are taking place in the media and by KSA itself.
What we really want to know is exactly how much export capacity they have available, is it 6.8mmbbl/day? We can’t know for certain because some oil is exported from the east coast and some from the west. I believe it was running about 5mmbbl/day on the east and 2mmbbl/day on the west. I think the Khurais field supplies the west while Ghawar and several others supply the east through Abqaiq. I believe that ALL of the export capacity of the east is at Abqaiq. So if Abqaiq was previously processing 5mmbbl/day, the question is how much is it doing now? The claim is that it’s processing 4mmbbl/day. Hence, a loss of 1mmbbl/day at Abqaiq. I think the 600kbbl/day lost at Khurais will show up as a loss on the west coast. So it’s my view that the most that the Saudis will be able to export going forward, until more units are repaired, is 5.2mmbbl/day.
That is a far cry from the 8mmbbl/day they were exporting when they flooded the market and even the 7mmbbl/day that they have been exporting the last year or so. Hence, the market is going to be in deficit 2mmbbl/day for the next two months I think. I assume that the Saudis have some idea of what they can bring back by the end of November but my guess is that it won’t be 2mmbbl/day, half that if they are lucky.”
KSA seems to be making up whatever deficit there is by exporting some of their inventoried oil. They also seem to be placing some of the produced but unstabilized oil into inventory. Whether their exportable inventory will last until more processing capacity comes on is an unanswered question.
WRT the following from above
“The oil from the fields first must pass through the spherical oil separators or spheroids as they have been referred to. There are 11 of those at Abqaiq and 8 were damaged which is 72%. The oil must first be passed through those in order to reach the stabilizers.”
I saw this info at another site. Not sure if it is true or false. Can anyone confirm or deny that the spherical tanks are old and not working?
“At Abqaiq most of the damage was on the Spherical tanks. Missiles and drones precisely hit 10 of the 11 Spherical separation tanks . Just two of the fractionation/separation towers hit. Only one of the towers totally destroyed ( photo op) . Other was more cosmetic.
THE SPHERICAL TANKS ARE 60 YEAR OLD TECHNOLOGY. THEY DONT USE THEM ANYMORE.
The spheres were installed in the 60’s. They are antiques that are very time consuming , inefficient , expensive and lose up to 10% + of crude yield.
Can’t believe how “lucky” Saudi Aramco is that their enemy targeted useless tanks. Whew, dodged a bullet. “
Ok, even if its not timely fully accurate, here my presentation of the September RRC compelktions.
Take out: first time we are above the same month of 2018, maybe because of the new piplines and/or the price jump after the Saudi attack, October was the biggest bump in 2018, interesting to see whats happening next, with prices down again.
US weekly frac spread of Primary Vision still declining – to 365 (from 475 in May) lowest since April 2017
(I’m wondering if this is maybe the better overal indicator, because of the RRC completion registration lags)
Very interested diagram from RRC data Envision , what seems to me is that the increase in October 2018 could have a relation to oil price that increase above 70 usd WTI in that period, perhaps the increase in September is both related to increase oil price because Saudi attac and majours espesialy Exxon ramp up in permian. Could be nice also to implement graph off WTI price as it seems this is an important factor related to completations.
link WTI price
https://www.bloomberg.com/quote/CL1:COM
Freddy,
The RRC completion data is not very useful, better data at shaleprofile.
Hey guys, a thought experiment:
OPEC sells oil under the free market equilibrium theory, expressing the belief that there should be a single price for oil (more or less) at any given time, and that members interests are common enough to work together towards that one price of oil. But maybe the interests of poor producers (who need to sell anyway) and rich producers are not exactly the same. I think it was either Watcher or HHH who pointed that when Argentina introduced fixed oil prices, it thus decoupled from supporting the illusion of one oil price by equilibrium. Argentina is not an oil exporter and it still seems to have already been perceived as a problem.
But what if some rich exporter, UAE or Brunei for example, wanted to sell oil for substantially higher price, like 120$, for example? Could they just stop selling oil for 60$ and say “we are not going to labour towards some incremental price increase anymore, from now on only 120$ for our oil please” ? What would happen?
The astonishing lack of economical diversification in countries of OPEC (significantly, besides Iran) is a bit suspicious and may be the expression of attempts to force them to rely on selling oil by NOT having a choice of not selling oil (something like that was depicted in “Syriana” movie where the progressive prince was taken down). Therefore, it is not only Saudi Arabia that props petrodollar but the entire OPEC, by its very exsitence and policy, does so too.
The scenario is entirely legitimate.
It evolves from the fundamental concept that there is nothing negative for a country that is self-sufficient to decide to leave the oil underground for their grandchildren.
Norway is the obvious example of this. They are self-sufficient. They do not leave the oil underground for their grandchildren. Instead it has grown the largest Sovereign Wealth Fund in the world.
At some point it may occur to some people that oil underground is a Sovereign Wealth Fund in and of itself. Why produce and export that oil merely to convert wealth from one form into another? And dare I note the original form is likely quite a bit superior to the new form that is defined by unelected officials at central banks.
In the case of KSA, people think they produce oil to become wealthy, since they are producing far beyond their domestic consumption. But in their case it’s not quite that. They produce because a choice noted above would generate invasion in the pre shale days. Anyone without an army who chooses to leave their oil underground and has a big portion of global supply would likely have their oil taken away from them.
Think about that. If someone decides so just keep their own oil there’s probably no price you can offer them to change their minds because they have made the correct decision that oil is far more important than money. Such a decision would have to be changed by military force.
That’s why Argentina’s declaration of its own price is such a dangerous thing. It introduces all of the above thinking into too many minds — many of which are sitting on billions of barrels.
Well, Norway is not self-sufficient. It must import a lot of food, like KSA. It does not produce enough food even for its 5 milion citizens (like KSA, they tried, and failed). It must import a lot of other things, too. The biggest industry there is still oil and gas. Likewise, the biggest industry in KSA and UAE is oil and gas. Difference or similarity?
The largest soveriegn fund, by the very fact of being ‘largest’ is certainly a hostage of global economy.
So Norway is not a good example. It is a virtue signalling country par excellence. They signal virtue, not wisdom.
The interesting example would be Russia. Russia is self-sufficient, and can defend herself. Why not to decouple from global economy? Why pump 11 mbd, and not 6 mbd like in the nineties?
Russia is a country of a gas station. The rulers decided that it was possible to sell oil and buy everything that was needed.
The economy is regulated. A lot of checking authorities on whose decisions the work of business enterprises depends. A lot of different raiders associated with law enforcement agencies.
Damn democracy in Russia, and in order to be re-elected, the government must constantly raise the standard of living, which means that it is difficult to develop domestic production, although there is little progress.
If oil production is reduced, living standards will decrease, unrest will begin, there will be problems with the re-election of the ruling elite.
One of EU,
Unless UAE had some reason that their oil was special, they would sell no oil on international markets if they raised their price.
Let’s say you own a vehicle that uses petrol, you drive doen the street and see toe petrol stations, at one the price is 10 Euros per liter and at the station right next to it the price is 5 euros per liter. I know which station I would choose and I bet most other customers would do the same. One of the two stations gets all the petrol sales, can you guess which it is?
Any nation can ask whatever price they wish for their oil, the customers will buy the oil that sells for the lowest price.
But what if 5 euros station did not have any more fuel?
Would I buy fuel for 10 euros?
If I really needed it, yes.
The peculiarity of fuels market is its relative flateness. You can buy diesel for 1.23 or 1.29 euro (current prices), but not for 2.29, whereas you can buy chocolade for 0.69 and 2.69 euro, and so with meat and other things.
So maybe if I were UAE I would just market my oil as some kind ‘luxury’ and would demand high prices.
PS. Some problems with scrolling by me too.
OneofEU,
Do you see big differences in prices between petrol stations that are near each other? Maybe it is different where you live, in my neighborhood the prices are very similar as most businesses realize that they don’t make any money when they don’t sell anything.
On different price of meat or chocolate, there are different qualities of those products, just like cars, clothes, shoes, etc.
Oil is relatively uniform, though there can be differences in weight, sulfur content etc and those differences are reflected in the many different prices for different oil blends. The petrol sold in different petrol stations is pretty uniform.
Uniform, unless you add benzene or fuel oil. It is already a plague in EU. Cheap fuel means some addition. So I suppose the pure fuel may become a kind of luxury in future.
One of EU,
Not really a problem in the US, though some people complain about ethanol in the gasoline, one can find no ethanol gasoline, but it is very expensive, using a fuel additive, if having problems, is far cheaper.
The competing view to the above scenario is being advanced by today’s tree huggers. Oil in the ground 10 yrs from now will be “Stranded Oil” because of electrification of transportation. It’s a bit far fetched because they forget, or more probably don’t know, that close to 50% of the oil is needed for industrial purposes. These green NGO’s have been successful in convincing a few oil companies that they must assess the risk of stranded oil in their reports to shareholders. From what I have read, I think Shell has taken this possibility seriously.
“Internal studies by a group of analysts within Shell known as the “scenarios” team had concluded that global demand for oil might peak in as little as a decade—essentially tomorrow in an industry that plans in quarter-century increments. Hastening the peak was an onslaught of increasingly competitive fossil-fuel alternatives, from solar and wind power to electric cars, whose prices were dropping far faster than Shell executives had expected. When the oil-demand peak came, Shell believed, petroleum prices might begin a slow slide, dipping too low to cover the costs of oil-sands production.
So it appears that we are in this transition zone between the competing scenarios of “Peak Demand” pushed by the greens and extensively reported by the MSM and “Peak Oil” which is rarely reported, and if reported, mocked. For those of us here, we know which scenario will become apparent first.
Ovi,
Keep in mind that liquid fuels (gasoline, diesel, jet, fuel, and residual fuel) are the important use of “oil”, other uses are less important or there are other sources of supply. Those fuels are about 80% of World C+C output. Gasoline and diesel are about 65% of World C+C output and their primary use is land transport, so electrifying transport is a solution to the peak supply problem, peak demand would be a good problem to have, though perhaps not for oil producers. Doubt we reach a point where demand falls below supply before 2050 and perhaps even 2070.
Dennis
Below are two charts that show oil use by sector. Searched for “Oil use by sector” to get them. They show that road use can be somewhere between 47% and 57%.
Ovi,
Pretty sure your “oil chart” is an all liquids chart.
Look at regional oil tab at BP stats and compare with EIA C+C statistics. Note that like Ron, I don’t consider “bottled gas” such as propane, butane, or ethane as “oil”, and would tend to exclude ethonol and biodeiesel as well.
In 2018 petrol and diesel consumption was 54120 kb/d (from BP stats), if we deduct rail use (using your chart 1/57 of oil use for land transport is rail) we get 53170 kb/d, World C+C output was 82979 kb/d, so about 64% of World C+C output was used for land transport (I assume water transport uses fuel oil.)
Note that I expect rail transport could be electrified over time, if that were included as part of land transport, the total in 2018 would be 65% of C+C output was consumed by land transport.
Chart 2: OIL-Final-Energy-Consumption-by-sector-EU28-1990-2014-MTOE.png
What’s non-energy use which is not industry use?
Surprising amount goes to power generation. Must be Greece with all those islands. Residential and aviation are to be cut now, Germany prepares to ban any new heating oil installations. But that’s not so much anyway.
“What’s non-energy use which is not industry use?”
Asphalt, Vaseline ?
Boy, I didn’t realize that Europeans were so into Vaseline!
That’s the question.
Ovi,
I am using World numbers, and perhaps a different definition of “oil”.
Surprising that agriculture/ forestry is that high. If we assume that for the World about 2% of all liquids use was for agriculture (possibly this would be a bit lower in emerging economies) the land transport would drop to 62.8% in 2018, in the future agriculture may switch to biofuel as oil prices rise.
I suppose it is more about fertilizers and pesticides than about tractors.
OneofEU,
Could be from NGL I suppose, EU uses a poor definition of “oil”,
NGL is not oil, useful for cooking, heating (drying crops for instance) and chemical inputs, but mostly not used very much in land transport.
Isn’t NGL known as petroleum gas ?
Pretty popular as auto fuel in EU, too, at least in some countries.
OneofEU
When I have driven in Europe I never noticed any propane fueling stations.
My guess is that it is a very small part of fuel supply for land transport.
Have you ever driven such a vehicle on a road?
I have seen fork lifts powered by propane other than that just heating systems cooking and grilling.
Dennis
I have wondered what the increased discussion of Peak Oil in the MSM would do. I guess it would move the world toward reducing its use of FF which would be good.
However the comment above by Laherrere regarding how much Oil and coal is pumped into the CC models is concerning. Don’t these scientists look at real oil production and where it’s headed. I hope the answer is not “it is not in their interest to check on oil production trends”
“He (Laherrere) then compare with his own scenario, and find that coal production is 10 times his predictions, while oil and gas are 7 times his predictions.”
Shocking if true.
Ovi,
The higher RCP 8.5 scenarios are not realistic from a peak fossil fuel perspective. The RCP4.5 scenario and even the RCP6.0 scenarios are realistic. I have long believed this, but many disagree. Coal and natural gas URR have not been studied as closely as Oil.
Some great work on this by Steve Mohr
https://ogma.newcastle.edu.au/vital/access/manager/Repository/uon:6530
and 2015 update below, but you have to request the doc
https://www.researchgate.net/publication/267870440_Projection_of_world_fossil_fuels_by_country
DC,
OT but not really:
Every post on both threads, new and former, is labeled New and has the light-blue background. Is anyone else having the same happen?
Probably your browser’s cookies have been reset.
How is this for irony. After pushing the benefits of US tight oil and encouraging US companies to sell their Cdn oil sand assets to invest in LTO, Wall street shifts again. So much for stranded oil. Two of the big sellers of their Canadian assets are Devon Energy and Shell.
This is from today’s Globe.
https://www.theglobeandmail.com/investing/markets/inside-the-market/article-wall-street-eyeing-canadian-oil-sands-amid-us-shale-disillusionment/
Disillusionment over the U.S. shale oil boom is leading Wall Street to reconsider an alternative that was largely abandoned by American energy investors – the Canadian oil sands.
After years of pursuing growth at virtually any cost, U.S. frackers, which use horizontal drilling techniques to tap shale deposits unavailable through conventional drilling, have seen investors lose patience in recent months over excessive drilling, well performance issues and a lack of profits.
With many investors now demanding U.S. shale companies prioritize free cash flow and returning money to shareholders, suddenly Canadian producers don’t look half bad by comparison, said Dane Gregoris, senior vice-president of capital markets at RS Energy Group in Calgary.
“Oil sands producers are ahead of the game [regarding] this slow-growth mantra that’s now affecting U.S. shale.”
Analysts at Goldman Sachs recently pointed to the oil sands as “screening favourably” relative to U.S. peers, citing attractive free cash flow and dividend yields.
That echoed the thesis of Merrill Lynch analysts, who said in a research note in September: “We maintain our preference for Alberta (oil sands) over Texas (shale).”
Investors, however, do not appear to have followed that advice in any substantial way. Though Canadian energy stocks as a group have meaningfully outperformed the U.S. sector over the past year, domestic exploration and production (E&P) companies are still trading close to 20-year lows.
“That trade has been a widow-maker for the last several years,” said Brian Madden, a portfolio manager at Goodreid Investment Counsel. “There are still a lot of problems with Canadian oil.”
Those problems include a shortage of transportation options, as pipeline capacity is scarce and crude by rail serves as only a partial solution.
Chronic delays in divisive pipeline developments prompted the province of Alberta to impose mandatory production cuts on the sector, which are still in place.
And the oil sands is increasingly targeted by the global divestment movement, which aims to cut off money to fossil fuel industries as a way to combat climate change.
This week, the largest pension fund in Norway said it sold its holdings in four Canadian energy stocks – Cenovus Energy Inc., Suncor Energy Inc., Imperial Oil Ltd. and Husky Energy Inc. – as part of a full exit from the oil sands. The fund, known as KLP, likened production from the oil sands to coal in terms of environmental impact.
Global institutional investors are increasingly incorporating environmental and social considerations into their investment processes.
“The oil sands isn’t perceived to fit that bill. There is a lot of reputation repair that needs to be done,” said Morgan Kwan, a vice-president at RS Energy Group.
Domestic investors have also found plenty of reasons to flee from the oil sands, as many of them shifted their energy exposure south of the border as the shale boom gained strength.
“U.S. shale siphoned a lot of investment dollars out of Canadian E&Ps,” Mr. Madden said.
In the wake of that exodus, the oil patch has been forced to undergo a restructuring.
Unlike their U.S. counterparts, most oil sands producers have largely lost the option to expand output, because of pipeline constraints and curtailment. They’ve had little choice but to consolidate, pay down debt, reduce expenses and increase dividends and share buybacks.
“They’ve had to strengthen their business models and capital structures,” said Patrick O’Rourke, an energy equity analyst at AltaCorp Capital. “By and large, the weakest business models have been flushed out of the system.”
Many of the companies that remain can generate substantial free cash flow at today’s oil prices, and in some cases, pay double-digit dividend yields.
Typically, a yield that high is a sure sign of an impending dividend cut.
“Given the numbers today and their balance sheets and how much money they’re making, they don’t need to cut their distributions,” said Bill Harris, a partner and a portfolio manager at Avenue Investment Management in Toronto.
And yet, alluring yields and valuations plumbing record depths do not yet seem to have won the oil sands many converts, American or Canadian, Mr. O’Rourke said.
“The business models themselves look good. The valuations are compelling. I don’t think investors are quite there yet. But when they are, there’s going to be a lot of opportunities.”
We have a new Premier in Alberta that is really pushing to bring back investment to the oil sands. He’s dropping the corporate tax rate to be the lowest in North America and has been traveling around promoting Alberta as “open for business”.
He has also created a “war room” called the Canadian Energy Centre to fight back against misinformation and promote the technological advancements happening in our oil production (most related to the environment and climate)
The previous government’s main effort was to diversify the economy. They made progress but it wasn’t enough, so we are back to the basics.
We go to the polls later this month for a Federal election. Right now it’s too close to call, but looks like it will either be a minority Liberal or minority Conservative government. Both of which should still result in the TMX pipeline moving forward.
I am concerned that the NDP and/or Greens might say, kill TMX and you get our support. That would put them in a tough spot to bring the govt down two or three months after an election.
https://www.rigzone.com/news/wire/shale_wells_riding_the_edge_of_profitability_at_present_prices-10-oct-2019-160035-article/
I wonder how Bloomberg estimate that US shale is profitable with WTI 51 USD next 2 years. Perhaps they mean before capital cost, interest and before loan ballons are payed. Halcon have now gone trough Chapter 11 and billions of depth have been written down same with interest they now look forward to do Buisiness with focus on spending after earning.
A bit difficult to scroll. Conversation above concerning Norway self-sufficiency. The intention was oil only, but introducing food is legitimate. I think the amounts of food imported, essentially 1/2 of consumption, probably would not need oil for trade because they sell a lot of condensate and natural gas as well.
The Saudis list vegetables as 8% of total imports with the items ranked higher being non-food, and that number includes all the non-citizens. But there’s no point in quibbling over Saudi food self-sufficiency. They do grow some and they have the largest dairy in the Middle East, as I recall.
The suggestion of Russia being the entity that chooses to save the oil for the grandchildren doesn’t really work for two reasons. The first is oligarchs who would fairly quickly understand that the concept of wealth is being redefined and their own yanked right out from under them. Assassinations would be inevitable. The second is more subtle and probably more powerful than the first. It is, simply, but they’re going to win.
They have the surface area for undiscovered resources. They have tremendous margin for gradual reduction in output, with margin being defined as excess over domestic consumption. The operative word is gradual. They’re going to win, provided they can manage to stay out of big wars. Their policy has evolved and is evolving into one of conflict avoidance. They will take opposite positions to the United States, but none of a magnitude that would cause thrown ICBMs. Victory will come from the inevitable reality of they being the last superpower to have oil. When scarcity arrives it will crush their competitors and not them.
That is when they offer to help America’s cities to eat, in return for unilateral American disarmament.
Iranian officials say two rockets struck an Iranian tanker traveling through the Red Sea off the coast of Saudi Arabia
https://www.cnbc.com/2019/10/11/explosion-sets-ablaze-iranian-oil-tanker-near-saudi-port-state-media.html
Ecuador’s state-run oil company, declared on Wednesday a force majeure on all oil trading operations, according to an evening Tweet by Petroecuador, citing mass protests that have disrupted the country’s oil industry.
Petroecuador also said that it had completely shut down the TransEcuadorean Pipeline System known as SOTE, which normally carries 360,000 barrels per day, because it does not have enough oil to move through it.
https://oilprice.com/Latest-Energy-News/World-News/Ecuador-Declares-Force-Majeure-On-All-Oil-Operations-As-Protests-Escalate.html
Why are the people protesting, they should just by an EV now when its an even better deal and if they are hungry they can eat cake.
Nothing matters anymore, they want to CUT anyway:
https://oilprice.com/Energy/Oil-Prices/OPEC-Chief-Hints-At-Deeper-Cuts-In-December.html
Doesn’t Ecuador exit solve the problem?
I mean, with members leaving, the relative share of OPEC cuts increases more and more. Actually, they should be cutting less and less.