February Non-OPEC Oil Production Climbs

A guest post by Ovi

Below are a number of crude oil plus condensate (C + C ) production charts for Non-OPEC countries created from data provided by the EIA’s International Energy Statistics and updated to February 2022. This is the latest and most detailed world oil production information available. Information from other sources such as OPEC, the STEO and country specific sites such as Russia, Brazil, Norway and China is used to provide a short term outlook for future output and direction for a few countries and the world.

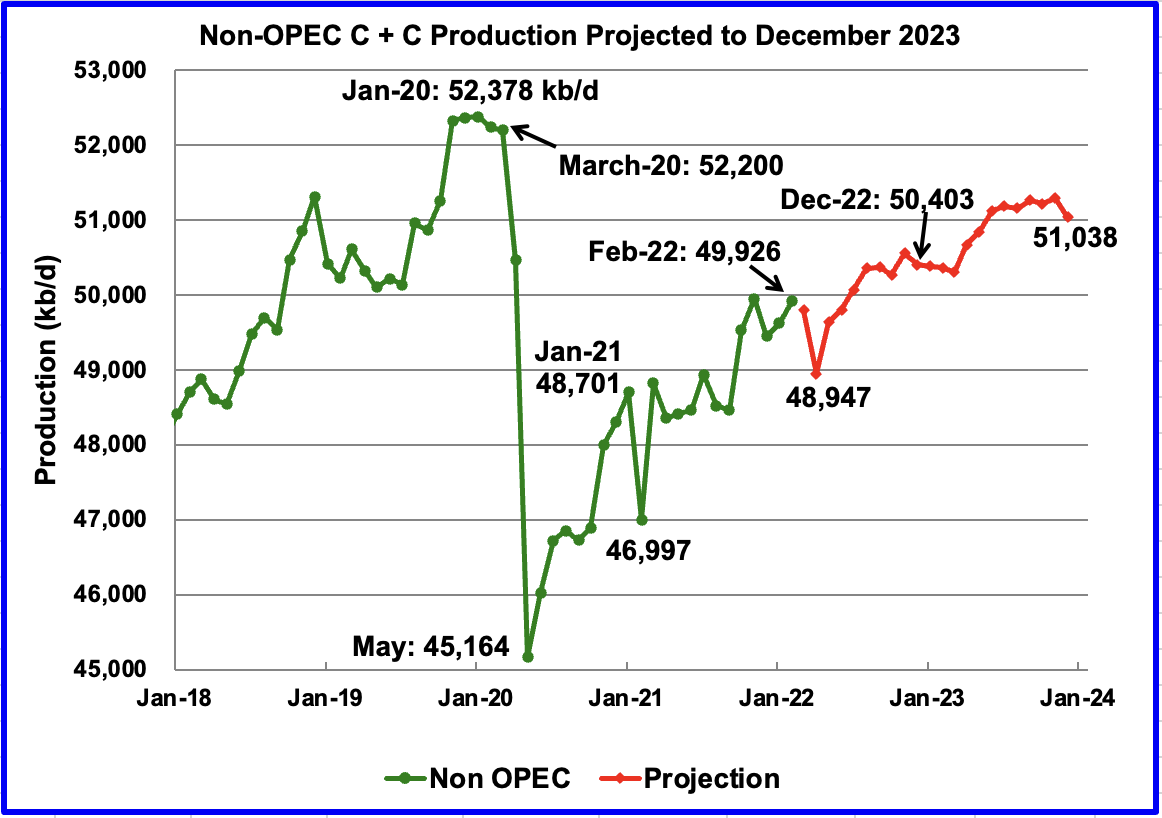
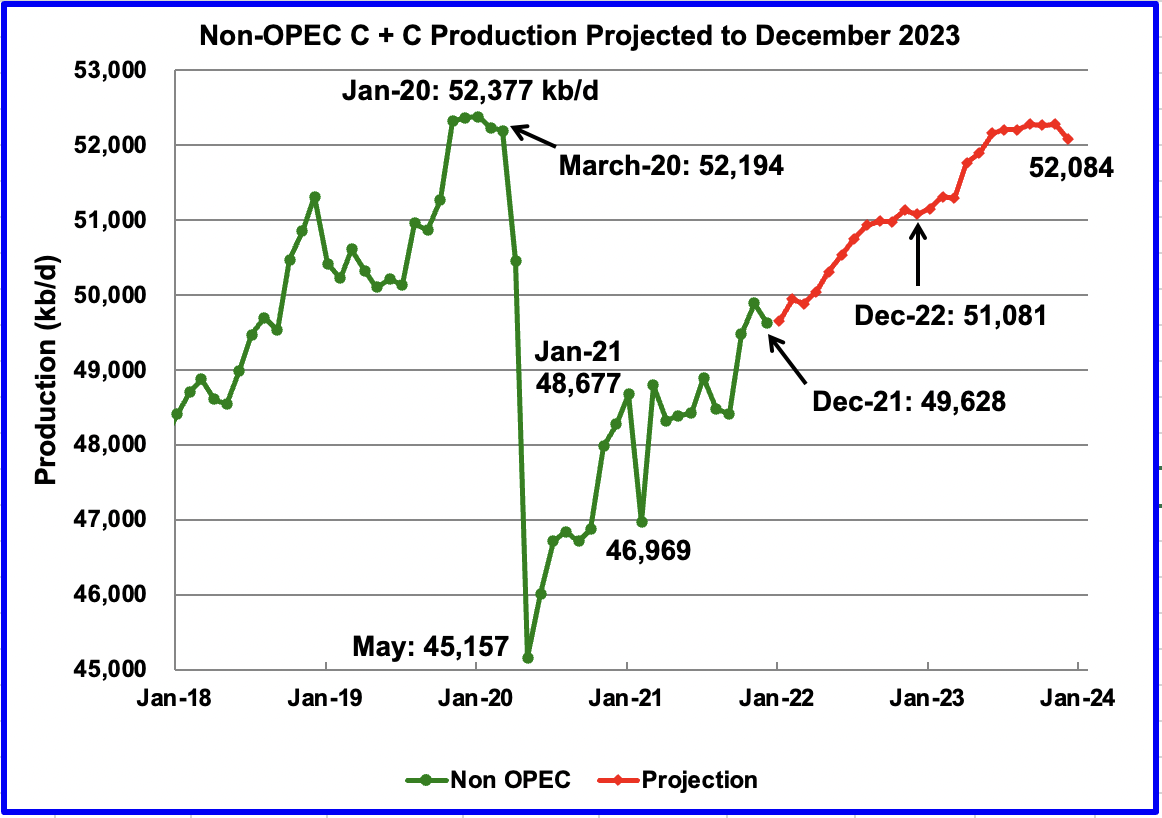
February Non-OPEC production increased by 303 kb/d to 49,926 kb/d. Of the 303 kb/d increase, the biggest increase came from Canada 225 kb/d. Offsetting the increase were decreases from Brazil 116 kb/d and China 92 kb/d. The Febuary 2022 output of 49,926 kb/d is 2,274 kb/d lower than the March pre-covid rate of 52,200 kb/d.

Read More

Gulf of Mexico update

Through 2021 the federal waters of the northern Gulf of Mexico (OCS) have cumulative production of 23.4 Bbo and 193 Tcf.  The deepwater (water depths > 1000’ as defined by BOEM) has produced 10.2 Bbo and 23.5 Tcf while the shelf has produced 13.2 Bbo and 169.5 Tcf.  From a BOE standpoint, the GOM has primarily been a gas province, and the bulk of that production has come from shelf fields.  While the shelf has produced more cumulative oil than deepwater, over 90% of current oil production comes from deepwater fields. 

First production from the OCS occurred in 1947.  First deepwater production was in 1979 from Shell’s Cognac field in 1022’ of water.  GOM oil production in December 2021 was 1.69 mmbopd as per BSEE.  As Ovi says in his monthly updates, if GOM were a state, it would be the 2nd leading oil producing state in the US, only behind Texas.

Brief history of GOM gas production

GOM gas production peaked in 1997 at 14.4 bcf/day and has been declining ever since.  Current gas production is about 2 bcf/day. 

Figure 1 – GOM gas production, with shelf and deepwater broken out.  Data from BOEM.

Read More

Non-OPEC December Oil Production Drifts Lower

A guest post by Ovi

Below are a number of crude oil plus condensate (C + C ) production charts for Non-OPEC countries created from data provided by the EIA’s International Energy Statistics and updated to December 2021. This is the latest and most detailed world oil information available. Information from other sources such as OPEC, the STEO and country specific sites such as Russia, Brazil, Norway and China is used to provide a short term outlook for future output and direction for a few countries and the world.

December Non-OPEC production decreased by 261 kb/d to 49,628 kb/d. Of the 261 kb/d decrease, the biggest decreases came from the US 205 kb/d, Brazil 113 kb/d and China 91 kb/d. Offsetting the decreases were increases from Norway, 117 kb/d and Guyana 86 kb/d.   

Read More