World Exports versus Consumption, The ELM

The EIA has updated their International Energy Statistics with annual production numbers through 2014 and export data through 2012. Sometimes these stats can be confusing as they include several types of production and exports. But for production I use only “Crude plus Condensate” and for exports I used “Crude Oil Exports” which I assume includes condensate as well.

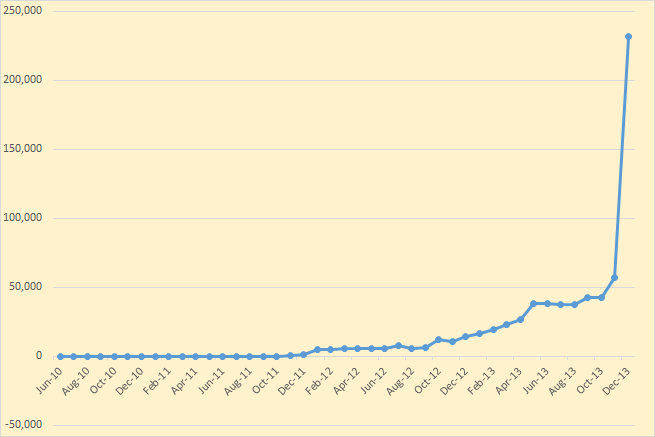
Also the export data is not exact, just close, because some importers are also exporters. For instance in 2001 the US exported 59,000 barrels per day. In 2012 the US exported 629,000 barrels per day. The exporting of condensate is allowed in the US and since the Shale boom condensate exports have increased quite dramatically because Light Tight Oil is rather top heavy with condensate.

To get exports versus consumption for exporting nations I simply subtracted their exports from their production. The difference was what they consumed. Similar data can be found on the Energy Export Databrowser.

I think the data clearly endorses Jeffrey Brown’s Export Land Model.

World E v C

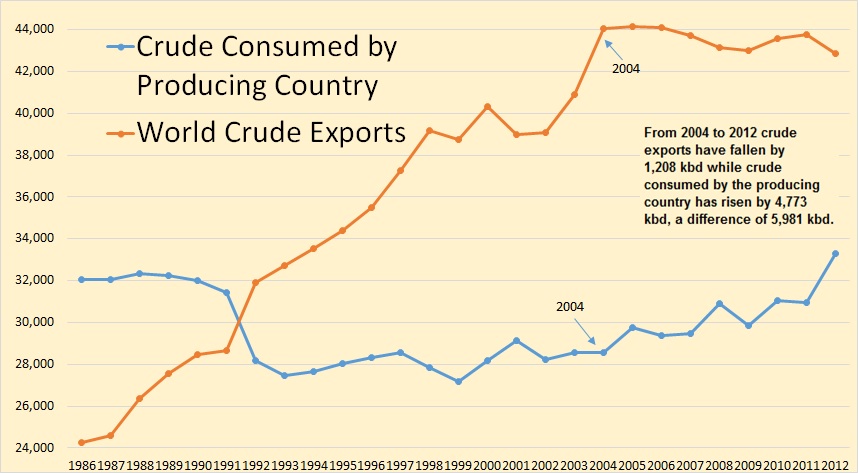
In 2012 76,160,000 barrels of C+C were produced per day. Of that 76 million barrels 42,845,000 barrels were exported while the other 33,315,000 barrels was consumed by the producing nations. That is this is oil that was never exported.

Read More

Texas RRC Crude and Condensate Data, Is Eagle Ford Peaking?

This page Texas Oil and Gas Production was last updated on February 18. However the data on this page has been updated. And the January production has been updated also: Oil and Gas Production Data Query then check “Lease”, “Both”, Statewide and then punch in the appropriate dates. Then when the next page comes up click on “Monthly Totals”. This brings up the updated monthly totals for Crude, Casinghead Gas, Gas Well Gas and Condensate.

There were revisions going back to July 2010 but only 2013 had any major revisions though there were some 2012 revisions also as the chart below shows.

Texas Revisions

The earlier revisions were smaller and there were some of them that were negative. That is the figures were revised downward.

This chart compares Texas with North Dakota. This is all Texas not just Eagle Ford. The last data point for all is January 2014.

Texas + North Dakota

Though there is a lot of conventional production in Texas, the increase is nevertheless about all tight oil. And these two states produce perhaps 95% of all tight oil produced in the United States. And that is about 2  million barrels so far if the Texas RRC is close.

Read More