Is Non-OPEC Oil Production Recovering?

A post by Ovi @ peakoilbarrel.

Below are a number of oil production charts for Non-OPEC countries, created from data provided by the EIA’s International Energy Statistics and updated to August 2019.  Information from other sources such as the IEA and OPEC is used to provide a short term outlook for future output and direction.

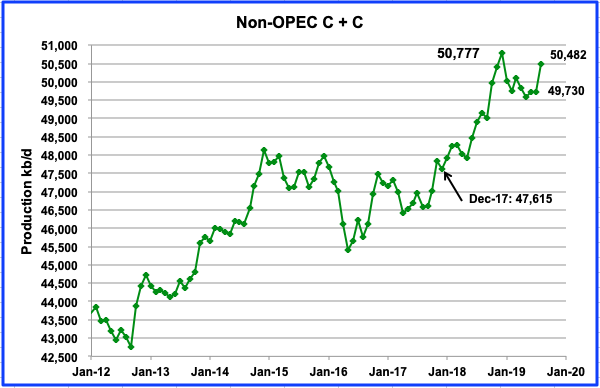
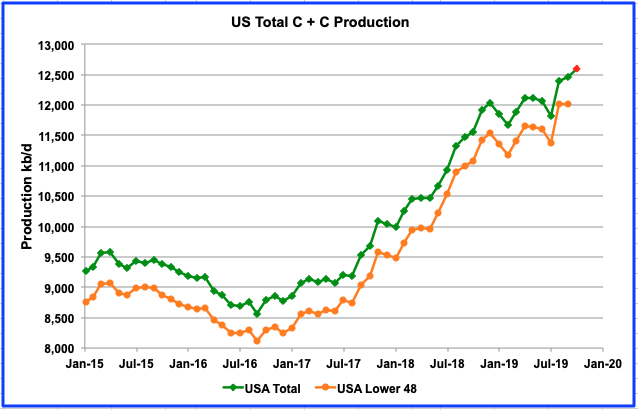
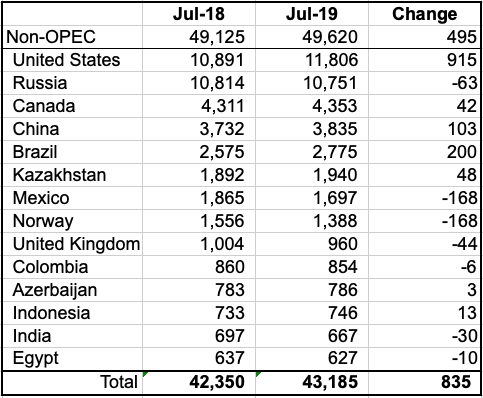
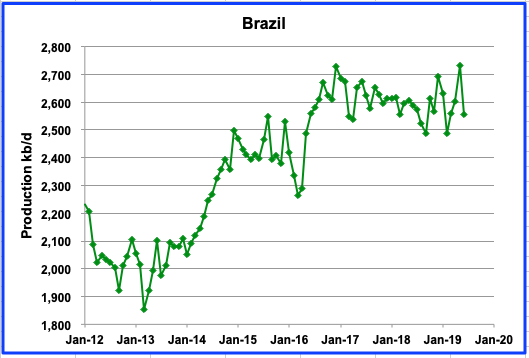
Non-OPEC production increased by 752 kb/d to 50,482 kb/d in August from 49,730 kb/d in July. This is the first significant monthly increase in 2019. Output declined from January to May. The main contributor to the increase was the US by adding 599 kb/d. This leaves August production just 295 kb/d short of the previous high of 50,777 kb/d reached in December 2018. New output from Norway and Brazil, along with increasing US output coming in the next few months could raise Non-OPEC output beyond the previous December 2018 high. The question “How much higher beyond the December high” is of great interest to OPEC+.

Read More

Is US Oil Production Growth Slowing???

This is a guest post by Ovi here.  

All of the oil production data for the states comes from the EIAʼs Petroleum Supply Monthly.

The charts below are updated to September 2019 for the largest US oil producing states (>100 kb/d).

There continues to be much speculation and information pointing to a potential slowing of US oil production.  However the latest production data from the EIA continues to point higher, albeit at a slower rate.

Read More

EIA Non-OPEC Oil Production Updated to July 2019

Below are a number of Non-OPEC charts created from data provided by the EIA’s International Energy Statistics.

The charts and table below are primarily for the world’s largest Non-OPEC producers and are updated to July 2019, except for the U.S., which is updated to August 2019. The first set of charts is for Non-OPEC countries with production over 500 kb/d and the last few provide a world overview.

Under some charts are added country comments from the IEA since I have updated data from them up to September 2019. While the IEA production numbers reflect “all liquids”, their July to September increments provide an indication of how the trend in the EIA charts will change by September.

Read More

Non-OPEC production according to the EIA International Energy Statistics

Below are a number of Non-OPEC charts created from data provided by the EIA International Energy Statistics.

Since the EIA site is still in the Beta stage, the data and countries listed change from month to month.

Ron has been doing a lot of work with OPEC production data and the EIA US data.  I am adding the EIA’s Non-OPEC charts to provide a world overview of how the production from a range of countries is progressing.

The charts below are primarily for the world’s largest Non-OPEC producers and are updated to June 2019, except for the U.S., which is updated to July 2019.  If you are interested in additional countries, let it be known.

The first set of charts is for Non-OPEC countries and the last few provide a world overview.  Under some charts, I will add country comments from the IEA since I have updated data from them up to August 2019.  While the IEA production numbers reflect “all liquids”, their June to August increments provide an indication of how the trend in the EIA charts will change by August, since that is their latest data.

A personal note: I am not an oil expert. However, I do enjoy playing with numbers and looking at charts.  I am a follower of this great site because of my interest in the Peak Oil question/issue.  I do appreciate the info and insight provided by the experts on this site and want to thank Dennis and Ron and other posters and followers for keeping this site active and current. 

Read More

EIA tight oil estimates

The US Energy Information Administration publishes Tight Oil Production Estimates by Play each month (can be found at link above.)  I noticed this month that the estimates seemed different than I remembered so I checked earlier estimates I had saved on my computer.  The chart below compares estimates from Dec 2018 to April 2019 (where the last month of data in the estimate is Dec 2018, Feb 2019, March 2019, and April 2019).

chart/

Read More