This is a guest post by Ovi here.
All of the oil production data for the states comes from the EIAʼs Petroleum Supply Monthly.
The charts below are updated to September 2019 for the largest US oil producing states (>100 kb/d).
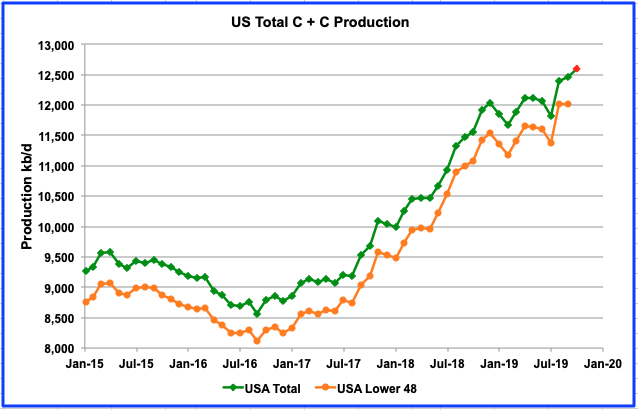
There continues to be much speculation and information pointing to a potential slowing of US oil production. However the latest production data from the EIA continues to point higher, albeit at a slower rate.
US C + C production reached a new high of 12,463 kb/d in September according to the November EIA 914 report. Looking forward to October production, the November Monthly Energy Review (MER) estimates US production for October to be 12,600 kb/d, an estimated increase of 137 kb/d, shown in red as the last data point.
The initial growth estimate for 2019 indicates a slower growth rate for 2019 vs 2018. In 2018, growth to September 2018 was 1,432 kb/d. For 2019 it is 426 kb/d, ~30% of the 2018 growth rate. So while US production is growing, yearly growth is slowing.
However it needs to be noted that there was no increase in September production relative to August in the L48 states. A number of increases in Texas, New Mexico and Oklahoma were offset by large decreases in the GOM (-114 kb/d) and North Dakota (-40 kb/d) that led to no growth.
US Oil Production by State
Listed above are the 10 states with production greater than 100 kb/d. These 10 account for 10,106 kb/d (81%) of total US production of 12,463 kb/d in September.
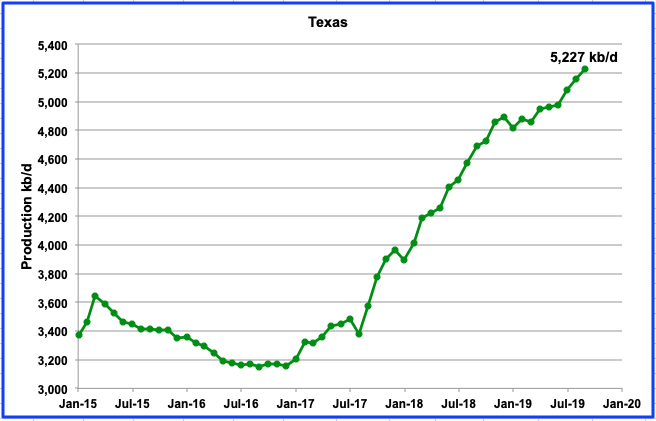
In September, Texas production continued to rise and rose by 72 kb/d to 5,227 kb/d. Again, comparing the initial growth estimate for Texas for 2019 vs 2018 indicates a slower growth rate for 2019. In 2018, growth to September 2018 was 729 kb/d while for 2019 it is 331 kb/d, ~45% of the 2018 growth rate.
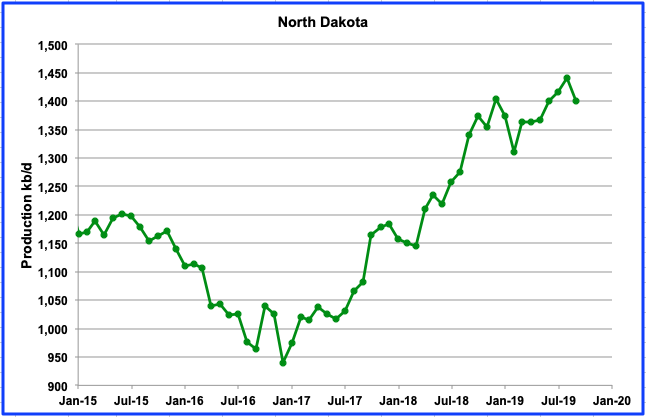
North Dakota’s September production is down by 40 kb/d due to heavy rain according to the Star Tribune. According to Shale Profile, ND added 119 new wells in September but these were not enough to overcome the legacy decline. For 2019, average peak production for ND wells is 713.9 b/d, according to Shale profile.
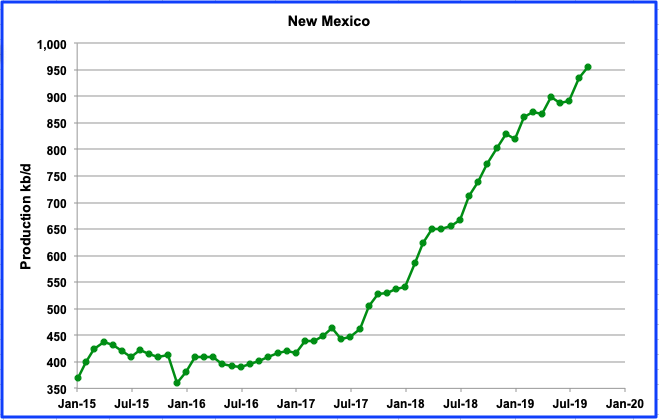
New Mexico’s September production increased by 21 kb/d to 956 kb/d. This is about half of the August increase and could be related to storm/weather activity.
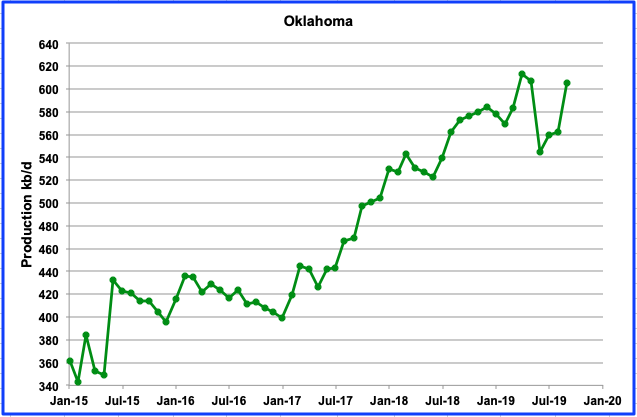
Oklahoma’s September production increased by 43 kb/d to 605 kb/d. This is a large increase relative to production from June to August. What is surprising is that a June report indicated a loss of interest by drillers in Oklahoma. According to the headline in Reuters, “Interest dims in Oklahoma shale play as drilling results disappoint“. Apparently the geology has stymied hopes for a “Permian Jr”: “Exploration wells pointed toward uniform rocks that produced high levels of oil, but producers instead encountered more complexity underground, and production weighted toward gas – at a time of a global glut and stubbornly low prices for the commodity.”
While production is still lower than the April high, we will need to wait to see if production is on a plateau or will increase further.
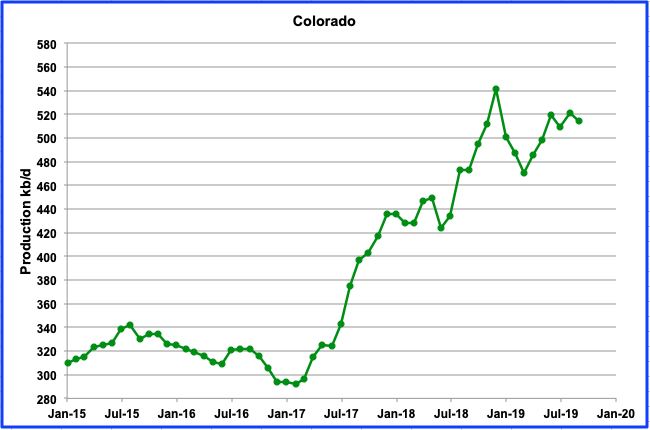
Colorado’s September production has been on a plateau since June between 510 kb/d and 520 kb/d possibly due to new regulations. However according to the Colorado CPR news, All systems are “Go” for Colorado oil and gas.
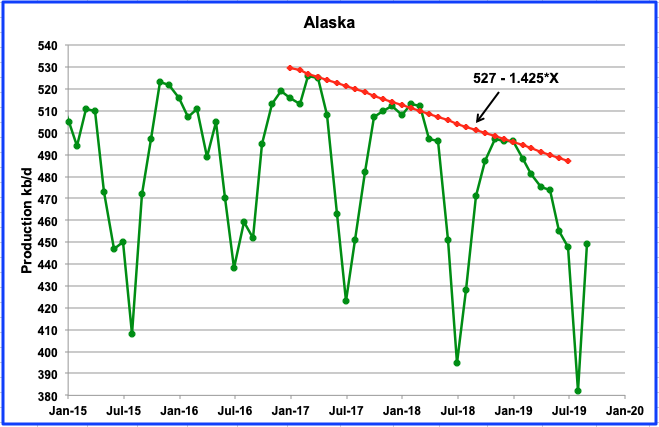
Alaska’s September production increase is associated with the end of summer maintenance. The November MER is predicting a further increase to 477 kb/d for October. However the September number is being questioned by the Alaska Frontiersman. They claim that “Oilfield operators produced an average of 478,756 barrels per day in September and October, compared with 505,822 barrels per day for the same months of 2018, according to the data.”
The answer to the question of whether Alaska production will exceed 500 kb/d this year requires a few more months of production data.
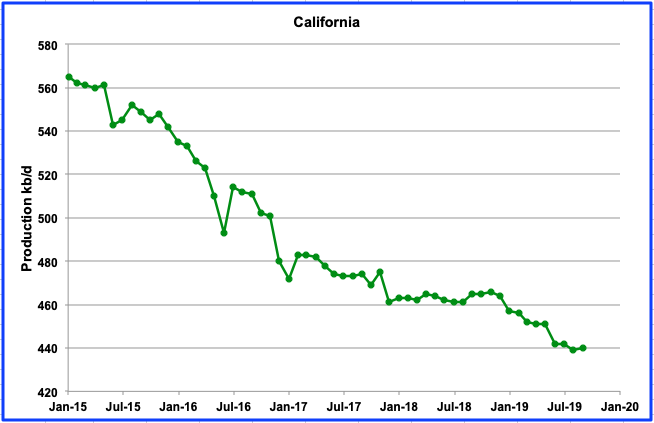
California production has been flat since June at 440 kb/d. Since 2017, production appears to be going through a step process of a flat period and then a ramp down. Bottom line is that there is little sign of recovery.
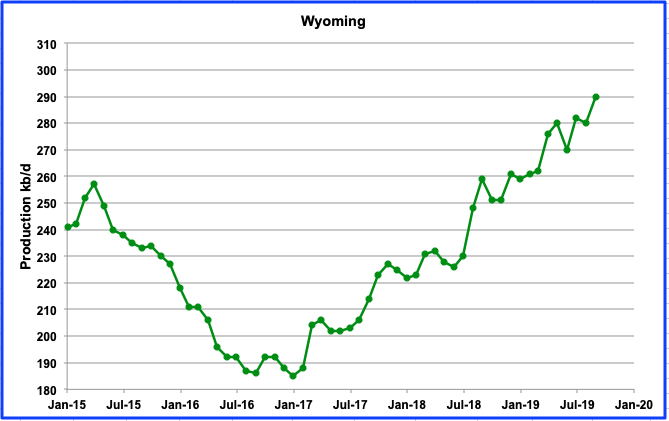
The northern portion of the Niobrara LTO basin is situated in Wyoming. The sharp increase in Wyoming production from January 2017 is directly related to increased drilling in the Niobrara. One year ago September, on average Wyoming had 30 rigs operating. As of September 2019, it has increased to 35. We should expect to see production increasing. However, in November there are only 31 operating. It will be interesting to see if production decreases. For all of the Niobrara, September production increased by 9 kb/d. Wyoming by itself increased by 10 kb/d.
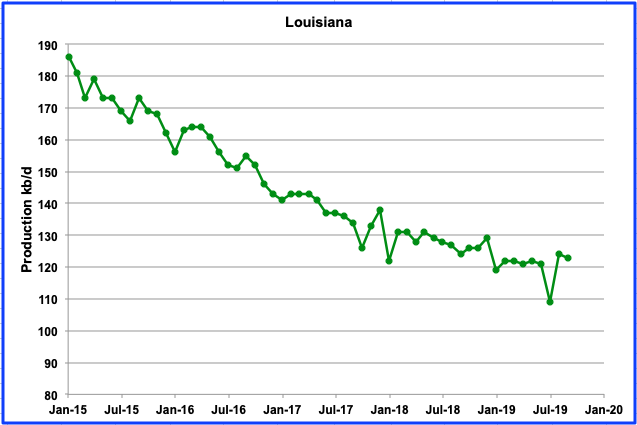
Louisiana had a production recovery in August but it did not continue into September.
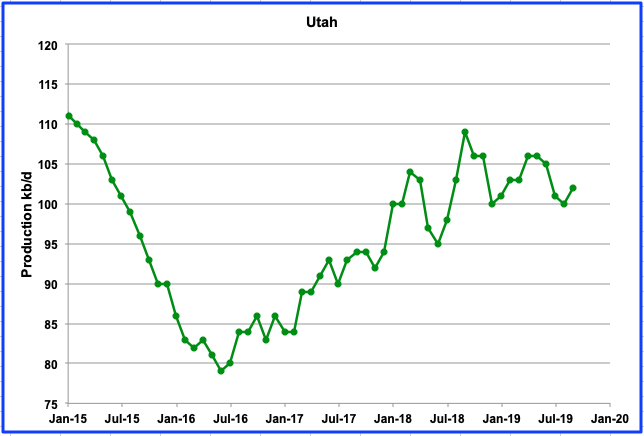
Oil production in Utah started to increase in 2016 after the discovery of a new conventional oil field. However, Utah’s production may now be entering a plateau period or declining phase.
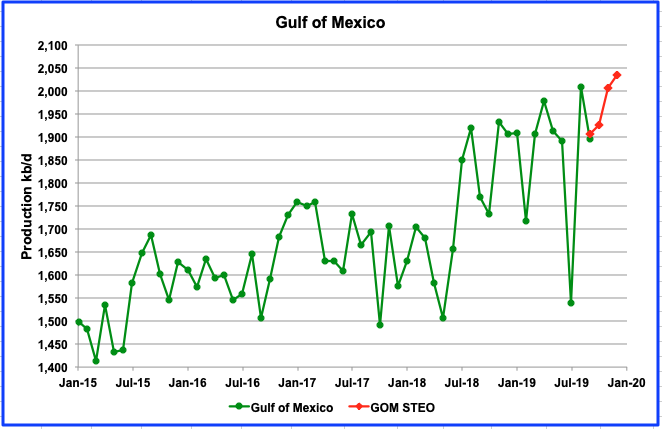
The GOM experienced a production drop of 114 kb/d in September. However, according to an article in Rigzone: “Eight new deepwater projects are expected to come online this year while four should come online in 2020. Majority operators for the 2019 starts include LLOG, Shell, Oxy, Murphy Oil and W&T Offshore. Talos Energy, BP, Murphy Oil and Fieldwood Energy are majority operators for the 2020 starts.
The agency (EIA) expects these projects in total to add around 44,000 bpd this year and approximately 190,000 bpd in 2020 as their production ramps up.”
So far in 2019, the top contributors to supply growth have been the Big Foot and Crosby fields, but the Appomattox field is expected to make a significant impact by the end of the year by ramping up towards its processing capacity of 175,000 barrels of oil equivalent per day.
Despite the addition of a total 234 kb/d of new production in 2019 and 2020, the STEO does not expect the GOM production to exceed 2,050 kb/d in the first half of the year before seasonal maintenance will drop production below 2,000 kb/d.
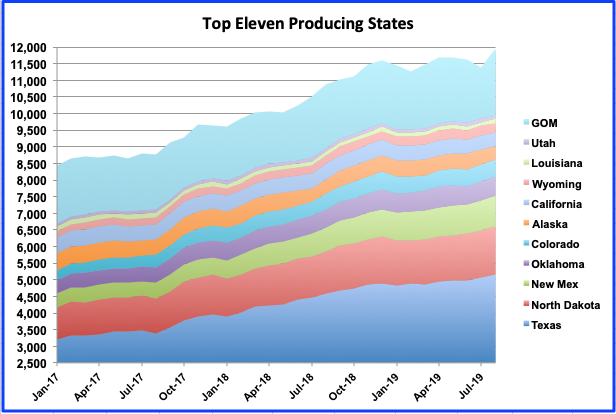
Above are the top US states and GOM plotted on the same scale.
Drilled but Uncompleted wells (DUCs)
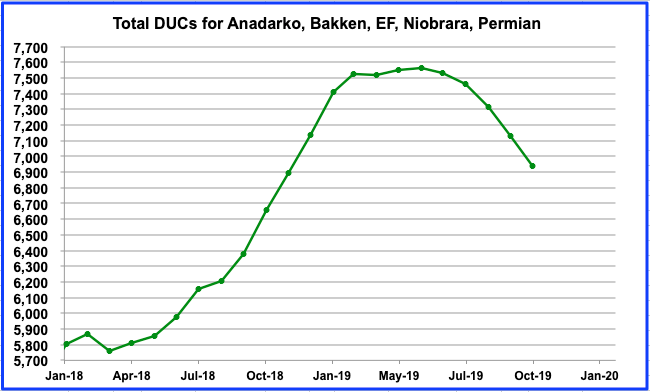
This chart shows the number of DUCs in the five major oil producing LTO basins. Much discussion surrounds how production of LTO continues to increase while the number of rigs operating in the LTO basins continues to decrease. One of the reasons given is that the higher production rate tier 1 DUCs (Sweet spots) are being completed along with some lower rate Tier 2 and 3s to keep production growing. However as the number of tier 1 DUCs decreases, it is expected that the growth in LTO production will peak and the begin to decline. As of November, DUCs are down by only 8.2% from a peak of 7,566 in May 2019.
Two Projections: The first Near term and the second slightly longer
Projection 1
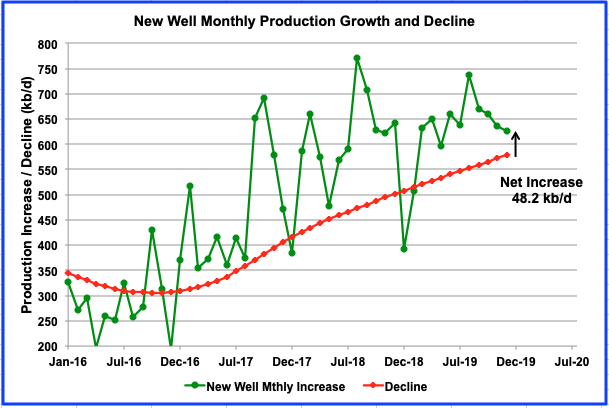
The EIA DPR report looks ahead to provide guidance on production from the US tight oil basins. However, it should be noted that the DPR includes regular oil in their production data whereas the EIA LTO report only provides data on US LTO production. The gap between the green and red lines in the above chart reflects the net production increase for that month.
In the chart, the projected increase for December is 48.2 kb/d. Also it can be seen that the EIA’s projected monthly net increase has been getting smaller since August 2019 and the volatility is gone. Maybe the DPR has better and more up to date production information from these nearer term months. Time will tell.
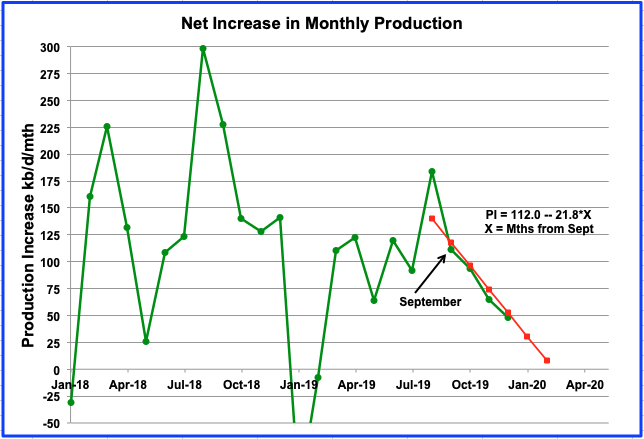
This chart shows the difference between the monthly production growth and the monthly decline in the previous chart. In other words it is the DPR’s projected Net monthly production increase for the seven LTO basins starting in January 2018. While the volatility is quite high up to July 2019, after August 2019 the volatility decreases and seems to have taken on a more linear trend. A straight line fit of the monthly net production from the tight oil basins starting in September has been added to the chart. (Note: The red line has been slightly shifted so the underlying data can be seen). If the decrease were to continue at the rate of 21.8 kb/d/mth, there would be no net increase in production from the LTO basins after March 2020. (To be really precise, it is actually February 4 and don’t tell anyone??) It will not take long to see if this projection is wrong. Also it will not be the last of more to come.
Projection 2
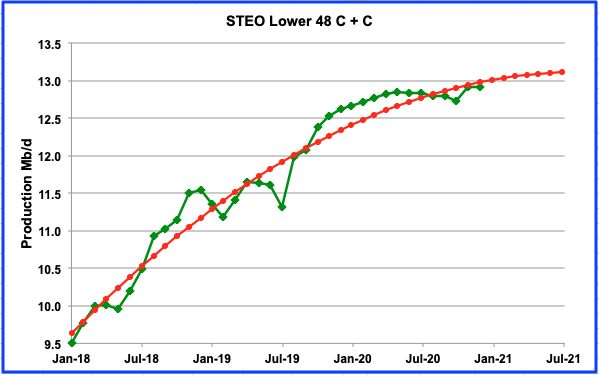
Above is a quadratic curve fit projection out to mid 2021 of the STEO L48 production data up to December 2020. The quadratic is giving a strong indication of a peak around the middle of 2021. The STEO data shows an intermediate peak in May 2020 which could be the high if the bump up from the GOM in November 2020 does not materialize. The September and October declines could be simply EIA guesstimates associated with hurricane interruptions.
US Natural Gas Plant Liquids
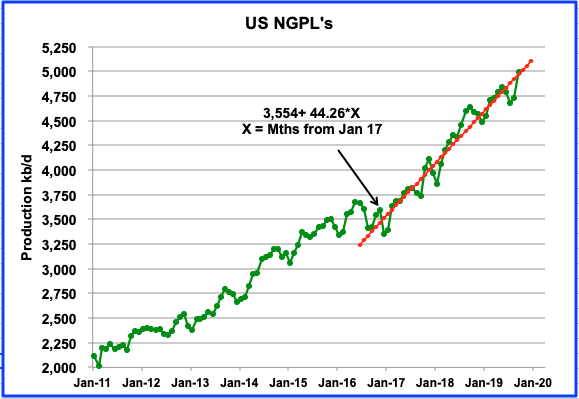
While the focus of this post is on US C + C production, we cannot ignore the increasing amounts of NGPLs being produced in the US. When the IEA and OPEC report on US oil production, they also include the NGPLs. Adding the two, total oil US production for September would be 17,452 kb/d. Since Jan-17, NGPLs production has been growing at the rate of 44.26 kb/d/mth.
I should note that the large increase in September NGPLs shown in the chart is correct as taken from the EIA NGPLs sheet. However the EIA weekly data for September shows an average production of 4,820 kb/d as opposed to 4,989 kb/d shown in the September EIA monthly data. Possible typo??
World Crude + Condensate Production
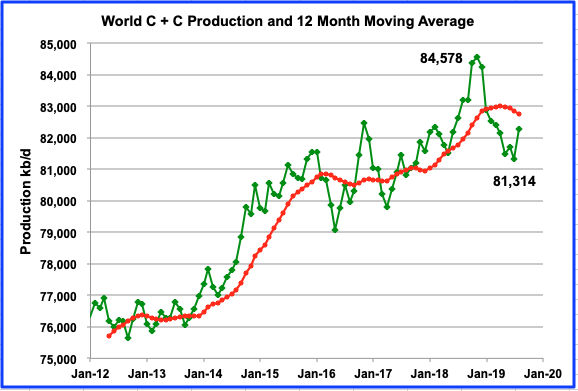
World Oil C+C production increased by 962 kb/d in August with 752 kb/d being provided by Non-OPEC countries. A more detailed update of world oil production will be provided later this month.
Very good presentation Ovi, I wonder regarding the DUC’s. How many is for Gaz wells and how many for Oil wells. Guess some oil wells also producing gaz and condensate , this might also be affected by lower production of oil espesialy when there is only dead DUC’s and Gaz DUC’s left ?
Freddy
At this time I do not have an answer. That is why I just focussed on the five major oil producing LTO basins. Maybe some other participant might have some idea.
So for a short time the US will be energy independent by continuous expansion of drilling. Yet at the same time it is getting much more dependent upon a limited energy source that has decline dogging it’s heels like a pack of hounds after a fox.
Quick, think of some ways to get off this treadmill before it goes over the cliff!
Good job Ovi, thanks for this presentation.
Since the y axis of the various states is very variable in scale, could you make a composite graph of them so the magnitudes of the rise and decline is more easily appreciated? Please include the GOM on that graph.
The US is not energy independent. Production is ~ 12.5 million per day and consumption is over 20.
https://www.eia.gov/tools/faqs/faq.php?id=33&t=6
Yes, but why this info; from the EIA, among others:
• Amid the shale boom and President Trump’s drive for American energy independence, the U.S. has posted its first full month as a net exporter of crude oil and petroleum products since government records began in 1949.
• The nation exported 89K barrels a day more than it imported in September, according to data from the Energy Information Administration.
• Analysts at Rystad Energy predict the U.S. is only months away from achieving total energy independence, citing surging oil and gas output, and the growth of renewables.
Petroleum supply chains are ridiculously inelastic. Just try building, expanding or repurposing a refinery. Or building a new pipeline. Or changing the grade of oil. The US exports excess LTO but then turns around and imports for processing several million barrels per day of other stuff. Some of which is again exported. Etc.
As for Rystad, Rystad is full of nonsense.
It can’t be a good thing that such bald-faced lies persist.
Yup, it seems to be a very narrow definition of what a net exporter means. If the USA consumes 20 million per day, then it would have to import quite a lot to then turn around and export a significant fraction of that to be a net exporter. I actually don’t think that is possible mathematically. Somehow they still have to make up the 8 million in addition to the 12 million being produced.
Added: If it is this
Say that we imported 30 million and turned around and exported 22 million of that because we still have to make up the 8 million to reach 20. Or we exported 1/2 of the 12 million we produce. Then we would have to keep 14 million instead of 8 of the imported 30 to fuel the economy.
We thus exported 22 while taking in 30 million.
The numbers just don’t add up, unless I have a mental block or misunderstanding on this concept.
EDIT
If it is this narrow definition: “the country became a net exporter of refined petroleum products. ”
So say the USA uses all 12 million domestically and then imports 17 million UNREFINED barrels. It refines 8 million for domestic use and exports the remaining 9 million. Voila, the USA is energy independent for REFINED products according to the definition. All sorts of variations on this are possible.
Beside energy being more than oil, look up the EIA data and you will see that net imports are often negative on a monthly basis for petroleum products and petroleum.
Just because we import petroleum does not mean we are not exporting the products. They are close enough to zero for petroleum and petroleum products to be called zero.
For example net imports were -310 for the week of Nov 15 and plus 113 for the week of Nov 22. That is thousand barrels per day. So the net imports are bouncing around near or below zero for petroleum.
Total crude oil and product export was over 8 million barrels per day last week.
I think we are exporting natural gas and coal now.
https://www.eia.gov/dnav/pet/pet_move_wkly_dc_NUS-Z00_mbblpd_w.htm
Beside energy being more than oil,……
Gonefishing, yes, but they write ‘net exporter of crude oil and petroleum products’; that doesn’t include natural gas and coal.
Anyhow, the EIA (and IEA) isn’t credible anymore.
Interesting read is the article posted by Fremerman on the thread from 11/25/2019 ‘Permian basin, etc Net Volume’
https://www.bloomberg.com/news/articles/2019-11-27/texas-scoffs-at-paris-oil-predictions-as-shale-patch-feels-pain
Propoly is confused by obtuse EIA definition of US consumption. They clearly say that they use product supplied, which appears to add all inputs (native and imported) but not count exports. So the consumption figure is not just internal consumption.
Not sure what your point was Hans, but I think the EIA can add up imports and exports for various products. No predictions involved, just accounting.
And yes I clearly know the difference between coal, gas and oil and clearly stated (plus referenced) I was discussing petroleum and petroleum products.
So not sure what your point is.
However, concerning shale oil expansion just give those poor hurting drillers more subsidies and free passes around environmental laws, then they will access the less sweet spots. Mining and drilling do not have to make a profit as long as they are deemed critical to society money will flow toward them.
Railroads used to run coal mines at zero profit so they could make money transporting and distributing the coal.
Industrial supply chains are still consumption.
The US can in an accounting manner net export crude but being energy self-sufficient is a completely different claim. Simple example is gasoline. US uses over 9 million barrels of it per day. You can’t get 9 million barrels of gasoline from just over 12 million barrels of crude.
Uh oh, I guess we are not quite gasoline independent. Have to subtract out the alcohol, additives and process gain but still about 10 percent short.
Need more EV’s.
Gonefishing,
If we strip out all the biofuels, NGL, etc and just consider C+C, the refineries utilize about 16726 kb/d of C+C (most recent 12 month average). US C+C output was 12463 kb/d in Sept 2019 (highest monthly output ever.)
Bottom line we are 4263 kb/d short on C+C output and need to import the difference in order to keep the refineries running.
US crude net imports 12 month centered average 1945 to present
“… the U.S. has posted its first full month as a net exporter of crude oil and petroleum products since government records began in 1949.
• The nation exported 89K barrels a day more than it imported in September, according to data from the Energy Information Administration.”
So crude imports are 4263 kb/d, those imports plus domestic production get refined, and about 4352 kb/d of “petroleum products” get exported.
If you could find data on US exports of “petroleum products”, that might clarify the misunderstanding.
This implies that about 12,374 kb/d of refined crude ie “petroleum products” is kept within the US for end users, which is far short of the claim that the US “consumes” 20 million barrels per day.
Godot,
The important factor is crude, but you are correct that it is possible that there is a lot of exports of petroleum products.
If we ignore NGL and associated output (mostly gases at STP rather than liquids, aka bottled gas.) Petroleum product output is about 16 to 17 Mb/d. Only about 1.3 Mb/d net exports of liquid fuels for most recent month.
The numbers get distorted by various NGL products, which have little to do with oil, they are a by productt of natural gas output. The US is an oil exporter meme is an illusion if you dig into the numbers.
Gone Fishing
I have added the chart you requested after the GOM chart. I have not started at zero so that the smaller increments would show up.
Thanks
I just received this from the PeakOilDiscussionGroup. The YouTube link below is one hour and five minutes long. It will blow you away. It covers everything from the early peak oilers and why they were wrong to today. Everyone talked about peak oil then but it didn’t happen. (The video explains why.) But no one is talking about peak oil today. (The video explains why. They are afraid of looking like a fool.) The video covers Peak Oil, Peak Demand, SUVs, EVs, and just about everything else you can think of. It covers shale oil in depth.
Dennis will love this video because it talks about price in depth and what effects it has had on the oil supply in the past and how it will affect the supply of oil in the future. And when will peak oil happen? And by peak oil I do mean peak supply. Between 2020 and 2024.
Mushalik
Maybe some self-interest involved, but:
discusses peak oil concerns since 2003
then shale oil rescued us
demand peak talk discourages CAPEX in oil
EV transition needs high oil prices
depletion at peak 2022 – 24 – table attached
A Real Conversation with Mark Gordon: Unprecedented Opportunity in Oil
Markets
We are about to enter a new regime for Oil prices, one that will
radically alter the landscape for oil.
This is the link. This is a must-watch. I have watched it once and will watch it again just to make sure I did not miss anything.
A Real Conversation with Mark Gordon: Unprecedented Opportunity in Oil Markets
For a very conservative tight oil scenario, oil sands scenario, and conventional oil URR (2800 Gb) with total C+C URR of 3040 Gb (with 89 Gb tight oil and 148 Gb oil sands) we get the scenario below.
The extraction rate for conventional oil is assumed to remain flat at the 2019 level (5.46% of producing conventional reserves are extracted each year from 2019 to 2045.) Peak is 2024/2025 with a plateau from 2022 to 2027 at 85 Mb/d.
The US tight oil scenario used with this World scenario peaks in 2025 at 10 Mb/d.
The extraction rate for conventional oil is assumed to remain flat at the 2019 level (5.46% of producing conventional reserves are extracted each year from 2019 to 2045.)
Dennis, you forgot to put a smiley face after that remark. 😉 Or perhaps you just worded that sentence wrong. I know you are not the only man on earth that believes conventional production will remain flat for the next 26 years.
Anyway 5.6% times 26 years is 145.6%. I really don’t think so.
Or, if you meant 5.6% of remaining reserves are extracted each year then by 2045, or 26 years from now, then 23.7% of today’s reserves would be remaining in the ground. That would mean a dramatic drop in conventional production that your chart does not show.
Also, your reply did not mention the subject of my post, the YouTube video. So I assume you did not watch it. Do you intend to?
Ron,
I said producing reserves. At end of 2018 my model has about 475 Gb of conventional producing reserves. New producing reserves are continually added each year. When I say 5.46% of the reserves are extracted, this implies production would be about 26 Gb. So there are 2800 Gb of conventional resources in the model, and 1335 Gb had been extracted at the end of 2018, so a total of 1810 Gb of cumulative production plus producing reserves, leaving 990 Gb of reserves to be developed to become producing reserves.
What you seem to miss is that the shock model assumes a certain rate that discovered resources are developed, as oil is produced more resources are developed to replace them, this is the reserve replacement that all oil companies are focused on, I assume you have heard of it.
Chart below is conventional C+C output, where conventional is defined as C+C that is not tight or extra heavy oil output.
On the 5.6% over 26 years take 1-0.056=0.944 then raise to the 26th power and we get 22.34% of the reserves left, but that is of the original 475 Gb of producing reserves, new producing reserves get added each year.
You can find this data for the US here (proved non-producing reserves):
https://www.eia.gov/dnav/pet/PET_CRD_NPROD_DCU_NUS_A.htm
and reserves here:
https://www.eia.gov/dnav/pet/pet_crd_cplc_dcu_NUS_a.htm
The difference is proved producing reserves.
No problem Dennis, I see your point.
Your chart. 2005 to 2019…. Is that a bumpy plateau or what?
Ron,
Yes a bumpy plateau for conventional 2005 to 2025 or so, note that the producing reserves will decrease starting around 2021 (newly developed conventional reserves will be less than oil extracted, so a fixed extraction rate means conventional output will decrease. By 2035 conventional producing reserves fall to 434 Gb, 2040=406 Gb, 2050=342 Gb. Cumulative conventional output in 2050 is 2088 Gb for the scenario presented and conventional output in 2050 is 52 Mb/d, total C+C output is 57 Mb/d.
Thanks for this clarification.
(a) Out of the 990 Gb undeveloped reserves how much is from Iraq, Iran, Kuwait, Saudi Arabia and UAE?
(b)
20% of the 148 Gb of tar sands is from shallow surface mining (produced at an annual 3% of current reserves), 80 % from in-situ (produced at an annual 0.8 % of current reserves). For the purpose of calculating a production peak much of the in situ reserve will not be relevant. It will moderate the decline, though. Provided bush fires don’t burn down the production facilities
https://www.oilsandsmagazine.com/technical/properties
Matt,
The shock model is top down rather than bottom up. I take World discovery data and fit a dispersive discovery model to that data, with an assumed total of 2800 Gb for conventional discoveries. No attempt is made to break out the discoveries by nation. As the model is for World output (also not broken down by nation) I do not have an answer for (a). If you are interested you could look at Laherrere’s work.
https://aspofrance.org/2018/08/31/extrapolation-of-oil-past-production-to-forecast-future-production-in-barrels/
Oil Sands model and tight oil model shown below. I agree Oil sands will mostly moderate the decline, the peak will mostly be about tight oil.
Dennis,
For what it is worth, I remember that Walter Youngquist told me that the rate of Athabasca heavy oil is limited by the volumetric flow rate of the river of the same name and put it at 4 million barrels per day. I see that we are already close to, or even past that. But if he is right the future extraction rates may be limited by this constraint. Of course, Walter could have been wrong, but he had excellent contacts in oil industry all over the world including Alberta and often talked with them about depletion.
Dennis/Seppo
There are two types of oil sands operations.
One is open pit mining. Literally the sand is scooped into huge trucks and then dumped into a process plant that removes the sand and outputs bitumen. There is virtually no “decline” in this type of operation. Oil sands are more accurately described as a depleting resource rather than a declining one.
The other is “Steam Assisted Gravity Drainage” SAGD. Same as they use in the Kern River operation in California. This process has similarities to LTO in that they drill a horizontal hole and inject steam to fluidize oil sands or heavy oil. Another hole below the top one is used to extract the liquid. When most of the oil is extracted, they then move over a couple of hundred feet and repeat the same operation.
It is more of a question of when does the pool of oil Sands run out as opposed to a slow decline. Similar to the LTO operations, they have to keep drilling new holes.
As for the Athabaska river, I think they are not allowed to dump effluent in there any more. However there is seepage from what are called the “Tar Ponds”. Literally large areas of shallow pools of effluent that contain water, fine clay and residual hydrocarbons that evaporate and slowly seep into the soil. Some of this seepage migrates to the river. This process has also been stopped. Two pictures to give you an idea of SAGD.
As an aside, what is infuriating to some of us in Canada is Hollywood movies stars telling us the oil sands are bad for the environment. Most of them don’t know that the SAGD operation they have in California is worse than the Canadian Oil sands.
Here is an article on the Kern River Oil Sands issues. I suspect that most Californians know nothing about these operations.
https://e360.yale.edu/features/why-does-green-california-pump-the-dirtiest-oil-in-the-u-s
My wife works at a SAGD operation up here. Very interesting and promising technology. It really is frustrating when celebrities see one open pit mine and assume all of Alberta is like that.
It will be interesting to see how much oil is recoverable as technology advances.
In 2007 it was estimated that 178 billion barrels were recoverable. That is only 10% of the estimated 1.7 TRILLION barrel deposit. SAGD should continue to improve that ratio.
Just need pipelines and infrastructure to promote more development up here.
Second picture looking like an LTO operation.
Seppo,
I use the Canadian Association of Oil Producers forecast from June 2019 for my Canadian oil sands estimate up to 2035, then extend to about 2040, using the 2025 to 2035 rate of increase. Orinoco belt forecast based on assuming about 75 Gb URR and that the rate of increase is somewhat like Canadian experience, but starting 25 years later. I am far less confident of Orinoco estimate.
In any case note that the extra heavy oil estimate includes both Canadian Oil sands plus Orinoco extra heavy oil. CAPP estimates about 4.4 Mb/d oil sands in 2035. Perhaps Canadian oil sands will rise no further than 4.4 Mb/d after 2035, potentially Venezuela will have sorted out its political problems by 2035 and Orinoco output will increase. Much will depend on the price of oil.
as oil is produced more resources are developed to replace them, this is the reserve replacement that all oil companies are focused on, I assume you have heard of it.
Yes, I have heard of it Dennis. I just don’t believe it. Middle East OPEC nations have been making this claim for decades. Every barrel they produce is replaced by another barrel. I call it “magic oil”. Pump out a barrel and another barrel magically appears to replace it.
I assume you have heard me make this analogy before.
As long as there is “reserve replacement”, as practiced by OPEC, and as in Dennis’ example, the world will never run out of oil. 😉
Ron,
I am talking about oil majors and large independent oil producers, they are constantly developing new resources. Also there are proved, probable, and possible reserves along with contingent resources. As oil prices increase resources and reserves move to different categories, with some probable reserves moving to the proved category and some possible reserves moving to the probable category and some contingent resources moving into the possible reserve category. In addition new technology sometimes results in reserves and/or resources moving to new categories. For OPEC we don’t have such data, but we have some data for the US, UK, and Norway and those that have access to IHS data probably have pretty good information for most non-OPEC nations.
In case you haven’t noticed I have never claimed that resources are unlimited, just generally a bit more than you believe.
Also every “medium” scenario I have ever produced has always proved to be too low, so my “wildly or outrageously optimistic scenarios” have to date always been too pessimistic.
There are others with outrageously pessimistic scenarios. 🙂
I wonder if this is something akin to “a wet towel over a shower rod”? Wring out a wet towel until you can’t get any more water out of it. Throw it over a shower rod. Come back a little time later and the floor underneath is wet and that are droplets on the bottom towel hem.
I wonder if this is where the fat tail comes from when we look at a Hubbert curve vs actual production over time?
Ron,
I watched the video, I agree very good.
See
http://peakoilbarrel.com/is-us-oil-production-growth-slowing/#comment-692883
Ron,
Very interesting, with some basic Peakoil talk that anyone reading and posting on your blog should be familiar with.
So, high oilprices disguise the peak oil theory, because of demand destruction, shifting the ultimate peak of supply to the future. This is dangerous because this will happen when world crude oil depletion is not at 50%, but at about 65% (tar sands not included I suppose) according to Gordon. ‘According to’ regarding the percentage 65%, ‘dangerous’ is my conclusion.
At 17:43 he says: “we (the U.S) now are almost a net importer of oil”. He means: almost a net exporter of oil. Not if production is 12.5 mbd and consumption is 20 mbd though.
It indeed is a presentation to watch again and to stop regularly, to be able to read completely the pages of his report that he shows.
Han, looking at C+C production and comparing it with total consumption is a little misleading. That 20 mbd is a lot more than just C+C. It includes NGLs, renewable fuels, and even refinery process gain. Go here: EIA Table 3.1 Petroleum Overview
The very last column, “Products Supplied”, is our consumption. Net imports for October was 349,000 barrels per day. The 10 month average for net imports was 889,000 barrels per day. So you see we are getting pretty close to being a net exporter.
Thanks for watching and commenting on the video. I found it a real shocker. But I suppose most people are too busy to watch it.
Ron, maybe quite a lot people watch it without commenting on it. Normally I don’t watch long videos, but because of the general optimism on future tight oil production and your comment on the video I got curious and wanted a ‘reality shot’ again.
By the way, I cannot judge if Dennis prediction of future U.S. thight oil production is too optimistic, because of lack of knowledge, but some future hitches, like money much less being poured in, company debts and the ‘shale oil sweet spots’ issue could certainly ‘spoil the party’.
Han,
If Brent oil prices remain under $65/b (2018$) long term, then tight oil output will be lower than my best guess scenario. I assume oil prices gradually rise to $90/b (2018$) by 2027 and then remain at that level (at minimum) from 2027 to 2040). In my opinion that is a conservative oil price scenario. It is possible there might be either Great Depression 2 of GFC 2 between 2030 and 2040 and that could result in a fall in oil prices if it occurs. Events of that type are difficult to predict in my view.
Mushalik???
Mushalik was the author of the post from peakoildiscussion@googlegroups.com . I am on that list and receive their emails. I occasionally reply also.
I listed his name because I copied and pasted his post verbatim.
Thanks!!
Matt Mushalik is the publisher of a long series of excellent oil related articles, the most recent of which is this one from about 1 month ago-
http://crudeoilpeak.info/uncertainties-following-the-abqaiq-attack-have-shrunk-the-worlds-safe-oil-reserves-by-around-half-part-2
With respect to EV production, he focuses on Cobalt. Battery developers are trying to get away from Cobalt. Nikola, an EV semi truck startup, says they have a battery coming out that does not use Cobalt. The Nikola battery specs are:
Cycled over 2,000 times with acceptable end-of-life performance
40% reduction in weight compared to lithium-ion cells
50% material cost reduction per kWh compared to lithium-ion batteries
Double the energy density (kwhr/kg) at 40% reduction in weight – roughly a wash with respect to total energy in a pack of a given volume.
2,000 cycles with a range of 300 miles is roughly 540,000 miles before battery replacement (capacity starts at 100% and end of life is roughly 80%. I used an average capacity of 90%)
At half the cost would be a real break through. The replacement cost of a 24 kwhr Leaf pack is/was $5600. Half the price would be $2800. 24 kwhr * an EPA 3.14 miles/kwhr * 2,000 cycles (*90%) is
roughly 135K miles. Electricity at $0.10/kwhr is roughly $1.00 every 30 miles. Cost of “fuel” is $4,521. At $2/gallon for an equivalent car is $4,521. The difference more than pays for the cost of a replacement pack.
So scarcity is understood and there are efforts to find alternatives. The Nikola announcement has been a real surprise. Honda is working on a flouride battery with similar to better specs (8 to 10 x the energy density). I think we are going in the right direction whether or not we see EV sales slump or not.
The problem may actually be that the price of gasoline might fall if the above battery developments pans out.
Nikola, an EV semi truck startup, says they have a battery coming out that does not use Cobalt.
Interesting—-
But more interesting with 10% market share.
I have been watching Nicola for a long time now and still waiting for the first customer to be supplied with a truck.
Have they even started the factory yet?
First it was going to be an electric truck with gas turbine back up and free gas for customers from shale wells the company was going to drill. Then they changed their minds and announced a fuel cell energy source later revised to fuel cell and battery.
So far I am still rather sceptical.
I’m skeptical too. Lots of good sounding ideas out there. We’ll have to wait and see. First question I would ask: “is any of the smart money piling into this?” Besos and Ford piled into Rivian with $1.2 Billion combined. Workhorse has a plant and interested investors.
Not sure where Nikolas stands. Googling: nikolas motor financing, I do see some serious amount coming in from serious companies. But some of it is for hydrogen fuel cell projects which makes me wonder.
Let’s see what batteries the Tesla semi truck will have.
It won’t be conventional Lithium ion – since with their specs the battery pack will weight round about 9 tons.
Many tech nerds think their ” 1 millin miles battery” is not only 1 million miles but much more compact.
They will announce that as late as possible for not hurting their current sales. Nothing is more dangerous for selling the IPhone 1.0 than announcing 2.0 with all new features.
Even the 500 miles big cybercar model won’t have conventional Lithium Ion cells. It won’t have any pounds of load when using the battery pack from Tesla 3, since it would need round about 3 of them.
Just watched the video.
Clearly those of us on this site are well plugged in and well (Pun intended) informed. I found it interesting that he was comparing production from Dec to August as an indicator of slowing US production. Similar to what was done above, instead to September.
I agree with him that the next six months will give a clearer view of the potential for shale production to provide increasing US production over the next two years.
I am surprised that he did not mention Guyana. While Brazil and Norway are starting to ramp now, Guyana starts up early in 2020 with the potential of reaching 120 kb/d. Other sites could add 440 kb/d by 2023. Keep in mind that decline never sleeps. Brazil added 225 kb/d in August. Norway will not show up adding an increase until October.
Also interesting comments on Canadian Oil Sands
Rather a lot of the oil discovered offshore Guyana is turning out to be heavy.
https://www.guyanastandard.com/2019/11/15/stabroek-block-has-heavy-oil-too-hess-ceo/
So far, first 20 minutes is very good. Gordon did his research. Thanks.
Ron,
Watched the video. I agree it is a good presentation.
He calls for peak conventional in 2020-2024, I agree with that. He does not call for a peak in tight oil in that time frame, his analysis on tight is similar to my own. Growth rates will be slower than 2017 and 2018 going forward. When oil prices rise (and Gordon expects this in about 6 to 12 months) tight oil output will increase, especially in the Permian Basin. He mentioned on several occasions tight oil growth at 12% instead of 25% (I assume he meant annual rates of growth). He was mostly talking about Permian as other basins as a group are likely to be flat or down, in his view (and my view as well). Permian output is currently 3990 kb/d so 12% of that is 480 kb/d. That is pretty close to my average growth rate for Permian basin from 2019 to 2028, about a 500 kb/d annual rate of growth over 8 years from 4000 kb/d to 8000 kb/d.
I agree scarcity will become apparent within 12 months, demand will peak at some time after oil prices have risen in response to the approaching peak in supply (which is likely to arrive while oil prices are high). Chart below includes World C+C, conventional (C+C-XH-LTO), extra heavy (XH) oil, and tight oil (these last two read from right vertical axis.) This is my best guess scenario with 50/50 chance output might be higher or lower than this scenario. Odds it will be exactly right are exactly zero as there are an infinite number of future possible scenarios.
Dennis, I read your comment yesterday. I did not comment then because I didn’t see anything I felt like arguing with. I think conventional oil has already peaked. I see shale oil peaking in 2020. The world peak will likely be 2018 but no later than 2022.
The below chart is World Less USA.
Ron,
We might define conventional oil differently (there are many variations), I exclude only tight oil and extra heavy oil (includes bitumen) with API gravity less than 10, where some authors also exclude deep water offshore and perhaps Arctic oil. For my definition of “conventional oil” (C+C-LTO-XH in my chart), I agree the peak is probably behind us and roughly a bumpy plateau from 2005 to 2025 is likely. The only place we disagree is tight oil which I believe will peak 5 years later than you (in 2025). We have been through this before with the North Dakota Bakken/Three Forks, when people were claiming 2.5 to 4 Gb for the URR in August 2014.
https://peakoilbarrel.com/bakken-oil-peak-jean-laherrere/
So far output has been 3.2 Gb through Sept 2019. At the end of 2017 cumulative Bakken/Three Forks output in North Dakota was 2.4 Gb and proved tight oil reserves at the end of 2017 were 5.1 Gb, so this suggests a minimum URR of 7.5 Gb and there may be probable reserves of 1.5 Gb which would bring the URR to 9 Gb, higher future oil prices might lead to some possible reserves to be reclasssified to probable reserves possibly raising the URR further.
So it might be that the USGS mean estimate of 10 Gb for the TRR for the ND Bakken/Three Forks proves to be pretty close to the URR. For my Permian model the URR (59 Gb) is about 80% of the USGS mean TRR estimate (74 Gb).
Likewise my estimates for the Eagle Ford and Niobrara and “other US LTO” are fairly conservative. I am confident that the 2025 estimate for US tight oil peak will if anything prove too conservative as has always been the case for my past estimates (medium or best guess scenarios).
Time will tell as always.
Well, I think there is one other place where we disagree. You seem to think that the peak of tight oil, around 2025, will also be the peak of C+C. That is, there will be enough tight oil to hold off the total peak until 2025.
I very seriously doubt that. Even if peak tight oil isn’t until 2025, nevertheless the rate of increase of tight oil will be dramatically slowed down. There will not be enough increase in tight oil to make up for the decrease in conventional oil.
However, it is my opinion that peak tight oil is less than one year in the future.
Ron,
Yes we disagree on both points. I expect conventional C+C to decrease from about 72.8 Mb/d in 2018 to 70.8 Mb/d in 2025, tight oil and extra heavy oil will increase from 10.1 Mb/d in 2018 to
14.5 Mb/d in 2025. (tight oil output I expect to increase from 6.4 Mb/d in 2018 to 10 Mb/d in 2025).
So we have very different perspectives on future tight oil output.
As I suggested we will have to wait and see, I believe my best guess scenario is conservative, but I have been wrong before (though in almost every case my best guess estimates have been too low.)
Some of this disagreement is splitting hairs. I like to comment over at the AGW blogs but it’s getting impossible to mention peak oil issues. At the ATTP
blog, the main guy is now writing about stocks and flows in his top-level post.
https://andthentheresphysics.wordpress.com/2019/12/04/stocks-and-flows-2
This is a comment I added which was under moderation for awhile but eventually got intentionally deleted.
“One stock and flow pattern is that for fossil fuel usage. The stock is discoveries of crude oil and the flow is production from these known reserves. This idea was what enabled King Hubbert in the late 1950’s to accurately predict peak oil for the USA after a lag of 14 years. The already declining stock was all that Hubbert needed that turned out to be “the single best long-term forecast that everyone ever gotten right. For those of us that work on Wall Street, we realize how difficult it is to get anything right, but here is a guy that looked 14 years in the future and managed to get it right” according to this oil investor video (6 minute mark) from a couple of days ago
I included a link to the YT video that Ron mentioned above. Below is the stock and flow lagged shift that Hubbert described, with the blue arrow indicating the prediction (screen shot from the YouTube presentation)
Hubbert nailed this but didn’t anticipate the recent fracked shale oil nor the Gulf of Mexico or Alaskan discoveries, which didn’t invalidate the model but instead pointed out how it could be used in a wider geographic context.
These climate guys seem terrified by this stuff and go nuts when anyone mentions the RCP8.5 scenario, which used to be a BAU emissions trajectory but now are claiming as a “high emissions” path.
Keep it up Dennis and Ron, this is good stuff.
Thanks Paul,
Yes that part of the Gordon presentation reminded me of your oil shock model.
Ron and I are really quite close, in the grand scheme a peak in 2020 vs 2025 is of little consequence.
Perhaps all the times I have estimated too low in the past has caused me to shift to too optimistic a scenario.
If oil prices remain low (<60/b) perhaps we see a 2020 peak for tight oil, if they rise to 70/b by 2021 as I expect and continue to 90/b by 2027, then the 2025 estimate for tight oil peak may be right. Or that's how I see it.
Ron, what Gordon does with his scenario of taking the hypothetical Hubbert’s curve based on extraction growth prior to 1970’s disruption and somehow balances the areas under that curve with the new one he has created on his page 14. There is no basis for this. The estimates for the intrinsic growth rate and the ultimate are extrapolated from the past data and the estimate of the ultimate has kept increasing over the years. Thus the so called theoretical Hubbert’s curve he displays in Figure 12, is based on the data on extraction history based before that date. If one were to carry out Hubbert’s analysis today, it would predict a peak about now again. The same is true if the analysis is carried out at any time over the last 20 years. That is, peak seems to be always about at the time the analysis is carried out. The reason is that the ultimate is creeping up. Hubbert’s method is an attempt to predict the future trajectory and only the future part of the curve is important. Those who say that the model fails because it is based on a symmetric distribution, fail to see it. That the curve is not symmetric is clear because in the past it has fluctuated for a variety of reasons. The reasons are speculative. The phenomena is non-linear with many variables and for such a problem it is difficult to know what factor is driving what. People are willing to speculate, but the answer is unknowable.
The same is true with the economy in general. When people say that this is caused by factor x, and other factors are unimportant, the next person says that no it is cause by factor y, and the others are unimportant. The non-linearity in the system does not allow one to identify which variable is the driver and which is the follower. Of course, this is not entirely the way I have written, and identifying what are the endogenous and exogenous variables is a good start, if it can be done. It seems to me that price is endogenous and it also seems to me that Gordon thinks it is exogenous. I dropped out from these discussions a long time ago, as they are based on too simple thinking.
To give one example, the Bernoulli equation for an ideal incompressible fluid says that if the velocity increases, pressure drops. Or is it the drop in pressure that causes velocity to increase, for after all the higher pressure behind will accelerate the fluid. It should be easy to see what is missing in the logic at least in some simple settings and I will leave it to you to experience the joy of the aha-moment of figuring out why the arguments are incoherent.
I hope that I am not viewed as patronizing in writing this, but my experience is that some well established professionals do not seem to have learned to think about non-linear problems properly, and this includes those (economists) who are ready to pronounce why something is taking place now because something else is also taking place. Actually, if they had said that something else was taking place yesterday, there would be at least a chance of getting the correct answer. But even this does not apply in, say a non-linear limit cycle, that has reached a steady periodic state.
Thanks, Seppo for this analysis. I agree with you that the price of oil is endogenous. I just assumed that was self-evident. That is the reason the peak is so damn hard to predict and why so many people, like me, get it wrong. Just when we think we see the peak, some more oil pops up somewhere from some totally unexpected source.
Or at least I think that is what you are saying, it’s the oil that determines the price, not the charts or peak demand.
No, you are definitely not viewed as patronizing. We need more in-depth analysis on this blog. After all, nothing is as simple as it often appears. Simplistic explanations are the bane of epistemology.
Thanks again.
Seppo,
I use the Canadian Association of Oil Producers forecast from June 2019 for my Canadian oil sands estimate up to 2035, then extend to about 2040, using the 2025 to 2035 rate of increase. Orinoco belt forecast based on assuming about 75 Gb URR and that the rate of increase is somewhat like Canadian experience, but starting 25 years later. I am far less confident of Orinoco estimate.
In any case note that the extra heavy oil estimate includes both Canadian Oil sands plus Orinoco extra heavy oil. CAPP estimates about 4.4 Mb/d oil sands in 2035. Perhaps Canadian oil sands will rise no further than 4.4 Mb/d after 2035, potentially Venezuela will have sorted out its political problems by 2035 and Orinoco output will increase. Much will depend on the price of oil.
Note that the URR will not increase without limit. Using a Hubbert linearization (HL) is likely to underestimate the eventual conventional URR as output rarely follows a Hubbert curve. Currently an HL analysis suggests about 2500 to 2900 Gb for conventional URR. As historically HL has tended to underestimate I use 2800 Gb for conventional URR with a window of 2500 to 3100 Gb (subjective probability roughly 75% that URR of conventional might fall in that 600 Gb range).
Difficult to predict URR as it will depend in part on the price of oil which is determined by by many factors both geophysical and economic.
Ovi,
There are often differences between weekly and monthly data, the weekly data is a rough guess that is often wrong and never revised. The monthly estimates are done more carefully and they are revised as better data is collected. My guess is that there is no typo for the EIA monthly data, and as I always say, the EIA weekly data is best ignored (along with DPR).
Ovi,
If we use tight oil production estimates by play (the official EIA tight oil estimate) rather than the DPR, we get something a bit different for the trend in monthly production change.
Dennis
Both the LTO and DPR info have shown reduced volatility lately. Up to March-19, LTO volatility was of the order of 150 kb/d. Since March it is down to close to 40 kb/d. The DPR’s volatility seemed to vanish in August. As I mentioned they both may have better info so I will continue to track the DPR to see if their guesstimates are getting better. By keeping track, we will see if their projections are improving. Even I will be surprised if the EIA’s L48 on-shore monthly numbers peak in March 2020.
The other reason for looking at the DPR is that it also includes conventional oil. Consequently the decline in the conventional oil is offsetting the increase in LTO and may be a better overall estimate of what is happening in the LTO basins.
I was very surprised to see that there was no growth in the L48 in September. Maybe it is only due to a temporary drop in the GOM.
Ovi,
Yes, it was due to a drop in GOM, the better data is L48 excluding GOM. The increase in US L48 excluding GOM in Sept was 113 kb/d.
Chart below shows US Lower 48 minus Gulf of Mexico.
Ovi,
I think the following chart shows pretty clearly that US L48 excluding GOM has slowed down quite a bit from 2018 to 2019, by nearly a factor of 2.
In my opinion this is simply due to a slow down in completion rate in the tight oil plays which was caused by the drop in oil prices at the end of 2018. It really is that simple.
Brent oil prices, monthly average price.
Dennis,
Do you see brent going over $100/b within next say 5 years?
Iron Mike,
Difficult to say, but I never get oil price predictions correct. My guess is that in 2025 the Brent price in 2018$ will be $85/b to $115/b, depending on the speed of the transition to EVs and other non oil transport paths (natural gas, biofuels, etc) as well as fleet efficiency, etc. Some of this is determined by consumer preferences, some by technology development, some by government policy.
You get the idea.
The most honest answer is that I have just as little foresight as the next person and have no clue.
US tight oil.
Chart suggests L48 conventional excluding GOM was rising in 2018 (at an annual rate of about 100 kb/d) and declining in first 9 months of 2019 (at an annual rate of about 158 kb/d.) This conclusion is reached by looking at slopes of tight oil chart and L48 excluding GOM chart presented upthread.
Hi Ovi,
You said “The other reason for looking at the DPR is that it also includes conventional oil. Consequently the decline in the conventional oil is offsetting the increase in LTO and may be a better overall estimate of what is happening in the LTO basins.”.
I agree that conventional oil is in decline. The Permian chart below is by David Hughes and is up to April 2019. David has shown pre-2012 wells which I’m assuming is mostly conventional. What’s amazing is that in April 2019, 19% of oil production came from 80% of the well count or a whopping 112,326 wells.
You can see there has been a steady slow decline in production from pre 2012 wells since 2012.
Conventional oil will decline, at relatively slow rates compared to tight oil.
In my view tight oil is very different from conventional as far as the rate of decline and looking at tight oil only makes the analysis far clearer.
In addition the DPR just has been very bad historically, i doubt the future will be different.
Dennis
Let’s give the DPR a chance . Since their latest data does not show much volatility, I believe they must have better data.
Ovi,
Look back at older DPR estimates, you will find that they have not been very good. The lack of volatility is just an artifact of the model. The most recent 6 to 8 months of any DPR is always low volatility. The volatility of older data is where they have adjusted their model to match historical data.
You and others can continue to use the DPR, I will continue to ignore it as it is a flawed model.
Dennis
Clearly you have more experience than I have looking at the DPR and LTO reports. Now that I have used the DPR to make some predictions, I will be following their estimates more carefully. So in about 6 months, hopefully we can come to a consensus. Bad, improving, reasonable, good, …??
Ovi,
There is an archive of old DPR reports at EIA site. In 2018 the average monthly conventional output from tight oil regions was 866 kb/d, I assume that level is unchanged in 2019 for the tight oil regions (the DPR has this increasing which seems wrong) that is the basis of the “estimate” which adds 866 kb/d to the EIA tight oil estimate.
This will likely prove to be a better estimate than the DPR.
click on chart for larger view.
Ovi,
concerning volatility of estimates, if we consider the November 2018 DPR and compare with the November 2019 DPR we find the newer (I assume better) estimate has greater volatility. Chart below compares the net monthly production increase for the Jan 2018 to Dec 2018 period (Nov 2018 DPR estimate ends in Dec 2018).
Thanks Tony
Dennis
The Permian increase is the difference between two large numbers. Looking at the the chart that Tony provided, it looks like there is an approximate decline of 5 kb/d/mth in the Permian wells drilled since 2012, approximately 9% of the 57 kb/d projected increase for the Permian increase for November. The Permian net monthly growth seems to be dropping at roughly 10 kb/d/mth over the last few months. Essentially, the conventional decline makes it more difficult for the Permian to show increasing production in the DPR data. I note that drillers are adding approximately 350 wells per month in the Permian. T0 offset decline shouldn’t they be adding a few extra every month?
More info to look forward to as it will always keep coming. Nice feature of the info exchange that occurs on this site.
Ovi,
Chart below has conventional oil output from 7 shale regions found by taking DPR estimate and subtracting tight oil production estimate by play. The 2019 increase is probably just model error, but the data through Dec 2018 may be fairly reliable.
Note that conventional oil wells continued to be drilled after Dec 2011.
Net monthly production change for US tight oil from Jan 2017 to Oct 2019, basically flat with about a 2 kb/d annual decrease over that period, average monthly production change was 111 kb/d. If the trend continued (and I do not expect that it will), then the monthly production change would reach zero about 55 years after March 2018.
A simple extrapolation of such a trend is not likely to be reliable in my humble opinion.
I maintain a best guess for US tight oil peak in 2024/2025 probably at 9.5 to 10.5 Mb/d, depending upon the future price of oil and Wold economic conditions, both of which are not possible to predict.
Dennis
My comments on the typo referred to the NGPLs chart. The weekly numbers for the NGPLs are different than the oil numbers in that they remain constant for 3 to 4 weeks. Not sure why this is so. I have attach a table showing the weekly numbers starting in July. In the second column is the monthly EIA number, placed roughly near the middle of the month. The September increase is 5 times the increase from July to August. Maybe the September number reflects increased production getting ready for winter.
Ovi,
Yes I was also referring to NGPL. For every estimate the EIA does, the monthly estimate will always be more accurate than the weekly estimate. Every type of data.
The DPR is also far less accurate than the tight oil production estimate by play.
The IEA has published its World Energy Outlook 2019
https://webstore.iea.org/world-energy-outlook-2019
ASPO Germany tried to fill some gaps in a table with production forecasts
http://aspo-deutschland.de/dokumente/2019-11-21AnalysisOfWEO2019-ASPO-de.pdf
Matt,
World peak oil 2021 mainly because US shale peaks in 2021.
Curve ascent doesn’t account for 2019 being well under 2018 globally.
What seems quite clear from this graph if it happen is the increase in world oil supply in 2020 will be very low before it start to decline. The environment activist will like this situation, even oil price reach 200 usd each barrel.
One conclusion stated in the Aspo Deutschland analysis-
In order to meet the IEA projections
Production of New Fields 2025 = production of 2 Saudi Arabias
Call me a tad skeptical,
(But then again I’m not a big believer in any entity holding debt that is greater than 20 times their annual savings (not income),
whether you are an individual, a pension fund or a country).
btw- when is the last time the USA government saved a dime?
Government debt less than x is not a problem. Solve for x.
“not a problem.”
call me skeptical, but the point was directed particularly at the IEA projection
of vast new fields oil of production.
What? Your point in your last paragraph was totally about debt, referencing the US govt, no?
>>But then again I’m not a big believer in any entity holding debt that is greater than 20 times their annual savings (not income),
whether you are an individual, a pension fund or a country).
btw- when is the last time the USA government saved a dime?
<<
Perhaps I shouldn’t have mentioned the debt issue, I was just pointing out that sometimes my viewpoint is heavily biased by skepticism of the ‘party line’ [whether it be projections of Unfound Oil, or the supposed benign nature of indebtedness]
Hard to pay debts in when global energy production is in decline. Sorry or like spending 3000 kcal per day feeding yourself to produce 2500 kcal per day. Debt systems only function when there is economic growth.
Hickory,
If we break out the oil that needs to be replaced to each month, the World needs to replace 262 kb/d each month of conventional output, if this is 67 Mb/d as IEA counts it (I get 73 Mb/d in 2018, but I define conventional C+C as total C+C minus extra heavy oil (includes bitumen) minus tight oil).
In any case 262/67000=0.39% of World conventional output must be replaced each month by development of non-producing proved reserves. We have been doing this since 2005, I do not see much changing. There are a lot of undeveloped resources, if we start to run short on oil, prices will rise and the rate that new resources are developed may increase to a level that satisfies demand at the prevailing oil price level.
Peak in 2025 still looks pretty reasonable and potentially a plateau might be maintained to around 2030, if there is no severe recession to reduce demand.
Hi
You are probably mathematically spot on in your 2025 prediction given your resource assumption. A lot of variables ofcource. Now with underinvestment and negative sentiment a crises would most likely come much sooner, and the question is how the sentiment for oil and gas investments will be after the house of cards eventually does fall.
If oil supply is not able to keep up with demand oil prices rise, profits rise, rate of reserve development will rise. The high prices will reduce demand to the level of supply.
At some point we get a recession. Probably at about 120 per barrel maybe higher.
“At some point we get a recession. Probably at about 120 per barrel maybe higher.”
If the U.S. isn’t importing, the $120 barrel grows internal production and stimulates jobs & profits. I don’t think $120 oil alone will tips the economy negative. Todays vehicles are 25% more efficient than 2008.
Huntington Beach,
My expectation is that US output grows by another 2 Mb/d to about 14 Mb/d, but unless consumption is reduced, we currently have about 16.7 Mb/d crude input to refineries, so unless consumption is reduced by 2.7 Mb/d between now and 2025 (when I expect the peak), the US will remain a net importer of C+C.
Also note that at the World level the economy may be affected by $120/b (especially in 2018$) for Brent, but basically the growth in real GDP (assume 2.5% average annual real GDP growth from 2015 to 2030) would result in total growth of real GDP of 44.8% above 2014 level when Bent was about $110/bo in 2018$. So in 2030 the World economy might be able to handle $160/b for Brent in 2018$. If we assume an average 2% annual inflation rate from 2019 to 2030, this suggests a nominal Brent oil price in 2030 of $203/b.
I doubt the World economy would handle more than $160/b in 2018$ in 2030, so perhaps $140/b+/-20 in 2018$ for Brent oil price in 2030 would be a better guess.
In short, I agree that $120/b might be on the low side for 2030 if a peak is reached in 2025 (possibly followed by a “plateau where output gradually falls from 85 Mb/d to 81 Mb/d over the 2025 to 2032 period. Here I define the “plateau” as 81-85 Mb/d.
It is not clear how fast the transition away from liquid petroleum transport fuel will occur, but ceteris paribus the transition may be faster at a higher Brent oil price level. Some scenarios I have done suggest that demand may fall below supply in roughly 2037 due to expansion of EVs, at that point oil prices start to fall so that supply matches demand. Difficult to guess how fast oil prices might fall as the falling prices might slow the EV transition.
Depending on how quickly the transition to EVs occurs, the economic disruption of peak oil and rising oil prices might lead to GFC 2 or even Great Depression 2.
Dennis
I’m not in the business of predicting recessions 10 years from now. Most can’t predict 6 months forward. I base my statement mostly from the fact the U.S. economy grew from 2011 to 2014 with $100 plus oil and ended with a 5 year market surplus. Also the economy is a lot more efficient per unit of energy today.
Maybe more importantly there are viable transportation alternatives to oil today. That was not the case ten years ago. For myself, gasoline is less than one-sixth of my transportation expenses. Which is half the cost of my healthcare and has increased much faster than oil over the last 2 decades.
I think your over rating the price of oils impact on the economy.
Huntingtonbeach,
I agree $120/b (in 2018$) might be too low a number and revised to $160/b in 2018$, I agree recessions cannot be predicted, but I suspect the transition from oil based transportation to something else might not go smoothly, despite improvements in EVs, Brent oil prices at $160/b in 2018$ seems likely to have a negative effect on the World economy in my opinion, especially when added to the multiple other problems the World is likely to be facing by 2030.
I am not claiming oil price is the problem, but it may be one of many problems which might have negative consequences for the World economy.
Possibly by 2035 or so the transition to alternative transport may have reached a level where oil price starts to fall due to reduced demand for crude.
Perhaps it will be smooth sailing, but odds seem low.
$33 billion
https://stockdailydish.com/chevron-to-buy-anadarko-petroleum-in-a-33-billion-cash-and-stock-deal/
chevron stock price gains in seven years = zero
I suppose treading water is better than the alternative
tonyE,
link does not work
https://fortune.com/2019/05/09/chevron-anadarko-deal-occidental/
Chevron Drops Out of Bidding War With Occidental for Anadarko Petroleum, May 9, 2019.
Dennis.
One thing that has happened this year regarding our operations is that the price of electricity has fallen significantly. Almost 20%. It is our understanding this is directly the result of ultra cheap natural gas.
I’d rather have the price of oil hovering around $60 WTI instead of $55 (2018 was a very good year at $65 WTI). However, electricity is typically the stripper well’s second greatest expense (after labor).
So I guess there is a small silver lining for conventional operators that results from shale overspend.
Maybe we will send a thank you card to the CEO of CHK. Lol.
Shallow sand,
I hope oil prices go back to $60/b for wti, though Mr Shellman is correct when he tells us that hope is not much of a business plan. 😉
SS, can you quote a typical kilowatt hours per stripper well per month?
Watcher. I can for a 800’-1,100’ well bore, which is about all we have left, we sold the few deeper wells we owned. Do have half dozen 1,500’ wells, cost is minimally more.
Will post later assuming you are interested, but I suspect most stripper wells are much deeper than ours.
Deeper would be more KW Hrs?
Watcher. The current rate is $0.1078 per KWH. There is a $25 facility charge per meter.
I looked the $$ up on some of our one well leases. In each case subtract the $25 facility charge and then divide by $0.1078 to get the kwh:
A. $52.35 (time clock 4 hr/day)
B. $102.33
C. $121.41
D. $158.97
E. $177.43
F. $191.41
G. $118.36
H. $67.54 (time clock 6 hr/day)
It all is dependent upon how much total fluid is being produced. The two lower amounts produced minimal water (which is hauled). On the rest, the power used is not just for the electric motor which powers the pumping unit, but also the hydracell 10 injection pump, which pumps the water down the injection well.
Well B only produces about 20 BWPD, injection pump runs maybe two hours a day. Injection pressure 200-250 psi. F produced about 100 BWPD. Injection pressure 500-550 psi.
Again, very small footprint stuff, which I am sure matters not in the least to the keep it in the ground people. The youngest well on the list was D & C in 1985. The oldest in 1943. D in 1957. H 1960.
Each has a small fiberglass separator, two steel stock tanks, one fiberglass water tank. Small pumping units. Small foot print.
Thanks shallow sand. Pretty good rates, what do you think about the Tesla pickup? Do you usually buy new or used trucks?
I buy a new truck every 6 years or so. Not a big fan of the look of the TSLA truck. Not sure about how it will do in mud/dirt/gravel. Not sure about hot/cold weather range. A lot of unknowns.
I will likely not be an early adopter re: EV trucks.
Thanks for the response. At high gas/diesel prices, I imagine TCO for the Tesla will be pretty good. The Model 3 has no problem in heat or cold, range reduced about 30% at -10 F. No idea on mud gravel performance for Tesla pickup, I tend to keep the M3 out of the mud, but it works fine in snow, as long as its not more than 6 inches deep.
Hi Shallow
I am trying to find up to date production data for the Venturini-Ginochio 3 and 4 wells in the Brentwood field. I have found them with well finder on the California website and although they are listed as active no production data is available.
I know from your previous posts that you subscribe to some well data providers so just wondered if you can find any more info.
Thanks in advance
Lightsout. Do you know who is the operator?
Yes it is Integrity Management Solutions
Lightsout. I see two wells by that name with the number 3. Both operated by Temporary Energy, LLC. First well has made 13,436 BO oil, 5,959 MCF gas and 606 BW 3/19 thru 8/19. The second shows one month of production, 789 BO and 1,246 MCF gas in 7/19. Well 4 has made 11.859 BO and 18,477 BW from 4/19 to 8/19.
These appear to be directional wells in Contra Costa County CA?
Thanks shallow. That’s interesting because the California well finder names the operator as Reabold California they own a 50% share but claim Integrity are operator.
Lightsout. Mind me asking what you interest is in these wells? I don’t see any indication of well depth, but note they are directional wells.
Hi Shallow
It the old story of trying to see beyond the smoke and mirrors. This is the announcement that was made by the company to shareholders.
“At West Brentwood, the VG-4 well was put onto permanent production on 26 July 2019, following a successful ‘hot tap’ to tie into an existing gas pipeline in the vicinity of the field. As announced on 28 January 2019, initial production testing at VG-4 saw the well produce at a choked level of 480 bopd and 742 thousand cubic feet per day of gas. Both the VG-3 and VG-4 wells at West Brentwood are now in production.
Permits for up to three additional wells at West Brentwood have now been secured. Given the success and prolific production rates seen at West Brentwood, Reabold, along with JV partner Sunset Exploration and contract operator Integrity Management Solutions, (“IMS”), is considering whether the next well at West Brentwood should be accelerated within the California drilling schedule.”
Hello Shallow, thanks for the comment. It would be interesting if you wrote a post on your operation. Maybe you have and I missed it. Please direct.
I think you might consider myself a keep it the ground person. I feel that way because of the long term (also short) consequences to plant earth and humans. I also don’t blame yourself for climate change. I’m just as guilty as anyone. The keep it the ground to me is about transforming away from fossil fuels asap, which at best will take a life cycle of infrastructures amount of time. It’s not about putting someone like yourself out of business, but new infrastructure being carbon free.
There will be some pain during a transformation, but a lot less than BAU overall. The world needs to electrify everything and produce it carbon free. Which will make going to the moon look easy.
Salued
I haven’t written a post.
The wells are shallow and are in a field that has been producing oil for over 110 years. There are several people who earn a living pumping the wells plus numerous contract service providers who earn a living in the field, including rig operators and hands, electricians, heavy equipment operators, chemical sales and service, accountants, mechanics and even state well inspectors – who also owe their present livelihood to the oil produced from the field.
About 80 BW is produced for every BO, all of the water is disposed of into wells which are inspected unannounced by state well inspectors and which also must pass a mechanical integrity test every five years. The injection and disposal wells must comply with state regulations and the state regulations must comply with US EPA regulations. Operators must file annual reports with the state detailing the activity of each injection and disposal well.
The wells have almost no associated gas, even when the field was discovered, it was noted that there wasn’t much gas drive after IP. There are almost 3,000 active production wells in the field and I can only think of two wells that have flares, both being maybe 2’ high and both produce from a deeper zone that is not commonly found in the field. Because there is so little gas, there is also no gas infrastructure. There is a small gas field from a shallower formation on the edge of the field where there is some gas infrastructure.
Water flooding was first noted in the 1920s, by operators who were just trying to dispose of the water. Around WW2, water flooding became widespread.
Decline is low, 2-4% annually, which can be reduced by well work over.
Production increased from 2010-15, just as it did when water flooding was initiated and just as it did during the late 1970s-early 1980s boom. Very few wells have been drilled since mid-2015.
I just looked. Over 700 active leases in the field. Only 4 new leases since 1/1/2016 and all four are fairly small (6 wells or less).
shallow sand,
Are most of the wells shallow like yours?
Dennis. Yes. Deepest in our primary field are 4,000’. 90%+ are 1,500’ or less. Shallowest wells we own are 600’, which are in another field nearby. There is a large field near us that has hundreds of 300’-400’ wells.
The vast majority of conventional vertical wells within a 200 mile radius are 3,000’-4,000’, however.
Dennis. Each state has to have regulations on injecting/disposing of water that comply with US EPA regulations. Otherwise, the state would lose primacy and the US EPA would regulate wells in the non-complying state.
The primary issue we are seeing is not with the regulations themselves, nor the enforcement per se.
As in the rest of the industry, many in the regulatory side of upstream have retired. They are being replaced by people who have little hands on experience in the industry and/or have been trained in different fields. It would be preferable to have petroleum engineers and geologists working in these positions instead of persons trained in other areas.
We are finding primarily people take the job in oil and gas to get a foot in the door on state employment, and then bid on and transfer to their chosen field/occupation once said job opens. As you may know, in most states current state employees get preference over new hires.
So, you see industrial engineers, environmental engineers and the like filling these jobs, staying a short time, and then the cycle starts all over again.
Just another problem with calling for the end of the industry decades before feasibility. No one wants to specialize in regulating it because of being told it is going the way of the horse and carriage next year.
Shallow sand
More great stuff. Don’t know the answer for people retiring.
Thanks, interesting. About 1920 Huntington Beach was an oil boom town. There are lots of striper wells around town. I’m always trying to figure out what’s going on. There’s also two platforms about a half to one mile off shore in about 50 feet of water. There are 3 more about 10 miles out.
CRC has ownership of some of all of it and I own a little to much of it at the moment. But, it’s really cheap right now and not in bankruptcy fear like 3 years ago.
This is how a city boy gets his hands dirty. This can all be gone at a click of a mouse. Don’t even need a truck.
So 98 percent of what you pull up. You pump back down another hole to keep the oil flowing to the lift well ?
HB. Yes, that’s pretty much it. Cycling water through sandstone. I’m not a geologist, so my explanations are necessarily simplistic.
I happened to drive right through the Inglewood oilfield when I was last in LA. I see a lot of SoCal operated production is now for sale. It has to be a nightmare operating there. However, some really good stripper well production. Too bad it’s not in the middle of nowhere instead of being located in one of the most populated areas in the USA.
Shallow sand,
For the wells you run, is it 1:80 oil:water?
That would be 98.7% water by volume, yikes.
Dennis. Yes. Mostly water. Each well varies, of course. Some make almost zero water. Have a one well lease that we’ll haul one 70 barrel load of water a year.
But the field has been this way for decades regarding water. I suspect you will find similar water cuts in many mature USA lower 48 onshore fields.
I suspect KSA and Kuwait handle a lot of water too?
shallow sand,
I just did not realize it was 80 to 1, as long as the economics works and everything gets done in an environmentally responsible manner (and it sounds like the regs are pretty good in your state) it’s all good. For some reason I expected maybe 10 bw/bo, hey only off by an order of magnitude. 🙂
Shallow sand,
There are around 330k stripper wells in the US, I imagine quite a few of those are shallow wells even though the average depth of oil wells may be about 4000-5000 feet in the US, I imagine there may be a fair number of wells that are 1000-1500 feet deep. You would know more than me. I can’t seem to find any data on the depth distribution.
Ovi,
Your post is on Yahoo!
https://finance.yahoo.com/news/visualizing-us-shale-slowdown-220000639.html
and now OilPrice.com
https://oilprice.com/Energy/Crude-Oil/Visualizing-The-US-Shale-Slowdown.html
Tony
Thanks for letting me know.
That’s great, congrats
Paul,
Unfortunately Ovi is not happy about Oil Price dot com removing his name from the post, yahoo picked up the post from oil price, but at least they have a link back to peakoilbarrel.com.
Ovi,
Oil Price has corrected their mistake, hopefully they will continue to do things this way in the future.
https://oilprice.com/Energy/Crude-Oil/Visualizing-The-US-Shale-Slowdown.html
OPEC+ Gambles That U.S. Shale’s Golden Age Is Over
(Bloomberg) — For years, OPEC ignored the rise of the U.S. shale industry and came to regret its mistake. Now, the group is making another bold gamble on America’s oil revolution: that its golden age is over.
When the Organization of Petroleum Exporting Countries meets this week, ministers will discuss whether to extend their current output target, rather than reduce it, according to people familiar with the internal debate. The reason? They believe relentless U.S. oil production growth will slow rapidly next year.
OPEC isn’t alone. Across the industry, oil traders and executives believe U.S. production will grow less in 2020 than this year, and at a significantly slower rate than in 2018. On paper, the cartel has the oil market under control.
Slower growth doesn’t mean no growth, however. While the independent companies which drove America’s shale expansion are struggling, and have announced big spending cuts, Big Oil is now playing a much bigger role in key basins such as the Permian. Companies with deeper pockets, such as Exxon Mobil Corp. and Royal Dutch Shell Plc are likely to continue spending, increasing production in Texas, New Mexico and elsewhere.
Vitol Group, the world’s largest independent oil trader, expects U.S. production to increase by 700,000 barrels a day from December 2019 to December 2020, compared to growth of 1.1 million barrels a day from the end of 2018 to the end of 2019.
https://www.bloombergquint.com/global-economics/opec-gambles-that-u-s-shale-s-golden-age-is-over
The decision to terminate hundreds of USA jobs was communicated in a letter to the Oklahoma Office of Workforce Development. The Monday letter by Michael Queener, Halliburton Vice President of the MidCon Area said company the looking close its office in El Reno.
“The layoff is expected to be a permanent employment loss,” Queener wrote in the letter.
The El Reno field camp handles a dispatch command center and houses several hydraulic fracturing crews. Among the 808 employees to be laid off, one third worked with acids used in the hydraulic fracturing process and one-tenth of the team handles cementing work for oil wells.
https://www.ibtimes.com/halliburton-layoffs-2019-800-lose-jobs-oklahoma-plant-shuts-down-2877864
Tony
It will be interesting to watch Oklahoma’s production over the next few months. I was surprised when I saw the bump up in OKs production as shown in the OK chart above.
Fracing slowdown in Permian basin leads to more job losses
HOUSTON (Bloomberg) – The throttling back of fracking in the world’s biggest shale patch is hitting the unemployment line in Texas.
Fracing contractor Superior Energy Services Inc. slashed 112 jobs from its Pumpco unit in the Permian Basin last month, according to an email Monday from the Texas Workforce Commission. The state received notice of the Ector County reductions on Nov. 22, with the firing date set for three days after that, according to the commission.
Employment in the Permian Basin of West Texas has fallen by 400 through the first 10 months of the year, a massive change from the 16,700 jobs added in the same period last year, according to a report last week from the Federal Reserve Bank of Dallas.
Permian basin frac crews, who are brought in to complete the final stage for creating a new oil well, have dropped 21% so far this year, according Primary Vision Inc. For all of 2018, frackcrews in the West Texas and New Mexico oil fields expanded by 1.3%.
The commission disclosed Monday that another oil services company, National Oilwell Varco Inc., fired 85 employees in Harris County, which includes Houston. Job cuts at Halliburton Co. and RPC Inc. have also been confirmed in recent weeks.
https://www.worldoil.com/news/2019/12/3/fracing-slowdown-in-permian-basin-leads-to-more-job-losses
It might be that acc. to earlier report most Tiere 6 Ducs with initial production > 800 bpd is already used this had break even cost 18 usd pr. barrel , than perhaps 50% of Ducs fracked now show initial oil flow 800-600 corresponding to Thiere 5 wells and remaining might be 80% Thiere 4 and 20% Thiere 3 wells. Guess when the result off new fracked wells show bad flow they stop frack more in that Area and send crew home. Guess not many sweet spots left but I read the Authorities will issue some new Acre in Permian in 2020 think it was 53 000. Perhaps that could add more sweet spots or Thiere 6 and 5 that might be profittable in a 50 usd environment WTI.
“You can’t just keep dropping rig counts, moving to more marginal acreage, failing to increase productivity as much as in previous years,” he said. “All of those offsets that there used to be have gradually disappeared.”
For Permian oil production to remain constant around 420 wells/month needed to be completed, which is currently happening, but in other plays such as the Eagle Ford “critical levels” of well completion were not being achieved, he said.
https://www.spglobal.com/platts/en/market-insights/latest-news/oil/120319-us-shale-magic-stalling-investments-shrinking-standard-chartereds-horsnell
Tony,
Great article thanks.
Also from that article:
Standard Chartered’s own forecast is for US liquids production to increase by 700,000 b/d next year, of which 500,000 b/d is crude oil, 400,000 b/d of this being derived from shale.
So their tight oil forecast is about a 400 kb/d increase in 2020. US tight oil will end the year at about 8200 kb/d and their 400 kb would put US tight oil at 8600 kb/d at the end of 2020, fairly similar to your forecast. I think 8800 kb/d in Dec 2020 is more likely, if oil prices rise as I expect over the course of the next 15 months to about $65 to $70/b for Brent. Peak is reached in 2025 at about 10.3 Mb/d with 50/50 chance output might be higher or lower than this level and that the peak will be earlier or later than my best guess estimate.
Update from https://shaleprofile.com/2019/12/03/us-update-through-august-2019/
Band 1 wells produce > 800bd and show a peak of 1.29 mbd in Dec 2018, dropping to 1.18 mbd in Aug 2019. Assuming that the majority of these Band 1 wells are located on Tier 1 acreage, this 8.5% production decline is evidence of a decline in number of sweet spots.
Band 2 wells produce 400-800bd and production has been on a peak plateau of just over 1.7 mbd since Nov 2018.
Band 1 wells >800bd
Band 2 wells 400-800bd
Tony,
This can result from falling completion rates (see 2015 to 2017 in your two charts above).
Chart below is from EIA DUC data at DPR site, Anadarko, Bakken, Eagle Ford, Niobrara, and Permian basin completions. Note that most recent 12 months of completion data may not be very accurate, prior to that the data may be ok.
It’s also notable that Band 7 wells, producing 25-50bd, have displayed a production growth rate decline since early 2017. On March 2017, there were 13,061 wells producing just over 470 kbd, increasing to 508 kbd, from 14,213 wells, on Aug 2019. The average production per well has remained constant at 36 bd.
Does anyone have an explanation from this production rate growth slowdown since early 2017?
Band 7 wells 25-50bd
Image link for productivity distribution, need to copy and paste link to browser
“https://public.tableau.com/shared/3W56S8RCH?:toolbar=n&:display_count=n&:origin=viz_share_link&:embed=y”
ND Bakken, Eagle Ford, Niobrara, and Permian wells with first flow from 2008 to 2018, 61,400 total wells, first 12 month cumulative average 90506 barrels with 59% of the wells less than average and 41% above average. The average well profile for all these wells has a peak output of 440 b/d and 12 month cumulative average output of 92215 barrels.
Tony,
Here is US tight oil plays wells with production level at 100 b/d or less, this may be a result of high grading after oil prices fell sharply in 2014/2015, in other words there was more of a focus on completing tier one wells when oil prices were lower, so fewer wells were falling in output to under 100 b/d relative to earlier periods when lower productivity wells were being completed.
Finally a source out with October vehicle sales. November SHOULD be out, but it is quiet, again.
1.34 million vs 1.35 million Y/Y same month 2018 Decline of 0.7%
Top 3 best selling models F150 sales Y/Y same month +5.8%. Ram P/U +8%. Silverado +12%. The losses were down the list a bit, Equinox and Honda Accord.
Tesla sales -5.4%, much steeper decline than all vehicles (and given the steep declines “all vehicles” may not have been -0.7% if EVs excluded, probably less). Other EVs, no data but this is likely the 4th consecutive month of declining Y/Y sales. That market may be full and done.
Oil burn from the total inventory is going to rise from this mix. The heavy burners are rising in sales. A mpg estimate for everything on the road . . . relentlessly upward.
source is marklines dot com, look for flash report
Since you brought it up-“Other EVs, no data but this is likely the 4th consecutive month of declining Y/Y sales. That market may be full and done.”
You may enjoy this news on Ford.
They have stacked one of their biggest cards on getting this right.
The first inning is still in its early phase.
https://www.motor1.com/news/384702/mustang-mach-e-sold-out/
Those are the best pictures I have seen yet of the E Mustang. Disappointed in the slopping tail end for less cargo utility. Also a tv size touch screen looks out of place and like a driving distraction in it’s location.
TCO comparison of F150 and Tesla Cybertruck
https://www.teslarati.com/tesla-cybertruck-vs-ford-f-150-tco-comparison-video/
For CA, F150 72K, Tesla 53K
For TX F150 65K, Tesla 47K
For Total cost of ownership over 5 years.
The comparison pictures of the two together real makes the Ford look old
Its a Ford—
Don’t hold your breath
After 40 years of GM loyalty, I’m a little pissed with them.
Everybody’s on the table next time.
Tony, seems less oil is comming out off US shale, drilling and fracking work is declining but still EIA sees increase of millions of barrels. I understand they exspect the Mayors will save US shale, the next 6.month will give that answer. Will be interesting to see Exxon drilling result from GOM, to prevent decline in US shale will cost billions off dollars perhaps 25 will not be enough. They also need cash or borrow for dividend..
Freddy,
The total for the EIA estimate for tight oil production estimate by play when Oklahoma and rest of US tight oil are subtracted from total compares well with the shale profile estimate for Dec 2018 (when we choose Bakken, Eagle Ford, Niobrara and Permian only for the basins at shaleprofile for both it is 6.6 Mb/d. For more recent estimates there is missing data at shaleprofile.
Freddy,
I’m not sure what Exxon’s plans are for the Gulf of Mexico. I suspect you’re referencing the attached press release about the 21 well deal they signed with Valaris for their Ensco 87 jack-up rig. These are shallow water rigs, typically under 400′ water depth, but some can go out to 600′ or so.
The length of the deal is only 295 days, so, it could be that the rig will be doing some Plug & Abandon work, but this is just a guess.
https://www.rigzone.com/news/exxon_awards_valaris_21well_gom_contract-26-nov-2019-160439-article/
https://www.zerohedge.com/energy/russian-gas-mega-pipeline-china-goes-online-putin-xi-hail-closer-ties
10% of total China consumption by 2022. And capacity grows from there.
Clarifying the capacity of the pipeline is greater than the gas that will flow through it to represent 10% of Chinese consumption. Beyond 2022 more gas will flow through that pipe line.
The presumption is of course that Chinese consumption will grow over that period of time. If so, the increased gas might maintain the 10% of consumption level. If Chinese consumption doesn’t grow as fast then the 10% number will increase.
There is oil relevance here in that Chinese gas consumption increasing implies not just population increase but industrial increase. Naturally that will correlate to an increase in oil consumption. They have been growing oil consumption at 5% per year. This extra gas will represent an absence of restraint that might otherwise have existed on that growth.
Attached is the weekly updated chart for US L48 production. Same as last week at 12,400 kb/d. The increase from Nov 1 to Nov 29, 300 kb/d seems a bit overdone. Looking at the DPR, it only shows an increase of 100 kb/d from Oct to December. Was there some big increase from the GOM? We will know in a few months.
Ovi,
Take a look at weekly vs monthly data in Feb 2019, looks like it was too high by about 500 kb/d. Note that the EIA’s tight oil estimates by play has Oct tight oil output up by 143 kb/d from Sept. If November rises by the average level from March to Oct (about 100 kb//d), then Nov output would be about 240 kb/d above Sept output and we would be in the right ballpark, but often the weekly estimates can be 500 kb/d too high, or 500 kb/d too low, or somewhere in between.
That is why I simply ignore the weekly data, I think they just generate random numbers. 🙂
Dennis
The last monthly data point is for October and was taken from the November MER. Adding 100 kb/d to that for November gets us to 12,200 kb/d for the L48. The weekly average for November is closer to 12,350.
So I was just pointing out that the last data point looked a bit high. While I wouldn’t say that their numbers come from a random number generator, I would say they are overly optimistic. I often wonder if this optimism has some other objective.
Also I see no harm in presenting the weekly data and let our viewer hear the different perspectives that are presented on that data.
Ovi,
Just pointing out that when we look at historical weekly data and compare it with monthly data, it does not look very good. Past 6 years monthly vs centered 5 week avg.
Not always optimistic, sometimes too low sometimes too high, pretty much random error imo. Essentially monthly output plus random number (-500 to 500 kb/d).
If we take the average from Jan 2014 to Sept 30 2019, the weekly data is on average 100 kb/d lower than monthly data, so weekly is on average pessimistic rather than optimistic over period of chart
Dennis
I guess that leaves us with the question of deciding whether they are in an optimistic mode this week/month or pessimistic. For me, it looks like they are on the optimistic side for the next month or so.
Ovi,
I expect Nov 2019 L48 output to be about 240 kb/d higher than the Sept 2019 monthly estimate, so the weekly number may be a bit optimistic, I tend to focus on the 4 week average, currently at 12350 kb/d(for we 11/29/2019). I expect Nov 2019 L48 output will be 12260 kb/d, so the weekly number would be about 1% too high. That is about as good as it gets for weekly estimates.
Rystad Energy predicts that total non-OPEC production (crude oil and condensate) will grow by around 2.26 million barrels per day (bpd) in 2020.
https://www.rystadenergy.com/newsevents/news/press-releases/NonOPEC-production-is-growing-at-record-speed/
The chart below shows Rystad forecast 2020 growth of C+C from the top 10 non-OPEC countries, which total 2.60 mbd. That means that Rystad is forecasting a decrease of only 0.34 mbd from the rest of non-OPEC countries, since Rystad is forecasting 2.26 mbd growth from all non-OPEC countries.
Rystad forecast of 1.09 mbd increase for US C+C appears high but Rystad has an office in Houston and may want to give optimistic forecasts for US Shale, instead of truly independent forecast.
The increases of about 0.5 mbd from both Norway and Brazil are also optimistic, in my opinion, because annual decline rates from Norway and Brazil’s existing offshore production are high, 10 to 20%.
http://www.postpeakliving.com/files/shared/Hook-GOF_decline_Article.pdf
My guess is 1.5 mbd C+C 2020 growth from non-OPEC.
Rystad on 12 Sep 2019 posted a forecast of tight crude (shale oil) in a base scenario.
https://www.rystadenergy.com/newsevents/news/press-releases/us-shale-to-grow-to-14.5-million-bpd-by-2030/
I don’t know why Rystad is so optimistic about US shale oil. Maybe they get paid $ to be optimistic?
Rystad base case forecasts US shale oil to peak at about 14.5 mbd around 2030???
However, Rystad forecasts a linear growth rate of about 0.9 mbd/yr from 2018 to 2025, for its base case. Their forecast appears too simplistic. I’m sure Rystad has a methodology for forecasting but I don’t know what it is.
The chart below indicates that Rystad forecast is not a curve but a series of linear segments which I don’t believe.
It will even grow at 45$ WTI price for 10 years. Are they believing the investor powerpoints of break even prices below 30$ even at class B wells?
another interesting chart from Rystad.
Too optimistic even for me.
Tweaked tight oil model to match data better (last 4 months have been running ahead of model as completion rate has been higher than I anticipated.)
My current best guess, URR 89 Gb, peak 2025 at 10.2 Mb/d for US tight oil.
updated eia data
The graph above is a bit misleading in some respects. Australia is forecast to increase their oil production but what is not shown is the base from which this is growing. It’s like saying a canoeist is increasing his canoe’s speed but what is omitted is that he is paddling upstream. Australia “reaching an all time high of 781 BBL/D/1K in February of 2000 and a record low of 238 BBL/D/1K in May of 2018.” (Ref: https://tradingeconomics.com/australia/crude-oil-production ) 57BBL/D/1K to 238 BBL/1K is good for them but it does not change the fact that the general direction of the canoeist is down stream.
Interesting news about the Economic of US shale. I guess this Company use as many DUCs as possible to save money, guess that is included in the breake even price of both gaz and oil . Seems the investors still not believe all that is presented from the Companies but at least they managed to borrow more as they could continue to produce oil and gaz. https://www.rigzone.com/news/wire/chesapeake_debt_deal_skirts_bankruptcy-04-dec-2019-160495-article/
A. $52.35 (time clock 4 hr/day)
B. $102.33 –>
C. $121.41
D. $158.97
E. $177.43
F. $191.41
G. $118.36
H. $67.54 (time clock 6 hr/day)
minus $25 facility charge (per meter per what? day? month?) 0.1078 dollars per Kw-Hr
Can’t really get a power consumption estimate without knowing frequency of facility charge.
Not a fan of scroll. This is SS’s quote of electricity consumption on some stripper wells.
Watcher,
Probably one meter per well,
so subtract 25 from the figure given, then divide by 0.1078 to get kwhr used each month.
Most commercial electricity bills have a fixed monthly charge (in this case $25/month) and then one is charged per kWhr. This is fairly straightforward.
$, kWhr
52.35, 254
102.33, 717
121.41, 894
158.97, 1243
177.43, 1414
191.41, 1544
118.36, 866
67.54, 395
Dennis. To be clear, I just set forth “one production well” leases.
Most leases here have multiple production wells.
Typically, there is one meter per lease, whether there is one production well or several.
shallow sand,
Thanks for teaching us about the real world oil industry, it is much appreciated by everyone.
For the numbers you reported N, then kwHr would be (N-25)/0.1078, I think because they are one well leases, for a lease with X leased we would do
(N-25/X)/0.1078 to find kWhr for each well.
So the $25 is monthly per meter, and sometimes more than one well per meter?
It would simply be useful to know how many kilowatt hours are required per month per well. Maybe also kilowatt hours per barrel pumped.
Watcher. The kWh per well varies based upon variable such as strokes per minute, size of pumping unit, etc.
I will look at our field wide and give you an idea of average when I get time. Maybe have time this weekend.
Watcher
I gave you kWhr per well,
I don’t have barrels per well,
I would certainly not want to reveal my output if I ran the wells, perhaps shallow sand thinks the same.
I am grateful he has shared the info we have.
Dennis. I have no problem giving you and Watcher a field wide estimate which I believe would be pretty close. I estimate electricity charges run on average $6-7 per gross barrel of oil produced. By gross, I mean before deducting royalty barrels. The more water a well produces, the more power needed for both the pumping unit motor and the injection pump motor. Also, the higher the injection pressure, the higher the electricity for the injection pump motor. However, injection pressures here are fairly constant.
I would note that during winter we use bypasses, which keep the injection pump running full time, so it won’t freeze, plus we use heat lamps to keep the injection plant buildings warm. So more electricity is used in the winter. Also, some separators have electric heaters in them which help separate oil from water in cold weather.
Again, this is for one small conventional field. In several areas, pumping units run on produced gas. Wells don’t make as much water.
I owned an interest in a a couple wells in Mike’s general neighborhood years ago. The pumping units ran on produced gas. The wells made almost no water, maybe 1 barrel of water for every 10 of oil. One well pumped one day a week. The other pumped every other day. They were extremely economic, except each was over 5,000’. So, a tubing leak would wipe out an entire year’s profits, as the wells were very low volume on oil also.
There are lots of variables out there. Looked at a unit for sale in Wyoming once. All of the wells ran on submersible pumps. Made over 200 BW for every BO. Heavy oil. Water was not salt water. Had a permit to dispose of produced water in a waterway leading into a creek. So LOE wasn’t that high despite all the water. I know that is difficult to believe, but the pumped grew a garden in the summer near the tank battery and watered it with produced water.
All very interesting, thank you.
A peripheral question. Yes it will be good to have a kilowatt hours number req’d to produce some typical number of barrels per day. I mostly wanted to be sure that dollars were not the unit of measure.
But the peripheral question is — is there some sort of regulatory configuration for the electrical equipment? I’m sort of asking for typical power consumption to operate an oil field and it would be good to know if regulations help to ensure that the word typical has meaning.
Thanks Shallow, do you preform most of the labor and maintenance yourself or hirer out most everything ? Can you look forward and say this well is not going to be economical in 10 to 15 year or might it have a major expensive repair that doesn’t justify continuing operations? Alot of old used cheap equipment around to keep things running ?
Thanks
HB. Most of the operators work in the field. I am an investor with family members and work a totally unrelated job.
Most operators do hire several different types of contract companies to do service work. It’s is not economic to own a rig and employ a crew if you don’t use it every days. Same with all the other types of service work.
Every service company is a small business, just like every operator in most fields in the US. So, leave it in the ground is not just against big oil. Leave it in the ground is against thousands of small businesses across the United States. I don’t think leave it in the ground realizes this. Some thought needs to be given to what to do about these job losses.
As to economics down the road, keep in mind that a lot of stripper wells in the US are already decades old. The biggest issue usually is when a well develops a casing hole. Those are difficult and expensive to fix at times, any many times it is best to just plug the well. But not always. Those can be repaired.
As for old equipment, it is usually much higher quality than new equipment with regard to pumping units. One small business here buys old pumping units, repairs them, and sells them. All the companies here would rather buy from them than buy new. The stuff manufactured prior to 2000 will last forever if you keep it greased and oiled. There is one exception to this, there is a company that does make good small units new. I understand it is owned by a man who sold out and then didn’t like how the units of his old company were being made, so he started another company. We buy those if we need a 10, 13 or 16 unit. Most of the units on our wells were likely manufactured in the 1970s-early 1980s boom.
A local company makes fiberglass tanks and separators. Those can last decades. Same with steel stock tanks. There are two companies that repair down hole pumps. Two that repair injection pumps. The small ones (which are in use here the most) can be removed and easily taken to the repair shop, with a spare replacing the one that needs repaired. Not so on a “big lease” that has many wells and has a large injection pump.
Operators do go through a lot of belts and small fittings. Again , sold by a small supply company.
All of this stuff is pretty much a small business operation as the majors and large independents sold out of US lower 48 onshore in a big way in the late 1980s – 1990s. So you will find much the same in many states.
I hope this helps to explain why it doesn’t make people feel good that many want oil production to end. It’s not only a job for a lot of people, but for many it is the end of their small business, that has been successful for decades. A lot of these are second, third, fourth and even fifth generation people.
Shallow sand,
At some point oil may become too expensive relative to alternatives. I imagine those in the whaling industry were unhappy that whale oil got replaced, and coal miners probably are not happy that demand for coal is falling (in the US). Whether through government interference or simply by means of the free market, some industries eventually wind down.
This likely occurs slowly over the next 30 years or so. Or that is my expectation, oil prices may start to fall between 2035 to 2040, as hybrids, plugin hybrids and EVs gradually reduce demand.
How is the wind resource in your area? Maybe there is another energy industry that people could move into?
Hi SS, thanks for all this, very enlightening for us folks that don’t work in the oil patch.
Kind of a random question for you or anyone, but does seismic activity like earthquakes ever affect well casings in a substantial way? It seems like all those vertical and especially horizontal well casings would be very prone to cracking in such events.
Thanks!
Shallow sand,
On the royalty barrels, say its 15% (no idea the typical rate in your area), do the land owners get this payment in barrels, with no deduction for cost of production?
If that is the case, then electricity costs per net barrel would be more interesting as that is the number that affects the working interest.
Dennis. If oil can’t compete economically it won’t and will be phased out. No issue with that.
Do have an issue with pols who think all oil is produced by evil big oil while they continue to consume oil and other FF.
Royalty burden runs 12.5 to 25 percent here with vast majority being 12.5 to 20.
Do those who get royalty barrels pay you for the costs incurred to produce the oil?
I agree oil production should not be shut down. As long as there is proper regulation, as espoused by intelligent people like you and Mike Shellman, seems fine to me.
As oil becomes expensive demand will gradually fall as will output that is profitable to produce.
I think we may be on the same page, or at least same chapter. 😉
Royalty only pays severance and ad valorem taxes. And income taxes of course. It is free of all operating costs. At least that is how it is here.
Thanks shallow sand. Probably standard practice everywhere. Surprising they get their barrels for free, a good deal for them.
Wow
The reported 500,000 cut is larger than the numbers floated ahead of the meeting. It would bring the total production cut to 1.7 million barrels per day. On Friday, OPEC and its allies — known as OPEC+ and which includes Russia — will meet to finalize any proposed measures, including how any cuts would be implemented by each country.
https://www.cnbc.com/2019/12/05/opec-december-meeting-opec-production-cuts-in-question.html
Tony,
From what I have read this is a cut from current quotas, and results in little actual change in OPEC+ output, essentially it is status quo as far as actual output.
Sounds like they are trying to make a silk purse out of a sows ear. I heard on the TV, if they all meet their new targets. SA is prepared to cut an additional 150 kb/d.
Here is a short summary.
Instead, delegates said it would rejig its deal to formalize the extra supply reductions some of its members, notably Saudi Arabia, have already been making for most of the year. Then it would share them out more equitably among the countries that have consistently failed to meet their targets.
Saudi Arabia, the world’s largest oil exporter and the group’s defacto leader, will continue to pump at current levels under the new agreement, said delegates, who asked not to be named because the information isn’t yet public.
Under the new deal, the size of the OPEC+ daily production cuts target will be increased from 1.2 million barrels to 1.7 million barrels, compared to a baseline of October 2018, according to ministers including Russia’s Alexander Novak and Iran’s Bijan Namdar Zanganeh. That doesn’t require the group as a whole to pump less oil, since it was already implementing an additional cut of that size in October 2019.
https://www.rigzone.com/news/wire/opec_agrees_to_redistribute_oil_cuts-06-dec-2019-160513-article?rss=true
Latest update. This must be meaning full since WTI just hit 59.53 +1.10
From OPEC+
Saudi Arabia will continue to voluntarily cut 400K B/D and will cut an additional -167K
total OPEC+ cuts will amount to 2.1 million B/D after improved compliance.
need to show are serious about output cuts
no interest in fiddling the numbers on cuts
we don’t want oil inventories to rise in 1Q
OPEC+ showing readiness by meeting in March
Some DUCs will never be completed and can be named lame DUCs. According to Raymond James and Associates there are about 1200 lame DUCs.
“We should note that we are not blaming the EIA for bad data,” Freeman said. “We are simply making the case that the current reported EIA DUC count is overstated by nearly 15% versus reality. No matter how it is sliced, the difference in reported versus real DUCs is staggering.”
Should the DUC drawdown and completions continue at their trailing three-month rate, DUCs could reach critically low levels by February.
https://www.naturalgasintel.com/articles/120348-duc-duc-goose-giant-disconnect-seen-in-lower-48-well-completions-rig-count?v=preview
https://www.bnnbloomberg.ca/saudi-aramco-raises-25-6-billion-in-world-s-biggest-ipo-1.1358246
The shares were priced at 32 riyals (US$8.53), according to a statement. The initial public offering was 4.65 times oversubscribed, with most of the money coming from local investors. It received total bids of US$119 billion.
Who are these local investors, the Saudi government?
Not likely. It is the Saudi government that is trying to raise the money. ARAMCO is wholly owned by the Saudi government. So if they bought them it would simply be a buyback. The most likely buyers would be Saudi businessmen and perhaps members of the royal family.
I believe China also want to invest in that Saudi IPO
Saudi central bank. Saudi SWF. Al-Waleed, personna non grata.
Related: Bakken oil pipeline project slammed shut
https://www.cnbc.com/2014/12/12/bakken-oil-pipeline-project-slammed-shut.html
Longtimber,
That article is from 2014, probably not that relevant.
Oops. Did all the takeout for Bakken get built or production still using Buffets rail?
Longtimber,
I think some of the pipelines got built, just not the one from Canada to Oklahoma.
Brent oil almost $65 and WTI almost $60
https://oilprice.com/Latest-Energy-News/World-News/Why-The-OPEC-Pledge-Is-More-Bullish-Than-It-Seems.html
Seems Halliburton is further adjusti g workforce to reduced demand for their services in the US Shale play…
https://www.rigzone.com/news/halliburton_confirms_more_layoffs_in_oklahoma-06-dec-2019-160514-article/
Has anyone here tried to download the November IEA Oil Market Report. I can’t seem to find the archives anymore. They are offering a September version, whereas we used to be able to get it, two weeks after publication.
Ovi,
I have the November IEA OMR. If you give me your email address then I’ll email it to you. I downloaded it from IEA old website on 30 November. IEA has a new website.
Tony
Thanks Tony
I already have it. I just happened to go to the IEA site and realized it was different. Tried to find their archive and only October was there. Looks like we will have to log in to get an old two month report.
I may have stumbled onto an assay for Bahzenov shale oil.
Urals is a blend of three different Russian oils, one of which is Western Siberia and towards the North near the Kara sea. This is the Bahzenov area.
It is labeled light with an API density of 37.
Speaking of the Kara sea, people may recall that Exxon had partnered with Rosneft to develop the oilfield that is known to be below the Kara sea. This ended with sanctions.
There is a September 2019 blurb saying Rosneft has declared that oilfield unfeasible.
A guy named Guillermo Nielsen has been appointed head of the Argentine NOC portion of YPF. He is gung-ho Vaca Muerta.
An interviewer asked him how about the new administration’s policy in the VM. He was nudged about the decreed price of oil and he fended it off, and spoke instead about a new policy easing repatriation of profits by the foreign oil companies. When they export oil or gas they will not be required to keep the money in Argentina.
Maybe the most significant part of this is I had not known that any such restraint was in place and Chevron had not mentioned anything about this.
It’s a little bit weird. He talks about a trust account in New York City where incremental export proceeds will be stored as a 1-year parking lot. Then large multinationals can spend on machinery and drilling with confidence, because it is their money. His phrasing is something like the Argentine government well supervise, the private companies will inform, but they will not ask permission. Frankly this all looks like very carefully crafted phrasing to make reassuring noises to the multinationals without committing to very much at all.
In an overall perspective probably all that we could conclude from this is that Vaca Muerta is to be an enormous priority for the new administration.
Source cronista.com
The chart below from the article link shows a declining production growth rate. If this trend continues then US shale oil will peak in 2021.
https://seekingalpha.com/article/4311287-rise-of-crude-oil
“This slowdown in production is primary coming from the Permian Basin due to a wave of bankruptcies, however overall production growth rates show slowdowns in basically every major region.”
Note that MBD in the chart means kbd.
Two new posts up:
http://peakoilbarrel.com/eias-electric-power-monthly-november-2019-edition-with-data-for-september/
http://peakoilbarrel.com/open-thread-petroleumdecember-8-2019/