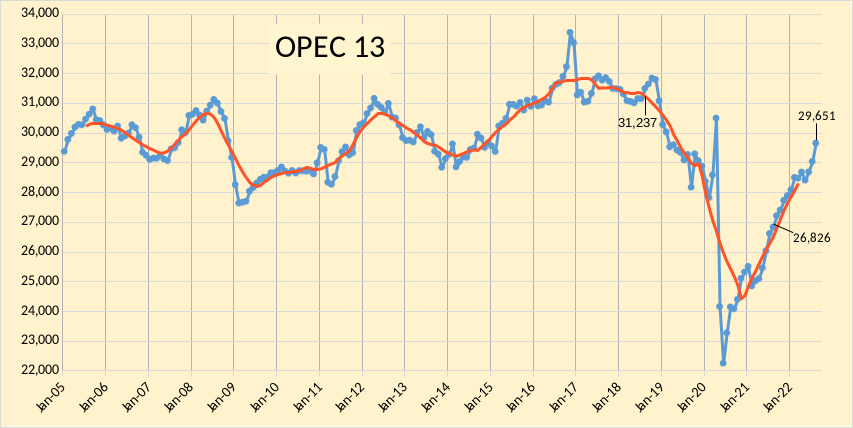
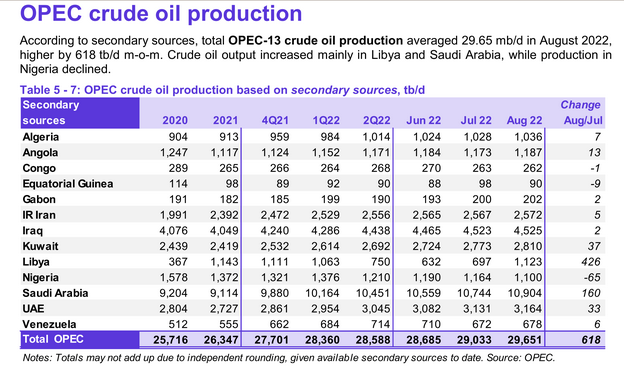
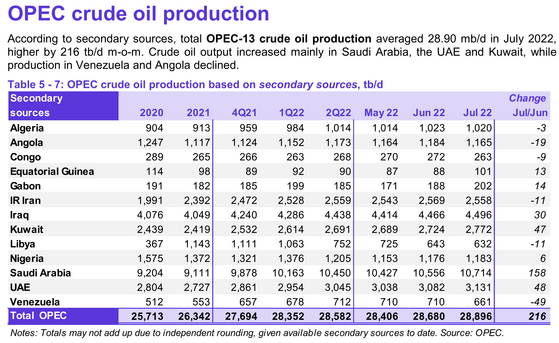
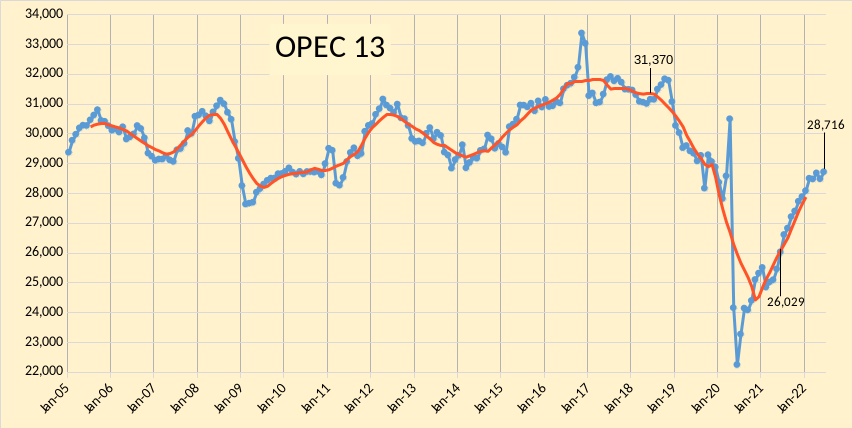
The OPEC Monthly Oil Market Report (MOMR) for September 2022 was published recently. The last month reported in most of the OPEC charts that follow is August 2022 and output reported for OPEC nations is crude oil output in thousands of barrels per day (kb/d). In most of the OPEC charts that follow the blue line is monthly output and the red line is the centered twelve month average (CTMA) output.
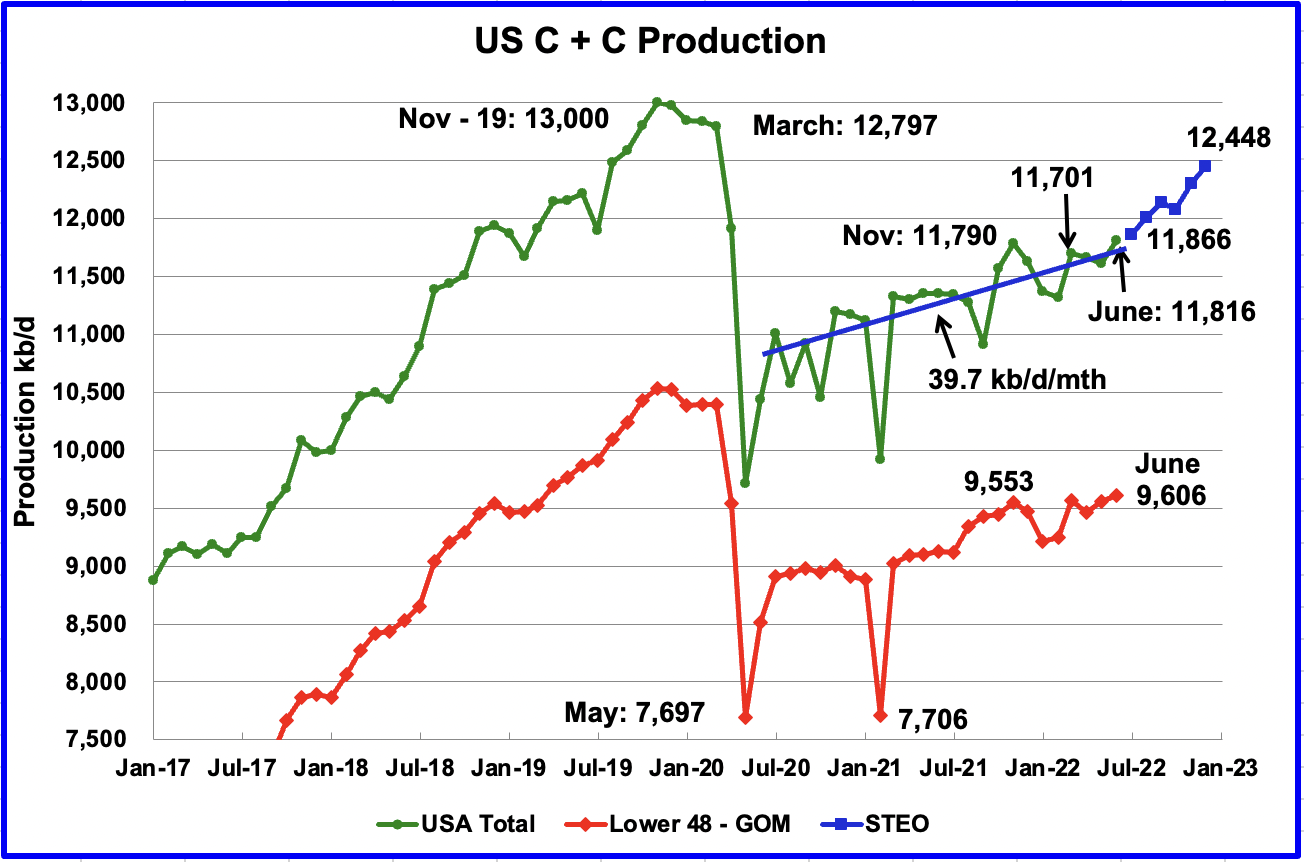
All of the Crude plus Condensate (C + C) production data for the US state charts comes from the EIAʼs Petroleum Supply monthly PSM.
U.S. June production increased by 201 kb/d to 11,816 kb/d. Of the 201 kb/d increase, the largest increase came from the GOM, 183 kb/d. June’s production was a new recent high at 26 kb/d higher than November 2021 which was producing at a rate of 11,790 kb/d.
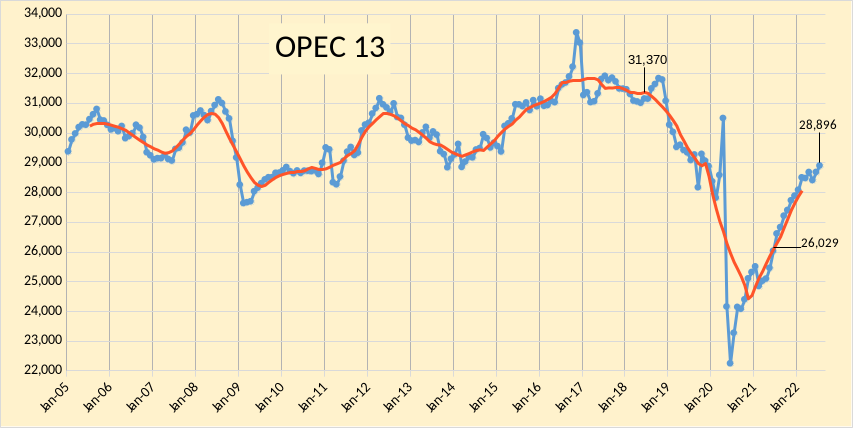
The OPEC Monthly Oil Market Report (MOMR) for August 2022 was published recently. The last month reported in most of the OPEC charts that follow is July 2022 and output reported for OPEC nations is crude oil output in thousands of barrels per day (kb/d). In most of the OPEC charts that follow the blue line is monthly output and the red line is the centered twelve month average (CTMA) output.
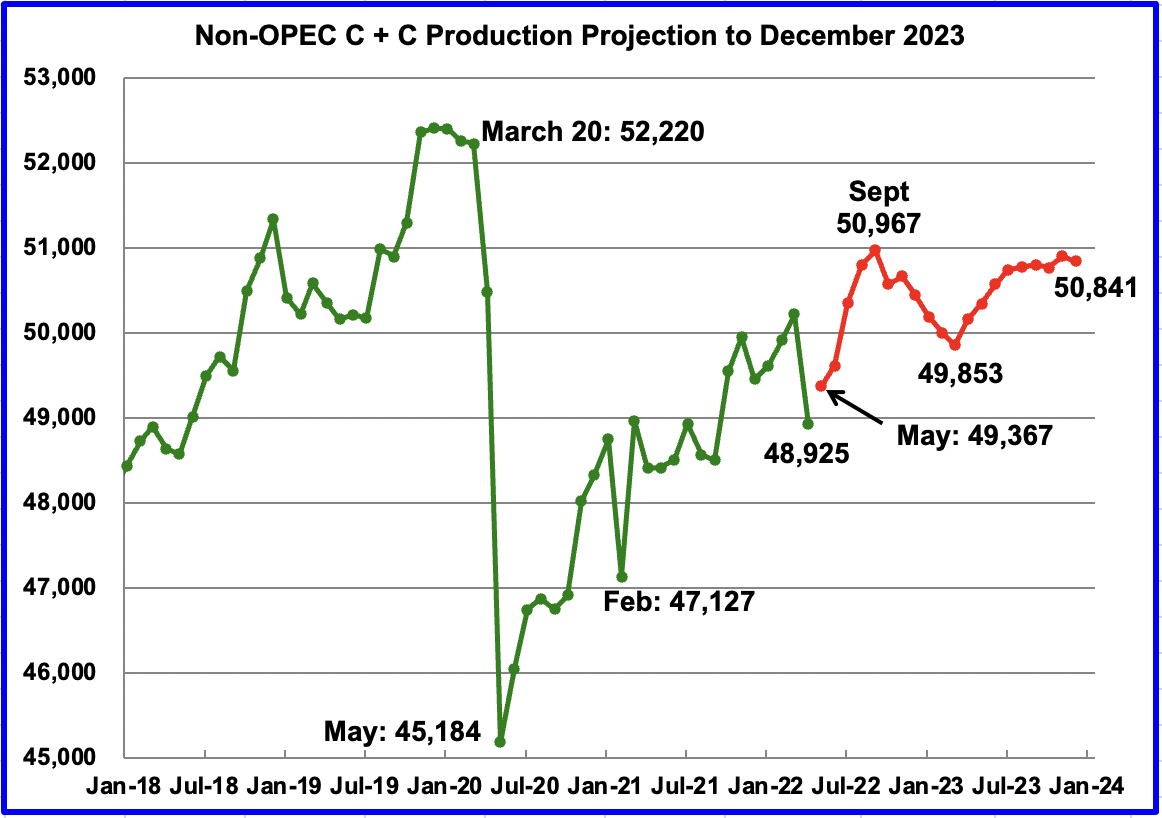
Below are a number of Crude oil plus Condensate (C + C ) production charts for Non-OPEC countries created from data provided by the EIA’s International Energy Statistics and updated to April 2022. This is the latest and most detailed world oil production information available. Information from other sources such as OPEC, the STEO and country specific sites such as Russia, Brazil, Norway and China is used to provide a short term outlook for future output and direction for a few countries and the world.
April Non-OPEC production decreased by 1,294 kb/d to 48,925 kb/d. Of the 1,294 kb/d decrease, the biggest decreases came from Russia, 965 kb/d, Kazakhstan, 175 kb/d, Canada, 95 kb/d and Norway, 78 kb/d. There were no significant offsetting increases. The April 2022 output of 48,925 kb/d is 3,295 kb/d lower than the March pre-covid rate of 52,220 kb/d.
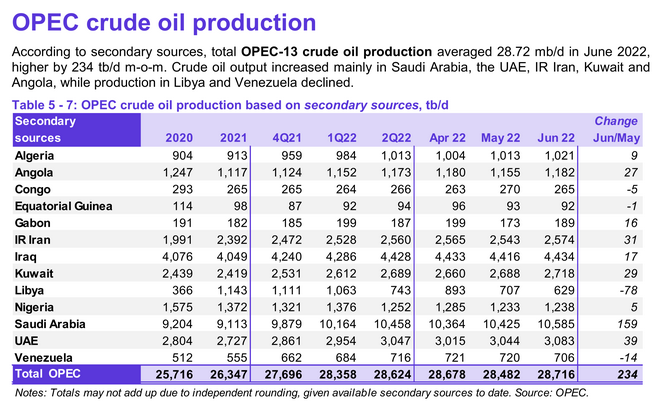
The OPEC Monthly Oil Market Report (MOMR) for July 2022 was published recently. The last month reported in most of the OPEC charts that follow is June 2022 and output reported for OPEC nations is crude oil output in thousands of barrels per day (kb/d). In most of the OPEC charts that follow the blue line is monthly output and the red line is the centered twelve month average (CTMA) output.