A Guest post by Ovi
All of the Crude plus Condensate (C + C) production data for the US state charts comes from the EIAʼs Petroleum Supply monthly PSM.
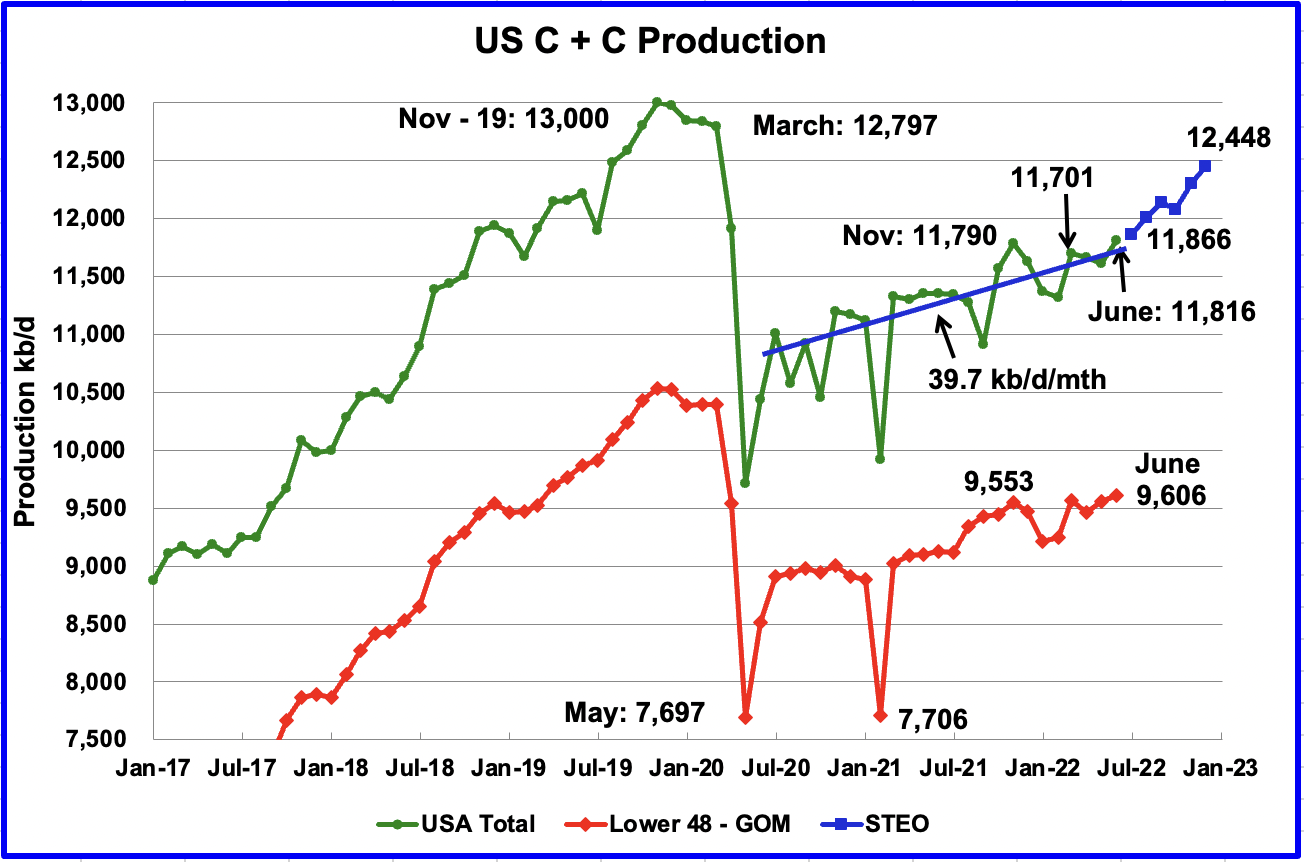
U.S. June production increased by 201 kb/d to 11,816 kb/d. Of the 201 kb/d increase, the largest increase came from the GOM, 183 kb/d. June’s production was a new recent high at 26 kb/d higher than November 2021 which was producing at a rate of 11,790 kb/d.
While overall US production increased, a clearer indication of the health of US onshore oil production can be gleaned by looking more closely at the On-shore L48 states. In the On-shore L48, June production increased by 46 kb/d to 9,606 kb/d.
The blue graph, taken from the September 2022 STEO, is the production forecast for the US from July 2022 to December 2022. Output for December 2022 is expected to be 12,448 kb/d, a decrease of 128 kb/d reported in the previous post.
From July 2022 to December 2022, production is expected to increase by 582 kb/d or at an average rate of 116.4 kb/d/mth. This rate is more than double the rate of the OLS Blue line covering US C + C production from July 2020 to June 2022. The OLS line has a production rate of 39.7 kb/d/mth. The much higher forecast production rate for the last half of 2022 could be related to an upcoming increase in GOM production. See GOM chart below.
Oil Production Ranked by State
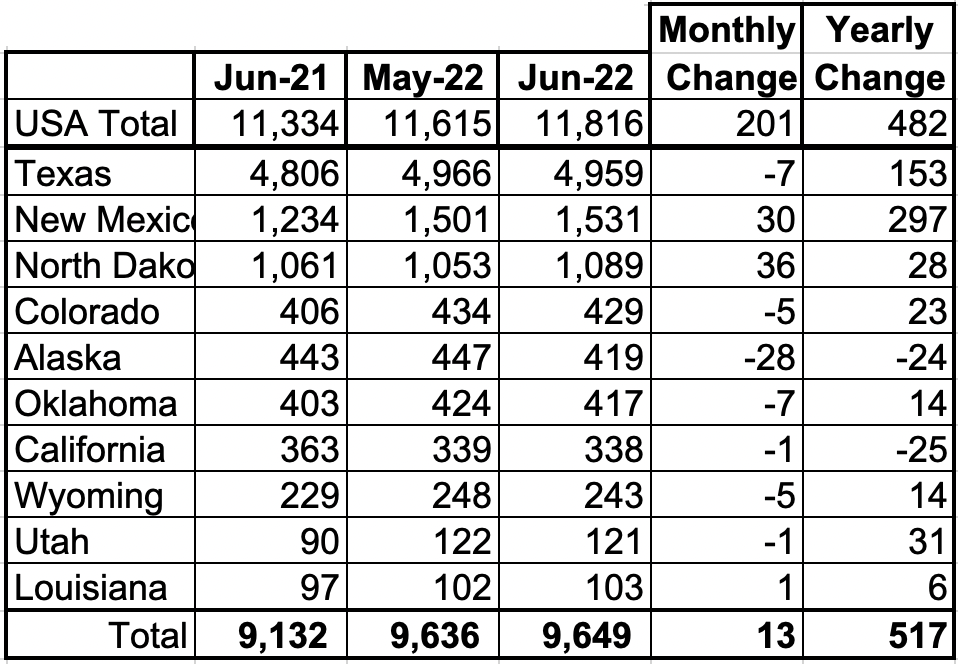
Listed above are the 10 states with the largest US production. These 10 accounted for 81.7% of all U.S. oil production out of a total production of 11,816 kb/d in June 2022.
On a YoY basis, US production increased by 482 kb/d with the majority having come from New Mexico and Texas.
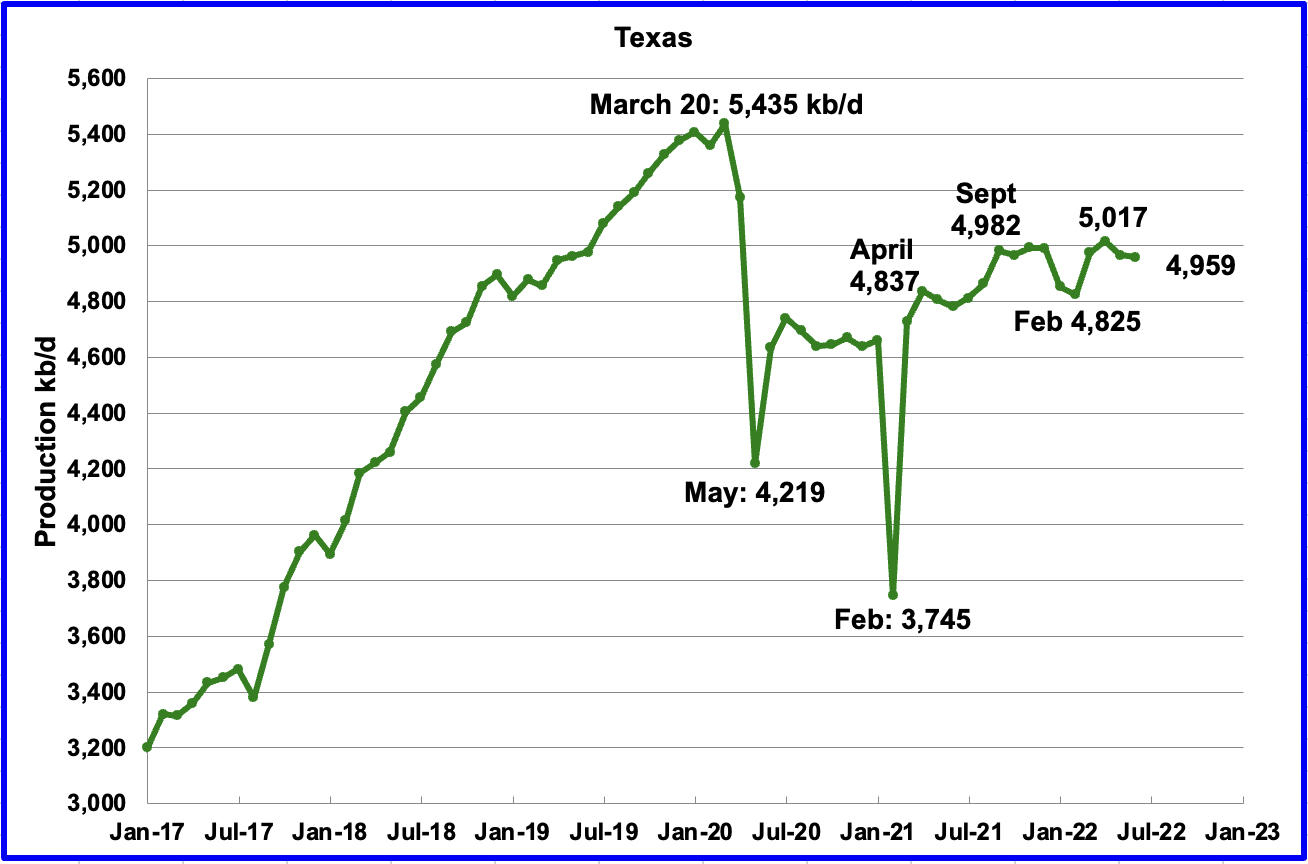
Texas production decreased by 7 kb/d in June to 4,959 kb/d from 4,966 kb/d in May.
In September 2021 there were 205 Hz oil rigs operating in Texas. By the last week of June 2022, 302 Hz oil rigs were operational, an increase of 97 rigs and production decreased from 4,982 kb/d in September 2021 to 4,959 kb/d in June, a drop of 23 kb/d over a period of nine months.
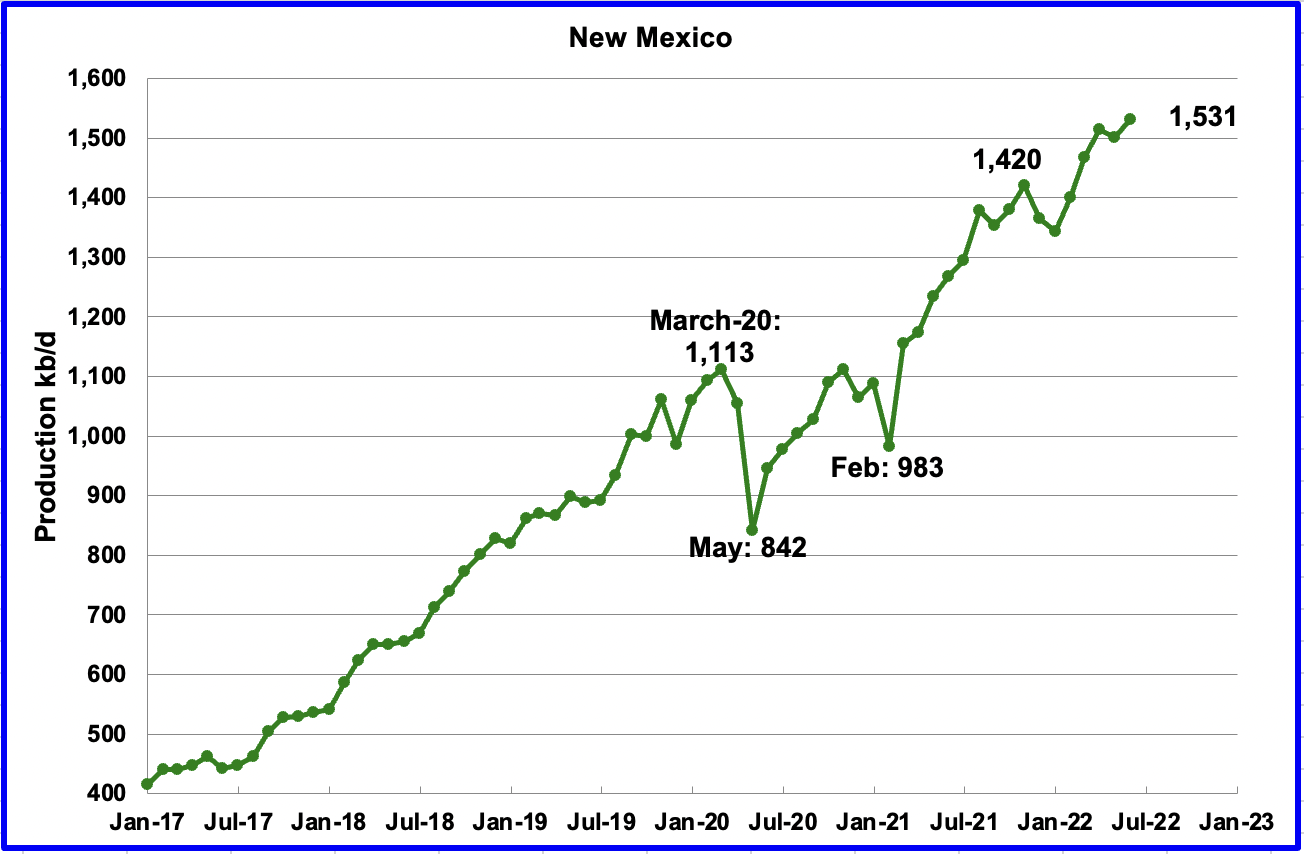
June’s New Mexico production increased by 30 kb/d to 1,531 kb/d to a new record high. From January 2022 to the end of May, close to 92 rigs were in operation in the New Mexico Permian. However in June and July operational rigs peaked at 104 and 105 respectively. The recent production increase is due to more wells being drilled and more wells being completed than drilled.
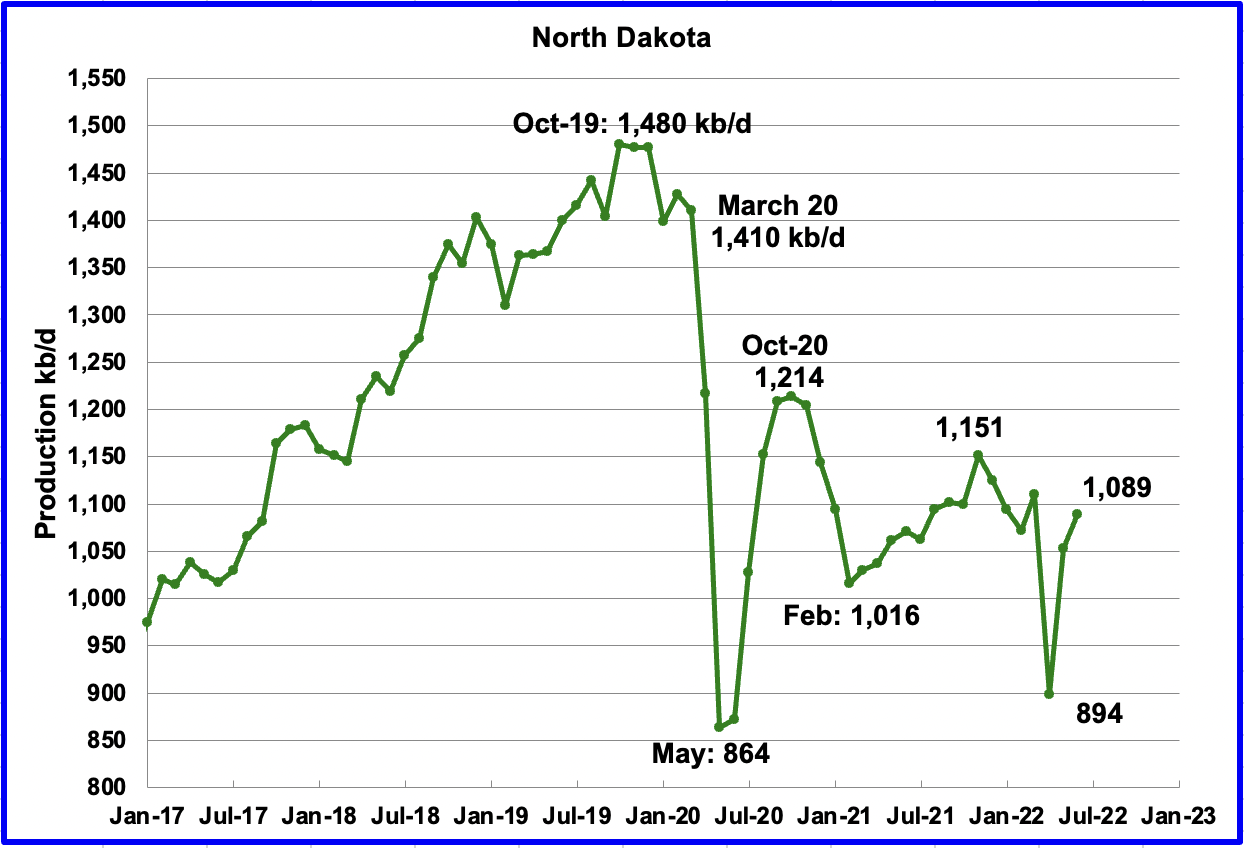
North Dakota’s June output rebounded from the April/May storm to 1,089 kb/d, an increase of 36 kb/d over May.
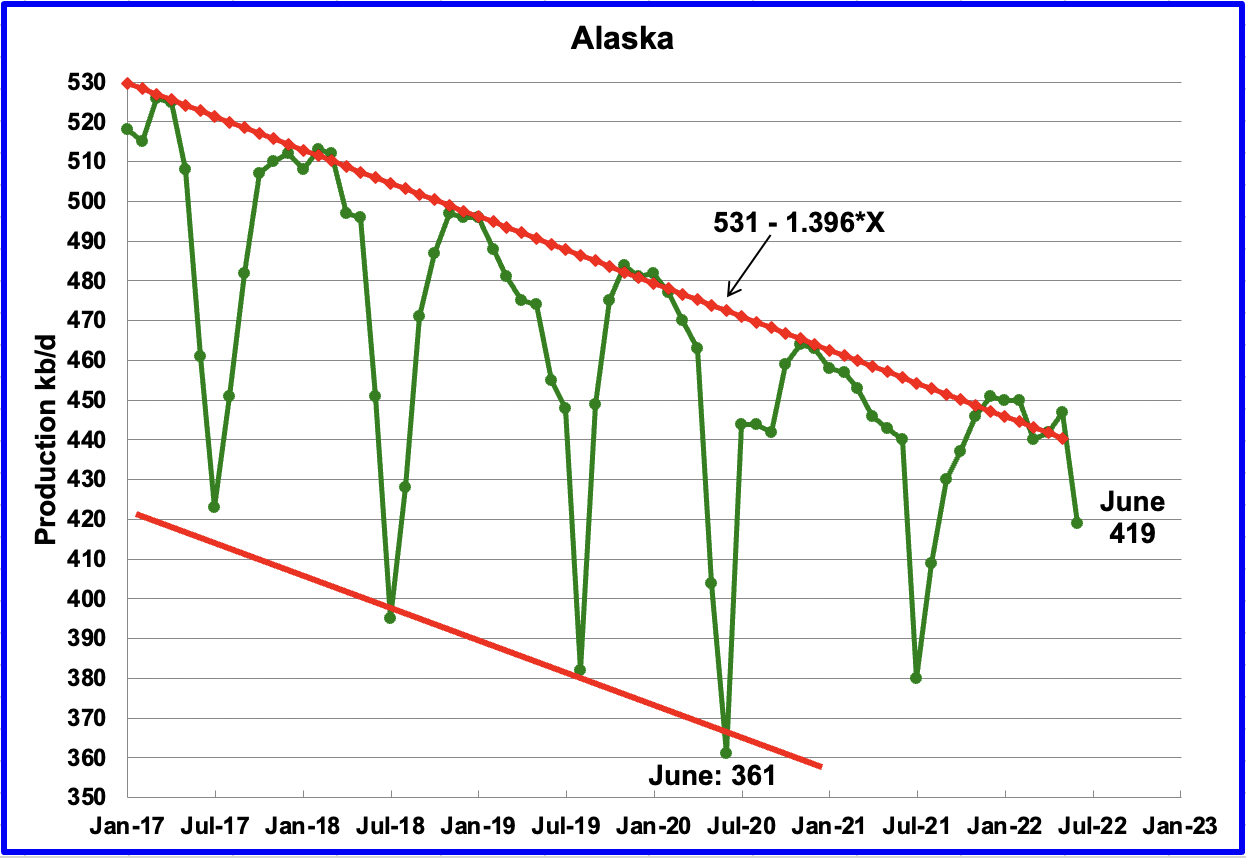
Alaskaʼs June output decreased by 28 kb/d to 419 kb/d. June production typically falls due to summer maintenance.
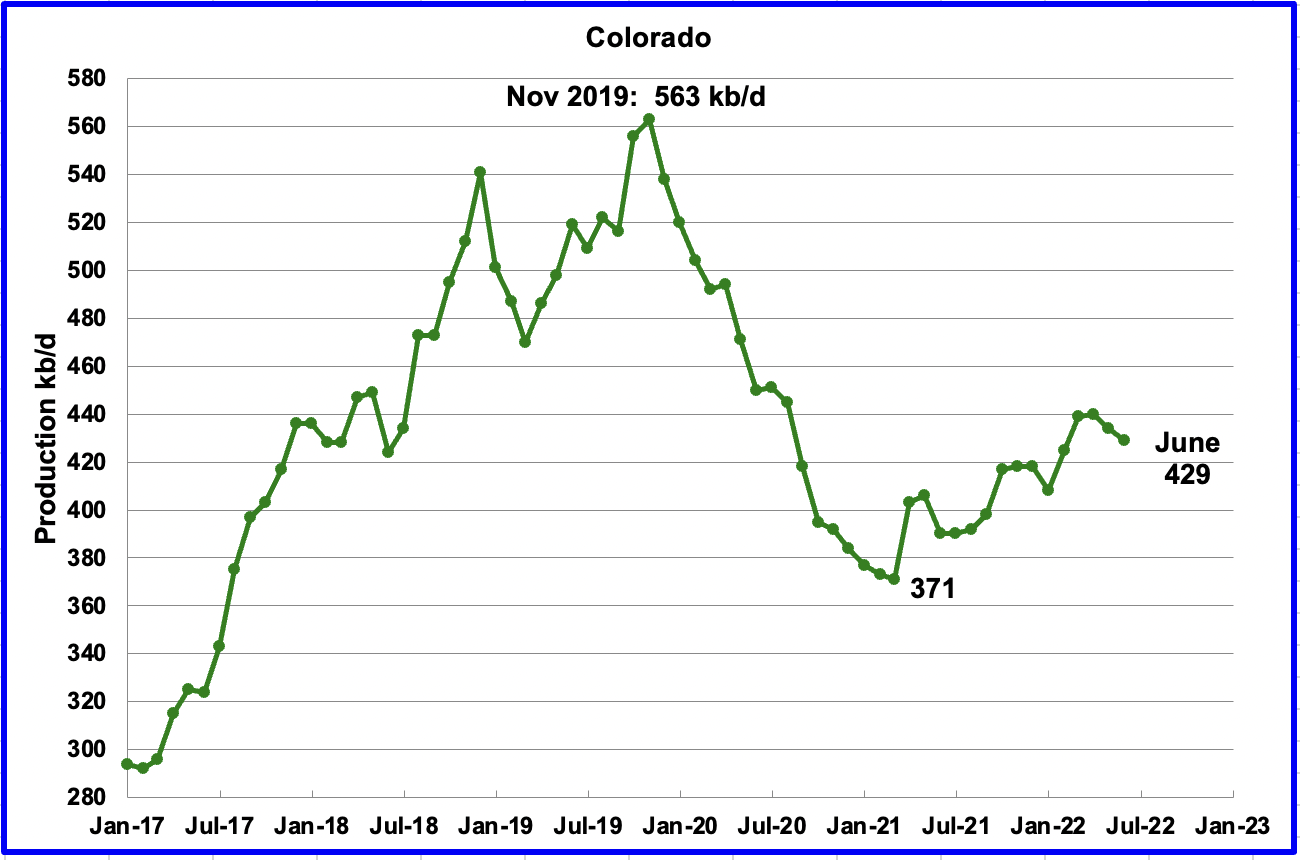
Coloradoʼs June production decreased by 5 kb/d to 429 kb/d. A recent Colorado report forecasts little oil growth is likely in Colorado for 2022.
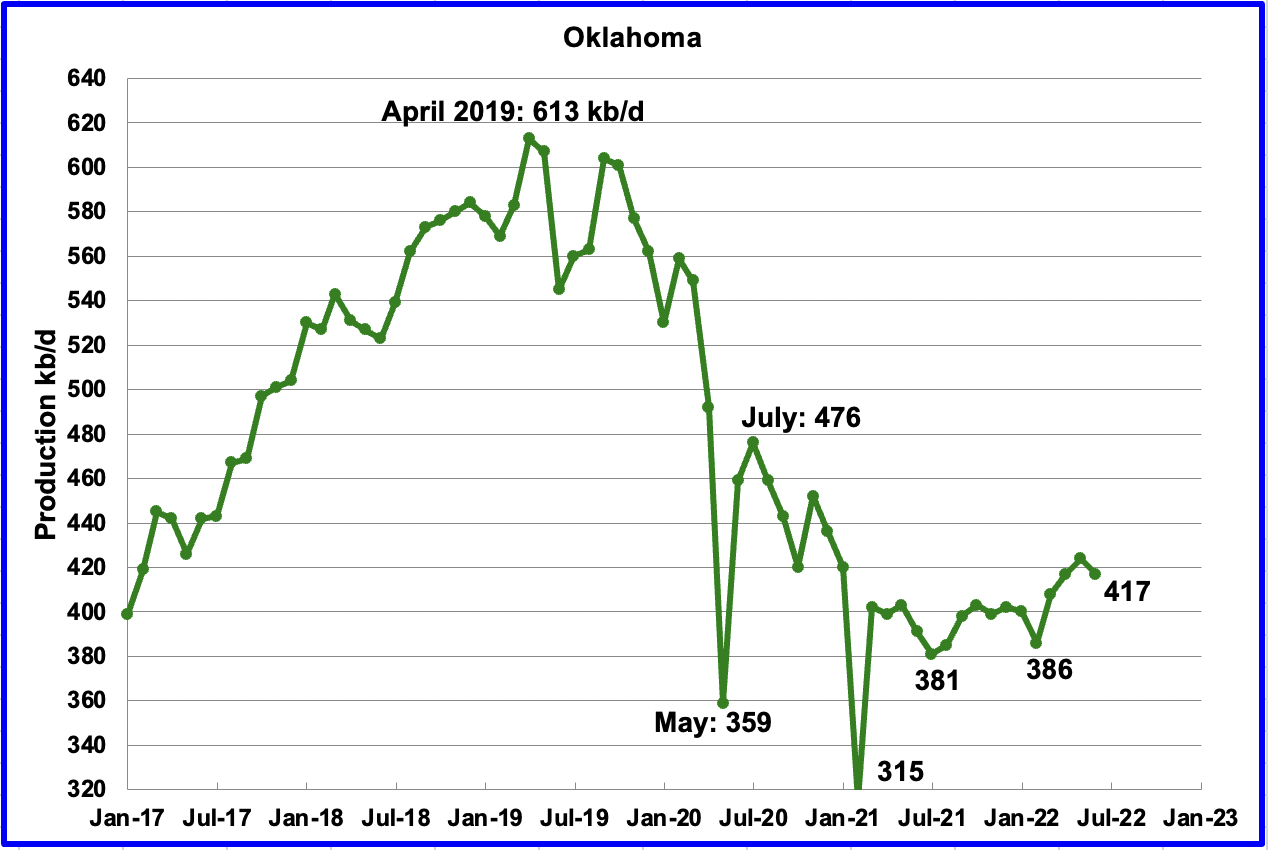
Oklahoma’s output in May decreased by 7 kb/d to 417 kb/d. From January to April, close to fifty rigs were operating in Oklahoma. In June the rig count increased to 56.
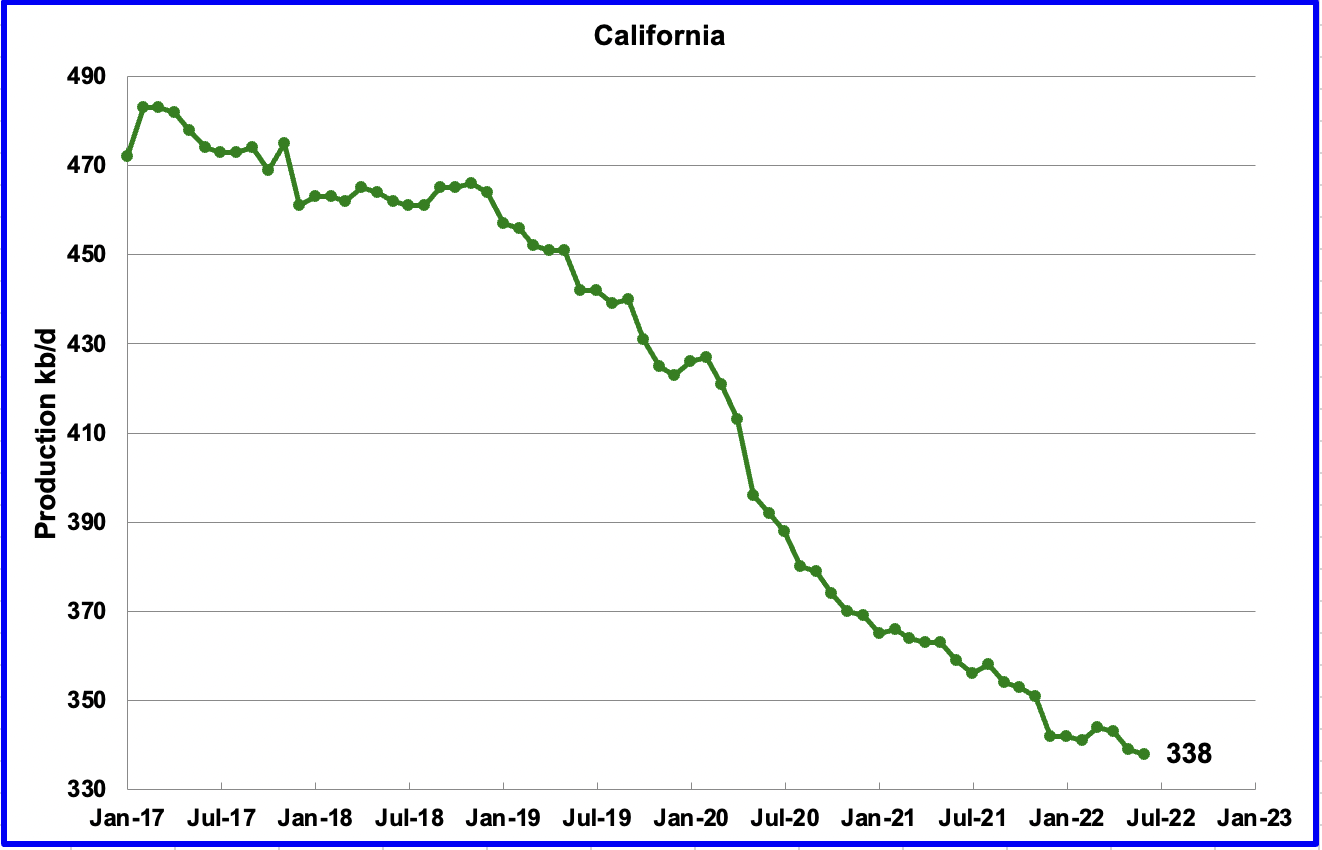
Californiaʼs slow output decline continued in June. Output decreased by 1 kb/d to 338 kb/d.
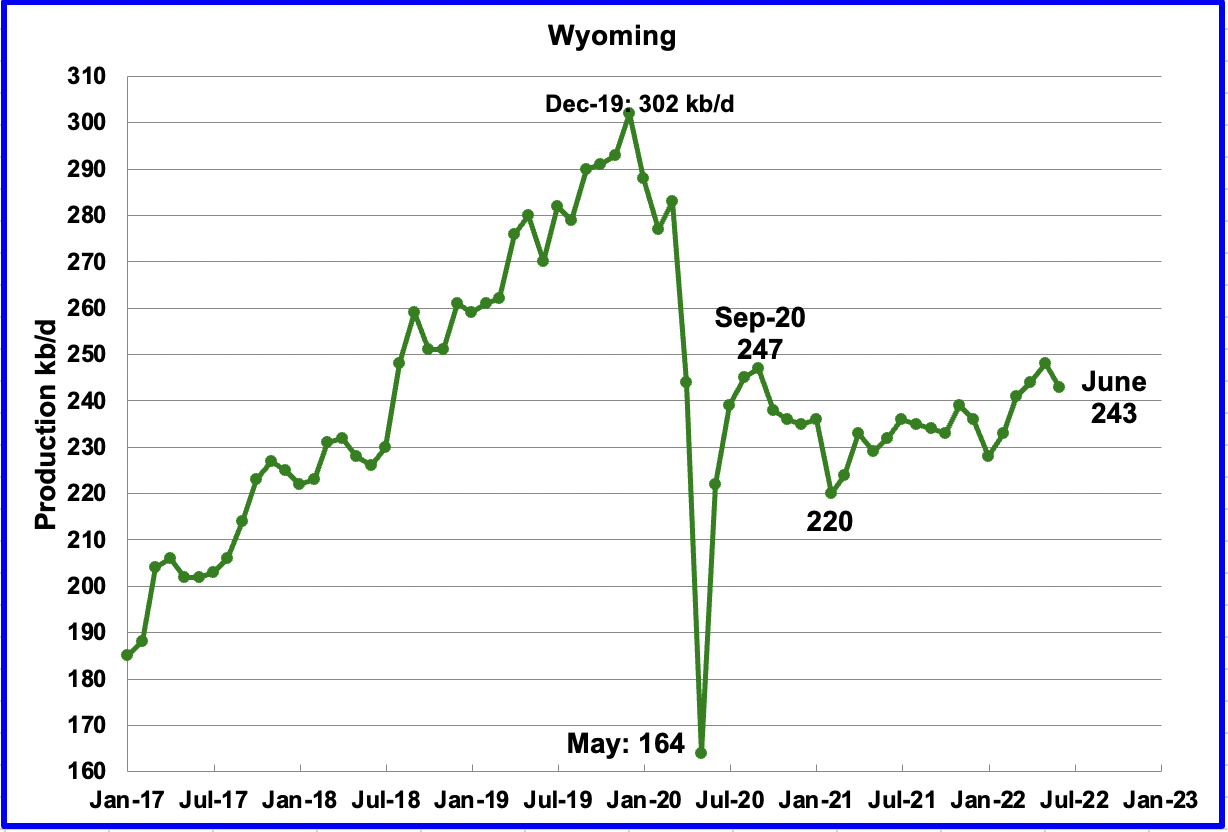
Wyoming’s oil production has been on an uptrend from the low of 220 kb/d in February 2021 due to increased drilling. June’s output decrease of 5 kb/d to 243 kb/d is the first production drop in 5 months.
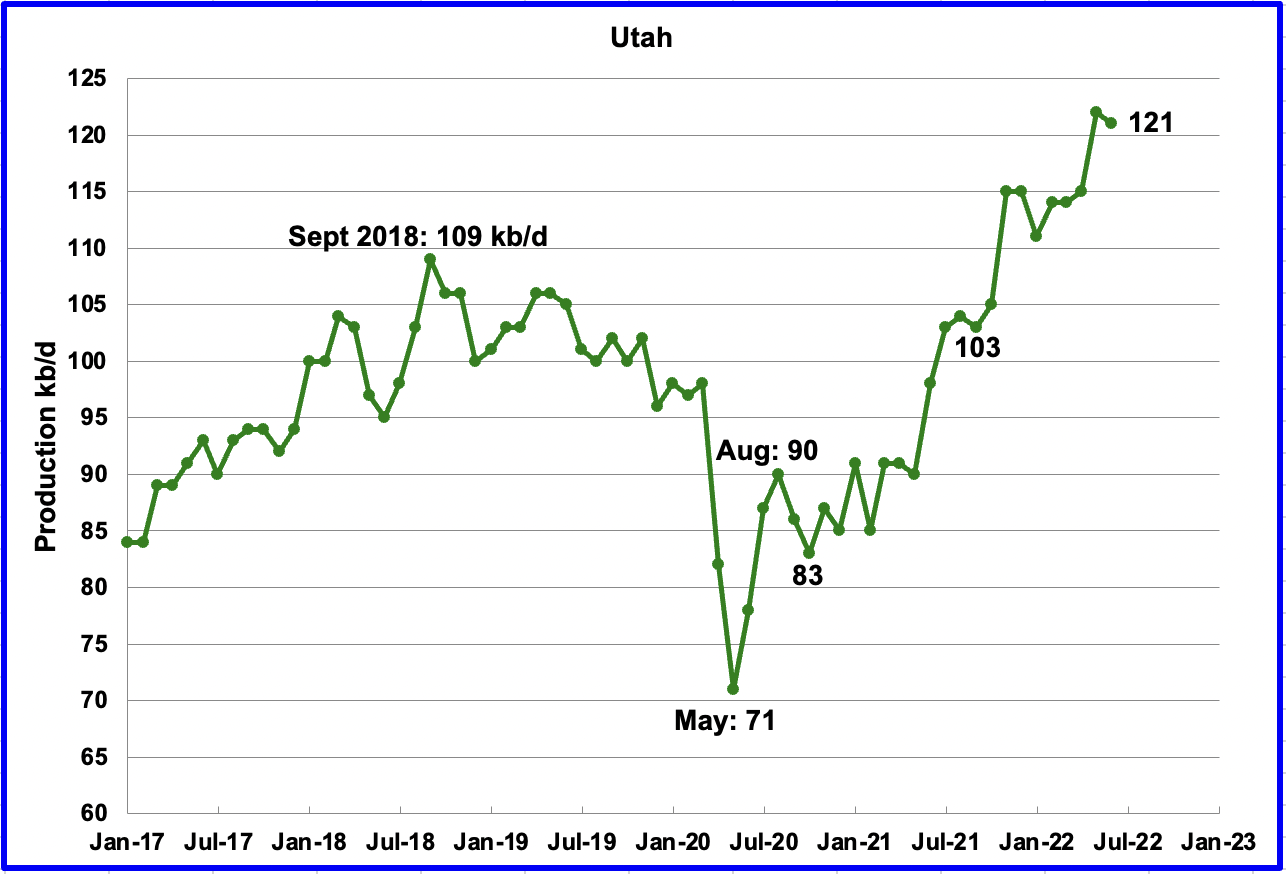
Utah’s production hit a new high in May but dropped in June. June’s production decreased by 1 kb/d to 121 kb/d. Utah had 10 rigs operating in June, an increase of 5 over January.
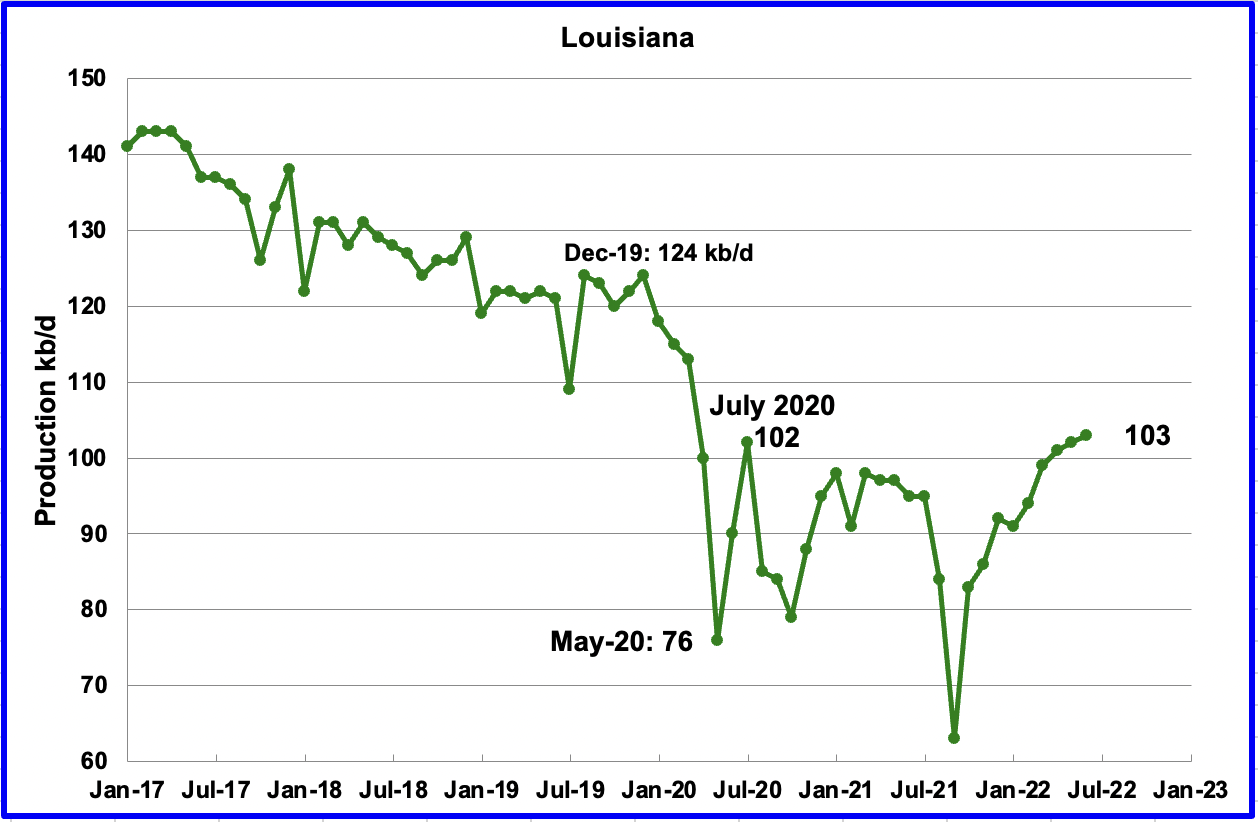
Louisiana’s output increased by 1 kb/d in June to 103 kb/d and exceeded its previous high of 102 kb/d in July 2020.
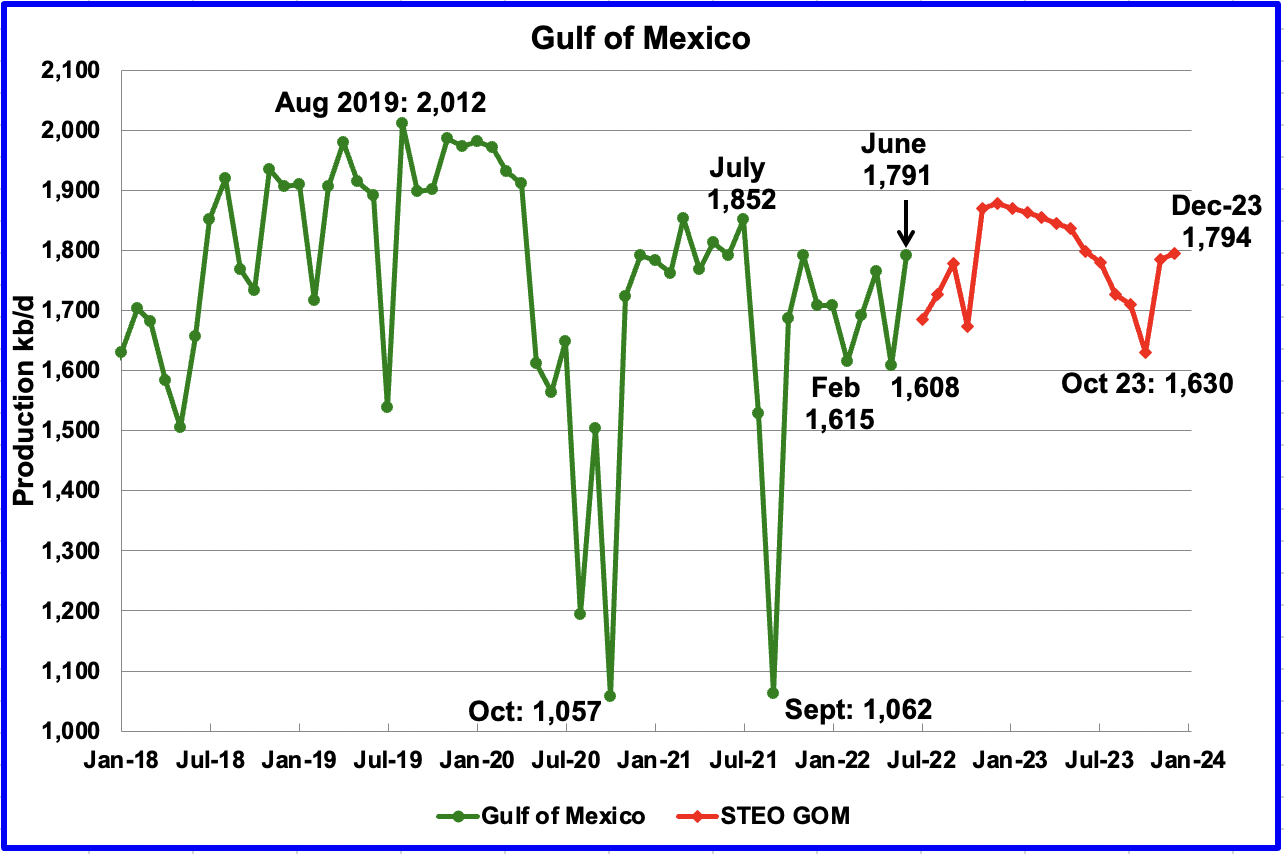
The GOM production is at highest level since July 2021. GOM production rebounded by 183 kb/d to 1,791 kb/d in June after restoring shut in production caused by bad weather. If the GOM was a state, its production would normally rank second behind Texas.
According to one of our contributors, Bob Meltz, the impact of King’s Quay first oil and Thunderhorse South may be responsible for the rebound. August will be somewhat lower because of pipeline issues with Shell’s Mars-Ursa fields. GOM still has Mad Dog 2 and Vito to come online over the next 6 months or so.
The August 2022 STEO projection for the GOM output has been added to this chart and projects output will be 1,794 kb/d in December 2023. For July 2022, the STEO is projecting a drop of 107 kb/d to 1,684 kb/d.
A Different Perspective on US Oil Production
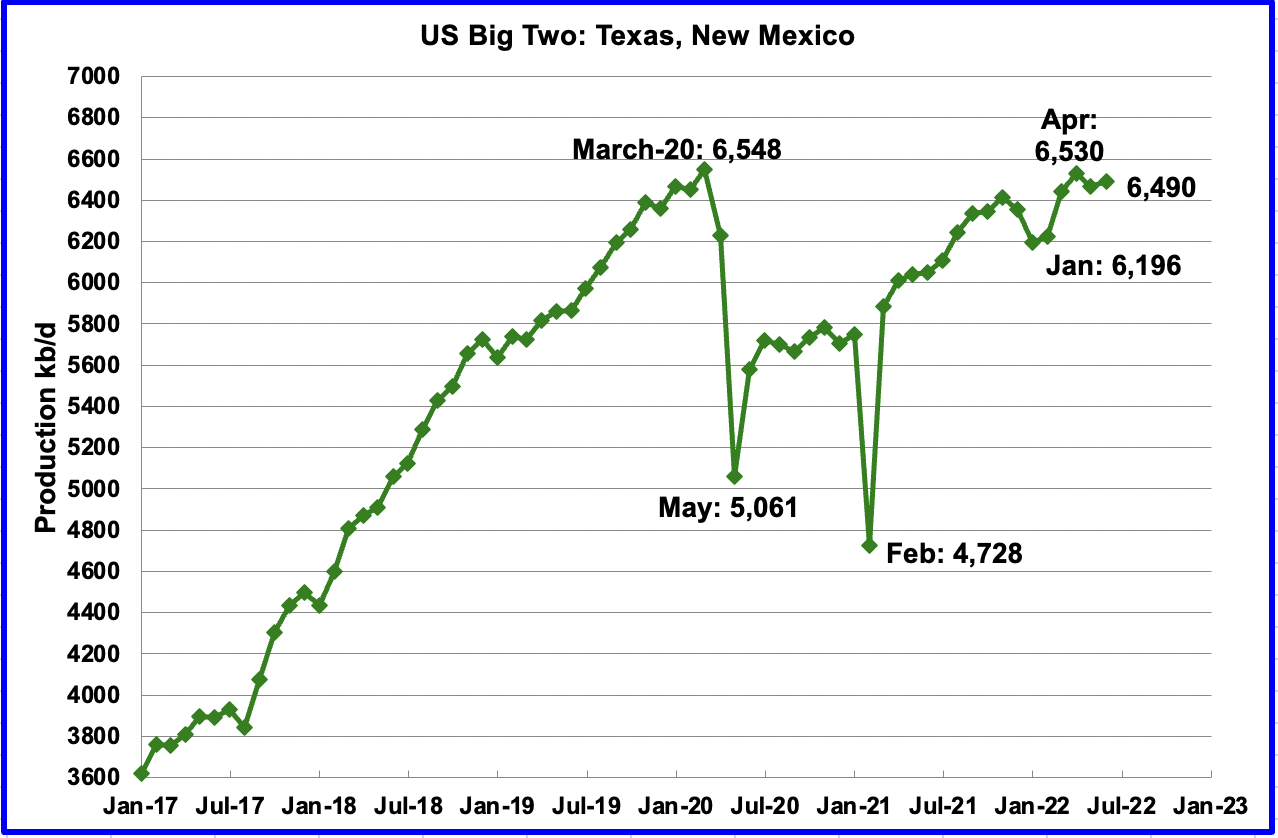
The Big Two states, combined oil output for Texas and New Mexico.
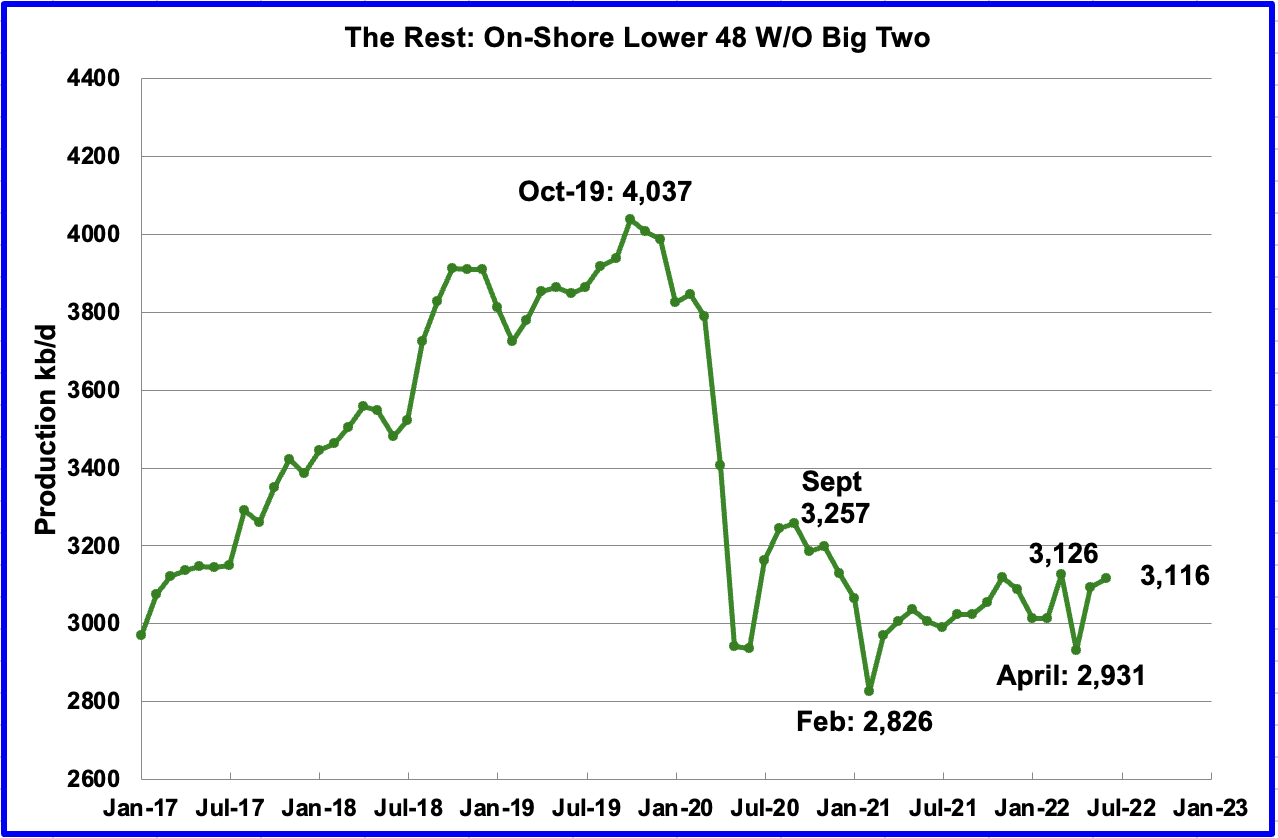
Oil production for The Rest
To get a different perspective on US oil production, the above two charts have segregated US state production into two groups, “The Big Two” and the “On-Shore L48 W/O Big Two” or The Rest.
June’s production increased in the Big Two states by a combined 23 kb/d, with Texas dropping 7 kb/d and New Mexico adding 30 kb/d.
Over the past year, production in The Rest appears to be holding steady at close to 3,100 kb/d. In June The Rest added 23 kb/d.
Rigs and Fracs
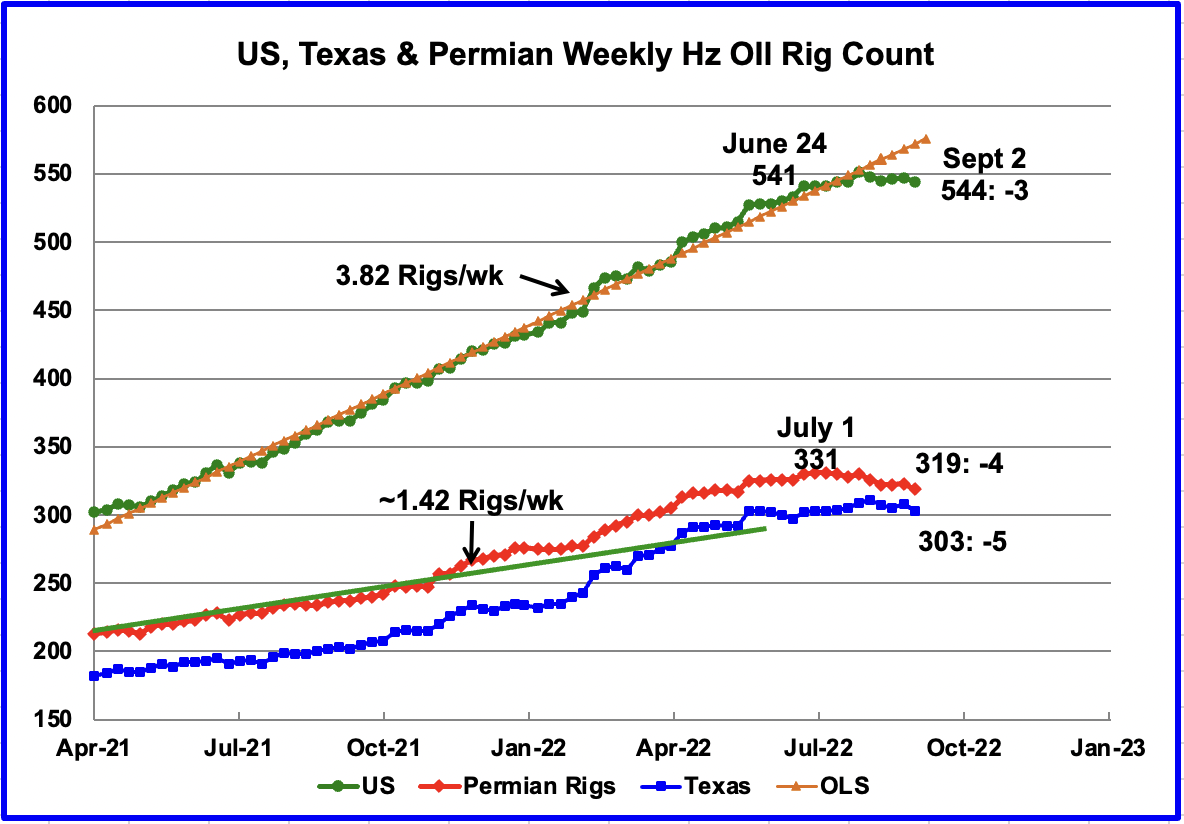
Since the beginning of April 2021 through to the week ending July 29, 2022, the US has been adding horizontal oil rigs at a rate of close to 3.82 rigs/wk, orange OLS line, and peaked at 551 rigs in the week ending July 29. However since then, the number of operational rigs has declined by 7 to 544 in the week ending September 2.
In the Permian, the rig count peaked at 331 in the week ending July 1 and has dropped by 12 to 319 in the week ending September 2. Can the drop of 12 Rigs over the last two months in the Permian be related to the recent price drop in WTI, equipment shortage or fewer/declining Tier 1 drilling spots or all of the above?
In Texas 303 rigs were operational, a decrease of 5 over the previous week and down 8 from the peak of 311 in Early August.
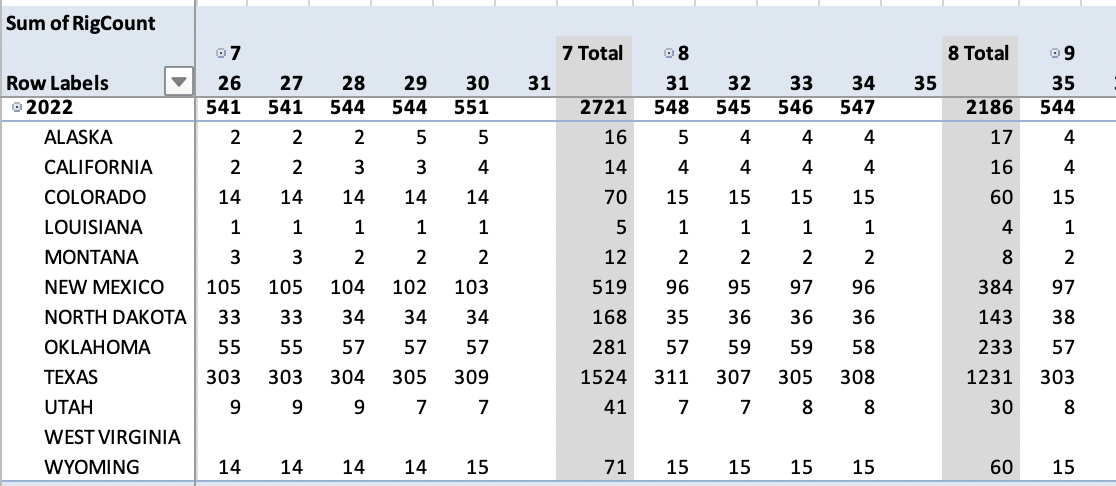
This table shows the trend in rig growth starting in the first week of July and ending in the first week of September. Comparing the first and last columns, the largest changes have occurred in New Mexico and North Dakota. New Mexico is down 8 while North Dakota is up 5.
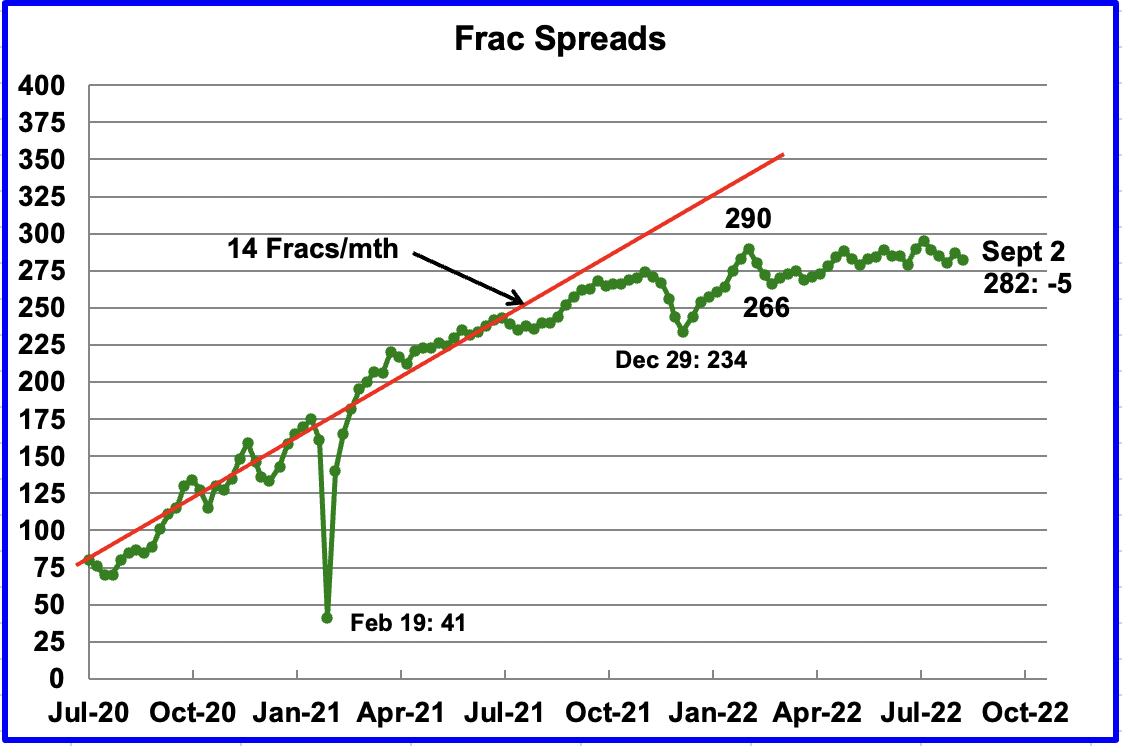
Over the last 5 weeks ending September 2, the frac spread count and the US rig count have both declined. Frac spreads have dropped from 295 in the week of July 29 to 282 in the first week of September. Over the same period, the US Hz rig count dropped from 551 to 544.
Since early February, the growth in frac spreads has not been keeping pace with the growth in rigs. In the week ending September 2, 282 frac spreads were operating, 8 fewer than the 290 operating in the week ending February 25. From February to late July, the rig count increased from 475 to 545, after which both started to decline.
What is causing the the frac spread count to drop?
Note that these 282 frac spreads include both gas and oil spreads.
115 responses to “GOM Oil Production fuels US June Increase”
Thanks Ovi, fantastic work as always.
Thanks Schinzy
Much appreciated.
“ What is causing the the frac spread count to drop?”
The price of tubing metall, required for completing the wells, has 4-folded…
Michael,
From 2018 level price has roughly doubled, using the low point in 2020 when demand was very low is not a good way to assess.
Dennis.
I suspect being able to actually buy the pipe could be an issue.
There have been times when the supply yard here was out of either 2 3/8” or 2 7/8” tubing for a short period of time.
But it’s not just the steel. We need to do some electrical repairs to one of our leases. Some of the parts the electrician needs won’t be in till November or December, per him.
We have waited up to a month for electric motors.
We waited almost 2 months for four 25 pumping units. Trucking from TX was the issue there.
We have a 6 1/4” packer stuck in an injection well. We are waiting on a tool. The injection well is the only one on the lease. So the two producers are shut in, and have been since July 4. Hopefully it will be here soon and the rig crew can get free and get it out.
I’ve posted stuff like this many times, so hope I’m not beating a dead horse. But there still are not even ten work over rigs running in our field of over 2,500 production wells.
Our field did add one, there are two pumpers who bought a single drum and pull wells after work. Takes them 3-4 day to do a tubing job on a 1,000’ well. They know what they are doing and we are sure glad they are willing to do the work. They are some of the only “young” guys (under 50) around here.
I see that Oklahoma unemployment this year is around 3% and hasn’t been lower in the past 20 years, and USA is at 3.6%- also lowest in 20 years.
How does Oklahoma and the country get more workers (meaning people willing to work).
In my field there is a bigger shortage than in the past 50 years, despite vast gains in average productivity.
It isn’t going to come via more reproduction (with 20 year time lag), since the fertility rate of the country is the lowest since records in 1800.
This country will need lots and lots of new people from other countries to keep the economy moving along, just like we always have.
Hispanic people are already the backbone of the US oil industry in many parts of the lower 48.
That hasn’t happened yet in our field, but probably needs to.
Shallow sand,
Thanks for the information. I understand based on your comments that there are many supply issues in the oil field. Have things been getting worse or better since 2020 ? I assume eventually these issues will be worked out, perhaps not.
Dennis.
I think this year has been the worst regarding supply chain issues. There is more demand as oil prices have risen, but supply hasn’t followed regarding many types of equipment and supplies.
Same with labor. There is more demand for rigs, but not more in the field because of lack of labor. There are a lot of workover rigs here still stacked in yards.
Same for many other services.
Shallow sand,
Thanks. I hope things improve.
Meanwhile the seamless tubing factory at my doorstep just closed down, basically due to management incompetence, according to the guy across the street, who has worked there for decades.
It gives you a sort of sic transit gloria mundi vibe, because seamless steel tubing was invented right here.
But they built a factory for the frackers in Youngstown a few years ago, so that may still be around.
Michael
Thanks. Does this mean that the current price of WTI, $87/b, does not offer sufficient profit/return to drill and complete more wells?
Thanks Ovi
Screen shot from twitter these guys are usually reliable so keep an eye out for the data.
I don’t understand this. We have the Russian data, or their reported data, through July. Was that data not accurate? Was Russia feeding us bad data? What is going on here?
Ron. I assume they are referring to the bottom line.
There it is.
The EIA’s International Petroleum Data is out.
World C+C production was down 607,000 bp/d in May despite Russia being up 145,000 bp/d.
The EIA has apparently stopped collecting and reporting data from many very small producers. Total production for all those small countries in April was 684,000 bp/d. In January 2013, their total production was 1,786,000 bp/d. So, the production from these small producers has been declining rather steadily. Apparently, the EIA was having trouble getting data from these countries so they must have just decided to discontinue them.
Below is the world data with and without those small countries. The data without them is through May, with them, through Apri.
Ron,
Interesting find. I think te EIA is still having problems recovering from the data server crash this past summer. I imagine this data will be revised in the future.
No, I don’t think this has anything to do with their computer. The point of this chart was to show that the historical data has been revised. I believe this is a permanent change because they were having so much trouble getting accurate data from those very small producers.
It makes little difference. Everything is the same except the data we get will not include a few small producers whose combined production is just a little over half a million barrels per day, and declining.
Anyway, we will know next month.
Ron,
The EIA found that there was a problem and has updated international data, chart below shows difference between Current data (Sept 2022) and data from last month (Aug 2022) for EIA International data for World C plus C in kilobarrels per day. Data is the same prior to January 2008 (difference is zero).
Ovi,
Many reasons for changes in frac spreads and horizontal rigs. One important one is that oil companies might be satisfied with current levels so the rate of change is small. Much of this is publicly traded companies returning profits to shareholders with increased dividends, share buy backs and also paying down some debt (more of the former).
Chart below uses completion rate from Drilling Productivity Report(DPR) for tight oil basins (excludes Appalachia and Haynesville) to calculate the centered 12 month average for completion rate in the 5 tight oil basins (Permian, Bakken, Eagle Ford, Niobrara, and Anadarko) from July 2014 to Jan 2022.
Data from
https://www.eia.gov/petroleum/drilling/
click on DUC Data spreadsheet link at right side of page
Any reason you don’t just skip the DPR “analysis” and go right to the data they use, publically available FracFocus? It is downloadable to anyone who wants it.
Do you have a link?
Is the data different?
I am simply using competion data provided by the EIA.
Reservegrowthrulz,
It is a big file about 337 Mb, not nearly as convenient as using EIA data. Not at all straightfoward to extract the data from that set of files.
Dennis
Could you post the link?
Ovi,
https://www.fracfocus.org/index.php?p=data-download
I assume you mean the link to the frac focus data download, that is what I linked above.
RESERVEGROWTHRULZ
Since you made us aware of this data I decided to take a preliminary exploratory look and having done that I am looking for some help.
Folder FracFocusRegistry_23 contains the Frac data for 2022 up to mid August. I have looked at the info and analysed it and I don’t believe it. Maybe I am making mistake.
In the preliminary review, I looked at one week July 10 to July 16. I was able to analyze it using a pivot table. However my big issue is why are there 10 to 20 lines for each frac. Most rows are the same except for some chemical data. So for the well shown below there are 23 lines. See attached picture.
I just count one line of the 23 for that Frac
Attached is the Pivot table for the Fracs done in the week of July 10 to July 16. These are the big drilling states for oil, Louisiana, NM, ND, Oklahoma and Texas. I only count 1 row for a well. I have counted a couple of days by hand to make sure the count is correct. I find the numbers to be too low.
For instance for the week ending July 15, there were 279 fracs started according to Frac count. The pivot table numbers appear low to me for these big states.
Any help would be appreciated.
Did a different analysis for Texas and came up with more realistic Frac spread number.
Week ending July 15: 152 Fracs
For instance for the week ending July 15, there were 279 fracs started according to Frac count. Having 152 in Texas makes more since since I have read that close to half of the Frac spreads are in Texas/Permian, Not sure which one.
Dennis that is a good observation and part of the issue. Most companies are trying to stay within 1.5 times EBITDA , there is a shortage of skilled labor, steel, parts etc…. Plus I believe with companies are focused on paying down debt as well as making distributions. I also believe the model has changed a bit. My company is buying a large asset in Texas and we have modeled recompletions, workovers, with an equity raise. We plan on distributing cash flow created a 20% IRR day one and never having more than 1x EBITDA leverage. We have also bought outs for 24 months.
Most producers who are left are very cautious and trying to be conservative so as not to be bludgeoned by ESG , Green Energy, potential windfall profits taxes etc… For the first time in a long time oil & gas producers are showing restraint.
LTO Survivor
Are recompletions less expensive than the original ones. Also how much better is today’s technology than the original frac?
Are the decline rates of refracted wells much different than the original ones?
Yes much less expensive. Todays technology has not really improved as much on the frac side vs the drilling side in my opinion. We are getting better at drilling horizontally with new casing designs, new bits, etc.. and drilling faster. Unfortunately with tubulars being so expensive and hard to find plus the fracking is costing more, recompletions are much more cost efficient.
Thanks LTO survivor,
Great insight as always.
A year or 2 ago I think yoi suggested perhaps 5% output growth for tight oil.
Does that still seem about right on average for US tight oil?
Dennis,
I would be thrilled to see a 5% output increase. For most of my career most of the smaller public E&P companies traded at 10-12 time EBITDA and were never required to make distributions etc……. their value being derived and measure by reserve growth which didn’t allow these companies to distribute dividends as opposed reinvestment of 100% of their free cash flow utilized solely for the purpose of reserve growth.
Now with Commercial banks not lending more than 1.5 -2.0 times EBITDA which for most of my career was 4 times EBITDA and Private Equity reeling from being poor short term investors, most E&P companies cannot raise production more than 5% without two very important inputs 1. Human Capital in the form of skilled labor and equipment and 2. Financial capital which is the life blood of and industry that needs large analysts of capital to replace reserves due to the depletion of a finite commodity.
The easy oil has been found and now the new marginal barrel that comes online will be significantly more expensive and costly to find and produce.
One final thought or question, I don’t know how Russia will maintain its current rate of production without the technology from western firms like schlumberger and Halliburton as well as production equipment and technology manufactured and provided by the West. It is my supposition (which may be wrong) that Russia will struggle and face steady declines without Western technology and equipment.
With the current Rig Count and Frac Spread, I anticipate modest growth and with tier 1 and 2 acreage being mostly drilled up, production declines in the shale are just a few short years away.
The world has become addicted to and critically dependent on abundant and cheap energy. In my opinion, this era has come to an end and governments and countries who understand that this is a survival fight over scarce natural resources will be the survivors of peak oil. I would bet our current Secretary of Energy in the United States has no earthly understanding of what Peak oil is or what is means for the security of our country and it’s impact on our current way of life.
“…governments and countries who understand that this is a survival fight over scarce natural resources will be the survivors of peak oil.”
Agreed, 100%. Yet by the end of 2022-2H2023 the EIA expects half of US tight oil production and one third of US natural gas production to be exported to foreign countries.
With regard to tight oil, the US allows exports ONLY because our country’s refinery’s can’t absorb more than 4.8-5.0 MM BOPD.
But we don’t HAVE to export ANOTHER 4.8-5.0 MM BOPD because there is nothing else to do with it…regulators can increase spacing between wells and well densities per acre of land so that US tight oil production equals US use. We can keep it in the ground until we CAN use it. As in conservation. GASP!! It’s not going anywhere and the idea that it will be “stranded” because of renewables and falling oil demand is ludicrous.
So, pay a little more now, learn to do with less, or have NONE later and learn which end of a horse to walk to. Warning: they don’t eat electricity.
By the way, to facilitate current oil export levels of 3.8MM BOPD, 75%-80% of which comes from the Permian Basin, flaring, the unadulterated waste of natural gas, in going up again, not down.
It’s not a sprint to see how fast we can drain the Wolfcamp in the Permian Basin, it’s a marathon to make sure OUR county, our LONG TERM energy security, and our CHILDREN…win.
Vote accordingly.
LTO Survivor wrote: I don’t know how Russia will maintain its current rate of production without the technology from western firms like schlumberger and Halliburton as well as production equipment and technology manufactured and provided by the West. It is my supposition (which may be wrong) that Russia will struggle and face steady declines without Western technology and equipment.
Obviously, they will not maintain current production. They have admitted it in this Tass article:
Russia’s oil production will decline by 2% in 2022, refining by 8% — Energy Minister
“There is an increase in oil [production] now, but at the end of the year, production is likely to be slightly lower than last year – by about 2%
Their average for 2021 was 10,514 K bp/d. A 2% decline would have them averaging 10,303 for the entire year of 2022. However, for the first eight months, their average was 10,626 K bp/d. To pull their average for 2022 down to 10,303 K bp/d their average for the last four months would have to be around 9,750 K bp/d. That is over 1.5 million barrels per day below their pre-covid average. And of course, their 2023 production average would drop from that level.
“There is an increase in oil [production] now, but at the end of the year, production is likely to be slightly lower than last year – by about 2%.
LTO Survivor,
I doubt oil prices will remain below $100/bo for long. It seems you think 5% growth is too high. Maybe 3%? Do you have a guess? What do you think about the suggestion that tight oil output should be restricted by the government or that US crude exports shous no longer be allowed? These seem like bad ideas to me, but some do not agree.
And if you are a government agency with jurisdiction over Permian production and exportation (I don’t know who that would be),
try not to consider that
“Energy bills for European households will surge by 2 trillion euros ($2 trillion) at their peak early next year”
and all the implications of that.
And-
“Russia will not resume gas supplies to Europe until sanctions lifted, says Moscow…”
Hickory,
Federal government can stop crude oil exports as they did from 1975 to 2015. The Texas Railroad Commission regulates oil production in Texas, they have the authority to set well spacing rules and set all kinds of regulations on the oil industry (such as the amount of natural gas flaring allowed). Those rules could be set in such a way that tight oil exports are minimized. Many in the oil industry are not in favor of such a policy and in the short term we would likely see liquid fuel prices (gasoline, diesel, and jet fuel) rise if such a policy option was chosen. It is not clear many politicians would choose such a policy as they might not be re-elected if this was their position.
“Try to consider,” if you can, what YOUR country will look like in less than decade because most of its affordable hydrocarbon resources were exported to foreign countries and the lofty, unrealistic renewable transition didn’t occur quite like you wanted it to. “Consider” that 90% of the American population can’t make ends meet now and won’t be able to afford an EV, that hydrocarbons in America provide food for Americans and that US oil reserves ensure energy security. Consider that grandma in Cleveland THIS winter is set to pay 5 times what she did a year ago to keep her home warm, because of LNG exports. I assume you have a savings account for your future; why not your own country? Oil inventories are at an 18 year low in the US and the SPR is being sucked dry like Biden pulled the plug on a bathtub. You good with draining America dry, first, in the name of globalization? I’m not.
That America thinks it can “save the rest of the world” with costly, marginally profitable resources that decline 85% the first 32 months of production life, while 1.5 BCF of gas gets burned up a flare stack, is really short sighted shit.
Consider reading LTO’s opening sentence one more time. It’s true. Forget that I am conservative, as hard as that might be for you, and think about OUR nation’s future, yours AND mine.
And finally consider this: that no dumb-ass politician, either flavor, will dare do the right thing for our nation’s long term energy future because it won’t be popular in the Permian Basin and won’t get them re-elected is pretty fatalistic, isn’t it? Sadly true but pathetic, nevertheless. That’s the big trouble in America; no leadership. Nobody has the nuts to lead.
Dennis wrote: Federal government can stop crude oil exports as they did from 1975 to 2015.
I did not know that. Where did you get that information? This site has a different story. Monthly Energy Review
Click on graph to enlarge.
Mike- you made my point well.
Politically, it will be unlikely to be a successful path to ban exports.
I doubt the Texas Railroad commission members are ready to put big restrictions on the oil and gas industry.
They’d get shown the door.
The US has benefited tremendously from globalization, and being the reserve currency, since the end of WWII. The role back in globalization, with growing economic isolationism and nationalism will hurt the US in a big way- whether it originates with us or with others.
We have grown use to the huge advantages, as if it was normal conditions. Inflation like we have never seen, and supply shortages of critical industrial and manufactured materials are at big risk of becoming the long trend. Free trade is a two way street, or it is an abandoned alley.
side note- if it had been up to people who think as I do, we would have developed all resources much more slowly, as if the future mattered.
Anyone care to guess what the LTO breakeven price is per barrel? My understanding is that maybe ~5 years ago it was close to $100…I would imagine it’s now closer to $110/$120? It does seem like it’s less sensitive to price than some other producing countries for some reason…
Using a 2014 value ~$75 adjusts to ~$95 in 2022 dollars…my guess is this neglects the past 6 months of issues affecting LTO industry, so something over $100 seems to make sense…
Brazil and Canada are higher, likely in the $125-$150 range, will be interesting to see how production develops there, and makes sense why Canada growth is not huge…
Forecasts are projecting $100 for next 12 months…in theory N. & S. American production should drop if price stays below $100…
Appears middle east is in a good position to keep price somewhere between 90-100 and take over market share (if they can keep production up). Interesting next 6 months for sure…
We are not nearly close to energy scarcity, so says the Harvard´s David Keith.
https://www.youtube.com/watch?v=B47Jd3PWG4k
I disagree, and find his arguments specious.
Ron,
I said crude oil exports, the table you showed has crude plus refined products.
See
https://www.eia.gov/dnav/pet/hist/LeafHandler.ashx?n=PET&s=MCREXUS2&f=A
Seppo,
What is even more concerning is the amount of comments mentioning abiotic oil and how oil is not a fossil fuel as it replenishes itself. The world might have a rude awakening once the party is over.
Texas Railroad Commissioners are elected officials; some folks haven’t entirely given up yet so we do what we can to change people’s minds and urge them to vote accordingly. For as little time as I can devote to my advocacy I am pleased with the opinions I change about exporting the last of our natural resources away. I promise you, someday you’ll understand that. I’ve dealt with decline and depletion my entire career, what’s about to happen in a few years is going to rock people’s lives.
I used the reference to globalization with regard to the last of our nation’s natural resources, and the future, which really has nothing to do with the past and the dollar. I find that most of the far left who are against the use of fossil fuels can think of a number of reasons to drain America dry, as fast as possible, and get onto Flintstone cars. Not good, that. ALL people in America matter, not just the elite and the holders of the so called, ‘moral high ground.’ We need LOTS of time to convert to renewables. Decades. If you think the Permian is going to last for decades you’ve been listening to Dennis too long.
I liked your last sentence, goodonya. Perhaps then you can set aside your politics and join with me in the hope for conserving what’s left of our nation’s natural resources, and stopping exports of light tight oil and LNG. Flaring, for instance, sucks. We need to be prepared for anything, right?
Sure. Savings accounts are really good !
“We need LOTS of time to convert to renewables. Decades.”
Well Mike…I’ll be blunt about it.
Yes it will, and for 40 years now one party and its voters have been overtly hostile and/or indifferent to that whole domestic energy sector despite
1-fossil fuel depletion being a front and center issue the whole time
[I learned about it first in 9th grade 1975, but most adults already new about it in 1972 with the Saudi embargo against the US]
2-huge domestic wind and solar reserves
Its about time to embrace the industry with enthusiasm despite partisan loyalties.
Ditch leaders who seek to get in the way.
And btw- Texans stand to benefit as much as anyone from the wind and solar industry.
Mike Shellman,
People on the left are not the ones who pushed to allow crude oil exports, it was people on the right who tend to support free trade. In addition the US oil industry was and remains strongly in support of continuing to allow crude oil exports. Note also that export of petroleum products has always been allowed.
The US has been importing crude oil for a long time, the solution to that problem and the problem of oil depletion is to use less crude oil. The fact that fossil fuels of all types leads to environmental damage due to climate change will also be improved by using less fossil fuel. I agree this will take time to accomplish, several decades sounds correct to me. High prices for fossil fuel may help to accomplish the transition more quickly.
US crude oil imports in chart below using data from link below.
https://www.eia.gov/dnav/pet/hist/LeafHandler.ashx?n=pet&s=mcrimus2&f=a
Do you expect there to be big changes in the position of the RRC on spacing rules etc? Note that my scenarios assume 1320 foot spacing (4 wells per section width) for Pemian basin wells in the Wolfcamp (both in Midland and Delaware basins) and Bonespring formations and 1760 foot spacing (3 wells per section width) in the Spraberry formation. Also it is assumed that average lateral length after 2020 is about 9500 feet, so about 288 acres per well on average in Wolfcamp and Bonepring and 384 acres per well in Spraberry formation on average.
Mike —
Exporting oil isn’t about “draining the country dry”. It’s about paying off the vast foreign debt the US has accumulated by being a massive net importer of oil for eight decades.
The best way to do this is to heavily tax fuel at the pump so Americans stop wasting so much oil on stupid oversized vehicle and a ridiculously bad transportation system. That is what is draining the countries limited resources.
The myth of American oil self-sufficiency needs to die. It isn’t true now, and it wasn’t in your grandfathers day, or any time between.
This whole thread is brilliant, harrowing. Thanks, fellas.
“We need LOTS of time to convert to renewables. Decades.”
Wanna see something that will break your heart? Hubbert gave an interview back in 1976 that remains probably the only video of him depicting the future decline of oil. Around minute 31:00, after carefully explaining the importance of thinking about the future of energy, Hubbert shifts to showing how to deal with a post-peak world. He is clearly not a “doomer.” He gets out a little tabletop solar-powered motor to illustrate his point.
“We can do it now,” he says, repeatedly.
That was over 45 years ago. We did jack.
https://www.youtube.com/watch?v=Gq9GBx_KXL0
Drilling Productivity Report (DPR) centered 12 month average output for 5 tight oil basins. Note that we do not have updated data for official tight oil data from EIA due to a data server issue and improvements to the tight oil estimates expected to be completed by November 2022 at the EIA. For now the best data I have is the DPR beyond May 2022 and tight oil official estimates beyond March 2022 are likely to be revised.
Note that the DPR estimate includes conventional output in the tight oil regions so tight oil output is likely 500 to 600 kb/d lower than these estimates in 2022.
I think it’s a bit misleading to credit Thunder Horse much with the rise in GoM production. The most recent well, which finished ramp-up in March, has been a success but the one before less so, and overall the fields have been significantly underperforming compared to expectations. In the chart below the green line is taken from a report of BP’s in 2018. The other BP operated platforms have met expectations, except for the delay to Mad Dog II, with Na Kika doing better than planned. Mostly the rise is doe to improved availability with the platform doing best at the moment, considering its early problems, probably being Appomattox, with high availability and large producer wells recently ramping up.
Most of the GOM field-specific data through June has now been released by BSEE. It appears to be a bunch of small to moderate increases contributing to the 180 kbopd increase between May and June. Atlantis is up 6000 bopd, Mars-Ursa is up 50 k (biggest increase, but May was down from typical), Thunderhorse complex is up 8, Tahiti/CaesarTonga is up 8, Appomattox/Vicksburg is down 1, Jack/StMalo/Julia is up 24 – close to 100 k from these fields. I don’t currently track Na Kika, but that could be up as well.
King’s Quay data isn’t updated for June.
Bob/George
In the GOM chart in the post, an increase of 200 kb/d is shown for November. Do you know what is happening in the GOM during October to result in such a large increase?
The increase in November is a continuation of a trend of increasing production they show in July, August and September, with a down month in October possibly due to the EIA view of minor hurricane impact. King’s Quay is ramping up, and I’ve seen reports of 60+ kbopd in July or August.
The latest I’ve seen regarding Shell’s Vito is first oil in early 2023, and BP’s Mad Dog 2 (Argos) is still supposed to have first oil in last 2022, but that could get pushed into 2023.
I suspect the EIA still has Vito and Mad Dog 2 first oil impacting 2022 production, and that could be part of what is contributing to their view of increasing production.
Thanks Bob
OPEC agrees to cut production after oil price slump
London (CNN Business)OPEC said Monday it would reduce oil production next month, the cartel’s first output cut since the depths of the pandemic, as it braces for a global economic slowdown to hit demand.
The Organization of the Petroleum Exporting Countries and allied oil producing nations, including Russia, agreed to shave 100,000 barrels per day off their production targets in October.
Just a month ago, the OPEC+ group agreed to increase production in September by the same small amount — equivalent to about 0.1% of global demand — after coming under intense pressure from the United States and other big oil consumers to do more to bring down energy prices and inflation.
WTI 89.92/b +3.05 at 9:32 Est.
https://www.cnn.com/2022/09/05/energy/opec-oil-gas-prices/index.html
From your linkOPEC+ agreed to “revert to the production level of August 2022 …
OPEC had a big increase in August, so that won’t be much of a cut.
I have their August crude only production at 29,576,000 barrels per day. That is 2,261,000 barrels per day below their high 12-month average reached in August 2017 at 31,837,000 barrels per day.
At this point OPEC is just a talking shop.
I agree, Lightsout, OPEC+ is irrelevant. They are about 3M barrels below their quota. So cutting 100K of nonexistent oil is equivalent to slashing a knife through the air.
“Global economic slowdown to hit demand “
I’d add high priced electricity particularly in Europe will be causing oil demand destruction as small businesses in Europe can’t afford or borrow to stay open through the winter.
I think Europe might have enough natural gas to make it through a mild winter. But not a cold winter. And it’s the price of electricity that will kill oil demand in Europe. Even if they do burn some oil for electricity. It will still be high priced electricity that people can’t afford. Which equals demand destruction as businesses close down.
Price of coal looks to head higher. I see that as a negative of oil prices.
ECB raising interest is also a negative for oil prices. If asset prices in Europe no longer are appreciating due to a tightening of monetary policy. It means the bid for assets in Europe goes away. Falling asset prices means purchasing power takes a hit. Money flows out of Europe instead of into it.
Which is why the Euro will likely continue to fall against the dollar.
China is in a very similar situation. Depreciating asset prices. Leading to decrease in purchasing power which equals demand destruction.
Oil prices have been declining for 3 straight months. And on monthly chart in August closed closer to the lows. Oil prices look to continue their decline.
Oil is a special thing here at the moment.
It was only one newspaper reporting – Diesel and heating oil is already used for heat and electricity generation replacing the more expensive gas.
It may be oil usage goes up instead of down, simply by replacing too expensive nat gas. No idea about the numbers – at least Germany owns round about 4 GW old oil generator capacity, and additional production replacing gas with oil.
Heating oil is decoupling from crude oil, prices are rising. Now at 1.7 € / Liter.
Austria is promoting oil use instead of gas for the industry, too.
A big thing holding down oil is the Corona panic politic in China, setting more and more of the country on lockdowns. This adds a lot of instability and demand construction. They try to paper it over with interrest rate reduction.
I think the symbolic 100k barrels cut of the OPEC was a warning – they’ll cut big when prices continue sliding. They know nobody other can ramp up production in any meaningful way.
PS: 340 billion € energy relieve bill coming out in Germany. Lot’s of helicopter money slushing around – they want to finance it with a excess profit tax.
Interesting times…
Regarding your PS, yes, the money paid by customers goes somewhere, in many cases to a company that actually have a much lower production cost than the marginal kWh was priced for. So money will be made, by someone. (as always)
From TASS:
“5 Sep, 10:45
Russia’s oil production will decline by 2% in 2022, refining by 8% — Energy Minister
According to Central Dispatching Department of the Fuel and Energy Complex, in 2021 Russia increased oil and condensate production by 2.2% year-on-year
VLADIVOSTOK, September 5. /TASS/. By the end of 2022, Russia is likely to slightly reduce oil production (by about 2%), oil refining will be reduced by 8% to about 262 million tonnes, Energy Minister Nikolay Shulginov said in an interview with TASS at the Eastern Economic Forum.
“There is an increase in oil [production] now, but at the end of the year, production is likely to be slightly lower than last year – by about 2%. For oil refining, we expect a 8% decline, based on the current trend. By the end of the year it will be about 262 million tonnes,” he said.
According to Central Dispatching Department of the Fuel and Energy Complex, in 2021 Russia increased oil and condensate production by 2.2% year-on-year to 524 mln tonnes. Processing increased by 3.9% up to 280.7 million tonnes.
Organized by the Roscongress Foundation, the Seventh Eastern Economic Forum will be running from September 5 to September 8 in Vladivostok. TASS is the event’s general information partner and its official photohost agency. This year, the theme of the forum is: “On the Path to a Multipolar World.”
Greenbub, thanks for this post. But I cannot seem to find the article on the web. Could you please post the link. Thanks.
https://twitter.com/staunovo/status/1566871293559013378?s=20&t=eGC8_5I5ZYaI5mYI82nxNA
Here’s the link to the article on the Tass site
Russia’s oil production will decline by 2% in 2022, refining by 8% — Energy Minister
https://tass.com/economy/1502981
Survivalist
Did you notice the date and headline a few articles lower
27 FEB, 16:04
Kiev mayor says Ukrainian capital is encircled.
Thanks, Survivalist. That article was posted on September 5.
According to Central Dispatching Department of the Fuel and Energy Complex, in 2021 Russia increased oil and condensate production by 2.2% year-on-year to 524 mln tonnes. Processing increased by 3.9% up to 280.7 million tonnes.
Assuming August production was about the same it was around mid-month at 10.56 million barrels per day, then they would have to average 9.75 million barrels per day for the rest of the year to produce 524 million tons for the entire year.
Of course, production would not be flat for the last four months of this year, that is just what they would have to average.
Click on chart to enlarge.
Russia August Oil Output Set for Decline After Months of Growth
(Bloomberg) — Russia’s oil output in August is set to decline for the first time in four months amid lower flows from a group of smaller liquids producers, which include Gazprom PJSC.
The nation pumped an average 10.56 million barrels a day of crude oil and condensate from Aug. 1 to Aug. 23, according to calculations based on data from the Energy Ministry’s CDU-TEK unit seen by Bloomberg. That’s about 1.9% below the July level, the data and last month’s figures obtained by Russian newspaper Kommersant show.
https://www.bnnbloomberg.ca/russia-august-oil-output-set-for-decline-after-months-of-growth-1.1809816
https://www.dailymail.co.uk/news/article-11185617/Gazprom-releases-sinister-video-showing-worker-turning-gas-supplies-Europe-freezing.html
Russian Oil Gazprom creates a video of Europe entering an ice age as it switches off supplies.
PA, yes, too bad Europe has so few renewables. Or at least, we could do with a whole lot more. And Gazprom will be losing a ton of revenue because there are few pipelines to non-European customers?
“PA, yes, too bad Europe has so few renewables.”
True. North of the Alps solar is relatively weak.
The wind resource offshore is huge for many countries, once the equipment is deployed.
Like most of the world, Europe has far outgrown its domestic resources over the past 2 centuries.
Overshoot.
Please remind me, what follows overshoot?
Contraction.
Long, long contraction…
in population, GDP, energy/capita.
No two ways about it.
No recipe, no playbook.
Right. See “Bronze Age Collapse.” Dry run for today.
Price of WTI isn’t all that far from triggering a bunch of margin calls. Just saying if you bought in at anytime during 2022 the trade is about to go against you.
We can see prices take the elevator down from here. If we get cascading margin calls.
When this hits 30 again I’m going in big on the long side.
Free money.
Whoever holds the other side of the trade ( a short I assume because margin calls only happen when you’re long and prices decrease) will make the exact amount of money – to the penny.
Futures and options are risk transfer instruments, not assets so in aggregate losses and gains are zero and therefore don’t matter.
rgds
WP
Margin calls can happen when your short as well.
And futures is where prices are set. So it does matter. The zero sum game matters a lot.
Currency trading is a zero sum game. That matters a lot. Value is transferred.
And when value is transferred out of oil as prices drop it effects oil producers.
Purchasing power is being transferred out of the Japanese yen at a high rate. Tell them that because it’s zero sum it doesn’t matter.
Of course price discovery matters – my only point is that from macro POV what happens in futures markets has no impact on the monetary system.
Btw – currency trading is not a zero sum game. Real purchasing power is exchanged.
Rgds
WP
Going on margin is money creation whichever way the bet is. If the entity on the other side of the trade is not leveraged, the margin call will result in money destruction which will help to bring down the asset bubble. Central bankers really don’t know what they’re doing. They have been using the excuse that inflation is low to blow asset bubbles. High energy prices are what produce inflation. So the fact that central banks are mandated to keep inflation in check translates into they have to keep energy prices in check. This means that if energy supplies decrease, central banks will raise interest rates until the money supply decreases, i.e. we have a recession. Read https://www.simonandschuster.com/books/The-Lords-of-Easy-Money/Christopher-Leonard/9781982166632
The sum of longs and shorts is zero and therefore there is no money creation or destruction. That is exactly the difference between derivatives like futures, options and swaps and real asset tokens like bonds and stocks.
rgds
WP
That’s wrong.
When you go on margin you are borrowing money to buy a financial asset and you are using another financial asset as collateral for the loan (see https://www.investopedia.com/terms/b/buying-on-margin.asp). When you get a margin call, it means that the bank has revised its estimate of the value of the collateral used for the loan and is therefore reducing the size of the loan. When banks loan money, that is money creation. When they reduce the size of the loan that is monetary destruction. Even if you make money on your trade, margin calls can increase systemic volatility because they can cause a dramatic reduction in the money supply.
Economics 101 should start with money creation. Unfortunately it doesn’t and your suggestion that every trade is a zero sum game so that “there is no money creation or destruction” is a common misconception. I suggest Nate Hagens podcast with Josh Farley to get you started: https://podcasts.apple.com/us/podcast/josh-farley-money-money-money/id1604218333?i=1000571335096
I second that podcast, just having listened to it the other day out on the trail.
You may want to read up on how futures work. They net to zero – always.
If you are long a contract and I am short the contract we both will show P&L but in the opposite direction – and they net out to zero. Central clearing enables that, and makes sure that every day after trading stops the net of our positions is zero. Unless one of us defaults ( and the clearing corporation takes over) both our positions and P&L net to zero.
The difference between futures and options is that options don’t get settled every day – you have open p&L but in futures world you need to cure any deficit you have at the end of the trading day.
Initial position
Shinzy +1 contract – market price is 105
WP -1 contract – market price is 105
P&L = 0
Market price moves to 102
Shinzy +1 contract, P&L = -3
WP -1 contract, P&L +3
Shinzy has to pay +3 to the clearing corporation at the end of the day
WP receives +3 from the clearing corporation and has the ability to take it out ( let’s asume I do)
next day:
Market price moves to 109
Shinzy +1 contract, P&L=+6
WP – 1 contract, P&L= -6
WP has to pay +6 to the clearing corporation and Shinzy has the ability to take out the +6 that were credited to his account.
The net between Shinzy and WP, both with respect to positions and P&L is always zero, not matter what happens.
What you wrote above is correct for real asset, but not for instruments ( note I did not say assets) that net to zero.
You example is correct if you’re talking about lending against an asset like a house – you pledge the house and the bank creates, say 80% of the value of the house and gives you a deposit. But that does not work for risk transfer instruments like futures / options. They are not assets, they just transfer risk.
HTH
WP
I will try one more time before giving up. Your example is fine, but there is no margin anywhere. Here is an example with margin:
Schinzy has no money but has 100 shares of XYZ corp at $100/share. He uses these shares as collateral for a $5000 loan to buy futures contracts.
accounting: $5000 is added to the money supply (in reality it’s a percentage of $5000 but it is above 90%) because the bank creates the money for the loan out of thin air.
The following week shares in XYZ corp go to $10/share. The bank makes a margin call to Schinzy telling him he is only allowed to borrow $500 now and asks him for $4,500. Schinzy has no money so he must sell what he has to cover the margin call. He sells a combination of XYZ corp and his futures contracts and pays the bank $4,500. The bank destroys the money Schinzy pays back so the money supply as shrunk by $4,500.
Note that if Schinzy sells XYZ corp stock, that increases volatility because the stock might now be oversold. Schinzy may have wanted to keep the stock at that price but can’t because he got the margin call.
Schinzy – I agree with your view of money creation – but that (I think at least) was not the point. The only point I was trying to make ( and I think failed to do so) is that in futures trading there is no creation or destruction of money – only transfers.
So if somebody chooses to create money ( by borrowing) when trading futures is a separate issue. One may or one may not. “professional” traders tend to put up T-bills, not cash, as margin for their futures account so one can argue that any debits against that are money creation but when it gets closed out that money gets destroyed again. I suspect that we both quite well understand how all this stuff works but due to brevity are just slightly talking next to each other.
rgds
WP
If the US stops releasing 1 mmbopd from the SPR in October, the price of WTI should go up a bit.
Take into account that China is not consuming full force. Add to that filling up of the SPR ..
This is a self-inflicted wound. Chancellor Gerhard Schroder signed the deal for a sub-Baltic pipeline with Mr. Putin just before leaving office. In return, Putin made Schroder a handsomely-paid head of the Nord Stream project, headquartered in Geneva. As natural gas roared into Europe, Germany became the European purveyor of Russian gas to the rest of Europe. Cheap Russian gas powered Germany’s factories, making them gobs of money but eventually raising European dependency on Russian gas to 40%. Then Ms. Merkel decided to decommission the nuclear plants. She, who speaks Russian fluently and holds a PhD in Quantum Chemistry.
Hickory is right: there is no way out of this. The SMUs–Small Modular (Nuclear) Units–would do it but the best ones are manufactured by Rosatom, the Russian state nuclear company, and that Rubicon has been crossed. The LNG project could almost pull it off, but it has been impossible to build pipeline infrastructure in the U.S. and very close to impossible to build LNG trains, not to mention the fact that Europe has few regas facilities and floating units are slow to completion. Solar is inadequate and wind is a slow buildout.
On the other hand, Russian gas is going to be fine. There is an LNG train right beside the kick pump of the now stilled Nord Stream, but more importantly more LNG trains are going in to handle Kara Sea production. The Northern Sea Route is now accessible year-round, only occasionally needing the ice cutters that were manufactured for the task of providing safe passage for LNG tankers. Siberian gas is going to China: by the Power of Siberia pipeline but also via LNG. Xi has prepared massive underground caverns for it.
Which brings me to my point: an unholy alliance between China and Russia.
The Sino-Russian Alliance is not a new thing, it has just been subrosa. We’re about to see it grow teeth. Putin could care less about selling oil and gas to Europe–he has a new buyer. What Xi doesn’t need, Modi will take, and any excess will go to Pakistan and other willing buyers. Sanctions won’t work and neither will a G7 price cap on Russian oil. Transshipment is underway and Japan (ironically a member of G7) has recently signed a contract to receive production from Sakhalin-II; to me that’s already a breakaway hypocrisy.
There is underway–almost lost in the angst of what is coming–a battle to change geopolitical hegemony. While some are gloating about Russian oil declining, Putin is raking in roughly $1B per day in oil and gas revenue. Saudi oil is on the wane. American domestic oil will begin to sputter out in about two more years. As oil becomes scarce, natural gas will become king and there was a world of gas created by the Siberian Traps. So much that it has formed billions of tunnels beneath the permafrost, which is now melting, causing coalescence of those tunnels into methane craters identified by GPS. Will the world use it, or treat it as a pariah gas?
We can shrug, or talk about renewables, or even opine about blue hydrogen and nuclear fusion. But this shortage is rushing at us and when it comes down to the utter privation of living a shitty life on Planet Earth without the munificence of petrochemicals and electricity, you can count on Homo sapiens to do whatever it takes to hang onto the comforts and health that fossil fuels have offered up.
The point I’m painfully trying to make is that Europe is only the point of the spear. The rest of mankind is clinging to the shaft. And Putin and Xi know that.
Another great post Gerry.
“As oil becomes scarce, natural gas will become king and there was a world of gas created by the Siberian Traps”
Why is everyone so against CTL?
Yes, I know environmental and climate change.
Those concerns will be flushed down the toilet when oil starts declining.
Exactly.
Natural gas will be extremely important in future as it has the potential to be re-formed into liquid fuels (for one).
https://www.lauriemeadows.info/conflict_security/The-West's-Apartheid-Trading-System.html#Natural_gas_to_Hydrogen_gas__carbon
As I noted, “Russia’s Novatek, which operates the Yamal gas plays is already said to be considering changing its planned Obsky project to ‘re-form’ natural gas to produce ammonia, hydrogen, and methanol. Hydrogen gas must be transported with natural gas to avoid metal pipelines becoming brittle, but ammonia is a liquid and so far easier to transport. The hydrogen in ammonia can be ‘stripped out’ at destination, releasing the nitrogen back into the atmosphere. Methanol (methyl alcohol) can be used as a liquid fuel (including in transport), or as a feedstock for a wide variety of chemicals. Once again, much easier to transport.”
Jesus Christ, Gerry. Brilliant.
I picture Ukraine disappearing like a lump down a boa constrictor’s long gut.
I’m a retired EE and one of my interests is to visit a dozen or so websites of power generation systems. I found one for Denmark which shows the % production relative to installed capacity. 6190 MWs. I have visited the site almost everyday for the past three years and I could count on one hand how many times the production has exceeded 4000 MW. There is a real cost to the Danish for 2000 MWs of towers, turbines, cables and switchgear that never earn their keep. Who would have a business where 20 of 60 employees sit on their ass everyday doing nothing. That’s the reality of wind and solar generation.
If you want to sound a little more ‘on the ball’ about it,
nameplate capacity of a generating facility is like the size of the engine, and for electrical facilities is given in Watts, like MWatts.
Actual output, or consumption, is in output/time. Like MWhrs.
The economic feasible of a generating station is generally calculated on a 30 yr levelized cost basis.
And for utility scale wind a capacity factor of roughly 40% (annual output at 40% of theoretical maximum for that particular unit) pans out to excellent energy output and financial performance.
That’s what happens when you put them in a windy area, and that is why it is a competitive and fast growing international sector.
If you have a great energy resource within your boundaries, be thankful.
Similar story with solar, in the sunnier 2/3rds of the world especially.
Hickory
I’m well aware of the difference between MW and MWhrs. Go to any ISO website and all of the graphs of the current loads are always MWs . Let me stay with Denmark. There are plenty of times when the production of their turbine infrastructure will be 100 to 200 MWs when the countries load is 4000 MWs. Levelized costs do not include the real cost of the capacity that has to be ready to produce electricity when the wind isn’t blowing. Or in California’s case, when the sun isn’t shining.
Good luck with that rationale.
Decision makers on electrical generation find it to be an economically viable and very useful source of energy, despite intermittency.
Intermittency of output is an aspect that will have to be taken into account,
like oil depletion.
If you wish just unplug when the wind generators are blowing as a form of protest. Hold a sign outside your house. You can get on the news.
“I found one for Denmark”
https://www.youtube.com/watch?v=BOQi4b9EMRE
https://energynumbers.info/capacity-factors-at-danish-offshore-wind-farms
Wow- that biggest installation- Anholt 1 has truly impressive performance numbers, with annual output equating to about 1/5th of nuclear power plant.
New UK government just announced a lifting of the banning of frac’ing.
Could be mahtee intrstn’ to see how that will play out.
As an aside – for the first time ever, apparently – LNG traders are actually ‘storing’ LNG on ships at sea (9, by one account) in anticipation of higher prices/shortages in the coming weeks.
The New England states are facing near-European levels of energy precariousnss should an early/cold winter unfold.
Interesting times.
Where would they get the rigs and labor from?
Greenbub,
Cuadrilla already has 2 wells drilled and 2 (of ~80 total) stages already frac’d.
Should a ‘wartime’ effort be adopted, the Brits could recreate the Cowboys of Sherwood Forest experience by recruiting American and Canadian hands along with a handful of Super Spec rigs and frac spreads.
I do not believe this will happen, but an expeditious program could see the UK producing appreciable amounts of natgas starting in 2023.
Except they had eight years of gov’t support and produced jack for it. The theoretical recoverable amounts are 15 fold less than what they expected. There are no fracking service companies here to take advantage of it, and the geology is nothing like the US. The locals don’t want it.
Aside from that, fracking doesn’t change anything about the FF depletion problem. It’s a stop gap, just as the cries for more North Sea licences are. The North Sea isn’t going to magically produce more, affordable gas and oil just because we extra double need it now.
Fracking in the UK will likely last as long as a fart in a whirlwind.
The new UK Energy Minister is a dominionist lunatic:
https://twitter.com/Jacob_Rees_Mogg/status/1567891494824038402?s=20&t=v1FbP-Ryku5lkARrbjTFPQ
The charts below show the four biggest independent producers in the Permian. They aren’t all exclusively producers there, e.g. EOG is also a big producer in Eagle Ford, but they all concentrate on shale oil and gas. The cumulative revisions are all negative but are so far less of a propotion of the cumulative discoveries than for the top producers in the Bakken. One reason may be that the wells in the Permian are, on average, a couple of years younger, another is that there have been a number of mergers and takeovers that may hide some negative revisions, or it may be that the original estimates were nearer reality. Nevertheless, allowing for all the probable category reserves that have been shown as unrecoverable, the original estimates look to be around twice reality, and maybe more as negative revisions continue to accumulate and discoveries plateau.
Discoveries, which are mostly FIDs on known resources rather than real discoveries.
Revision:
Reserves and production:
Quote today for a calendar 2023 $72.50 WTI put was $10.53 per barrel.
I assume this is evidence of the lack of liquidity/volatility in the oil markets which OPEC has addressed?
Lack of dollars in the market. Dollar shortage in real economy. I can’t stress how important Japanese banks are to Eurodollar market and providing dollar funding. Might be seeing a turn in dollar funding here. Watch USD/JPY.
If they turn the taps of liquidity back on oil might get a second life here.
Permian rig count and frac spread still trending down for the week, $90 WTI seems to be the cutoff
Interesting info on vehicle sales/miles driven in US. EVs now make up about 0.63% of the 284 million cars in US.
https://wolfstreet.com/2022/09/09/what-americans-are-driving-vehicles-in-operation-used-vehicle-exports-evs-and-stuff-for-engine-geeks/
A new Non-OPEC oil production thread has been posted.
https://peakoilbarrel.com/may-non-opec-oil-production-declines-again/
A new Open thread Non-Petroleum has been posted.
https://peakoilbarrel.com/open-thread-non-petroleum-september-10-2022/