A guest post by Ovi
Typically the POB posts have a theme. However due to EIA schedule changes for issuing their reports and missing EIA reports, this post contains oil production updates for a several Non-OPEC countries plus the September DPR report. The country updates come from a combination of official country websites and news articles.
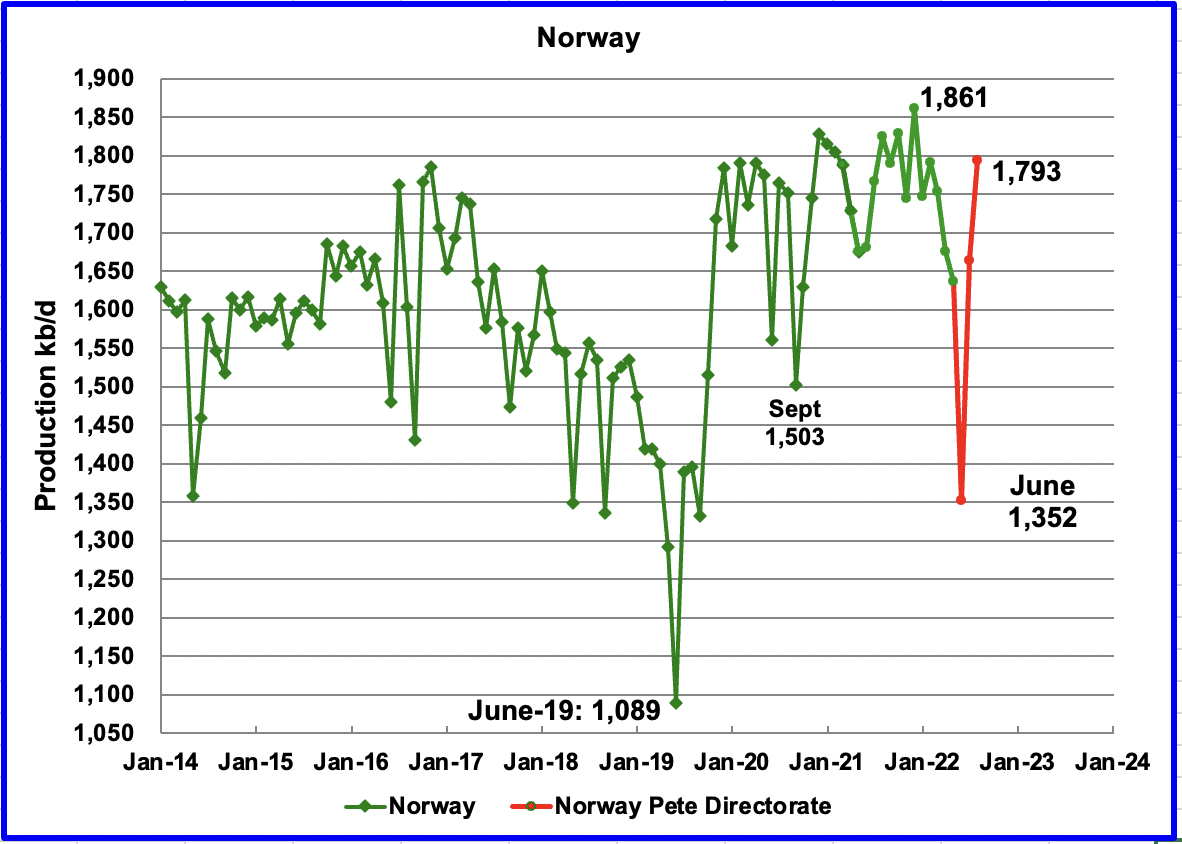
The Norway Petroleum Directorate (NPD) reported that production rebounded from June to July to 1,664 kb/d and then rose to 1,773 kb/d in August. (Red markers.). According to the NPD: “Oil production in August was 3.1 percent lower than the NPD’s forecast and 4.7 percent lower than the forecast so far this year.”
The rebound from the June low is due to the end of summer maintenance and possibly the start up of the second phase of the Johan Sverdrup field along with some other small fields.
According to OPEC: “For 2022, production growth is expected to decrease by 43 tb/d y-o-y to average 2.0 mb/d. Norwegian liquid output dropped by 12% in 2Q22 to 1.74 mb/d, mainly because of maintenance at offshore platforms. In addition to some small start-ups, growth is expected in 4Q22, following the return from maintenance and second-phase production start-up of the Johan Sverdrup field.
For 2023, Norwegian liquids production is forecast to grow by 0.24 mb/d, unchanged from the previous month, to average 2.2 mb/d. Plenty of projects, from small to large, are scheduled to ramp up in 2023 in the Njord, Nova, Ringhorne, Alvheim, Oseberg and Snohvit fields. However, Johan Sverdrup is projected to be the main source of increased output for the year, making up roughly 35% of total Norway’s crude and condensate output.”
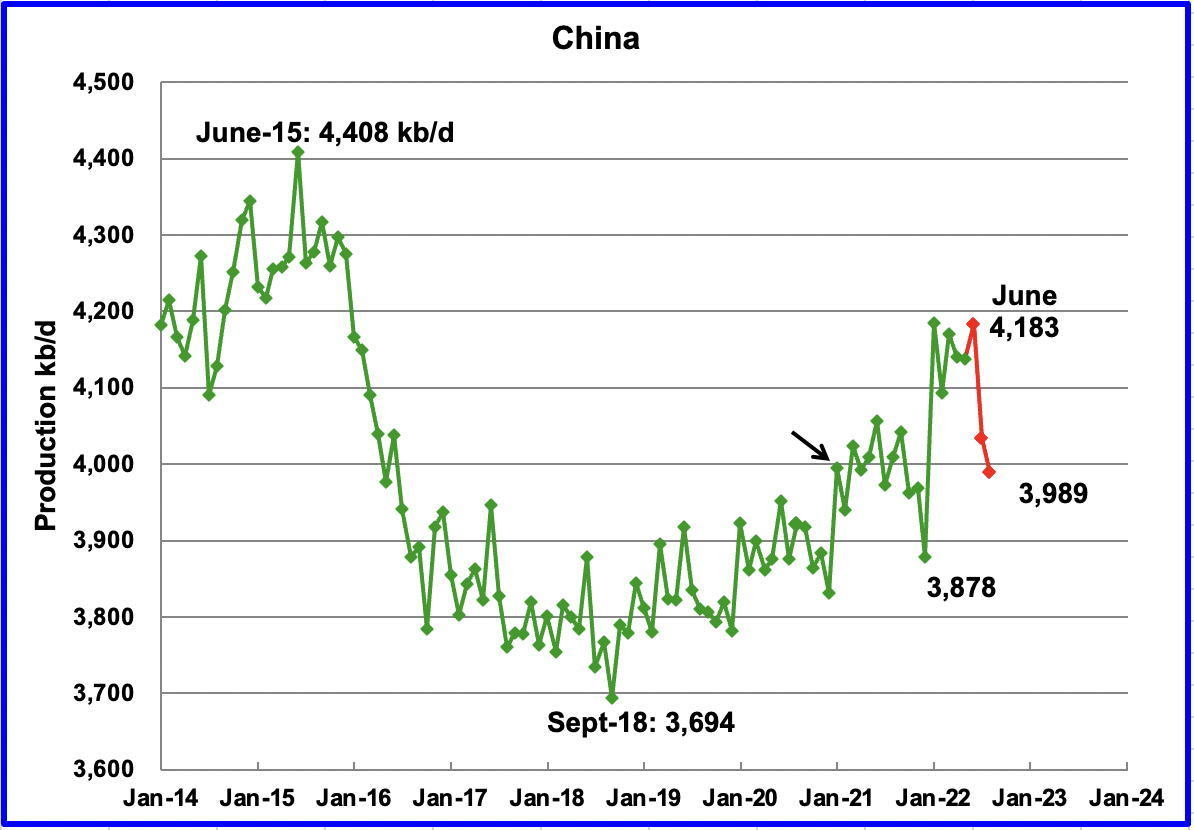
China reported that its output decreased in August to 3,989 kb/d, a drop of close to 200 kb/d from June. (Red markers)
China may be close to its current maximum production level of close to 4,000 kb/d. To offset declines, the national oil company is investing in conventional wells and also drilling for Shale Oil. See Below.
According to OPEC: “Natural decline rates are expected to be offset by the Chinese national oil company’s considerable investments. Tianjin, Xinjiang, Heilongjiang, and Shaanxi were the main producing provinces in the first half of the year. Chinese companies expect additional growth through more in-fill wells and enhanced oil recovery(EOR) projects.
For 2023, y-o-y growth of 30 tb/d is forecast for an average of 4.5 m/d, with Bozhong 29-6, Wushi 17-2 and Kenli 10-1N planned to come on stream under the China National Offshore Oil Corporation (CNOOC). At the same time, ramp-ups are expected from the Changqing, Jilin and Liaohe projects, which are managed by Petro China. The new projects will slightly offset declines from the mature onshore production base.”
According to this source, China’s CNOOC has found shale oil in its South China Sea exploration well for the first time.
“CNOOC believes that the Beibu gulf contains 8.76 billion barrels of shale oil, and claimed that the wildcat well flowed 20 cubic metres/day (m³/d) (125.8 b/d) of shale oil and 1,589m³/d (56,092 ft^3/d) of natural gas, which the Chinese oil giant is calling a commercial discovery.”
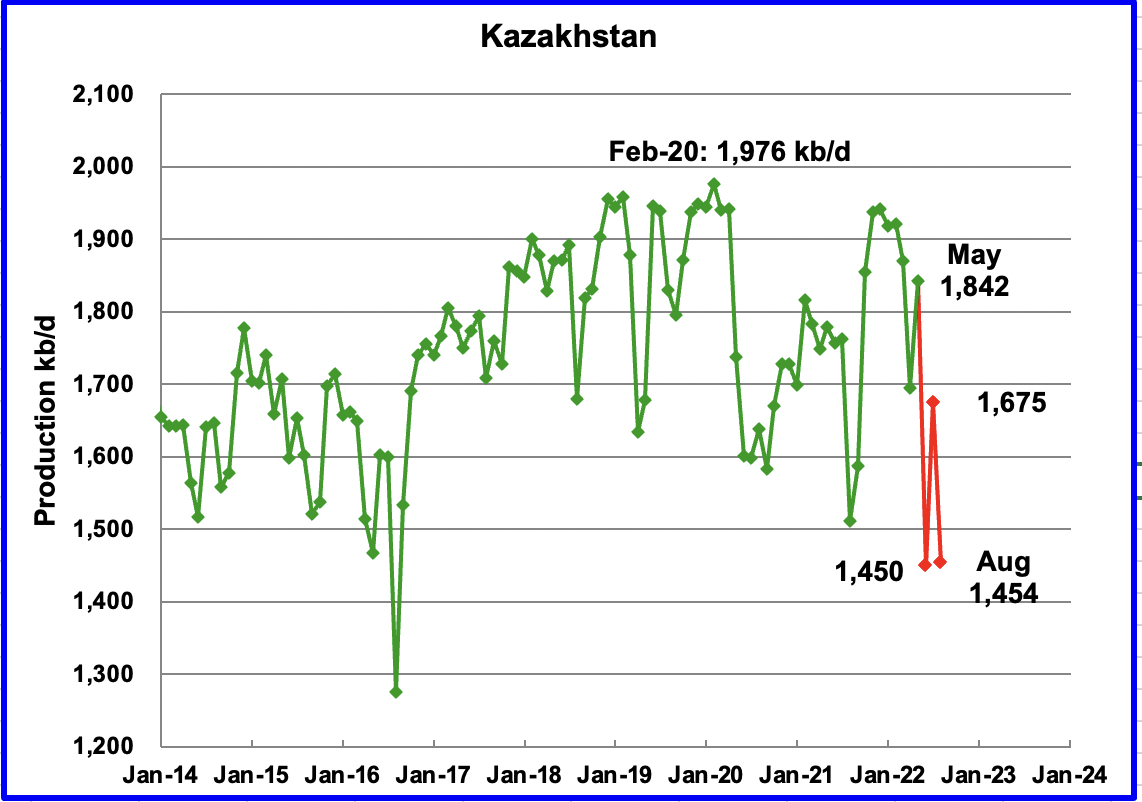
According to this source, August production fell after rebounding in July. The article just reports Crude oil production. Consequently the August number shown in is an estimate based on the percentage drop and a typical C + C to C ratio using earlier EIA data.
“The fall in output was due to a sharp decline in production in the giant Kashagan oil field after a gas leak early in August, as well as planned output curbs in the Tengiz field due to regular maintenance.”
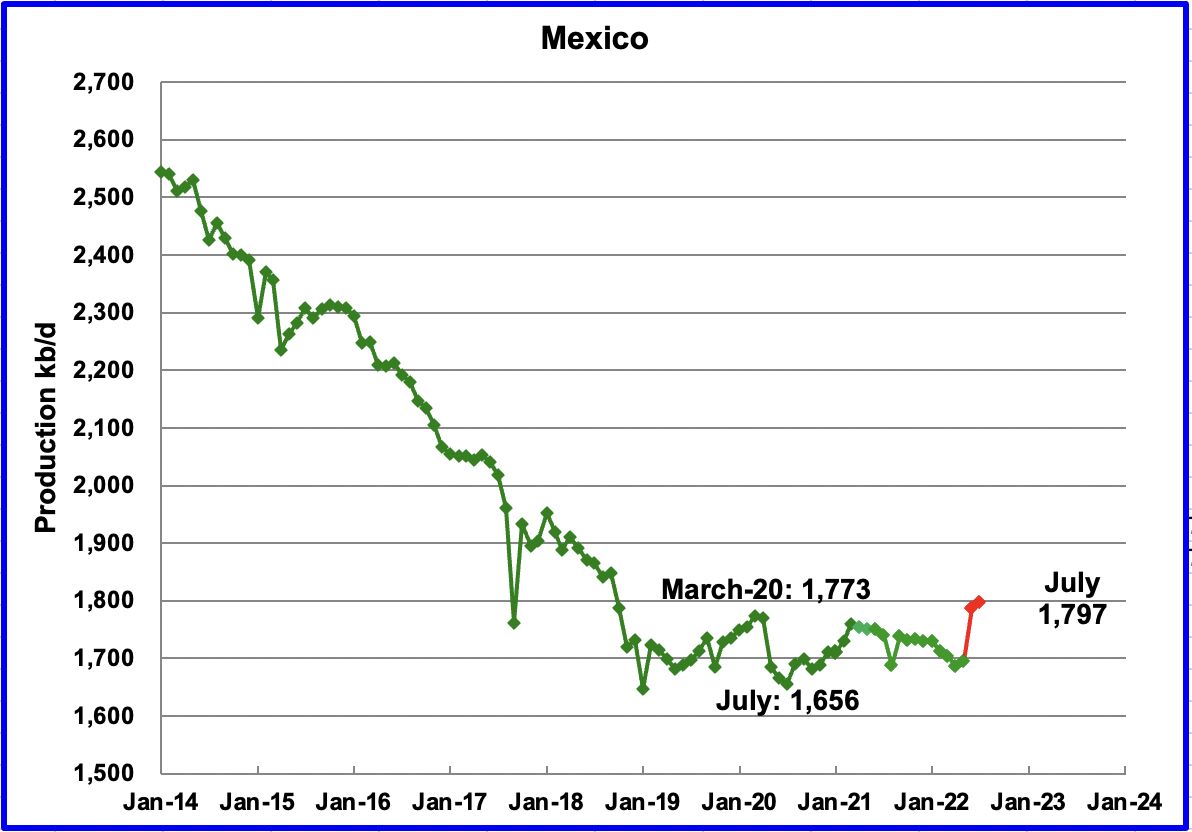
Mexico’s oil production increased by 10 kb/d in August to 1,797 kb/d. This is the third increase since May. Note that the red markers will be reduced by the EIA by close to 80 kb/d. Pemex reported production for May was 1,775 kb/d. The EIA reduced it to 1,695 kb/d, a reduction of 80 kb/d, due to a different definition for C + C.
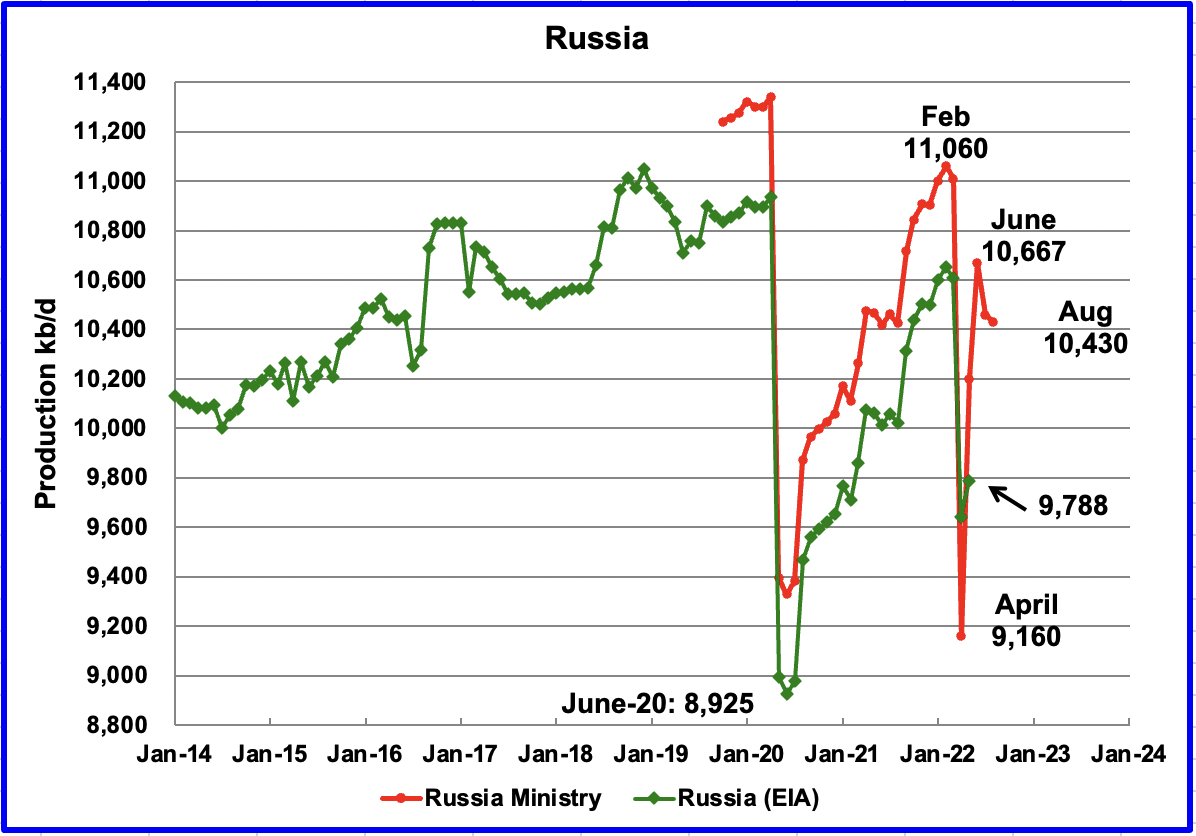
According to this source, August production fell by 30 kb/d from July’s output of 10,460 kb/d to 10,430 kb/d. In addition, this source revised down the original June output from 10,760 kb/d to 10,667 kb/d, a downward revision of 93 kb/d.
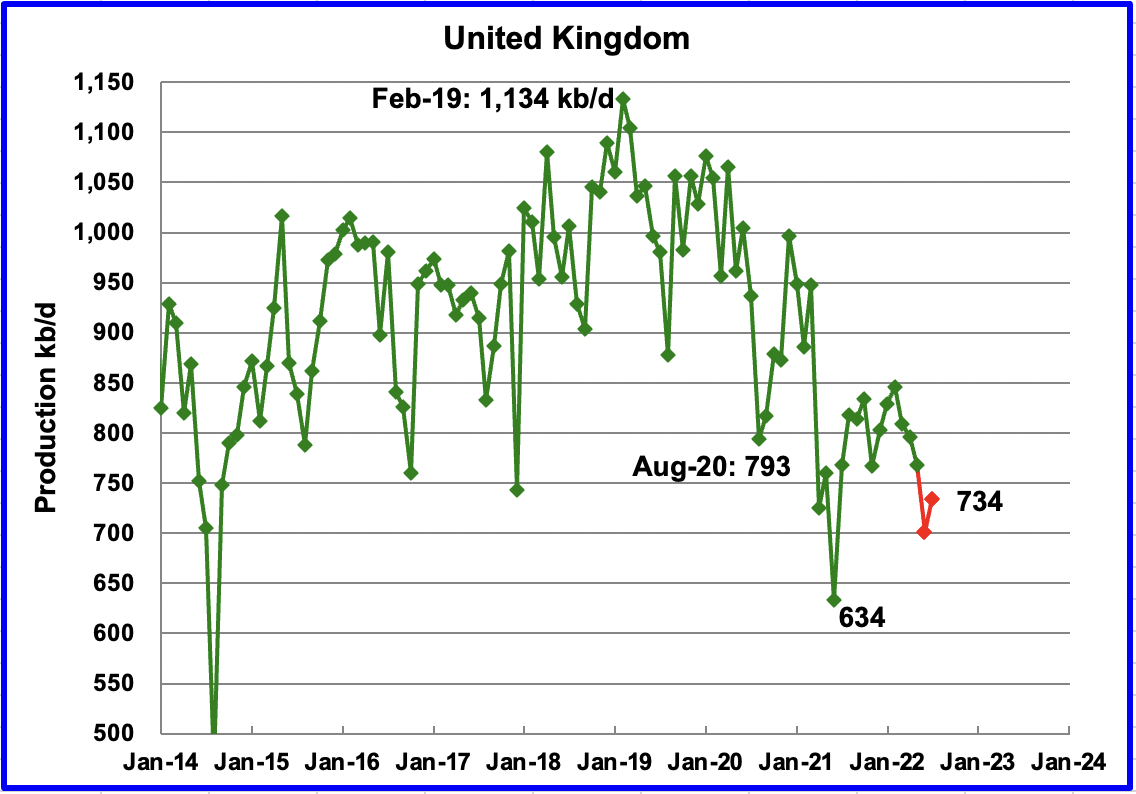
According to this source, UK production dropped in May to 701 kb/d and then rebounded in July to 734 kb/d. Clearly UK production is in decline.
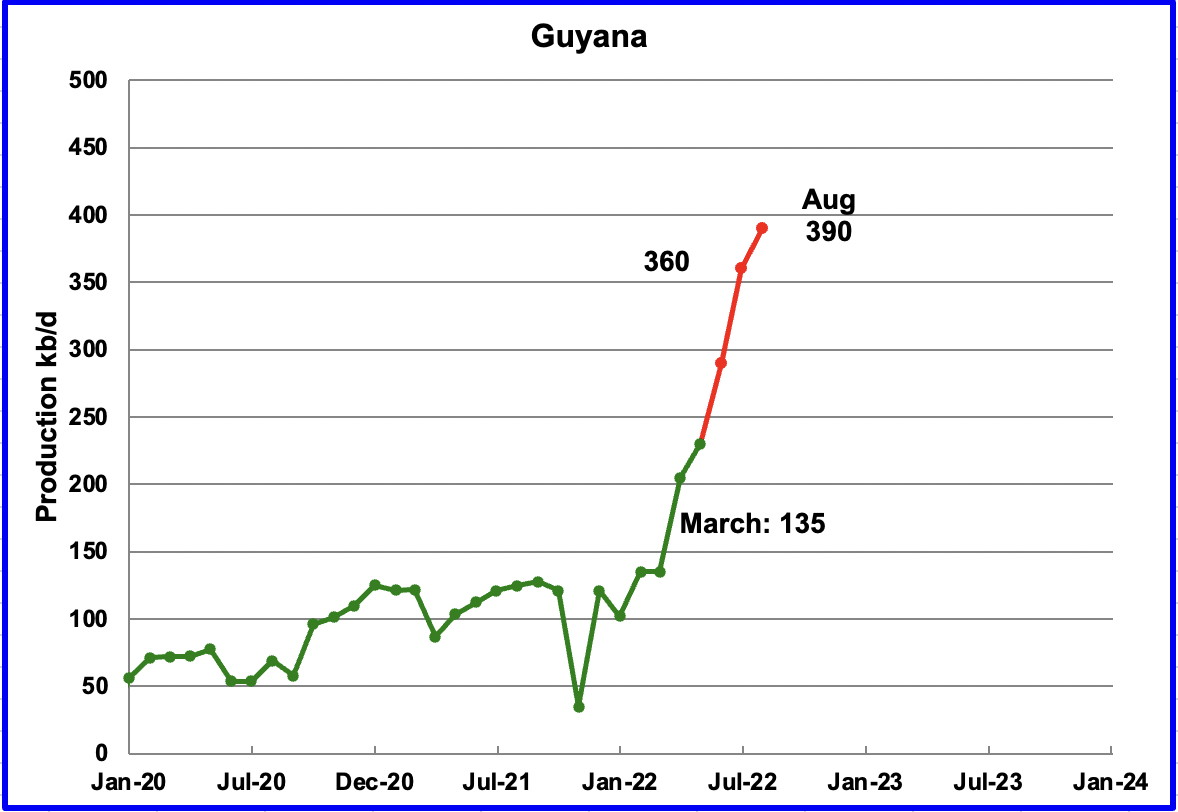
Guyana added an additional 30 kb/d of production in August to reach new high of 390 kb/d. According to the chart below, the operating companies appear to be ahead of schedule on production.
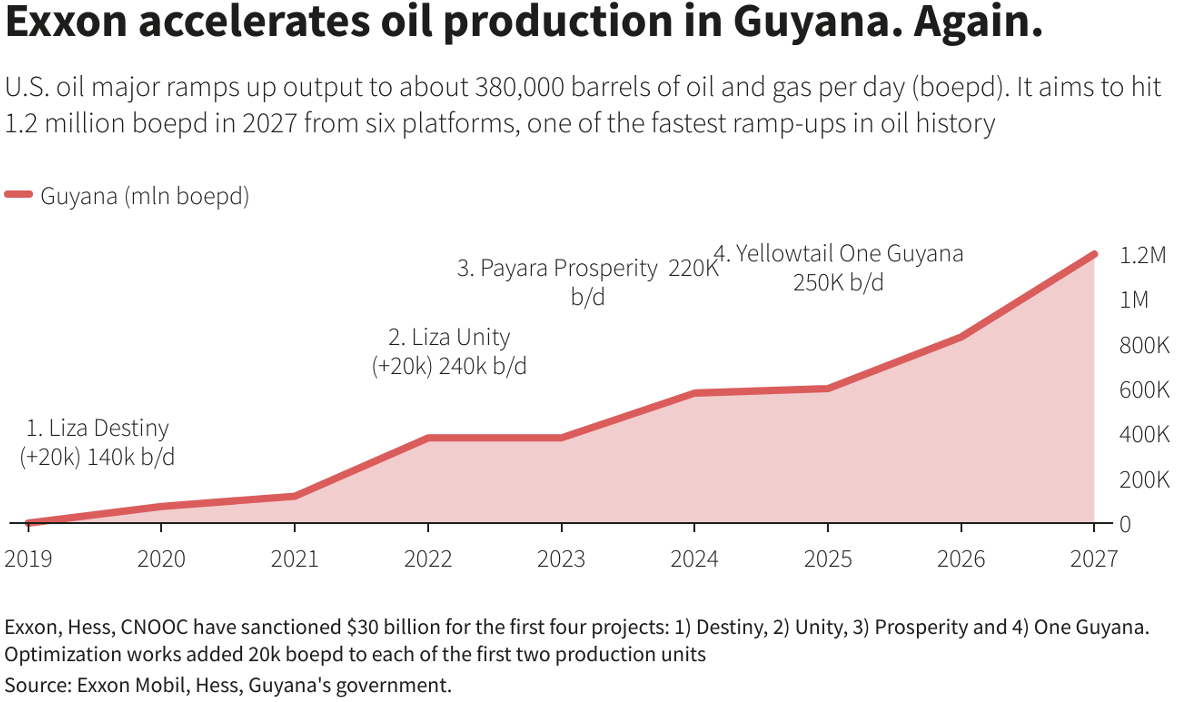
Guyana production schedule.
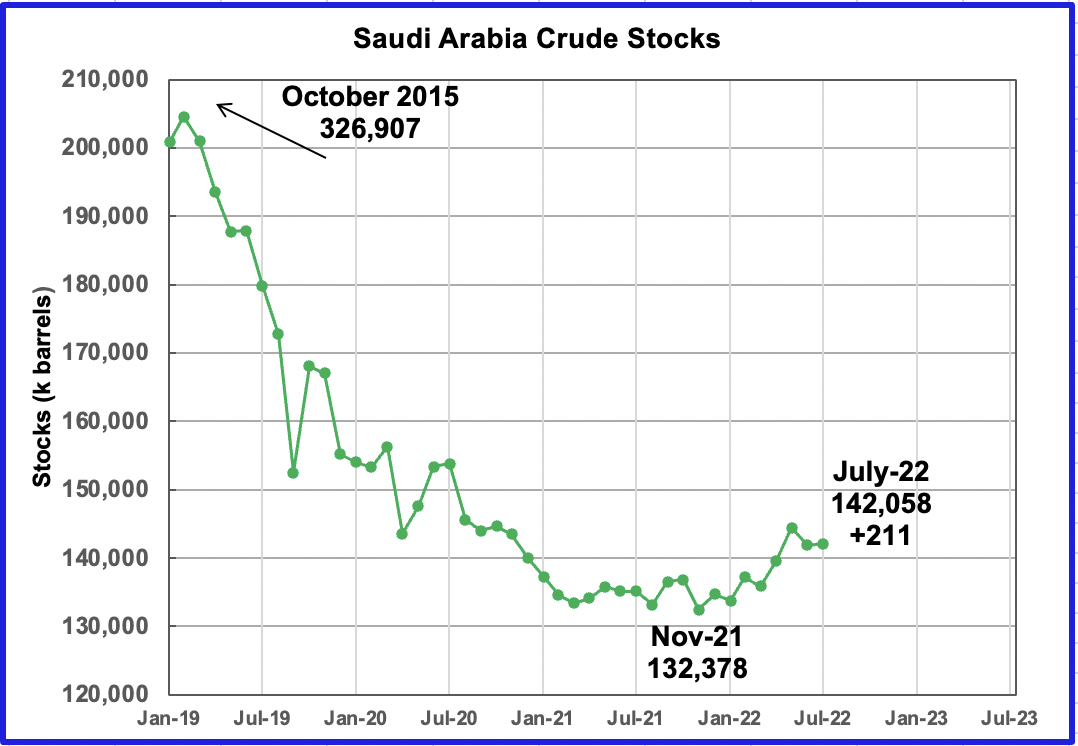
This chart shows Saudi Arabia’a oil stocks starting in 2019. In October 2015, SA had 326 million barrels in storage. Between then and January 2019, their stocks were reduced by 126 M barrels. During most of 2021, stocks bounced around 132 M barrels. In 2022, they have slowly risen to 142 M barrels in July
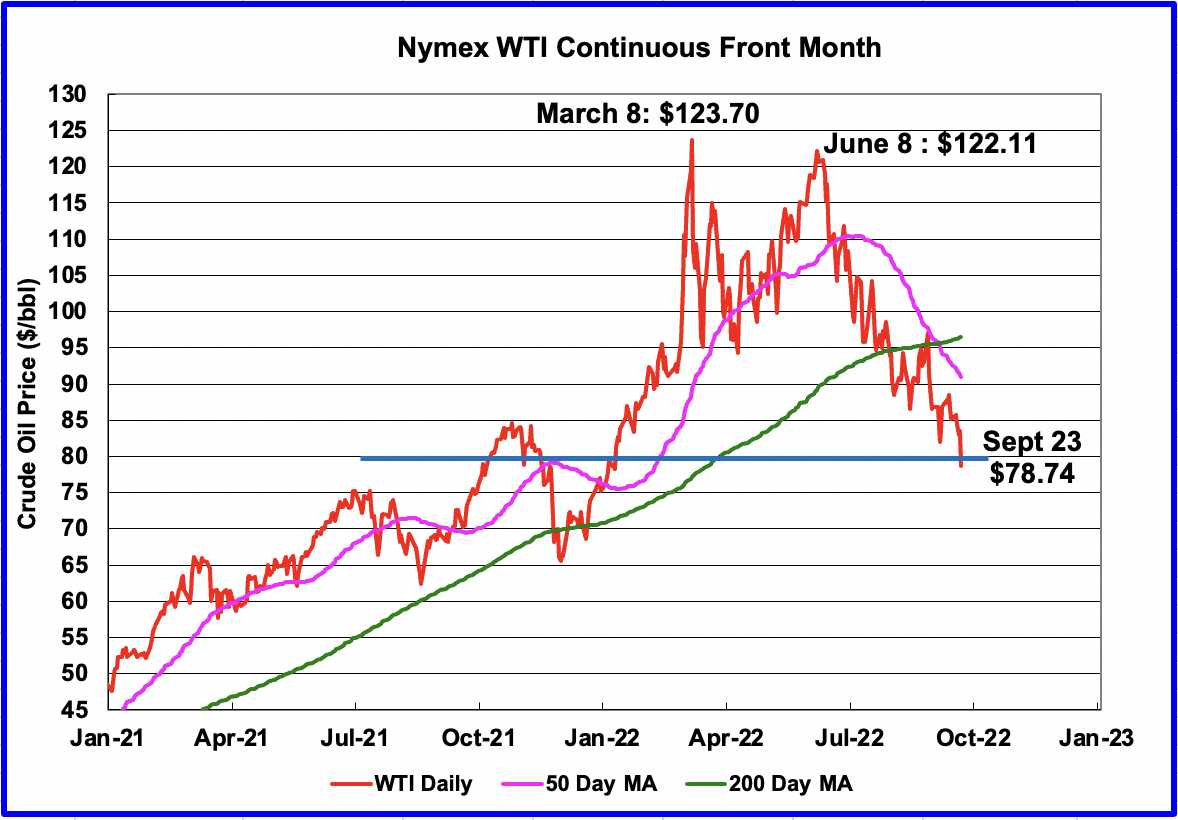
On September 23, 2022, WTI settled below the psychological level of $80/b. OPEC has stated that $80/b Brent is a fair price for both producers and consumers. More recently, some OPEC spoke persons have indicated their preferred level has drifted up to $90/b.
Rigs and Fracs
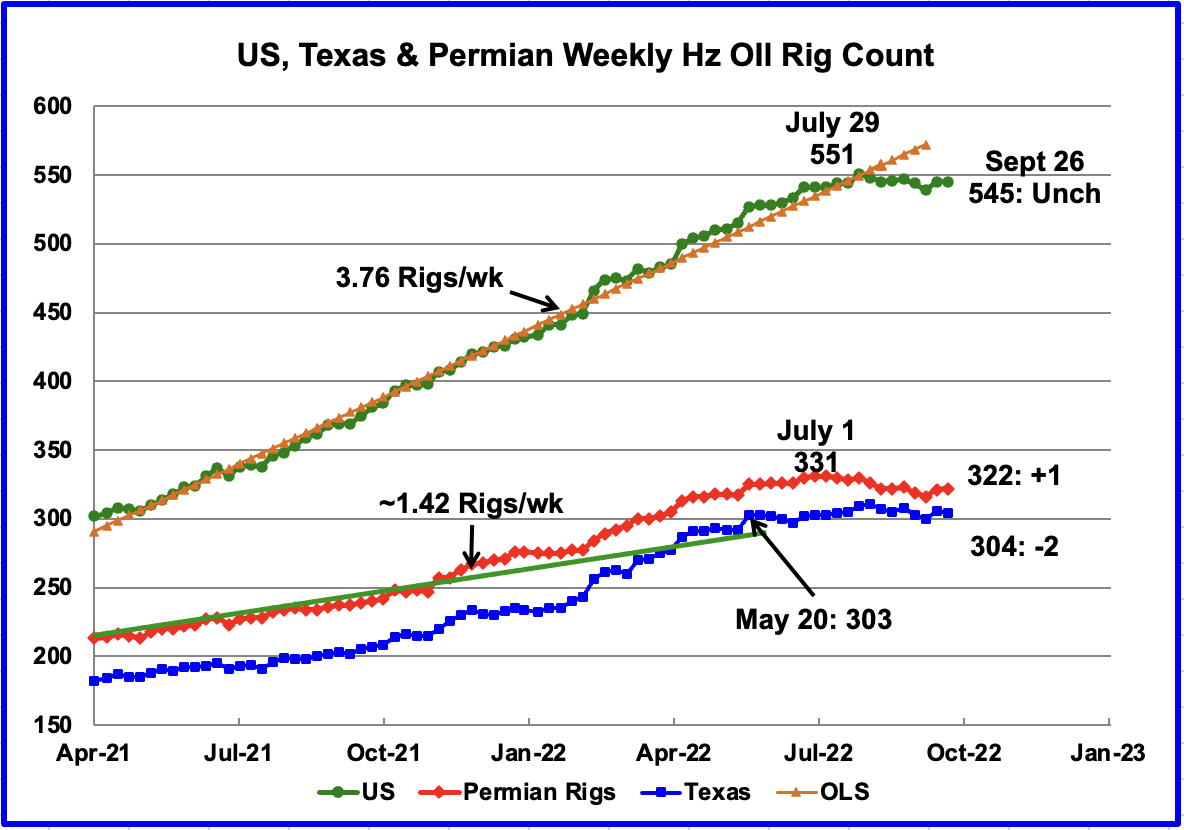
The rig story continues to be that the US Rig count has been holding steady at close to 545 rigs for the past seven weeks. In the week ending September 26, the rig count was unchanged from the previous week at 545. That was down six rigs from July 29 when 551 were operating.
The Permian rose by 1 rig to 322 and is down 9 rigs from a high of 331 on July 1. Note that 59% of the Hz rigs are located in the Permian.
Texas dropped by 2 to 304 and is essentially unchanged relative to May 20 when 303 were operating.
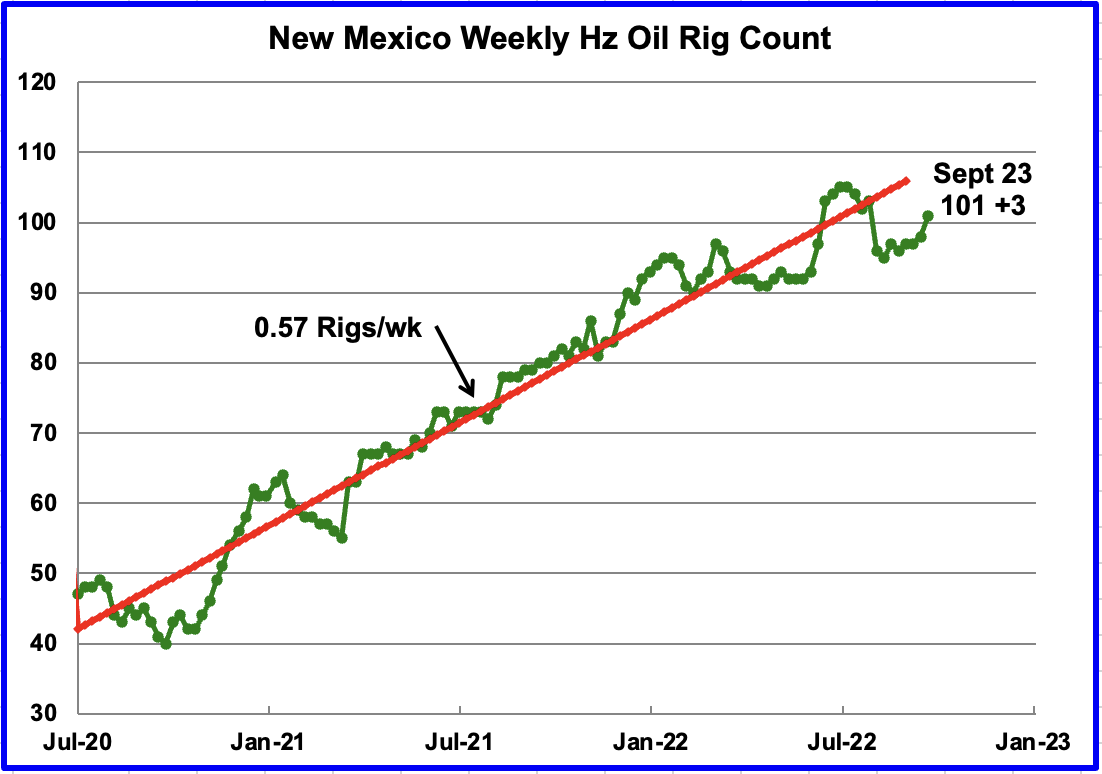
After New Mexico dropped 7 rigs in the first week of August to 96, the rig count has slowly increased to back above 100 to 101. The general trend in the New Mexico Permian has been to add an average of 0.57 rigs per week. This contrasts with the overall Permian trend shown above which has been in a slight down trend.
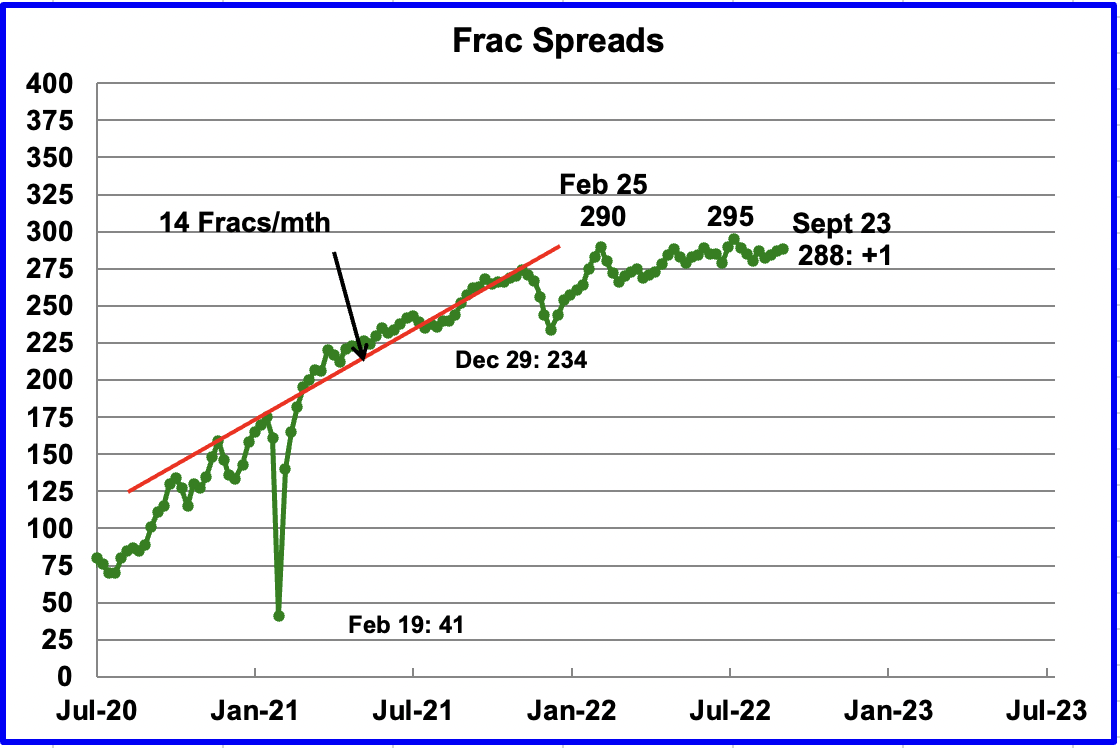
Frac spreads have not shown any growth over the last six months. A high of 290 was reached on February 25 and was not surpassed till July 29, 295. For the week ending September 23, 1 frac spread was added for a total of 288.
Drilling Productivity Report
The Drilling Productivity Report (DPR) uses recent data on the total number of drilling rigs in operation along with estimates of drilling productivity and estimated changes in production from existing oil wells to provide estimated changes in oil production for the principal tight oil regions. The September DPR forecasts production to October 2022 and the following charts are updated to October 2022.
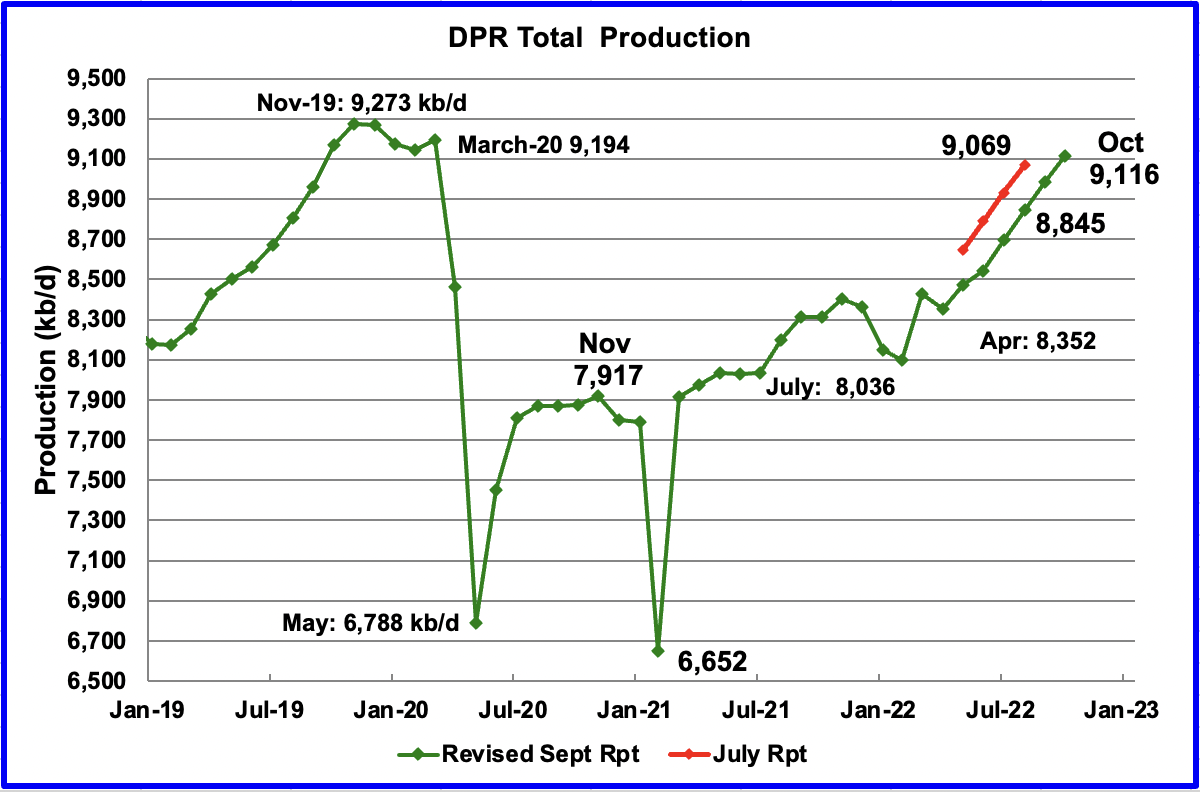
Above is the total oil production projected to October 2022 for the 7 DPR basins that the EIA tracks. Note that DPR production includes both LTO oil and oil from conventional wells.
The September DPR report has downwardly revised the April to September production forecast. The original forecast for August 2022 was 9,069 kb/d. The revised estimate for August is 8,845 kb/d, a downward revision of 224 kb/d. Of the 224 kb/d, 59 kb/d can be attributed to the DPR revising the Bakken April output down by 59 kb/d due to the April/May storm.
The DPR is projecting that oil output for October 2022 will increase by 132 kb/d to 9,116 kb/d. From April’s output of 8,352 kb/d to October’s 2022, output in the DPR basins is forecast to increase by 764 kb/d or by an average of 127 kb/d/mth.
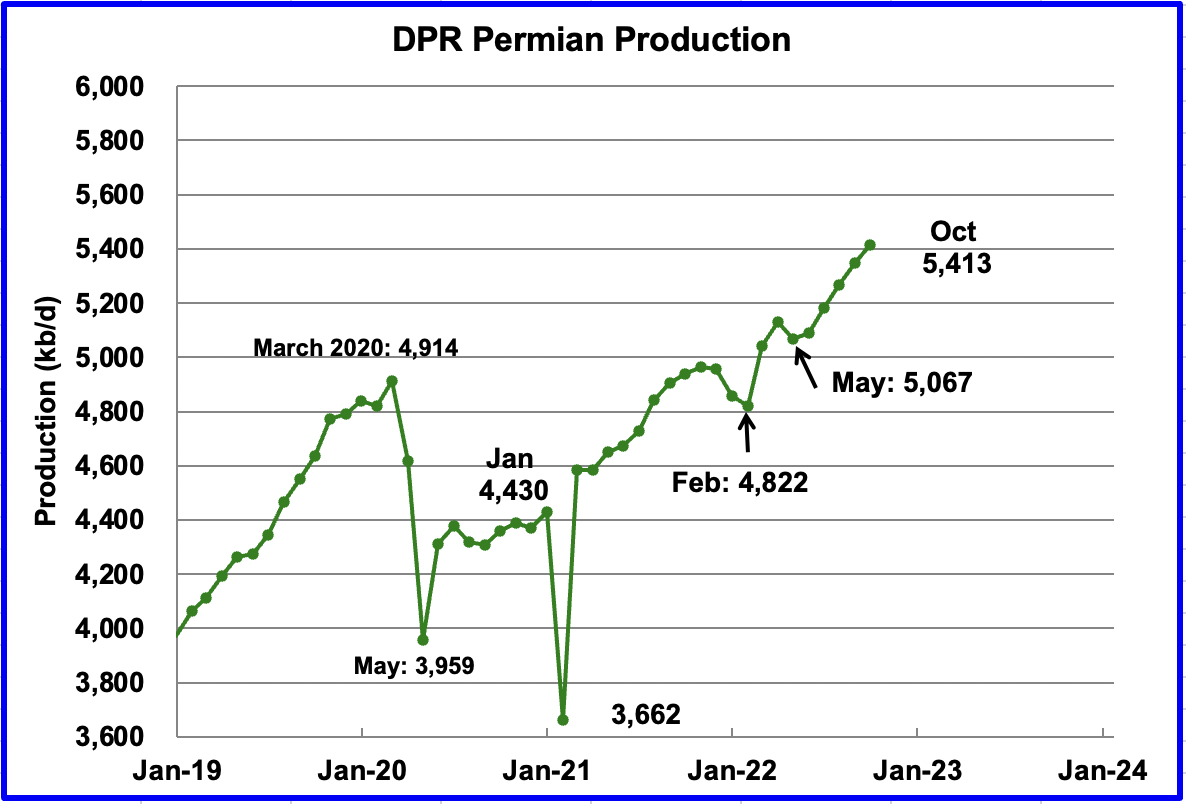
Permian output continues to increase. In October, production is expected to increase by 66 kb/d to a new high of 5,413 kb/d. From May to September, production is forecast to increase by 346 kb/d or at an average rate of 69.2 kb/d/mth. If the Permian were part of OPEC, at 5,413 kb/d it would be the second largest producer after Saudi Arabia.
During August, 416 wells were drilled and 435 were completed in the Permian. (Note that August is the latest data for DUC info). The completed wells added 378 kb/d to August’s output for an average of 870 b/d/well. The overall decline was 292 kb/d which resulted in a net increase for Permian output of 86 kb/d. Of the 435 completed wells, 336 were required to offset the decline. The completion of 19 extra DUCs over the drilled wells contributed 16.5 kb/d of the overall 86 kb/d increase.
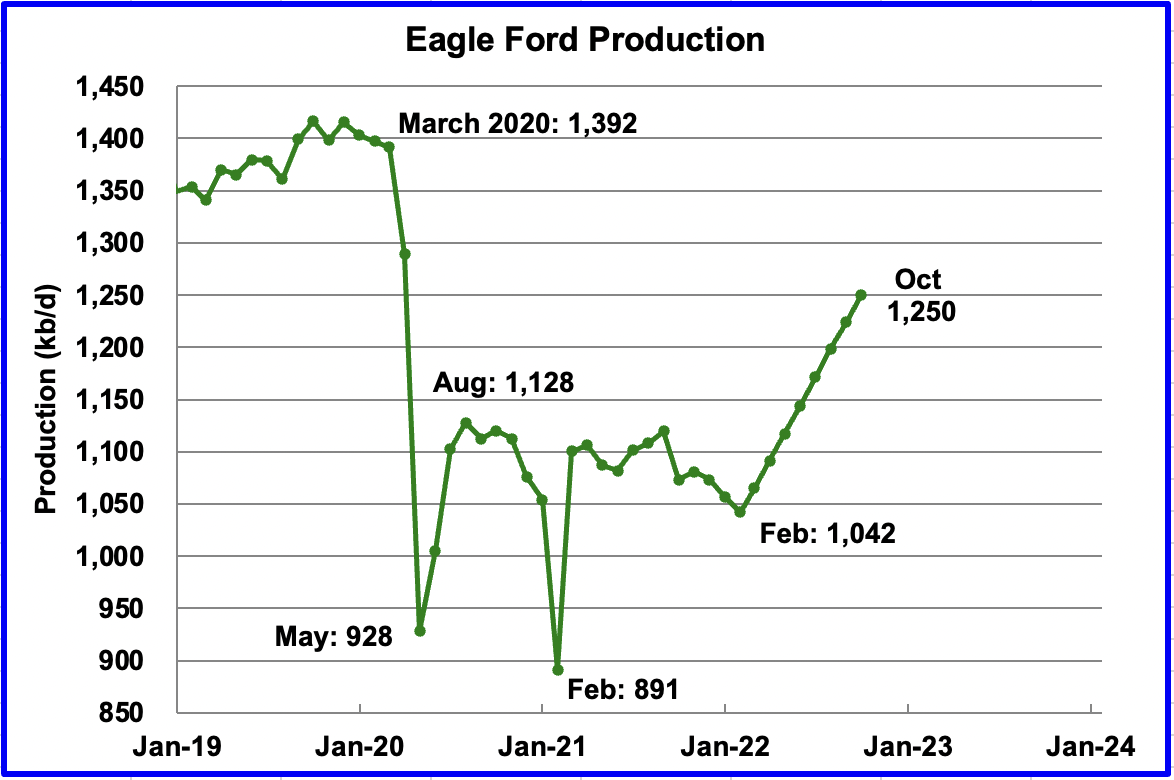
Output in the Eagle Ford basin has been showing an increasing trend since March 2022. For October, output is expected to increase by 26 kb/d to 1,250 kb/d. At the beginning of the year, 43 rigs were operating in the EF. As of September, 66 are operational and accounts for the increasing production.
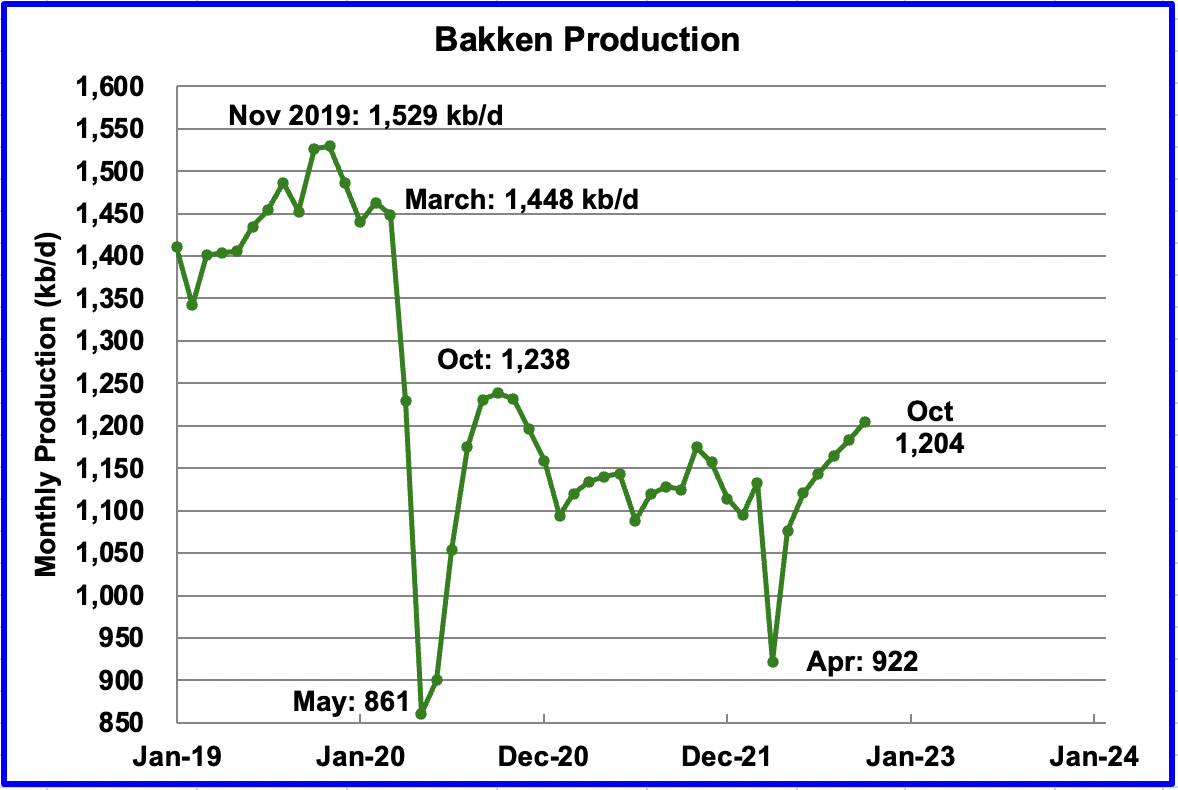
The DPR forecasts Bakken output in October to be 1,204 kb/d an increase of 21 kb/d from September.
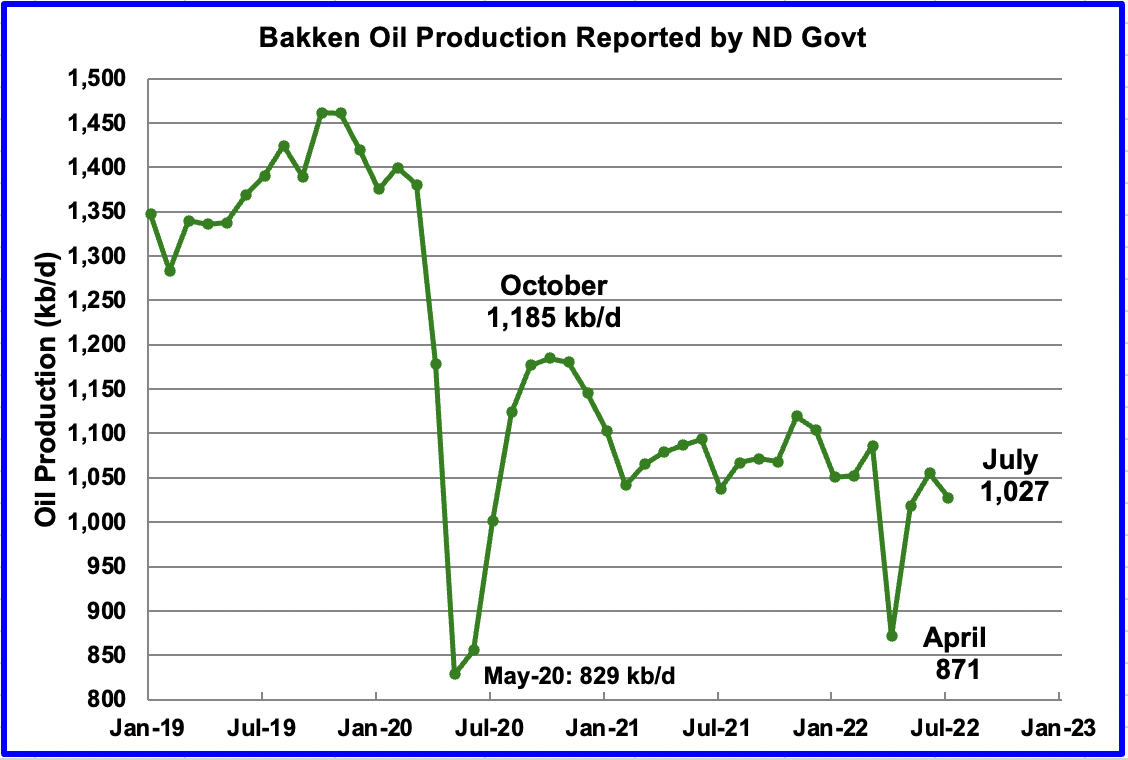
This chart shows the Bakken’s output as reported by the North Dakota government. July production was reported to be 1,027 kb/d down 28 kb/d from June. The DPR Bakken chart above shows July production to be 1,143 kb/d, 16 kb/d higher.
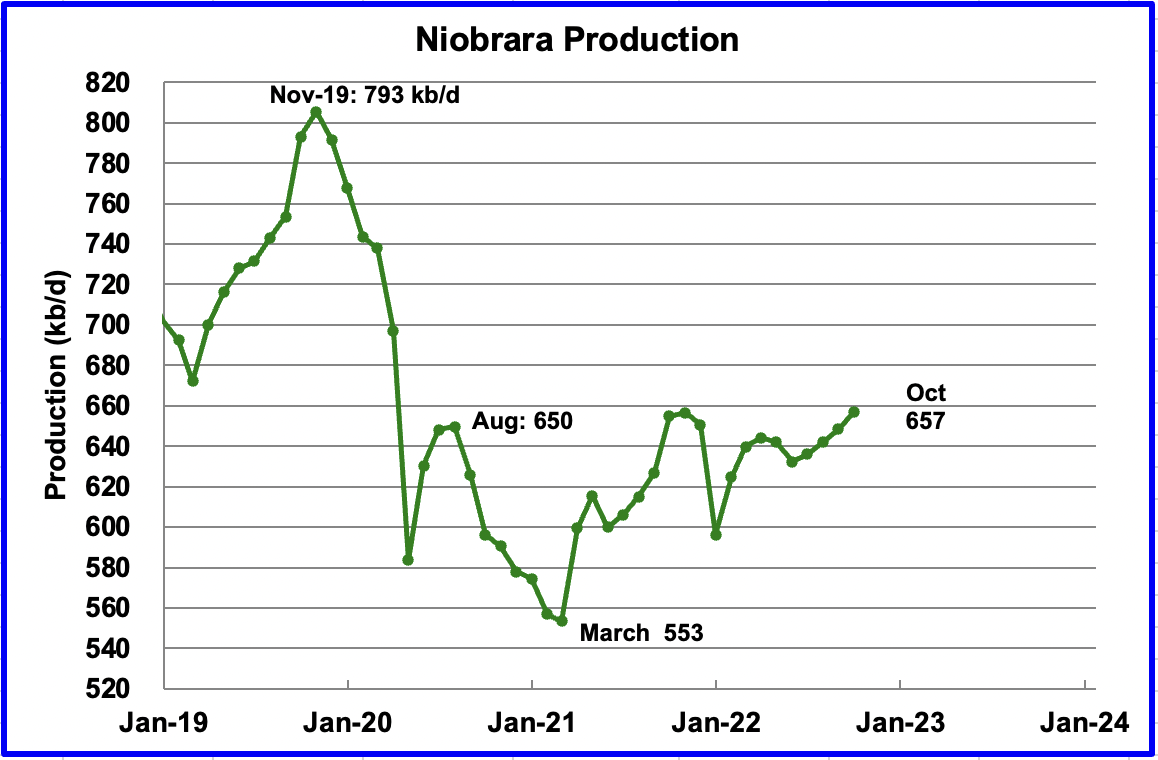
Output in the Niobrara continues to increase slowly. October output increased by 9 kb/d to 657 kb/d.
DUCs and Drilled Wells
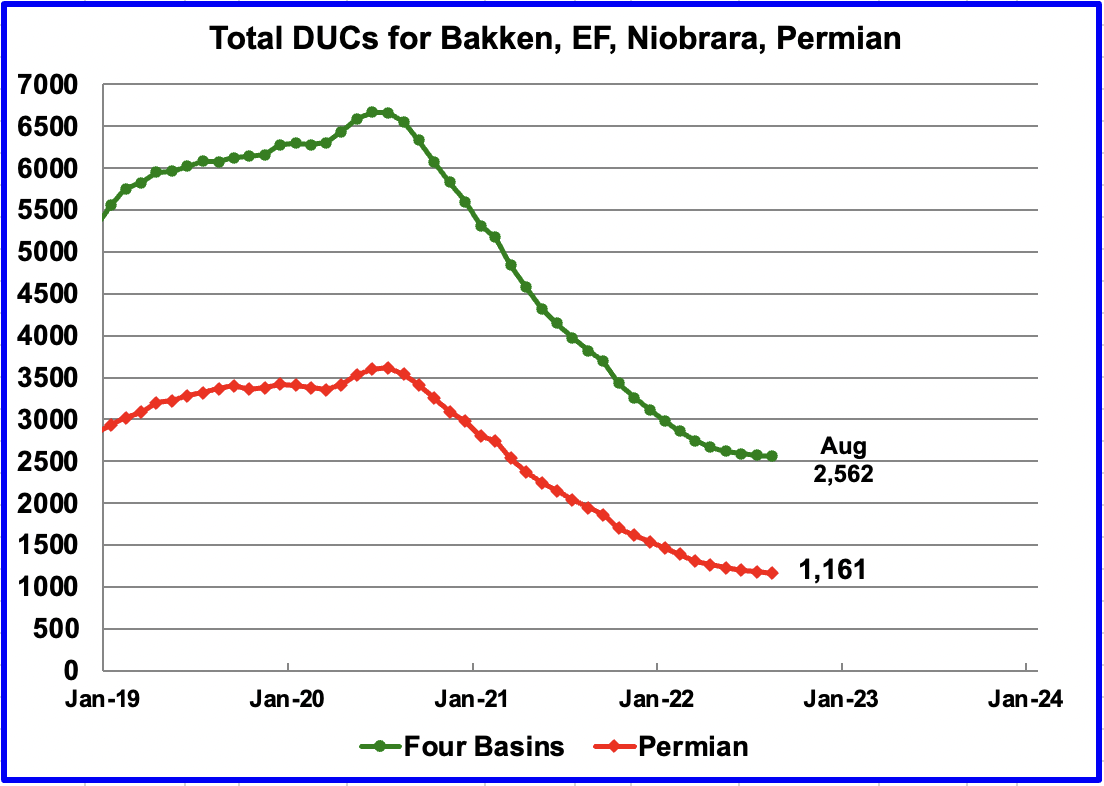
The number of DUCs available for completion in the Permian and the four major DPR oil basins has continued to fall every month since July 2020. Prior to July 2020 more wells were drilled than were completed. The last two data points show how the use of DUCs continues to slow and is further illustrated in the next chart.
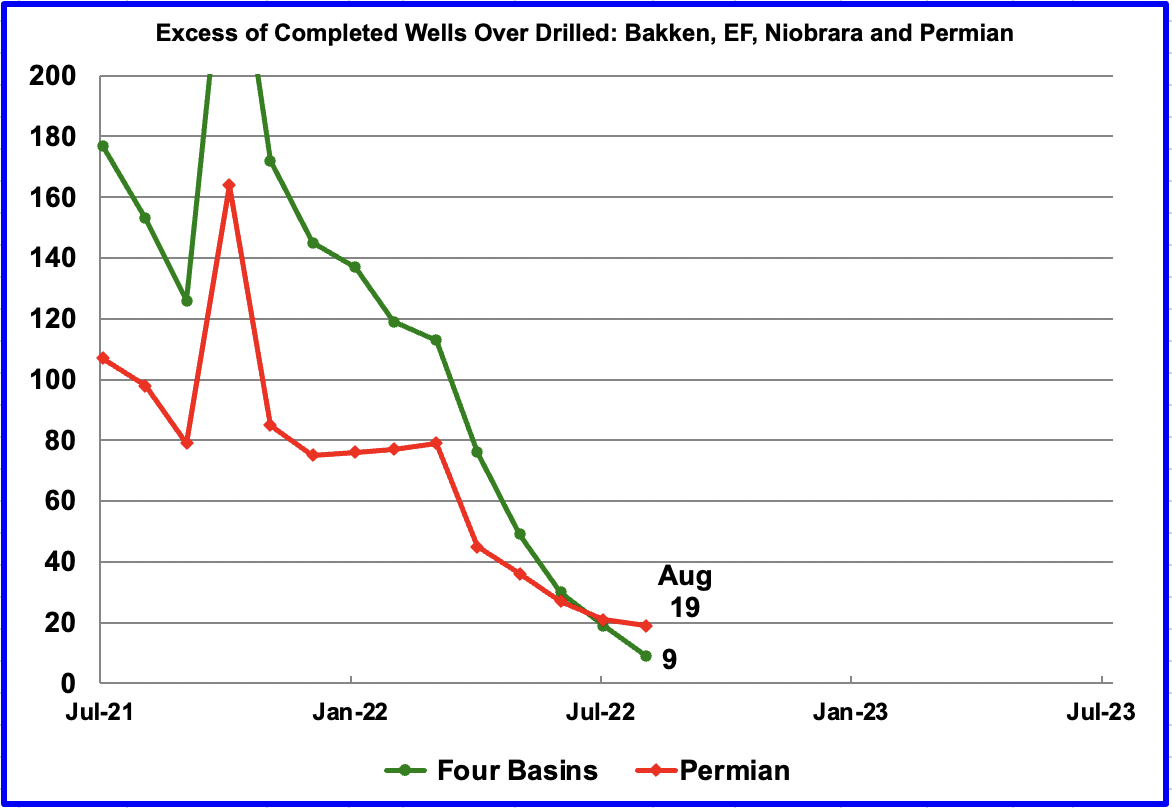
While this chart is titled “Excess of Completed Wells over Drilled”, it could also have been called “Monthly change in DUC completion rate” because the excess of completed wells in a given month is equal to the change in the DUC completion rate.
In these four primarily oil basins, the change in monthly completion rate of DUCs started slowing after peaking in March 2021. In August 2022, 9 fewer DUCs (2,571 to 2,562) remained than in July. Similarly the monthly completion rate for DUCs in the Permian continues to fall. In August, the number of remaining DUCs fell by 19 (1,180 to 1,161). Note that since Permian excess wells were greater than in all four basins combined, a few basins drilled more wells than were completed. For instance in the Niobrara, 119 wells were drilled and 110 were completed.
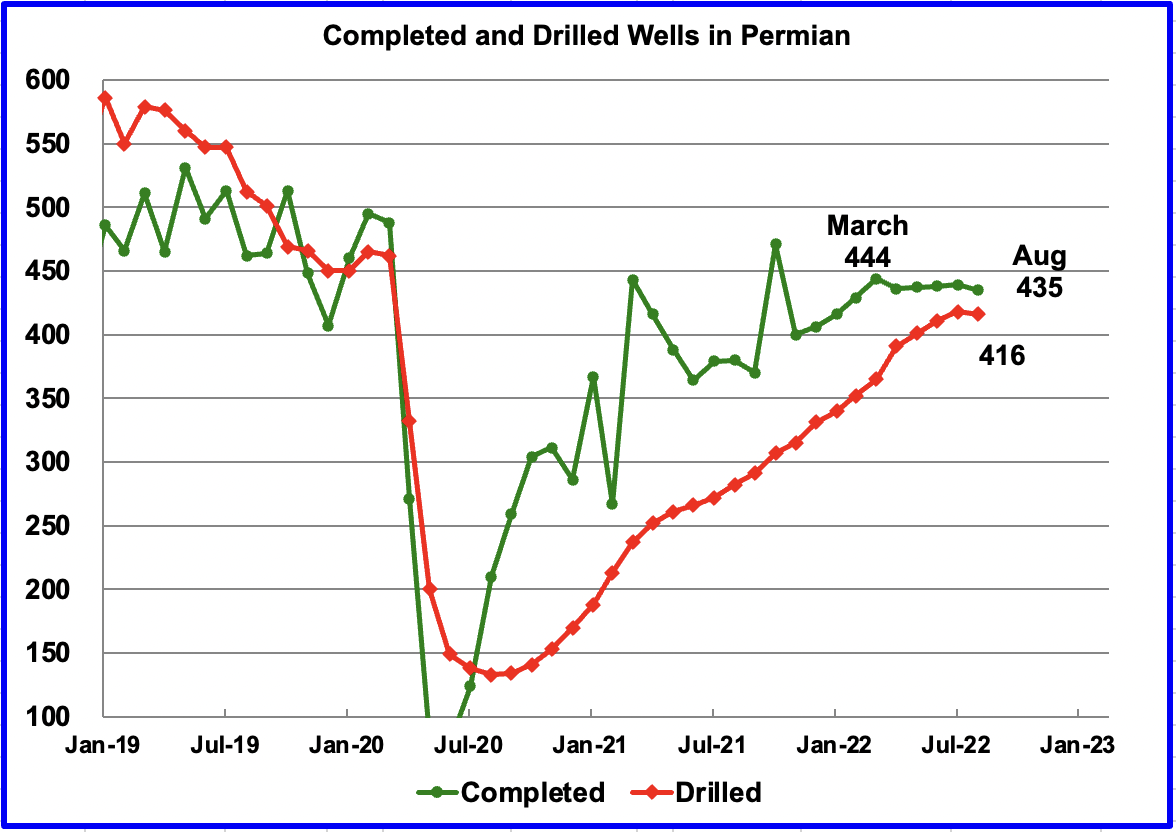
In the Permian, the monthly completion rate has been showing signs of slowing since the recent March peak of 444. This is consistent with the frac spread chart shown above where there has been no growth in frac spreads since February.
In August 435 wells were completed, 4 fewer than in July and 9 fewer than in March. During August, 416 new wells were drilled, a decrease of 2 over July. This is the first time that there was a MoM drop in drilled wells. The gap between drilled and completed wells in the Permian has reached a new current low of 19 DUCs, which is the same as reported in the previous chart.
Something Different: A Plug-in Hybrid Airplane

De Havilland Aircraft of Canada Limited and Pratt & Whitney Canada (P&WC) announced on July 15, 2021, they are joining forces to integrate hybrid-electric technology into a De Havilland Dash 8-100 flight demonstrator.
The Hybrid Electric Propulsion (HEP) technology is expected to optimize performance across the different phases of flight, allowing the Dash 8-100 demonstrator to “target a 30 percent reduction in fuel burn and CO2 emissions, compared to a modern regional turboprop airliner,” P&WC said in a press release.
Overall, the flight demonstrator will feature “advanced technologies” developed by P&WC and Collins Aerospace. Specifically, the Dash 8-100 will include an advanced electric motor and controller from Collins. Additionally, in support of the hybrid-electric technology and batteries within the flight demonstrator, De Havilland Canada will design a modified nacelle structure to house the technology, and will also “be responsible for the cockpit interfaces needed to safely monitor and control” the HEP technology.
Author’s comments: While no details have been announced, the aircraft will be powered by an electric motor turning a propeller. The motor will be able to draw power simultaneously from a large battery and a gas turbine engine running an electric generator. For takeoff, the motor will be drawing power from the battery and the gas turbine engine. At cruise altitude, the turbine will shut down and the flight will continue on battery power.
No details on range is provided but a reasonable guess would be about 200 miles on battery. The gas turbine powered generator would take over to extend the range by an additional 200 to 300 miles. This short range would be useful in Europe, US and China.
I must admit that I was both surprised and pleased to see this announcement.
204 responses to “Norway August Oil Production Rebounds”
Thanks Ovi, well done.
For July 2022 the North Dakota Industrial Commission (NDIC) reports 1027 kb/d output from the Bakken and 1069.5 kb/d for all of North Dakota. The DPR has 1115 kb/d for July, about 46 kb/d too high (the DPR is more comparable to all North Dakota production as 99.9% of it comes from the Williston Basin region, though not exactly because there is som production from Montana as well.)
For June 2022 the NDIC reports 1097 kb/d for all of North Dakota and the DPR has 1093 kb/d, if we add Montana’s production in June (again most of Montana’s oil comes from the Williston basin region) at 63 kb/d (EIA data) to the ND production in June we have 1160 kb/d for Bakken region production which is about 67 kb/d more than the DPR estimate. I do not know what percentage of Montana’s output comes from Bakken Region but I imagine most production may be from there. A quick estimate using data from
https://mineralwise.com/directory/shale-plays/bakken-shale-montana/
for counties in Montana producing Bakken tight oil and
https://www.mineralanswers.com/montana#county-card
for production by county
I get about 76% of Montana oil from the Bakken counties in March 2022.
Assuming this ratio was the same in June 2022, we would have about 48 kb/d of Montana oil produced from the Bakken region in June 2022, so 1097kb/d from ND and 48 kb/d from MT for a total of 1145 kb/d for Bakken region in June. This suggests the DPR Bakken estimate for June 2022 (1093 kb/d) may have been about 52 kb/d too low.
Dennis
Thanks.
Somehow I missed the July Bakken update from ND. I have updated the chart in the post for the ND Bakken to July. As for the July DPR report, I am showing 1,143 kb/d.
In general I find that the monthly DPR reports are high and get revised down almost every month. It is not clear why they can’t fine tune their estimates by comparing their estimates with previous real data.
Ovi,
My DPR numbers for June and July come from the most recent (September) DPR. I agree the most recent few months (September and October) from the September DPR are likely to be revised in the future as more state level data fills in (not every well’s output is reported accurately initially but the data gets updated and revised over time.)
Ovi,
You may want to double check your source for April 2022 Russian output.
See
https://www.reuters.com/article/oil-russia-output-idUSL8N2Z14H1
The Reuters piece gives 10.04 Mb/d for April 2022 and 10.21 Mb/d in May 2022. The figure for April 2022 in your chart may be a crude oil only estimate and might not include condensate. Often in reports on quotas they give a crude oil only estimate because that is what the quota reflects.
>Yeah, 95 million peeps living in poverty it really brings the wages down.
I agree. for example in 1980 here were about 850 million people in China living in absolute poverty. This has change dramatically, as hundreds of millions of those people have gotten connected to international labor markets. That same engagement has also reduced the price of labor worldwide, forcing interest rates down to near zero as central banks scramble to avoid deflation.
Everything’s looks great for Nigeria then… the next China… the more poor people, the better the outlook?
Dennis posted on the OPEC thread: Kengeo,
It confirms that the peak moves forward in time, which is all that I was saying and I believe Iron Mike may have also been saying this. Peak moves from 2027 to 2031 and is slightly higher in the alternative scenario.
No, oil was not “saved for a later day” by the covid demand production drop. That is, countries will not be able to produce more in 2029 because they produced less in 2020. Anyway, most countries were producing flat out in 2022 and what they did not produce in 2020 did not make their wells produce more barrels in 2022. Flat out is flat out regardless of what they did in 2020.
Of course it may be that they may be able to produce at peak a few months longer because they did not produce as much in 2020 but they cannot make their peak any higher. Point is, they are producing today at their maximum and far more of them are declining in production than are increasing in production.
Anothr point, not all countries decreased productionn in 2020, many of them just kept right on pumping flat out. And all but a very few producers had, by early 2021 returned to maximum production. And, for the vast majority of them, that return to maximum porductioncapacity, was well below their pre-covid production level.
Ron,
We will see. I focus on World C plus C output, which is likely to continue to increase in my opinion.
Yes, that is my guess also. Well, that is C+C will continue to do what they are doing. But they are declining, not increasing as you say. Below is the world less the OPEC big 5, Saudi, Iran, Iraq, Kuwait, and UAE. As you can see, they are declining, not increasing. The OPEC big 5 peaked last month, August 2022. Russia is undeniably in decline, and the USA is the only wild card. I think they will soon plateau, but even if they do not, they will not even be close to overcoming the decline in the rest of the world.
The chart below is through May 2022.
Click on the chart to enlarge.
Ron,
As I said, I look at World output rather than a select subset of producing nations. If we consider World output we have the following chart. Future growth will be a slower rate, perhaps 1500 to 2000 kb/d per year for 3 years and then 500 kb/d for three more years before reaching the final centered 12 month average World C plus C peak in 2028 at around 85000 kb/d.
Dennis wrote: Future growth will be a slower rate, perhaps 1500 to 2000 kb/d per year for 3 years and then 500 kb/d for three more years…
Dennis, I think you missed the entire point of my chart. Though while there are a few countries still increasing production, very slightly, taken as a whole, they are in very obvious decline. Therefore all that growth must come from the Big 5 and the USA. And that while the rest of the world, including Russia, is in steep decline. Think about that Dennis, think real hard about that. Then I am sure you will come to the only reasonable conclusion you can possibly reach. It just ain’t gonna happen.
Ron,
I disagree. A lot of the decline in your chart comes from Venezuela and Nigeria, they have both fallen very fast over the May 2015 to May 2022 period, that rate of decline is unlikely to continue. Chart below has World C plus C less big 5, US, Russia, Venezuela, and Nigeria from May 2015 to March 2020. The average annual decline rate for this group of oil producers is 19 kb/d per year. This is not a very high annual decline rate in my view (19/32000 or about 0.06% per year ).
Ron,
Chart for World less (big 5, US, Russia, Venezuela, and Nigeria) for May 2015 to May 2022 using monthly C plus C data from EIA, in this case when we include the pandemic and recovery following the pandemic the decline rate increases to 191 kb/d which is an average annual decline rate of 191/31203 or 0.6%.
Dennis, I could not make heads or tails of your charts so, as usual, I made my own.
As to Venezuela, they are not coming back, not in the next decade or two at least. And Nigeria is in continuing decline due to several reasons.
Nigeria Is Producing Less And Less Oil; Here’s Why
Basically, they have many, many problems and they are not likely to ever come back. Nigeria is becoming a failed state. Not there yet, but soon will be.
Click on chart to enlarge.
At any rate. Why on earth would you think removing Venezuela and Nigeria from the mix would make any difference? Even without these two, the rest are still in decline. And when Russia starts to decline in earnest, they will decline much faster.
Ron,
I am not suggesting that Venezuela or Nigeria will increase their production, only that they are not likely to decline as fast in the future as they have from 2015 to 2020. In fact from June 2020 to May 2022 Venezuela and Nigeria have had an average annual increase in output of 70 kb/d rather than the annual decrease of 432 kb/d they experienced from Jan 2015 to Jan 2020. The annual decrease for all of Jan 2015 to May 2022 for Venezuela and Nigeria was 420 kb/d.
The main point is that most of the decline in your original chart was due to Venezuela and Nigeria. From Jan 2015 to May 2022 the average annual decline rate was 191 kb/d when we do rest of world without Venezuela and Nigeria and it is 628 when rest of world includes Venezuela and Nigeria (about 3.3 times larger). In other words, the decline is more than 3 times less steep if we take Venezuela and Nigeria out of the mix.
My expectation is that future decline from Venezuela plus Nigeria will be much lower than it was from Jan 2015 to Jan 2020.
Also for your chart above Russia is not included and decline in Russia will be offset by increases from the big 5 and US in my opinion.
Nigeria’s economy is seven time the size it was 20 years ago. It is one of the world’s fastest growing economies. Not sure how you get from an economic boom with few precedents in world history to failed state.
It’s oil business is in bad shape, but that’s 20th century business, and it mostly corrupted the country. Nigeria is better off without it.
Of course, most of Nigerian exports are oil exports, so losing the business overnight would be painful, but in fact it’s just a distraction from the country focusing on its long term strengths, especially cheap labor.
Yeah, 95 million peeps living in poverty it really brings the wages down.
https://guardian.ng/news/2023-poll-apc-pdp-rendered-nigeria-world-poverty-capital-alleges-kachikwu/
Dennis –
You are implying that the covid-related recovery should continue to be projected into the future? If so, why are the last 4 data points plotting the opposite direction (downward)? It’s silly to cherry-pick data and make other claims that can’t be substantiated. It’s almost October, so 75% of 2022 oil production is in the books (or almost), here’s where it stands:
July 2019 – June 2020 – 12.2 MBpD
July 2020 – June 2021 – 10.98 MBpD
July 2021 – June 2022 – 11.5 MBpD
Highest recent 12 months of production was Apr 2019 thru March 2020: 12.5 MBpD, in comparison, the highest production in the past 12 months (11.8) is still lower than the lowest production (11.9) in July 2019…
A more wholistic point of view:
Peak Production in late 2019:
OPEC: 29.0 MBpD
Non-OPEC: 52.5 MBpD
Total late 2019: 81.5 MBpD
Recent Production in mid 2022:
OPEC: 29.6 MBpD
Non-OPEC: 49.0 MBpD
Total mid 2022: 78.6 MBpD (3.6% lower than 2019 peak)
Looking further back, you would notice an OPEC plateau of 31.5 MBpD between 2016-2018. For Non-OPEC the plateau of ~50.5 MBpD occurred 2018-2019. Adding the 2018 peak we get a max. production rate of 82 MBpD, meaning current production >4% lower than the 2018-2019 peak…
At the Covid low point (May 2020), production of OPEC/Non-OPEC totaled just under 70 MBpD, nearly 20% lower than the 2018-2019 peak…
It’s also worth noting that OPEC has essentialy been on a 20 year long 30 MBpD plateau, so don’t think that’s going to change any time soon…unless it’s downward…
To quote Ron: Non-OPEC production keeps dropping …no other countries are in any position to make up for that decline…
Kengeo.
For the past 2 years that we have data for for the World (May 2020 to May 2022) the average annual increase in World C plus C output has been about 4800 kb/d.
Note that I did not suggest output would continue to increase at that rate. I suggested and average rate of increase for the next 3 years of 1750 kb/d (a rate that is 2.74 times lower) followed by an average rate of increase of 500 kb/d for the following 3 years (a rate that is nearly 10 times lower). The average annual rate of increase over the next 6 years would be about 1125 kb/d per year, a rate that is about 4.3 times lower than the annual rate of increase since May 2020.
My guess is likely to be incorrect in the details, but reality is likely to be within +/- 20% of my expectation.
Kengeo,
Well let’s not cherry pick the last few years then. Here I have “cherry picked” Jan 1982 to May 2022, the average annual rate of increase over that period has been 753 kb/d. If the trend continues output would reach 85 Mb/d in 2025, but I do not expect output will continue to follow that straight line trend.
Kengeo,
We could also consider World C plus C output from 1910 to 2021 so as to not cherry pick data from only 40 years. In that case the linear trend is as shown in the chart below.
Where would you like to cherry pick your data?
Kengeo,
There is no doubt that currently output is below peak output. As to non-OPEC output dropping, one has to do some serious cherry picking to make that statement true. From 2013 to 2019 the average annual rate of increase was about 750 kb/d for non-OPEC output and more recently (Jan 2021 to May 2022) the annual rate of increase for non-OPEC output was about 1100 kb/d. I know many will claim that future non-OPEC output will drop and eventually that may be correct, some time after 2028.
I can imagine the world getting by with 1/2 of the amount of oil that it now uses.
Its not that hard since so much of the oil is wasted or poorly combusted or used for purposes that are not important to living.
‘Getting by’ means different things to different people.
I assume that peak energy will be followed by peak GDP and by peak population.
It would be smart for humanity to get that eventuality in their collective mind and begin to rapidly adjust plans and forecasts. False expectations (perpetual growth in the setting of declining energy supply and degraded environment) can be a big source of disappointment.
of course GDP is a silly measure of economic health or growth, since it includes so many irrelevant components that distort any clear view of actual propsects. That includes all transactions involving finance, tax, real estate, art, non-industrial gold, fashion, insurance (which includes all spending on military hardware, unless perhaps it is actually used and then it becomes a negative factor on GDP), for example. All of that is just ‘money’ sloshing around but accomplishing nothing. National purchasing power of individuals excluding the top 10% wealthiest would be a better measure of gross domestic national economic strength for any country…or something along those lines.
Dennis wrote: There is no doubt that currently output is below peak output.
No doubt about it Dennis. You finally got something right. 🤣 Peak Month was November 2018, the Peak year was 2018, and the peak 12-month average was February 2018 to January 2019. We are way below all of those peaks and always will be.
Ron,
Always is a long time. I think the World C plus C centered 12 month average peak in July/August 2018 of about 83 Mb/d will be surpassed between 2024 and 2028. But I have never said the 2018 peak would be surpassed by 2022 since the pandemic became evident in 2020. There is a lot of room for US tight oil to grow, particularly in the Permian basin until about 2030 (when I expect output in the Permian basin to peak).
You should update your international data from the EIA, the current 12 month peak is 83000 kb/d in August 2018 (for centered 12 month average) or Feb 2019 (for those who prefer a trailing 12 month average.) Peak year was 2018 but average was 82974 kb/d and peak month was Nov 2018 with output of 84526 kb/d.
Dennis –
Let’s pretend your hypothesis is that oil production DID NOT PEAK within past 5 years. Does showing only 1.5 most recent years of data accomplish this?
It’s worth noting that forecasts for US oil production are marginally higher than current production, which I think you realize and I also think you realize they are overly optimistic. Not sure why you think that US production would take a couple years off and then steam ahead at some later date. Anyhow, I think looking at 2018 data and onwards does a pretty good job of showing current predicament (world is losing ~1.5% production annually). All things point to this downward trend accelerating…
As I’ve said before, how can you expect world oil production to go up when it’s currently going down????
The cheap oil ended in ~2005, so no need to look at data older than that. Between 2005 and 2020, various countries peaked such that the world peaked Nov. 2018…nothing points to that peak being challenged anytime soon…arguably, if somehow production could increase by 1 MBpD each year, it would still take ~5 years to reach a new peak…
Dennis, my international data is up to date. I copy the entire EIA Excel data and just paste it into my spreadsheet. I update it once every month on the day the data comes out. It was updated on September 3rd if memory serves me correctly. I will update it again early next month when the new data comes out.
I don’t bother with centered averages. The 12-month average is the average for all the previous 12 months. So in my estimation, that is the 12-month high.
Ron,
When the data first came out there was a problem with it. I emailed EIA to ask about it and they confirmed that there was data processing eror which had been corrected. You have not updated your data since I emailed you about this and if you checked the data at the EIA you would see that I am correct.
For anyone who would like to see the correct data it is at the link below.
https://www.eia.gov/international/data/world/petroleum-and-other-liquids/monthly-petroleum-and-other-liquids-production?pd=5&p=00000000000000000000000000000000002&u=0&f=M&v=mapbubble&a=-&i=none&vo=value&&t=C&g=none&l=249–249&s=94694400000&e=1651363200000
Yeah Dennis, I completely forgot about that. But I did upload the correct data a few days later when it was corrected.
There is a far shorter link to the data, rather than that long one you quoted. It is:
https://www.eia.gov/international/overview/world?src=
It works, I promise, and it is the same data you get with your link.
Kengeo,
If you think 4 years which includes one year where OPEC was resticting output (2019) and one year (April 2020 to March 2021) was a period of low output due to low demand due to pandemic will give a reliable result, that’s fine. We will see where output is in 2 years. Can you tell us what you believe the average level of World C plus C output will be in 2024? By the way do you seriously want to claim that two years of data is “cherry picking”, but 4 years of data is not? Below we have a shorter period from Jan 2000 to May 2022 because it seems that now you don’t like too much data to be included.
Finally you have noticed that there have been many times in the past where output has peaked, then output decreased and then surpassed the previous peak in the future. I guess the question would be why would you expect this would not happen.
Hubbert linearization suggests a URR of 3200 Gb with a peak in 2026. Lots of analysts including Jean Laherrere have come up with URRs that are even larger than this (3500 Gb). I don’t think the Hubbert model will be followed as the Logistic is just a special case of a more general model. See Mathematical Geoenergy for an explanation of this result.
Hi Ron,
When I click your link I just get the intitial page for international data. My link takes someone unfamiliar with the EIA website directly to the monthly data for World C plus C from Jan 1973 to May 2022.
Were you working from an older spreadsheet, because the data in your comment was different from what is at the EIA?
Yeah, I noticed that the latest data was off by about 18 K bp/d from what the EIA posted earlier this month, after the correction of course. Apparently, they update the data during the month. That is not a problem because the changes are not enough to make a difference.
I don’t have a problem with the EIA data. After all, how can I because that is all the data we have for total world production?
Kengeo,
Note that my hypothesis is not that 2018 is not a peak year for oil output.
It is simply that there is a very different trend from june 2020 to may 2022 than the period from August 2018 to May 2020. There are simple statistical tests that can be used to prove this, though it is obvious from looking at a chart.
Dennis – For short term (next 12 months), we can expect a decline of ~1 MBpD (~1.5%). Sometime in 2023/24 I believe the decline rate will double or more to ~4-5% and maintain that for at least 5 years and then drop back to a decline rate of ~2% after 2030.
I believe a big driver of this will be US decline and inadequate investment for replacing the reserves. By 2027 I believe US production will be around half of what it currently is. Russia and Saudi Arabia will also be down 25-30% from current levels by 2027. So while you see a return to the 2018 peak rates I see a considerable decrease with overall production about 10 MBpD lower than current levels.
In order of likelihood, some options for consideration:
– Continuation of the existing trend: 1.5% annual decline in world production rate.
– Low decline rate/no decline rate: 2027 production nearly the same as 2022 (continued plateau scenario).
– Annual oil production growth rate of 1 MBpD, reaching new peak in 2027/28 (this implies a URR of ~3300 Gb, well above the most optimistic 2PCX value of ~3100 Gb
(1500 produced + 1570 remaining).
Since you love to pull the URR card, here’s why URR makes no difference:
For 3000 Gb, 50% would be 2022 (this year).
For 3100 Gb, it would be next year.
For 3200 Gb, it would be 2026.
If truly optimistic, then you could use 3500 Gb and it would be 2030.
This is all well and fine but it ignores critical data (proven reserves estimates). It also ignores past 20 years of history (end of cheap oil occured in early 2000’s).
If we were to take the average of the most likely estimate in existing fields (2P) and the additional mean contingent (2PC) then we would come up with remaining reserves of only 880 Gb.
Adding the 1500 Gb produced to date, we come up with a total URR of only ~2400 Gb, giving us a year of ~2011 for 50% URR…this is important as it correlates well with many countries that have already peaked…
If we take the full 2PC value, we still come up short (1500 + 1200 = 2700, giving a 50% date of ~2017).
If we take the full 2PCX value of 1570 Gb, we come up with a URR of 3070 Gb and gives us a 50% URR date of 2023.
No matter how you slice it, there is no way that global production can go up after 2022.
Hopefully this makes sense to you, obviously you are going to say something ludicrous like, well maybe URR is 4000 (peaking by 2040), or maybe its 5000 (peaking by 2055).
There’s also another more concerning option, it’s that URR is actually much lower than most estimates point to; that 1P is actually what is left and that due to some of the super giant fields, we are actually able to produce them more efficiently and the peak is not at 50% URR but more like 75-80% URR. Example would be 1500 Gb produced and ~300 Gb remaining, the global peak is ~2017 with 75% URR (1800 Gb).
I don’t think there is an argument to be made for keeping production flat, we simply don’t see that happening, I appreciate your willingness to hash it out, it’s clearly important discussion and timely (either way we are at peak oil +/- minus).
Visual aid:
Nigeria government estimates 200,000 to 400,000 barrels a day of oil theft. That is not local villagers carrying the stuff away in jerry cans, but must involve tankers moving it to international markets. Similarly, the Kurds are pumping as hard as they can on Syria’s oil fields with out registering it as a component of world supply. How many more clandestine operations are going on around the world? Are there any estimates of the total unaccounted production? Is it prudent to assume a constant level of clandestine production year after year?
Kengeo,
Peak does not always occur at 50% of URR, the estimates for URR have tended to increase over time, Jean Laherrere had conventional oil URR at about 1800 Gb in 1998, more recently he estimated conventional oil at about 2600 to 3000 Gb. In 2000 the USGS estimated conventional oil URR at about 3000 Gb, unconventional oil URR will be at least 200 Gb.
Also note that a logistic model suggests a peak of about 2026 under a scenario where there is no pandemic. There was in fact a pandemic and oil production was cut back due to low demand. The barrels not produced when less output is produced due to low demand can be produced later. Leaving the URR estimate unchanged at 3200 Gb and accounting for lower production in the 2020 to 2026 period (relative to a logistic type model) pushes the peak to a later date of about 2031. Note that my model does not use the logistic, it uses a more general model based on oil discovery, past production, and the development cycle for discovered resources. The URR of my model is about 3000 Gb with about 2800 Gb of conventionl oil and 200 Gb of unconventional oil.
Chart below has a conservative model (tight oil maximum output is lower than I expect by about 2.9 Mb/d and the extra heavy oil model is also very conservative.) with conventional oil on right axis and unconventional on left vertical axis. The peak for conventional oil in the model is 2016, but there is a secondary peak in 2030 and unconventional oil is on a peak plateau from 2027 to 2039. Peak for World C plus C is 2029 when we add the conventional and unconventional together.
What seems to be confounding you is that there are two separate models whose peaks do not coincide. Also production rarely follows a logistic type curve.
Dennis – Thanks for the graph, I’ve added your model data for comparison. It looks like the second peak occurs at 60% URR, taking the average of the two peaks we get a date of roughly 2024 and URR closer to 50%…time will tell. I would say that if in 6-12 months world production is >77 MBpD then your model stands a chance, if not, then down we go…
Dennis –
I’m particularly interested in where you think the following countries will be production-wise in 2026:
Russia-above or below 9 MBpD?
China-above or below 2.5 MBpD?
Brazil-above or below 2.0 MBpD?
Norway, Mexico, and Nigeria-above or below 1.0 MBpD?
Angola and Libya-above or below 0.5 MBpD?
Answers to these questions can cut an additional 5 MBpD from current production…so not sure how you are factoring those into your model…if not factored in then there’s a good chance any gains you see coming down the road will be swallowed up by these declining countries…
Kengeo,
I don’t try to forecast output for every nation in the World, some nations will increase others will decrease, it is the overall total I focus on. Trends sometimes change and it is impossible to predict when and by how much. Chart below has cumulative output for a scenario that peaks at 85 Mb/d in 2030. In this scenario I assume unconventional oil output increases gradually (by about a 338 kb/d annual rate of increase) from 2023 to 2035, in 2030 unconventional oil output is 14.4 Mb/d and in 2035 it is 15.9 Mb/d from a 2022 level of 11.7 Mb/d.
Ovi —
I’m not sure if this is relevant to your post but according to my Norwegian niece, a petroleum reservoir engineer, the emphasis in Norway now is to maximize gas production (as opposed to oil). The reason for this is because its partners, the EU and the UK, are scrambling for gas supply. For example, a new field development just approved includes a development plan for the third phase of the Ormen Lange field; production at Ormen Lange Phase 3 is expected in 2025 which will expand the recovery rate from Ormen Lange roughly 75 percent which will help maintain gas supply to Europe from the middle of this decade. There are many other new gas production developments of course.
Doug
In my previous post on Non-OPEC production, Sept 10, under the Norwegian chart, I note the following: “According to OPEC, the continuing drop was due to summer maintenance in offshore platforms and some operators prioritizing gas production.”
So the OPEC quote confirms the Info provided by your niece. Also the price of NG is so high in Europe that it makes more sense to expand NG production. It’s a double win, strategically for Europe and economically for Equinor.
Doug L,
I don’t think the “gas first” at the expense of oil production really was very useful. Some of the oil fields depended on gas lift injection to enhance production rates. So if the math is 90-100 dollars a barrel for oil and 200-300 dollars a barrel for a liquified gas barrel, it begs to question if it is worth trying to to increase gas production at the expense of oil production. And it is absolutely not worth it, not very sensible. The policy is most likely reversing as we speak.
Olaf Schultz went on a begging tour for natural gas. He went to Norway, Canada and the finally to the Middle East (UAE first). For Norway I would guess that the narrative was to use the smaller off the shelf projects to ensure stable production over several decades to maintain the given production rate rather than trying to expand anything. Probably the lack of a major offshore gas field to invest in is the problem and the several small and medium sized is needed to facilitate current infrastructure instead.
Prospects are much better when it comes to oil going forward in Norway for a long time. Probably with an exceptionally long production tail, given the wast coast line and given that it is logistically and economically easier to build the necessary infrastructure for oil.
This shows gas sales from Norway. It doesn’t look like any of the main fields have increased production above design limits, which would be difficult in a few months only, but Troll is back to it’s maximum. The recent additions have been a restart of Snohvit and an addition of a small field in the Skarv area (I can’t remember the name, might be Idun something).
A figure to save for those interested.
Here is just one of the reasons sanctions will devestate Russian oil production even if they are able to sell every barrel they can produce.
Sanctions Threaten Russia’s Next Huge Oil Field
Vostok Oil, a vast patch spread across inhospitable terrain in Russia’s far north, faces setbacks without Western cash and imported technology
These are boom times for the Russian oil-and-gas industry. High energy prices are keeping the country’s economy afloat and funding the war in Ukraine. How long it lasts will depend in part on a massive Arctic oil project that Russia promised would save the world from an energy crunch.
Vostok Oil, a vast oil patch spread across inhospitable terrain in Russia’s far north, is supposed to produce a premium, easier-to-refine type of crude that would account for as much as 2% of daily global output at the end of the decade. Last month, the head of Rosneft Oil Co., Russia’s state-aligned oil major, compared it to Noah’s Ark because it would save humanity.
But the development relies on Western cash and imported technology. At least two important Western financial backers are planning to pull out of the $180 billion project, while sanctions have delayed or restricted everything from drilling equipment and software to ice-class tankers, according to people familiar with the matter, companies involved in the project and energy consultants.
“Right now Russia is benefiting enormously from high prices, but that is short-term gain versus a long-term loss,” said Daniel Yergin, the energy historian and vice chairman of S&P Global.
There is a lot more to this article but you will need to click on the link to get there. The bold title in blue is the link. Just click on that.
Ron
Our discussion regarding sanctions was over the next six months where I think there will be minimal impact from them. Six years is a different discussion.
Really Ovi, I was just posting the news. It was not intended to be part of any previous discussion.
That being said, sanctions are affecting current Russian oil production. Sakhalin Island is producing over 200 K barrels less than before sanctions, about one fifth of their pre-sanction level. That is the case in many other places in Russia. To assume that sanctions are not affecting today’s Russian oil production is totally not realistic.
Ron
Let’s see what happens between now and the end the year. I think it will bounce around where it is now.
Ovi, export sanctions do not kick in until December 5th. Any decline between now and then will be due to field production problems due to foreign firms pulling out and sanctions against technology and spare parts imported into Russia. That is what you are seeing right now and that is all you are seeing right now as Russia is free to export every barrel they can produce.
No, it will not bounce around from where it is now. It will be a slow but steady decline from August production levels. Then beginning in December, you will see much steeper declines.
Ron
Great. We now both have a clear position.
I am now in this strange position of having said that it will hold steady but hoping it will fall so that P gets less revenue to finance his war.
Ovi,
What we expect and what we hope for are often not the same. I hope Ron is correct that 2018 is the peak for World output (centered 12 month average), but my expectation is that World C plus C output will surpass the previous peak (83 Mb/d for 12 month average) in 2026+/-2.
Dennis, your timeline of 2026+/-2 gives a lot of latitude to the peak. However, I said earlier this year that we would know later this year which way things are heading. I think we know now. I think it is as obvious as the nose on your face.
But… but… even you will know by the middle of next year what most of us know right now. We… you… will not have to wait until 2026+/-2.
Ron,
That is not the prediction for the peak, it is when the previous peak is surpassed, that is the time frame when oil output exceeds 83 Mb/d for the centered 12 month average.
As to what we know the middle of next year will depend on many factors, if output is relatively flat we would not know if the next move is up or down and we would be exactly where we are now. In fact given the current economic outlook, that seems likely. If demand and oil prices are low we might even see a moderate decline in output. Below I have created a conservative shock model with a low tight oil peak of 9 Mb/d. URR is under 3000 Gb, note that extraction rate is from proved developed producing conventional oil reserves, unconventional oil is modeled separately, conventional oil URR is 2800 Gb for this model and unconventional oil URR about 190 Gb. The model is for crude plus condensate.
Dennis, I just reloaded my EIA world data, it had changed quite a bit since my last reload early this month, (after the correction). World peak 12-month average moved up quite a bit. World 12-month peak is now exactly 83 million barrels per day. That point was reached in January and also in February 2019. But of course, most of that production was in 2018. The monthly peak and peak year also changed. I was a little shocked at the amount they changed. I am sure they may change again in a few days when the June data comes out.
I noticed your world peak is 83.81 million barrels per day. Barely above the 2018 peak. Your predictions seem to be decreasing slightly. Why is that?
My short-term prediction, for what it’s worth, prices will be higher next year, but production will be lower. You will not be able to blame the decline on low prices. And the decline will be even greater in 2024.
Ron,
The model is a low case where tight oil only reaches a maximum of 9 Mb/d, my best guess is that tight oil may reach about 12 Mb/d, in addition the model assumed extra heavy oil output remains at the low levels of 2021 when it is likely that this will also increase, mostly from Canadian oil sands, I expect Venezuela’s Orinoco output will remain at about 560 kb/d. My guess is that the centered 12 month average peak will be between 84 and 88 Mb/d with a best guess of about 86 Mb/d, the peak is likely to occur between Jan 2028 and Dec 2030.
Here are estimates for 2021 to 2025 World C plus C in Mb/d:
77.14, 78.11, 78.50, 79.78, 80.94
These are for my “low” scenario and would be the minimum output I would expect.
For my best guess scenario we have for 2021 to 2025 (Mb/d):
77.14, 79.10, 81.33, 83.25, 84.77
All of these are average annual output for the respective years.
Keep an eye on China. Rumor is a military coup. But that is yet to be confirmed.
If Chinese yuan breaks out above 7.20 against the dollar there is no reason it can’t go to 8 or 9.
China might be taking over the lead in this global downturn really soon. Keep an eye on the currency because it will be a big negative for oil prices.
HHH, everything with you is about “currencies”, are you a FOREX trader or a Gold Bug??
I’ll introduce you to this guy SRSRocco….He’ll help you get a wheel barrow to haul your precious metals while your neighbors are firing bullets at you…
currencies are fungible.
Keep an eye on everyone.
Peak Oil is undoubtedly understood by the sophisticated militaries of the world.
The Oil Embargo is a 1st day Military Strategy lesson.
“No Energy = No War”
Purchasing power absolutely matters. Business are being squeezed from both sides. Lower profits and higher cost in their local currency.
Oil demand in China will fall with the currency.
“are you a FOREX trader or a Gold Bug??”
You didn’t answer the question.
What is your agenda?
Your questions don’t pertain to oil.
Everything I talk about on here pertains to oil and oil prices and why they are going where they are going.
People don’t seem to understand what actually makes markets and prices move. It’s not as simple as supply and demand. And Macro conditions and liquidity actually matter more.
Dollar liquidity has dried up. Ie Eurodollar curve inverted. Macro conditions are so bad nobody wants to take other side of the trade un-invert the curve.
What’s upon us is way worse than 2008. Majority of people just don’t get it but they will as things continue to deteriorate.
HHH – I for one much appreciate your comments. I don’t always understand fully some of the arcane language but I generally get the gist. I’ve been aware that the dollar exchange rate has a big influence on price and can appreciate the importance of liquidity (it fits in with the too cheap to produce too expensive to buy narrative I think) even if I get lost in the details.
HHH,
Any revisions to your oil price expectation? I think earlier you may have suggested $25/bo by March 2023.
No revisions Dennis. Until something changes. Which nothing has changed. Everything has just reaffirms prices are going lower much lower.
Global easing of monetary policy would change things but that isn’t happening until inflation comes down.
So what are the numbers needed to get inflation back to target. Just a guess. Anywhere between a 30-50% correction from current price in US stock markets. 30% or better correction in housing from current prices.
That will kill enough demand to bring oil prices way down. And bring demand actually lower than supply.
HHH,
Thanks. So your expectation is that this severe recession occurs some time between now and March 2023?
I haven’t seen any updates from the person who purchased paper-money options out-to Mar 23, but I can guarantee they are doing quite well. That fake-trade was placed when oil was $93/barrel, not barely a month ago. I think he did $60 and $93. Prices already down to $77. So on many levels HHH has already been proven correct. It was a good time to place that trade. Oil briefly retested $96 and hasn’t looked up since. Is he some sort of supply/demand guru? No – the signals are in places like currency, bonds, etc.
Two cats,
Not surprising that prices have decreased, pretty much everyone expected oil prices would be volatile with some suggesting a $30 to $200/bo range (shallow sand, but the range may not be exactly this as this is from memory). My guess was $50 to $150/bo, HHH is predicting $25/b by March 2022, though he may be focusing on daily oil price (which in my view is insignificant), if his prediction is that the monthly average price for WTI will be $25/bo or less for some month between September 2022 and April 2023 and one were to make trades on that basis, I think the trade would lose money especially after October if the sales from SPR stop as planned and after December as European sanctions kick in. In 2023, the oil market is likely to be very tight. As to the severe recession expected by HHH, the market may likely have this priced in. Nobody can predict the timing of the bottom. The economy will slow and take some pressure off oil demand and perhaps oil prices will remain in check, though gas to oil switching in Europe will also put pressure on oil prices.
Any and all of us can predict a severe recession or depression,
but its not worth even a dime
if we don’t specify when, how severe, and for how long.
If oil drops to $25 in 2018 dollars for a few days that means not much, except for day traders.
It would just be a reflection of more important factors such as an extremely rapid drop in economic performance and prospects, and fluctuations in national currency relative values.
The drop in price will be a lagging indicator of poor prospects for the global economy.
If the price stays that low for 6 months or a year it would start to be meaningful in that it would affect energy business decisions to some degree.
but most of us would be making a guess based on little to no evidence, no process, or back-testable thesis. And its not just day-traders. There are huge amounts of money to be won or lost (or losses avoided if you manage a 401k account with long only options). These are not insignificant questions even for people on this thread if HHH’s warnings are not being heeded.
Twocats, I posted an update on Sept 23rd, gain of 27%. Here’s the position as of yesterday, gain of 78%.
John,
The tricky part about a real trade is knowing when to sell, with paper trading it doesn’t cost anything to wait for the market to turn. Timing is everything. Tell us when you “sell” your pretend options. The market can turn on a dime, that’s why few make money playing that game.
Two Cats- I was indicating that short term price movements of a highly volatile item like crude oil are not used for making energy business decisions.
Decisions such as project investment or percent of company resource to spend on R & D.
Hedging by producers, buyers and sellers is also based on longer term pricing.
By the way, if we have a severe recession/depression, then yes, oil pricing will go down a lot. That is what I consider common knowledge.
I have been expecting big economic downturns for most of my adult life, and I have been correct a few times. Seems like we are very ripe for such an episode now. And if I knew that date, duration and severity, that would be special.
A standing call on economic decline is not actionable information.
HHHH
As per the social media posts, many by experts across the fields from China itself, an unprecedented military movement was seen towards Xi Jinping’s residence in Beijing. Military vehicles were seen making a movement close to Xi’s residence. A few puported videos of such movements have also gone viral on social media. However, their is no official confirmation on the same.
Based on the report of The Epoch Times, Flight Master said that 9,583 flights were cancelled nationwide on September 21. The flights cancelled were 59.66 percent of the total scheduled flights on the day. It is to be noted that Flight Master serves as a source of information on flight, ticketing, and travel services in the country. Moreover, the reports said that some of the air transport hubs in China had a cancellation report of over 50 percent.
https://zeenews.india.com/india/military-coup-in-china-xi-jinping-under-house-arrest-general-li-qiaoming-next-president-say-social-media-rumours-2513977.html
The source for that story seems to be the Falun Gong, and the story isn’t being reported anywhere except India?
Report from Newsweek says the rumors are false, this is likely to be “fake news”.
https://www.newsweek.com/xi-jinping-house-arrest-china-military-coup-rumors-1746014
It’s hard to see what the Chinese military would expect to gain from such a risky undertaking.
When it comes to the FED and inflation. There is nothing the FED can do about supply side. They can’t make more oil and gas come out the ground. They can’t fix China and Europe.
What they can do is bring demand down inline with supply. Asset prices have to fall here for them to bring demand down. If asset prices were to bottom here an go back up that would be inflationary for demand and prices.
There is not going to be a soft landing or mild recession. They will overshoot this. They don’t care about everyone’s portfolio.
The longer inflation remains higher the more they will do to bring inflation down. Every rally in prices should get sold until inflation is back at 2%
And it’s not like the FED has some magic number here that will bring inflation back down to 2%. That is why they will overshoot this. And why there is a high probability oil prices go much lower than most here believe they can.
The charts below show the recent number of exploration wells drilled by some major IOCs. I split USA because it is dominated by shale wells, unfortunately the offshore wells can’t be separated out as they would be better included with the RoW numbers. Shell either drills many more exploration wells or has a different way of counting them as they are about as many as all the others combined; so I didn’t include their wells as they skew the picture, however they show a similar decline and about the same range for the proportion that come out dry.
The steady decline indicates to me an industry running out of options and likely to start fading away over the next decade or so as the lack of drilling leads to lack of additions to reserves from discoveries. Coupled with falling, and even negative, revisions as the proportion of probable reserves decline towards zero and some early estimates, especially in USA shale, are shown to be highly inflated, this will leave only purchases as a way for these companies to add reserves. No wonder they’ve all suddenly gone gung-ho for renewables.
Last year’s exploration success rate was dreadful, it will be interesting to see how the trend goes in the next few years.
Rest of world, is probably a more important indicator.
Note – the data is direct from the annual reports and the numbers are net wells (i.e. some are fractions of one).
Thanks, George, this is evidence that cannot be ignored. But of course, it will be ignored by some.
There is a very obvious reason the number of exploration wells is falling. You stated the obvious: Last year’s exploration success rate was dreadful,.. It cost a lot of money to drill exploration wells, and if you get nothing in return, you just stop drilling them.
The real telling statistic is the dark black line in your charts (ratio dry). That is the percentage of dry holes. Seems to be rising. 😫
One possible explanation is that most of the resources are held by national oil companies, also the level of exploration wells drilled will lag oil price movements by 6 to 12 months, many of the drops in exploration wells can be partially explained by changes in the price of oil. No doubt there are also fewer prospective well locations that IOCs have access to.
Dennis, changes in the price of oil cannot explain the dismal success rate of exploration wells. And this dismal success rate would, very obviously, be reflected in national oil companies as well as IOCs. What it really reflects is there are just no new fields to plow.
Ron,
A “dry” well is one that does not find enough oil to be profitable to produce, profits depend, in part, on the price of oil.
Here is a definition of dry hole
Describes a well that does not produce oil or gas at commercial volume; typically is a producing well, but does not have enough resources to justify production.
From
https://www.texasinternational.com/blog/oilfield-glossary/
I don’t see things quite that way. Without 2021 the success rates are pretty flat. The success rate really represents the skills of the reservoir team and the accuracy of the seismic data and reservoir models. They should whittle out the dry wells so that the high drilling costs are not wasted. The technology has been getting better but that’s balanced a bit by the geology getting more difficult. It may also be that the retirement of experienced engineers is starting to be seen. With last year’s higher prices the companies may have been inclined to take more risks, if so it didn’t pay off. If they correct that this year then the exploratory wells drilled will take another big step down but success rates will revert to the norm.
Thanks George.
I do not doubt there is more to it than just changes in oil prices, but I would think the evaluation of what is a “commercial” discovery is different at $30/bo than it is at $100/bo, so that it might play some role, perhaps a minor one.
George,
Interesting, so would your guess be that the price expectations are not revised from time to time? Generally these price expectations do not exist in a vacuum and I would expect that they would be influenced by historical prices.
If you are listening My Meltz, your perspective would be of interest.
In my offshore experience, “price decks” are revised 2-3 times a year, and price deck revisions more often impact marginal small projects (for example, a single well – and more often a single development well than an exploration well) than big projects. Once a company has committed to a big project, (made their “final investment decision) they are very unlikely to cancel it, regardless of price deck revisions.
George, What is the black line labelled Ratio? Is that the fraction of exploration wells that come up dry?
Paul,
I believe your interpretation is correct is is the percentage of all exploration wells drilled by IOCs (excluding Shell) that were dry holes.
Dry oil exploration wells…..”No wonder they’ve all suddenly gone gung-ho for renewables.”
Not surprising that humanity and its big companies would generally wait until very late in the game to get a clue and get to work on attempt at adaptation. I can now even sense a slow but perceptible drop in the partisan hostility to solar and wind energy.
Ovi, I took a closer look at your Russia chart above. Russian August production is down 630 K bp/d from its post-covid high in February. I was assuming that August 2022 would be the world post-covid high. Now I am wondering if it just might still be February.
Ron
I think that is a reasonable guess.
Since Feb. Saudi Arabia, Iraq, and UAE are up almost 1.5 MBpD, question is how far down is Russia and what is going on with Canada (since high of 4.7 MBpD in Dec-21, they were down to 4.25 MBpD in Jun-22)…looks like the combined 5 top exporters will be flat for the year (32.3 MBpD plus or minus 2-3%). Small gains by the others may make up for Russia declines…not clear yet…
A look at the two US production peaks, ~50 years apart…
Sorry, if this has been posted. But it is an interesting article on Russian oil prospects.
https://www.linkedin.com/pulse/sanctions-threaten-russias-next-huge-oil-field-udo-von-massenbach/
An Oil Supply Shock May Be Imminent
When the chief executive of Aramco said earlier this week that years of underinvestment had damaged the balance between supply and demand in the oil market, it should have been a wake-up call to those in decision-making positions. Instead, the secretary-general of the UN bashed the oil industry once again for “feasting” on record-high profits and urged governments to make them pay for this.
Meanwhile, OPEC’s production shortfall last month reached 3.58 million bpd—a figure equal to some 3.5 percent of global demand—and the United States continued to sell oil from its strategic petroleum reserve.
These seemingly unrelated news reports do have something very important in common. Both clearly suggest a supply shortfall on a global level is imminent. Throw in the news that Russia’s oil exports could fall by some 2.4 million bpd after the EU embargo enters into effect in December, and an oil shortage becomes more or less unavoidable.
Oil demand has remained resilient in the face of a multitude of challenges, and even prices of over $100 per barrel failed to curb it in any significant way earlier this year. Now, prices are somewhat tempered, but the embargo is still about two months away. Once this kicks in, prices are bound to jump because alternative supply is limited. And the U.S. will need to start refilling its SPR at some point because it is getting depleted.
The Wall Street Journal sounded the alarm on that problem this week. Author Jinjoo Lee cited the Energy Information Administration as saying the inventory level at the SPR had declined by another 7 million barrels in the week to September 16, meaning the total was 427 million barrels. And this number was the lowest SPR inventory level since 1984. It is also the first time there is less oil in the SPR than in commercial storage, Lee noted.
There is a lot more to this article. Click on the link to read.
Ron
The Armco chief executive said that the under investment would bite us if world demand returned to pre-covid levels. Many analysts these days talk about a tight supply/demand situation. The author above states “Oil demand has remained resilient in the face of a multitude of challenges”. Looking at the latest US data tells a totally different story.
On a YoY basis for last week, demand is down 2,208 kb/d. See Table. On a YoY four week average basis demand is down by 1,404 kb/d. Why is it down, EVs, slowing economy, stay at home workers, all of the above.
On a world scale economies are slowing and China is partially closed due to its covid policy.
With the price of oil dropping, its seems that the world is in an over supply situation and that OPEC might announce a cutback on October 5.
So over supply being the case, I cannot see demand coming back to a point that it begins to stress the supply side. Maybe something changes when the SPR draw down stops next month.
Yes, it is a lack of demand that is keeping prices in check. I really don’t think that EVs have much effect right now. They may be later, in a few years that is. Right now I think there is a creeping worldwide recession that is keeping things in check. Of course, the full force of a worldwide recession is not happening right now. And of course, the China lockdowns are having an effect.
Ovi,
You are showing data for a single nation, and often the weekly data is not very good. OPEC’s September MOMR assessment of World demand is that demand in 2022 will be 3100 kb/d higher than 2021 and their expectation for 2023 is that World demand will increase another 2700 kb/d from the 2022 average level.
The IEA says this their September Oil Market Report:
https://www.iea.org/reports/oil-market-report-september-2022
World oil demand is forecast to rise by 2 mb/d in 2022 and 2.1 mb/d in 2023 …
Also the IEA gives a forecast for Global liquids production of 100.1 Mb/d in 2022 and 101.8 Mb/d in 2023, while OPEC gives a demand forecast of 100.03 Mb/d in 2022 and 102.73 Mb/d in 2023. If both of these were correct this suggests the oil market will be oversupplied in 2022 and undersupplied in 2023.
Alternatively we could take the average of the two demand estimates from OPEC and IEA which is 2.25 Mb/d increased demand in 2022 and 2.4 Mb/d in 2023, if we add these to the 2021 demand estimate from OPEC (96.92 Mb/d) we get World Oil demand of 99.47 Mb/d in 2022 and 101.87 Mb/d in 2023. If this latter estimate for demand and the IEA forecast for supply were correct, it suggests oversupply in 2022 by 0.63 Mb/d and a market nearly in balance in 2023 (deficit of only 0.07 Mb/d).
There is also the EIA’s September 2022 forecast for World Production and Consumption of liquids which also suggests oversupply in the second half of 2022 and a balanced market in 2023. My expectation is that all of these forecasts may overestimate future production and I expect in 2023 the oil market will be undersupplied unless there is a severe recession which brings demand down and eases the otherwise tight oil market. See chart below for EIA forecast or link below.
https://www.eia.gov/outlooks/steo/data/browser/#/?v=6&f=M&s=0&start=202112&end=202312&map=&linechart=PATC_WORLD~PAPR_WORLD&maptype=0&ctype=linechart
Dennis, those STEO projections are totally unrealistic.
Ron,
I agree. That is why I said:
My expectation is that all of these forecasts may overestimate future production and I expect in 2023 the oil market will be undersupplied …
Note that the IEA has the following estimate for August 2022 production:
World oil production rose 790 kb/d in August to 101.3 mb/d…
In the September MOMR they estimate as follows:
Preliminary data indicates that global liquids production in August increased by 1.3 mb/d to average 101.3 mb/d compared with the previous month.
The EIA STEO has World liquids output at 101.26 Mb/d in August 2022, pretty much the same as OPEC and the IEA, after August 2022 the STEO forecast has relatively flat World output through Dec 2023.
From Sept 2022 to Dec 2023 the STEO has average World liquids output at 101.37 kb/d, this might be 1 Mb/d too high, but is in the right ballpark in my view.
Dennis
My main comparison was the four week average. This is a more reliable indicator than just one week.
My main point was to contrast the contradiction between the IEA and OPEC projections and what the current US data was showing. I would think that both OPEC and the IEA would be checking the weekly data to get a sense of the trend in oil use and check on the impact of the higher gasoline and diesel prices. My sense is that they don’t do that and possibly just rely on the STEO.
As usual, we will have to wait for next year to arrive to see how well these predictions work out.
Ovi,
I imagine that OPEC and the IEA do some analysis of their own, note that the demand predictions of all three organizations are slightly different, but I don’t kmow the details of what is behind the analysis. Sometimes the 4 week average is pretty accurate, other times it is not, I maintain that we don’t really know until months later when the monthly data comes out and sometimes the initial monthly estimates need to be revised significantly.
The data is often very fuzzy and I agree we won’t know much about demand in September 2022 until December at least. Note that all three agencies see that demand is growing more slowly and expect supply to be higher than demand for the second half of 2022, this may be in part what is driving oil futures lower.
Things are getting dire: strange and unusual policies everywhere abound. As world economies involute, demand destruction may well plummet the price of oil, even minus Putin’s full measure. Bankruptcies of the weakest of the independent shale oil drillers will occur, if this lasts long enough. (That’s no small percentage: several hundred, maybe 25% of all shale oil activity.)
Due to volatility, reinforced by the above graphs, articles and comments, at some point there’s going to be one hell of an oil shock, and prices are going sky high. If that correlates with a threat of war, we could easily find ourselves refilling the Strategic Political Reserve with $150 oil.
Folks around here might find this interesting
https://economicsfromthetopdown.com/2022/09/24/how-to-make-the-oil-industry-go-bust/
The author looks at the cleanup liabilities for oil companies in Alberta Canada. (It may be later than we think.)
We have passed / about to pass / will pass shortly, the point at which all the future revenues from oil production would be needed to pay to cap and clean up all of the old wells in Alberta.
Now of course, these liabilities will for the most part be defaulted on, but it does indicate that we have not be paying the full cost for obtaining oil in either monetary or energetic terms.
Thank God that nuclear power doesn`t leave any nasty things behind… /S
In the comments to the report on last month’s OPEC MOMR, there was a discussion about optimal management of resources. I would like to point out that Elinor Ostrom won the 2009 prize in honor of Alfred Nobel in economics for empirically showing that frequently the commons managed common resources more optimally than the two solutions proposed by standard economic theory which are either private ownership or government regulation. In other words, the so called “tragedy of the commons”: https://en.wikipedia.org/wiki/Tragedy_of_the_commons is not a tragedy at all. Ostrom found two requirements for success in managing the commons:
1) Those using the resources should make the rules (rather than by government decree).
2) Those using the resources should be in charge of enforcement.
In case nobody has posted this link already:
https://oilprice.com/Energy/Crude-Oil/An-Oil-Supply-Shock-May-Be-Imminent.html
Russia triggers European energy crisis but Middle East supply risks drop
Crisis mode
Sanctions introduced against Russia following its invasion of Ukraine have had a major impact on commodity supplies and continue to cause major price volatility.
Sanctions have already reduced output from the world’s largest producer of both oil and gas by approximately 2 million b/d. Russia has also restricted gas supplies to 12 European countries, triggering in some cases a 565% jump in prices year on year.
S&P Global forecasts that Russian oil disruptions will peak at 1.5 million b/d in the first quarter of 2023, or 1 million b/d below the August average.
“We believe a sizable portion of the 3.5 million b/d of crude and product that needs to be re-routed from Europe will find buyers not requiring Western shipping services, with or without a price cap, but the policy could further ease the trade flow shift by permitting Western insurance under a certain price level,” S&P Global analysts said.
Look for Russian oil production to be down in September if exports are any indicator. But this data is only through September 16th. What happens in the second half of the month may change things.
Russian seaborne crude exports crater to their lowest level in 5 months as Europeans shun Moscow ahead of new sanctions
Russia’s seaborne crude exports have seen a steep drop-off over the last month, with cargoes to Europe falling 18%, according to Bloomberg data.
A storm in the Pacific and a decline in shipments coming out of the Baltic region dragged on exports. Bloomberg data shows that in the week leading up to September 16, crude shipped from Russian ports averaged 2.54 million barrels a day, down from 3.42 million barrels in the week to September 2.
Across a four-week moving average, Russia’s seaborne shipments cratered below 3 million barrels a day for the first time in five months.
To Europe specifically, shipments fell by 172,000 barrels a day in the month up to September 16, per Bloomberg, as the European markets increasingly close off to Russia ahead of fresh December sanctions.
Meanwhile, Russian crude cargoes in Asia did not surge in the same time period, meaning there was nothing to offset the drop in exports elsewhere.
Russian Oil Flows Dive, Hurting Putin’s War Chest
The chart below shows the continuing decline of tankers carrying Russian oil. Week ending Sep. 2, 33, Sep 9, 26 and Sep. 16, 23.
Click on Chart to enlarge.
Russia seen suggesting OPEC cuts oil output by 1 mln bpd
Russia is likely to propose that OPEC reduces oil output by around 1 million barrels per day at its next meeting in October, a source familiar with the Russian viewpoint said on Tuesday.
Russia faces challenges in maintaining oil production due to Western sanctions on its energy and financial sectors after it invaded Ukraine earlier this year. The Kremlin calls it a special military operation.
https://www.reuters.com/business/energy/russia-seen-suggesting-opec-cuts-oil-output-by-1-mln-bpd-source-2022-09-27/
It’s a done deal . Who got the prisoners’ exchange deal done ? MBS . Connect the dots and geo politics . Quid pro quo . Don’t loose your sleep on this .
“The extent of the damage means the Nord Stream pipelines are unlikely to be able to carry any gas to Europe this winter even if there was political will to bring them online, analysts at the Eurasia Group said.”
Hickory,
The fact that Europe’s fundamental security – that is, actual life and death precariousness for much of the population throughout the coming winter – doesn’t merit but one comment (yours) is a pretty shocking display of indifference/ignorance by this site’s commentators.
There will be no gas through those pipes for the forseeable future.
In addition. Gazprom hàs just said that they will curtail gas shipments through Ukraine, purportedly in a legal/financial spat.
For you folks squabbling about minutiae regarding oil scarcity, this gas situation has just ratcheted into the stratosphere in geopolitical, economic, and global conflict-tier terms.
Mebbe Watcher’s long running observations regarding primal human response vis a vis survival mode will (already started to?) play out shortly.
Agree. The situation in Europe is the big deal currently.
Its like a dress rehearsal for the peak energy era.
And coincidentally happens to be right on the 50 year anniversary of the article
“Written by meteorologist John Sawyer, the paper – entitled “Man-made carbon dioxide and the greenhouse effect” – was published by the journal Nature in 1972.”
I did see a mid-winter projection calling for normal degree of winter cold in Europe Dec Jan Feb this year (posted on the other side).
The Moon of Alabama provides a very good review of the circumstantial evidence around the possible perpetrators of this sabotage.
https://www.moonofalabama.org/2022/09/whodunnit-facts-related-to-the-sabotage-attack-on-the-nord-stream-pipelines.htm
Russia’s Prosecutor General has opened a case of International terrorism (Russia owns about 50% of Nordstream 2).
Millions of dollars of has gas has been lost.
While Germany’s gas buffer storage is 90% full, it still needs gas on a regular basis.
Germany will only have expensive imported LNG from now on. One-off spot cargoes are expensive. Long term contracts are cheaper, but nothing USA or Qatar ship could be anything near as cheap as Russian pipeline gas. Cheap pipeline gas built German industrial might. Russia relies on selling pipeline gas in winter as it’s LNG arctic fields are iced in.
Russia may ‘turn East’, but the large diameter pipeline through Mongolia to China has barely even been approved, let alone built.
There is a lot of gas in Qatar, Iran and Russia and the world is gonna need all suppliers. Russia and ?Saud are increasingly looking to re-format natural gas at source, capturing and storing the CO2 and sending out liquid methanol for blending with petroleum or as a straight run fuel (including for generators).
Germany’s competitiveness is now shot. And they did it by diktat of their politicians and their so-called ‘sanctions’ – including on their own part-owned pipeline.
German firms are considering re-locating to USA for cheaper fuel costs – and subsidies from the US.
They would have done better re-locating to Russia.
US says 190k/bpd of oil production shut down in the Gulf of Mexico ahead of hurricane Ian
The US offshore regulator says 190,358 barrels per day of production is shut down in the Gulf of Mexico on hurricane disruptions. In addition 184m bcf is shut. A total of 14 platforms or rigs have been evacuated.
Interest rates on 30 year fix mortgages are now over 7% here in US.
Think about how many jobs revolve around housing. Without that asset bubble in place how much demand for oil, natural gas and so on goes away?
Hard to quantify.
Listen to what the yield curves are telling you instead of all the talking heads.
OPEC is going to have to cut way more to even have a prayer of keeping oil prices up.
All Corporations and governments roll over their debt to the new interest rate.
They rarely, ever pay it down.
Rollover Risk
https://www.investopedia.com/terms/r/rollover-risk.asp
The idea that interest rates would never go up was extremely stupid.
The market ultimately sets the rates, with RISK and INFLATION priced in.
Central banks of the world have created the largest mega-bubble-of-bubbles in world history… and it was all predicated on low interest rates. The Zerohedge community, when not posting weird pepe-type bullshit, has been talking about how “this can’t last” since 2008. Well, it lasted a lot longer than most of their trading accounts I’m sure, but the bill may finally be coming DUE.
Our entire economy depends on the bubbles continuing.
Think about Tesla. They don’t even exist as a company without the bubble in stocks and crypto
because way fewer people could afford a $100,000 or even the $50,000 Tesla without the money they made from the asset bubbles.
The price of oil also depends on the asset bubbles.
As theses bubbles pop and make no mistake they are popping. Price of oil is going down not up.
Correct, peak oil implies decreasing oilprice.
Oil is the main energy driving our economy, when oil gets harder to extract there is less energy left to drive the economy, so the economy tanks and the price of oil decline, a vicious circle kind of.
I don’t see that scenario playing out at all. If we have peak demand, that would imply decreasing oil prices. I see peak demand as extremely unlikely. Peak production however was four years ago. And as production drops further, that means prices will have to increase until price gets high enough to decrease demand to equal production.
Prices will increase in 2023. It will likely average over $100 a barrel.
Ron,
We tend to agree that oil prices are likely to rise, but if we have a severe recession similar to the Global financial crisis or worse yet to the level of economic decline during the pandemic which some here think they foresee, we might see oil prices drop in that case.
My guess is the odds are low that the recession we are likely to see will be bad enough to impact oil prices severely. We might see oil prices bounce as low as $70/b if the recession is relatively severe (say World real GDP growth of 0.5% to 1.5%), but I think an annual average oil price for 2023 of about $100/bo+/-10 is about right.
Dennis, I think we can agree that it all depends on the level of supply. A collapse in supply can cause a recession that could keep prices low. But a collapse in supply that only causes a mild recession could cause prices to go much higher.
I understand that it is not just oil, but also natural gas, that could cause the economy of Europe to collapse. But either way, it is the collapse of petroleum products production that will cause a collapse if it happens.
On the other hand, if oil and natural gas production increase, then that lessens the chances of a recession.
I expect a dramatic decline in the production of oil and natural gas next year. I think we may have the worst of all possible worlds. That is a recession coupled with high oil and gas prices.
Ron,
Yes it depends on supply and also on demand, it is the balance between these that will determine the price of oil and of cource the price of oil will feedback to demand and supply and affect both production and consumption of oil. I do not expect production of oil and natural gas will collapse in the face of a mild World recession, they might decline moderately, but more likely will be flat or increase moderately especially if natural gas is trading at $20/Mcf in much of the World (Europe and Asia) and oil is at $100/bo or more.
I just noticed that Ukraine’s oil production has ceased completely. They did not produce a lot, averaging around 33,000 barrels per day, but not any more.
BOE (Bank of England) threw in the towel and restarted QE. Basically they aren’t going to fight inflation. They are going to hold yields down in the face of inflation, hope for the best and watch everything implode.
I should add this move is temporarily positive for markets and prices. As bond yields fall it eases monetary conditions. They didn’t really have a choice. It’s like a game of chess and we are getting down to the last few available moves.
Monthly Energy Review was released on September 27 by the US EIA, link below
https://www.eia.gov/totalenergy/data/monthly/
The chart below has US C plus C output from August 2020 to August 2022, the July and August estimates are significantly different from the Short Term Energy Outlook released on Sept 7, 2022.
I looked back at several months previous estimates (July and August reports) and it seems that for those months that the MER seems to overestimate output for the most recent two months reported, lately the estimates have been about 200 kb/d too high, so the last two data points are likely not correct, the STEO does a somewhat better job and the STEO estimates are roughly 200 kb/d lower than the MER for July and August 2022. I cannot find any documentation at the EIA for the basis of the estimates. In a couple of days we will have the Petroleum supply monthly estimate for July 2022.
Dennis
The MER monthly numbers are estimated from the weekly numbers posted by the EIA. Last month, the STEO nailed it for June.
Attached is a table with the weekly production numbers, the number of days in that week that belong to August and an over all August average of 12,094 kb/d compared to the MER’s estimate of 12,090.
Thanks Ovi,
A likely explanation. And yes the STEO seems to get the months very close to the release of the PSM pretty close in recent months. What seems strange is that the weekly estimates are supposedly based on the STEO for L48 output, but current weekly estimates are about 200 kb/d higher (11600 kb/d where STEO is about 11400 kb/d for Sept 2022). See page 38 from link below
https://www.eia.gov/petroleum/supply/weekly/pdf/wpsrall.pdf
Excerpt:
EIA estimates weekly domestic crude oil production using a
combination of short-term forecasts and the latest available production
estimates from Alaska. The four data elements contributing to the
estimate are:
• the most recent Short-Term Energy Outlook (STEO)
model estimate (including interim estimates) for average
daily production for the lower 48 States and the Federal
Gulf of Mexico (GOM) (STEO Table 4a: http://www.eia.
gov/forecasts/steo/data.cfm?type=tables);
• daily production volumes delivered from the North
Slope of Alaska to the Trans-Alaska Pipeline System
(TAPS) (reported to EIA by the Alyeska Pipeline Service
Company);
• daily volumes of natural gas plant liquids produced
on the North Slope delivered to TAPS (reported to EIA
by BP); and
• daily production for South Alaska estimated from
monthly production reports (lagged by two months)
from the Alaska Oil and Gas Conservation Commission
There was a revision of lower 48 output by -200 kb/d from August to September, maybe the folks that do the weekly numbers missed this. So for August weekly numbers they would have expected 11.6 Mb/d for lower 48 based on the August STEO and for July STEO the August 2022 L48 estimate was 11.7 Mb/d (they round to the nearest 100 kb and may have rounded up from 11.65 to 11.7 Mb/d). For July 2022 both the June and July STEO reports had L48 output in July 2022 at about 11.6 Mb/d.
The problem is simply that the STEO cannot predict with pinpoint accuracy current output (say September output in the September STEO) and in June and July the STEO was predicting July output to be 200 kb/d higher than the current (Sept 2022) STEO.
Essentially the weekly data reflects the misses in forecasts by the STEO in past months.
https://www.dailymail.co.uk/news/article-11259295/Nord-Stream-attack-European-infrastructure-risk-experts-warn.html
Europe bracing for attacks on oil and gas infrastructure
Gas ‘sabotage’ could show Putin is readying for ‘global war’, expert says
“Some have already begun scrambling to shore up their defences, with NATO chief Jens Stoltenberg in Denmark today for talks which he said ‘addressed the protection of critical infrastructure‘
https://www.youtube.com/watch?v=8ZywLkKOg58
Finland’s President on Putin
“He’s gone all in”
I thought the Energy Cliff was bad, it’s gonna be real bad if foreign governments start targeting oil infrastructure.
THIS TIME IS INDEED, DIFFERENT… LOL
Why? The World Oil Industry Has Hit the Red Queen Syndrome. Trying to keep global production at 100 M/bd will become impossible as time goes by. Thus, we head over the ENERGY CLIFF.
People ask, why are Europe and other parts of the world suffering from an Energy Crisis? Easy… again, we have reached the ENERGY CLIFF. Thus, any Geopolitics or disruptions to supply now cause massive energy price volatility.
However, if we go back to the 1960s… we see how massive Geopolitics impacted the oil price
1961 BAY of PIGs
1962 Cuban Missile Crisis
1963 Assassination of President John Kennedy
1964 Gulf Of Tonkin Incident
1965 U.S. Enters Viet Nam War & Drops more bombs than during WW2
1967 Arab – Israeli 7 Day War
1968 Assassination of Martin Luther King, massive riots and protests
1968 Assassination of Sen Robert Kennedy who was running for President
With all of these massive Political & Geopolitical Events, how did they impact the Oil price during the 1960s? NOT AT ALL… LOL. The Oil price was set at a long-term price of $1.80 from 1961-1969.
That has all changed now that the world has hit the ENERGY CLIFF…
steve
https://www.youtube.com/watch?v=HDXsR7f_L38
“You Have No Idea What’s About Come In Next Few Days”- Peter Zeihan
Oil content inside
Izzy Doroski Posted this on the non-petroleum thread. It should have been posted here on the petroleum thread, so I will repost it for him:
Excellent discussion on the present and future of oil production and investing in the space by Shubham Garg. Many reasons why a dramatic oil production decline is coming from a lack of resources, rising costs and huge decline rates and even apathy of the needed workers.
https://www.youtube.com/watch?v=3p4JIBAH5nk&t=2743s
This is a very long video, but I watched it some time ago but quit just over halfway through it because it did not seem to get to the point. I should not have done that. Just skip to about minute 47 of the video and listen to the next few minutes. You will get very scarey facts as to what is really happening in the oil patch.
He says exactly what I have been saying for over a year now. These facts can no longer be denied.
Dennis, please watch this. Not the whole thing, just about 5 minutes of it beginning at minute 47. Then give us your input.
Ron,
I still think producers that are increasing output will increase by more than those that are declining. The video seemed to be suggesting that oil prices will rise once the SPR release ends, I agree with that, the overall thesis seems to be that oil demand will increase and oil prices will be between $100 and 130 per barrel and that oil companies will be very profitable at those prices. I agree with that as well. In some places he overstates the declines from small producers, saying it is as much as 6% (possibly true for some individual nations) For declining producers with less than 600 kb/d of output in May 2022 (52 nations) the decline rate was about 2.7% per year over the 2011 to 2019 period, about an annual rate of 136 kb/d. He says it adds up, but not to a large number.
The rest of the World (not including these 52 small declining nations) saw average output rise by about 1100 kb/d annually over the 2011 to 2019 period.
With higher oil prices we may see some of the nations that declined during the pandemic return to their previous trend prior to the pandemic, unconventional oil has room to grow.
Dennis –
At this point it’s all wishful thinking, changing the URR doesn’t impact the timing of peak, rather it impacts the magnitude of the peak. I modeled several different URRs, peak is the very close to the same point in time but the max output is the difference…
2000 Gb – Peak in year 2000 at 62 Mbbl/d.
2500 Gb – Peak 2011 at 77 Mbbl/d.
3000 Gb – Peak year 2019 at 92.5 Mbbl/d.
3250 – Peak year 2020 at 100 Mbbl/d.
3500 – Peak year 2021 at 108 Mbbl/d.
See 3000 Gb example below:
Kengeo,
To do the analysis properly you need to use crude plus condensate data not all liquids data.
Data can be downloaded at link below
https://www.eia.gov/international/data/world/petroleum-and-other-liquids/annual-petroleum-and-other-liquids-production?pd=5&p=00000000000000000000000000000000002&u=0&f=A&v=mapbubble&a=-&i=none&vo=value&&t=C&g=none&l=249–249&s=94694400000&e=1640995200000
Note that at the end of 1972 cumulative World C plus C output was 264.17 Gb.
Dennis – Still wrong!
I used the data you pointed me to, no real difference.
Peak year is 2021 at 30.07 Gb (82.4 MBpD), I couldn’t use more than URR=3100 Gb. The k value is 0.0388.
If I plug in 3250 Gb and k=0.0375 then the peak is early 2024 at a value of 30.47 Gb (83.5 MBpD)… this is not a good match for the data though.
Using 3500 Gb and k=0.035 then the peak is 2028 at 30.6 Gb (83.8 MBpD).
Since the peak production year was 2019 (82.2 MBpD), then doesn’t that suggest that max possible URR is 3100 GB?
It may have been a giant coincidence that peak oil was going to happen in 2020/2021 but Covid displaced the peak.
For URR between 2900 and 3250 Gb, the average peak year is 2020 falling in a range of 2018 (2950 Gb) to 2024 (3250 Gb).
Note that the full 2PCX value of 3070 Gb gives a peak production in 2021 at 82.4 MBpD (3
0.09 Gb).
I’m not sure why our models seem to be so far off, I’m using Tom Huber’s model…
I would say it’s an 80% chance the peak is behind us…seems to be a very big stretch for a new peak and as Dennis knows, the best we could hope for is somewhere slightly over 82 MBpD…and current data don’t point to that happening anytime soon…
Based on this model, I get a good match as follows:
Peak year 2023 at a rate of 82.8 MBpD and URR=3225 Gb; k value of 0.0375.
Maybe our models agree Dennis and this is why you insist that Covid pushed the peak forward 3 years? I disagree though, I think it would only flatten the peak, not push it out (we’re still burning >80% during that time so little effect on timing, just flattens it a bit…)
Kengeo,
You need to match cumulative output. One way to do this would be to go back to data ending in 1997 as Laherrere and Campbell had when they wrote their famous 1998 paper. Their estimate for URR was 1800 Gb. What you will find is that they chose 13 years of data from 1985 to 1997, the URR is 1755 Gb, they rounded up to 1800 Gb in the paper. If you use 15 data points from 2005 to 2019 you will find the URR is 3242 Gb.
You should attempt to match cumulative output rather than output, when you do so you will find Tpeak to be 2027, but that is for a scenario that follows the logistic from 2019 to 2027, the fact is 2020 and 2021 were well below trend and it will take many years to return to trend. You are trying to get cumulative output to return to the level of the Hubbert model, that is what my alternative model does. A reasonable alternative would reach a new peak in 2031.
Kengeo,
Below we have a hubbert model based on Hubbert linearization on 2005-2019 World C plus C data, URR=3242 Gb, an alternative model is shown that accounts for low output in 2020 and 2021.
The Hubbert model peaks in 2027/2028, the alternative in 2031 (both have the same URR of about 3240 Gb).
Below is World C plus C output in Gb/year from 2018 to 2037 for Hubbert Model:
29.47, 29.65, 29.82, 29.96, 30.09, 30.20, 30.28, 30.34, 30.39, 30.41, 30.41, 30.39, 30.34, 30.28, 30.20, 30.09, 29.96, 29.82, 29.65, 29.47
Basically we have a 20 year plateau with output at an average level of 30.06 Gb/year and a range of 29.47 to 30.41 Gb/year or we could think of it as 29.94 /-0.5 Gb/year.
Disagree
Yeah, so do I, in spades.
LTO Survivor and Ron,
Not clear what you disagree with, but I suppose basically you both believe 2018 will be the final peak, if you are correct (and I do not think that is the case), at minumum I would expect a plateau around 82 to 83 Mb/d. I also assume you both believe we will see no growth in either tight oil or Canadian oil sands output, I disagree strongly that that will be true, especially if oil rises to over $100/bo (after SPR releases stop and European oil imports from Russia stop) and natural gas remains above $5/MCF.
Time will tell.
Dennis wrote: I also assume you both believe we will see no growth in either tight oil or Canadian oil sands output,…
I have never made any such statement, and I have no idea why you think that is my opinion. No, I believe both Canada and tight oil will have marginal increases in production. Also, there will be other nations that will have marginal increases in production. It is the decliners that you are overlooking Dennis. The decliners will overwhelm the gainers, and the general direction will be down. That has been my opinion ever since the peak in 2018. I thought you knew that.
I think growth in the US, Canada, Brazil, Argentina, and Guyana, along with potential increases from UAE, Iraq, and Saudi Arabia will be larger than declines elsewhere in the World, especially if oil prices average about $100/bo or more from 2023 to 2028 in 2022 US$ and natural gas prices in the Europe and Asia are in the $10/MCF range (2022 US$) over that period.
I totally disagree with Dennis, but we all know that!
Here’s a look at changes over past 10 years, no surprises here…
While Brazil increased by 1 MBpD since 2014, their average profile hasn’t moved much since 2019, I don’t believe their production is price dependent, is mostly slow-moving deep water plays. Canada will not be a source of growth, that’s for sure.
Kengeo,
The Canadian government believes Canadian output will increase, mostly from oil sands output. Ovi has given convincing arguments for why oil sands output is low cost and viable.
Perhaps he can correct me if he disagrees with CER scenarios. Much of the increase in World output may come from US tight oil. Lately growth in tight oil has been very slow, if that continues we might not reach a new peak. It is surprising how slow growth has been, only 250 kbpd over past 12 months. At that rate only a 2 Mbpd increase by 2030 and in that case the US does not move the needle much.
Lately growth in tight oil has been very slow, if that continues we might not reach a new peak.
I really cannot blame you, Dennis, if I start seeing signs that my peak oil prediction might be wrong, then I just might start crawfishing also. 🤣
But really, the US is only a bit player in the grand scheme of things. Even if US shale production sores to new heights, it will make little difference. Peak oil happened in 2018, end of story.
Ron,
I adjust my thinking based on the data. I took a quick look and even if tight oil only grows by 250 kb/d per year a new peak will be reached. If output grows more slowly, perhaps we won’t. It is possible that future growth in tight oil might be lower or higher than it has been the past 12 months. Difficult to know for certain what the future holds, despite your confidence that you know that future output will be less than 83 Mb/d (for 12 month average). Based on the slow growth of the past year, 85 Mb/d in 2030 seems very likely.
Denis wrote: I adjust my thinking based on the data.
So do I. When the facts change, I change.
despite your confidence that you know that future output will be less than 83 Mb/d (for 12 month average)
There you go again Dennis, putting words in my mouth. I have never stated that I know any such thing. I only know one thing. Like Descartes, I think therefore I know that I exist. Everything else is just an opinion. It is my opinion that the world average C+C will never exceed 83 million barrels per day again. If it does then, I will just say: Damn, I was wrong.
But that is not just a willy-nilly opinion that I just pulled out of my ass. It is based on a serious study of the production trend of every oil-producing nation. I think it is the correct opinion. But hell, I could be wrong. But I have very high confidence that I am correct.
Damn Dennis, I admitted to you that if the facts change then I will start crawfishing also. 😆
Having followed this as a lay observer for almost two decades now, it amuses me how academic all this has become.
In short: It doesn’t matter.
My geology professor from college, an early Hubbert advocate and writer of several key papers on the topic, said it best back in 2007, when I interviewed him: Michael, it’s too late.
Even Hubbert thought the precise date was irrelevant. As far back as 1976, during an interview, Hubbert seemed less concerned about the date of peak than the fact that “We can do it now,” meaning make an immediate transition to solar power, for which we were already developing the technology.
But we didn’t, Blanche. We didn’t do a goddamned thing (to paraphrase a Bette Davis character).
And now we reap the whirlwind.
Mike B. – Dr. Hubbert recommended that the world transition to nuclear and alternate energy & get the population of the Earth under control. Hubbert believed that solar power would be a practical renewable energy replacement for fossil fuels, and that nuclear energy in breeder reactors would be able to sustain humanity for centuries. He also states that “provided world population can somehow be brought under control, we may at last have found an energy supply (uranium) adequate for our needs for at least the next few centuries of the ‘foreseeable future.”
His graph went for another five thousand years, and flat. Implying that nuclear would go for thousands of years beyond that. If you can find any document that has him promoting solar then please post it.
Ran across this a few years ago, a clip on Hubbert talking photovoltaics.
https://www.youtube.com/watch?v=kF04MdS5yLM
Thanks for reposting it Ron. He has a lot of good insight on the fundamentals going on with the producers and their problems bringing on new petroleum resources.
From Bloomberg
https://www.bloomberg.com/opinion/articles/2022-09-28/the-oil-peak-is-here-as-steep-rate-hikes-curb-consumption?srnd=premium&sref=hEO85HQm
Peak Oil Has Finally Arrived. No, Really
Those who have called a top in oil may finally be proven right as sharp global rate hikes hurt consumption.
I’ve rarely felt more trepidation about writing a column than this one. But here goes: After more than a century of almost continual growth, the world’s appetite for oil is peaking, and will soon enter terminal decline.
That’s hard to write, because those who’ve called a top in oil have a forecasting record on a par with film producer Harry Warner’s skepticism that people in the 1920s wanted to see talking pictures.
As far back as 1919, the chief geologist of the US Geological Survey wrote that domestic output — then running at about 960,000 barrels a day, about 6% of levels nowadays — would start falling within two to five years. In the 2000s, a dearth of oilfield discoveries led to febrile worries that supplies were running out, before the shale revolution prompted a surprise jump in production. BP Plc in 2020 predicted that consumption of liquid hydrocarbons would at best plateau for 15 years around the 97.9 million barrels a day mark it hit in 2019, before revising its forecast to a peak between the middle of this decade and 2030.
Rgds
WP
This sounds like the old “peak demand” argument to me.
That was my reaction as well, but this version looks to be based on global economic downturn cutting into demand.
I see that scenario as a distinct possibility, although I’ve been waiting for about 4 decades to be correct about that.
One of these days or years.
If that scenario pans out in a big way, then oil supply will not be near the top on the list of problems.
Shot across the bow.
Warning to European democracies on Ukraine to back off or the cold war will get more serious-
“Why Putin would want to blow up Nord Stream 2, and the advantages it gives him-
The Russian leader has a record of weaponizing fuel supplies and believes his people can endure economic pain longer than western Europe…The timing was perfect. A new gas pipeline between Norway and Poland was inaugurated on Tuesday, very close to the Nord Stream 2 pipeline, as news of the suspected sabotage emerged.
Warsaw is moving to cut itself entirely off from Russian gas by the end of the year.
The new Baltic Pipe is part of wider moves across Europe to find alternate suppliers to Moscow and build up gas reserves before winter bites. ”
https://www.telegraph.co.uk/world-news/2022/09/27/putins-nord-stream-2-sabotage-sends-warning-will-blow-pipes/
I add that the timing link with annexation of Ukraine is no coincidence. Its a warning to cease interference with the invasion and territory grab.
I would say, qui bono in the long run?
There are multiple suspects here, whatever you may think, so again, qui bono in the long run?
I myself can think of several others, Quatar, US, Ukraine to name a few. Quatar and US selling more LNG obviously, but also Ukraine for keeping the old pipelines running.
Just an opposing view.
Add Norway to your list.
But my best estimate is that this is Putin giving a big warning to Europe.
Here is what happened to Nord Stream 2 Pipeline. Watch from 1:22 to 2:00. From C-Span in February. https://www.youtube.com/watch?v=OS4O8rGRLf8
Well, that kind of closed my case…
If that’s all it takes to convince you, well you are a lot easier than I would have guessed.
Here’s some fine-tuning of hubbert peak in 2018-2019 timeframe, it’s all down from here:
Kengeo,
Not a viable model as you need to use crude plus condensate output to reflect crude oil URR. If we use Hubbert linearization on World C plus C data from 2005 to 2019 we get U=3242.5 and k=0.0375174. Hubbert model peaks at 2027 at 30.41 Gb/year (2018 was 30.29 Gb/year).
Kengeo,
Note that peak C plus C output in 2018 was 30.29 Gb per year rather than the nearly 35 Gb/year shown on your chart. Ron and I both ignore “bottled gas” and biofuels and refinery gain and focus on real oil (crude plus condensate).
Dennis – See above, not sure why but it doesn’t really matter, both data sets land on nearly same peaks ranging from 2018 (3200 Gb). Covid likely flattens the peak, while I think there is a very slim chance we could see 80 MBpD again, in light of everything going on in the world it seems like a fat chance.
Kengeo,
Perhaps you have the cumulative wrong, it should be 981.2 Gb at the end of 2004. Or you can use 445 Gb at the end of 1980 which I got from this USGS paper (see bottom right of Figure 1 on page 2a for date)
https://pubs.usgs.gov/of/1983/0728/report.pdf
Dennis – One thing to add, I think you may be correct with one issue. A new peak may or may not happen (in my opinion it’s very unlikely). However, looking closer at the Hubbert graph/data, I think it’s possible we could see limited decline for next 5-10 years. I guess it all comes down to how well the economic engines can operate in this no-growth environment…most of us here don’t have much faith that BAU is up to the challenge…but maybe we underestimate it…at this point it’s completely trivial whether or not a second peak is reached, we know that the plateau (or much worse) is right around the corner. I think our models and interpretations of them are in 90% agreement (peak occured -or will- sometime between 2018-2028, peak value is somewhere around 82 MBpD). If hubbert curve holds (and economics allows), then we should see production between 75-80 for next ~10-15 years, then decline rate will step up and production will reach <10 MBpD sometime in next 40-50 years…
Kengeo,
Note that the Hubbert won’t necessarily be followed. I expect a minimum of 82 Mb/d and perhaps as much as 88 Mb/d between now and 2031.
Kengeo,
I do agree we are not very far apart and perhaps there will be a plateau in the 83 to 87 Mb/d range, my current best guess is 85 Mb/d in 2030 or so, but it might be lower (implying a longer plateau) or higher (where the plateau would be short). The plateau may be very bumpy (with swings up and down due to various shocks).
Here is what the model vs data should look like. Notice the close match from 2000 to 2021.
I’m not getting that result:
Here’s the URR needed for the respective peak year:
2900 Gb (2019)
3050 Gb (2021)
3300 Gb (2024)
3550 Gb (2027)
Trying to fit the data the latest peak that I can produce is 2020…regardless of the dataset used…URR doesn’t care about what dataset you use…best I can do for your URR of 3250 is 2023…so we might find out soon!
Kengeo,
Part of the problem is you use all liquids data, use crude plus condensate data to get a viable model.
Kengeo, Using the correct data matters.
It is not hard to find the data.
Try this
https://www.eia.gov/international/data/world
If you are using BP Statistical review of World Energy data, then cumulative production is about 145.63 Gb at the end of 1964.
A Hubbert Linearization on the C plus C plus NGL data at BP from 2005 to 2019 gives:
URR=3725.55 Gb and
k=0.0380959743
Peak year is 2029/2030 at 35.48 Mb/d.
This implies an NGL URR of about 483 Gb.
Note that I do not think the Hubbert linearization method works as output does not seen to match a logistic function historically, so we would not expect it to follow that function in the future.
Washington Post article, behind a paywall.
Peak Oil Has Finally Arrived. No, Really
The article is mostly about peak demand, but it talks about production also. But a chart showing demand shock recovery times shocked me. Then I realized something. Many people on this list have commented that demand destruction “saves” oil for future production. No, this is not the case. Demand hits on production and does not save oil. In the vast majority of cases, especially in small producers it simply takes marginal wells offline that will never recover.
Nitpick – it is a bloomberg article reproduced by WaPo.
rgds
WP
Ron,
How is Saudi Arabia producing 11 million barrels a day? Are they buying Russian Crude to cover domestic needs? I just can’t believe Saudi can keep this up.
No, they cannot keep it up for very long. You will likely see their production drop in October. And yes, they are buying Russian crude on the cheap and exporting their own oil to take advantage of higher prices. (I just read on the net that Saudi production, as well as OPEC production, will be up in September.
Here’s why Saudi Arabia is buying more Russian oil
Saudi Arabia’s crude imports from Russia allow it to free up its own oil for export to reap profits from the record-high prices in the international market, Pat Thaker, Editorial Director, Middle East & Africa at The Economist Intelligence Unit (EIU), told TRENDS in an emailed interview.
EIA piece on Permian basin from Sept 30. 2022
https://www.eia.gov/todayinenergy/detail.php?id=54079#
OPEC+ oil output cut talks narrow to 0.5-1.0 mln bpd, sources say
LONDON/DUBAI, Sept 30 Reuters) – OPEC+ oil producers considering lowering their output target at a meeting on Oct. 5 are focused on a cut of between 500,000 and 1 million barrels per day (bpd) to support the market, OPEC+ sources told Reuters.
Earlier this week, a source familiar with Russian thinking said Moscow could suggest a cut of up to 1 million bpd, while an OPEC source put the likely figure closer to 500,000 bpd. Talks are expected to continue ahead of the meeting.
https://www.reuters.com/markets/commodities/opec-oil-output-cut-talks-narrow-05-10-mln-bpd-sources-say-2022-09-30/?rpc=401&
US July data is out.
July is up by 12 kb/d over June and 10 kb/d over November 2021.
Full report late Saturday or mid Sunday.
With the current oil price and current D &C costs of the shale wells, the IRRs are not very appealing. Trading dollars virtually. Dennis you may want to use the actual production statistics for your shale model. Peak oil or no peak oil, it’s the well economics that drive industry health and growth.
Now the administration is discussing a windfall profits tax. Where was the windfall profits tax credit when the price was -$30 per barrel two years ago. Letting non energy experts manage our energy future ( Janet granholm) is like asking me to Sous Chef at a fine restaurant.
It’s no wonder why the world is running out of energy.
LTO Survivor,
Can you reveal current D+C costs? Mike Shellman posted recently at his blog that it looked like wells were pretty profitable, or perhaps I misunderstood, he assumed oil at $90/bo and NG at $5/MCF.
https://www.oilystuffblog.com/single-post/what-s-the-hold-up
The average 2020 Permian well based on Novilabs well profile data has and EUR of 479 kbo and 2030 MMcf NG and 168 kb NGL, assumes well is shut in at 20 bopd. Cumulative net revenue is 27 million at 169 months assuming $4.60/Mcf, and wellhead oil price of $75/bo and NGL price of $26.25/b, real IRR is 45% assuming a well cost of $12 million. At 36 months cumulative net revenue is 15.5 million and at 60 months cumulative net revenue is 19.3 million for the prices that I have assumed.
Note that real IRR adjusts for inflation, nominal IRR = real IRR plus average rate of inflation. In a case where real IRR is 45% and average rate of inflation is 3%, the nominal IRR would be 48%. Not sure what the target is for the oil industry, but a 48% IRR is pretty good.
I would like to see the details of this computation.
Hi Schinzy,
See spreadsheet linked below
https://peakoilbarrel.com/wp-content/uploads/2022/10/breakeven-Permian2020c.ods
These charts show exploration drilling for some large independents. All of them have been concentrating operations in the US as opportunities have reduced through the rest of the world. Occidental numbers include Anadarko before 2018. The high numbers (off scale by a factor of four) in the early years are from Apache drilling of small wells in Canada, which it quickly gave up on. Success rates have been pretty good and improving, maybe reflecting the few wells drilled as the companies have reduced their presence in certain areas.
The exploratory drilling in shale basins peaked around 2012 and then faded away as delimitation of the prospective areas was set. The uptick in 2021 is mainly from COP, which bought the Shell assets in the Permian. It drilled 87 wells in the lower 48 in 2021 after only 3 in 2020 and 35 in 2019, so presumably most were in the newly acquired areas. It is a bit suspicious that every one was successful, so I doubt if they really counted as true wild cats.
The reserves of all the companies have fallen rapidly since the 2014 price crash. Hess has done better recently because it is a junior partner in Guyana but the main reason for the uptick last year was purchases, particularly by COP in the Permian.
This shows the discovery, which have equally been on a falling trend for the last decade. Note these are SEC reported numbers so really reflect FIDs when development of resources has been approved, which may be 2 to 5 years after the original discovery well was drilled. The decline in exploration wells is likely to mean that discoveries will continue to fall, as will remaining reserves and, probably, production.
I would argue that, as LNG production grows, oil will become less relevant. LNG is an excellent feedstock for petrochemical plants, but more importantly, for fertilizer. And not enough importance has been attributed to the wonderment of the LNG train, which removes not only water but salts, toxins, and other impurities. Soon, it will be unthinkable to use plain old NG, because LNG has become the world’s cleanest fossil fuel. And there’s a lot of NG: every time something falls over dead, NG is produced. This is in contradistinction to the making of oil, which requires at least a million years at a narrow window of temperature and pressure.
Historically, there was great concern about how to feed a growing population dating back 175 years. The soil was depleted in Europe. When the Haber-Bosch process was perfected, the addition of ammonium nitrate to soil brought about an immediate doubling of crop production. Today, in some parts of the world, food is being denied for the merely hungry and is instead given to the starving. Tomorrow will be much worse.
Soon, the results of ammonium nitrate scarcity will become apparent. The United States outsourced 75% of its fertilizer needs–it’s a dirty business. Putin understood the importance of nitrogen fertilizer, and also phosphates. Spain had to subsidize its largest fertilizer provider because of the price and scarcity of NG. Without NG, no significant ammonium nitrate fertilizer. Without fertilizer, food production will be cut in half.
Not to be a scare-monger but this scenario is coming to a place called home. There is no chaos larger than that produced by hunger, and no greater insult to the human spirit. We will soon see the effects of dividing the world into fossil fuel haters and non-haters, refusing to establish a sustainable energy policy, playing the blame game, and geopolitical shuffling. We will see this next crop year.
A world that is heating up is one thing. A world with one-quarter of its population starving and angry is quite another. “Winter is coming.”
Solutions are not always unique: https://toopi-organics.com/
Gerry Maddoux,
There is a huge amount of human and animal waste that can be utilized as fertilizer. As natural gas becomes scarce and the price of fertilizer produced with natural gas grows, we may see more fertilizer produced using this vast waste stream from humans and livestock.
The Chicoms use coal as the feedstock for their nitrogenous fertiliser. That capital cost of that route is twice the capital cost of the natural gas route. You could also use power from nuclear plants to electrolyse water to produce hydrogen as your feedstock, if you wanted to. And that is where we will end up when all the coal is mined out.
HaHaHa. A great point. And I’m all for it. I don’t know of any downside except salinization of the soil from the western diet but that could be easily managed in bulk solution.
In point of fact, great amounts of artificial nitrate fertilizer are unused by crops and wind up polluting the groundwater, which ultimately makes its way to the oceans of the world. And the making of nitrate fertilizers is not without an environmental cost.
And with your solution, lots of flush water would be saved. I’m thinking this might work.
Gerry Maddoux,
I doubt the solution is simple, but it might be feasible and potentially lower cost than fertilizer produced with methane when the price of natural gas is $20/Mcf or higher (as is currently the case in Europe.)
A new thread updating US July oil production has been posted
https://peakoilbarrel.com/us-june-oil-production-shows-little-growth/
A new open thread Non-Petroleum has been posted.
https://peakoilbarrel.com/open-thread-non-petroleum-october-2-2022/