A guest post by Ovi
All of the Crude plus Condensate (C + C) production data for the US state charts comes from the EIAʼs September Petroleum Supply monthly PSM which provides data up to July 2022.
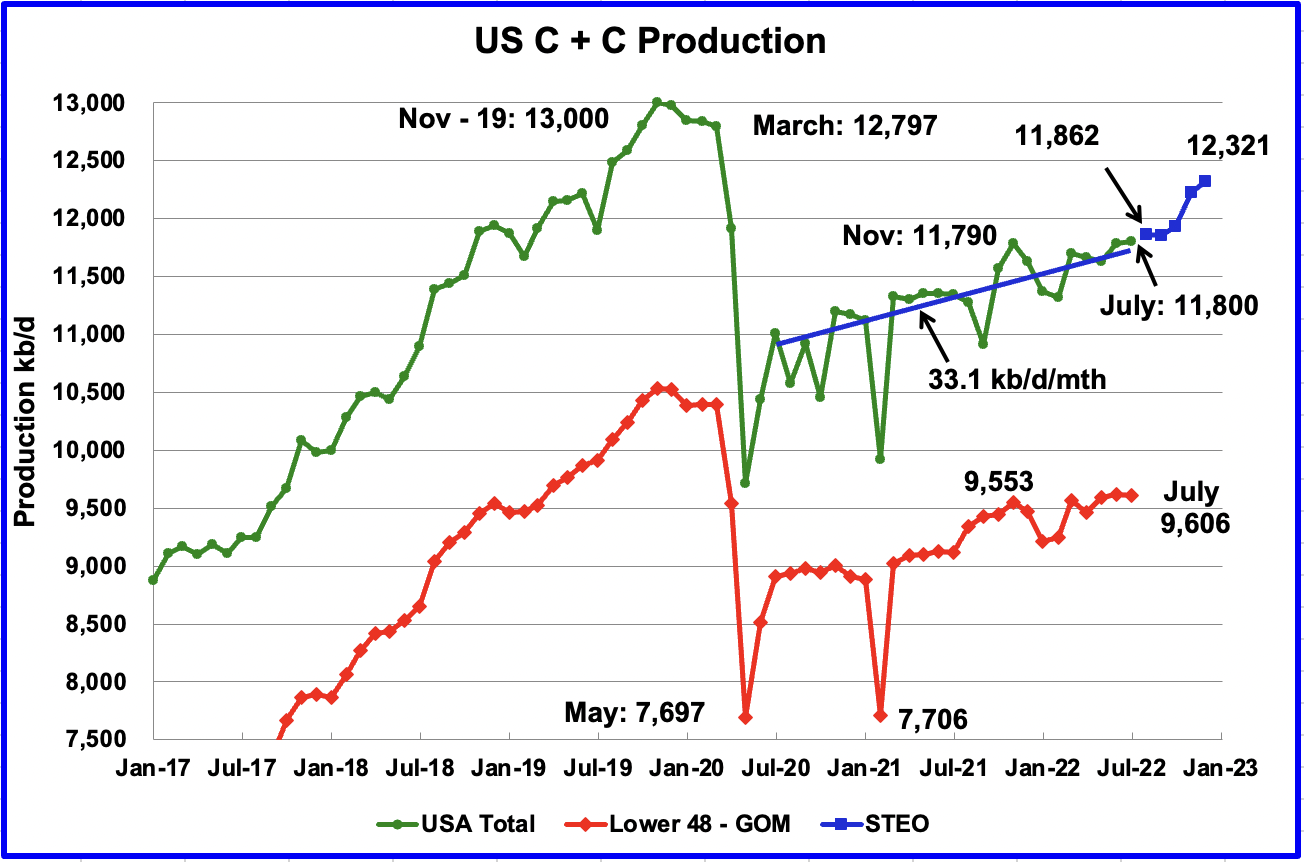
U.S. July production increased by a minimal 12 kb/d to 11,800 kb/d. For July, the states with increasing production were offset by states with decreasing production. July’s production was a new recent high. Production was 10 kb/d higher than November 2021 which was producing at a rate of 11,790 kb/d. However it should be noted that June’s oil production was revised down from 11,816 kb/d to 11,788 kb/d in the September report.
While overall US production increased, a clearer indication of the health of US onshore L48 oil production can be gleaned by looking more closely at those states. In the On-shore L48, July production decreased by 11 kb/d to 9,606 kb/d from June’s 9,617 kb/d.
The blue graph, taken from the September 2022 STEO, is the production forecast for the US from August 2022 to December 2022. Output for December 2022 is expected to be 12,321 kb/d, 127 kb/d lower than projected in the August report.
From August 2022 to December 2022, production is expected to increase by 459 kb/d or at an average rate of 115 kb/d/mth. This rate is more than triple the rate of the Blue line covering US C + C production from July 2020 to July 2022. The blue line, which just used July 2020 data and July 2022 data to estimate an average rate, has a production growth rate of 33.1 kb/d/mth. The much higher forecast production rate for the last half of 2022 could be related to an upcoming increase in GOM production. See GOM chart below.
Oil Production Ranked by State

Listed above are the 10 states with the largest US production. These 10 accounted for 81.9% of all U.S. oil production out of a total production of 11,816 kb/d in July 2022. As can be seen, the states with increasing production were offset by decreasing production in the remaining states for no net monthly gain.
On a YoY basis, US production increased by 470 kb/d with the majority having come from New Mexico and Texas.
State Oil Production Charts
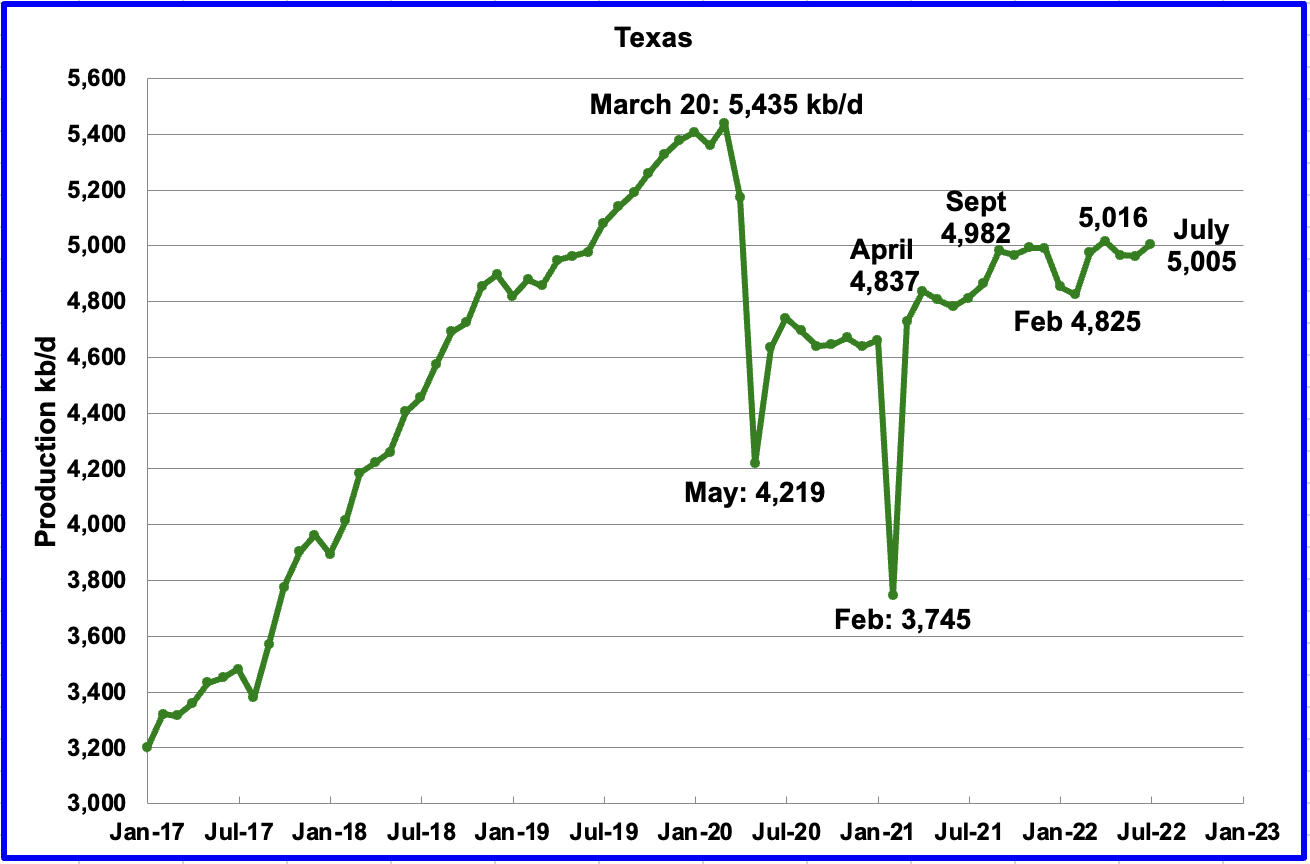
Texas production increased by 43 kb/d in July to 5,005 kb/d from 4,962 kb/d in June.
In September 2021 there were 205 Hz oil rigs operating in Texas. By the last week of July 2022, 309 Hz oil rigs were operational, an increase of 104 rigs and production increased from 4,982 kb/d in September 2021 to 5,005 kb/d in July, an increase of just 23 kb/d over a period of ten months.
Texas production has been essentially flat over the last 10 months. This could be due to the slower growth in the Texas Permian being offset by the decline in the Eagle Ford basin.
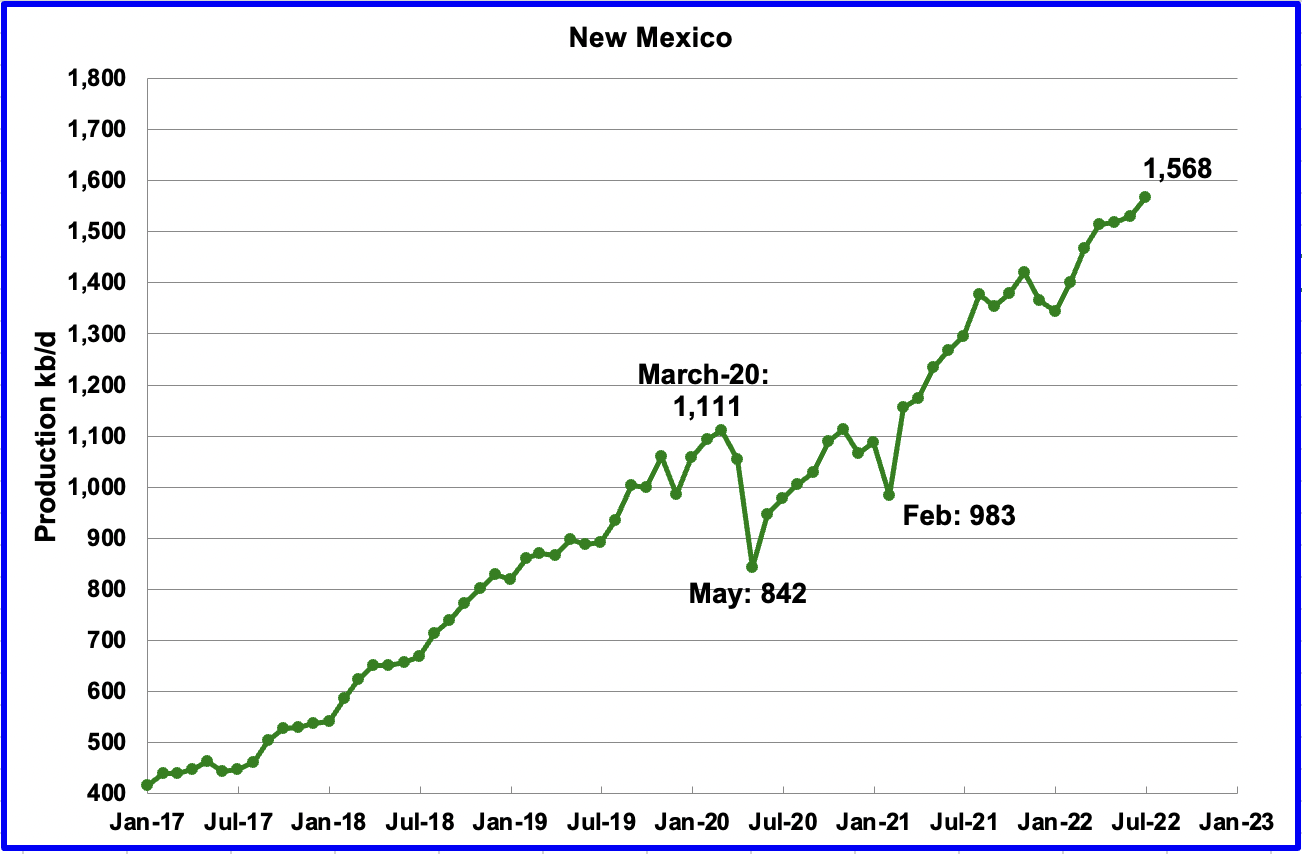
July’s New Mexico production increased by 38 kb/d to 1,568 kb/d to a new record high. From January 2022 to the end of May, close to 92 rigs were in operation in the New Mexico Permian. However in July operational rigs peaked at 104. The recent production increase is due to more wells being drilled and more wells being completed than drilled.
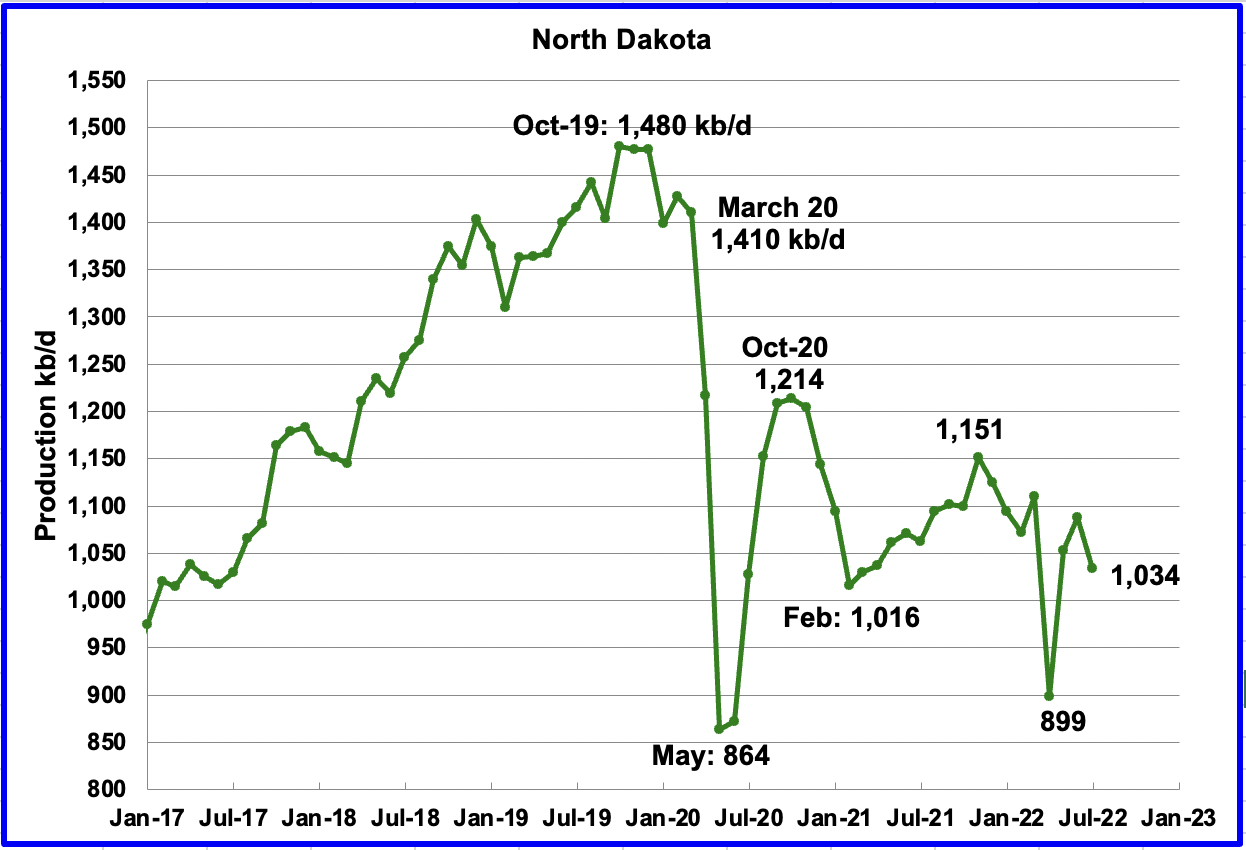
North Dakota’s July output dropped to 1,034 kb/d, a decrease of 54 kb/d from June.
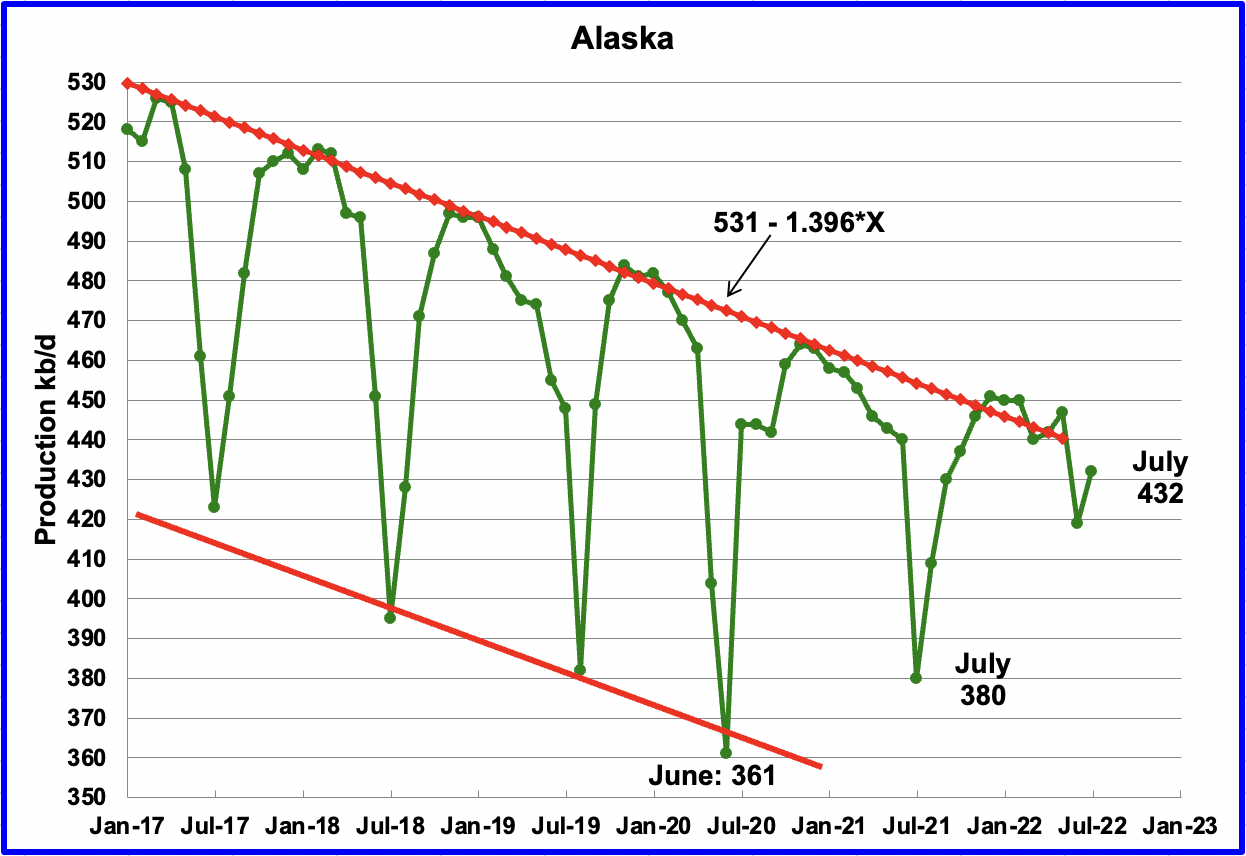
Alaskaʼs July output increased by 13 kb/d to 432 kb/d. July production typically rebounds due to the end of summer maintenance.
ConocoPhilips continues to pursue the Willow oil project in Alaska while NGO’s oppose it. Alaskan officials hope the project will help offset declining oil production in the state.
“The largest proposed oil and gas project on U.S. federal lands moved one step closer to approval in early July. At 180,000 barrels per day, or 629 million barrels of oil over the course of its 30-year lifetime, the Willow Project would produce more oil than any other public-lands fossil fuel development. The Trump administration’s Interior Department approved the project in October 2020. But in August 2021, a federal judge rejected it following a lawsuit over the project’s impacts on the climate, nearby communities and area wildlife. The Biden administration agreed to conduct another environmental review, which the Bureau of Land Management (BLM) released on July 8.”
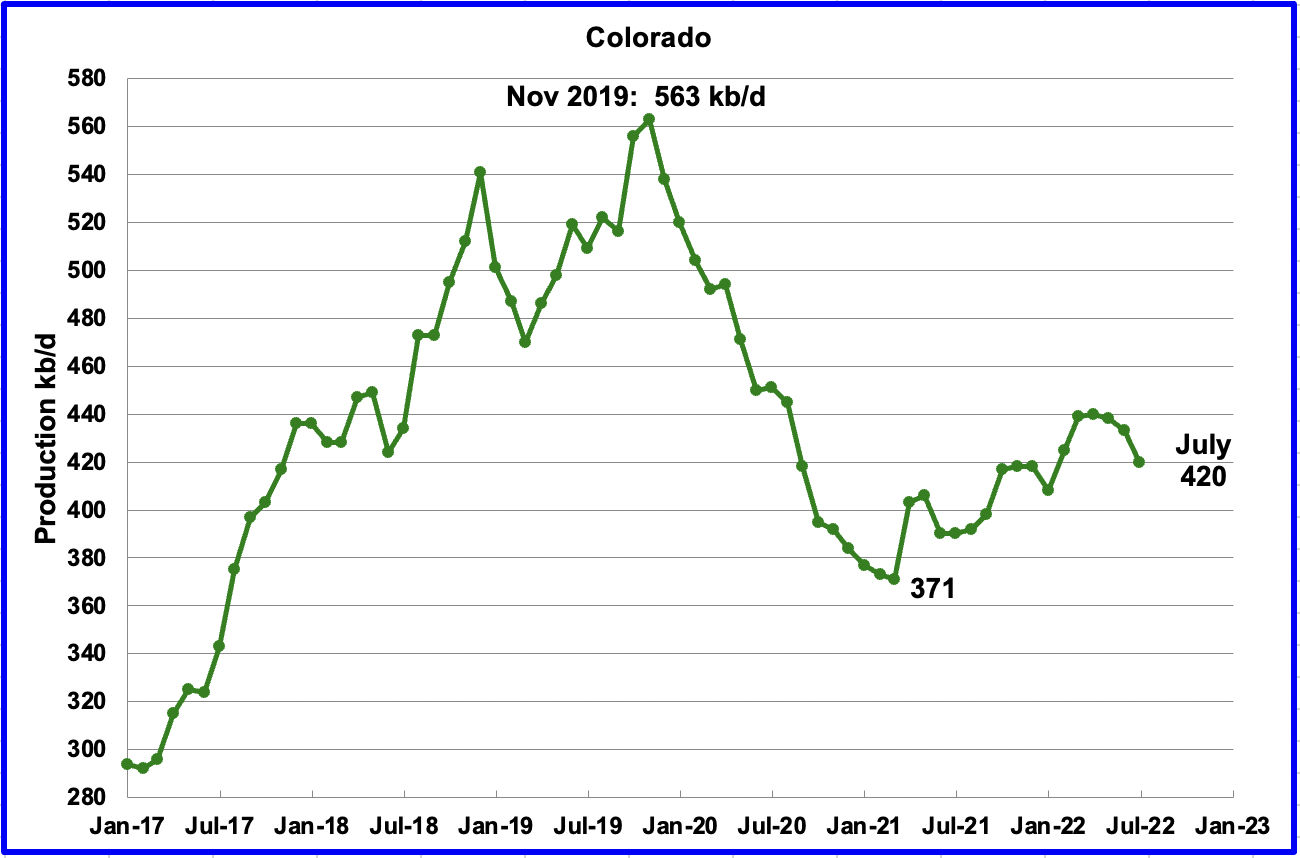
Coloradoʼs July production decreased by 13 kb/d to 420 kb/d. After having flat production in March and April, production began to decrease. A recent Colorado report forecasts little oil growth is likely in Colorado for 2022.
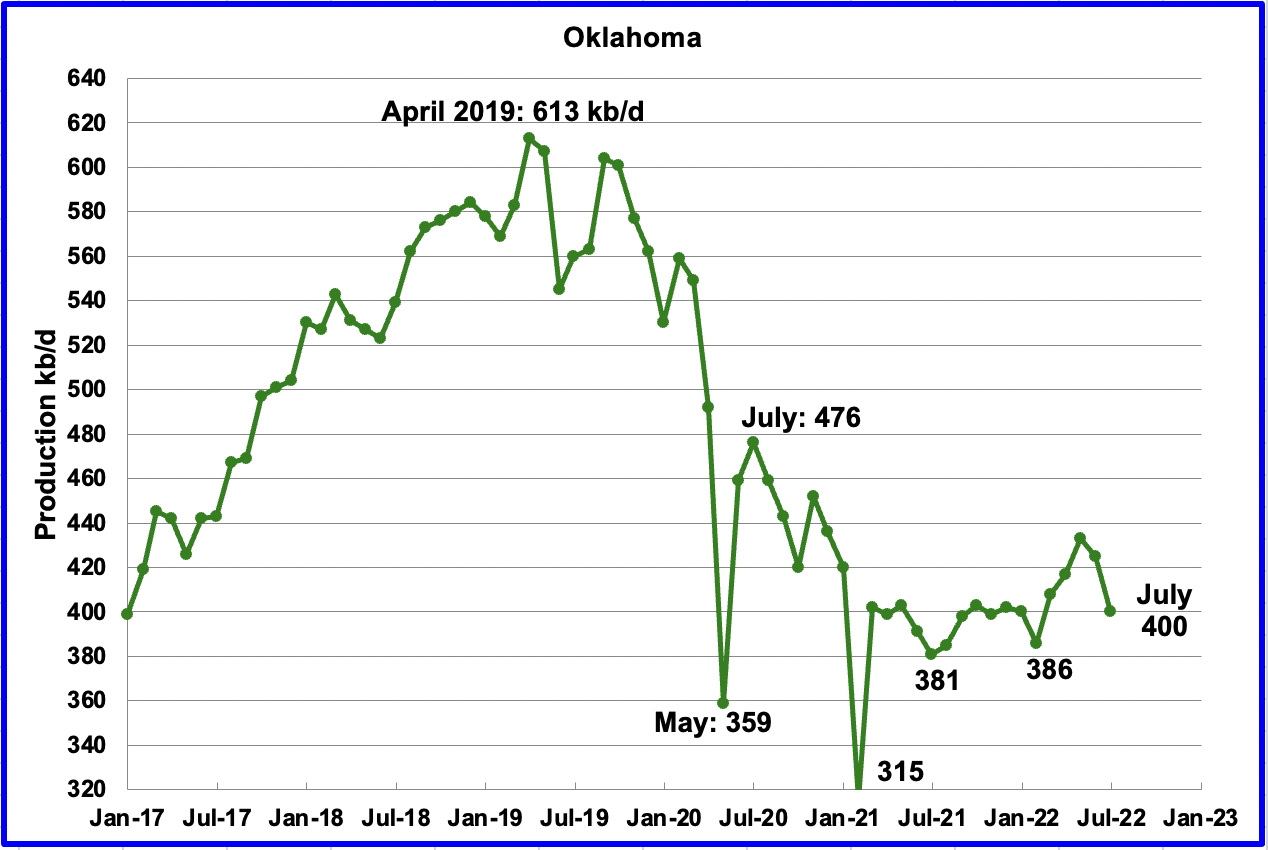
Oklahoma’s output in July decreased by 25 kb/d to 400 kb/d. From January to April, close to fifty rigs were operating in Oklahoma. In July the rig count increased to 57. Since March 2021, production has been hovering around 400 kb/d.
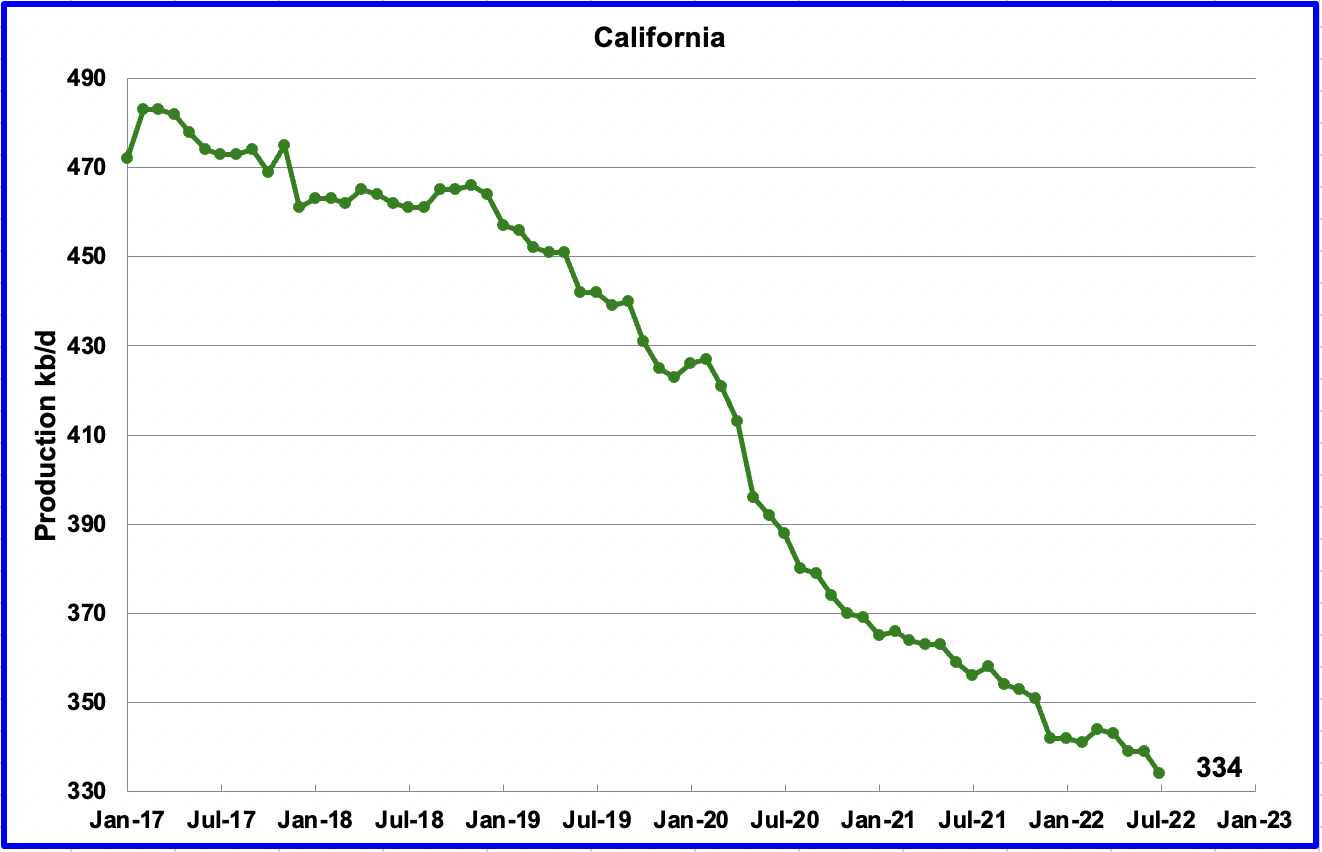
Californiaʼs slow output decline continued in July. Output decreased by 5 kb/d to 334 kb/d.
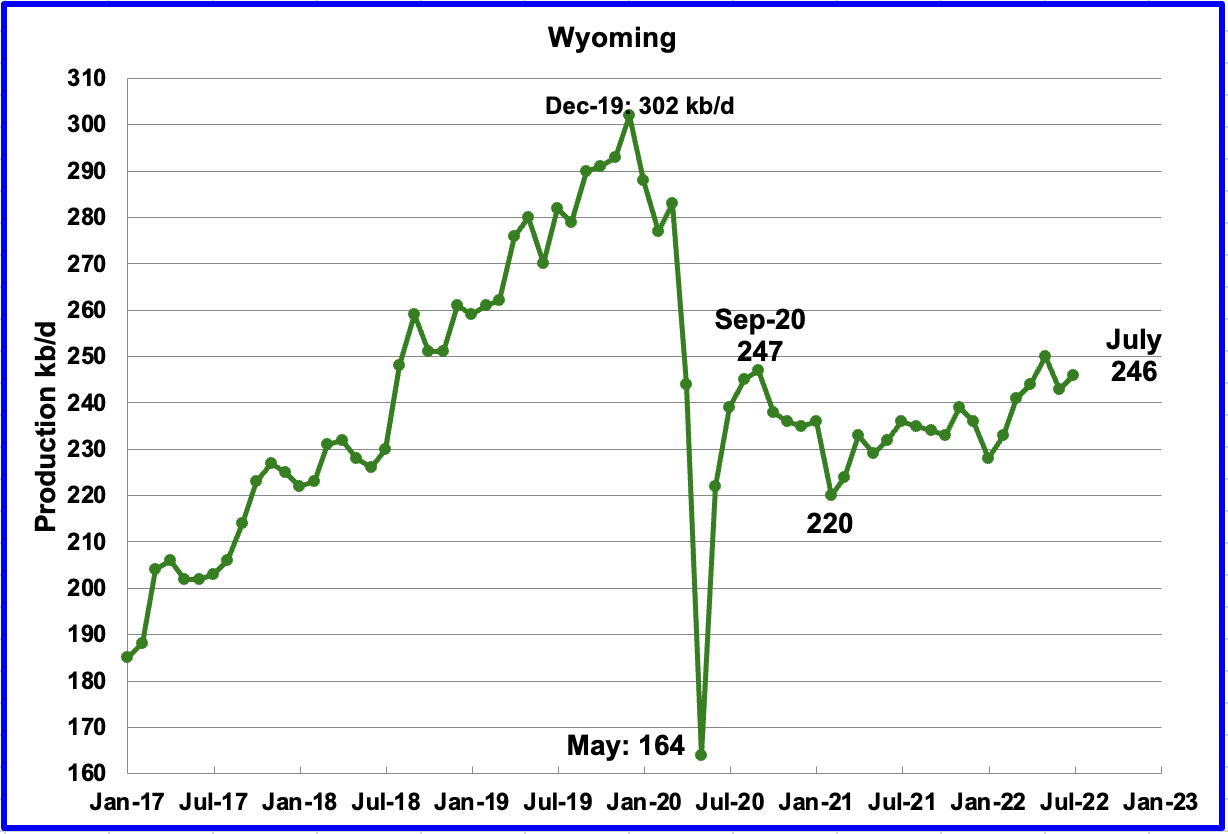
Wyoming’s oil production has been on a slow unsteady uptrend from the low of 220 kb/d in February 2021 due to increased drilling. July’s output increased to 246 kb/d.
In August, a new oil field was discovered. A geological company confirmed the Wyoming deep discovery has total Original Oil in Place of 993.5 million barrels.

Utah’s production hit a new high in May of 122 kb/d but dropped in June and July. July’s production decreased by 1 kb/d to 121 kb/d. Utah had 9 rigs operating in early July and then dropped to 7 in the last two weeks.
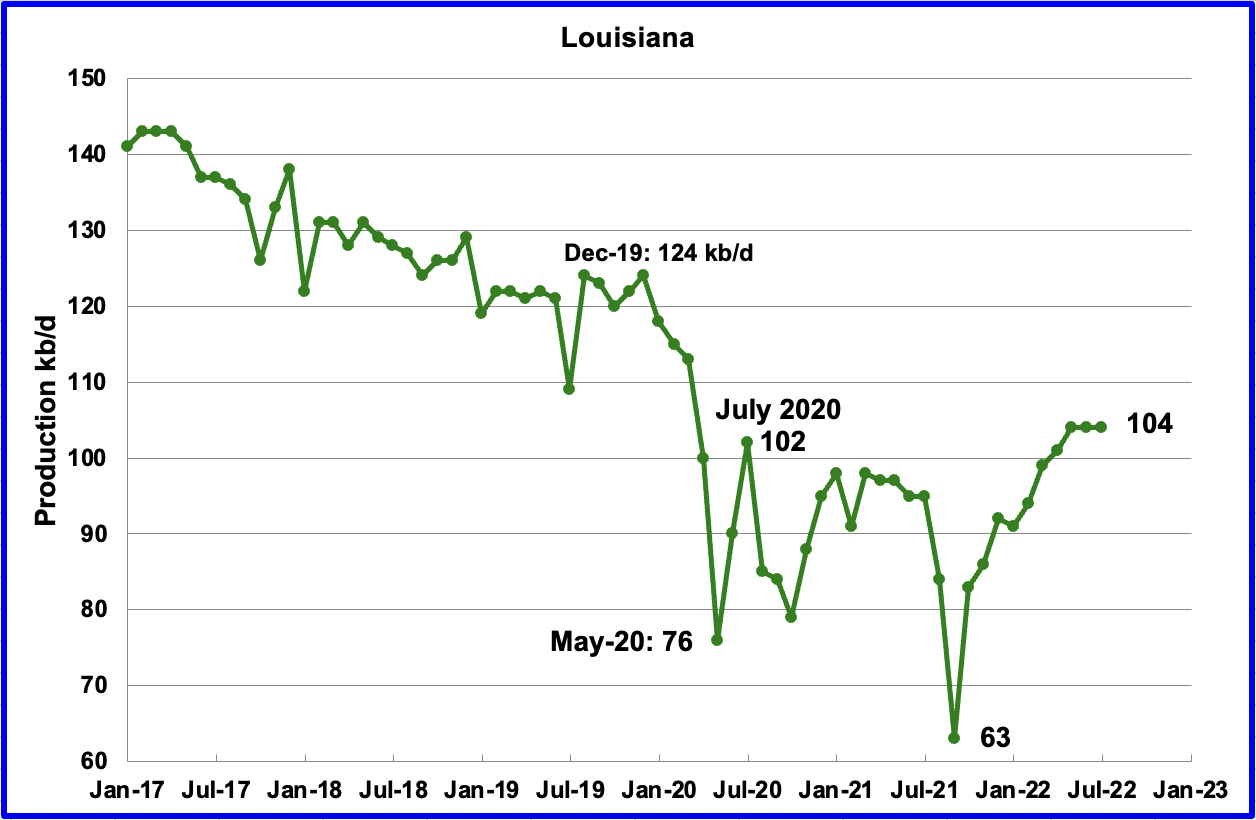
Louisiana’s output was unchanged in June and July at 104 kb/d. July’s output of 104 kb/d exceeded its previous high of 102 kb/d in July 2020.
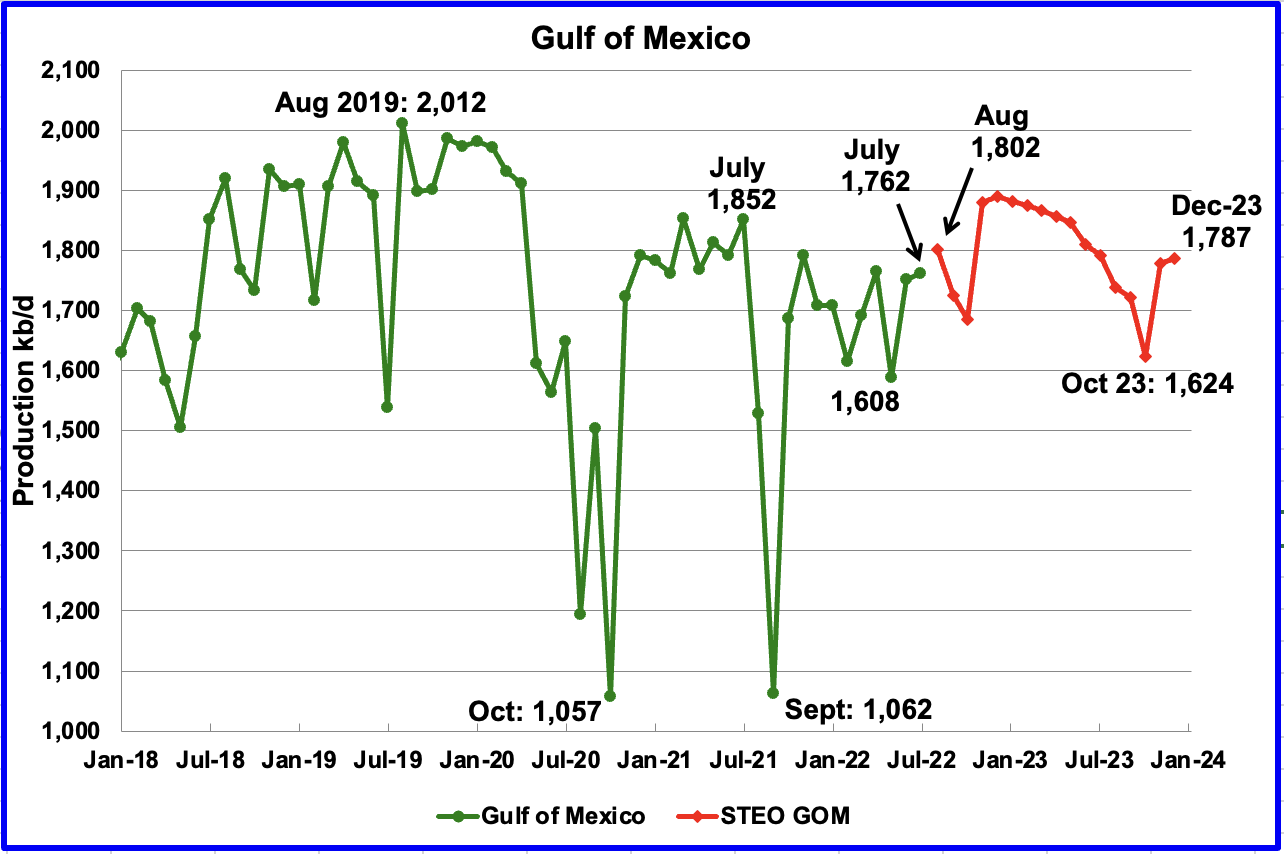
GOM production increased by 10 kb/d in July to 1,762 kb/d. If the GOM was a state, its production would normally rank second behind Texas.
The September 2022 STEO projection for the GOM output has been added to this chart and projects output will be 1,787 kb/d in December 2023, slightly lower than August 2022 at 1,802 kb/d. For August 2022, the STEO is projecting an increase of 40 kb/d to 1,802 kb/d. However over the next 18 months, the sharp increase shown in November will be slowly eroded by the 24/7 decline rates in other GOM fields.
A Different Perspective on US Oil Production
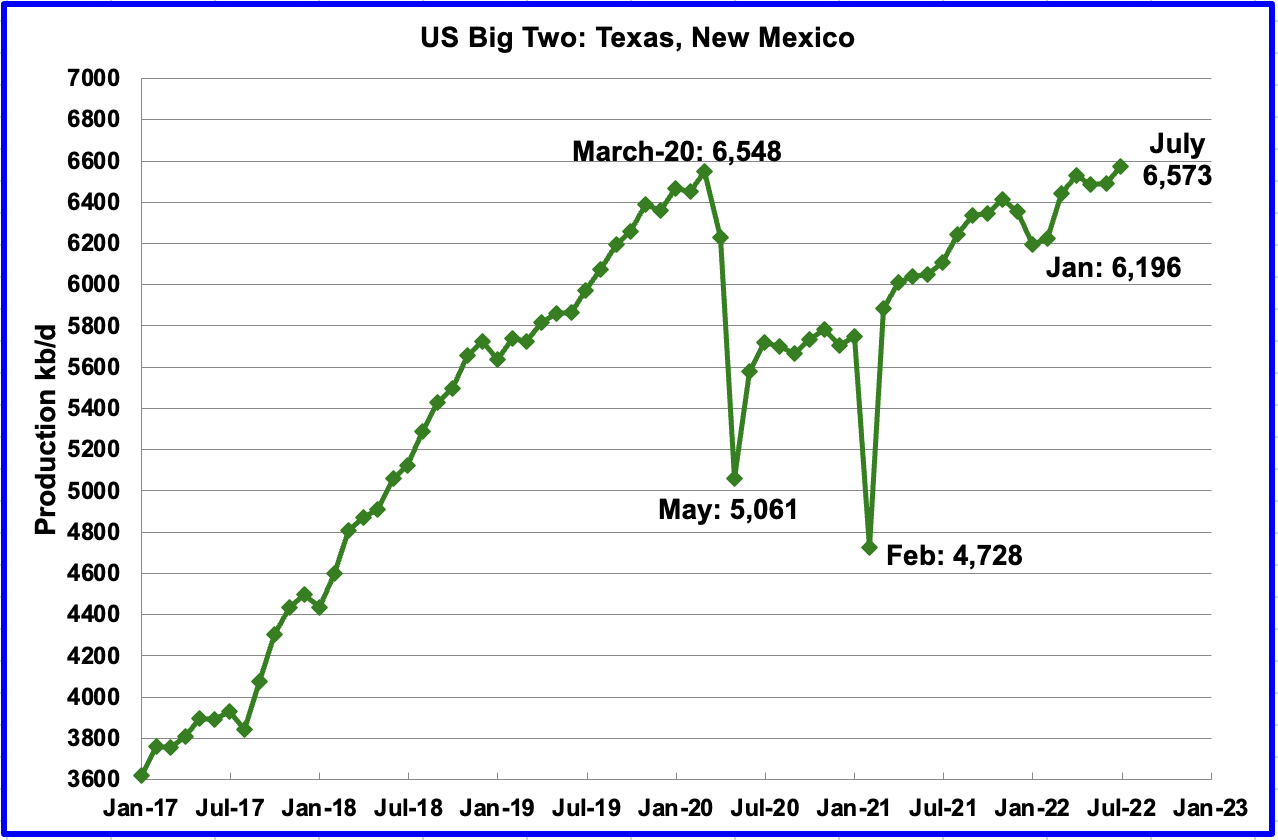
The Big Two states, combined oil output for Texas and New Mexico.
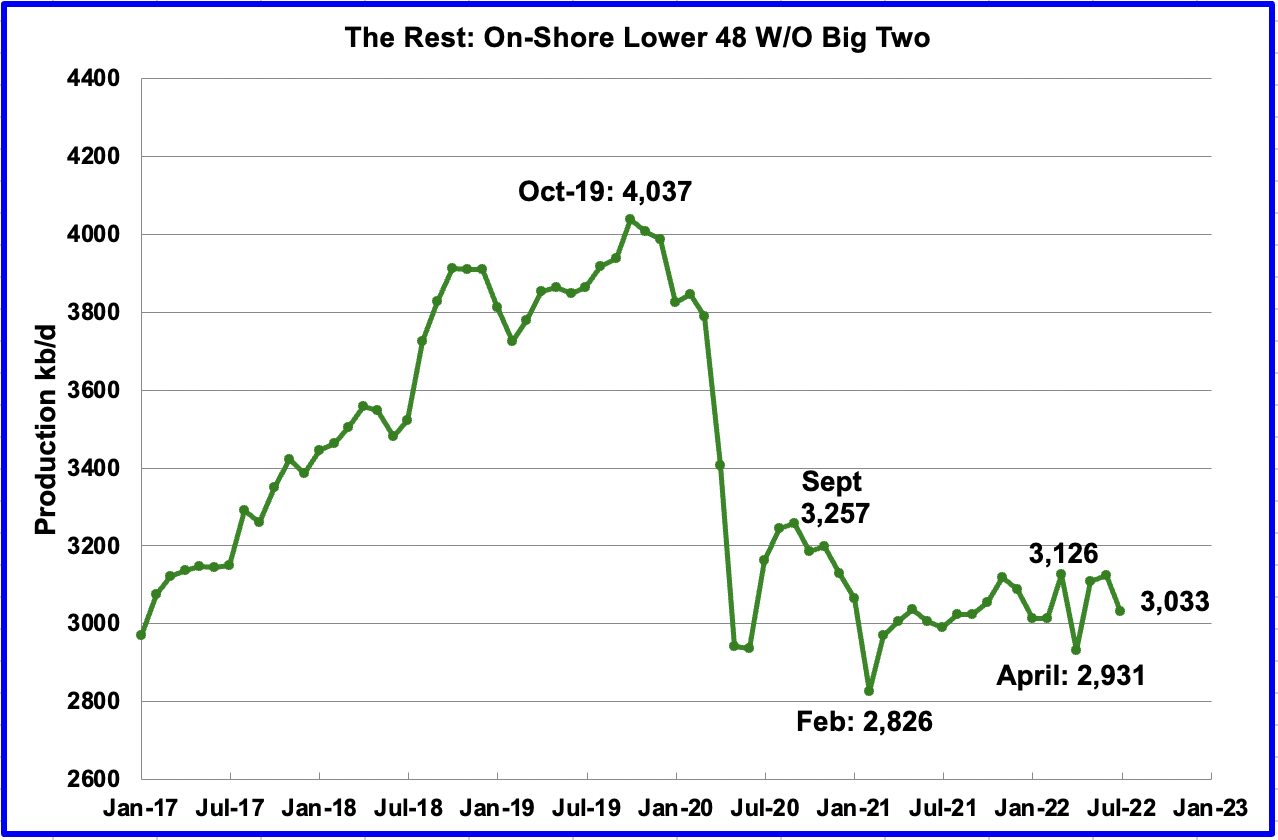
Oil production for The Rest
To get a different perspective on US oil production, the above two charts have segregated US state production into two groups, “The Big Two” and the “On-Shore L48 W/O Big Two” or The Rest.
July’s production in the Big Two states increased by a combined 81 kb/d to a new high of 6,573 kb/d with Texas increasing by 43 kb/d and New Mexico adding 38 kb/d.
Over the past year, production in The Rest appears to be holding steady at close to 3,100 kb/d. In June The Rest dropped by 92 kb/d to 3,033 kb/d.
The main thing to notice in the Rest Chart is that current production is 1,000 kb/d below the high of October 2019. The question we need answered Is “Is this a permeant loss that will never be recovered?
Rigs and Fracs
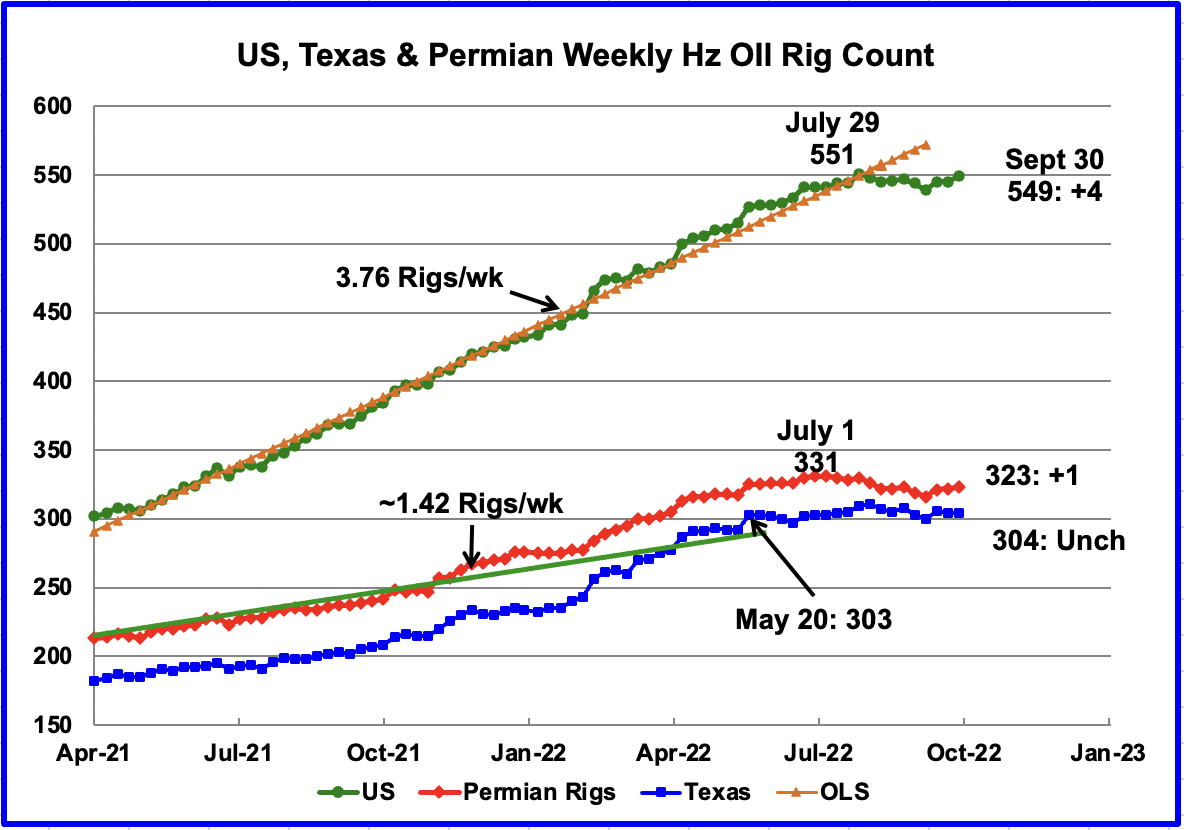
Since the beginning of April 2021 through to the week ending July 29, 2022, the US has been adding horizontal oil rigs at a rate of close to 3.82 rigs/wk, orange OLS line, and peaked at 551 rigs in the week ending July 29. However since then the number of operational rigs has been more or less steady at the 550 level. In the week ending September 30, the number of rigs increased by 4 to 549, bringing them back close to the 550 level.
In the Permian and Texas, the general trend for the number of operational rigs since July has been flat to slightly down. Is this related to the drop in the price of WTI?
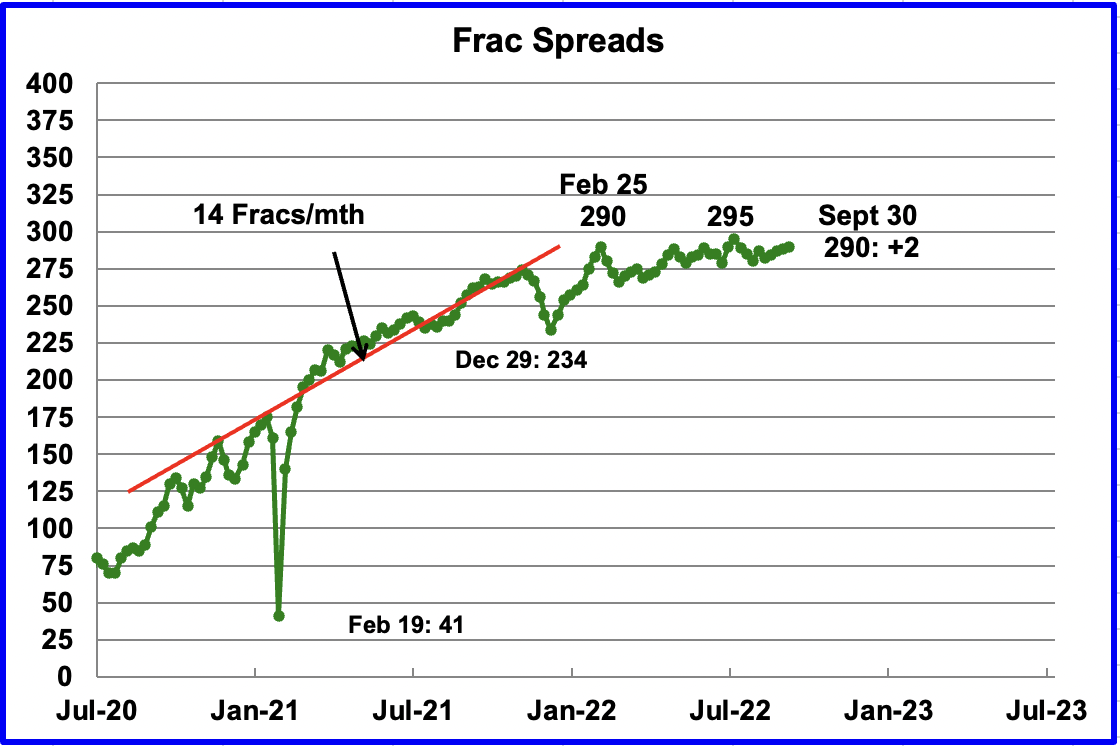
For frac spreads, the general trend since late February can best be described as essentially flat around the 290 level.
Note that these 290 frac spreads include both gas and oil spreads.
September Light Tight Oil Update
The EIA’s LTO database provides information on LTO production from seven tight oil basins and a few smaller ones. The September 2022 report updates tight oil production to August 2022.
The last LTO report was published in May because of operational issues and the EIA took the opportunity to update the information used to produce the LTO. First look at the new September report indicates the updated report is much better and may be more reflective of what is happening in the field.
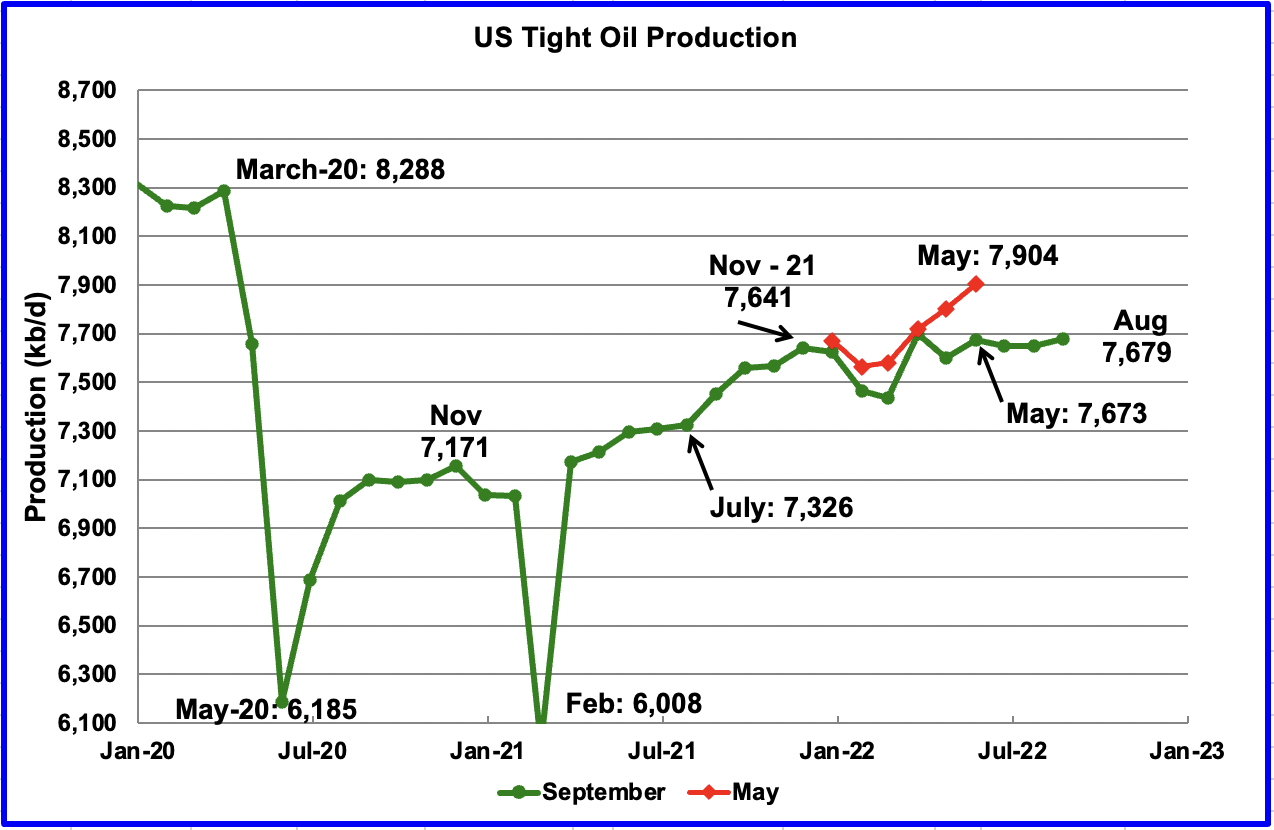
August’s LTO output increased by 28 kb/d to 7,679 kb/d.
The EIA’s September LTO report made significant downward revisions to the production forecast in the May report. The biggest revisions in output occurred for April and May. May output has been reduced by 231 kb/d from 7,804 kb/d to 7,673 kb/d.
More significantly though is that the overall output has shown very little growth from November 2021, 38 kb/d, and no growth since March. This is consistent with the trend shown in the first chart where little growth has occurred since November 2021. The lack of growth is a combination of increasing production in the Permian and decreasing production in the Bakken and Eagle Ford. See below.
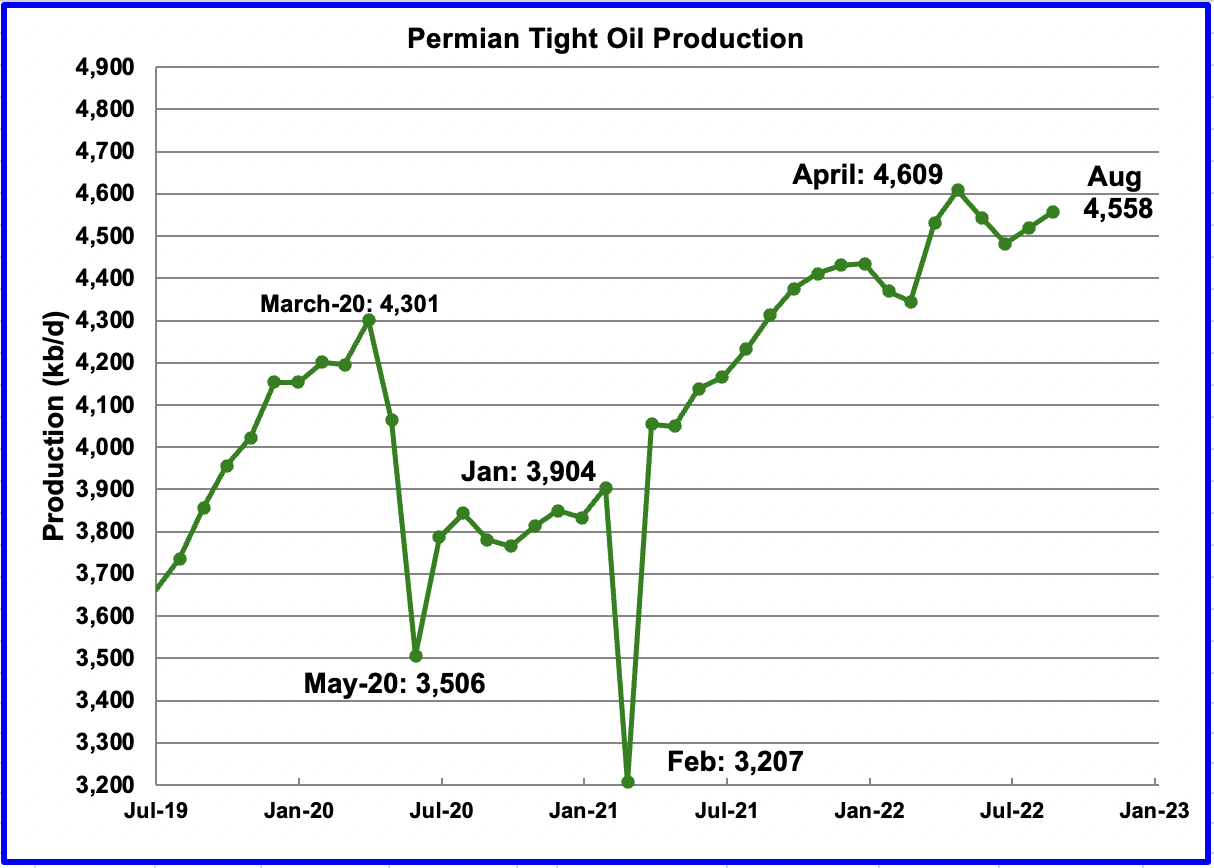
August’s output increased by 38 kb/d to 4,558 kb/d and is 257 kb/d higher than the high of 4,301 kb/d recorded in March 2020. It is not clear why production dropped in May and June.
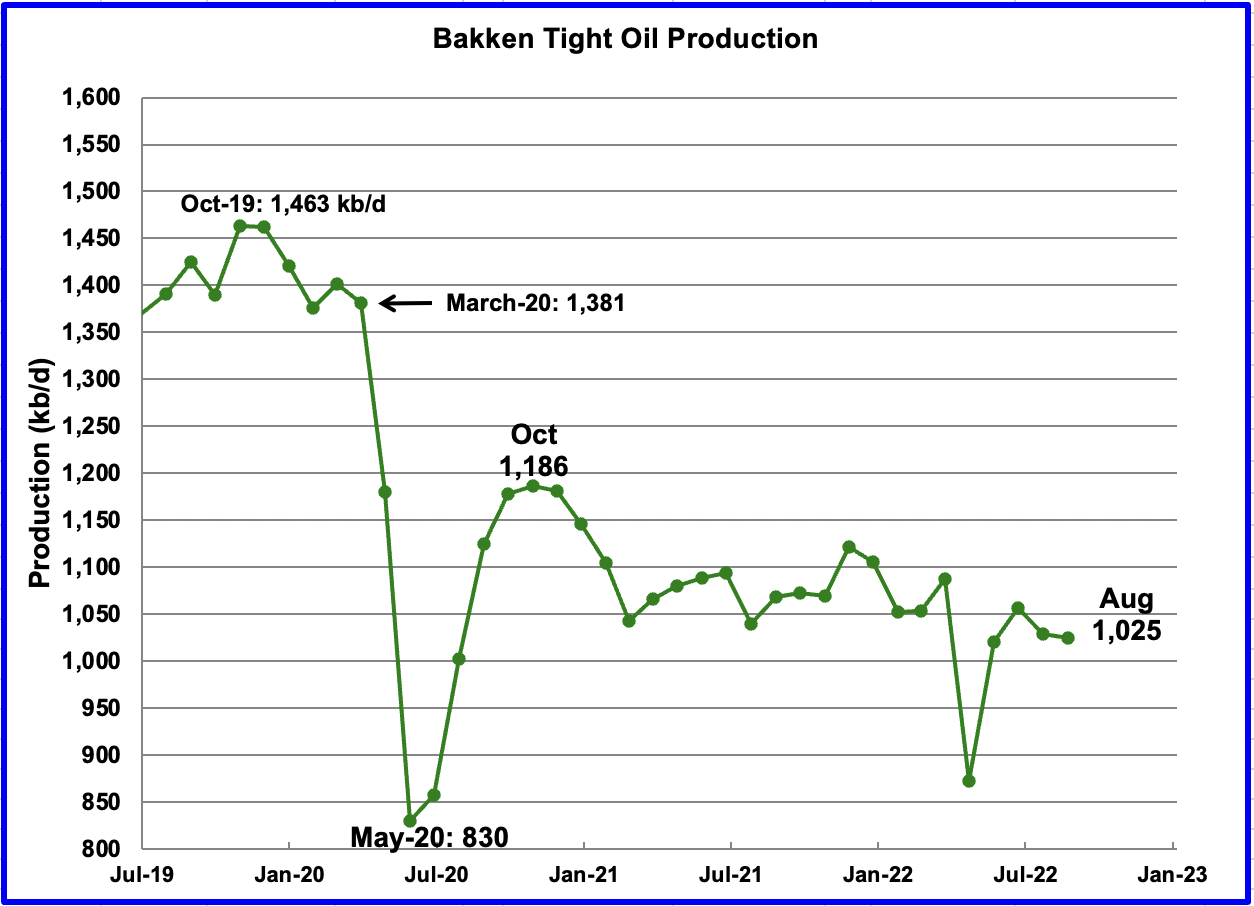
The Bakken’s August LTO output decreased by 4 kb/d to 1,028 kb/d. The output since October 2020 shows the same overall declining trend as in the North Dakota chart above.
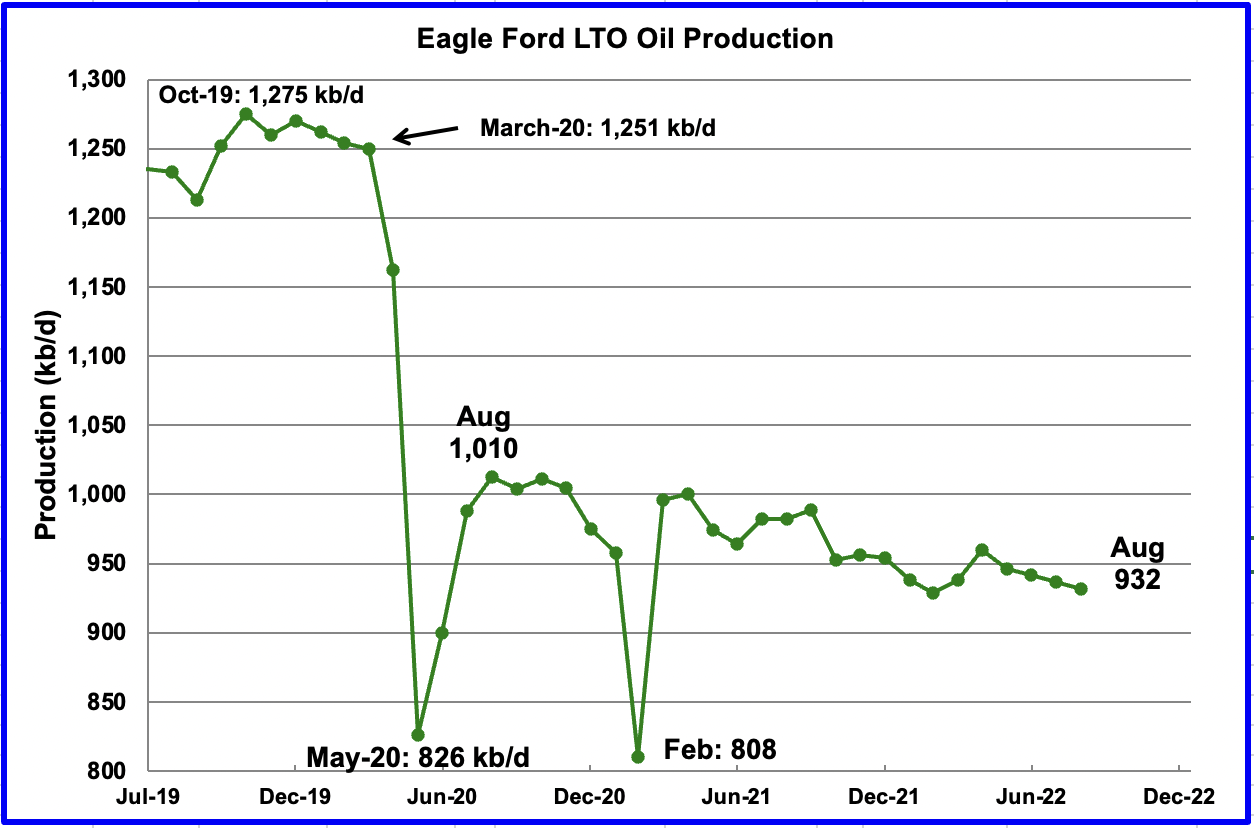
Production in the Eagle Ford basin decreased by 5 kb/d to 932 kb/d in August. Eagle Ford appears to have entered a slow decline phase.
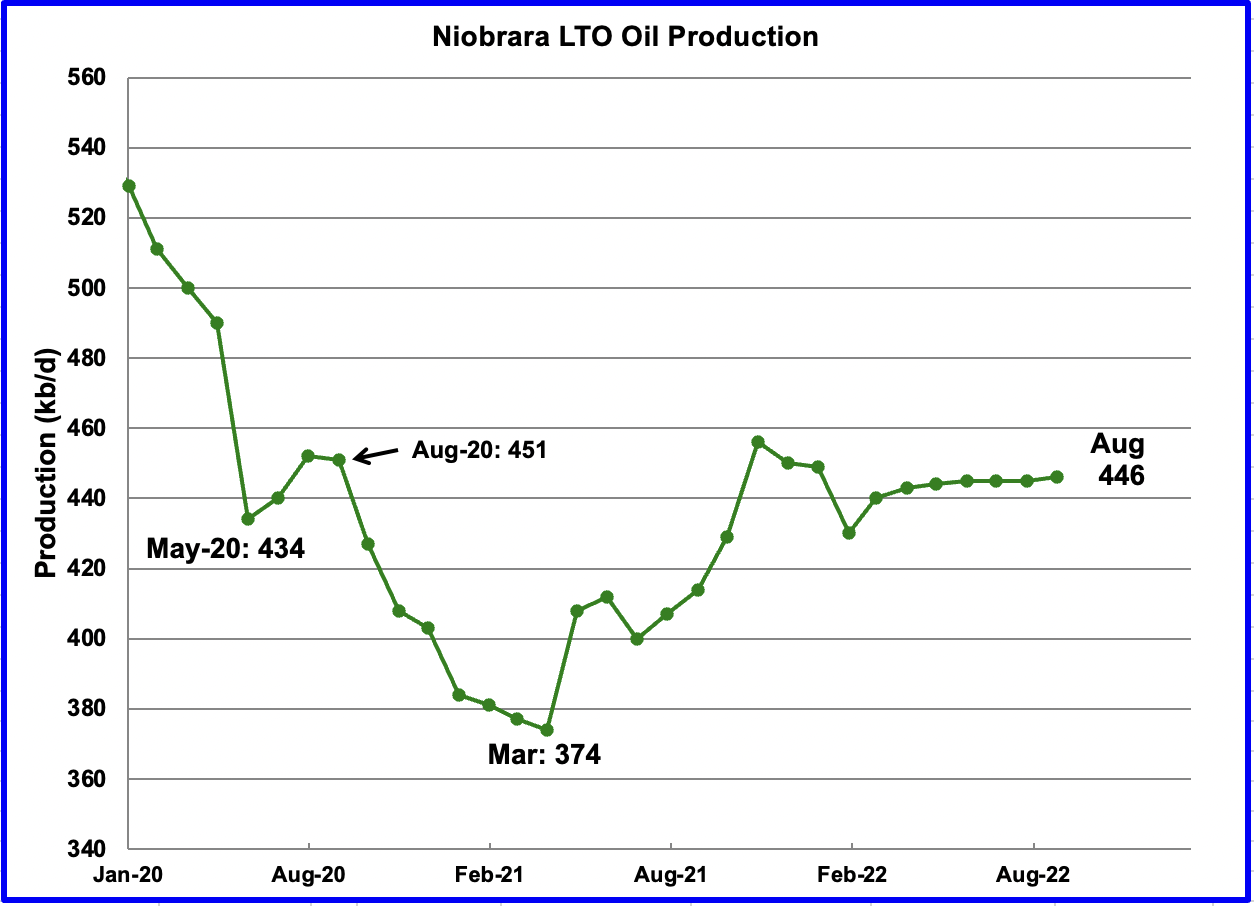
After increasing production from March 2021 to October 2021, output in the Niobrara began to drop in November 2021. Production since April has shown little growth. August’s output increased by 1 kb/d to 446 kb/d.
Production Decline in the Bakken and Eagle Ford
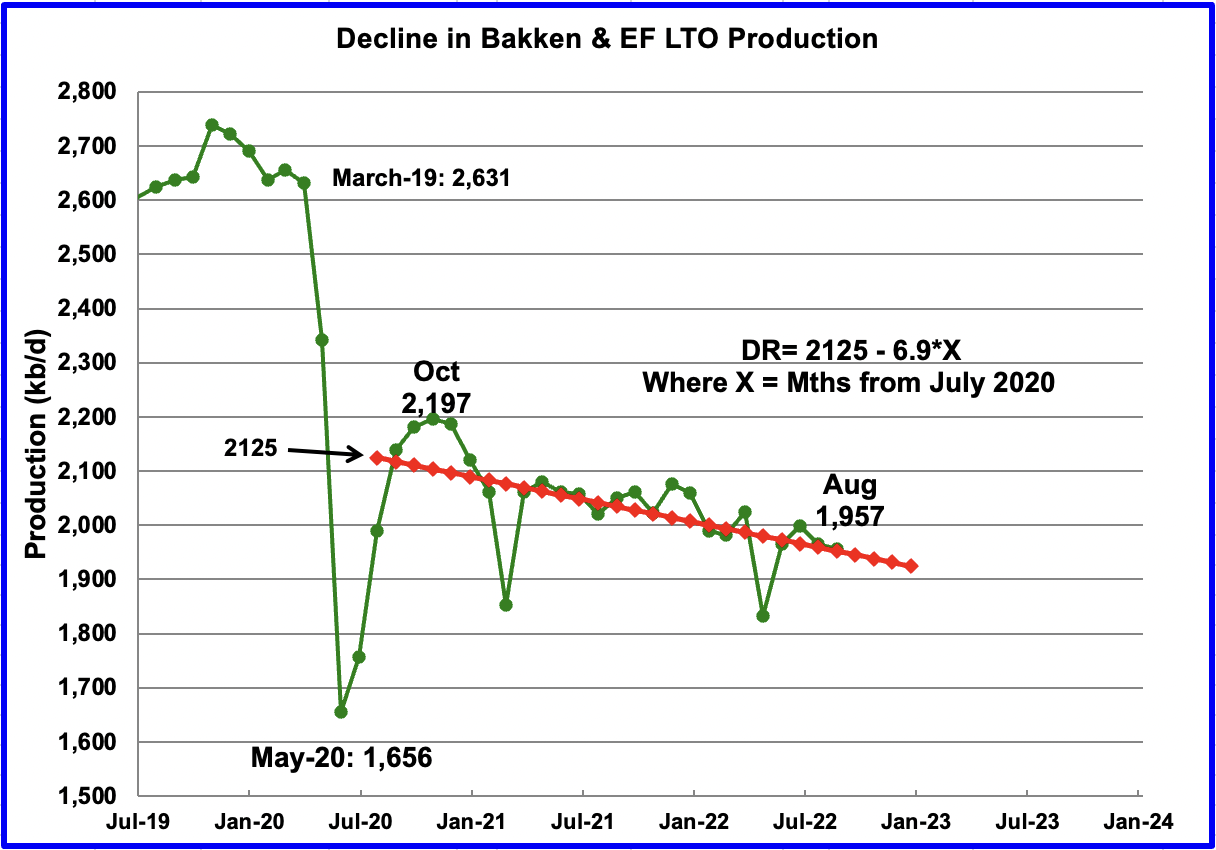
As noted above, monthly production in the Bakken and Eagle Ford basins since October 2020 has been in a slow decline. The decline being addressed here is not the rapid decline associated with LTO wells. Rather it is the decline associated with the lower productivity of new wells, see next chart, along with reduced investment in rigs and frac spreads.
The above chart is the combined output from the Bakken and Eagle Ford basins since they are so similar. Using data from July 2020 to August 2022, the OLS line gives a combined decline rate of 6.9 kb/d/mth.
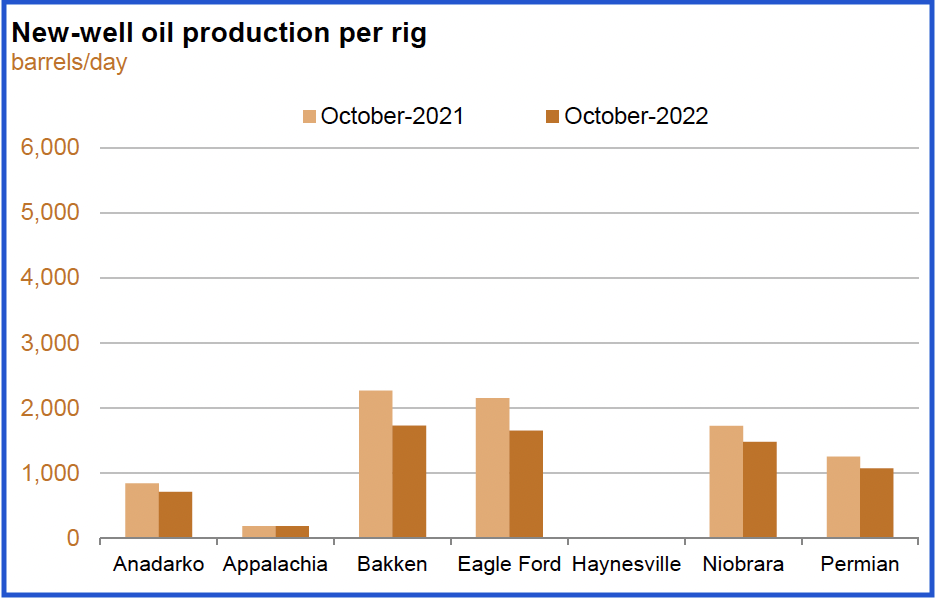
The September DPR report shows YoY decline in new-well oil production per well in the Bakken and Eagle Ford basins.
On-Shore L48 Conventional Production
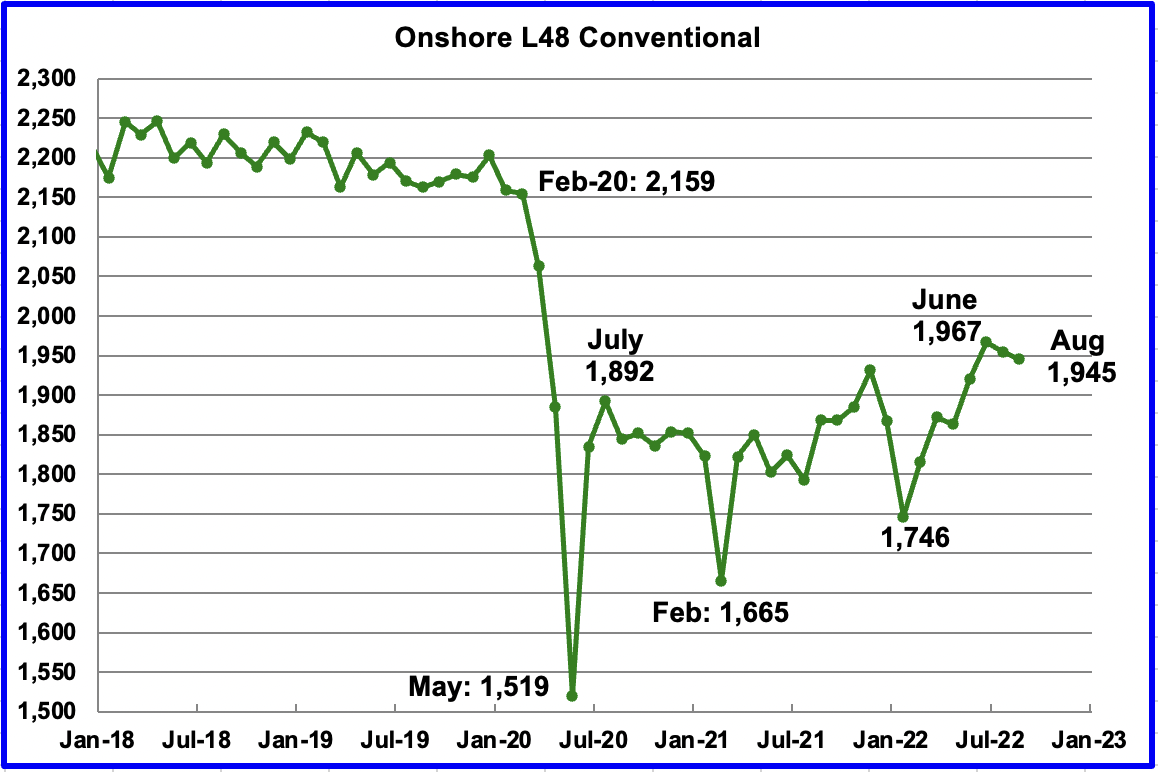
Conventional oil output in the Onshore L48 dropped by 10 kb/d in August to 1,945 kb/d after reaching a new recent high of 1,967 kb/d in June. This estimate is based on a combination of the expected August LTO output and the September 2022 STEO report that has an August 2022 forecast for the US Onshore L48 output. Data from May to July in the STEO has been replaced by the actual EIA production data from the current September report.
A note of caution is in order. This chart is derived by subtracting two large numbers which are subject to revision, particularly the last two months, June and July.
Looking at the Flip Side
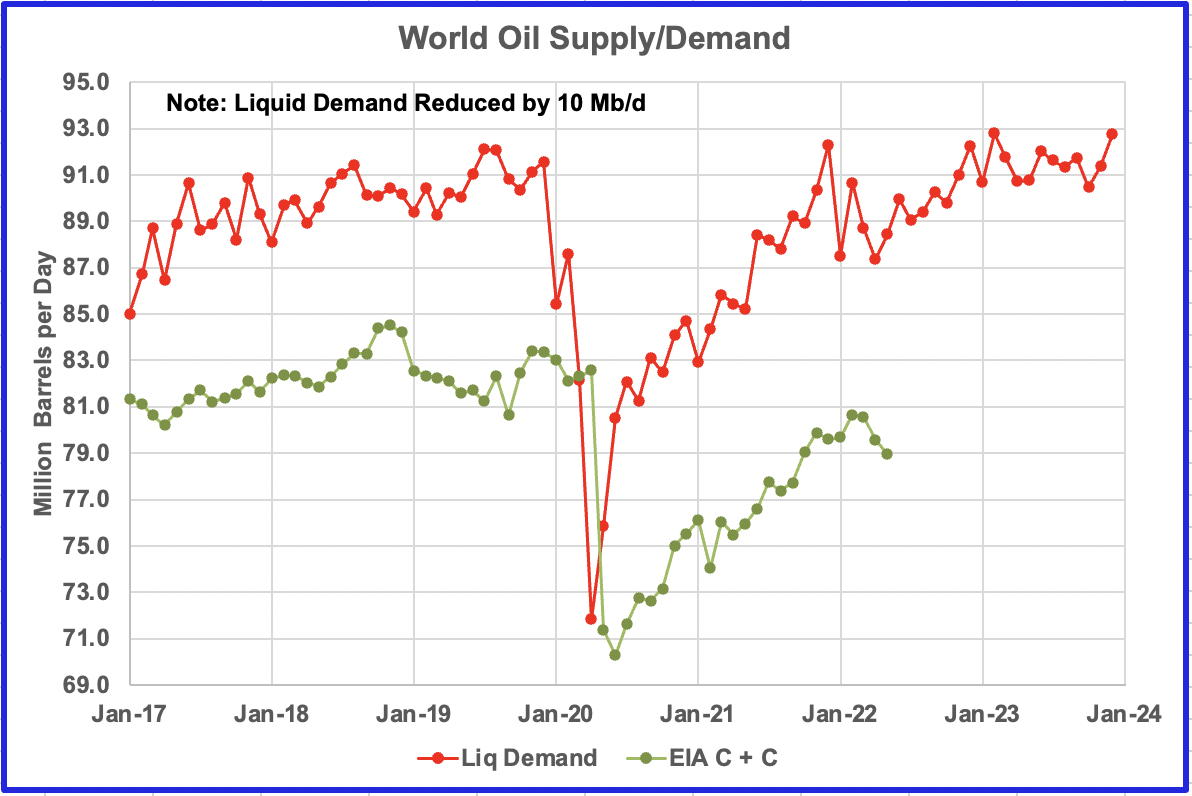
In recent times, many pundits have been addressing the issue of Peak Demand vs Peak Supply with the Peak Demand voices being heard more often. However little evidence is presented to justify the claim that peak demand is in the rear view mirror. While this site focuses on the supply side, we need not restrict ourselves.
The above chart presents the EIA’s STEO data for All Liquids demand. Initially the All Liquids supply data was added to the chart but it was difficult to discern much from it as the lines kept crossing. As a second thought, the EIA C + C data was added. This provided a clearer chart that better showed the trend between supply and demand. To bring the two graphs closer together, 10 Mb/d was arbitrarily removed from the EIA All Liquids demand data.
The average demand for All Liquids (reduced version) from January 2017 to December 2019 was 89.75 Mb/d. The average demand for C + C was 82.13 Mb/d. The difference being 7.62 Mb/d.
On the other side of the pandemic, the oil market has not yet achieved a stable equilibrium due to the impacts of the Ukrainian war. However just looking at the first five months of 2022, average demand for All Liquids is 88.88 Mb/d. Note that demand continues to build from the low of March to year end. From the low of March to year end, demand increases by 5 Mb/d. Average supply of C + C over the first 5 months is 79.89 Mb/d, for a difference of 8.99 Mb/d. The increase in the difference between demand and supply is partially being offset by the SPR release of 1.0 Mb/d.
There are a few things to notice in the above chart. Peak demand occurred in July 2019 while peak production occurred in November 2018. Peak demand will exceed the November 2019 peak again in December 2022 and February 2023, based on the STEO demand forecast. To assess whether the world is approaching a second lower production peak, demand needs to exceed the November 2019 peak for a sustained period in the first half of 2023 so that the supply side can be stressed. If the supply side is not stressed in 2023 to the point that prices rise, that could be an indication the peak demand pundits may be correct and that Ron will be vindicated in saying Peak Oil is in the rear view mirror.
267 responses to “US July Oil Production Shows Little Growth”
Hi gang. I just wanted to tell you about my new book that has just been published. It’s called “A Worldview Based on Evidence”. Everyone has a worldview but very few are based on evidence. Most are based on dogma of religion or the dogma of science. Have a look and let me know what you think.
I included my free will essay in chapter 1 but added to it.
A Worldview Based On Evidence
Also, my website is live again. Check it out.
http://thefinetuneduniverse.com/
Thanks,
Ron Patterson
Congratulations Ron. Don’t know when I’ll find the time to read your book but I will put it on my long list of books to read.
Congrats on your new book! I will definitely check it out and let you know what I think. As an author of 2 science fiction novels I know how much work it takes to write and publish a novel. I have a hunch that you are writing about the universe explained by science through your objective reality viewpoint. It should be interesting. Izzy Doroski
Actually, Izzy, it’s more about the evidence denied by science. But if you are religious, you will not like it.
But if you are religious, you will not like it.
Abandoning the Cabbages For Christ population?
One cannot abandon something they were never associated with.
I know Ron—
Will check out the book also–
Congratulations!
I am definitely spiritual but not religious. I went to Catholic grade school which was like a military training camp but public high school & college. I think that our viewpoint of reality is conceptual through consciousness and governed by the laws of quantum mechanics & classical physics. Although lately strong new evidence shows that classical physics emerges from quantum physics and that quantum physics is the basis of everything we know of in the universe.
The dogma of science. I like that one….the idea being that science itself isn’t evidence based?
Reservegrowthrulz,
See Kuhn’s, Structure of Scientific Revolutions. There is more to it than evidence alone.
See
https://en.wikipedia.org/wiki/The_Structure_of_Scientific_Revolutions
No, that is not what I meant at all. Of course, science is evidence-based, at least most of it. The problem is that a lot of science is not evidence-based. The multiverse has not one iota of evidence to support it. And every scientist will admit as much. There is not one whit of evidence to support string theory. And they will also admit as much. The many worlds theory is about as cookie as they come. About 20% of cosmologists buy into it while the rest think it is the most absurd thing ever to come down the pike. But there is strong evidence to support almost all of science, only the fringe stuff is not evidence-based.
On the other hand, there is a lot of evidence that most science denies. There is overwhelming evidence that materialism is not all of existence. But such existence is vehemently denied by about 90% of all scientists. They call it naturalism. They know, with absolute certainty that nothing outside the material world exists therefore they will not even bother to look at the evidence. After all, it would be a total waste of time so why even bother to examine what others call evidence?
The reason for their refusal to even examine the evidence is that they associate anything non-material with religious superstition. As Christopher Hitchens correctly put it, religion poisons everything. But it has not one damn thing to do with religion. And that is what most scientists don’t realize. And that is what the book is about.
Thanks for the synopsis. As someone with a career in science, I’m trying to true up the idea against my experience and it isn’t quite working. The religious part anyway. I presumed that religion had nothing to do with it going in, and I don’t recall working with folks who appeared to ever think otherwise. Evidence, hypothesis, a theory, empirical testing, analyze, rinse-recycle-repeat.
Reservegrowh, this is just so damn frustrating. Of course, religion has nothing to do with what science believes. It has everything to do with what they disbelieve. They know, correctly, that all religion is bullshit. They know that there was never a god named Yahweh, Allah, Zeus, Posiden, or any other name. They know all the miracles in the Bible are total bullshit. Therefore they conclude that materialism is all there is.
Okay, I am not going to write another book here. But it is not what scientists believe, it is what they disbelieve is where they go wrong. They disbelieve that anything non-material exists at all. They are so certain in their opinion that they refuse to examine any evidence to the contrary. And religion has everything to do with it. Religion has poisoned their mind. Religion poisons everything.
Mr. Patterson,
(Reluctant to jump in here …),
You may find Carolyn Myss’s view somewhat relevant.
To wit,
“Spirituality is an Individual’s recognition of the existence of a non physical Reality.
Religion is a social and cultural expression of that”.
This dovetails neatly with Pirsig’s Zen and the Art of Motorcycle Maintenance wherein Pirsig’s towering intellect irrefutably shows the limitations of Reason. (The Church of Reason example presents a disquieting context of much of modern day ‘rational’ discourse).
If you are familiar with much of Kaku’s work, he brilliantly – in exceptionally clear terms – shows how it is generally an expansion of current scientific dogma that continuously enlightens human knowledge, that is, enlarging understanding of that which exists but is presently beyond our ken.
This comes full circle in aligning the quip from ‘The Dancing Wu Li Masters’ in that cutting edge, super smart scientists from various fields are metaphorically climbing the Mount of Knowledge, only to find that the pinnacle is already occupied by the Mystics.
Interesting view.
Coffeeguyzz, thanks for the post. I read Zen and the Art of Motorcycle Maintenance in the early 80s but don’t remember much about it now. I am familiar with Kaku’s work. He is a string theorist and a strong advocate of the multiverse. I think both are nonsense. But if anyone could produce any evidence for either, I would change my mind. He is a kind of mystic, however, a pantheist. I am close but not a pantheist. Pantheists believe god is the universe and the universe is god. That says way too much in one breath and not nearly enough in another.
I am familiar with the metaphor of the mystics already at the pinnacle of the mountain when the scientists finally get there. I don’t like it. It implies that the mystics already have the answers. I am a mystic and I sure as hell don’t have all the answers. Actually, I have damn few of the answers, but that’s what makes the search so much fun.
What does “they disbelieve that anything non-material exists at all” mean? As a scientist, can you name something or general category of non-material that I ignored during my career? Science never struck me as about my own opinion, and studying peak oil for me was completely about examining evidence to the contrary. Matter of fact, I made my bones in proving things to the contrary as opposed to discovering things new and exciting.
can you name something or general category of non-material that I ignored during my career?
Of course not. I know absolutely nothing about your career.
Kaku has totally bought String Theory.
As after the Standard Model, physics has hit a brick wall.
It is creative fiction, so far.
The whole damn multiverse bullshit is creative fiction.
Reservegrowth, just one more thing. You wrote:
I presumed that religion had nothing to do with it going in, and I don’t recall working with folks who appeared to ever think otherwise.
I am not a scientist but I read a lot of science books, I mean a lot. Over the years I have read hundreds. You are mistaken if you think they never discuss religion. They talk about it quite often. They even write books denouncing religion. “A Universe from Nothing” by Lawrence Krauss is an example. I could give the titles of many others. They talk about it on YouTube videos. I give examples in my book. So when you say “I presumed that religion had nothing to do with it going in,” you are simply wrong.
When you say “they” you are including me, and I never discussed religion or got into an argument with any other scientist about it. I have no doubt someone must be doing this if you’ve seen them doing it in print, but certainly it never came up during work hours that I am familiar with. I don’t mind being wrong when it comes to religion being mixed in there somehow, but your experience in science must be in a more interesting field that the geosciences perhaps. I tried to keep my observations on this topic to the evidence in a career of doing it.
“They” means scientist in general. Of course, some never discuss religion. I read mostly those that do. Like Lawrence Krauss or the late Victor Stenger, or Martin Rees, and I could name more.
I tried to keep my observations on this topic to the evidence in a career of doing it.
Well good for you. However, the discussion of the fine-tuned universe is about religion. Or at least the Bible bangers try to make it about religion. Cosmologists are fully aware that the universe is indeed fine-tuned. And they argue about it, they make YouTube videos about it, and they write books about it. If you have not checked these arguments out, then you are missing a lot of fun.
And I argue they are making The Wrong Argument
Hey Ron I will debate you on your comments (the multiverse, materialism, many worlds ) in the near future but not on this thread since it is pertaining to US oil production.
It’s really not a big thing with me Izzy. I have been debating for years. I debated Kent Hovind twice. (If you don’t know who he is, google him.) But I have never debated a scientist, only religious fundamentalists. We can go to the other thread or on my website. Thefinetuneduniverse.com.
But if you need a month or two to bone up, that’s fine with me. 🤣
Any video / recordings of Ron vs Hovind.
I would enjoy watching those.
Sorry, both debates were in the early 90s, well before the days of YouTube or even the internet. Also, videos in those days were on VHS tape. Everyone had a VHS player, but there were damn few VHS cameras.
That was before Hovind went to prison for tax fraud.
Ron: With all of the “overwhelming evidence that materialism is not all of existence”, it’s weird that the Randi Challenge never paid out.
Richard, I will not discuss this subject anymore on this thread. Post it on the non-petroleum thread, and I will be glad to discuss the James Randi Scam.
Just got a call from my editor. They uploaded the wrong manuscript to the printer and to Amazon. The “Note to from the Editor” should not have been in there. Several corrected strike-throughs were left in the manuscript, there were no page numbers, and chapter 11 was left out of the contents page, though it was still in the book. They are going to correct the kindle immediately and swap out all the books already shipped.
Sorry for the screwup.
Oh, I thought it was a book about oil,
Just bought your book for my Dad. I think he will enjoy your perspective, though I haven’t read the book myself, yet.
It doesn’t look like Amazon ships your book outside the USA.
You might want to look into that ( if you can ) as I suspect you have developed some fans that don’t live in America.
thanks!
I hope you get the corrected copy. But I doubt it, i t just went to the printer yesterday. But everything is in the original flawed copy, just no page numberss and a few errors.
Doesn’t matter. The content is what matters not the formatting.
I didn’t mean to imply that I am not buying it for myself. I can’t wait to read it.
I live outside the USA so I can’t get it (says out of stock)
A collector’s edition with the editor scribbles!!
thanks!
It says “Out of stock” because they pulled all the flawed copies. The new stock should be there in a few days. Sorry about that.
The talk is OPEC cutting 1.5 million b/d at their meeting this Wednesday. Honestly with everybody teetering on recession. If you run prices back up to $100+ it’s a nail in the coffin that brings prices down much lower. Not really in OPEC’s best interest but that doesn’t mean they won’t do it.
So basically at this point we’ve got New Mexico to grow production…
Stephen Hren,
For past two years Texas and New Mexico have grown C plus C output at an annual rate of 579 kb/d. Texas at an annual rate of 272 kb/d and New Mexico at 307 kb/d. Period is August 2020 to July 2022 and trend is based on ordinary least squares (OLS) regression on the data from those 24 months.
If we look at annual growth rates as a percent of output, New Mexico is growing much faster than Texas, 24% per year for New Mexico vs. 6% per year for Texas over the past 24 months.
If we look at all of US C plus C over the past 24 months we see all of the increase came from Texas and New Mexico.
But now the Eagle Ford may be declining as much as the Permian is able to increase. So maybe just New Mexico
Stephen Hren,
The Texas data includes both Permian increases and Eagle Ford decline, the net gain for the past 24 months in Texas has been about 270 kb/d per year, using OLS regression on EIA C plus C data.
Of course the trend could change and I agree that in percentage terms New Mexico is growing much faster, but in absolute terms there is only a slight difference over the past 24 months.
Stephen,
You are correct… over the past few years, Permian production from New Mexico continues to rise significantly, while the Texas Permian has been, virtually… FLAT.
steve
If we look at what has happened since mid 2020, both Texas and New Mexico have seen increased output. New Mexico has increased much faster as I said earlier in percentage increase, about 24% vs 6% per year for Texas.
Keep in mind that the Texas data is not very good for the most recent 6 months or so, they have significant delays in reporting all oil output. That is why on Enno Peter’s posts he gives an estimate of what production will be after all the data comes in, it is higher than what his chart shows.
In the most recent Novilabs post on the Permian (Sept 1, 2022) the chart has 4486 kb/d for May 2022 output, but in the post Enno says:
Permian tight oil production rose to a new output record in May, at around 4.6 million b/d (after upcoming revisions, horizontal wells only). Not all this production is reported yet by the state agencies, thus the apparent drop in production in the above chart.
Since the bottom of Covid, aggregate TX Permian is up about 11 MMbbl/month. Aggregate NM Permian up about 16 MMbbl/month. So a 60/40 split in favor of NM.
Dennis,
New Mexico is a much smaller area than the Permian with two countries (Eddy and Lea) producing the bulk. They also lie on the western flank of the Delaware basin.
I believe two things have fueled the growth:
1. Harder to drill in New Mexico due to theabundance of State and Federal leases with more well site regulations as well. Many operators feared the Biden administration would eliminate leasing on Federal lands and became more active to protect their leasehold positions.
2. Many operators were running out of leasehold to drill not only in the Permian and the “Texas” Delaware. Much of the undrilled core locations are owned by larger companies like Chevron,, ConocoPhillips, Exxon and OXY. I am seeing a smaller number of independents drilling in Texas and opting to drill acreage in New Mexico for the same reason as I stated above. Also the wells in New Mexico are generally shallower and less expensive.
These are not necessarily substantiated by any facts that I have but general consensus from folks I have visited with in the industry.
LTO Survivor,
Thanks for this information.
I had a response to your comment near the end of the previous oil thread and Schinzy asked for more information. I included a spreadsheet that might be of interest. Link to start of comments below. The average OPEX over the life of the well is about $10.50 per BOE in 2022$, at a well cost of $12 million, IRR is about 47.5% assuming annual infaltion rate of 2.5% (real IRR is 45%) at $75/bo at wellhead and NGL sold at 35% of wellhead crude price and natural gas sold at $4.60 Mcf.
https://peakoilbarrel.com/norway-august-oil-production-rebounds/#comment-746837
Thanks Dennis
Schinzy,
You’re welcome. Let me know if you see any obvious errors.
Thanks.
Dennis,
Costs have risen out of sight. Most service companies are not expanding, labor is in short supply and steel for casing is in even shorter supply as mills in Europe are shutting down, banks have redlined the fossil fuel industry. Drilling costs have soared monthly as drilling companies are charging $32k per day as opposed to $25 per day. Mobilization and demobilization of Drilling Rig costs are through the roof and almost $1 million per well up form $500k. Total D & C costs for a 10,000 Hayneville Shale well have gone from $1,400 per foot to almost $1,800 per foot depending on the size frac. At the current price of gas, theses wells net a little better than 2:1 if everything goes right. I believe this is why we are not seeing production growth as oil and gas companies are paying down debt, making distributions and living within cash flow.
This is a good thing in that impedes unbridled growth and violent product price swings but I wouldn’t anticipate shale production rising as fast as you may think. Political headwinds, ESG policies ( a la SEC proposed rules by Gary Genslar) , Private Equity prohibited from investing in Fossil Fuels, and Banks redlining the industry all play a part in limiting growth in production. This Thursday CEOs of major banks will go before Congress to discuss new restrictions on loaning to oil & gas companies.
It hasn’t worked out very well for Europe this year.
LTO Survivor,
Wow, if we assume a 10,000 foot lateral that is 18 million per well, I assume costs are similar in the Permian basin, is that correct?
At that cost and assuming $10.50/boe for OPEX we would need $95/bo and $4.60/Mcf just to get an IRR of 32.5% (assuming 2.5% annual rate of inflation) for the average 2020 Permian basin tight oil well.
What number do you target for IRR?
Dennis.
The only wells drilled this year in our field are a few that have been drilled by a company that owns its own drilling rig. So I don’t know the D & C costs.
I do know that plugging a well in our field is approximately 1.5 times more expensive than it was at the same time last year.
I also know that reactivating a temporarily abandoned well is much more expensive than one year ago, primarily due to much higher rod and tubing expense, as well as much higher rig expense. It also takes a long time. We set up one this summer and the rig finally got there now. The service company has several rigs stacked that could all be running if there was labor available. Experienced rig operators just aren’t out there.
Thanks shallow sand,
This may explain the low completion rate.
For those that think it is better to drop the Feb 2021 “outlier”, consider the following definition of outlier in the post linked below
https://www.freecodecamp.org/news/what-is-an-outlier-definition-and-how-to-find-outliers-in-statistics/
For the Texas plus New Mexico C C Data from August 2020 to July 2022 (24 months), the low point in February 2021 has a value of 4752 kb/d. IQ1=5732, IQ3=6370.5, the IQR=IQ3-IQ1=638.5.
A low outlier is less than IQ1-1.5*IQR=5732-1.5*638.5=4455 kb/d, so what seems to be an outlier visually on the chart is not by the interquartile definition as 4455<4752.
Paul Pukite know statistics in far more depth than me, he has suggested to me that unless there is a compelling reason to drop a data point, it should not be done. I tend to agree.
The original chart this comment refers to is at link below
https://peakoilbarrel.com/us-june-oil-production-shows-little-growth/#comment-746917
Oil Jumps at the Open as OPEC+ Considers Big Production Cut
Oil surged in early Asian trading after delegates said OPEC+ was considering cutting output by more than 1 million barrels a day when the group meets this week to stem a slide in prices.
A few other articles have indicated that they are looking to keep prices in the $90/b range.
The bigger question is are they really doing this to keep oil at $90/b or are SA and UAE struggling to keep production at their current high levels. That may be the bigger issue.
https://www.bnnbloomberg.ca/oil-jumps-at-the-open-as-opec-considers-big-production-cut-1.1827085
Demand is a term that in this context really means the measured Consumption,
which takes into account how much was needed or wanted, and how much could be afforded.
And of course the consumption can be hard limited by lack of physical supply in the marketplace- for whatever reason.
I say this simply because many people get thrown off by the term ‘demand’.
The only company that I have found with increasing numbers of exploration wells is CNOOC. The other two national oil companies that report on SEC, Pemex and Petrobras, have shown declines in line with IOCs and independents. CNOOC delisted from stock exchanges in 2020, along with many other Chinese companies, so there won’t be any more data. Pemex and PBR low numbers are probably due mostly to loss of onshore and shallow offshore drilling while deep water drilling has been retained, and probably increased for Pemex.
Success rates for CNOOC and Pemex have been declining while for PBR they have improved. The deep water pre-salt wells in Brazil are very expensive so I’d imagine PBR would want to be very confident before committing to exploratory drilling.
Although exploration has increased the CNOOC discoveries have been steady or slightly declining so discoveries per well have shown a distinct falling trend, and are also much smaller than for Pemex or PBR. The high discovery years for PBR discoveries were when large numbers of new FPSOs were approved for new fields, mostly in large pre-salt basins that were actually newly drilled some years previously. There haven’t been many new projects approved in the last few years and reported drilling results have often been poor.
Development drilling for all three companies has been falling. For Pemex and PBR this reflects moving to fewer but more productive deep water wells, for CNOOC I don’t know what it means; production for C&C has been on a near plateau since the 2014 price crash but natural gas has increased.
Thank you Ovi for the great post and especially the look at demand. The relatively small drop in world demand during Covid leaves me skeptical of peak demand claims.
Paoil,
A drop in demand for liquids of 20% is a pretty big drop (from 91 Mb/d in Dec 2019 to about 72 Mb/d in March 2020). The forecast demand in 2023 is relatively flat, but forecasts are often incorrect.
The lockdown-dip in oil demand saw many writers predicting the permanent onset of green energy dominance–some the same writers who predict peak oil demand. But covid didn’t fundamentally change energy delivery and oil demand has snapped back with remarkable speed. Tinkering like the Inflation Reduction Act will artificially influence the market and perhaps reduce oil demand a little bit in the USA. But the 1.4 billion people in India represent a great deal of future oil demand as do the 3+ billion people with little to no current access to oil. If there was a source of reliable energy BETTER than oil then the foundation for peak oil demand would exist. Covid lockdowns were a great little tinkering experiment–but they didn’t change the desire of the people of India and Africa to consume like the Americans.
PAOIL,
Based on World liquids consumption data from BP Satistical Review of World Energy, the annual rate of increase in consumption from 1982 to 2019 was about 1169 kb/d. What many have argued is that the rate of increase may gradually slow over time. If we return to the 1982 to 2019 trend line we would expect World liquids consumption to reach 112.4 Mb/d by 2030, I doubt we ever reach that level of World liquid energy consumption as define by BP. Energy will become more expensive and the World will use energy more efficiently while gradually transitioning to other types of energy for land transport.
PAOil-
” If there was a source of reliable energy BETTER than oil then the foundation for peak oil demand would exist.”
The foundation for global peak ‘demand’ is oil depletion.
You can’t can’t consume what isn’t available for sale.
Your statements are a good example of how people get mixed up about the terminology ‘demand’.
Other factors, such as lack of affordability, might also decrease Consumption.
But in the end the base issue comes down to Depletion.
And we are now on the big global oil plateau, with the only off-ramp being a down trend in production and thus a down trend in consumption (regardless of what people may or may not want).
disclaimer- I am not denying the possibility that this plateau phase may have a minor rising component as Dennis portrays. Nonetheless I consider global production to be at rough peak plateau beginning in 2018
Hickory,
I tend to agree we may be on a bumpy plateau from 2016 to 2035, if there is a new peak it might not be a lot higher than the 2018 peak and at most would be 2 to 4 Mb/d higher, in the grand scheme, it is a drop in the bucket.
a 19 years bumpy plateu isn’t that too many years, do we have a precedent for this ?
Ed,
No, there is no precedent, but many in the past have predicted this. Note that part of this prediction assumes a fairly wide up and down limit for the “plateau”. So the model below has an average output from 2015 to 2038 of 81 Mb/d, if we assume the plateau is 81 /-3 Mb/d, the scenario has this from 2014 to 2039, with the exception of pandemic years of 2020 and 2021, 23 years in all.
If we prefer a tighter output range of say 82 to 84 Mb/d, then we could call the plateau from 2028 to 2036.
On that bumpy plateau comment (with chart) the long plateau is 2015-2039 with a range of 78 to 84 Mb/d (81 plus/minus 3 Mb/d), or a shorter plateau with a tighter range of 82 to 84 Mb/d (83 plus/minus 1 Mbpd) from 2028 to 2037. The long plateau (25 years) has output range of plus or minus 3.7% of the mean and the shorter plateau (10 years) the output range is plus or minus 1.2%.
Dennis, a month or so ago you posted your predictions for world C+C until 2028. You showed world production increasing by 1.9 million barrels per day from 2022 to 2023. I estimated production decreasing by 1 million barrels per day during the same period. I stand by my prediction. Have you changed yours? If so, what are you predicting now?
Best Guess Yearly C+C Production
…………. Dennis .. Ron
2020 ….. 76.0 ….. 76.0
2021 ….. 77.0 ….. 77.0
2022 ….. 78.7 ….. 80.0
2023 ….. 80.6 ….. 79.0
2024 ….. 82.3 ….. 78.0
2025 ….. 83.5 ….. 77.0
2026 ….. 84.3 ….. 76.0
2027 ….. 84.8 ….. 75.0
2028 ….. 85.0 ….. 74.0
Ron,
That previous estimate I only had tight oil data through May 2022, recently I got new data through August 2022 that I did not have previously.
Also note the “bumpy plateau” is not my best guess, this would be the minimum output I would expect. My current best guess estimates for World C plus C starting in 2022 (in Mb/d):
78.16, 78.84, 80.34, 81.67
Ron,
For current best guess World model, peak is 2030 at 85 Mb/d.
a revision to the scenario is below based on feedback by Ron.
see link below
https://peakoilbarrel.com/us-june-oil-production-shows-little-growth/#comment-747343
I share your opinion that we are on a bumpy plateau. How would you define the end of the plateau?
Old Chemist,
I would say if three year centered average output falls to less than 90% of the average of the previous 5 years, we would know. As a concrete example let’s say the average output for 2031 to 2033 is 76 Mb/d and the average output from 2026 to 2030 was 85 Mb/d, I would then call the end of the plateau, though perhaps even 95% might be enough. Obviously a subjective determination. Also if this happens during a period of falling oil prices due to lack of demand (say in 2032 and 2033) we would be unlikely to see output recover.
My current best guess estimates for World C plus C starting in 2022 (in Mb/d):
2022 . 2023 . 2024 . 2025
78.16, 78.84, 80.34, 81.67
Dennis, that makes no sense whatsoever. Here is 2022 production for the first six months.
79,651 . 80,640 . 80,545 . 79,583 . 78,926 . 79,319
Six Months average … 79,777 Kbpd
Your average estimate for 2022 of 78,160 is 1.62 million barrels per day below the current 6-month average. To average 78.16 million bpd for the entire year, the average production for July through December would have to average 76,320 Kbpd for each of month.
Dennis, world C+C production hit 80.64 million barrels per day in February 2022. Your prediction for 2022 average output is almost 2.5 barrels per day below February production. You know that is not realistic. I think you are deliberately lowballing it just so that next year you can say: “See, my estimates are almost always very conservative.”
Ron,
I have not focused on 2022, that is based on what I expected from last year. You have been banging the drum that output will be decreasing a lot in the second half of 2022. Keep in mind these estimates are for annual average output rather than for individual monthly output.
What is your prediction for average annual output in 2022?
Note that the slow growth of the past 12 months has also led me to reduce the future growth rate estimate.
If you look back at my past estimates you will find that mostly they have been too low (in the absence of Worldwide pandemics and such).
If I revise my 2022 estimate to 79.5 Mb/d, my best guess estimate is revised to (starting in 2022):
79.50
80.25
81.00
81.89
82.84
83.65
84.29
84.66
84.89
84.86
84.52
83.81
82.66
81.14
79.50
This scenario is a rough plateau of 7 years from 2027 to 2033 at between 83.5 and 85 Mb/d, with average output of 84.4 Mb/d over that 7 year period (Jan 2027 to December 2033).
Dennis, my prediction has not changed all year. I posted it some time ago along with your prediction.
Best Guess Yearly C+C Production
…………. Dennis .. Ron
2020 ….. 76.0 ….. 76.0
2021 ….. 77.0 ….. 77.0
2022 ….. 78.7 ….. 80.0
2023 ….. 80.6 ….. 79.0
2024 ….. 82.3 ….. 78.0
2025 ….. 83.5 ….. 77.0
2026 ….. 84.3 ….. 76.0
2027 ….. 84.8 ….. 75.0
2028 ….. 85.0 ….. 74.0
My prediction is still 80 million barrels per day average for 2022. Your prediction has only recently changed. It went from 78.7 million bpd to 78.16 million bpd. That change was, apparently made, last month. Your estimate dropped by just over half a million bpd, just this past month, not last year after you had a full five months of 2022 production. That, Dennis, is what I cannot understand. You had the data right in front of you yet you still made a ridiculously low estimate for 2022.
Yes, I expected Russia to drop more than they have. And I still expect Russia to decline by at least 2 million barrels per day below their February high by December. But if they do not decline that amount by December, I will just say, “I was mistaken.” It’s not really that hard to say, Dennis, you should try it sometimes. 🤣
I am suspicious of their reported September production as reported by only one source, the Moscow Times. I have seen several articles stating their steep drop in September exports. However, if there are other sources confirming that Moscow Times estimate, then I will just accept that.
One more thing. Now that you have the first six months world production data right in front of you, yearly average so far 79,777,000 barrels per day, do you wish to update your 2022 prediction? Or do you still wish to still maintain that 2022 world production will still be about 78.16 million barrels per day?
Ron,
I agree my 2022 estimate was not very good, though I don’t remember you mentioning it earlier. This was based on my expectation that OPEC and Russia would not be able to increase output as much as they have done so far in 2022, the fact that I have revised my scenario is an admission that I was wrong.
As I have often pointed out, and will repeat, the future is unknown, the number of posible futures is infinite and the odds of a correct prediction of future World C plus C output is exactly zero. Every prediction I have ever made in the past has been wrong and I expect my future scenarios will also be wrong, any correct prediction is a pure luck and if we just extend to more digits will also be incorrect in the fine details.
My expectation is that my scenarios will be wrong in every case, so I don’t even bother to point out this very obvious fact.
That revision to 2022 was based on lower tight oil output than I expected, I was less focused on conventional oil production.
I am surprised you expect 80 Mb/d for 2022, based on your comments that seems high.
Chart with best guess shock model scenario for World C plus C in Mb/d.
Dennis wrote: I am surprised you expect 80 Mb/d for 2022, based on your comments that seems high.
My goodness Dennis, I know how to read the data and estimate accordingly. 80 million is only 223 Kbpd below the current average of 79,777 Kbpd. And we know August and September production will very likely be well above 80 million bpd, I think my estimate makes sense. I expected OPEC to begin producing flat out to take advantage of those very high prices that began in March and lasted through July.
I read the data and make predictions based on that data. So far I have been pretty close. And the data tells me that peak oil was in 2018. I think I will be damn close on that one.
Ron,
I agree that the 80 Mb/d guess may be about right for 2022. Using that (instead of 79.5 Mb/d for 2022) I the following for a revised scenario (first year is 2022):
80.0
80.6
81.3
82.2
83.1
83.9
84.5
84.9
85.0
84.8
84.3
83.5
82.3
80.8
79.1
The problem with predicting the future based on past trends is that the underlying tech keeps changing, Countries that develop later don’t necessarily follow in the footsteps of developed countries.
For example, I remember hearing in the 1980s that telephones would never be widespread in Africa because there wasn’t enough copper in the world for all the land lines. Today there are a billion phone lines in Africa. How was this possible? Africans skipped the land line stage of telephony history.
Internal combustion engines are a dying technology. Every dog has its day, like land lines, cathode ray tubes for TV screens and electronics, typewriters, tape recorders, wind-up mechanical clocks and many other ingenious technologies.
This is a bitter pill to swallow for the oil industry, but the car industry has already decided to ditch internal combustion engine. Investment in next generation combustion engines has collapsed in recent years. It’s a done deal, not some wild eyed prediction. You can gin up some foolproof arguments about why it is physically impossible or why it doesn’t fit your personal preferences etc, but automotive engineers won’t be listening.
The tech is dying, and it’s not coming back. And with it dies most demand for oil.
The primary point you make is certainly true and obvious to anyone keeping track of automotive news,
but keep in mind that it is going be a very slow fade for oil transport fuel demand.
Question is- will the slow fade in petrol demand be a close match for the fade in petrol availability that is now on the verge of happening due to both depletion and due to geopolitical disruption?
I think that in many parts of the world the match between supply and demand will be poor on the way down. We’ll see.
Hickory —
>very slow fade for oil transport fuel demand
I doubt this, since heavily used vehicles like delivery vans and taxis will switch fastest. EV sales are rising at about 50% a year even while car sales in general are collapsing. It will take time to replace the fleet in raw numbers, but gross fleet percentage is a bad proxy for fuel use, because most cars are parked >90% of the time anyway.
Be that as it may, the point I was making was not about how fast demand would fall in rich countries, but about how fast it would rise in developing countries. I was responding to PAOIL’s remark about “the desire of the people of India and Africa “. Since there are relatively few cars in poorer countries, they will switch to electric more quickly than countries with large “incumbent” combustion engine fleets as they develop and their fleets grow.
Tobacco companies took the move away from smoking in rich countries in stride because the could rapidly expand their business in developing countries. Oil companies will not have that luxury.
I don’t see fast switching in Africa and other developing countries.
The electric grid is nowhere to charge electric cars there – it’s already permanent at the brink of collapse. Connecting a 11 KW wallbox will cause a blackout in many situations.
And improving it is a state thing – and the governments are often notorious corrupt.
And no, private installation of solar cells is not an option for most people – there isn’t much money there to do big frontload investments. It’s more a “living on a prayer” infrastructure – getting a can of gas at a time if you operate a car. Operating a car is 95% commercial in Africa, that’s why I don’t say driving a car.
Oil isn’t going anywhere, and neither are ICE vehicles any time soon.
And before you refer back to it, there is nothing remotely comparable to the phone analogy unless you happen to know of a teleporter being invented about now.
This is the same wishful thinking that got Germany to become the most retarded nation in Europe in terms of energy policy. Fossil fuel usage is only going up, not down.
>Oil isn’t going anywhere
A bold claim to make on a peak oil website, but Im sure you have a detailed argument to back it up.
Peak oil doesn’t mean oil vanishes. Kinda the first misconception people outside the peak oil community need correcting on.
PAOIL
Thanks. I think we will need to keep looking at the other side. Being in non-normal times makes it difficult to know what the new normal will be like. I do think that these higher prices will continue for a while and we will have to wait to see what the new consumption levels will be. They will hit bottom at some point and then start to climb again.
OPEC output up 230 kb/d.
https://www.bloomberg.com/news/articles/2022-10-03/opec-output-rose-last-month-after-libya-recovery-symbolic-hike
Excerpt (North African nation referred to is Libya):
The Organization of Petroleum Exporting Countries boosted oil supplies by 230,000 barrels a day to 29.89 million, with about half the gain coming from the North African country, according to a Bloomberg survey.
How does that square with OPEC exports down by 166,000 barrels per day in September?
OPEC Crude Oil Exports Trend Lower In September
Crude oil exports from all OPEC oil producers were down in the first 25 days of September compared to the full month of August, according to data from Petro-Logistics cited by commodity analyst Giovanni Staunovo on Wednesday.
Between September 1 and 25, OPEC’s crude oil exports averaged 21.648 million barrels per day (bpd), which was 166,000 bpd lower than the average OPEC crude oil exports for the full month of August.
Crude oil exports out of Iran plunged by more than 700,000 bpd, per Petro-Logistics’ data. Oil exports from the Islamic Republic – exempted from the OPEC+ deal – averaged just 450,000 bpd between September 1 and 25, down by 710,000 bpd compared to the full month of August, according to the data Staunovo cited.
Ron,
I have read that some OPEC producers were buying Russian oil so they could export more. Perhaps that changed in September, production and exports are two different things, also one or perhaps both estimates may not be accurate.
Dennis
Below Is an open link to the Bloomberg article. BNNBLOMBERG is associated with Bloomberg. I just did a search using some words in the title and the BNN link also came up
OPEC Output Rose Last Month After Libya Recovery, Symbolic Hike
https://www.bnnbloomberg.ca/opec-output-rose-last-month-after-libya-recovery-symbolic-hike-1.1827264
US Oil-Output Growth to Top Government Forecast, BNEF Says
Bloomberg is looking at 2023 and 2024 and 2024 growth drops like a stone from 900 kb/d to 200 kb/d.
The latest BNEF report estimates daily US oil output to increase by more than 900,000 barrels next year. The expected production of 12.85 million barrels of crude per day exceeds the Energy Information Administration’s forecast by 250,000 barrels.
BNEF forecasts production to increase by less than 200,000 barrels in 2024, to 13.04 million barrels per day. Oil production in the Permian Basin is estimated to reach 5.8 million barrels per day by the end of 2024.
The US may see slowed production growth in 2024 if producers do not complete more wells. This could further tighten markets, especially if oil demand recovers in the next two years. The Organization of Petroleum Exporting Countries and its partners already have limited capacity to raise output, Liu noted.
https://www.bnnbloomberg.ca/us-oil-output-growth-to-top-government-forecast-bnef-says-1.1824506
Ovi,
Thanks… looks like the circa 2025 Energy Cliff scenario may be more FACT than FICTION… LOL.
By the way, I posted this chart up the thread, but wanted to post it again lower as there’s a BIG DIFFERENCE between the New Mexico and Texas Permian production profiles.
New Mexico is certainly where all the growth has taken place in the Permian. Texas is been FLAT DEAD… LOL.
steve
Steve
Thanks for the charts. While not as specific as the NM Permian and the Texas Permian, the charts for Texas and NM show the same trends. While Texas contains both the Permian and EF, the post pandemic production trend is slightly down for the EF and the EF output is about 1/4 of the Permian. This means that the Texas chart post pandemic reflects what is happening in the Texas Permian. NM is all Permian.
Texas cumulative chart
NM cumulative chart
Thanks Ovi,
Based on the cumulative for the 2021 Permian basin wells at 12 months it is clear why there is a higher rate of increase in completions for New Mexico than Texas (roughly 220 kb in NM vs 160 kb in TX).
Ovi,
Also notice that in 2015 at 24 months the New Mexico and Texas wells had similar productivity (though perhaps not when lateral length is accounted for (Delaware basin wells tend to have shorter lateral, especially back in 2015). Since 2015 there have been Marginal productivity increases in Texas Permian, but they have been far more robust in the New Mexico Permian.
Based on that, it is surprising there wasn’t a greater move to New Mexico sooner.
Ovi,
Indeed… troubling signs in the Texas Permian, especially when we look at what’s happening with Water Production. Water production in the Texas Permian peaked and now continues to decline, which suggests ALL IS NOT WELL in the Permian. No pun intended. 🙂
However, if we look at the New Mexico Permian, water production continues to increase, hence the HUGE RISE in oil production in this state.
Unfortunately, All SHALE OIL BOOMS suffer the BUST. I would say in a year, or so, the New Mexico BUST will begin.
BLUE LINE = Water Production
GREEN LINE = Oil Production
YELLOW LINE = Water Oil Ratio
steve
Steve/Dennis
So we just need to watch NM to find out when the US enters the plateau phase.
Ovi,
If we assume things don’t change in Texas Permian, that might be true. My guess is that there will be more development in Texas in the future.
Steve,
Completion rate has been falling in the Texas Permian since 2019 and it has been rising in the New Mexico Permian. The WOR decreases as the completion rate falls. Generally a lower WOR reduces costs for disposing of produced water and is considered a favorable development. The rising WOR in New Mexico may be of greater concern.
Dennis
Attached is a table that shows the Hz oil rigs operating in the various states and basins. The information appears to be enlightening and confusing at the same time for NM and Texas. NM has 102 rigs operating. I assume they are all in the Permian. The Permian total is 323, implying there are 221 in the Texas Permian. Roughly a 2 to 1 ratio.
The latest DUC report shows 435 completions in the Permian. Using the 2 to 1 ratio to apportion the completions would allocate 290 to Texas and 145 to NM. (Actually closer to 300 to 135) Allowing for the fact that the NM wells are about 30% more productive, it is difficult to explain the growth of oil production in NM and the flat profile out of Texas based on this rig and completion info. Am I missing something or is there something wrong in the data?
Ovi,
Number of wells drilled will reflect the rig count, but completion rates can be different as DUC stock can be utilized without drilling. Also keep in mind that there are a lot more horizontal oil wells in Texas than New Mexico, so it takes more new wells drilled in Texas to make up for legacy decline from older wells. Also there is a couple of month lag (2 to 6 months) at minimun between changes in rig counts and changes in completion rates.
It seems the 240 rigs or so in the Texas Permian is what is needed just to maintain output (although output has risen over past two years in the Texas Permian) whereas the 85 rigs or so in the New Mexico Permian is enough to increase output at a faster rate (in percentage terms) because there are fewer old wells that are contributing to legacy decline.
Dennis
The higher legacy decline in Texas could account for part of the difference.
Dennis
I forgot add, maybe your model could explain this.
Ovi,
My model does not distinguish between Texas and New Mexico, it takes total Permian output, completions, and average well profiles basin wide. Would take some work to try to tease some information out.
Using Novilabs data for Permian wells completed through Dec 2020, for Texas wells from Dec 2020 to Dec 2021 output fell by 1200 kb/d, for NM wells the decrease was about 410 kb/d, roughly 3 times higher. There were 7025 NM Permian wells completed as of Dec 2020 and 23,174 TX Permian wells as of Dec 2020.
So we need more new wells in Texas to make up for the legacy decline. Probably about 250 new wells per month (maybe 300 I haven’t run the model to check) would be needed just to account for legacy decline in Texas, fewer wells would be needed in New Mexico, perhaps 83 to 100 wells.
Ovi,
Based on my model roughly 225 wells per month need to be completed in the Texas Permian basin to keep output flat, while in the New Mexico Permian about 75 wells would be needed at the end of 2020. If the ratio of Texas to New Mexico Permian wells has remained similar today, the number of wells needed would be higher, about 263 for texas and about 88 for New Mexico.
Ovi,
Looking a little more closely at Novilabs data, I find that at the end of 2021 about 23% of all Permian wells were in New Mexico and the rest in Texas. The legacy decline of the 34741 horizontal wells completed from January 2008 December 2021 (8203 of these completed in New Mexico) was 245 kb/d for Dec 2021 to March 2022 in NM and 534 kb/d in Texas. So the combination of greater average new well productivity in New Mexico and the higher legacy decline in Texas may account for most of the slower rate of growth in Texas compared to New Mexico. Note that over time if more wells are completed in New Mexico compered to Texas, the rate of growth will slow down in New Mexico as legacy decline rate will increase, also fewer wells being completed in Texas will tend to reduce the legacy decline rate compared to an alternative scenario where the completion rate remains high.
Ovi,
The BNEF forecast is pretty aggressive, a recent Permian scenario is shown below, maximum completion rate is 472 wells completed per month in December 2024, Permian tight oil output is 5521 kb/d for December 2024 and it is 5046 kb/d in December 2023, output in August 2022 was 4551 kb/d. The BNEF forecast has Permian oil output at 5800 kb/d at the end of 2024, though perhaps some of this is conventional oil. If we assumed about 600 kb/d of conventional Permian output, the tight oil output from the Permian would be only 5200 kb/d which is a conservative estimate. Note that the scenario I present is the high end of my range of scenarios, I have other scenarios with output as low as 5275 kb/d at the end of 2024 with completion rate rising to only 424 completions per month by December 2024 from 400 per month in August 2022.
The annual rate of increase from July 2020 to August 2022 was about 11% for Permian tight oil and for August 2022 to December 2024 the annual rate of increase is 8.6% for my scenario. From 2012 to 2019 the average annual rate of increase in Permian output was 29% per year.
Everyone is predicting peak oil demand, and no one is talking about peak production. But is there a difference? How will we know when oil production starts to decline in earnest? I guess it will be the price. If prices are high at decline then it’s peak supply, if prices are low, then it’s peak demand.
At any rate, at the end of this article, there are 28 companies and organizations that predict the date for peak demand. As best as I can tell, they are talking total liquids here. The article is quite long and I have only posted a short part of it here.
The Biggest Argument For Peak Oil
BP’s peak oil demand prediction in 2020 turned out to be wrong.
A relatively large number of forecasts don’t see peak oil happening within the next few decades.
Advancements in ICE engines and increased fuel efficiency have had a serious impact on fuel consumption.
It’s been two years since British oil and gas supermajor BP Plc. (NYSE: BP) dramatically declared that the world was already past Peak Oil demand. In the company’s 2020 Energy Outlook, chief executive Bernard Looney pledged that BP would increase its renewables spending twentyfold to $5 billion a year by 2030 and “… not enter any new countries for oil and gas exploration”. That announcement came as a bit of a shocker given how aggressive BP has been in exploring new oil and gas frontiers.
When many analysts talk about Peak Oil, they are usually referring to that point in time when global oil demand enters a phase of terminal and irreversible decline. According to BP, this point has already come and gone, with oil demand slated to fall by at least 10% in the current decade and by as much as 50% over the next two. BP noted that historically, energy demand has risen steadily in tandem with global economic growth with few interruptions; however, the COVID-19 crisis and increased climate action might have permanently altered that playbook.
However, BP has been forced to do a mea culpa after it became clear that the COVID-19 pandemic that began more than two years ago has not resulted in a significant reduction in oil demand.
Ron,
I just ordered your book on Amazon. Can’t wait to read it. Good luck with it
Thanks, much appreciated.
Hi Ron
I ordered your book as well on Amazon. I am looking forward to reading it ASAP.
Thanks, Mike, but they screwed it up. The publisher sent the wrong manuscript to the printer. It had a publisher. It had a personal note to me, with no page numbers and other errors. They are going to try to pull it back and get the right copy printed. They will have to throw all the current printed books away and replace them. If you get a bad copy, let me know, and I will send you a good one, at no charge. That goes for anyone else on this list that gets one of the bad copies.
Ron, this is a great question, what is the difference between peak supply and peak demand. The definitions are squirrelly. And for sure the notion of peak demand is a bit ridiculous on lots of levels. Let’s take for granted that most of the 8 billion folks living on earth would enjoy having a standard of living similar to US standards. If that were the case then oil demand would be probably a billion barrels a day.
But peak demand is not measuring desire. You only count if you have money and can make a demand on the economic system for fossil fuels. Take Sri Lanka for example. Lots of people there can no longer afford cooking gas because of the economic crisis. Does that mean they no longer want to cook their food? Of course not. But they have become severed from the economic system and their desires no longer are tallied. What peak oil is doing and will continue to do is cut off less financially stable countries and send them back to the Middle Ages.
Meanwhile many advanced countries are reaching peak population and do not have huge growth in demand. Energy efficiencies are continuing in the building sector and even more so with the conversion of ICE cars to EVs, a roughly 75% reduction in energy use for each switch. So demand in these established markets is likely peaking. As oil supply begins to contract this decade, peak supply will be masked by indicators of peak demand in established economies. Meanwhile every year a Sri Lanka, Haiti, or Pakistan will fall off the energy cliff and then you won’t hear much more about them. So I strongly doubt there ever be a moment when the media shouts Peak Oil! Honestly it is too difficult a concept for most people to ever understand, sadly.
Peak supply is when the giant fields reach the last 10% of oil in place for recovery. Peak demand is when the central banks funds printing stops prior to hyperinflation.
Good definition CC. Of course there will be some kind of „peak demand“ when the economy is tanking due to energy scarcity. They might even paint it green, telling the people they are „reducing global warming“. But the primary peak who causes all this, is the geologic one. The one that IMO happened in late 2018.
U.S. shale producers to stay on sidelines if OPEC+ slashes output
“I don’t foresee any changes up or down for our position, and that includes what we have working for 2023,” said Joseph DeDominic, CEO of Anschutz Exploration Corp. There is a paucity of good rigs and workers, and the company’s 2023 capital budget is nearly finalized and will not be influenced by OPEC cuts, he said.
“Until more capital is made available for U.S. producers, they’ll be hard-pressed to increase production and OPEC will continue to have control over pricing,” added Brad James, CEO of Enterprise Offshore Drilling.
https://www.reuters.com/markets/commodities/us-shale-producers-stay-sidelines-if-opec-slashes-output-2022-10-04/?rpc=401&
While I’m sure the geology/decline rates must play a role in the slow down, there must also be a component of the higher interest rate environment at work…
The slowdown in June/July does correspond with higher rates…
Price-wise, current oil market looks eerily identical to the 2007-2008 oil shock and the market turmoil that followed. If the same situation, then the markets need to drop another ~30%, bottom out in next 4-6 months…
Curveball now is that world is fundamentally different than 15 years ago.
Population is 20% higher (8 billion vs 6.6).
The Russian war in Ukraine is the likely trigger for it all.
The role of US in the world has changed considerably, particularly our relationship with China and other countries has deteriorated.
I would almost say we are seeing the slow death of BAU and globalization.
For the models above, average peak year is between 2025-2030, average peak rate is 89 +/- 10. Will be curious to see the future estimates in 6 month to a year…buckle up – next 6 months is going to be a wild ride…
PS – got a paper copy of Rons book, looking forward to reading it!
Ken Geo,
There are 28 scenarios with 8 of them having the peak before 2021, there are 4 scenarios with peaks between 2024 and 2026, 4 scenarios with a peak in 2030 and there are 10 scenarios with the peak in 2040 or later, note that they do not give the peak amount for scenarios peaking between 2024 and 2026, only the 2030 output (not the peak) and it is not clear if this is all liquids or something else, but the all liquids peak so far (in 2018) was 100.5 Mb/d.
The scenarios that we can determine the peak are those with peak years of 2030 or later. For that group of 14 scenarios the range of the peaks is 96 to 126 Mbpd with an average of 106.7 Mb/d for all of those scenarios.
Scenarios with a peak less than 100.5 Mb/d must be using something other than all liquids, perhaps C plus C plus NGL (2018 peak was 94.2 Mb/d).
Excellent remarks.
Based on recent slow growth of US tight oil, I created a new tight oil scenario with average annual growth rate of tight oil output of 3.2%/year from June 2022 to June 2027. For the past 24 months US tight oil grew at an average annual rate of about 5.5% per year, but growth was slower for the past 12 months.
In chart below I consider US lower 48 onshore (OS) C plus C output for the August 2020 to Sept 2022 period where I use the most recent STEO estimate for August and September along with EIA data for the rest, I define L48 OS as US output minus GOM and Alaskan output. There is one data point that is an outlier in February 2021 and I adjust that data point from 7.67 Mb/d to 8.16 Mb/d which is the edge of outlier status (using interquartile range method).
The annual rate of increase is about 443 kb/d, I use this rate of increase for future output from October 2022 to Dec 2023 in my “alternative scenario” in chart below, output in Dec 2023 is 10.25 Mb/d for the alternative scenario vs 10.75 Mb/d for the STEO. Note that the STEO has US L48 excluding GOM output increasing at an annual rate of 850 kb/d from July 2022 to Dec 2023, this may not be realistic considering the rate of increase over the Aug 2020 to Sept 2022 period. Also presented is what the rate of increase would be if my recent tight oil scenario is correct and non-tight L48 OS output remains flat. The tight oil scenario has an annual rate of increase of 383 kb/d from July 2022 to Dec 2023, that scenario has December 2023 US L48 OS output at 10.17 Mb/d, note that July 2022 US L48 output was 9.56 Mb/d.
Prediction is very hard
I noticed that the actual data is geting less an less, and forecast more and more years, so you have on your graph 2 and a half years of actual production against 22 years of production prediction
it would be nice a chart with 90% data and at only 10 percent prediction/extrapolation call it what is worth
Ed,
I agree predictions are difficult and wrong about 100% of the time. Chart below has all data from Jan 2000 to Aug 2022 (that is all the data available), I show an estimate back to 1950 and the model from Jan 2010 to Dec 2039. I assume average well productivity is unchanged from the average 2020 well from 2021 to December 2039 when the last US tight oil well is completed in the scenario. The maximum completion rate after 2022 is 1160 new wells per month from Jan 2026 to Jan 2028, in August 2022 the completion rate was 885 new wells per month and in 2019 the average completion rate for the year was 1073 per month and the peak centered 12 month average completion rate was 1293 new wells per month in March 2015.
My assumptions about future completion rates and future average new well productivity are both likely to be wrong. The scenario simply shows what would occur if the assumptions of the model are correct.
Ed,
Also note that if the chart ended in 2030, it would look like I expect tight oil output to continue increasing forever, the details are likely wrong, but I expect a peak after 2030 followed by steep decline in output. Note that the EIA’s reference scenario from the most recent annual energy outlook from 2022 has US tight oil on a plateau from 2025 to 2050 at about 9 Mb/d. as in chart below.
In a joint letter, the two top US oil industry groups say “recent discussions with officials raise significant concerns that the [Biden] Administration might pursue a ban or limits on refined petroleum products” exports
https://www.api.org/~/media/Files/misc/AFPM-Granholm-Letter-on-Refined-Product-Exports
That’s pretty big news, isn’t it?
I see another 6.2 million BO was drawn from the SPR last week per API. Down to 416 million, or 240 million below the level in July, 2020.
When does this program end?
Shallow sand, my understanding is the end of October.
Wouldn’t be hard to replenish it at $120 dollars a barrel?
A 1 million barrels/day release from the SPR about to stop combined with a potential 2 million barrels/day reduction from OPEC+. I wonder what this will do to oil prices?
Higher oil prices will deeply damage the global economy I think a recession is unavoidable at this point, its just a matter of how severe it will be.
I believe we are going to find out that central banks can’t save the day. In the most brutal way.
Uk is going into a depression not recession. So is Germany.
Central banks pinning interest rates low so collateral won’t be repriced isn’t going to save the day. Uk is getting ready to find that out soon.
In the meantime if OPEC fails to go large today with it’s production cut, oil prices are going to tank.
The government here in Germany already started the 200 billion € “double whammy”.
So that’s the way – more and more expensive government programs, financed soon by the ECB. Monetary devaluation, either by deflationary or inflationary breakdown and restart.
At years end they introduce a more generous “people money” social security program. Everyone who don’t want to work in low paying jobs can stop working, get’s his rent paid + 500€ pocket money and may add a small mini job to earn some more (or go black working).
Very attractive in the time of extreme expensive gas and heating oil times…. the state pays this. When my partner still would be single, it would pay more than working at the current cost level here.
I think some central banks are going to start doing QE while raising rates like the U.K did. No one knows what the outcome of this will be.
Oil definitely has some headwinds, with the anticipation of recession and decreasing demand, but proper production cuts (assuming implemented) will put a floor on the prices i think. We probably never see oil in the $20s again, i don’t think OPEC+ will allow another repeat of 2020. All speculation on my part though.
https://www.dailymail.co.uk/news/article-11281509/Britain-sends-warships-North-Sea-protect-underwater-gas-oil-pipelines-internet-cables.html
Britain sends warships to defend North sea oil rigs
Monkey werx: https://www.monkeywerxus.com/blog/the-nord-stream-2-pipeline-sabotage
Here is an update for US car sales. The x-axis is the brent oil price converted to energy, measured in BOE. 11.05 USD are today 1 %BOE. The y-axis are car sales in thousands per month. Each point of the curve is the car sales average of the last 12 months, together with the average oil price of the month.
The blue arrow shows the current energy threshold for a significant car sales rise. The threshold is derived from an evalution of the yellow lines, which show the last significant rises of car sales in 2013 and 2021.
BERNDT
Please explain “11.05 USD are today 1 %BOE.” I am assuming BOE is barrels of oil equivalent. Please explain the hoops of getting 11.05 USD equals 1% BOE.
Hi Ovi,
for the conversion of USD to energy i use the energy intensity diagram. It is world GDP divided by world primary consumption for each year. The value for 2022 is estimated by interpolation of the 2021 and 2020 values, The current energy intensity value is about 0.65 USD/kWh. An BOE is equal to 1700 kWh, so 100 % BOE correspond to 1700*0.65 = 1105 USD.
BERNDT,
What is the data used for World GDP? Is it the World Bank in the current USD? According to the World Bank, Global GDP increased to $96.1 trillion in 2021. However, the increase was mostly due to the $44 trillion of debt added in 2020 & 2021.
Wouldn’t the Energy Productivity be even less if we were to adjust for Inflated GDP due to the large debt increase?
steve
Hi Steve,
i use the world bank data, 96.1 trillion USD in 2021.
https://data.worldbank.org/indicator/nY.gDP.MKTP.CD
I believe, it is important to interpret the world economy as a system running on energy, not on money. I have got the proposal to use exergy instead of energy, or to include prices of oil, coal etc., or your proposal. All proposals make calculations more complicated and difficult to understand.
What is money ? It is more or less the commitment to pay back debt, see David Graeber: Debt the first 5000 years. It has properties of a religion.
Energy is the thing moving machines, not commitments or religion.
Money is the part that moves humans to do labor, beside at their homes.
So it’s money + energy – at least until robots get much more sophisticated. Then it’s energy pure.
But you won’t get a car build without energy – and without skilled enough workers. So you need both. And knowledge. Under an knowledge boycott, you can’t build cars, too, even with manpower and enough energy.
And without knowledge you can sit on a big thorium deposit and don’t have energy ;).
A fourth factor is the political dimension. Venezuela has oil (energy) but can’t do much with it at the moment. I sit on the biggest Lithium deposit of the world here (in the meantime they recalculated it), and the Nimbys are gathering in legions because they fear earthquakes of the magnitude of 2 or even 3 that could make small paint cracks in their homes.
It’s not that simple.
(And yes, money is dept and dept is money)
Eulenspiegel,
Well said. Despite what some believe there is more to understanding the World than energy alone. I would add soil and water to your list of important things, perhaps air as well. Many things are needed to allow society to function, energy is one component, but reducing everything to energy, is a bit too reductionist imho.
Berndt-
“I believe, it is important to interpret the world economy as a system running on energy,”
If that is the message you wish to convey,
then simply plot energy consumption vs GDP.
Keep it as straightforward as possible-
5th grade chart level should get the story across.
The drunken spider artwork that you present just clouds your message.
Here is such a simple chart for USA
David Graeber: Debt the first 5000 years
One of my favorite anarchists favorite books.
A great read.
Energy is needed to build cars, as well as labor, water, food, skills etc. That’s true.
Have you ever heard of Liebigs law of the minimum ? https://en.wikipedia.org/wiki/Liebig%27s_law_of_the_minimum
It states that growth is dictated not by total resources available, but by the scarcest resource (limiting factor).
It is not possible, to replace energy by using more labor, water, food, skills etc. In contrast, only with energy enough labor, water, food, skills etc. are available.
No net energy, no cars.
Its even simpler that than.
No net energy…no food.
We all get that.
Have you reviewed the EPBT [Energy payback time] for photovoltaics?
Of course the energy input includes the mining, manufacturing and deployment, etc-
Its in the 1-4 year timeframe (assuming you deploy them outside in a sunny area), and they crank out the energy for over 35 years.
https://www.nrel.gov/docs/fy04osti/35489.pdf
https://www.sciencedirect.com/topics/engineering/energy-payback-time
Berndt,
I will say it again. The net energy for a single product such as crude oil tells us very little.
It is the net energy from all types of energy sorces that society uses that matters for the World economy.
We are not close to the point that net energy from all energy sources is close to zero. In theory it would be a problem, just as no clean air, or no clean water, or no fertile soil would all be severe problems for society.
@Hickory
Hall’s and other investigations into PV contradict those studies. Specifically, look at how Spain fared with regards to the economics and lifetimes of the systems with boundaries accommodating not just the cells, but related installations. When you factor in storage, it gets worse.
Dennis,
i know, it is impossible to convince you.
So, some questions, to see who makes better predictions and to compare in the future.
Do you think US car sales will rise again ?
When will that happen ?
At which oil price ?
What are the reasons for your answers ?
>Energy is needed to build cars
Cars are not the only measure of wealth. Also, it is true that some energy is needed to make cars, but it is not clear how much. We are nowhere near 100% efficiency.
Berndt,
I expect light vehicle sales in the US will rise by 2025, oil price may not be a significant factor as a large proportion of those vehicles will no longer be fueled with crude oil products. A light vehicle is defined as a vehicle with a gross vehicle weight of less than 3856 kg in the United States (<8500 lbs.).
We may not return to the level of 2016 in part due to demographics, an aging population drives fewer miles and needs fewer vehicles, also cars are lasting longer, this will be even more true as the ICE fleet is replaced with EVs. Potentially more use of Transportation as a service in cities and car sharing apps might also reduce the need for vehicles. An analysis that focuses on thermodynamics alone misses a lot.
Kleiber-
Lets see some references for your claim.
And lets have it be from the last ten years and is credible.
@Hickory
https://www.amazon.com/Spains-Photovoltaic-Revolution-Investment-SpringerBriefs/dp/144199436X
It was done following the fallout from the Spanish solar bailouts in the years after the GFC, and is based on real world data. It’s about as comprehensive a study as possible using an actual nation with the best solar prospects in Europe. And it was a farce. You can probably find good excerpts for free online, but the research was mentioned on a few energy blogs when it came out. One of the Amazon reviews gives a good summation.
Thanks for the book link.
Well, we have conflicting information.
Regardless, we will just have to make due with what we’ve got,
and see just how quickly we can lower our collective appetite.
Or, it will be lowered for us.
@Hickory
Sorry it’s not a free paper. I got it originally off Cambridge University’s library ebook scheme a few years back, but I think Alice Friedman or Charles Hall put details up to give a flavour. The meat is, naturally, only found in the book (but that’s mainly the models used and the real world data to feed them). Prieto and Hall are aware of the conflicts which come from certain assumptions or best case modelling.
As you say, we’ll be getting our lifestyles adjusted one way or another. We either do it voluntarily and get used to a lower net energy world, or we have it done to us and hopefully don’t act like petulant children in fighting over the scraps and denying thermodynamics. I think Macron’s energy sobriety plan is one of the few times a work leader, outside Carter, has acknowledged such limits being hit. PM Truss, meanwhile, canned an energy rationing awareness campaign this week.
As it happens, and given the European energy crisis, I am looking at getting a PV and battery installation. But crunching the numbers, the pay off will still be around a decade given what I’ve looked at so far. Without a battery (10 kWh) it’s much less, but also means very little in a blackout. By the way, we’ll likely get rolling blackouts in winter. I’m hoping ‘70s decoration and fashion isn’t the next throwback from that decade to come to the UK.
On a semi-related note, I’m using a dehumidifier as a space heater. The COP of the unit I’m using basically matches that of a decent heat pump system, though just means I can keep my gas central heating low (18°C) and use this to not only dry the winter air, but utilise the condensing process to give me a >100% efficient electric space heater for one room. Much better than an electric oil radiator or fan.
Meaco Arête 20L Coefficient of Performance
– Assuming: total electrical consumption of 0.25 kWh constant operation of fan and compressor over 8 hours.
– One full tank produced @ 4.8 L given average room temperature of 20°C and >70% relative humidity.
– Water density 1 L ≈ 1 kg.
– Enthalpy of vaporisation of water @ 2257 kJ/kg.
Heating output of unit (electrical only): 0.25 kW × 8 hrs. = 2 kWh.
Total condensate collected: 4.8 kg × 2257kJ/kg ÷ 3600 to get kWh = 3 kWh.
Total heat output over 8 hrs. = 5 kWh
Coefficient of performance for assumed energy output and condensation rate is ∴
5 ÷ 2 = COP of 2.5 = 250% efficiency.
Interesting point about the dehumidifier being used as a space heater.
I am surprised you would find residential scale solar economic- I presume you live in N.Europe where the annual solar input is pretty marginal-
(even Seattle which is by far the cloudiest city in the US 48 states has about 15% more annual solar input than cities like Berlin, Brussels, London and Copenhagen)
@Hickory
The UK, yes. And I’ve seen loads of PV and solar water heating panels go up in my area of late, next door neighbour just got 9 panels and a battery for his two bed bungalow (same build as mine). I would agree that northern and Western Europe really are more suited to wind than solar. Harder to get a handy mini-turbine in a residential building area, though. Plus, moving parts and noise. Solar is delightfully simple if you have the space and correct roof orientation.
The payback time varies depending on usage, prices of the electricity on the grid and the cost of the system, as you know, but as I don’t intend on moving any time soon, a decade is still not too bad. Just paying via finance makes it less useful, and I don’t have the capital to hand to buy outright currently. That said, given I don’t see energy being cheap ever again, this could be a suitable hedge against rising bills with a feed in tariff and being a good buffer against blackouts.
For the dehumidifier idea, got that off a Canuck blog you may like: http://www.iwilltry.org/b/heat-your-home-with-a-dehumidifier/
“given I don’t see energy being cheap ever again, this could be a suitable hedge against rising bills with a feed in tariff and being a good buffer against blackouts.”
Understood, and I keep trying to remind myself just how tight the energy supply is now in Europe. Best of luck with it.
Dennis,
my forecast is: Continous decrease of the US car sales (current type of car) for the next fourteen years, reaching zero in 2036. A small upturn of sales might be possible during the next three years, but after that the decrease will continue.
I will not exclude that very light vehicles ( <700 kg) might replace the current fleet of cars, powered by reneweable energy and coal energy. But their number will be much smaller than the number of cars today, and this will not begin before 2027.
Berndt,
If autonoumous vehicles are ever perfected we would see number of cars sold drop as transportation as a service would take off. Not clear what you mean by “current type” of vehicle. If you mean ICEV, I think the number of ICEVs sold will indeed drop, as they get replaced by BEV, perhaps vehicles will also become lighter (especially ICEV as real oil prices rise). The important number is World vehicle sales rather than US sales. The US market is saturated and vehicle use will decrease due to aging population and more telecommuting and more online shopping.
What is your light vehicle (less than 3865 kg) sales prediction for 2025 and does it include BEVs and plugin hybrids or only ICEVs?
OPEC+ Panel Recommends 2 Million-Barrel Cut to Output Limits
https://www.bnnbloomberg.ca/opec-panel-recommends-2-million-barrel-cut-to-output-limits-1.1828375
If this happens and Russian sanctions kick in in December, look for oil prices to hit $120 a barrel, at least. That would take about 3 million barrels per day off today’s oil supply.
Ron
It will be interesting to hear the final result. They could cut 2 Mb/d from targets, which would result in a smaller real cut and make it look like they listened to world pressure.
At least it should be clear now that OPEC+ are past their most productive days. Don‘t count on them to save the world.
Westtexasfanclub,
The cut is because OPEC believes the market is oversupplied, this will no longer be the case when strategic reserves reach some critically low level. The decision by the Biden administration to draw down the SPR by 180 million barrels was not a smart choice in my opinion. At some point soon it can no longer continue.
I agree with you the problem is that if they start replenish it at $120 how high will that grow further!
There is talk, not in MSM, of Rosneft and Aramco arranging policy to explicitly ignore all NYMEX and London pricing in all agreements for short term contracts. The perspective is NYMEX and London are hostile entities potentially controlled by the US and UK govts.
The world is never going back to what it was.
There seems to be a misunderstanding here. The NYMEX does not set bid and asked prices, they just report them. They report what is bid and asked by traders. So I don’t understand how they could be ignored since they do not set prices, they just report them.
That is quite simple, but it is difficult to understand when someone claims that the exchanges are controlled by the US and UK governments. That is just bullshit. The government cannot tell traders what to bid or ask for futures contracts. Just think for a minute. Just how would they go about doing that?
That is, at best, a stupid conspiracy theory, dreamed up by someone who hasn’t a clue as to how commodities exchanges work.
Well Ron
Of course I take your point on this. But I do remind you that not so long ago, when Biden was asked about how he intended to stop the Nordstream 2 pipeline which was entirely under German control, he replied that (the US gov’t) had the means to get it done. If you hadn’t heard that right from the horse’s mouth, would you have said that (US terminal intervention in Nordstream II) was a stupid conspiracy theory?
The President did say it, after all, and right in front of TV cameras.
Germany does not control the input to the pipeline, Russia does. I didn’t see the interview with Biden, but if he said the US had no means to get it done, then that’s it. So what’s the problem?
Hi Ron
No problem, and I am in agreement with you. Upon reflection it was a damn poor argument on my part.
Watcher:
Do you have a source for that?
Thanks
WP
It is now official, OPEC has made the decision to cut 2 million barrels per day. The cuts take effect in November.
OPEC announces the biggest cut to oil production since the start of the pandemic
London — CNN Business
OPEC+ said Wednesday that it will slash oil production by 2 million barrels per day, the biggest cut since the start of the pandemic, in a move that threatens to push gasoline prices higher just weeks before US midterm elections.
The group of major oil producers, which includes Saudi Arabia and Russia, announced the production cut following its first meeting in person since March 2020. The reduction is equivalent to about 2% of global oil demand.
The price of Brent crude oil rose 1.5% to more than $93 a barrel on the news, adding to gains this week ahead of the gathering of oil ministers. US oil was up 1.7% at $88.
SNIP
The production cuts will start in November, and the Organization of Petroleum Exporting Countries (OPEC) and its allies will meet again in December.
In a statement, the group said the decision to cut production was made “in light of the uncertainty that surrounds the global economic and oil market outlooks.”
Global oil prices, which soared in the first half of the year, have since dropped sharply on fears that a global recession will depress demand. Brent crude is down 20% since the end of June. The global benchmark hit a peak of $139 a barrel in March after Russia’s invasion of Ukraine.
OPEC and its allies, which control more than 40% of global oil production, are hoping to preempt a drop in demand for their barrels from a sharp economic slowdown in China, the United States and Europe.
What’s hilarious is that OPEC+ is spinning this like a voluntary cut when in fact they can’t produce at current levels for more than a month or two so a cut had to happen
Stephen,
At some point the releases from the SPR of the OECD will stop, then oil prices will increase and we will see what OPEC can produce. The real cut will only be one million barrels per day as many of the OPEC plus producers were producing far below their quotas. OPEC may be worried about lack of demand and would like oil prices to return to $90/bo or more. A cut may accomplish this unless the coming recession is severe.
Saudis at 11 mil, couldn’t last for more than a few months.
It will be interesting if they cut their actual production or their overinflated quotas. If I had to guess then I say it will be the former.
Attached is a table that shows the OPEC production revisions from August for the months of November and December. The second last column shows OPEC 10 production for August and the last column shows the difference with the updated Voluntary Product, i.e. new target.
As you can see the biggest reduction/help goes to SA, UAE, Kuwait and Iraq, the four countries producing at production levels that were never sustained before for more than six months. Also Angola and Nigeria aren’t underproducing as much as before.
Note that Russia is the same as SA.
Thanks Ovi,
So if the quota for OPEC 10 is met for the 6 nations producing over the new quota, output decreases by 853 kb/d. Also Russia is already below the quota, not sure about other OPEC plus nations, but we would aat most see a 200 kb/d decrease from those nations so all told no more than a 1054 kb/d decrease. It may be that OPEC plus reverses course when releases from SPR stop.
It will be interesting to watch what happens in November and December 2022 and beyond.
There is a fundamental change in this.
In decades past, KSA leadership took on the opinion that they must not elevate prices to a point where they destroyed the economies of their customers. This was always the rationale for restraint presented to the less conservative countries of OPEC, who wanted to inflict pain on those customers considered enemies.
That has gone away. Russia and KSA have zero reason to expect anything but animosity from these customers, and the Saudi Minister of economics and planning is out of Penn State and MIT. He learned that central banks can create money and economies can’t be outright destroyed. KSA has no reason to embrace that conservative perspective of the days before MBS came to power.
The Administration says KSA is aligning with Russia. This is likely true. No reason why they should not. They can do whatever they like to extract the maximum number of printed dollars from the US.
Watcher
I think that OPEC wants $90/b oil. That is probably a fair price for consumers and producers. Let’s see what happens if it gets above $100/b
Fair is not an imperative.
There is talk of White House rage, and regime change eliminating the House of Saud via assassination. This is what happens when an Administration of green people experience utter shock at discovery that oil is EVERYTHING, and the inevitable desperation that follows.
Funny listening to the politicians who claim that if the Biden Administration would let them, US producers could keep the world market well supplied and we wouldn’t need OPEC+ oil.
I agree Biden is no friend of US producers. But the idea that the US has unlimited capacity to grow shale continues to be believed. I think many Dem political types think that too, actually.
SS
Living North of you I keep scanning all the news channels CNN, FOX, MSNBC and CNBC to see what subject each of them is pursuing. One of those channels keeps insisting that if B hadn’t shut down Keystone 2, the price of gasoline would be much lower. No mention of the protests and court battles that TC Energy had to put up with during the 4 yrs that T gave TC Energy to get it through the courts. I think they wrote off $1.3 B
Ovi.
I honestly am not qualified to comment much on Keystone 2. I guess I will say the whole thing just became a political nightmare.
I guess I’m just surprised few outside of here are noticing the difficulty so many countries are having with growing oil production.
I alway like to use our little field as an example. It is maybe a bad one, but it so easy for me because I’m living in it.
We had a lot of wells drilled 2005-14. There hasn’t been much activity in 2022 regarding new wells. Just a company that owns its own rig, and had a lot of casing stockpiled pre-COVID.
Heck, there are still wells shut in during COVID that have never been put back on.
Our field turned 117. It is going to produce less oil than in any other year in 2022, even including 2020.
This has to be the situation in old fields all over the world.
In the old days we itched to drill when prices were high. Now we have zero desire to fight it. We are getting older. But there is almost nobody following us. Not hardly any of the next generation.
Anyone in our field under 50 is considered a young guy.
Shallow sand,
Can you give us a rough idea of the % annual decline rate in your field (total output) over the past 12 months if you have data available (most recent month minus same month one year before divided by average output over that 12 month period times 100)?
Thanks. My guess is 4 to 5% or less (see below for why this guess might not be very good.)
Based on EIA data for the state of Illinois using natural log of C plus C output data for August 2020 to July 2022 (24 months) and using the slope of the OLS regression on that data, I find the average annual decline rate has been 1.3% over the past 2 years. Longer term from Jan 2005 to December 2019 (to avoid the pandemic) the average annual rate of decline in output in Illinois was about 1.2% per year.
Dennis. Go to iprb.org. It has IL production by county 2008-2021. Our MC Field is exact same as Crawford. MC is all in Crawford and only field in Crawford is MC.
They keep drilling HZ wells in White County near the Wabash River that IP strong. Only thing holding the IB together it appears.
Maybe you can analyze and give a better opinion. Seems we have hung in better than most. Very old fields in IB.
Shallow sand,
Thanks for that.
Chart below has natural log of annual output for Crawford county from 2013 to 2019, the slope of the line is the annual decline rate, which is 4.6% per year, so my intitial guess turned out to be right (probably based on a comment you made years ago with a rough guess of 4 to 5% annual decline rates in your field).
The linear trend is based on ordinary least squares regression on the data over that period. Note that output was increasing from 2008 to 2013, Shallow sand knows this, but others may not.
For anyone interested I used the page below
https://iprb.org/industry-facts/illinois-production/
Crawford, IL oil output in kb/d, 2008 to 2019.
Dennis.
I think if you analyze other counties, you might find a larger percentage decline.
Marion County is almost entirely the Salem Field. It was discovered in the late 1930’s and operated for decades primarily by Texaco. It has been operated by Citation since 1998. Citation drilled a lot of wells up until 2014, not as many since 2015.
Fayette County is almost entirely the Louden Field, also discovered in the late 1930’s. Same thing.
The Lawrence Field was discovered in 1906, and was operated by Marathon until the 1990’s. It is entirely within Lawrence County and makes up 99% of Lawrence County’s production.
The Clay City Consoldated Field is located in Clay, Jasper, Richland, Effingham and Wayne Counties and makes up all, or almost all of those counties’ production. Discovered in 1930’s. Was the highest producing field until the recent horizontal drilling in White County.
Clark County is also almost all just one large field, discovered in 1904. Mostly version shallow wells under 500’. Very heavy drilling on 2.5 acre spacing 2011-15.
Edgar County is almost all the Dudley Field, which was discovered in the 1940’s. It is a small field, just around 1,000 acres, if that. It has really dropped. Also very shallow wells under 500’
DeWitt County is entirely the Wapella East Field. It has really dropped. It was discovered in 1962 and consists of just 550 acres. Has produced 4.1 million BO through 2020.
Studying these fields has led me to believe that if locations in a field are completely exhausted, and/or drilling no longer becomes economic, decline rates can be high.
Shallow sand,
What decline rate would you consider “high”? For Illinois as a whole the decline rate is fairly low, but perhaps if I excluded white county the results would be very different.
Note that for Marion county the annual decline rate from 2015 to 2019 was about 4.4%. From 2012 to 2015 output was fluctuating between 980 and 1030 kb/year in Marion county.
Can you remember which county was particularly high decline?
Shallow sand,
For Edgar county the decline rate is about 5.3% from 2008 to 2019. I believe this was one of the counties you suggested had dropped a lot. I also looked at Dewitt County and the exponential trend for 2008 to 2019 is an annual decline rate of 3.6%.
For Illinois total output minus White county output, the annual decline rate from 2012 to 2019 was about 5% per year. If we use the longer 2008 to 2019 period the annual decline rate is only 2.5% for Illinois minus White county because output was fairly flat from 2008 to 2012
Dennis.
Thanks for calculating those because I didn’t. I was just eyeballing, and my eyeball math apparently is poor.
Prior to the late 2014 crash, there was a lot of drilling activity going on in most of the larger producing counties.
Since 2014, most drilling has been in White. Those wells are expensive, but do produce a lot of oil early on.
I think probably over 6% I’d consider high. So maybe none are.
Shallow sand,
If you look at short term rates (Edgar from 2012 to 2014 for example) the annual rate of decline over that three year period was high, but longer term it was not.
Chart below has Illinois total annual crude output minus White county crude output (in kb per year)with an exponential trend line, annual rate of decline is about 5% (0.05).
“I agree Biden is no friend of US producers.”
US producers are not a friend of the Democrats either.
In 2021, the oil and gas lobby spent 5 to 1 for Republicans. “Lobbying spending of oil & gas companies in the United States during election cycles from 1990 to 2022, by receiving political party”
https://www.statista.com/statistics/788056/us-oil-and-gas-lobbying-spend-by-party/
All the regulars here know the increased price of energy over the last year has not been because of Biden. It’s been in the making for decades. Yet the Republicans have been blaming inflation on Biden for over a year. They boxed Biden in a corner on energy prices politically. In return he released 100MB from reserves 6 months prior to the election. I would have released 150MB.
In years past, during World War 2 the American public rationed gasoline. In the 1970’s America reduced speed limits to 55mph. But today, in an America were covering you mouth with a 10 cent mask to save lives are fighting words. Neither of those options are viable.
Personally, I hope oil goes to $200 a barrel. It will put an end to ICE and needless driving a lot sooner.
Ehh. I didn’t really mean for that post to be political but I guess I should know better.
My point is that most in both parties think this “high price period” can be taken care of by the drill bit. One thinks the US is an energy powerhouse. The other thinks OPEC+ is holding back a lot of spare capacity.
Apparently it’s an unforgivable political sin to even remotely suggest peak supply.
That was my point.
By the way, are you still holding your oil and gas shares?
2020 was ugly, but in the 4th quarter I was buying all the refiners and producers I could with available cash. Started selling it the first half of this year until the price broke in early June. Started selling a little more this week. I expect the June down turn to continue for another couple of months. I think we are in a period similar to 2004 to 2008. An under supplied market with new oil price highs every year.
Oil and politics are like peanut butter and jelly.
I’m still holding XOM, COP and PSX. I thought about buying Canadian producers when things were lower in 2021, but didn’t. Seems like SU has had some management issues?
I added CVN, XOM, OXY, DVN, RIG, PBF and SLB in the forth quarter. With DVN being my best return at 800% capital gains to date plus dividends and RIG my smallest investment being mostly flat. I’ll bet you have owned the COP and PSX since the spin-off.
CRC the OXY debt filled spin-off filed Bankruptcy in 2020 and the bond holders became the owners.
Russia increased oil production in September
Wednesday, 7:38 PM | October 5, 2022 by admin
Thus, the extraction of raw materials returned to the July norm, reaching 1.47 million tons per day. At the same time, the level of oil exports by sea remained at the same level.
10,775 kb/d using 7.33 barrels per ton
This is a bit of a strange link.
https://scooptrade.com/russia-increased-oil-production-in-september/
Ovi,
An interesting find. Below is a diffent link from Moscow Times confirming this.
https://www.themoscowtimes.com/2022/10/05/russia-boosts-oil-output-despite-western-pressure-kommersant-a78979
So this would suggest an actual cut by Russia with the new quota of almost 300 kb/d, which would increase the total OPEC plus “real” cut in output to 1300 kb/d roughly.
Great find, thanks.
Russia increased oil production in September
The source of their data was The Moscow Times:
It may be accurate but I will wait for confirmation.
Ron,
In the past the information from the Moscow times has matched that from other sources, but for now it is the only information I could find, seemed it might a better source than “scoop” which I had never heard of.
https://www.youtube.com/watch?v=gG-DwlPtXEE
Peter Ziehan on announced OPEC cuts
Zeihan says OPEC cutting its quota … may INCREASE their production?
Congrats on your book Ron, I look forward to reading it.
Hey DC, how have you been? Haven’t seen you post here for awhile. Hope things are good.
June World Oil Production numbers are out.
Production is up slightly less than 400 kb/d from May. Down 1,321 kb/d from February.
Full report out late Tuesday.
After the latest cut announcement, I googled and found the IEA World Energy Outlook projections for OPEC since 2000. The year of the projection is (more or less) evident from its branching point from the actual data. Edit – the chart won’t load, I get a page not found error. No matter. Predicts 60mbd by 2020, in 2000. It was above all this absurd, um, optimism, especially early on, which motivated peak oil arguments. The US shale oil boom has in a way temporarily hidden the year 2000 30mbd overshoot in IEA estimates for OPEC in 2020.
Use a program such as microsoft paint or gimp to resize the image to about 50-60kb.
And make sure it’s a gif, not a jpeg or png. A gif takes a lot less data.
But, you could just post the link then we could look at it from there.
Thanks. Ok, Here’s the paper, Uppsala University – didn’t read it though, (will do now) not endorsing it’s contents, only looked through for the OPEC chart, which I take to be pretty likely correct, to be found on page nine of the pdf. No subscription needed.
2015, looks like:-
Oil projections in retrospect: Revisions, accuracy and current uncertainty
Henrik Wachtmeister, Petter Henke, Mikael Höök
Department of Earth Sciences, Uppsala University, Villavägen 16, SE-752 36 Uppsala, Sweden
https://reader.elsevier.com/reader/sd/pii/S0306261918303428?token=49800359569107AC2D244FB20CEC9410D1C1B0D762729B94472B8F6D99D423598EE18277797FFA2F82F490229B42F449&originRegion=eu-west-1&originCreation=20221008140951
House lawmakers say decision to cut oil production yesterday is a “turning point” in the US-Gulf State relationship.
https://responsiblestatecraft.org/2022/10/06/dems-propose-full-withdrawal-from-saudi-arabia-uae-after-hostile-act-from-opec/
If they only knew they had to cut because they were already producing way above their long term capicy. They are all producing flat out and will likely continue to do so even though their production will decline.
Obama is still running the US. Obama has always preferred Iran. This may just be for the midterms. But just threatening is enough.
The Saudis have their own IRBMS they bought from the Chicoms years ago. And since they financed the Pakistani nuclear bomb program, they have some of the fruit of that. Or they may go a hybrid nuclear umbrella with Israel. But they won’t be buying US weapons from here – it will be European and South Korean. And oil sales won’t be made in US$. They might make the US pay in Euros. The original deal was that all oil sales were made in US$ and the US provided protection on its part.
Military sales transform base metals and plastic at $4/kg into stuff that is sold for a thousand times more.
“Obama is still running the US. Obama has always preferred Iran”
You sure about this? When has any US President is recent years preferred Iran over Saudi Arabia?
USA is giving Saudi Arabia weapons, not Iran!
And no one person “runs the USA”, Obama only does his unofficial duty of promoting people from his political party and helping to raise money if he feels like it.
Consider this. During the eight years of the Obama presidency Susan Rice would openly mock Biden for being stupid. So there is enormous bad blood between them. Lo and behold, on January 20, 2021 Rice becomes Director of the Domestic Policy Council in the Biden White House. Biden was forced to accept her so he created a new non-position for her. You don’t believe me of course but believe Luttwak: https://www.tabletmag.com/sections/news/articles/three-blind-kings-edward-luttwak
The Biden regime isn’t lead by Biden. It is more of a quasispecies swarm.
That’s a poor take. Susan Rice is regarded as very capable, but also egotistical and intemperate. As Ambassador to the UN she was sometimes mocked for being uninformed. Her boosters were hoping she’d be the VP running mate, but others thought she should be purely a domestic affairs hire.
Your premise seems absurd and a little reading shows that. I read your link, and was underwhelmed.
“That’s a poor take. ”
Thats putting it gently…its his (Archibald) specialty.
Ok Dave, is it Obama or a quasispecies swarm running the USA?
Australia, 70% uninhabitable due to deserts, 30% uninhabitable due to Australians.
Maybe book and appointment to get your meds rebalanced.
Yea, Archibald is an Aussie and so obviously has all the answers.
Royal Saudi Strategic Missile Force Has some DF-3’s and DF-21’s. Iran would still paint the sand with them if it came to a war. KSA couldn’t fight their way out of a wet paper bag.
Janet Yellen clearly doesn’t think OPEC+ would have any problems maintaining oil production at current levels.
https://www.theguardian.com/business/2022/oct/10/cutting-oil-output-risks-global-economy-warns-us-treasury-secretary
Delboy,
With the exception of Russia, due to sanctions, the rest of OPEC plus could probably maintain output near current levels for 12 to 24 months, if they chose to do so. Later in the year (after releases from SPR cease) we will get a better idea if I am correct.
Very long article, all very interesting. I have posted here only a small part of it.
Russia Loses 60% of Its Seaborne Crude Market in Europe
(Bloomberg) — Russia has lost three-fifths of its seaborne crude sales in Europe since Moscow sent troops into Ukraine in February. That market is going to vanish almost completely eight weeks from now and the latest sanctions will make it very difficult to divert flows elsewhere.
Crude shipments to Europe averaged 630,000 barrels a day in the four weeks to Oct. 7, down from 1.62 million before the invasion. Tankers carrying Russia’s oil are now forced to spend four times as long making each delivery to India as they would previously have done shipping a cargo to the Netherlands, or 10 times as long as it would have taken to get to Gdansk in Poland.
The European Union’s latest round of sanctions, passed in response to President Vladimir Putin’s annexation of parts of Ukraine, include a ban on shipping Russian crude anywhere in the world on EU tankers — an escalation that could greatly increase the impact on seaborne flows. The sanctions have also been revised to incorporate a price cap championed by the US Treasury under which, from Dec. 5, buyers of Russian crude could use European ships, insurance and other services, but only if the price they pay is below a certain threshold.
Russia has said it won’t sell its oil to anyone who imposes a price cap, warning that its introduction could lead the country to cut production, and its major customers remain unlikely to endorse the plan. Still, the existence of such a mechanism is expected to boost the bargaining power that key customers China, India and Turkey have over Russia for future purchases.
This guy knows what is happening and the world should damn well be worried. When the CEO of Aramco says we are running out of oil, people would be wise to listen. But of course people are not wise and they will totally ignore his warning.
‘World should be worried’ by lack of spare oil output capacity: Aramco CEO
Spare global oil production capacity is running thin and the world should be “worried” about the impact of a rebound in demand when China winds down its zero-COVID policy and aviation demand fully recovers, Saudi Aramco’s CEO Amin Nasser said Oct. 4.
Despite growing fears of a global recession, world oil demand could rebound sharply in China while jet fuel demand remains some 1.7 million b/d below pre-COVID levels, Nasser told the Energy Intelligence Forum in London.
“If China were to open up a little bit we will find our capacity eroded completely… when we erode that spare capacity, the world should be worried because there is no cover for any recovery or any unforeseen interruption anywhere in the world,” Nasser said.
He said Saudi Arabia’s own target to increase its production capacity remains on schedule. Saudi Aramco, which produces and sells oil on behalf of the Saudi state, is currently working to raise its production capacity to 13 million b/d by 2027, with capacity additions coming online in increments.
Saudi Arabia, the world’s largest exporter of crude, pumped 10.92 million b/d in August, slightly below its quota under the OPEC+ agreement, according to the latest Platts OPEC survey.
The kingdom claims that it is capable of pumping 12.5 million b/d, if needed, although that is untested, and S&P Global Commodity Insights estimates that sustainable capacity is closer to 11.5 million b/d.
Ron
It all hinges on “the world should be “worried” about the impact of a rebound in demand when China winds down its zero-COVID policy and aviation demand fully recovers, Saudi Aramco’s CEO Amin Nasser said Oct. 4.”
Until demand rebounds to the point of stressing OPEC, we will not really know their maximum sustained capacity.
Ovi, I think you are underestimating OPEC’s ability to know what they can produce and what production level they can sustain. I think they have a pretty good idea as to both those levels. I think they are at maximum production right now and well above their sustainable level. And I think they know that.
And that, Ovi, is why they are announcing a big cut in production. They want everyone to think they did it on purpose. 😆
Ron
I have the same opinion that they cannot sustain production at some of those previous and current levels.
What is difficult to ascertain is the meaning of the SA statement that they can produce 12.5 Mb/d. That could just be the total of the maximum capacity of all of their wells combined producing at the same time. However when one throughs in the operational issues of maintenance and drilling, the real annual capacity could be closer to 11.5 Mb/d, as stated in other publications.
What is difficult to ascertain is the meaning of the SA statement that they can produce 12.5 Mb/d.
What is the meaning of the SA statement that they have 267.19 billion barrels of oil reserves? The answer is obvious, they are lying. Of course, they could actually believe that. As George Costanza said, it’s not a lie if you really believe it. Nah, nobody could be that dumb, they are just lying.
I don’t think they can sustain 11 million bp/d for more than two or three months.
“Industry oil stockpiles in countries that make up the Organization for Economic Cooperation and Development are 9.2% lower than the five-year average… While the oil cartel has often cut production in the face of weakening demand, it never implemented a cut in such a tight market, according to a Goldman Sachs research note from Monday.”-Jinjoo Lee, Wall Street Journal
Energy Bulletin over at Resilience 10/11/22
https://www.resilience.org/stories/2022-10-11/the-energy-bulletin-weekly-11-october-2022/
Thanks, Stephen. There is something very suspicious about this cut. I think perhaps a cut was about to happen whether they wanted to cut or not. So they just announced it and let the chips fall where they may. To my knowledge, they haven’t announced any quotas, and I doubt they will. Production will fall even though everyone will be producing flat.
Anyway, that’s just my opinion, for what it’s worth.
It certainly is a high risk proposition for the Saudis either way. If they think the Russians have any extra weapons to supply their Yemen debacle I think they will be sadly mistaken. But I guess this option is better than announcing the truth of being maxed out and only having half the stated reserves of what they’ve been saying for the last forty years 😂
Cutting oil production is getting KSA a response worse than murdering journalists and invading Yemen.
“The United States must immediately freeze all aspects of our cooperation with Saudi Arabia, including any arms sales and security cooperation”
—Senator Bob Menendez
https://www.reuters.com/business/energy/senior-us-senator-wants-freeze-saudi-cooperation-blasts-riyadh-2022-10-10/
Would be interesting to see the Houthi Movement beat the shit out of KSA for a while; maybe get bin Fuckface hanging from a tank barrel.
Survivalist
I hope the US policy makers do not listen to the short sightedness of Senator Bob Menendez. When the US moves out, the Russians move in. Not a good move.
The Russians have no capacity and are no problem – the Chinese will move in. And stay.
I feel the Russians are lagging in their security guarantees; Armenia for example. The CSTO looks suboptimal. China seems a more likely contender; although a refit and transition from American to Chinese kit would create a transition period of vulnerability. KSA may moderate their policies to avoid it.
Russia’s Unhappy Club: The CSTO
https://www.rferl.org/amp/russia-club-csto-ukraine-military-alliance/32079498.html
The EIA World production update will be posted tomorrow late afternoon. I want to incorporate the latest STEO projections into a few of the charts.
‘The International Monetary Fund predicts global growth will slow to 2.7% next year, 0.2 percentage point lower than its July forecast, and anticipates 2023 will feel like a recession for millions around the world.
Aside from the global financial crisis and the peak of the Covid-19 pandemic, this is “the weakest growth profile since 2001,” the IMF said in its World Economic Outlook published Tuesday. Its GDP estimate for this year remained steady at 3.2%, which was down from the 6% seen in 2021.
“The worst is yet to come, and for many people 2023 will feel like a recession,” the report said, echoing warnings from the United Nations, the World Bank and many global CEOs.”
Slowing growth means no significant pickup in oil demand.
And therefore the big test of spare capacity is unlikley in the next year or two.
When you pay a lot for energy and for accumulated debt service, you have less lying around to fund other needs and desires. And that includes discretionary energy spending (and vehicles and energy infrastructure).
Hickory,
An annual growth rate of 2.7% is pretty far from a recession. In 2012 and 2019 World real GDP growth was under 2.7%, the average annual rate of growth from 1980 to 2021 was about 3% per year. From 1980 to 2019 the average annual rate of World real GDP growth was 3.1%.
See
https://data.worldbank.org/indicator/NY.GDP.MKTP.KD
Information on OPEC plus output in article linked below
https://www.spglobal.com/commodityinsights/en/market-insights/latest-news/oil/101022-opec-crude-oil-production-rises-in-september-but-still-widely-lags-quotas-platts-survey?utm_campaign=oktopost-2022-platts+opec%2b+survey&utm_content=oktopost-twitter&utm_medium=social&utm_source=twitter
Text from Dennis’s post above. I tried to post it an hour ago but could not get it to accept the chart he posted, even as a gif. This thing about not being able to post charts is getting old. I don’t understand how some people can do it but others cannot.
OPEC+ crude oil production rises in September, but still widely lags quotas: Platts survey Requires Registration, Bold mine
The OPEC+ alliance boosted crude production by 170,000 b/d in September to the group’s highest since April 2020, according to the latest Platts survey by S&P Global Commodity Insights, but remains shy of pre-pandemic levels with several members pumping massively below their quotas.
OPEC’s 13 countries produced 29.75 million b/d, a rise of 190,000 b/d from August, while Russia and eight other allies added 13.26 million b/d, down 20,000 b/d.
The September performance was aided by sizable gains from Saudi Arabia, Iraq, and Libya, which more than offset losses from long-struggling Angola and Nigeria, which hit their lowest in the 34-year history of the Platts survey.
As a result, the gap between the group’s quotas and actual production remained a sizable 3.6 million b/d, roughly the same as in August, the survey found. Iran, Libya, and Venezuela are exempt from quotas.
The underperformance highlights the alliance’s continued issues with dwindling spare capacity and the impact of Russia’s invasion of Ukraine.
Russia, under harsh western sanctions that are set to ratchet up in December, is the biggest laggard to its quota, with its September production at 9.77 million b/d—about 1.26 million b/d below target.
Traditional buyers in sanctioning countries have cut imports from Russia. It has redirected some volumes to Asian markets including China and India but is unable to fully reroute these supplies.
Saudi Arabia, which co-chairs the OPEC+ alliance with Russia, pumped 11.02 million b/d, close to its quota and an increase of 100,000 b/d from August, supported by strong exports and ongoing high levels of crude burn.
Notice in the chart above, Platts said Russia produced the same number of barrels in September as they did in August. The Moscow Times said Russian production was up 250,000 barrels per day in September. I will take the word of Platts over that of The Moscow Times. Their estimate is more believable since several news agencies published data showing Russian exports took a dive in September.
Ron,
We can only guess what Russia’s output is. Platts is reporting crude only rather than C plus C, but the change in output should be roughly the same in either case. It may be that the Moscow times is reporting total liquids output rather than C plus C.
On OPEC quotas mentioned earlier you are correct that they are not calling these quotas, instead they are “voluntary adjustments” as in the chart below from link below
https://www.opec.org/opec_web/static_files_project/media/downloads/Production table – 33rd ONOMM.pdf
Considering OPEC output in September, the OPEC10 nations subject to quotas will reduce output by only 978 kb/d in November from September output levels, the reductions from OPEC plus nations will be close to zero, maybe 60 kb/d, so for all of OPEC plus the cuts from September output levels amount to about 1040 kb/d (this excludes Iran, Libya and Venezuela who are not subject to quotas).
Platts is reporting crude only rather than C plus C, but the change in output should be roughly the same in either case.
No, output should not be the same in either case. A lot of condensate comes from gas fields. Gas production has dropped far more than oil production. However, the OPEC MOMR that just came out this morning says Russian liquids were down in September. The below paragraph was taken from the “World Oil Supply” section of the MOMR. Bold mine.
November from September output levels, the reductions from OPEC plus nations will be close to zero, maybe 60 kb/d,…
Your link doesn’t work but your chart shows Russia down by over half a million barrels per day. But you just don’t believe that stuff do you?
Ron,
I said change in output might be similar.
Using MOMR estimate of 10.8 Mb/d for total liquids from Russia and using the 2021 average ratio of Russian C plus C to total liquids (based on BP Stats data this is 95.5%), I get a September 2022 estimate for Russian C plus C of about 10300 kb/d, with August 2022 Russian C plus C at about 10400 kb/d. The decrease in Russian NGL in September was estimated by OPEC to be about 10 kb/d, this is a pretty small change. Note that OPEC has Russian output 100 kb/d higher in August than the Platts piece you posted earlier, September Output of crude is the same in both cases at 9.7 Mb/d, Russian C plus C is likely about 600 kb/d higher than crude only at roughly 10.3 Mb/d.
See page 45 of October MOMR
https://www.opec.org/opec_web/en/publications/338.htm
I get a September 2022 estimate for Russian C plus C of about 10300 kb/d, with August 2022 Russian C plus C at about 10400 kb/d.
Thanks, Dennis, I have absolutely no problem with accepting those numbers. I think you are finally getting pretty realistic with your data. Congratulations.
Ron,
I mistakenly thought the Moscow times piece gave a C plus C estimate, but it seems it was probably total liquids, based on the MOMR report. I was re-evaluating the World C plus C estimate based on this new OPEC data and 2022 average annual output might even be a bit above 80 Mb/d, possibly as high as 80.2 Mb/d, it depends in part upon what OPEC plus output looks like in the fourth quarter of 2022. But your 80 Mb/d estimate will be within 250 kb/d of the correct number in my opinion.
Dennis, I think 80.2 million barrels per day average for 2022 is a little high. However, I will not argue with that figure until I see two or three months of data from the EIA International database.
The Moscow Times estimate is nothing but pure propaganda and should be ignored entirely.
The world is changing very fast. Putin is likely going down, as he may not have a second who will obey his order to deploy tactical nuclear. But who will replace him? It may be someone much, much worse. And one more thing: it will be someone vetted by President Xi.
OPEC+ has shot the middle finger at President Biden. It happens to be a very bad time to do that. Biden is upside down in just about everything, but especially energy. The Khashoggi murder has a lot of people roused, as does KSA’s role in 9/11. Basically, there is a plot afoot to NOPEC them, which would be a grievous error and would push them into the arms of their next protector: China + Russia. An alliance.
As we move along the spectrum of peak oil, tensions will hit the top of the Richter. Specifically, it is too late for the UK to start a fracking program, just as it too late for Germany to start a concentrated small modular nuclear program and much too late for countries–esp. Europe–to deglobalize (de-Russianize) the formation of ammonium nitrate by the Haber process. The die is cast. There will be energy poverty and electricity insufficiency and famines galore. And they’re coming soon.
In that world–which could go on for quite some time–there will be astronomical payments for electricity. Add up all the people on dialysis and all the manufacture of German luxury automobiles and the data storage centers making up the Cloud. The blame game is about to begin in earnest. Death by starvation will be a sobering thing to the world–we haven’t seen great famine since Bangladesh. Well, here it comes. And with it 3rd world countries defaulting on sovereign debt–and if they’re not careful, even the UK doing the same. There will be contagion in this tainted money pandemic, spread like smallpox fomites on a Monday when nobody is suspecting it.
The world is changing. And fast. There will be pockets of energy security and pockets just the opposite. It is just too damn late. Nobody has bothered with a cogent and coherent energy policy. The U.S. of A. certainly hasn’t. We have an energy secretary who couldn’t give you the germane pieces to the energy puzzle if her life depended on it. The UK and Germans and Aussies don’t either. China has a plan. I am no fan of China but by God they have a plan. That’s to dig up and import as much coal as they can, import as much oil and gas as they can store, all the while closing the lid on 95% of all rare earth elements and accelerate electric vehicle buildouts. It doesn’t make a damn to Xi that they have to charge those cars from electricity generated from brown coal-fired utility companies, they have a plan.
And it involves Saudi Arabia and Russia much more than any of us should feel good about. The “Energy Transition” is probably going to be known as the greatest geopolitical shift in the history of the world.
“The “Energy Transition” is probably going to be known as the greatest geopolitical shift in the history of the world.”
I’m sure that many peoples will see it differently, such as the Indigenous peoples of the America’s, among other continents. And all those who were conquered by horse riding warrior tribes over the past 10,000 years. There are certainly more examples, but those who were overrun did not get to write any chapters in the history books.
Nonetheless, your point is accurate- a great reshuffling between countries, and within countries, is to be expected. The great globalization of energy with diesel fuel for generators and tanker trucks delivering petrol and cargo ships running on bunker fuel and jet planes landing on runways- all around the world being the commonplace norm will no longer be able to be taking for granted, as the next decade or two unfolds.
There has always been energy haves and havenots, but the schism will regrow to become huge.
That reminds me. In 2014 I was talking to the publisher Regnery in Washington about my book “Twilight of Abundance”, developed from a lecture I give entitled “The Four Horsemen of the Apocalypse” – so someone has written a plan.
They asked “What do you hope to achieve with this book Mr Archibald?” I replied “Step one is to write an energy plan for the United States, step two is to implement the plan.” I was a believer in thorium in those days. It is too late for that. The best solution is the GE-Hitachi Prism reactor which is a sodium-cooled breeder reactor. It is described as “the best design never built”. Small modular reactors have less chance of blowing up than the current generation of light water reactors but still waste too much uranium and have the same actinide waste legacy. It is a shame to waste natural gas for power generation but it can be used directly as a vehicle fuel. Coal to liquid fuels is coming using the Bergius process instead of Fischer-Tropsch. The hydrogen for that will be made with power from the Prism reactors. We are going to have to do all that while suffering cognitive decline from long covid before the virions emerge from their immunoprotected reservoirs.
Must watch, 12.5-minute video:
Saudi Arabia Is Probably Lying About Their Oil Reserves
Aug 17, 2022 Saudi Arabia is the richest Middle Eastern country in the world. This is all thanks to their massive oil reserves which have taken the country from a desolate wasteland to a thriving desert oasis. Their flagship company, Saudi Aramco, is worth about $2 trillion and they generally pull in some of the largest profits in the world. With all the wealth Saudi Arabia has gotten through oil in the past 100 years, they’re definitely not going anywhere anytime soon. However, we may not be able to say the same thing about their oil reserves. You see, there are actually a lot of red flags that are pointing towards Saudi Arabia lying about their oil reserves. Right after Saudi leadership took over Aramco in 1988, Saudi Arabia’s oil reserves suddenly jumped by 90 billion barrels. Not to mention, their reserves have stayed constant ever since despite having pumped out nearly 100 billion barrels of oil in the past 30 years. This means that Saudi Arabia has discovered 200 billion barrels of oil since the Americans left the country. Some high-level oil officials from Saudi Arabia have also been suggesting that their oil reserve figures are sketchy, to say the least. The purpose of all of this would be to keep the rest of the world dependent on Saudi Arabia for as long as possible because that is their biggest negotiating chip. This video explains why Saudi Arabia may have been lying about their oil reserves and why Saudi Arabia may run out of oil way sooner than we all think.
From 1980 to 2005 US reserves grew by about 63%. Lets say Saudi Arabia’s 170 Gb of reserves in 1988 grew by 63% over the next 25 years. That would be 277 Gb, about 103 Gb of oil has been extracted since 1988, leaving 174 Gb of oil. Saudi Arabia has chosen to develop reserves slowly as for the most part they have had adequate capacity to act as the World’s swing producer. Soon this may no longer be true as investment by oil companies in general has been very modest of late.
Dennis, US reserves grew by new discoveries and the updating of proven reserves. Oil companies publically traded must estimate their reserves to the public who buys their stock. To not run afoul of the law they always originally underestimate their reserves. Some call that “reserve growth”, but it is nothing but oil companies trying to comply with SEC regulations.
Saudi updated its reserves in the 1980s. If there were any underestimating of reserves by the four original US companies that owned ARAMCO, that most definitely took care of that. And there have been no new discoveries since then. Reserves don’t really grow Dennis. I thought you knew that.
Ron,
Estimates of reserves change over time as more knowledge is gained through developing an oil resource, that is the definition of reserve growth. There were not a lot of oil discoveries in the US from 1980 to 2005, most of the increase was reserve growth, in fact I excluded new discoveries in my analysis and looked specifically at reserve growth. If it can happen in the US, it can happen in Saudi Arabia. Note that the 170 Gb estimate I started with for Saudi Arabia was subject to SEC rules. Also Saudi fields were less mature than those in the US so we would expect reserve growth could potentially be higher than the US.
See
https://peakoilbarrel.com/us-oil-reserve-growth-2/
Dennis, I know what reserve growth is. Saudi Arabia’s reserves grew by 90 billion barrels in one day, the day they decided that they would simply state their reserves. Every year they produce over 3 billion barrels and every year their reserves grow by that amount and sometimes a little more. It is called magic oil. For every barrel pumped out of the ground, another barrel magically appears to replace it.
Dennis, I have been following this OPEC reserves story for years. I have read dozens of analyses that also tell the obvious fact that OPEC Middle East reserves are overestimated by about three to one. I have read two, that I can remember, who think they might be legitimate. You and Robert Rapier.
I find that rather strange.
Ron,
I agree, Saudi Arabia overstates their proved reserves, my point is simply this, the reserves were accurate in 1987 at about 170 Gb, if Saudi Reserves grew by 63% over the next 25 years as US reserves did from 1980 to 2005, then current reserves would be about 177 Gb. The 3 to one claim is nonsense, basically the reserves reported are likely 2P reserves (proved plus probable), this is about 1.7 times too high not 3 times too high.
Thanks for including me with Robert Rapier who know far more about the petroluem industry (particularly refining) than me.
The 3 to one claim is nonsense,
No, you are dead wrong there Dennis. In fact, their reserves are likely overstated by more than 3 to 1. And I can logically prove it. Well, that is if you believe in logic.
OPEC states their reserves at 1,241.82 billion barrels or 80.4% of the world total. They give non-OPEC reserves at 303.25 billion barrels or 19.6% of the world total. Over the past decade, OPEC has produced just under 40% of the world’s C+C production.
Now does it make logical sense that those possessing 80% of the world’s underground oil produces, over the last several decades, only 40% of the world’s oil while those possessing only 20% of the world’s underground reserves, produce 60% of world C+C production?
They say they have over four times the reserves of all non-OPEC nations combined yet produce only two-fifths of the world’s oil production. Dennis, if you know anything, then you know that is bullshit!
OPEC Share of World Crude Reserves, 2021
To be fair about this, I’m not sure that the Saudis overestimate their reserves any more than we do here in the United States.
If you asked just about any spokesperson for the Permian, Niobrara, Bakken, or the Alaskan North Slope, I imagine their estimate would need to be divided by three.
And just as the Permian could increase their production for awhile, I would imagine that the Saudis could do the same if they really put their mind to it.
The ineluctable truth is that all of the major oil fields in the world are getting long in the tooth and are in decline–as we speak. The only exception is the Guyana field that Exxon is developing with Hess. And best guess by a realist (me) is that they’re all going to suffer a precipitous decline just about in lockstep.
But by then it’s going to be a bit late to do anything about it.
A new June Non-OPEC oil production thread has been posted.
https://peakoilbarrel.com/june-non-opec-oil-production-rises-from-u-s-and-russia-boost/
A new open thread Non-Petroleum has been posted.
https://peakoilbarrel.com/open-thread-non-petroleum-october-12-2022/