A guest post by Ovi
Below are a number of Crude oil plus Condensate (C + C ) production charts for Non-OPEC countries created from data provided by the EIA’s International Energy Statistics and updated to June 2022. This is the latest and most detailed world oil production information available. Information from other sources such as OPEC, the STEO and country specific sites such as Russia, Brazil, Norway and China is used to provide a short term outlook for future output and direction for a few countries and the world. The US report has an expanded view beyond production by adding rig and frac charts.
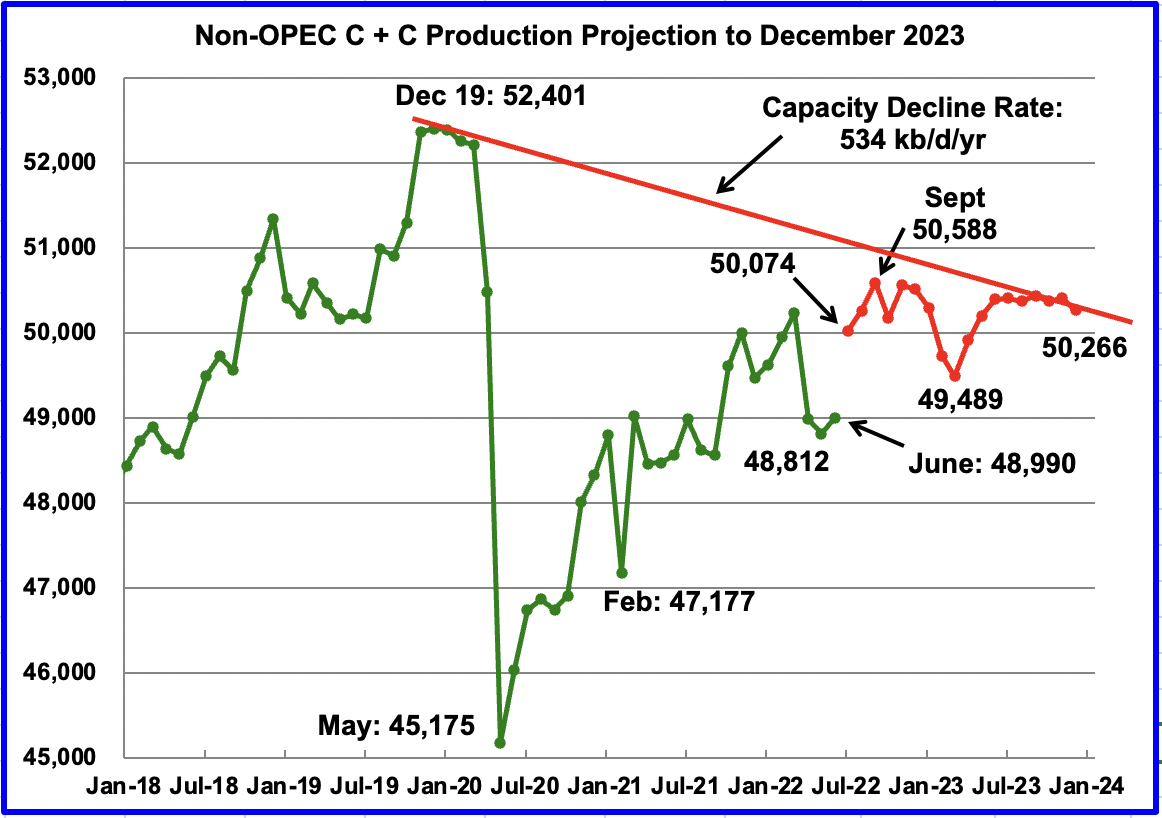
June Non-OPEC production increased by 178 kb/d to 48,990 kb/d. The largest increases came from Russia, 510 kb/d and the U.S., 201 kb/d. The largest offsetting decreases came from Kazakhstan, 381 kb/d and Norway, 285 kb/d.
Using data from the October 2022 STEO, a projection for Non-OPEC oil output was made for the time period July 2022 to December 2023. (Red graph). Output is expected to be 50,266 kb/d in December 2023. This forecast is 608 kb/d lower than predicted in the September report due to significant downward changes in the October STEO.
The large increase in July is due to a 1,600 kb/d increase in all liquids over June forecast in the October STEO. The C + C projection reduces the 1,600 kb/d increase to 1,084 kb/d.
Note that the September 2022 high of 50,588 kb/d is the high for all of 2022 and 2023.
The red capacity decline line represents an average decline rate for Non-OPEC countries over the four years since December 2019 and is combination of the natural decline rate plus possible reduction in exploration and production capacity/investment.
Non-OPEC Oil Production Ranked by Country
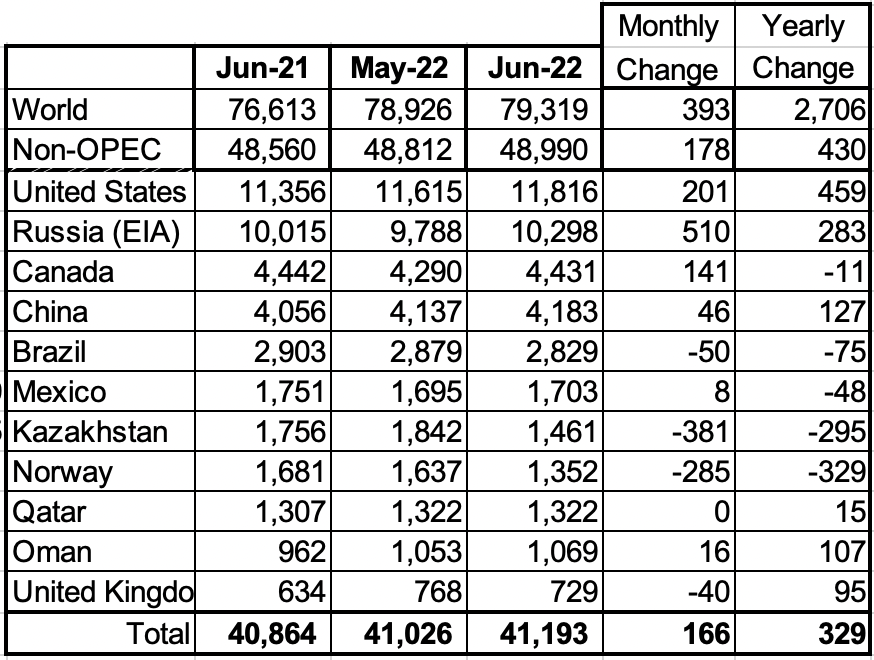
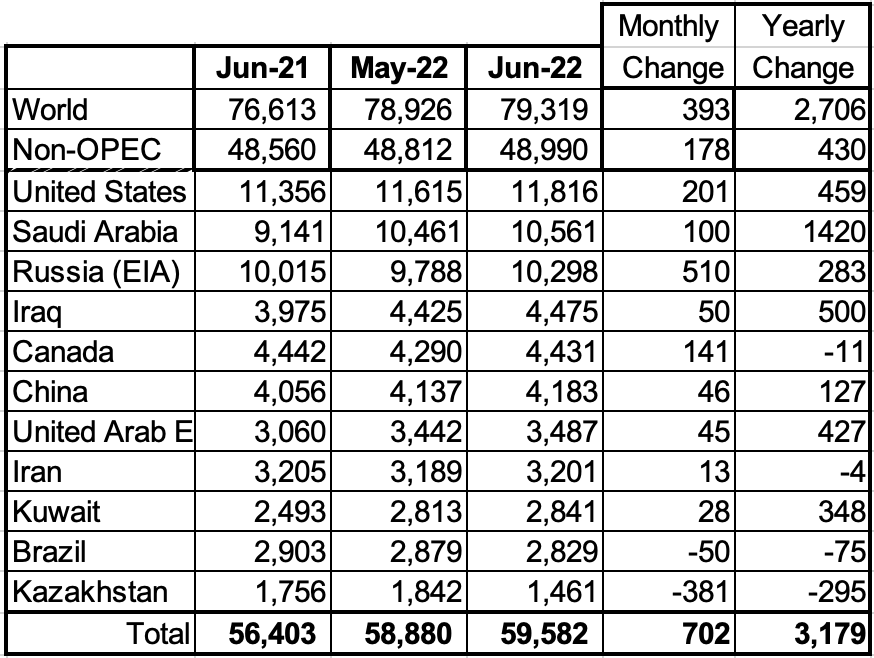
Listed above are the world’s 11th largest Non-OPEC producers. The original criteria for inclusion in the table was that all of the countries produced more than 1,000 kb/d. The UK has been below 1,000 kb/d since January 2021. As can be seen the U.S. and Russian increases were offset by the Kazakhstan and Norway decreases.
In June 2022, these 11 countries produced 84.1% of the Non-OPEC oil. On a YoY basis, Non-OPEC production increased by 430 kb/d. World YoY June output increased by 2,706 kb/d.
Non-OPEC Production Charts
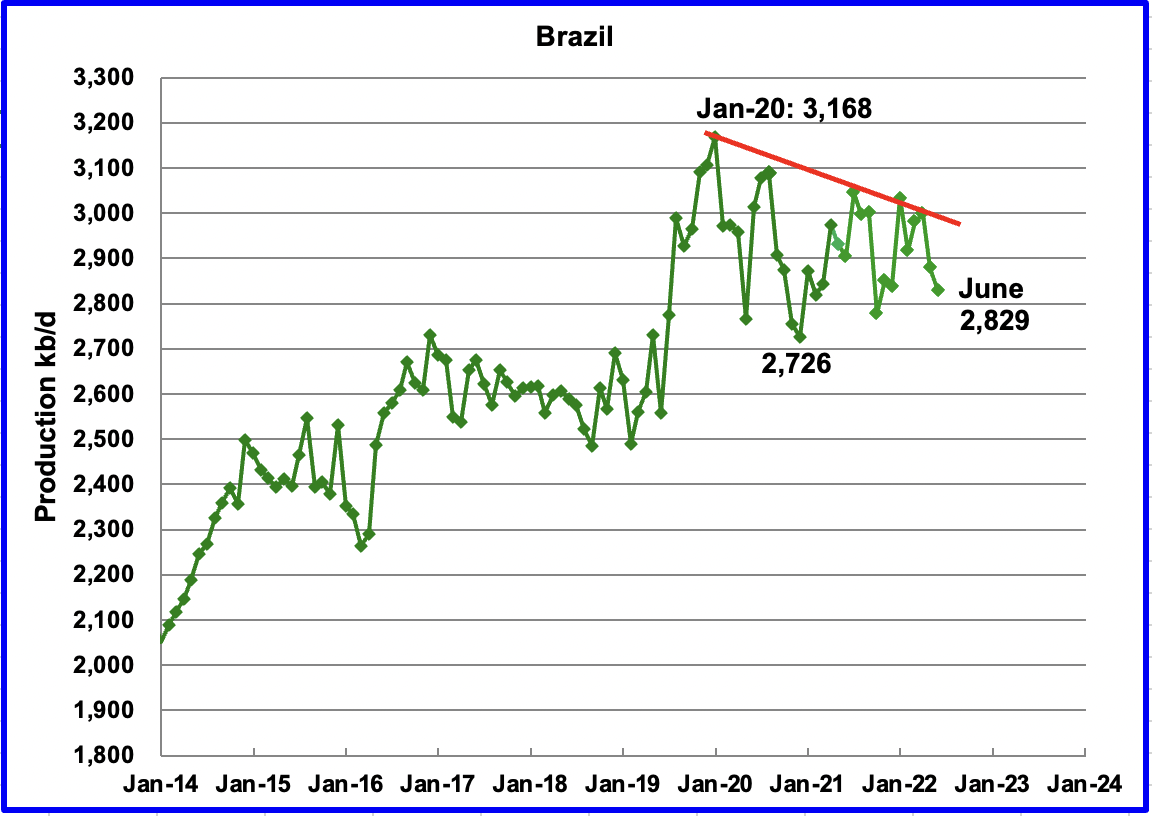
The EIA reported Brazil’s June production decreased by 50 kb/d to 2,829 kb/d.
Unfortunately, Brazil’s National Petroleum Association (BNPA) has stopped reporting Brazil’s production so that no future months are currently available.
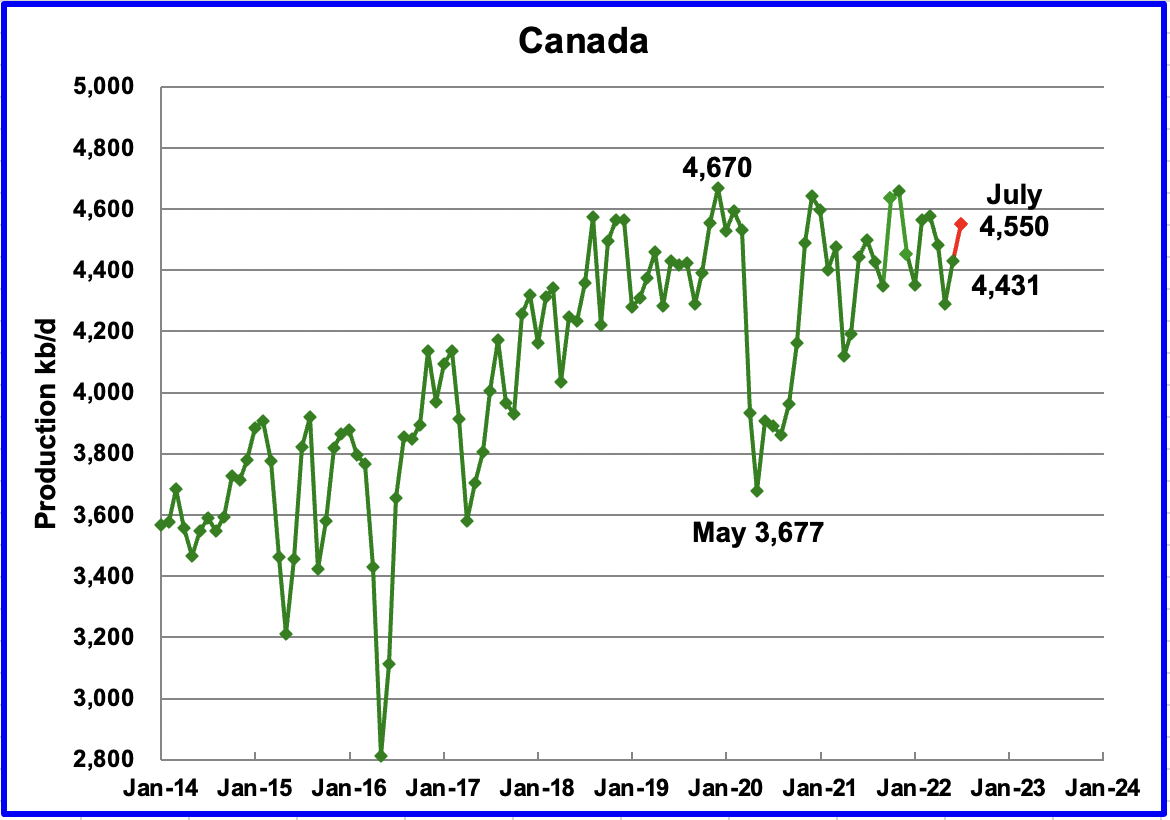
According to the EIA, Canada’s June output increased by 141 kb/d to 4,431 kb/d. Preliminary data from the Canadian Energy Regulator (CER) indicates that July production was 4,802 kb/d. However the EIA subtracts approximately 250 kb/d from the CER report. Accounting for the EIA’s reduction, Canada’s projected July output is then estimated to be close to 4,550 kb/d, an increase of 119 kb/d over June, red marker.
Rail shipments to the US in July dropped by 18 kb/d to 152 kb/d.
The current spread between Western Canada Select (WCS) and WTI has increased to $25/b from a more typical $12/b to $17/b. There is speculation the increase is related to the reduced demand from U.S. refiners due to the release of medium crudes from the SPR.
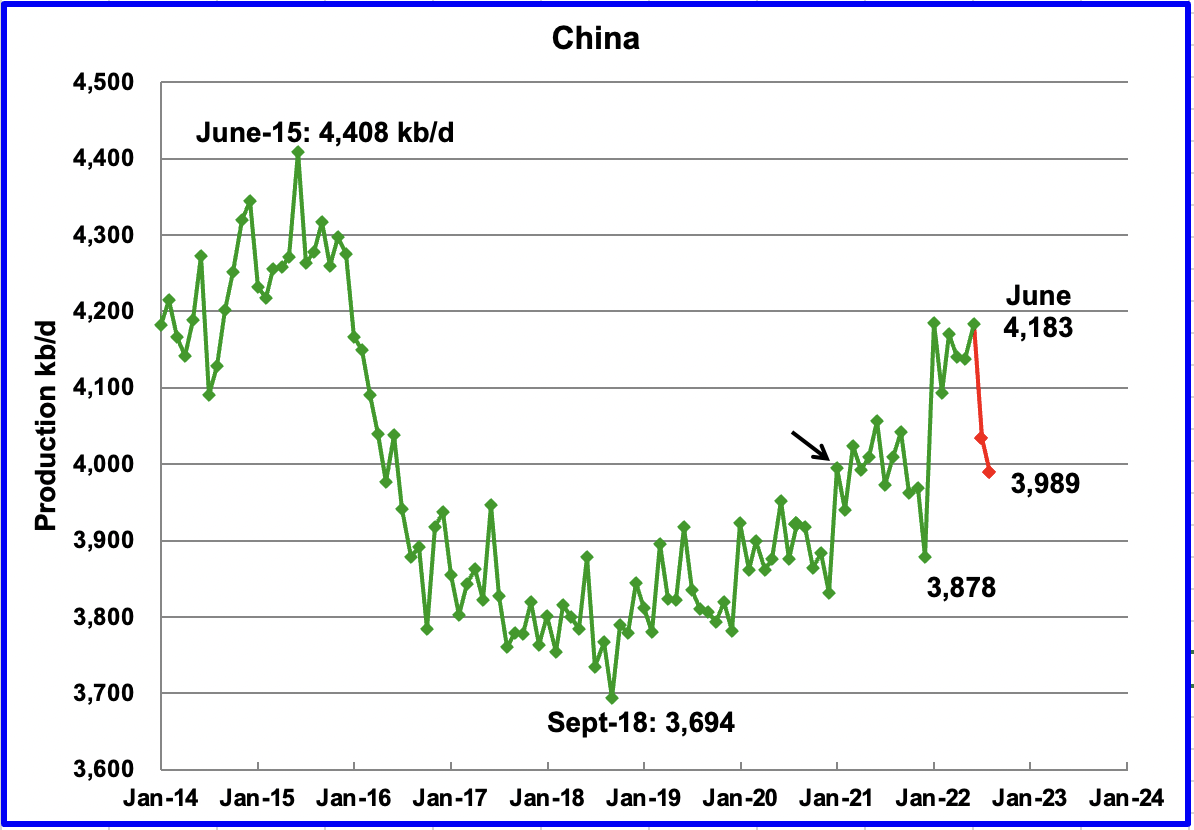
The EIA reported China’s output increased by 45 kb/d to 4,183 kb/d in June.
China reported that its output decreased in July to 4,034 kb/d and again in August to 3,989 kb/d, a drop of close to 200 kb/d from June. (Red markers)
China may be close to its current maximum production level of approximately 4,000 kb/d. To offset declines, the national oil company is investing in conventional wells and is also drilling for shale oil.
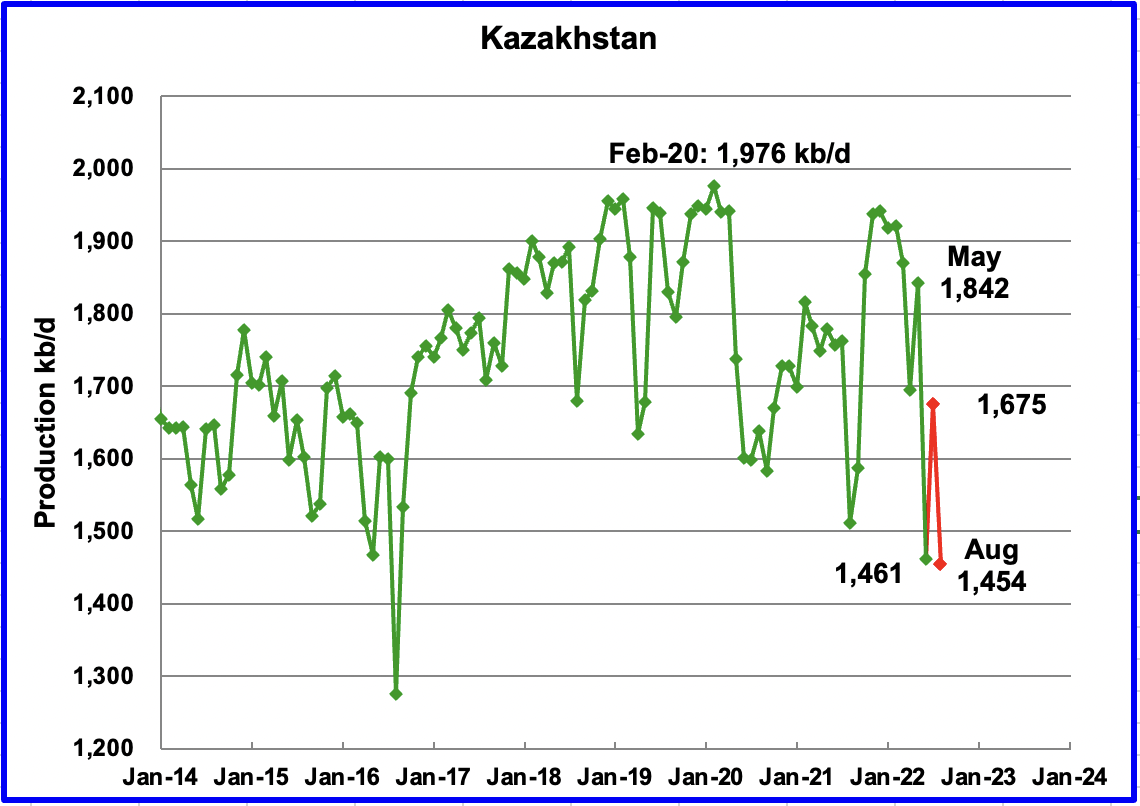
Kazakhstan’s output dropped by 381 kb/d in June to 1,461 kb/d.
According to this source, August production fell after rebounding in July to 1,675 kb/d. The article just reports crude oil production. Consequently the July and August production numbers shown in the chart are an estimate based on the percentage drop and a typical C + C to C ratio using earlier EIA data.
“The fall in output was due to a sharp decline in production in the giant Kashagan oil field after a gas leak early in August, as well as planned output curbs in the Tengiz field due to regular maintenance.”
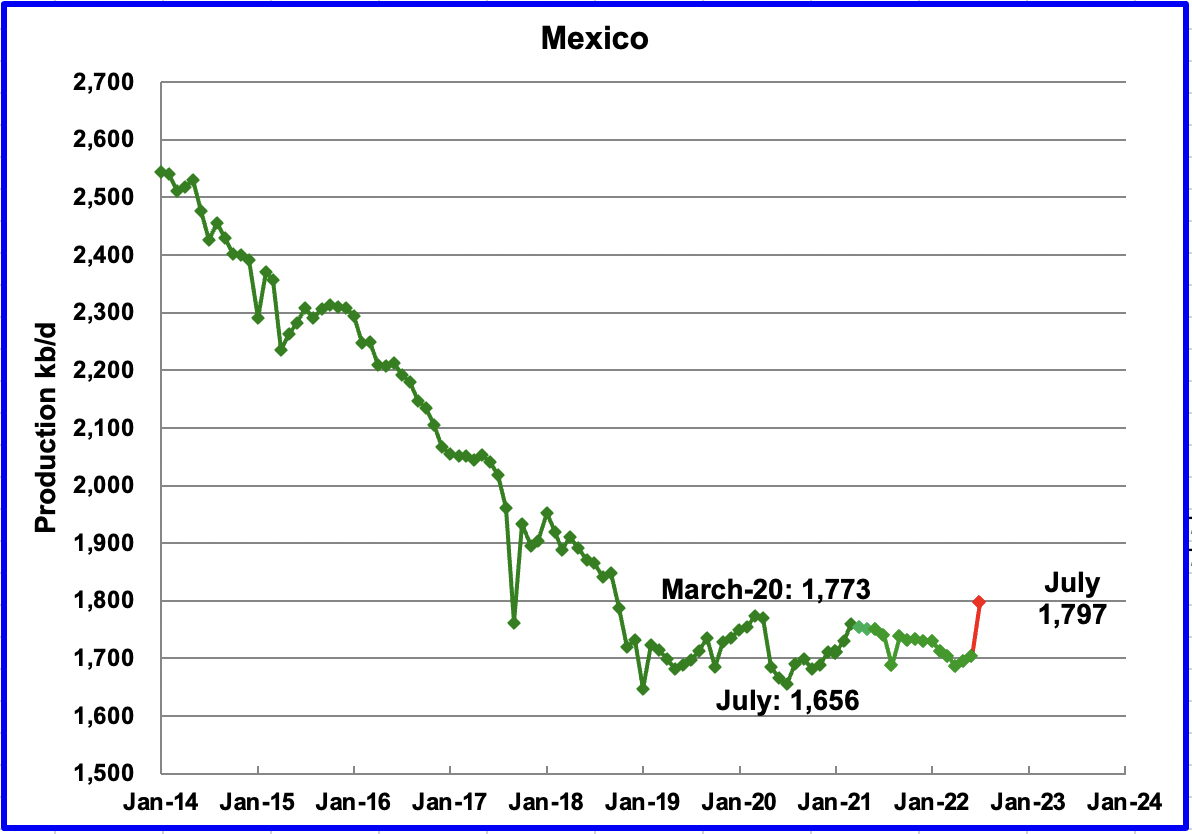
Mexico’s production as reported by the EIA for June increased by 8 kb/d to 1,703 kb/d.
Data from Pemex showed that July’s output was 1,797 kb/d. However, the EIA is expected to reduce Pemex’s July oil production by close to 85 kb/d, to 1,713 kb/d, an increase of 10 kb/d over June, due to a different definition for crude plus condensate.
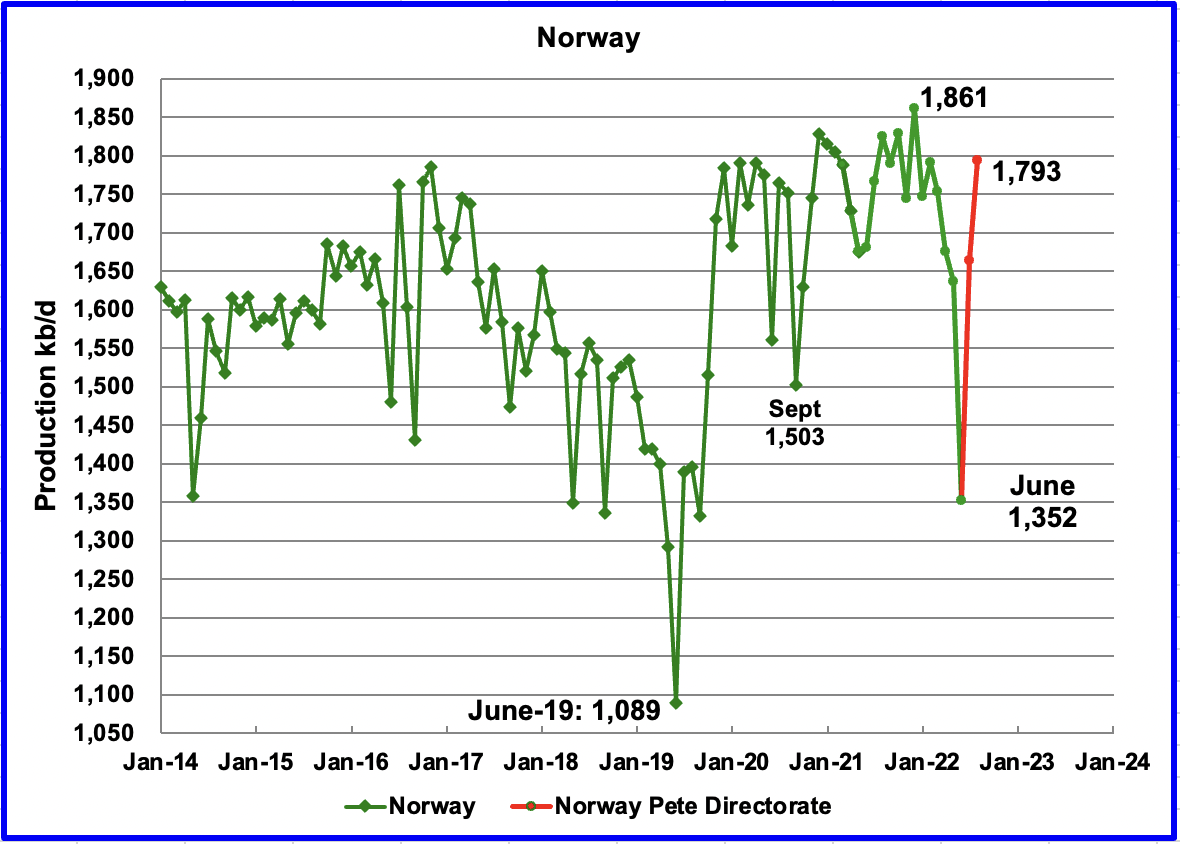
The EIA reported that Norway’s June production decreased by 285 kb/d to 1,352 kb/d.
The Norway Petroleum Directorate (NPD) reported that production increased from June to August to 1,793 kb/d (Red markers). According to the NPD: “Oil production in August was 3.1 percent lower than the NPD’s forecast and 4.7 percent lower than the forecast so far this year.”
Growth is expected in late 2022 and into 2023 when the second phase of the Johan Sverdrup field development starts production and other small fields come on line. According to OPEC “The Johan Sverdrup is projected to be the main source of increased output for the year. Neptune has also completed drilling at Fenja with the first oil on track for 1Q23. Fenja is expected to produce about 24 tb/d at peak production.”
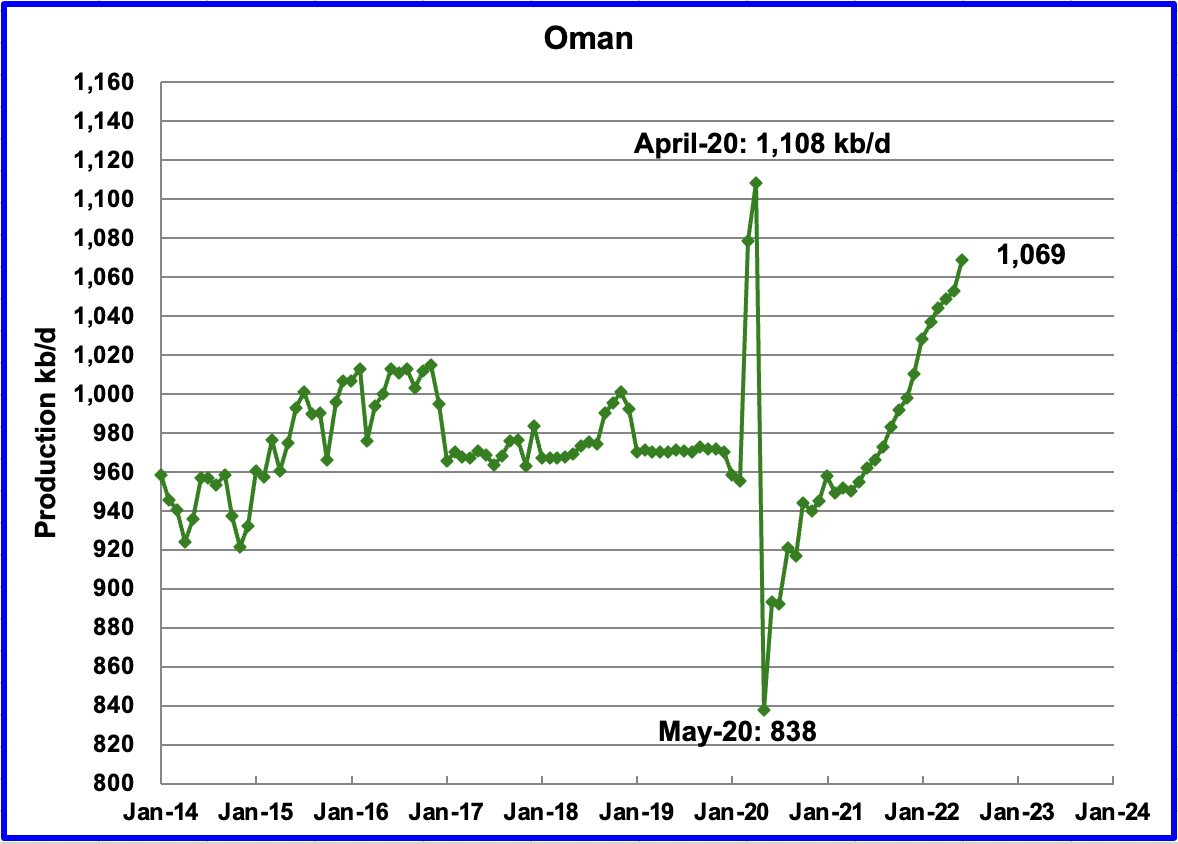
Oman’s production has risen very consistently since the low of May 2020. Oman’s June production increased by 16 kb/d to 1,069 kb/d. It is 39 kb/d short of its pre-pandemic high.
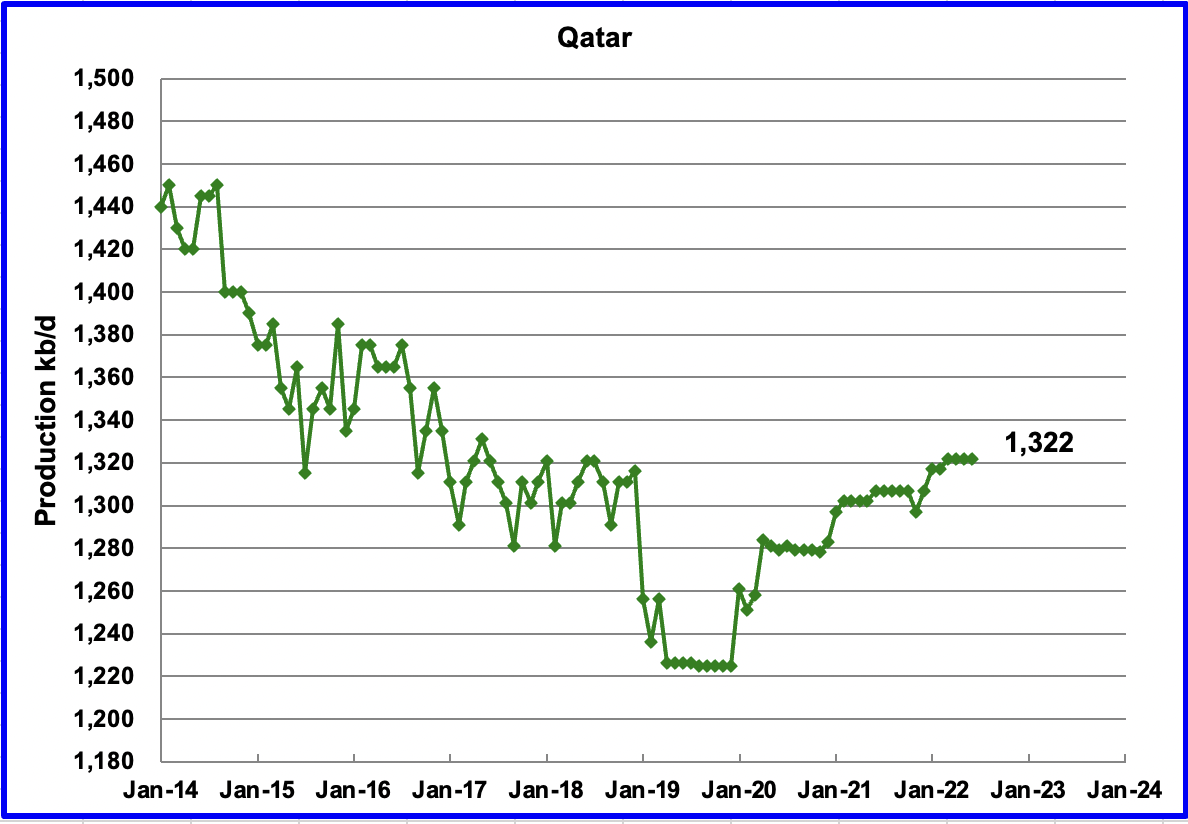
June’s output was unchanged at 1,322 kb/d.
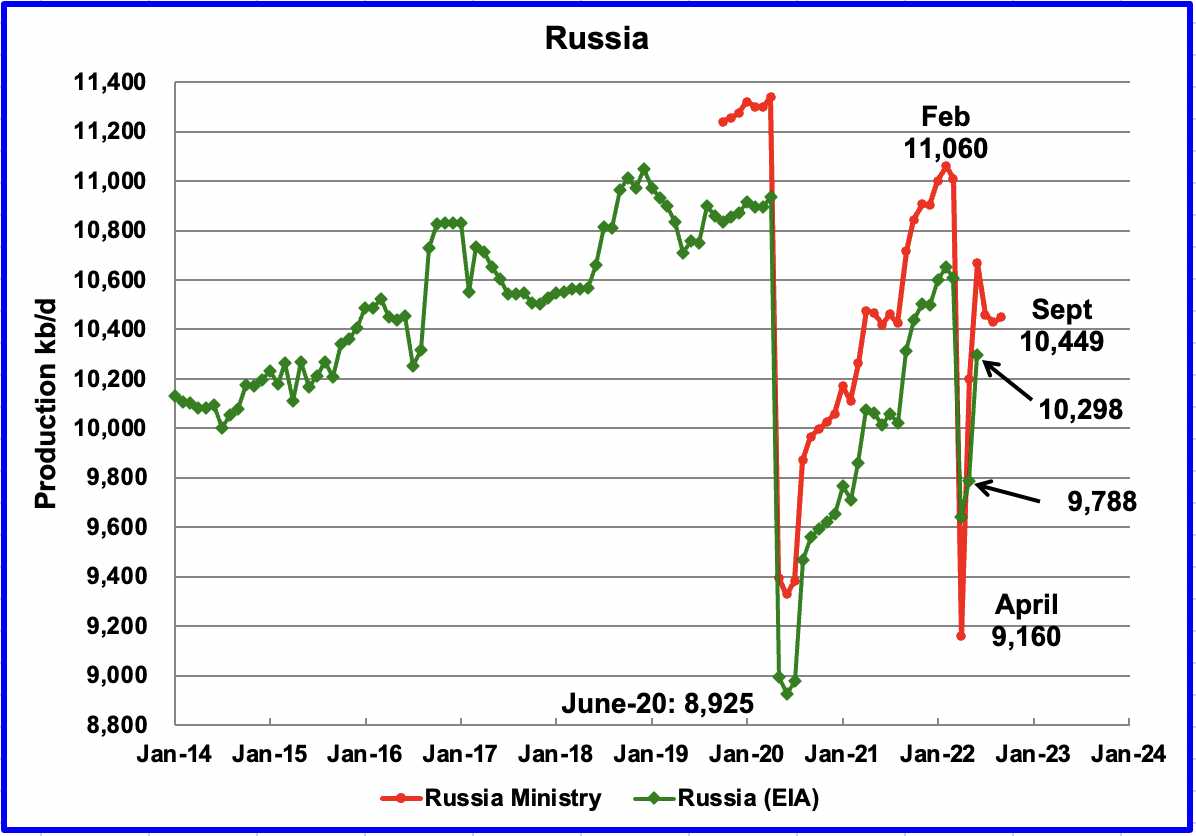
The EIA reported that Russian output increased by 510 kb/d in June to 10,298 kb/d.
According to this source, September production increased by 345 kb/d to 10,775 kb/d. While the source states the production level quoted is C + C, it appears to be all liquids since the October STEO is reporting 10,885 kb/d for all liquids. Assuming the 10,775 is all liquids, and using 0.96 for the C + C to all liquids ratio, September’s output would be closer to 10,344 kb/d, an increase of 19 kb/d over August.
However the October OPEC report states: “A preliminary estimate for Russia’s crude and condensate production in September 2022 shows a further decrease of 0.1 mb/d m-o-m to average 9.7 mb/d, while around a 10 tb/d decline is expected for NGLs.
There is a gap of 600 kb/d between OPEC’s preliminary estimate and the production shown in the chart.
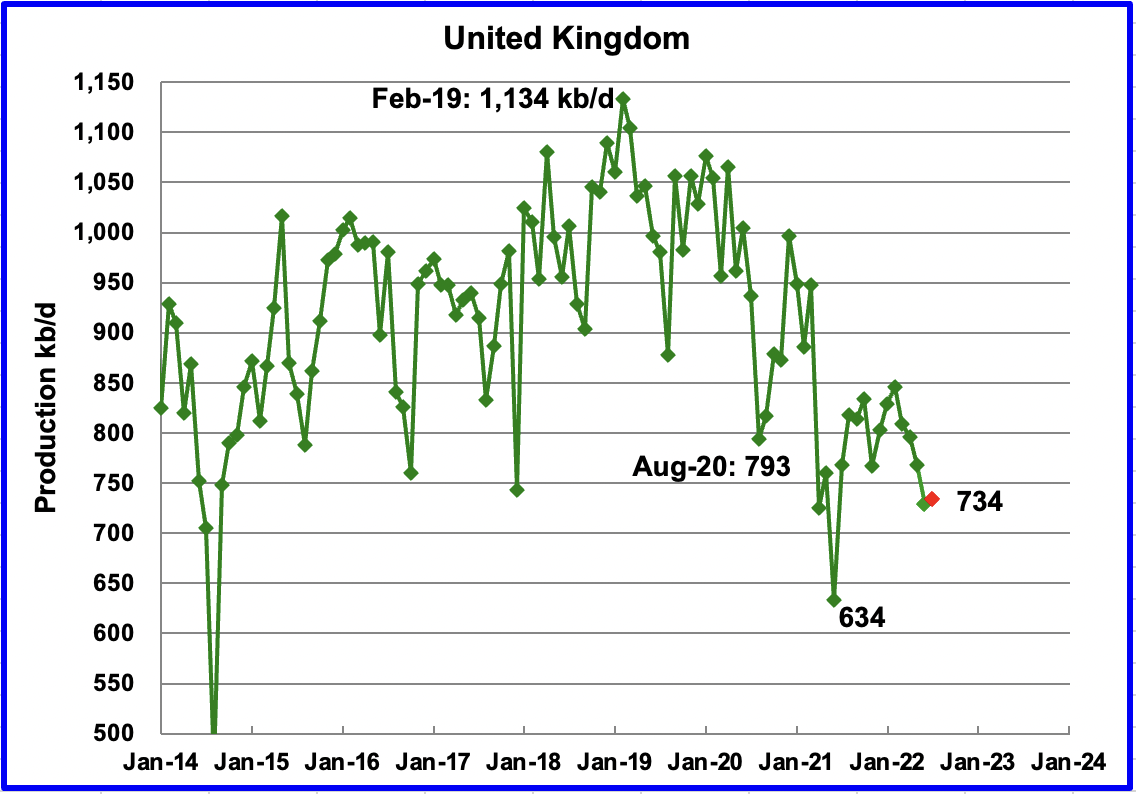
The EIA reported UK’s production decreased by 40 kb/d in June to 729 kb/d. According to this source, July’s production increased by 5 kb/d to 734 kb/d (Red Marker). The chart indicates UK oil production entered a steep decline phase starting in February 2019. On a YoY basis, July production is down by 34 kb/d.
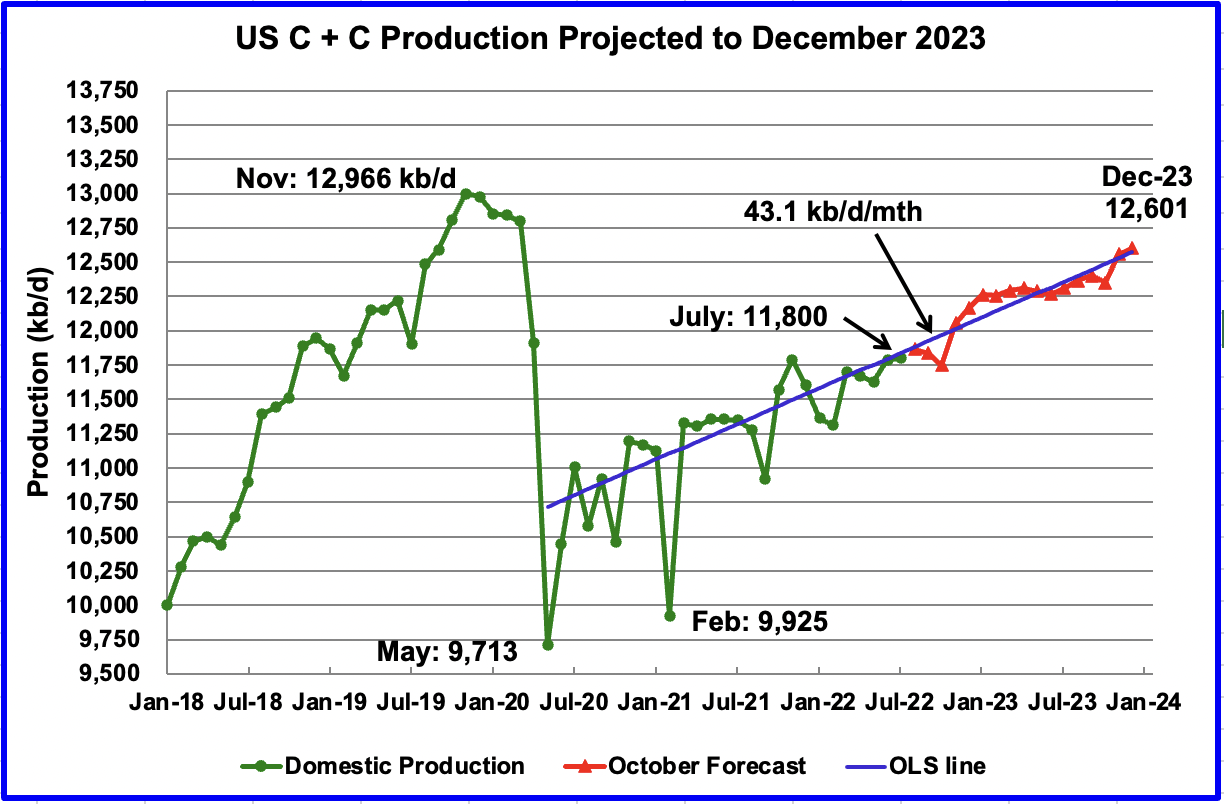
US July production increased by 12 kb/d to 11,800 kb/d from 11,788 in June. Note that the current EIA World report did not update June production to the most recently released rate of 11,788 kb/d from the original estimate of 11,816 kb/d.
The US chart also contains the October STEO projection for US output out to December 2023. In December 2023, production is expected to be 12,601 kb/d. This is a reduction of 385 kb/d from the September projection of 12,986 kb/d. Note how production from December 2022 to June 2023 is essentially flat at 12,250 kb/d.
The blue OLS line from June 2020 to December 2023 indicates a monthly production increase of close to 43.1 kb/d.
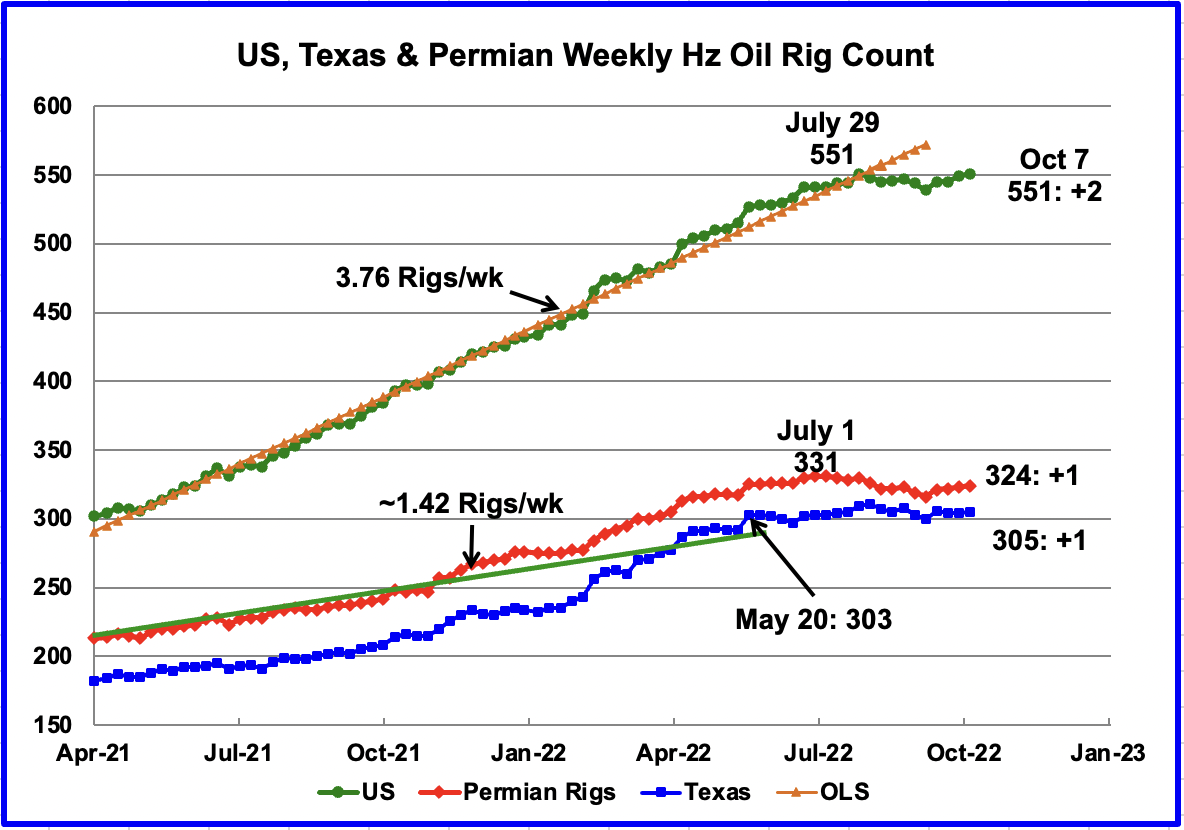
After the week ending July 29, the rate of rig additions slowed and has essentially stopped. Since then the number of operational rigs has been more or less steady at the 550 level. In the week ending October 7, the number of rigs increased by 2 to 551, the same numbers as in the week of July 29.
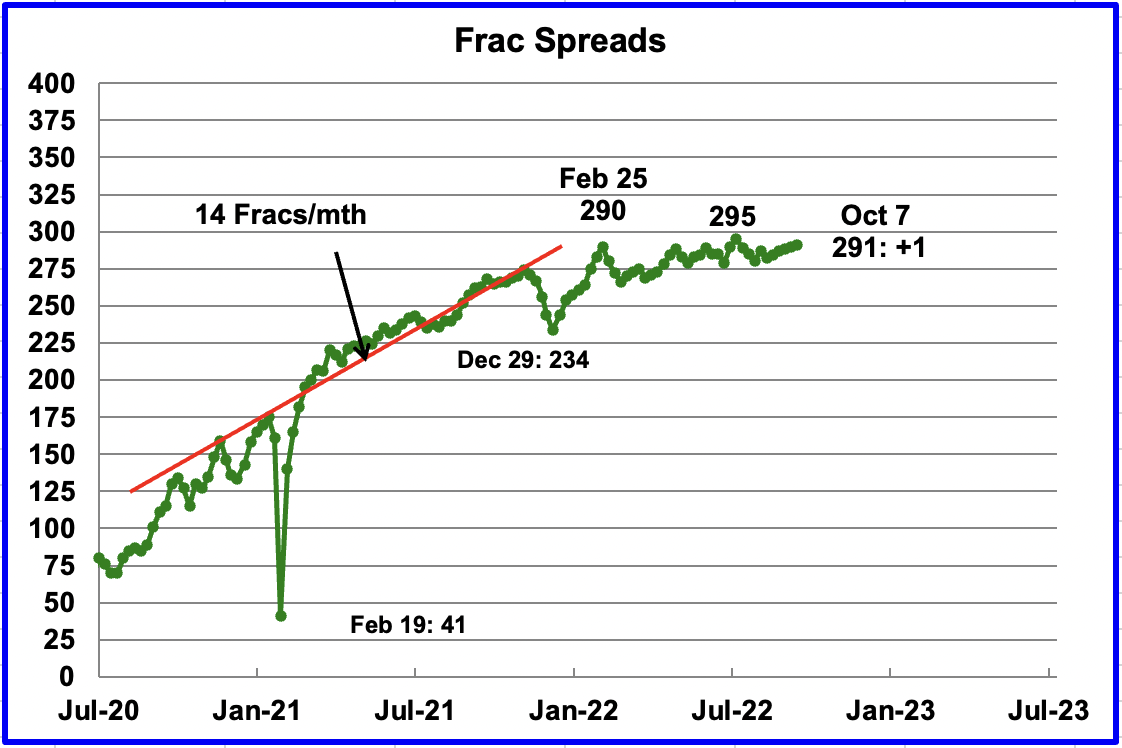
For frac spreads, the general trend since late February, when the count was 290, can best be described as essentially flat at around the 290 level. For the week ending October 7, the frac spread count increased by 1 to 291.
Note that these 291 frac spreads include both gas and oil spreads.
According to this source:
“The U.S. hydraulic fracturing market is “literally sold out,” Andy Hendricks, chief executive officer of oilfield firm Patterson-UTI said on Wednesday, as demand for equipment and services has outpaced available capacity.
Some fracking firms, including Liberty Energy, are reactivating pressure pumping equipment and deploying new fleets as prices have improved and demand has spiked. Patterson is running 12 frac spreads and on Wednesday said adding an additional fleet would be a challenge.”
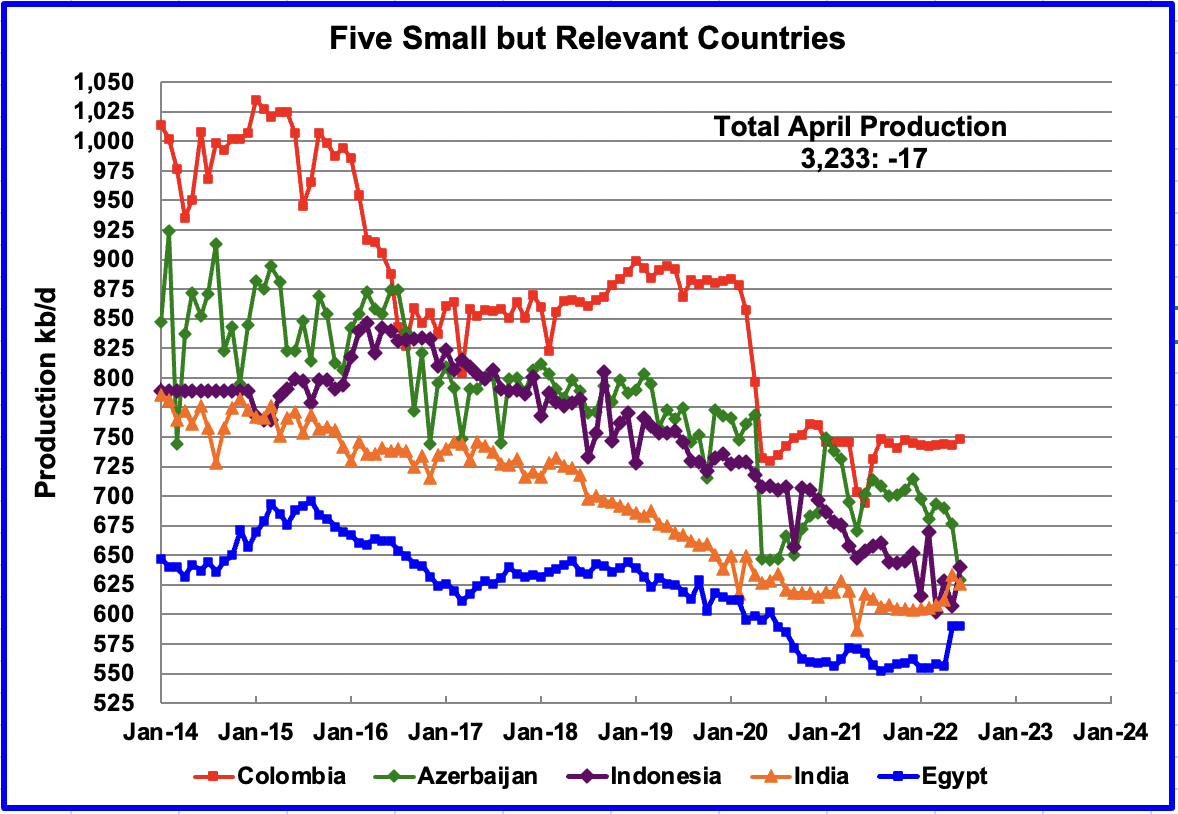
These five countries complete the list of Non-OPEC countries with annual production between 500 kb/d and 1,000 kb/d. Their combined June production was 3,233 kb/d, down 17 kb/d from May’s 3,250 kb/d.
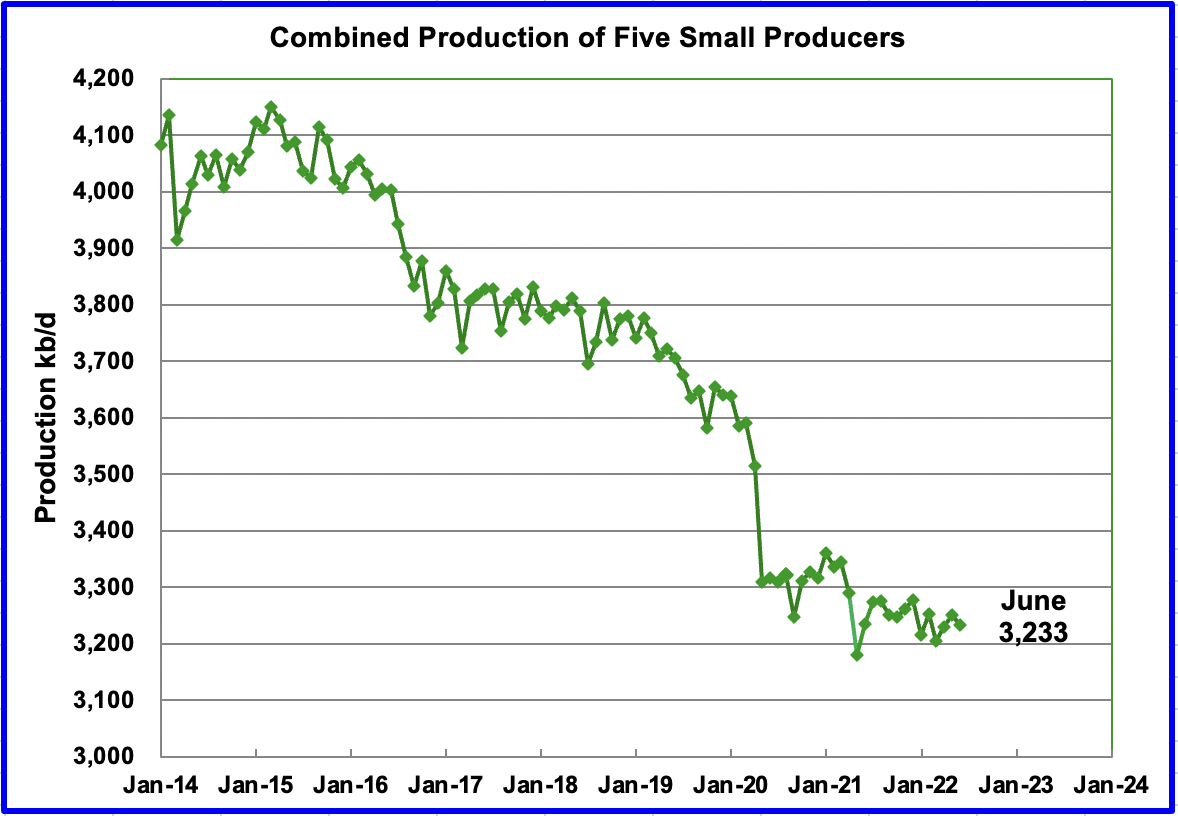
The overall output from the above five countries has been in a slow steady decline since 2015 and the decline continues.
World Oil Production Ranked by Country
Above are listed the World’s 11th largest oil producers.
In June 2022, these 11 countries produced 75.1% of the world’s oil. On a YoY basis, production from these 11 countries increased by 2,706 kb/d.
The largest increases came from Russia, 510 kb/d and the U.S., 201 kb/d. The biggest offsetting decreases came from from Kazakhstan, 381 kb/d and Norway, 285 kb/d. Note that Norway fell out of the Top 11 table due to its big production decline in June.
World Oil Production Projection
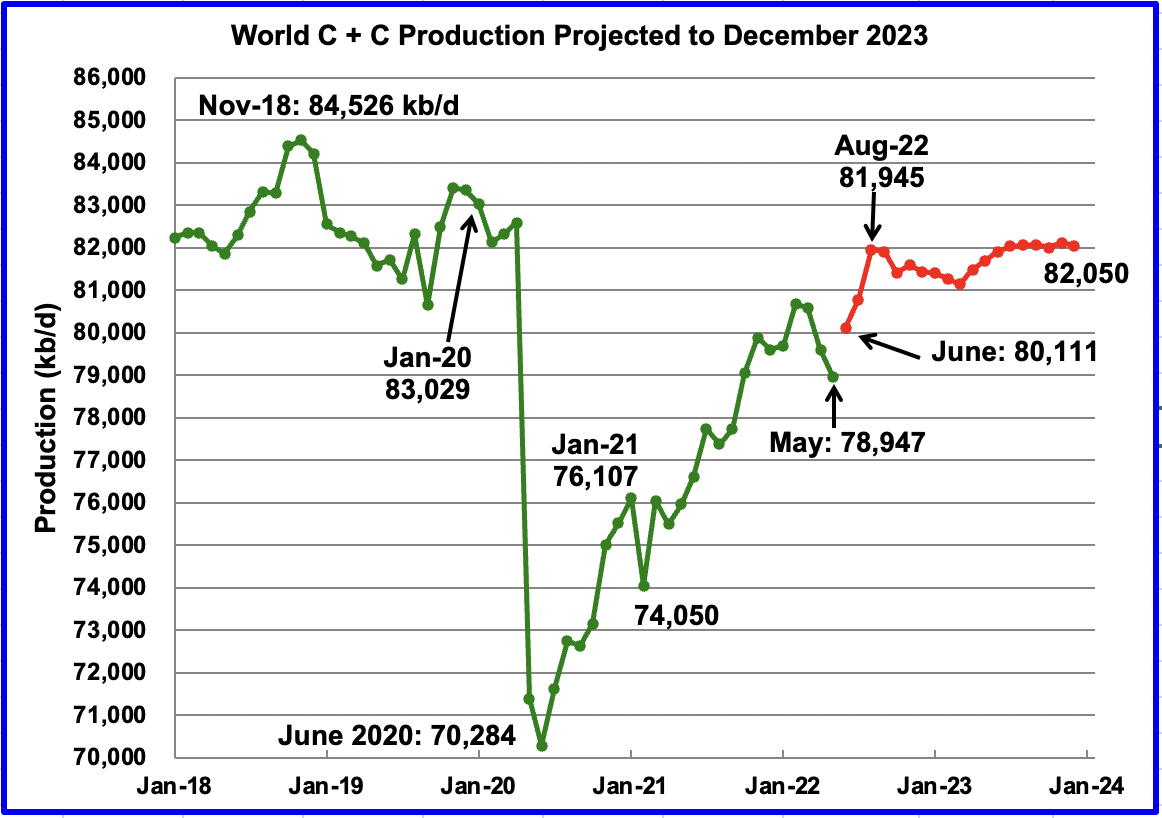
September Chart
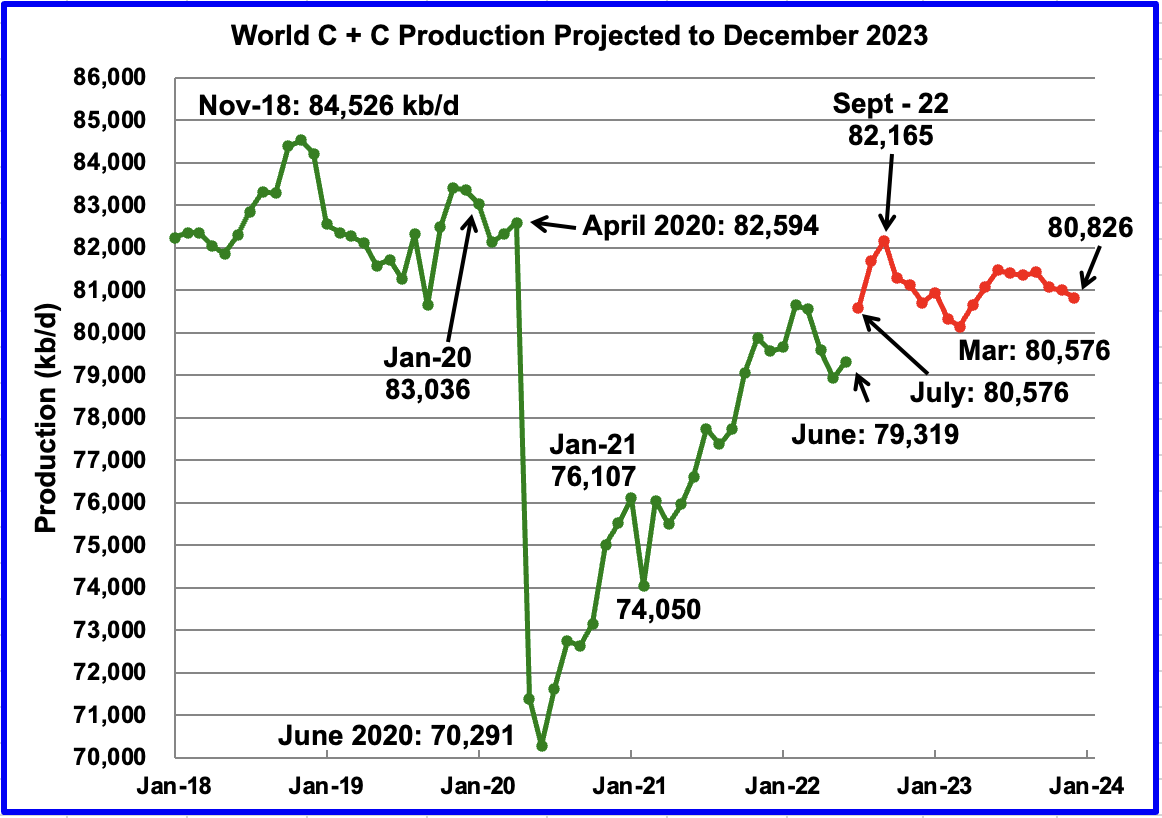
October chart
World oil production in June increased by 393 kb/d to 79,319 kb/d according to the EIA (Green graph).
This chart also projects World C + C production out to December 2023. It uses the October 2022 STEO report along with the International Energy Statistics to make the projection. (Red markers).
It projects that World crude production in December 2023 will be 80,826 kb/d, a decrease of 1,224 kb/d from the projection in the September report. For a comparison of the post August projection with the previous September projection, the September chart has been added before the October chart.
The large July increase of 1,257 kb/d is due to a 1,600 kb/d increase in all liquids over June. The December 2023 output is 3,700 kb/d lower than the November 2018 peak.
The rise of close to 2,846 kb/d from June to September seems aggressive. However, it is associated with projected US and OPEC + production increases. After September 2022, World production decreases and September 2022 could be the new post-pandemic high.
STEO OPEC Production Projection
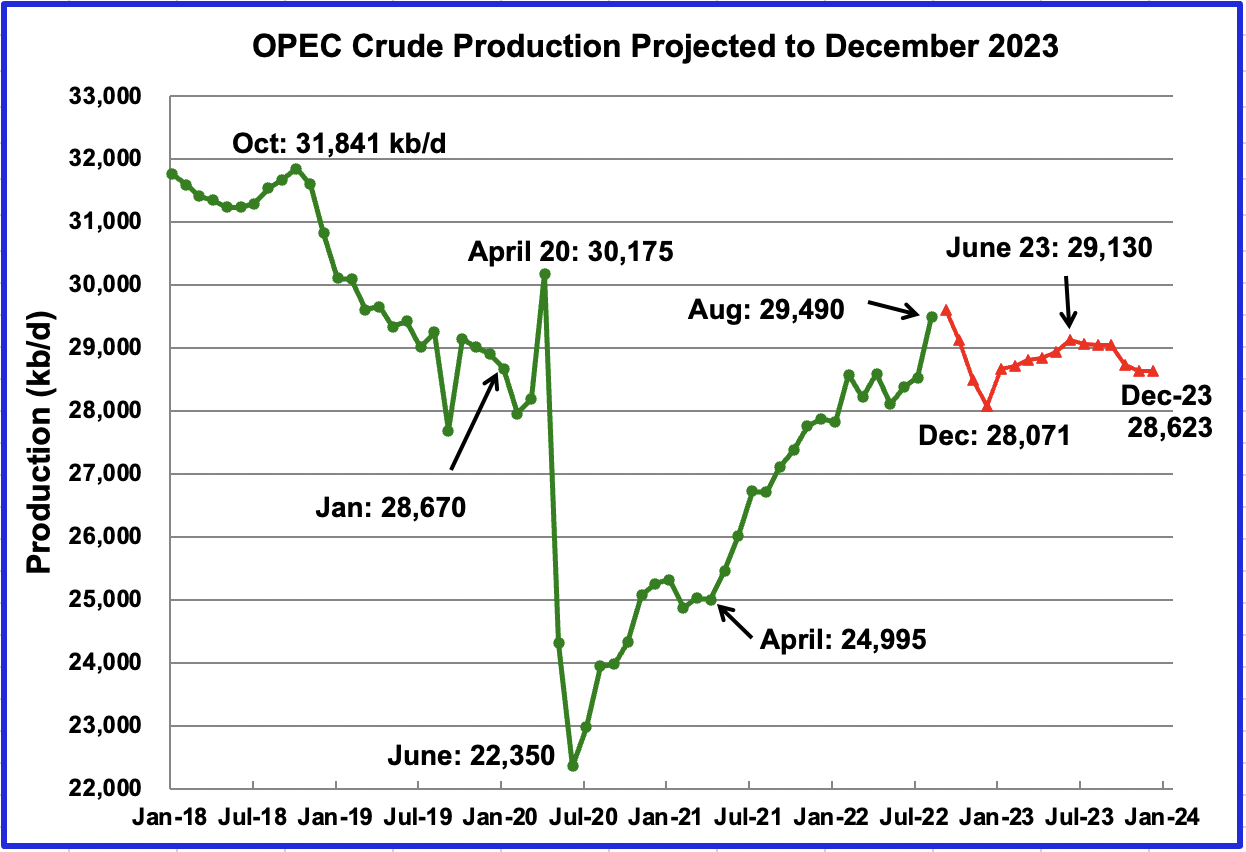
As noted above, part of the decrease in World oil production after September 2022 is due to the projected drop in OPEC production by the STEO, along with known cutbacks and sanctions. The August and September production levels are close to the current OPEC published figures.
293 responses to “June Non-OPEC Oil Production Rises from U.S. and Russia Boost”
Thanks Ovi. Once again POB is top of the favs.
Thought I’d post this here on the politics of peak oil
Failure to respond to the SaudiArabia’s slights would reinforce the perception that Washington is a mere oil dependent, susceptible to demands.
https://responsiblestatecraft.org/2022/10/11/five-ways-biden-can-re-evaluate-the-saudi-relationship-now/
It will be interesting to see international relationships change as peak oil develops.
Survivalist
All of those ideas are bad. It would just open a venue for the Russians and Chinese to move in.
Biden should have put forth a two prong approach as part of the transition to a greener world. Green initiatives and more US production.
– Promote green initiatives and increase U.S. production to maintain independence.
– Covid killed U.S. and World oil production. The government will help and encourage U.S. producers to increase output.
– The government will strive to get an oil price that is fair for U.S. producers and consumers by releasing some oil from the SPR.
The EIA has an administrator that doesn’t even know how much oil the US produces and uses. They only see green there and have not thought about an orderly transition.
She should have been out front with presentations showing how the price of oil crashed during the pandemic and why gasoline was so cheap and what the US was going to do about it. Being out there showing you are doing something is essential in politics.
Not a peep and I am afraid it is going to hurt them in November. It is unfortunate that some of those top people did not see the great charts we put up here at POB.
Ovi.
It seems we never hear government officials in the United States discuss achieving a stable oil price. Apparently they see no issue with the roller coaster.
I will note also I don’t think they have any idea what the goal should be for oil prices. I think Obama was happy in early 2016 when they were $25-30 and I recall Trump indicating he thought US producers could make strong returns at $40.
I have always thought a US policy on oil should recognize just how much oil is needed to transition away from it. Think of all the mining, manufacturing and transportation demand there will be to convert the fleet and to build out wind and solar.
For as much oil as the US produces, the government leaders are totally clueless about it.
Not sure who is worse, government officials or the majority of the US media, when it comes to oil.
Shallow sand,
There are some in the industry and some oil analysts that have claimed nonsense such as tight oil is profitable at $40/bo, people hear what they want to hear and pick those analyses that they agree with or hope to be true.
As to oil price stability, it is wishful thinking to believe that can be achieved. Price controls simply lead to shortages and the government would likely do a far worse job than the market at achieving efficient allocation of resources in my opinion.
Not that this does not suggest that markets are perfect, far from it, government intervention is needed to reduce monopolistic and oligarchistic power as well as to address both positive (infrastructure) and negative (pollution) externalities, and also to address wealth disparities through appropriate tax policies.
Nonsense of tight oil at $40/bbl? You are talking of current expensive horizontals? Not those of us doing this work in vertical shale wells with hydraulic fracturing during the last century? Never produced a single one of them with oil prices greater than $20/bbl or $2/mcf.
What were prices in 2022$?
That is the number that matters. Back in 96 when oil price was around 20 real price was around 40. This price was being claimed as breakeven back in 2018, but it never was credible.
What years were you drilling wells?
“Not sure who is worse, government officials or the majority of the US media, when it comes to oil [policy?]
To be complete lets add the ‘oil industry’ to the list. The big decision makers in the industry have been basically in a ‘free for all’ mode for the past 100 years.
Those few calling for some form of self control or regulation in order to smooth out production, prices, and longevity of national production have completely swamped by the majority of the players in the industry. Its certainly not the only industry to behave in a often counterproductive manner enabling a boom and bust undercurrent, but it is perhaps the greatest example.
SS
I did not intent to convey the idea that the government should be trying to control the price of oil in general. I was just thinking in response to how the war just added more pressure on oil prices.
A huge difference between the decision making in – for example SA and the US is that in the US there are many individual producers, all with different expertise and capital structures but all with the goal to optimize individual profits. In a way decisions are tactical, specific to individual companies. In countries like SA decisions are made on a national level, and the individual projects are all funded with the same capital stack. Profit is one of the motives but not the only one. Longer term political and strategic goals enter the picture, leading to a decision-making process which at times may lead to outcomes which are quite different from the straight profit maximization goal in places where resource extraction is not nationalized.
Rgds
WP
Cheers Ovi,
“It is unfortunate that some of those top people did not see the great charts we put up here at POB.” ~ Ovi
This website needs a Twitter feed 😉 I nominate OFM as its custodian; who’s usually good for a few yards of interesting text.
I found this recent podcast that you might find interesting. It seems to be more of an economic analysis and dismisses allegations of KSA politicizing oil prices.
The most recent episode is called “why is OPEC cutting oil production?”
https://www.aljazeera.com/podcasts/essential-middle-east/
It’s perhaps worth noting that KSA took the side of USA/Ukraine et al during the recent UN General Assembly vote. Allegations that KSA is taking the Russian side seem thin on the ground.
Survivalist
Also these politicians have short memories. They seem to forget that OPEC increased their 400 kb/d monthly increases to 650 kb/d for July and August.
My guess is the OPEC cut was supposed to occur AFTER the mid terms, not before it.
While KSA is the one being accused of playing politics with the price of oil, it would seem that perhaps it’s instead the Democrat leadership thats doing it.
OPEC couldn’t care less about the US mid-term elections. Everything they do is based on the interest of OPEC nations only.
While KSA is the one being accused of playing politics with the price of oil, it would seem that perhaps it’s instead the Democrat leadership thats doing it.
Instead? It’s not one or the other. It could be both or neither. However, it is only natural that Biden wants oil prices to fall. Why on earth would anyone see any kind of malicious intention in that?
A shift from the have not’s to the haves. Energy exporters know fiat currencies are walking dead, so what we see is a reversal of power from surplus energy, fiat currency based economies to the real world. There’s ‘some’ independency between those tectonic plates, as they both know. We’ll see how it turns out. Getting out of paper is one thing to consider….
Tectonic plates do what they do, crushing everything in its way.
In sure Ron is right, OPEC cares little about the mid terms, and it seems KSA may now suffer some consequences for having that kind of attitude.
The Democrats are not happy about higher gas prices, or something; not good for winning the mid terms. KSA has been accused, with little evidence, of being pro Russian. Pro Russian is an interesting pejorative these days. Very Steele Dossier.
It would appear that perhaps the only malicious intent is what certain Democrat politicians have hopes for in terms of consequences for KSA, secondary to OPEC perusing their own interests and cutting production.
Biden threatens ‘consequences’ for Saudi Arabia after OPEC cut, but his options are limited
https://www.cnbc.com/amp/2022/10/12/biden-threatens-consequences-for-saudi-arabia-after-opec-cut.html
The Democrats want to punish KSA for failing in what they perceive to be a key performance indicator; to wit, helping more Democrats get elected in the midterms. I know OPEC doesn’t care about the mid terms, Ron. If anyone ask
Biden he’ll tell you that’s the problem, hence the “consequences” for KSA. It’s interesting when US domestic politics influences foreign policy to such a degree; alienating KSA in order to win domestic power; compromising national power abroad in order to win political power at home. There seems an inherent tension in it.
Im not justifying it.
Im explaining it.
Let’s see what develops.
So true. All of the current administration’s moves are only due to their desire to impact the results of the mid term elections. Draining the SPR , bullying of KSA and on and on really show that the current administration is the one using oil as a political weapon desperately trying to win votes. Two more years of their anti business policies (ESG) and unbridled spending could surely bring us back to 1929. It’s really worse than the Jimmy Carter years. At least he tried to implement policies that promoted and encourage conservation which neither political party wants to embrace.
The thoughts in this sub-thread are similar to my own.
The Saudis, the Democrats, and the Republicans all see no political or economic advantage (at least in the short term) in a fact-based discussion of oil.
It’s all name-calling and posturing: by claiming politicization, all sides can avoid the question of depletion, and transfer the blame for high prices to someone else.
OVI, when will you put Great Britain in the Small but Important group? There getting there, rather quickly I might add. I don’t know when Norway, Kazakhistan and Mexico will drop out of the top 11, but I imagine it will be in the next five years.
Seattlepeak
I presume you have heard the phrase, “Great minds think alike, fools seldom differ”. I debated that question while reviewing the post and decided I was running out of time and do it the next post.
I actually generated the second graph to see the change. You can now see how the UK decline dominates.
Your awesome OVI. Thanks.
Thought I would post this concerning what OPEC says their oil reserves are and see if anyone agrees with them.
OPEC states their reserves at 1,241.82 billion barrels or 80.4% of the world total. They give non-OPEC reserves at 303.25 billion barrels or 19.6% of the world total. Over the past decade, OPEC has produced just under 40% of the world’s C+C production.
Now does it make logical sense that those possessing 80% of the world’s underground oil produces, over the last several decades, only 40% of the world’s oil while those possessing only 20% of the world’s underground reserves, produce 60% of world C+C production?
They say they have over four times the reserves of all non-OPEC nations combined yet produce only two-fifths of the world’s oil production. I say that is bullshit. What do you think?
OPEC Share of World Crude Reserves, 2021
Ron
They know they are lying and they know that we know they are lying and so they will keep on lying.
We will never find out until demand rebounds to a point that will stress OPEC’s capabilities.
Ovi,
It is possible that much of the OPEC oil reserves are not developed because they believe their capacity is adequate to supply the World oil market. There is not much point producing 100 Mb/d for World C plus C if demand is only 80 Mb/d.
But of course that has to be the case. And of course all non-OPEC nations would have the exact same motive. Why would they need all that money anyway. They all know the exact amount of oil the world needs and they all, that is every damn one of them, collude to not produce the oil and make all that money. Of course, the OPEC nations sometimes announce that they are deliberately cutting. But now we find out they are deliberately cutting when they say they are not. That is damn sneaky of them. 🤣
Dennis, you have come up with a lot of reasons to explain why the Middle East oil producers are such truth tellers, but this is by far the best one yet. 🤣🤣🤣🤣🤣
Ron,
Aside from a few nations that have joined with OPEC in the Declaration of Cooperation, I am not aware of an organized effort to limit oil production by the rest of the World. OPEC on the other hand makes monthly predictions of World demand and World supply and in many cases sets quotas based on the call on OPEC for oil supply.
What do you believe would happen to the price of oil when OPEC over produces? We get a rough idea by looking at the spot price for WTI on April 20, 2020 when it fell to less than zero (not sure how that even works, we will call it zero.) For the week ending April 24, 2020 the average spot price was $3.32/bo.
I do agree that OPEC lies about their reserves being “proved” reserves. For many OPEC producers the reserves may be over stated by about 70% and are closer to proved plus probable reserves than proved.
Robert Rapier believes the evidence for Saudi Reserves point to 270 Gb of proved reserves in 2019. He makes a convincing case :
https://talkmarkets.com/content/global-markets/how-much-oil-does-saudi-arabia-really-have?post=210858
https://talkmarkets.com/content/global-markets/discussion-of-saudi-arabias-oil-reserves-provokes-some-emotional-responses?post=211436
https://talkmarkets.com/content/global-markets/saudi-oil-reserves-growth-has-lagged-the-rest-of-the-world?post=211686
Dennis, I agree that OPEC nations often decide to cut production in times of oversupply. Historically I would guess that has been about half the time. You, however, suggest that they all must be cutting even when there are no quotas on their production.
Really Dennis, do you think that is a reasonable scenario?
I would suggest that it is blatantly obvious that in times of no quotas, all OPEC nations are producing flat out. And they have never stopped trying to squeeze every possible barrel oil out of their reserves.
Ron,
No not cutting production, just not expanding capacity beyond what they think is needed. If OPEC as a group believes 30 Mb/d is adequate capacity to meet the call on OPEC, they will not expand that capacity. If they expect future demand will be 35 Mb/d for OPEC oil, they may choose to expand their capacity in order to meet that demand.
I agree when there are no quotas they will produce at whatever rate they believe matches their current sustainable capacity. If output at that rate results in a high oil price level (as in 2011 to 2015) they might choose to expand their capacity. Often the bottleneck is gas, oil, and water separation facilities, pipelines, or port facilities rather than maximum output from the oil field. Sometimes more development is required in existing fields or new fields need to be developed.
Oh no. Robert Rapier lost two of his children in 16 months
FYI
https://twitter.com/RRapier/status/1579874021918638081
Paul,
Thanks for the information, so sorry for his losses.
based on production OPEC should have only about 200 billion reserves
Some years ago it was widely accepted that OPEC quoted original recoverable oil in place as reserves (so the fact that they hardly changed reflected them hardly ever finding anything new or adding upward revisions). That may have changed but there was a recent paper from the Shift project using Rysted data that seemed to agree. The African members (Angola, Nigeria, EG, Congo, and one I can’t remember) have western IOCs in charge of most production and these have to report remaining reserves honestly for SEC – their numbers would definitely agree.
GK,
Probably Gabon is the one you didn’t remember, those 5 nations had a total of 50.7 Gb of reserves at the end of 2020. If those are indeed proved reserves rather than 2P reserves, that would suggest 2P reserves of about 86 Gb for those 5 nations.
OPEC Reserves are likely 2P reserves, if we deduct Orinoco reserves (262 Gb in 2020) OPEC conventional 2P reserves are about 953 Gb. If we deduct Canadian oil sands reserves (161 Gb) and tight oil reserves (20 Gb) from non-OPEC reserves to get a rough estimate of conventional proved reserves of 336 Gb. To get a comparable estimate we can either divide OPEC reserves by 1.7 to convert to proved conventional reserves of 561 Gb, alternatively we could estimate non-OPEC 2P reserves by multiplying proved reserves by 1.7 and get a non-OPEC conventional 2P reserve estimate of 572 Gb. So for World conventional proved reserves we have at the end of 2020 about 897 Gb, plus about 40 Gb of unconventional tight oil plus Canadian oil sands in active development, so about 937 Gb in total at the end of 2020. For 2P reserves the total would be about 1593 Gb which would be the F50 estimate, also called the technical or engineering best guess estimate which would have about a 50/50 probability of reserves being either higher or lower than this estimate. At the end of 2020 cumulative World C plus C output was about 1409 Gb which would suggest with no future reserve growth and no future new oil discovery, that World C plus C URR would be about 3002 Gb. A possible scenario for future output with a URR of 2980 Gb, below
They also reoprt non-OPEC reserves. Their reserves are, according to OPEC, 303.25 billion barrels, less than one fourth those of OPEC nations. But wait, those are only 2P reservs as well. That would mean non-OPEC reserves, again, according to OPEC, are about 100 billion barrels. But then we would have to treat Canada the same as Venezuela, and not count all that hard to get shit, that would bring non-OPEC 1P reserves down to about 75 billion barrels.
But if they are truth tellers, they would give OPEC reserves in the same catagory as non-OPEC reserves. But if they are damn liars they would give OPEC reserves as 2P reserves while giving non-OPEC reserves as 1P reserves.
Which are they Dennis, liars are truth tellers?
Ron,
I am not making the same argument as Robert Rapier. I think many have OPEC producers overstated their proved crude oil reserves. I take my data from BP Statistical Review of World Energy
https://www.bp.com/en/global/corporate/energy-economics/statistical-review-of-world-energy.html
Try re-reading my previous comment more carefully:
Oil reserves
OPEC conventional 2P=953 Gb (exludes Venezueal Orinoco reserves=262 Gb)
OPEC conventional 1P=2P/1.7=561 Gb
non-OPEC conventional 1P=336 Gb (excludes Canadian Oil sands=161 Gb and US tight oil=20 Gb)
non-OPEC conventional 2P=1P*1.7=572 Gb
World conventional 1P=897 Gb
World conventional 2P=1525 Gb
World total 2P=2137 Gb (of which 612 Gb is unconventional oil (extra heavy oil plus tight oil)
World URR=3546 Gb, if reserve estimates above are accurate.
Note that my expectation is that only 190 Gb of unconventional oil will actually be extracted and approximately 2800 Gb of conventional oil. My best estimate of World URR for crude plus condensate is about 3000 Gb, but that estimate may be too conservative.
Noted Dennis. I am glad that you now agree with almost everyone else in the world. You, apparently, now agree that those OPEC folks are damn liars. Congratulations. I knew you would come around sooner or later. 😁
I have suggested that the supposed “proved” reserves of OPEC were in fact proved plus probable reserves for at least the past 2 years, perhaps longer. This has long been explained by how OPEC allocates quotas and when Iraq raised its “proved reserves” most other OPEC producers followed. In 1988 Saudi reserves increased from 170 Gb to 255 Gb, 255/170=1.5, this is roughly the ratio of 2P/1P reserves, perhaps this is coincidence, but I think not.
Paul told me that the oil shock model didn’t predict oil production correctly when he and it were pretending that peak oil was like 2008 or whatever, all because he couldn’t see into the future. Do you know if he has corrected this admitted flaw in the model that it might now be taken seriously? 🙂
No model can predict the future.
So Paul was just pretending when he was claiming peak oil a dozen or so years back? Wish he would have told us that then.
Couldn’t respond to your price comment above because of the awful format here, but no, I was doing multi-stage slick water fracturing in shales back in the 80’s and 90’s, and with real prices at that time, not an adjustment compared to today. Recently I showed you work done by the EIA in the Eagleford, and while the volumes available for $40/bbl in todays dollars didn’t equate to much oil, it did equate to some. Do you happen to have some corresponding or similar high areal resolution resource and economically recoverable analysis to substantiate the $40/bbl idea? I tend to give analysis a higher relative value than just someone saying it is, same as you probably.
Reservegrowthrulz,
I have pointed out on many occasions that I do not have the same access to proprietary databases that you may have. Of course there might be a few wells (perhaps 1% to 5% of completed wells) that might be profitable at $40/bo. The analyses I point to are from Rystad, where in Nov 2021 they were estimating an average breakeven price for tight oil at $37/bo (see link below)
https://www.rogtecmagazine.com/rystad-energy-as-falling-costs-make-new-oil-cheaper-to-produce-climate-policies-may-fail-unless-they-target-demand/
That estimate is absurd based on average well profile data for the Permian basin, the average 2020 well breaks even at about $60/b for Brent (refinery gate price, wellhead price at $55/bo), if we assume a real annual discount rate of 7.5% and average well cost of 13.3 million (full well cost) assuming NGL sells for 35% of the price of crude and Natural gas at $4/Mcf. Note that the 7.5% real annual discount rate is too low to be realistic because this well would pay out at 77 months and oil men suggest a 36 month payout is best with 60 months at most being reasonable. If we use 48 month payout as a guide for breakeven, the oil price would be $70/b at the refinery gate to achieve this. That would correspond to a real annual discount rate of 17% for the well to be barely profitable.
There are lots of stange “breakeven” concepts out there, a proper breakeven price means the IRR of the investment will be equal to an alternative equally risky investment.
RGR said about someone else:
Reminded of the fact that earth scientists are a weak link in the chain. They were never educated in how to do controlled experiments and so have little insight into how science works. Unsurprisingly, they are then at a complete loss for producing useful research into how nature actually works.
Yes, Dennis and I realize that oil production prediction is challenging, but that has more to do with economic game theory being involved, and that is known to be intractable. The essence of game theory is more widely known as “gaming the system” and of course business people will do whatever it takes to get a financial advantage. This includes redefining what crude oil means and then including all that other stuff in the oil category. Surprise, surprise that the peak will shift out.
Deffeyes predicted correctly that (conventional) crude production would peak in 2005. This peak is the logo on my website
https://crudeoilpeak.info/
https://pbs.twimg.com/media/FfG8d_KaUAAMJEC?format=jpg&name=small
This peak caused the US recession in 2007
https://www.brookings.edu/wp-content/uploads/2009/03/2009a_bpea_hamilton.pdf
and the oil price shock in 2008 which in turn triggered the financial crisis 2009. Has it already been forgotten that this crisis started in car and therefore oil dependent US suburbia?
What was not predicted was the US shale oil boom starting in 2010/11 which was financed by the Federal Reserve printing money (QE1 – QE3). Even Bush and Cheney could not imagine $100 oil (2011-2014) and invaded Iraq in 2003.
The above graphs show there are many peaks in various countries, each impacting on the local economies. Rystad estimated the Russian peak even before the invasion in Ukraine. It’s in my post
28 Feb 2022
Russian oil production update Nov 2021
https://crudeoilpeak.info/russian-oil-production-update-nov-2021
At present I am busy with coal supplies to aging Australian power plants because everyone assumes that EVs will solve much of the oil problem.
7/10/2022
Sale of Vales Point: How will Czech brown coal baron Pavel Tykac with
business registered in Liechtenstein impact on NSW coal and energy markets?
http://crudeoilpeak.info/sale-of-vales-point-how-will-czech-brown-coal-baron-pavel-tykac-with-business-registered-in-liechtenstein-impact-on-nsw-coal-and-energy-markets
In the last 20 years Australia failed to build sufficient pumped hydro to store renewable energy
Do you have a reference for Deffeyes defining conventional for his claim in 2005? I didn’t see it on any of the two links you provided. I presume that conventional oil is that requiring oil and gas wells to be drilled from the surface in some way, completed open hole or cased and completed, all the usual type of development that had been going on since at least the late 40’s? Other oil types being more mining operations, such as those done in the Athabasca, or anything the US might choose one day within the oil shales of the Green River Formation in the Piceance Basin.
Reservegrowthrulz,
One way of distinguishing conventional and unconvention oil is to use the USGS concept of continuous resources (tight oil and oil sands in Canada and Venezuela) and non-continuous, where resources are trapped in “pools”. By that definition the peak for “conventional oil” was in 2016, at least so far. Perhaps this will be exceeded in the future, though my gues is that it will not as the world transitions to electric land transport over the next 20 to 30 years, with demand falling to less than supply at $100/bo in 2022$ around 2035 or so with falling oil prices thereafter as the EV transition gains momentum.
That’s also a good way to look at it, as discrete resources scatterred over a region rather than as a continuum of lower density and grade, which is why one can use statistical sampling techniques to estimate where we are at in terms of a cumulative. Exploiting the continuous crud would be the nail in the coffin for preventing climate change.
The difference between 2005 and 2016 is meaningless given the uncertainty.
Should really make a Sankey flow diagram that would help explain how the USA consumes 20 million barrels of oil per day while it only extracts less than 12 million barrels of crude oil from it’s territory, all the while complaining to be “oil independent”.
If stated OPEC reserves were true, then the depletion rate of non-OPEC vs OPEC = 80.4%/19.6% x 60/40 = 6.15. In other words, non-OPEC produces 6.15 times more barrels per barrel of reserves than OPEC.
I agree that stated OPEC reserves are BS — there’s no way the above number is realistic, not even close.
Having oil and producing oil are two separate questions. You can have it but not be able tech wise to produce it.
CC, OPEC has been at this game for over 70 years. There is absolutely no reason that they would be less able to produce their reserves than non-OPEC nations. To suggest that OPEC nations are not as technically wise as non-OPEC nations is…. is…. no, I will not use the word. I will just say it is absurd.
Edit: I forgot to add. All OPEC nations have always used Western firms such as Baker Hughes, Halliburton, and Schlumberger. They all have the exact same technical support as Western firms.
That includes Russia as well. Without the Western Service companies and technology due to economic sanctions, their production will also fall dramatically.
In seeing the dialogue between you and Dennis, I would also suggest that if OPEC has all of these undeveloped huge oil fields, we would see storage in these countries rising steadily instead of falling steadily.
I believe KSA cannot sustain 11 million barrels per day without buying Russian oil either directly or through China and with the Russian Sanctions beginning in November, their proposed production cut may coincide with the the Saudis revealing their true sustainable production capacity (which I believe is a little under 10 million barrels a day) . The Saudis certainly are not willing to test having their assets in the US frozen.
LTO survivor,
Sustainable capacity depends on proved developed producing reserves.
As I am sure you are aware, this number is always less than proved reserves. I am simply saying the ratio of pdp to 1P is far lower for middle east OPEC producers.
Earlier Dennis, and I guess the rest of us, agreed that if the world were to surpass the peak hit in 2018, then it was up to these 11 oil producers. They were Saudi, USA, Russia, Iran, Iraq, Kuwait, UAE, Norway, Canada, Brazil and Canada. We called them the Big 11.
Well, Russia has now become part of the problem, no longer part of the solution. It is now the Big 10. The Big 10, as of June 2022, are about half a million barrels per day below their pre-covid level and about 900 Kbp/d below the world November 2018 peak.
But what about the rest of the world? After all, if they are declining, and indeed they are, then it is up to the Big 10 to make up for that decline. Well, it turns out they are not doing so well. They are 4,304 Kbp/d below the world peak in November 2018, they are 3,216 Kbp/d below their pre-covid level, but worst of all they are now 2 million barrels per day below their pre-covid decline rate. Their decline rate is increasing. Apparently, they shut down a large number of marginal wells and now they cannot be restarted.
Ron, these are great graphs. We have had high oil prices almost all year, with nothing to show for it. I try to be open-minded but this recent OPEC+ cut smacks of desperation. I can’t see a path forward from here that gets us back to the November 2018 peak. Not with Russia in the state it’s in and the collapse of the Iran talks. It’s just not possible any more.
Stephen Hren,
When oil prices return to over $100/bo and stabilize at that new level (my guess would be around $115/bo for Brent crude), we may see more investment by the oil industry, if not oil prices will continue to rise until either more investment occurs or enough demand is destroyed to balance the market, it will be a bit of both, but I doubt oil prices reach more than $140/bo in 2022 US$ for an annual average price.
Hey shallow sand, would you consider drilling new wells at $115/bo in 2022 $, assuming drilling costs rise at the annual rate of inflation (based on core CPI)? Assume you have seen prices at an average annual level of $115/bo for past year with volatility of plus or minus 5% (say in March 2024).
Possibly Dennis, looking like less than 5% odds at this point. To get to the old peak everything needed to go right: Permian ramping back up, Russia and Saudis full throttle, Iranian sanctions removed, Brazil and Canada ratcheting up. Instead everyone already looks maxed out or declining.
Stephen Hren,
Yes OPEC and many others are close to capacity at present, capacity is likely to increase imo, if oil prices rise in the future as I expect (to at least $110/bo for Brent in 2022 $). My estimate of the odds output will we lower or higher than my best guess scenario are 50/50. This assume discovered oil resources continue to be developed at the historic rate and the extraction rates for conventional oil resources increase to about the 2018 extraction rate.
It is expected there will be increased output from Norway, Canada, Brazil, Guyana, UAE, Iraq, Saudi Arabia, and the US over the 2023 to 2030 period, there will be decline elsewhere, but this will be far outweighed by increases, with a net increase of about 5 Mb/d from 2023 to 2030.
https://oilprice.com/Energy/Energy-General/US-Shale-Could-Peak-In-2024-Energy-Aspects.html
“Amrita Sen: U.S. crude oil output from shale basins could peak in 2024.
So far this year, the United States has managed to increase its total crude oil production by 200,000 bpd.”
Huge increases in oil price and shale barely treaded water this year.
Stephen,
It takes time for higher oil prices to affect output, we will see what happens when SPR releases stop, Russian oil sanctions become tighter and oil supply becomes very tight. It is possible there will be a severe recession in response so demand will fall, this is difficult to predict. If the recession is not severe as I suspect (World real GDP growth at 2.7% in 2023) oil prices will be at $110 per barrel or more for most of 2023 and we might see more growth in tight oil output than we have seen so far in 2022.
Much of the increase in World output from 2022 to 2030 will be from US tight oil, but there will be increased output from other nations as well (UAE, Iraq, Iran, Saudi Arabia, Canada, Brazil, Norway, Guyana, and Argentina).
Dennis, your optimism knows no bounds. 😇
Ron,
Here is the chart using a log scale on the vertical axis so that the slope of the curve indicates rates of increase and decline. The rate of increase from 2022 to 2030 is quite gradual about 3% per year.
Its a good chart.
People will be happy because they get to see their cliff.
LOL, Hickory. I hate log charts. And I hate Zen koans, as Hightrekker pointed out. Although the two aren’t necessarily related…
John Norris,
Below I plot the natural log of tight oil output, the idea is to see the rate of growth over time, which in this case corresponds with the slope of the curve.
For the semilog chart at link below
https://peakoilbarrel.com/june-non-opec-oil-production-rises-from-u-s-and-russia-boost/#comment-747456
The average annual rate of increase in tight oil output from jan 2022 to Dec 2025 is 4.94%/year and from Jan 2026 to Dec 2029 the average annual rate of increase is about 1.77%/year.
In a conversation with LTO Survivor I had a year or two ago he suggested tight oil might grow at around 5% per year, though his opinion may have changed.
The talk of tight oil peaking in 2024 is likely incorrect in my opinion. If oil prices rise to $100/bo by 2023 and remain at that level until 2030, this is roughly what the EIA expects for tight oil for that level of prices (from AEO 2022 this is the average of reference scenario and high oil price scenario).
Peak is around 11 Mb/d if we assume oil prices remain under $104/bo in 2021 $ through 2030.
Yes, whenever oil goes beyond $100, the world economy starts to slow so we should not assume that investments will be done on the basis of these high oil prices. See also my earlier comment in particular on Russia.
I appreciate your website is doing the hard work to monitor oil production. Unfortunately, I am no longer receiving email alerts to your posts so I am always late with comments
Matt,
I have stopped the emails, there is a new post every 7 to 10 days.
Matt,
The World economy grew at about 3% per year from 2011 to June 2014 when Brent oil prices averaged about $103/bo in 2015$. Also note that in 2022 $ this would be about $127/bo for Brent crude. Perhaps $140/bo in 2022$ might lead to a severe economic crisis, difficult to say, it might just lead to greater sales of EVs and might reduce demand enough to reduce market tightness.
” In the land of the blind, the one-eyed Jack is King.”
For the above scenario to occur, primarily from the Permian, over 4.7MM BOPD of NEW Wolfcamp, Bone Spring and Spraberry production will have to be REPLACED, and grown, for the next 10 years. Every year. Year after year. This replacement/growth will have to come from five to six, maybe seven, already over-drilled counties in two sub-basins, where gassy oil wells are quickly turning into oily gas wells. It will NEVER happen and suggesting that it might, even to a very few, is a great disservice to our country. As someone actually IN the oil and gas business for the past half century I would be ashamed to make these kind of predictions.
I am reminded of the meathead three months ago who said, on social media, the Permian Basin had 200 years of oil left in it. People all over America, even politicians, STILL quote this fella.
He was a realtor from Midland.
The US is on track to grow tight oil production only 225K BOPD in 2022, not 1MM BOPD as has been projected by Kings. And, as some of us have known for years, the end of Permian growth is perhaps much closer than estimated.
https://oilprice.com/Energy/Energy-General/US-Shale-Could-Peak-In-2024-Energy-Aspects.html
Prices have not continued to rise, as projected by Kings, they have declined. D&C costs have exploded. Economics are worse in the Permian, even with higher product prices. This is reality, not “hope.” Why this would change, drastically, over the next decade and things would get better, not worse, is sorta…not reality based.
Lastly, Kings have suggested here, constantly, that all future drilling can be paid for out of net revenue and all Permian debt, whatever selective number that is, “can be paid back by the end of 2024.”
So far, not so good. A number of large tight oil producers in the Permian are actually adding debt.
https://oilprice.com/Energy/Energy-General/US-Shales-Debt-Detox-Is-A-Huge-Win-For-Shareholders.html
Only 11% of accumulated long term debt has been paid back since 2020; this from a selective group of 30 of the top tight oil producers in the country, most of who were originally in Permian, or retreated to the Permian. With private debt, it’s much. much less. I have stated many times the US tight oil sector will NEVER pay its debt back; I stand by that.
Be weary of one-eyed Jacks with absolutely nothing invested in the outcome of their projections.
Some great recent posts by Mike
https://www.oilystuffblog.com/forumstuff
Mike,
Great post!! As an active investor.( God only knows why), I am personally experiencing all of the above. No amount of theoretical data will ever replace the economic realities of producing oil & gas. With current product prices and exploding D & C expenses, we are making lower IRRs than we were at $55 per barrel and $3.00 gas despite whatever the publics spew out on their IR decks quarterly. Just saying!!!
Mr. Survivor I would say you are very courageous man, sir. I got to see several AFE’s lately from proposed long lateral town wells within the city limits of Midland and I was stunned. I am spudding a little well next week where costs are up 30% YOY; these HZ wells were closer to 45%. 2:1 ROI’s over 10-12 years is a very tough way to make a living. I wish you the best of luck, sir.
Oil will likely go back up in November, I suspect, after the self serving political manipulation ceases, as you suggest. Our country’s much needed relationships with OPEC and the ME are being systematically flushed down the toilet…exactly like the SPR. All Americans should be livid about draining our nation’s oil savings account over politics and a stupid election.
Thank you, Stephen. And Avocado…still $3 bucks for ones the size of baseballs in S. Texas. Affordable avocado’s are past peak.
What draining America of oil is the stupidly oversized vehicles and the terrible urban planning that forces people to drive everywhere.
Waste not want not, my grandmother used to say. But she’s long gone, Americans prefer to roll coal and whine about shortages instead.
LTO Survivor,
How much is full well cost in Permian for horozontal well with 9500 foot lateral, I am currently using 13.3 million, also what is OPEX per boe on average for a an average 2018/2019 well? I am using about $12.5/boe over the life of the average 2020 well. I get an IRR of about 36% over the life of the well, which is about a 2 to 1 ROI over life of the well in real dollars assuming average rate of inflation at 2.5% per year. I assume the well is shut in at 20 bo/d.
LTO Survivor,
How much is full well cost in Permian for horozontal well with 9500 foot lateral, I am currently using 13.3 million, also what is OPEX per boe on average for a an average 2018/2019 well? I am using about $12.5/boe over the life of the average 2020 well. I get an IRR of about 36% over the life of the well, which is about a 2 to 1 ROI over life of the well in real dollars assuming average rate of inflation at 2.5% per year. I assume the well is shut in at 20 bo/d at about 14 years after first flow. EUR=479 kbo, 2000 MCF nat gas, and 168 kb NGL.
Well said, Mr. Shellman, thanks for your comments.
Interesting comments. Thanks.
So LTO Survivor, do you expect oil and natural gas prices are likely to decrease in the future?
Below is the oil price scenario I use for my Permian scenarios, it seems pretty conservative to me. I assume NGL sells at 35% of the wellhead price of crude which is $5/b below the Brent price and Natural gas I assume sells for $4/MCF.
Rather than picking ceertain counties or companies to make my case, I use the average well profile for Permian basin by year based on Novilabs data. I assume the Permian basin completion rate increases by 3 wells per month from 400 wells per month in Dec 2022 to 550 new wells per month by February 2027 and ten remains at that level until 2031 and then decreases at 5 wells per month reaching zero in Feb 2040. Obviously a guess, but that is the scenario.
Permian scenario with maximum completion rate of 550 wells per month. The scenario has a URR of 51.5 Gb and total wells completed from Jan 2010 to Jan 2040 are 117,668.
For the ND Bakken/Three Forks I expect a URR of about 8.9 Gb with the USGS mean TRR estimate about 11 Gb, so the expected URR is about 81% of the mean TRR estimate by the USGS. In the case of the Permian basin the mean USGS TRR estimate is about 75 Gb and my scenario URR is about 51.5 Gb or 68.7% of the USGS mean TRR estimate. In short, the Permian scenario is far more conservative than my North Dakota Bakken scenario.
Many would suggest the scenario is far too conservative, see for example
https://oilprice.com/Energy/Energy-General/Rystad-US-Shale-Production-To-Peak-At-145-Million-Bpd.html
On a linear scale the growth rates look unrealistic, but if we look at a semi-log plut to get an idea of annual growth rates (proportional to the slope of the curve on a semi-log plot), we see the scenario has far lower growth rates after 2022 than historical rates of growth in the Permian based. See chart below.
It would be interesting to get comments from Reservegrowthrulz, as he would probably think my scenario is absurdly low, in contrast to other expert opinions here.
Mr Shellman,
I would note that when output is not rounded to the nearest 1 Mb/d, my projection is 7.7 Mb/d for annual average tight oil output in 2022, average annual tight oil output was 7.2 Mb/d in 2021, so this is a 500 kb/d increase in output. The average output for US tight oil for the first 8 months of 2022 has been about 7.6 Mb/d. Also note that high oil prices in 2023 to 2028 of around $100/b in 2021 $ could make my projection too conservative, the EIA expects this price level would lead to tight oil output of 11 Mb/d by 2028, rather than 9.6 Mb/d for my scenario.
My projections have mostly been too low, maybe due to blindness. Of course your projections are always excellent, can you tell us what Permian output will be at the peak and when that peak will occur?
“… meathead three months ago who said, on social media, the Permian Basin had 200 years of oil left ….”
Daniel Yergin?
Mike,
From the article on debt you posted:
With capital discipline and the desire to strengthen balance sheets, the U.S. shale industry could potentially become debt-free by early 2024 if prices stay strong and discipline prevails, Deloitte said in a report in August.
My projection on debt was specific to the Permian basin and assumed both strong oil prices (over $80/bo) and capital discipline (wells paid for with cash flow), I also assumed 25% of cash flow was paid out as dividends, though I did not anticipate costs rising by as much as they have, so that forecast from 2020 will likely be wrong as the assumptions proved incorrect.
Dammit, these guys are admitting they have very little spare capacity. They know they are producing flat out and cannot produce enough to meet demand if it increases by only a couple of million barrels per day. Why don’t more people pay attention?
‘The world should be worried’: Saudi Aramco — the world’s largest oil producer — just issued a dire warning over ‘extremely low’ capacity Bold mine.
‘The world should be worried’: Saudi Aramco — the world’s largest oil producer — just issued a dire warning over ‘extremely low’ capacity. Here are 3 stocks for protection
The global oil market remains tight according to Saudi Aramco, the largest oil producer in the world. And that does not bode well for a world that still relies heavily on fossil fuels.
“Today there is spare capacity that is extremely low,” Saudi Aramco CEO Amin Nasser says at a conference in London. “If China opens up, [the] economy starts improving or the aviation industry starts asking for more jet fuel, you will erode this spare capacity.”
Nasser warns that oil prices could quickly spike — again.
“When you erode that spare capacity the world should be worried. There will be no space for any hiccup — any interruption, any unforeseen events anywhere around the world.”
Ron,
It is evident that spare capacity is low, I have been predicting high oil prices for quite a while, releases from the SPR cannot continue after the level reaches zero, maybe then the market will pay attention.
Well, perhaps. They will start screaming “Why did someone not warn us of this coming catastrophe?” Someone did, even the Aramco CEO tried to warn them. But another someone kept telling them, no, oil production will keep increasing until C+C reaches 100 million barrels per day around 2032.
They listened to him instead.
Pity. 😄
Ron,
Who is predicting C plus C at 100 Mb/d by 2032? EIA has it at about 87 Mb/d in 2032 in their most recent international energy outlook, my best guess is 84 Mb/d in 2032 (peak in 2030 at 85 Mb/d) the EIA has about 86 Mb/d in 2030.
Nasser is basically saying oil prices will be high when demand recovers, I agree. I do not think he is saying that output will decrease, just that increases will not be possible without more investment, I agree with that as well, my expectation is that high oil prices are likely to increase the level of investment in the oil industry.
Sorry, Dennis, I mistook your above LTO chart for a world C+C chart. Okay, I stand corrected. Your prediction is 84 million barrels per day in 2030.
No, you misunderstood Nasser. What he said was: “When you erode that spare capacity the world should be worried.” It could not be clearer. He knows full well that OPEC is out of spare capacity and knowing that the rest of the world is producing flat out, that they are out of spare capacity as well.
Read it again Dennis. It could not be clearer. Of course, it is your opinion that if we just had more investment, then more oil would magically appear. Investors’ actions are never based on today’s oil prices. They are based on what they expect oil prices to be in the future, sometimes years in the future. Investors look at what is happening with exploratory wells today and decide, “Too many dry holes and too many low-production wells, it just ain’t worth it.”
That Dennis is why there is so little investment. Nothing is based on today,s oil price or what they expect oil prices to be one or two years from now.
Ron,
The current oil price affects expectations of future oil prices. High oil prices today will affect investment decisions in the future. In any case, tight oil rates of growth have been affected in the past by the price of oil, currently supply bottlenecks for both labor and captal inputs to oil production along with a change in investor sentiment have reduced investment levels for tight oil. A prolonged period of higher profits in the tight oil industry is likely to change this investor sentiment.
Note that my shock model scenario has conventional output growing by only 0.6% from 2022 to 2030 (about 364 kb/d per year). This is less than half the historic rate in kb/d (historic rate is about 785 kb/d per year from 1985 to 2005). More recently conventional oil output has grown more slowly, in part due to oversupply from tight oil.
Note that my shock model scenario has conventional output growing by only 0.6% from 2022 to 2030 (about 364 kb/d per year). This is less than half the historic rate in kb/d (historic rate is about 785 kb/d per year from 1985 to 2005)
Slowly, slowly, Dennis, reality is creeping into your worldview. If this keeps up, you will be agreeing with me in a couple of years. 🤣
Okay, I was just joking there. Please excuse my dry humor. But instead of “growing by only 0.6%”, declining by 0.6% would put you a lot closer to reality. But hang in there Dennis, sooner or later you will get it right. I was not joking when I said sooner or later, you will agree with me that peak oil was in 2018. After all, no one can deny reality forever.
Ron,
We will see. I base a lot of my analysis on widely accepted estimates of oil resources by the USGS, Jean Laherrere, Steve Mohr, and many others.
My estimates of crude plus condensate URR are:
Conventional C plus C=2800 Gb
Unconventional C plus C = 200 Gb
USGS TRR estimates
Conventional C plus C=3200 Gb
Unconventional C plus C=750 Gb
Jean Laherrere URR estimates
C plus C less extra heavy oil=2600 to 3000 Gb
Extra heavy oil (API Gravity 10 or less)=200 Gb
Below is my estimate compared with the EIA’s International Energy Outlook 2021 (next update in 2023). Up to 2030 my estimate is roughly the same as theirs, by 2050 the difference is about 42 Mb/d (EIA=99 Mb/d and Oil shock model=57 Mb/d in 2050).
I base a lot of my analysis on widely accepted estimates of oil resources by the USGS, Jean Laherrere, Steve Mohr, and many others.
Yes, I know that Dennis. You have stated many times that your estimate of future oil production is based on what is reported to be left in the ground. There are a lot of problems with that method. First, they may be wrong. It is impossible to really know how much oil is left in the ground. And all oil reserves are not equal. Most of what is left are “hard to retrieve reserves” Then there are always political problems. They have always been with us and will always be with us. Most of the Venezuelan oil will never be recovered. Well, not in our lifetimes anyway. And a lot of reserves are controlled by the madman Putin.
My analysis is based on what comes out of the ground and the increasing production versus the decreasing production of all the world producers. Up until 2018, the increases were winning that battle. But then the tide changed, and the decreases are now winning… big time.
But on one point I agree with you. That point is “we shall see”.
Ron,
Not just what is left in the ground, it is based on technical 2P reserves, past production, as well as estimates of discovered resources. When one uses all available information, rather than a subset of that information, one gets a more accurate estimate of the future. It will still be wrong though because future rates of development of resources and extraction rates for conventional resources, as well as output of tight oil and extra heavy oil have an infinite number of possible paths, choosing the correct future path from an infinite set has odds of zero.
The decreases were caused by OPEC cuts in 2019 and then the pandemic, output has recovered quite a bit since then and though you believe that will not continue, I think you are wrong. I agree time will tell, it always does.
Dennis, the world had recovered from the covid collapse by January 2021. I have posted below a graph with a comment stating that. I posted it down there to get a wider area for my graph.
Ron,
Demand had not recovered by 2021, it was almost 3700 kb/d less than 2019.
Dennis and Ron –
Glad to see the discussion continues, as always I’m perplexed by Dennis’ rationalization of higher expected overall global oil production. A very simple exercise is to look at the top 3 producers (US, Saudi Arabia, and Russia). From about ~2010-2020 saw exceptional growth (mainly US) at an average annual rate of increase for the top 3 of about 4% each year.
As far as I can tell the main debate is whether that exceptional growth rate will continue.
In 2011 top 3 were 24.5 MBpD. Slightly before COVID hit top 3 were almost 34 MBpD (note that this level is slightly lower than the level of ~36 MBpD that would be expected if the 4% growth rate continued). With exception of US, top 3 rebounded from COVID lows by late 2021 (about a year ago) – US took another 6 months longer or so.
Ignoring COVID, top 3 producers should see production approaching and exceeding 40 MBpD in 2023.
Does it seem reasonable to expect this to happen? More over, if the 4% growth rate continued we would expect >42 MBpD by 2025.
Comparing 1 year growth intervals for US, we see August 2021-2022 added only 0.5 MBpD (under a high price environment no less).
In stark contrast, US between August 2017-2018, 1.5 MBpD was added (9.5 to 11). This was with oil prices ranging from $50-$75.
So I ask you Dennis, what are the fundamental differences between 2010-2019 and 2021-2022?
Even if US could continue at a growth rate of 4%, is this enough to offset all of the losers (average decline of 0.8 MBpD each year)???
All of this while not even talking about Russia…
I understand the US has considerable oil reserves, but I just don’t think it has the amount that is needed in order to get significant production growth over next year or so. We also have transport and refining limitations to deal with.
It seems the cards are stacked extremely high against additional growth…
Kengeo wrote: Ignoring COVID, top 3 producers should see production approaching and exceeding 40 MBpD in 2023.
Does it seem reasonable to expect this to happen? More over, if the 4% growth rate continued we would expect >42 MBpD by 2025.
Not even close. The world’s top 3 producers were at 32,675,000 barrels per day in June 2022. In 2023 I expect them to be at least 1.5 Mbpd below that level and down at least another million barrels per day by 2025.
With Saudi cutting and Russian production down due to sanctions, the only growth will come from the USA. And any increase in US production will be dwarfed by the decline in Saudi and Russian production.
Click on graph below to enlarge.
And just for grins and giggles. 😆
Click on graph below to enlarge.
Kengeo,
On only needs to look at my estimates for future growth to see that I don’t expect 4% growth in the future. As I often point out, it is World output that matters so we add up production from all producing nations.
So nobody is claiming exceptional growth for all three of these nations. I expect tight oil will grow at an average annual rate of about 3% per year fro 2022 to 2029. Overall World output grows at an average annual rate of 0.9% from 2022 to 2029 in my best guess scenario (from 80 Mb/d to 84.9 Mb/d over 7 years). The scenario is consistent with projections from the EIA up to 2030 and is more conservative than several scenarios I have seen.
Consider the Rystad estimate in the article below (from Feb 2022)
https://www.rogtecmagazine.com/rystad-energy-oil-at-100-could-trigger-an-additional-2-2-million-bpd-of-us-tight-oil-output-by-2023/
My scenario has tight oil output growing by at an average annual rate of 370 kb/d each year from July 2022 to December 2029.
Thanks for the link.
This article gives more details:
Saudi Aramco: The Oil Market Is Ignoring Supply Fundamentals
Oct 4 2022
The ongoing energy crisis, while intensified by the Russian invasion of Ukraine, didn’t start with the war, according to Aramco’s top executive. Years of underinvestment, a lack of a backup plan, and alternatives not ready to step up and replace conventional energy are the real causes of this state of energy insecurity today, Nasser said at the Schlumberger Digital Forum last month.
At the London forum today, he reiterated his view that underinvestment would come back to haunt the markets.
According to Nasser, upstream underinvestment continues due to pressure from investors and policymakers. Short-cycle projects are coming on – not long-term projects that will anchor and sustain production.
“We need to build up some spare capacity in oil, gas and LNG otherwise any outages or increased demand will seriously stretch producers and could cause more turmoil in markets,” Aramco’s CEO noted.
“Oil demand will continue to grow until 2030,” Nasser added, reaffirming the Saudi view that the world needs adequate oil and gas supply before moving away from fossil fuels.
“Alternatives are not ready yet. We need to decarbonize oil and gas and develop CCS but we must do this with adequate oil and gas supply,” the Saudi executive said.
https://oilprice.com/Latest-Energy-News/World-News/Saudi-Aramco-The-Oil-Market-Is-Ignoring-Supply-Fundamentals.html
Underinvestment after 2014 (when oil prices dropped and after QE3 ended) has been reported for many years and is well documented
https://www.verdict.co.uk/global-fight-oil-gas-investment/
In my opinion, the underinvestment reflects the problems you have when the easy oil has peaked including in Saudi Arabia itself
1/10/2019
The Attacks on Abqaiq and Peak Oil in Ghawar
http://crudeoilpeak.info/the-attacks-on-abqaiq-and-peak-oil-in-ghawar
The link to the London Forum, where Amin Nasser spoke:
https://www.energyintelligenceforum.com/
Note it is from the same organization
https://www.energyintel.com/
which in 2007 published Sadad-al-Husseini’s oil reserve table in which he had crossed out 300 Gb of resources
It’s here in my post:
http://crudeoilpeak.info/opec-paper-barrels
The link to http://www.energyintel.com/om/program.asp?year=2007
returns page not found
That’s how history is buried
It seems to me that whoever (probably the USA) destroyed the Nord Stream
pipelines put a large damper on oil prices. Without Russian nat gas,
European industry will not be competitive. Europe will deindustrialize. The
euro will fall with respect to the dollar and Europe will consume a lot less
oil.
It seems to me that whoever (probably the USA) destroyed the Nord Stream
pipelines…
What a very stupid ignorant statement. Biden would have had to approve such action. Anyone who thinks Biden would have done that is dumber than dirt.
Nuff said.
Maybe Schinzy bases this on a reliable source (Alex Jones?).
Schinzy- “European industry will not be competitive. Europe will deindustrialize.”
Putin would like to Europe struggle so that they are less likely to provide support and weapons for Ukraine. He is a spiteful person, and since he has control over Russian military actions without much push back, it is likely that Russia was behind the attack.
Most other countries have plenty of internal push back that would have prevented this action.
I am not sure if non-state actors could have accomplished this.
If there are any non state actors who could pull it off then I can’t imagine who they would be; It’d be a balls up.
The destruction of Nordstream accomplishes 2 things for Putin:
1) He’s got an expensive excuse to not supply gas to Europe.
2) It is a pretext for why he can start blowing up your oil and gas infrastructure.
I am convinced the timing of Putin’s actions and Peak Oil are not a coincidence.
Part of his plan is the dependency of his opponents on his resources.
Ugo Bardi wrote a post recently in which he remarked that we are always fighting monsters when our real problem is resource depletion. There were monsters in Iraq and Afghanistan. A monster in Syria. Monsters in Iran. A monster in Libya. What is extremely rare is a positive outcome to military intervention. In Secular Cycles, Turchin and Nefedov state that at the end of stagflation populations are rarely happy with their leaders while during the growth phase, they are. I think people are people and often the situation makes the leader more than his DNA.
Character assassination is the easiest propaganda play in the book. You think the US government doesn’t lie and manipulate the news media? Check out Matt Orfalea’s videos in which he documents systematic lying with astonishing conviction on main stream media: https://rumble.com/c/Orf
Check out the one on Hunter Biden’s laptop which was Russian disinformation before the 2020 election. Verifying emails on a forgotten laptop is about the easiest thing a journalist can do.
” our real problem is resource depletion..”
No. The real problem is that we are all the monster.
We are all the monster
Amen to that, well said.
No, that is a lazy thing to say which unfairly maligns an arguably small but significant segment of humanity. There are angels on this earth, I have met them and can confirm that they exist. And there are others, while not quite angelic, manage to govern themselves adequately such that they are a net positive to the human condition. There are monsters to be sure, but this description is most definitely not universally applicable and wrongfully waters down the significance of what a monster is and what they are capable of. It is like the left calling those who disagree with them a racist whenever it suits them; soon enough, the word lost any sort of definitive meaning and is now just a lazy slur to be used as a shield by the feebleminded.
Perhaps you have not heard of rape, or murder, or war, ethnic cleansing and genocide, starvation as a weapon of conquest, and the grotesque destruction of the natural world.
Oh sure, sometimes there are small flickers of kindness, but that pales in comparison to the evil deeds.
If you don’t see that humanity is a monster it is a great example of how one can live life with their eyes closed shut tight. Looking in the mirror is more palatable that way.
Let’s not put monsters down by comparing them to us humans.
My guess is on Poland. Russias primary method of influencing Germany this winter is to play the taps on/taps off for leverage. Now that leverage is gone. Russia wouldn’t likely compromise their own leverage over Germany. Germany has now been influenced towards making more assertive policies with regards to supporting Ukraine, secondary to decreased Russian leverage. Poland was probably the one most sick of their shit, and the next in line to play Home Team if shit goes sideways, so they ain’t fucking around.
The pipeline created a wedge issue. Now it don’t.
https://en.m.wikipedia.org/wiki/Wedge_issue
“The pipeline has been opposed by Ukraine and Poland and has left Washington in a difficult position with some of its European allies. It has also caused political infighting within Germany’s new coalition government and left the West divided in its response to the situation.”
https://www.aljazeera.com/amp/news/2022/1/25/ukraine-russia-what-is-nord-steam-2-and-why-is-it-contentious
I’m somewhat leaning towards a Ukraine-Poland collab.
That truck bomb on the bridge was a tricky job. I wouldn’t be surprised if Poland had their fingers in that also.
This line of reasoning also raises the possibility of a Russian operation with the goal of a ‘false flag’ narrative arising, such as implicating Poland or the USA.
I am not optimistic that clarity on this operation will come to the surface.
I don’t feel Russia would need to undermine its pipeline leverage in order to do some false flags. False flags are for internal consumption. Russia could have done any number of false flags other than blowing up their pipeline leverage to create wedge issues in Germany. The pipeline job is more like a No Flag job than a False Flag job, primarily because responsibility is unattributed.
The truck thing could have easily been a sloppily packed arms shipments; a lone wolf disappointed in his draft #, a false flag, maybe Poland did it to muddy the waters; the list of reasonable possibilities is quite long.
Russia says they have figured out the long circuitous route the shipment took to the bridge. If correct it’s a hell of a job; giving the package a check up; trying to keep eyes on it; timing it right for command detonation by an observer. That’s a lot of ingredients; a lot of pots simmering on the stove.
https://youtu.be/NmmWkJtuxz4
The truck bomb on the bridge, I am told, was an SAS operation. The person stating this appears to have had some inside information on the actors.
Thanks Mike, now we know.
/s
There is no way NATO SOF were involved in that. They may have had assistance in planning from a NATO power, but no Brit or Yank or Pole was on the ground doing it. I’d believe internal Russian agitators assisting Ukraine over that.
Ron,
Excellent point in regard to OPEC reserves vs. their production, especially to Non-OPEC. The world is getting ready to hit the ENERGY CLIFF, not because there are 1-4 trillion barrels of all kinds of worthless technically recoverable resources on the planet, but because the world economy can’t afford to pull that SHITE out of the ground economically.
So, we continue to debate this issue from those in the world who wake up in the morning and base their life on HOPIUM and those who are more PRAGMATIC.
Unfortunately, most humans today that are making leadership decisions are both very SMART & STUPID. But, there isn’t much in the way of WISDOM guiding the human race. That is why we head over the ENERGY CLIFF… DEAF, DUMB, BLIND… and STUPID.
Lastly, I tried to contact James Dietrich, the retired petroleum reservoir engineer who wrote the book, TOO MUCH BY HALF, to chat and do a possible interview for my website. He replied by saying, his Book and work took a very large toll on his life, and all he wants to do now is to put it behind him. Thus, he no longer wants to discuss it anymore, but says the implications from his book are still true today.
So, again… WISDOM has totally EVAPORATED from the HUMAN MIND as its leaders try to do whatever possible to keep the LIGHTS on for another few years before the PHAT ENERGY CLIFF LADY SIGNS…
GOD HATH A SENSE OF HUMOR…
steve
” leaders try to do whatever possible to keep the LIGHTS on for another few years”
Its not just leaders, after all leaders are really just followers of their constituents except in absolute autocracies/theocracies.
No its not just the leaders- its all of the worlds citizens [energy consumers].
Who purchased a new vehicle in the past 10 years, for example. I’m sure it was with full hope and expectation that they would be able fuel up at will.
With regard to reserves, I will reiterate: everyone, every person, every basin, every company, every state and country inflates oil reserves. Last night I heard on TV a very respected person state (perhaps rhetorically) that America had enough oil for the “next 600 years.” That’s BS of course, but people say it. It’s been said enough on national TV–often by members of both this administration and the last one–that 99% of the American people think it’s true. The culprit is always the oilman, greedier than J.D. Rockefeller and Standard Oil.
With respect to the Saudis inflating their reserves (the tacit implication being that they lie worse than most), with particular emphasis on the previous comment by someone that they didn’t “grow reserves,” perhaps they did. The Manifa Bay reservoir has been known since the mid-fifties, but nothing serious was done about it until about 2010-2015. It’s sour oil and the Saudis already had plenty of that. Then the big offshore field at Safaniya began to lose pressure at warp speed–and that was enough to get them going on Manifa. I have no idea how many non-Saudis who would understand the size of the reservoir actually worked on it, so there may possibly be a massive deposit of oil there, which has been kept quasi-secret. The Saudis are playing it coy, that’s for sure, and I suspect they want to pay it out over the next few decades.
What is known, geographically, in the Bay of Manifa is that they spent a good bit of money throwing up man-made islands. On them they’ve drilled on flat “onshore” surfaces. The concept that’s bantered about is that there are six (6) separate fields on these islands, connected by causeways and pipelines. If this is true, and they are as massive as hinted, I rather suspect that the bulk of oil shipped out of KSA in the future is going to come from Manifa, not Ghawar. It’s basically a new, emerging field that may conceivably be the size of Safaniya.
GERRY MADDOUX,
I think the 50-ton Brontosaurus in the room most are ignoring is the $300 trillion of debt the world is now choking on to keep the global supply chain moving and the lights on.
If we look at the oil industry in a vacuum, without finance, or the EROI, there’s probably a lot more oil that we can extract to continue going to Walt Disney World, Starbucks, and Walmart.
However, I imagine you see the tremendous volatility taking place in the financial markets-bonds that won’t end well. Thus, the coming collapse of Debt… and Asset values, means the ability to provide CAPEX to do more oil production will be limited.
This is by far the biggest misunderstood concept of the energy industry.
steve
The ND Monthly Oil Production Statistics”> is out. Their August production was pretty flat, up less than a thousand barrels per day. They are averaging 62 barrels per day per well.
From your graph it sure looks like North Dakota / Bakken has peaked.
There are only 39 rigs working in the Bakken; most are in the Delaware sub-basin of the Permian. This number is barely able to compensate for chronic well decline. Additionally, they are choking back initial production to improve EUR, so new well production doesn’t necessarily reflect the quality of the wells.
If and when we see true decline in shale oil production, some time before the lights go out the Bakken will get several thousand additional infill wells. EURs have actually risen there, due to long laterals in the thinner benches, but more due to choke back of IP, ethane gas reinjection as a clean up and oil-lifting agent, and reservoir pressure preservation. The small outfits up there (Crescent Point, Petro-Hunt, Lime Rock, Zavanna) are without peer in getting the most bang for the buck.
Some of the data we’re seeing results from a dire shortage of casing and other supplies, the most important of which are people willing to commit a career to work in an industry they’ve been told is dying.
Bakken Scenario
Dennis,
I see you woke up on the HOPIUM side of the bed. Well-done. Nice chart when we remove economics, debt and real reserves.
steve
SRSROCCO,
Economics included, wells can easily be financed out of cash flow at the assumed oil price, the scenario is exceedingly conservative. Wells are only completed if the discounted cash flow over the life of the well is positive. Annual discount rate used is 10%. The total wells completed in the North Dakota Bakken/Three Forks for the scenario from June 2005 to April 2038 is 28,533 wells, as of August 2022 about 16,983 ND Bakken/Three Forks wells had been completed, so the scenario assumes another 11,550 wells are completed from September 2022 to April 2038.
Steve,
Check out Novilabs supply projection at link below, hint it is quite a bit higher than my scenario.
https://novilabs.com/blog/north-dakota-update-through-july-2022/
If you are looking for a global energy outlook to 2050, with lots great data, charts and analysis from a research group out of Norway, down the report at this link
https://www.dnv.com/energy-transition-outlook/download.html
I’ve just begun to look through it. Impressed by the effort.
Cheers Hickory, that’s a great link.
They cover all of the energy sector in the report, but in regard to oil consumption (demand/supply) they appear to project a long plateau out to the early/mid 2030’s, with a small peak around 2025-26. Out to 2050 the consumption is down around 35% from peak. Oil used for light transport is down over 50% (which is about 2% decline per year).
These numbers are based on eyeballing of chart- not the raw data (IEA2022 based) since it isn’t presented.
I think this is roughly similar to what Dennis has presented in the last few years.
Hickory,
An excerpt from main web page, I am not getting the report for some reason.
— In 2020, demand was 75 million barrels per day (Mb/d) excluding natural gas liquids and biofuels. We predict a peak in 2025, at 86 Mb/d, 15% above today’s level, before going into steady long-term decline. Demand will decrease slowly between 2025 and 2035, after which the decline becomes relatively steep, averag- ing -2.4% per year over the period 2035–2050. In 2050, expected global oil demand of 56 Mb/d (115 EJ) will be 45% lower than today. This decline is linked largely to falling demand in the transport sector, down 45% in the next 28 years. Production will be concentrated ever more strongly in Middle East and North Africa.
Yes, roughly similar to my scenario, though I expect demand to increase until 2030 and then decrease thereafter with a slow decline at first and accelerating after 2035, basically they believe te transition away from oil will occur more quickly than I assume. I hope they are correct, but I think they are a bit more optimistic than me.
I do not doubt that this is what the world would demand if there is enough oil produced to meet this demand. My opinion on that. Not bloody likely.
In this context- demand equates to Consumption and takes into account production availability.
That applies to the past years, as well as to the projected future “demand”.
It is unfortunate use of terminology that seems to confuse most people over and over.
Hickory, in the past, when the world population was much lower, and oil was much more plentiful, demand always equaled production, arbitrated by price. In fact, that will also be the case in the future. As production falls, prices will rise until demand falls enough to meet production. It is really that simple. I am sorry that some people have trouble understanding that.
What is different today, is that many economists simply assume that demand always rises and there will always be enough production to meet that demand. They assume that demand will eventually fall, but caused by renewables. The vast majority of economists buy into the propaganda that we have enough oil to last for another century. They do believe in peak oil, but the peak will be caused by falling demand, not falling production. Geology, in their opinion, has nothing to do with it.
Understanding Economics and Scarcity
Scarcity
The resources that we value—time, money, labor, tools, land, and raw materials—exist in limited supply. There are simply never enough resources to meet all our needs and desires. This condition is known as scarcity.
Economics
When faced with limited resources, we have to make choices. Again, economics is the study of how humans make choices under conditions of scarcity. These decisions can be made by individuals, families, businesses, or societies.
Economics helps us understand the decisions that individuals, families, businesses, or societies make, given the fact that there are never enough resources to address all needs and desires.
https://courses.lumenlearning.com/wm-microeconomics/chapter/understanding-economics-and-scarcity/
Sorry Ron, I’m just not buying your belief about economist. I’m sure you can find a few nut cases. Just like Trump finds ignorance when he looks for lawyers. But, any level head person who has studied economics understands limits or scarcity.
Now the American public on the other hand has a big surprise coming their way. BTW, we do have enough oil for the next 100 years. Just not enough to continue todays wasteful habits. We are all very spoiled compared to the past and what will be the future.
The bigger they are, the harder they fall.
Sorry Ron, I’m just not buying your belief about economist.
I take it you are disagreeing with this statement:
What is different today, is that many economists simply assume that demand always rises and there will always be enough production to meet that demand.
Of course, not all economists believe that, but many do. Demand will rise or fall arbitrated by price. That is what they believe and what I also believe. But that cannot continue forever. If the product in demand is of a finite supply, then eventually that adage will no longer be true. Of course, everyone knows this, but it is often ignored when projecting future supply and demand.
The usual definition of demand in economics is the quantity of a product the public is willing to buy at a given cost. The idea of demand as a fixed quantity regardless of price doesn’t really exist is economics.
The role of price is a signal that adjusts supply and demand. Because supply and demand are both connected to price, they are never truly separate.
And here is a summary able of projected global energy supply by source.
Oil dropping from 179 to 118 EJ/yr from 2030 to 2050, which is a drop of almost 2%/yr
Coal will drop at a faster clip,
and Nat Gas at a slower clip with its peak later in the 2030’s.
2020 was an anomaly, caused by so many covid shutdowns. Therefore comparing 2020 to 2030 doesn’t tell you much. I wish they had used 2019 instead. How many Ej/yr of oil were supplied in 2019, any idea?
Ron,
According to BP Stats,
2018, 582 EJ
2019, 587 EJ
2020, 564 EJ
2021, 595 EJ
I don’t have access to IEA data.
That’s total Dennis. I was interested in oil only. Total tells me nothing about oil only.
Sorry, missed the oil.
2019, 192 EJ/y for oil
2021, 184 EJ/y for oil
They predict the peak will be 2025 at 86 Mb/d.
You can see from the chart on oil above that the 2019 global oil consumption (‘demand’) to be roughly the same as they expect in 2030-32, after peaking mid decade.
I believe they are overly optimistic on oil supply going forward but take that with some salt since I tend to be pessimistic about the smooth functioning of the global system of free trade and integrated supply chains upon which oil supply and consumption funding depends on.
I am a lot less certain about underground reserves/resources than just about everyone else here, so I don’t base my pessimism on that. But I don’t trust anybodies numbers to be accurate- not the Saudis, not the Russians, and certainly not the American companies.
Thanks, Dennis, that makes 2019 the peak, beating out 2025 by 13 Ej. And of course, It’s all downhill from there.
Ron,
Where did you get your exajoule estimate for 2025 (you should not assume a straight line increase)? Note that most of the “biofuel” would be ethanol and biodiesel which should be included in total liquids. The BP exajoule estimate includes NGL, and may be different fom the report by hickory, there are many different definitions of “oil”.
We do not have good consumption data for crude. If we switch to production of crude plus condensate in Barrels. BP has the peak in 2018 at 83592 kb/d, the report Hickory cited has demand for crude plus condensate peaking in 2025 at 85000 kb/d, roughly 1400 kb/d higher than 2018. Given how low current World stocks of crude are at present, it seems likely if this demand estimate is correct, that production of crude will need to be pretty close to that level as there is not a lot of oil stocks to draw.
Sorry, Dennis, I meant 2030. But if you have the 2025 data, please post it.
BP has the peak in 2018 at 83592 kb/d,
I can accept that. That point would be even harder to breach than the 83,000 Kbpd the EIA has.
the report Hickory cited has demand for crude plus condensate peaking in 2025 at 85000 kb/d, roughly 1400 kb/d higher than 2018.
Hey, everyone has an opinion. That is just someone’s wild-ass guess as to what demand, and I guess production, will be in 2025. I think that is an insane assumption. But of course, that is just my opinion.
Dennis, it is not up to what demand is likely to be but what the world can produce. I have no doubt that if prices are below $100 a barrel and the world is awash with oil, then that demand will be met. But all indications are Dennis, is that is just not going to happen.
That is actually a decent report, thanks for informing me about it.
It would take a while to read through it. Based on the summary and some of the graphics, they have managed to touch upon almost all of the main points regarding the energy transition. The quote “it is difficult to make predictions, especially about the future” come to mind when looking at projections past 2030 and especially in the time period from 2040 to 2050.
What I think could be a main point looking at Hickory’s excellent summary table, is that we most likely would go towards less total energy usage, but still that might not mean that we are a lot worse off. What I am aiming at is that less energy, but more electricity from renewables can imply more efficient use of it. A shrinking usage of energy for buildings both to keep the temperature and constructionwise can be mitigated to some degree. So can a shrinking manufacturing usage of energy, simply by reducing waste of energy and better choice of material input. Or quit producing redundant stuff. How much fossil fuels we are going to produce going forward is a wild card, especially after let’s say after 2035. But it is going to be far less, that is for sure. If global relations are ok and people are not rioting after a while (which is not very likely), I guess a somewhat positive scenario can be painted.
Agree with what you say. A huge concern is the unequal distribution of available/affordable energy, and I think that the poor distribution may be worse on the downslope than it was on the upslope of the fossil fuel age.
This shows on the RHS the reserves claimed by Africa OPEC nations (for crude only and probably equivalent to 2P although OPEC doesn’t really use proven/probable designation) and on the LHS the proven reserves of C&C plus NGL as reported by the main IOCs operating in those countries, as reported to the SEC (these may include small amounts from non-OPEC countries like Chad). The most notable thing is the large drop last year in Angola numbers, from over 7 GB to 2.5, which may be the first half-way honest OPEC claim. The steady decline in the IOCs reserves slowed down a bit last year, mainly because of the FID for a new FPSO by TotalEnergies. Allowing for the differences in liquids and countries reporting the IOCs produce about half of the total (see below) so the total remaining proven reserves are around 7Gb (there isn’t much probable left judging by the small revisions in recent years, and few recent discoveries but there are some older and marginal fields still awaiting FID).
The recent production from the five sub-Saharan OPEC nations (C&C plus NGL from EIA) and as reported by the main active IOCs there. The cumulative IOC production since 2005 plus remaining reserves indicate that total reserves post 2006 are going to be around 19Gb. Pro-rating against the flow would give 38Gb total, and there were 35 Gb crude produced before 2006. That gives 73 plus any condensate and NGL before 2006 ( which wasn’t as much as recently as much gas was flared). The maximum claimed reserve was 54Gb crude, which with crude and condensate might equate to 62Gb. If the claimed reserves were only taken from the point that the country joined OPEC then the numbers might make some sense, but maybe not.
Great 7-minute video on GPS with Fareed Zakaria on what might happen because of the proposed OPEC+ cuts. It explained why the proposed price cap is a bad idea. They also discuss the possibility of Iran and Venezuela coming back into full production. (Iran possible, Venezuela, impossible)
OPEC could tip the world economy into recession, warns IEA
Western governments are furious after OPEC+ decided last week to slash oil production by the largest amount since the start of the pandemic. They have good reason to be upset: The cartel’s actions may tip the global economy over the edge, the International Energy Agency has warned.
“With unrelenting inflationary pressures and interest rate hikes taking their toll, higher oil prices may prove the tipping point for a global economy already on the brink of recession,” the Paris-based agency said Thursday in its monthly oil market report.
The IEA slashed its forecast for world oil demand growth next year by more than 20%, citing further downgrades to global growth expectations from major institutions. The International Monetary Fund said this week that for many people 2023 will “feel like a recession,” as it cut its GDP growth forecast to 2.7% from an earlier prediction of 3.2%.
Perhaps OPEC will start preferring to set oil prices in some sort of accordance with what meets their budget requirements?
Oil prices are completely decoupled from product prices here, now.
When the invasion started, the oil price was at similar level or higher than today.
I refilled my heating oil tank then in the first week of the war, expecting things to escalate.
I payed 1,09 per liter then, which was outragious expensive.
Now it’s 1,65 – and you have to wait up to 3 monthts for delivery.
Below is a chart of world C+C production less the OPEC Big 5 and the USA. The OPEC Big 5 are Saudi, UAE, Kuwait, Iran, and Iraq. The covid demand crash had fully recovered, for all nations, by January 2021. Everyone has been producing flat-out since then.
World less Big 5 + the USA is 3,956,000 barrels per day below the level they were when the world peaked in November 2018. They are 724,000 barrels per day below their full recovery date of January 2021. And they are about 1,750,000 barrels below their pre-covid decline rate.
Notice that the 12-month trailing average has turned down. That’s a sure sign that they are not going anywhere very fast.
Ron,
No the covid demand crash had not been recovered from by Jan 2021.
In exajoules 2019 was 192.13 EJ/year and in 2021 demand for oil was 184.21 EJ per year.
See
https://www.bp.com/en/global/corporate/energy-economics/statistical-review-of-world-energy.html
I am well aware of that Dennis. 2021 production was well below 2019 production, and always will be. 2022 bill be a bit higher, and likely the post-covid high forever. For World less Big 5 and USA, June 2022 production was 724,000 barrels per day below January 2021 production.
Ron,
Consumption and production are not always the same. OPEC estimates conumption was 99.36 Mb/d in 2022Q1. In 2019 consumption was 100.55 Mb/d, you claimed demand had recovered by Jan 2021, probably not correct. See
https://www.iea.org/reports/oil-market-report-may-2022
Chart below is from that IEA May 2022 Oil Market Report, they estimate demand was about 93 Mb/d in Jan 2021, peak was about 102 Mb/d in August 2019.
Dennis, you are talking petroleum products demand and I am talking C+C production. We have C+C production. The EIA publishes it every month. Every country had a different date for recovery from the cut. However, no country is now recovering from the covid demand cut in 2020. They are all currently producing flat-out. The world in June was 3,710,000 barrels per day below the January 2020 level and 5,207,000 barrels per day below the peak in November 2018.
We have no hope of surpassing either of those marks any way soon. And it is my firm opinion that the November 2018 peak will stand, unbreached, forever.
That is all I am saying.
Ron,
Production capacity changes over time, so the amount of output tht results from “flat out” production changes over time.
As to World demand, you said demand had recovered by Jan 2021. What makes you think so? the only World demand estimates that exist are those for total petroleum products such as the one I presented by the IEA. If you have some secret demand estimate for World C plus C, then please reveal your source, we would all love to see it.
Dennis, the recovery from the covid demand destruction was over for many nations on January 1st, 2021. For a few other nations, it was later in the year. But the word “recover” is tricky. It depends on what your definition is. If you think it means recovering to their pre-covid level, then for many nations that will never happen. What I meant by the word was that they had recovered as far as they will ever recover.
As to World demand, you said demand had recovered by Jan 2021.
No, I did not say that. I said absolutely nothing about world demand. I said they had recovered from the demand crash. Meaning they were all now producing flat-out. They cut production because of the demand crash and by January of 2021 they were no longer deliberately cutting. I am not concerned with demand, I am only concerned with production. Production had recovered when no one was holding back production because of low demand. The date when every nation is producing flat out is the date of recovery from the covid deliberate cut in production. Of course, not everyone did that, but most did.
No, I haven’t a clue about future demand estimates. I never give demand a thought. I am concerned only with production. But yes, I have a clue as to future C+C production, just as you do. You post your estimate of future C+C production in those humpback charts you post. And I just give you my estimate in writing.
We both do it, and I really don’t understand why you have such a problem because I do it. My source is the EIA world production data. I watch it closely and try to see where things are trending. I think it works. You should try it sometimes. 🤣
Ron,
When you said the World had recovered from the demand crash I assumed you were talking about demand (=consumption) of oil. We don’t have very good data on demand for crude oil so yes I focus on production. I look at the same data as you, plus estimates of discovered resources and attempt to model developed resources based on past history and estimates of US developed resources which are extended very roughly to the World and also reserve estimates and how they change over time. I think looking at more than simply historical output gives a clearer picture of what may happen in the future.
“Consumption and production are not always the same”
The only exceptions
-being being product put into or taken from storage,
-or product which in the midst of transport to destination (storage at sea so to speak).
-or reporting and accounting inaccuracies such as intentional fraudulent reporting or stolen/smuggled product.
Hickory,
The difference between consumption and production is accounted for by eithe stock builds or stock draws. It is rarely the case that stocks do not chnage from month to month, though admittedly the data on World stocks of C plus C is appallingly bad. Over the long term production is roughly equal to consumption, short term, not so much.
Over the long term production is roughly equal to consumption
“Only a madman or an economist—“
Hightrekker,
A famous economist said, in the long run we are all dead. True dat.
Very true Dennis.
I appreciate all the good work you do on this site.
Wow – So even if US continues to add 0.5 – 1.0 MBpD each year, it would take at least 4 years to even get near a new high. This doesn’t factor in the loss of almost 1 MBpD every year from the “losers” list. This also doesn’t factor in Russia and other countries that are newcomers to the losers group.
This really underscores the trouble with focusing too much on a single country (US) to evaluate global production, I think we’ve all (almost) said it before, US is not going to see the increases in production that it had from 2010-2020, and even if by some miracle it does, it will do nothing to move the overall global production needle.
Question for all, why did the US take ~6 months longer than Russia Saudi Arabia to ramp production back up? My guess is part of it relates to COVID demand issues and also that US serves itself primarily while Russia and Saudi Arabia serve the international market. Price might play some role as well.
Kengeo,
The declining nations are not likely to continue to decline a 1 Mb/d, much of the recent decrease was Venezuela and Iran, these nations may not increase output, but they are unlikely to continue to decrease at the rate experienced from 2017 to 2020.
Dennis, It simply doesn’t matter. If they do not decline at all, they will not increase, especially with Russia set to fall another million barrels per day, perhaps two, at least. And the Russian decline will be permanent even though Putin says they can hold it flat until 2025. Saudi will likely be flat to down from here on out. That leaves it up to the USA to make up for the entire difference plus any further decline from the rest of the world.
That is just not going to happen no matter how much hopeum you put into your analysis.
Ron,
UAE, Iraq, Kuwait, Saudi Arabia, Iran, Canada, Norway, Brazil, and Guyana will likely add to the increases by the US, when we take Venezuela and Iran out of the declining nations group, because in the future the decline rates of those two nations are likely to be close to zero, the rest of the declining nations might be about 300 kb/d per year, this will easily be made up by the nations increasing output. Also Russia is likely to decline less quickly than you foresee, that has been the case so far in 2022.
Kengeo – Russia and Saudi just had to move some valves, USA had to mobilise rigs and fracking crews.
George, that may have been the case for Saudi, but that was not necessary for Russia. What Russia had to do was just watch it happen. It had already started to happen. Here is an article from 2009:
Russian Oil and Gas Industry Surprises Analysts
There are plenty of projects in Russia, both, new projects and existing brownfield projects. Russia is a very mature producer. If you exclude all the drilling activity taking place every year, then Russian organic decline in production is close to 19%. To compensate for that organic decline, Russia drills somewhere between 5,000 and 6,000 wells every year.
That was 12 years ago. New greenfield projects have all been almost halted due to all the major oil companies and all the service companies pulling out. And all that infill drilling in the Urals and Western Siberia has just about petered out.
They didn’t need to close any valves, they just had to stand back and watch it happen.
Ron, apparently when the oil service companies said they were suspending new operations in Russia early in this year, that did not mean they were going to abandon existing operations.
From Reuters 3 days ago-
Some of the oilfield service firm Schlumberger’s (SLB.N) more than 9,000 Russian employees have begun receiving military draft notices through work, and the company is not authorizing remote employment to escape mobilization, according to people familiar with the matter and internal documents. Schlumberger’s cooperation with authorities by delivering the military call-ups and its refusal to allow Russian staff to work outside the country has caused a backlash, according to the sources. They view the actions as tacit support for the war in Ukraine by Schlumberger….Russian law requires companies to assist with delivering a summons to employees and to conduct a military registration.”
Well, anyway you look at it, they are pulling out. Of course, they intend to comply with international law and fulfill current contractual obligations.
The world’s three largest oilfield service companies — Halliburton, Schlumberger, and Baker Hughes — are suspending operations in Russia Bold mine
Olivier Le Peuch, the chief executive officer for Schlumberger, said in the news release it was suspending new investment and technology deployment to the company’s operations in Russia. The company plans to fulfill any existing activity in full compliance with international laws and sanctions.
No one expected them to violate international law. But that is as far as it goes. When their lawful obligation is over, they are out.
In April, Schlumberger Chief Executive Olivier Le Peuch said the world’s top energy services company was closely monitoring developments in Ukraine and at the time was “hopeful for a quick cessation of hostilities.”
Schlumberger suspended new investments and technology deployment in Russia, but unlike some of its peers and customers, decided to remain.”
SLB has not suspended its Russia operations.
BHI and HAL did. The legal argument is false.
Russia cut production in early 2020 by choking back on flowing wells, not by stopping brownfield drilling. The choked wells could be brought back anytime as required. Drilling may have been reduced in the lockdowns, if so there would have been some decline in the country’s capacity, but nothing like that in USA, however there is no data available to say what happened there. Equally resting some conventional wells and fields would allow catch up on maintenance issues and improve reservoir and mass balance management, which would lead to improved overall production capacity, at least for some time, as demand recovered.
And of course, both demand and production did recover. They bottomed out at 9,329 Kbp/d in June 2020, and by February 2023 they had recovered to 11,080 Kbp/d, a recovery of 1.75 million bp/d.
But that completely misses my point. There were no oil field sanctions during that period. I was not talking about what could happen if there were no oil field sanctions, but the problems sanctions will cause. If you think the absence of the oil majors as well as the absence of the oil field service companies will make little to no difference, that is your prerogative. I, however, have a different opinion. After all, if their absence will make little difference, then why was Russia paying them all that money for their services?
Kengeo: “why did the US take ~6 months longer ”
My uneducated guess is something to do with the decline rate of US shale, i.e.: the Red Queen stopped pedaling.
Pops,
Simply a choice by tight oil producers to return cash to shareholders rather than drilling more wells, perhaps they are trying to punish the Democrats in the mid terms or they just like oil prices on the high side.
The analogy applies to about every oil and natural gas well ever drilled. It was interesting to me when David “no gas left in North America in ten years” (circa 2006) Hughes acted as though this was a surprise, rather than what you learn you’ll spend your professional life fighting about the 2nd day on the job. David never claiming any field or industry experience, him being a government coal geologist probably explains his surprise.
So after 150 years of drilling flat out, over and over drilling themselves into glut after glut, US E&P decide out of the blue drilling isn’t really their thing? That’s funny.
The question was why did RU and KSA not take as long as the US to ramp production?
Answer: US had to first make up for the massive loss in production owing to shale’s ridiculous decline rate of 80% the first two years.
The drilling report is no secret, Permian new production for Sep in the Oct 22 report is 364 mbbl/d but the decline is 314!
Pretending it is the same as it ever was is called normalcy bias.
Pops,
Of course the tight oil wells decline quickly, the rate that tight oil companies have chosen to ramp up new well completion in response to higher oil prices has been lower than in the past, this is simply a choice these companies have made in response to the demands shareholders have made in the case of publicly traded companies. Note that the drilling productivity report makes many assumptions which are not very good, so I tend to ignore that. Novi labs has good reports on tight oil, but they are less frequent than when Enno Peters was running things at shaleprofile.com.
https://novilabs.com/shale-oil-and-gas-insights-blog/
Ron,
Here is World less OPEC, Russia, and US before the pandemic ( July 2015 to June 2019), average annual decline rate is 191 kb/d over that period.
The OPEC Big 5+ USA are back to their pre-covid level but is still 1,251,000 barrels per day below the world peak of November 2018. The OPEC Big 5 are Saudi, UAE, Kuwait, Iran, and Iraq.
Since the World, less Big 5 + USA has clearly peaked. it is obvious that it is up to the Big 5 + USA to make up the difference. June 2022 World production was 2,207,000 below the November 2018 peak. I don’t believe they can do it.
Russia says they will produce 9,9,00,000 barrels per day in October. And they say they can maintain that level until 2025. I believe they can do that in October, but it is laughable to believe they can produce at that level until 2025.
But comparing that to their previous data, that is approximately 650 Kbpd below their September production level and 1,180 Kbpd below their February post-covid high, and 1,400 Kbpd below their pre-covid level.
The chart below is through October 2022, using the Deputy Prime Minister’s data for October.
Russia Claims It Can Maintain Oil Production At 9.9 Million Bpd
Russia expects to keep its production at 9.9 million barrels per day (bpd) in October, Russian Deputy Prime Minister Alexander Novak said on Wednesday, citing production volumes that are more than 1 million bpd below Russia’s current target under the OPEC+ deal.
Russian President Vladimir Putin said on Wednesday that Russia would keep oil production and exports at that level until 2025, vowing not to give up what he considered to be his world-leading position in the global energy markets despite sanctions.
“We are at the same level, 9.9 mln bpd. We currently have stable production,” Novak, who represents Russia at the OPEC+ meetings, said at an energy forum in Moscow today, as carried by Russian news agency TASS.
Russia is set to keep the 9.9-million-bpd level throughout October, Novak added.
SNIP
Russia is estimated to have been around 1 million bpd below its 11-million-bpd quota for September, so it will not have to reduce any production and will only benefit from higher oil prices.
So we still don’t know what Russia’s September production was. But according to the above sentence, it was a lot less than we have been estimating.
Ron,
The OPEC plus target is for crude only, so you need to add condensate output to get C plus C. The quota for September was 11.03 Mb/d of crude only, so crude only output based on Novak’s comment was about 10.03 Mb/d, then we add condensate of perhaps 400 kb/d which gets us to 10.4 Mb/d of Russian C plus C output.
See link below for Sept quotas
https://www.opec.org/opec_web/static_files_project/media/downloads/Production%20table%20-%2031st%20ONOMM.pdf
October quotas at
https://www.opec.org/opec_web/static_files_project/media/downloads/Production%20table%20-%2032nd%20ONOMM.pdf
November and December “voluntary quota” at
https://www.opec.org/opec_web/static_files_project/media/downloads/Production%20table%20-%2032nd%20ONOMM.pdf
Dennis, this report may have meant crude only, but there is no indication of that. Of course the reporter for Oilprice.com mentioned quotas, but that was here input, not Russian Deputy Prime Minister Alexander Novak’s words.
Before the war, when the Russian Minister of Energy gave monthly updates on Russian oil production, it was always in C+C. So I had to assume this report was in C+C as well.
Anyway, the EIA has Russian production dropping even further, just taking longer to do it. Also, there were several reports on the net of Russian exports dropping through the floor in September. I think their reported production, about the same as August, is highly suspect. We now have no official way of getting accurate production data out of Russia.
Ron the quote said it was 1 Mb/d less than the OPEC plus deal, that deal is for crude only.
Ron,
I reread article, he predicts 490 million tonned for 2023 (I agree this is likely C plus C) which would be 9.83 Mb/d for average 2023 output. Currently (September 2022), my estimate is 10.4 Mb/d for Russian C plus C so this suggests a drop of 600 kb/d.
Ron,
I was noticing Ovi’s excellent chart on Russia. Based on Russian data (back when this was available) EIA estimates of Russian production is about 400 kb/d less than the Russian estimate (this may be a difference in how C5 is reported in Russia compared to the US where US calls condenstae produced in the field a part of crude oil and C5 produced in a NGL processing plant as NGL, many other counties such as Canada classify all C5 as condensate which is the proper way to do things imo. Bottom line is that EIA estimates of Russian output are about 400 kb/d too low, this may be a big part of the differnt estimate in 2018 for C plus C by BP vs EIA.
It is interesting to see the EIA’s take on Russian future production. They see Russian production going a bit lower than the 9,900 Kbpd that Russia says they will hit and hold in October, this month. But they do not see that happening until February of 2023. Then they see it holding around 9,500 Kbpd.
The EIA STEO data is in “petroleum and other liquids,” but I subtracted their average “other liquids” from their data to convert it to C+C. Well, as close as I could.
Ron – Great charts.
So it’s looking more and more daunting for global production to approach the 2018/19 high (PEAK).
The biggest headwinds:
– Even before COVID, there was essentially no growth in global oil production between late 2018 and late 2019.
– Oil refinery capacity is maxed out, production growth will be extremely difficult without adding refining capacity.
– Unprecedented underinvestment in exploration and infrastructure.
– Price of oil is fairly high and demand destruction is occurring (if China ramps up demand then price shock cycles will further undermine stable oil supply growth).
– Price cap on Russian oil will likely have a destabilizing effect on both prices and production.
– The gainers were flat from late 2018 to early 2020, currently ~-1 MBpD from the PEAK.
– The losers club is -4 MBpD from the PEAK. They continue to lose somewhere around 0.5 MBpD each year.
– Russia is -2 MBpD from the PEAK – not clear if they have any room to increase (but not likely).
– US annual growth in best case scenario is ~1 MBpD (currently only ~0.5 MBpD during past 12 months).
– US post-COVID growth rate appears to be significantly lower than the 2010-2020 timeframe.
– No other countries appear ready for any significant growth.
Adding it all up, there is a ~10 MBpD deficit that needs to be addressed before a new PEAK has even the slightest chance. US growth does not appear able to address the decline rate of the “losers” essentially leaving global production growth at a standstill (best case scenario). Decline rates are likely to increase in near term, approaching several percent within next 1-2 years. At ~90-100 MBpD, even a 1% decline rate sees 1 MBpD of oil removed from the market each year.
A global decline rate of 2-3% will become apparent in the next 6-12 months. By 2030, global production will be near the levels of the late 1990s, by 2040 it will fall to late 1960s equivalent, which is drastic. Essentially this makes the PEAK centered ~2005, which makes a lot of sense in context to price movement of 2007 timeframe as well as all the estimates from 2000-2015, the only major changes of past 5 years are all the downward revisions to global estimates of recoverable hydrocarbons…
Great analysis Kengo, I agree with every phase of it. Check out two charts, up post, that I just posted a few minutes ago. The first chart is the combined production of Saudi, USA, and Russia. Their combined production, in June, was about one million barrels per day below their pre-covid level and 1,422,000 barrels per day below their November 2018 peak. However, the combined production of the rest of the world is currently 2,670,000 barrels per day below their pre-covid level and 3.748,000 barrels per day below the November 2018 peak…. and declining.
World production will never climb that mountain, especially with the World less the three largest producers clearly in decline.
Ken Geo,
Your 10 Mb/d does not add up, though you mix all liquids and C plus C estimates in random ways so not really clear. Peak was 83 Mb/d for C plus C current output 79.3 Mb/d, so you are off by about 6 Mb/d.
We are likely to see increased output from US, Canada, Brazil, Norway, Guyana, Saudi Arabia, UAE, Iraq, Iran, and Kuwait in the future and perhaps 300 kb/d annual decline from the rest of the world.
So annual decline rate of 2000 kb/d (2.5%) in the next 9 months? We will see. I think an increase of about 650 kb/d is more likely (from 79.3 Mb/d in June 2022) over the June 2022 to June 2023 period.
Dennis, I take it you don’t believe Russia will decline very much and also think OPEC is blowing smoke when they say they will cut 2 million barrels per day.
Ron,
I think Russia may drop by about 600 kb/d and then remain relatively flat, I also think eventually the war with Ukraine may end. OPEC plus cuts will be about 1 Mb/d at most and they are “voluntary” which typically means, Saudis and Kuwait make the cuts, but not anybody else. I expect oil prices might rise, if they do the cuts will stop, if not they may continue.
Okay Dennis, just one more question and we will put this discussion to bed. You say:
I think Russia may drop by about 600 kb/d and then remain relatively flat,
Fair enough, but drop from what level? That is, after this 600 Kb/d, decline where will Russian C+C stand?
I won’t bother you anymore with this Russian thing. I would just like to know where you expect Russian C+C production to hold “relatively flat” for the next few years.
2.5% decline seems possibly overly optimistic:
“Moreover, the persistent decline in existing oil production means that significant investments in new oil production are needed just to maintain existing levels of production. Chart 1 includes an illustrative path for global oil production assuming that, as from today, no new investments are made and existing levels of production decline at a rate of 3% per year.*
*-A 3% decline rate is, if anything, a relatively conservative assumption. Major energy consultants typically assume decline rates of between 4%-6%, See, for example: IEA Energy World Outlook 2013 (p 457); http://peakoil.com/production/global-4-5-oil-production-declinerate-means-no-near-term-peak; http://www.ogj.com/articles/2017/09/woodmac-forecasts-stablenon-opec-decline-rates-through-2020.html“
Kengeo,
You said 2 to 3%, so I picked 2.5%. I expect oil prices will increase and so will investment by oil companies.
Dennis –
December 2019 [PEAK] – US production =12.9 MBpD ($60) [value $0.77B per day]
December 2021 – US production = 11.8 MBpD ($70) [value $0.83B per day]
October 2022 – US production = 11.9 MBpD ($90) [value $1.07B per day]
All the forecasts call for US production to drop, correct?
Curious where you expect to find data to the contrary??
Kengeo,
See EIA’s AEO 2022.
https://www.eia.gov/outlooks/aeo/data/browser/#/?id=14-AEO2022®ion=0-0&cases=ref2022~highprice&start=2020&end=2050&f=A&linechart=~~ref2022-d011222a.8-14-AEO2022~highprice-d011222a.8-14-AEO2022&ctype=linechart&sourcekey=0
Good stuff Dennis, so the reference case is at least 3.5 times more than the proven reserves (2P) and the high oil case is 5 times proven reserves. Both of those scenarios seem extremely far-fetched. Specifically, pushing production above 12 MBpD requires proven reserves (2P) to triple within the next 6-12 months, do you believe that is a realistic possibility????
Put this all in perspective, looking at the big 8 exporters (Saudi Arabia-Iraq-UAE-Nigeria-Angola-Venez.-Kazahk-Norway). Since 2016 they have been losing production of around 2.5% annually. Starting in 2018 consumption of that same group has been dropping ~2% annually. For example, in 2016 net exports were ~23 MBpD but by 2021 they dropped to ~18.5 MBpD…this effectively means a 5% decline in annual net exports.
Once again, we lose track of the big picture by looking at production only (important to look at net exports as that has a larger factor on pricing). This has resulted in about a drop of 1 MBpD annual net exports for these top 8 exporters.
So naturally the question is which countries are consuming less? The answer is interesting.
Japan leads the pack 0.65 MBpD less over five years (2016-2021), (-0.65 MBpD)
Mexico is 2nd consuming 0.6 less (-0.6 MBpD)
UK consumes 0.35 less (-0.35 MBpD)
Canada, Germany, and Venezuela each consume ~0.25 less (-0.75 MBpD)
Egypt about 0.2 less (-0.2 MBpD)
Then a list of 10 countries consuming around 0.1 less (-1 MBpD):
-Australia
-Argentina
-Brazil
-France
-Italy
-Malaysia
-Netherlands
-Spain
-South Africa
-Thailand
The only 1 consuming considerably more over this timeframe is China (~3 MBpD).
As anyone can tell, even under the most unrealistic forecast for US production, there is simply no way to offset all of the other factors making oil less available to the global market. More importantly, US isn’t a net exporter, so even if we could supply our own needs it would do nothing globally…
Please let me know if there is some critical aspect I’m missing, it seems like it’s crystal clear to me but I’m only one person.
Price gap on heavy Canadian oil tops $30 per barrel, widest spread since 2018
A barrel of the North American oil benchmark is changing hands for about $90 US a barrel right now, but the heavy crude that comes from Canada’s oilsands is fetching $30 less because of a perfect storm of imbalances between supply and demand.
Frugal,
This is expected to change when releases from the SPR stop, which is likely to be soon, eventually the SPR falls to zero and we cannot release barrels that are not stored. Currently the SPR is at 409 million barrels and the Biden administration has been draining about a million barrels per day, so at that rate we are 14 months away from no oil in the SPR. The data only goes back to August 1982 when SPR stocks were around 270 million barrels. If we assume the US will not reduce the SPR to below 270 million barrels and continued release of 1 Mb/d, then releases from the SPR could continue through February 2023 and then would need to stop.
You would think oil refineries would retool to handle heavy, sour oil as this will become a larger fraction of future oil. But it looks like they won’t go through this expense until there’s physically not enough light, sweet oil available.
Frugal
My understanding is that the Gulf coast refiners are designed to process heavy sour crude. One of their primary sources is Mexican Maya. Maya is a heavy sour crude oil grade and is an important benchmark for heavy sour crude oils in the US Gulf Coast market. Its current price is $78.78 as shown at the oilpr.ce.com site. That is just a $7/b discount from WTI. Canadians think we are subsidizing US drivers.
oilprice.com
https://oilprice.com/
Frugal,
They are set up to handle that, that’s why the US exports most of the tight oil produced. A lot of the SPR releases have been heavy sour crude and probably all of it is heavy. The Canadian oil sands can be handled by US refineries, though transport can be a problem as pipeline access is limited and rail is expensive.
Well then:
https://www.resilience.org/wp-content/uploads/2022/07/Exxon_desert_tanker.jpg
Dennis
The DOE will release 10 million barrels in November. That will bring their total sales to 165 million barrels. That will be the nd of sales since the election will be over then.
“This historic release of SPR crude has already provided approximately 155 million barrels of crude oil supply to the U.S. economy—resulting in certainty of supply for American consumers. Today’s announcement will bring the total to 165 million barrels out of the 180 million barrels the President authorized in March.”
Hopefully for our Canadian producers, that should narrow the discount. As I noted under the Canada chart in the post, a more typical discount is $12/b to $17/b.
https://www.energy.gov/articles/doe-announces-notice-sale-additional-crude-oil-strategic-petroleum-reserve
Ovi,
I agree with your analysis, My point was that even if a decision was made to continue to release more crude from the SPR was made (this would not be smart in my view, but politicians do lots of dumb stuff in the US), it could not continue much beyond February, if 270 Mb is the lower limit of what is acceptable. My hope is that somebody in Washington will wake up and say what the F were we thinking! Unfortunately I am usually wrong.
Dennis
I wonder if they will start buying it back and think what that might do by adding to demand. I guess they could go slow and buy 200 kb/d.
Ovi,
The plan is not clear, they may wait for periods when oil prices drop to refill, or they may just refill slowly, I don’t really know.
Evidence the USA will peak soon in shale oil in this article. https://oilprice.com/Energy/Energy-General/US-Shale-Could-Peak-In-2024-Energy-Aspects.html
While this site keeps focusing on the supply side and questioning what the next maximum supply limit will be, we need to keep an eye on the demand side to get an idea when the next maximum supply limit could occur. (Note I am not implying it will be higher than November 2018). A good place to start is to look at the world’s biggest oil market, the US.
Attached is a chart which shows product supplied in the US. The year has been divided into 13 four week segments and the average product supplied for those four weeks is shown in the attached chart along with the price of oil in a chart below it.
For comparison, data for the years 2019, pre-pandemic and 2022 are shown to get an idea of where current demand stands relative to 2019. This comparison is intended to demonstrate how product supplied has been affected by the increase in oil price in the US and by implication other world countries. Note that in this discussion, product supplied is being used as a proxy for demand.
The price of oil at the beginning of the year 2022 was $75/b and note how January demand in 2022 was higher than in 2019. Note how the demand started drop as the price of WTI soared. During periods 8 and 9, roughly July and August, demand was down by 1,500 kb/d. I have to assume a similar trend is happening in Europe and possibly China.
So with demand down, the supply side is not going to be stressed to test its supply limits.
I am surprised there were no comments regarding the last chart in the post above. It is showing that the next potential peak supply occurred in September 2022 and will be even lower in December 2023. What is not known is whether the drop off is the result of lower demand because of possible high prices, > $85/b out to December 2023 or geology and sanctions. The clue to the cause will come from the price of oil itself.
Ovi.
Refined products costs are much more relevant than the oil price right now.
$85 WTI should equal $3.25 or so gasoline and diesel prices where I live, based on prior periods where WTI was this price. In 2008 when WTI hit its all time high, gasoline was around $4.10 where I live.
Today gasoline is $4.10 where I live. Worse, diesel is $5.69. We drove two hours North yesterday. Gasoline was higher, $4.25-$4.35 and diesel as high as $5.99.
There is a refinery in Toledo that had a bad fire in September. Two fatalities. News says it will be completely shut down well into 2023. Midwest refineries put off turn around until fall to take advantage of record spring crack spreads. But even now, when demand should be lower, prices are very high due to these refining issues.
I know grain prices are very high. But inputs are also at record highs.
Really, the oil price is irrelevant to demand if the finished product prices bear little relationship to them.
I think you’d agree $85 WTI normally wouldn’t translate into these product prices. But this may be the new normal. The US has lost a lot of refining capacity, with the Philadelphia refinery closed, as well as some closing in CA and small ones having been permanently shut down in the past few years.
SS
I agree with you that refined product costs are more important than crude to the consumer. However they are strongly correlated to WTI and do affect consumer behaviour.
In Ontario, in 2008, I recall paying $1.40/litre for gasoline. Today we are paying $1.60/litre with WTI at $86/b. So we have the same problem north of the border.
I recall that I used to add roughly 75¢/gal to New York harbour gasoline to get an average US price. Today it has moved closer to $1.25/gal. So costs and pricing are changing in the refinery market and we are paying more.
Ovi,
Product supplied includes a lot of stuff, much of it is not really liquid fuel supplied by crude oil.
Chart below has product supplied for Jan to Dec (month 1 to 12) in 2019 and 2021 for the sum of finished gasoline, diesel, kerosene (including jet fuel) and residual fuel. This sum better reflects crude inputs to refineries which is the demand for crude oil.
US output is a pretty small piece of World demand. Note also that some of the products supplied get exported, product supplied is basically output from refineries and blenders. It may be that exports have increased, particularly diesel fuel which might in part explain high diesel prices in the US.
Dennis
First off, I think that your scale is not kb/d. 59,000?
I am not clear why the statement “This sum better reflects crude inputs to refineries which is the demand for crude oil.”
The fact that that crude refinery input in 2022 is slightly higher that 2019 may just reflect expansion of refinery capacity. Not new refineries, just incremental expansion. Note that it is not consistently higher. It is lower in January and July.
The U.S. refiners import 5,000 kb/d to 6,000 kb/d of crude daily and export diesel and other products to world markets. So I do not see the relationship between US refinery input and demand for product in the US. With diesel at a premium I can see refineries biasing their output to diesel to take advantage of the spread and exporting it.
The point of the chart was to show that US demand for product was dropping as the price of WTI rose.
The main refinery outputs that are not liquid are asphalt and petroleum coke and their volume depends on the quality of the incoming crude. I recall reading that one of the characteristics of synthetic crude was that it had no bottoms, I.e. no asphalt.
Ovi a big part of products supplied is HGL (hydrocarbon gas liquids) as well as asphalt, waxes, lubricants and other stuff. Generally input to refineries and blenders id close to the output of gasoline, diesel, kerosene, jet fuel and residual fuel. A better anaysis would look at net exports of these products as well, though your point about inputs to refineries (and blenders) is a good one, that is the true demand for crude, though it may be affected by net exports of liquid fuel (excluding HGL). Took a quick look at net exports of these liquid fuels (at STP) and first 7 months of 2019 net exports were higher than 2021 by about 181 kb/d. So not a big affect on total demand for crude.
Dennis
I see the chart has changed. My comments still apply. I see that in January and July, input to refineries is down by close to 1,000 kb/d. Similar to product supplied.
U.S. is roughly 20% of the world market and I am just using it as a proxy for what is likely happening in Europe, China and other major economies.
What I am trying to get at is whether lower US demand, along with lower demand in the rest of the World is the reason that World C plus C is highest in September 2022 and is lower still in December 2023.
In other words is lower demand the reason for lower output of C plus C? While the timing may be bad, maybe that is why OPEC is lowering production. That is not to say there may also be other reasons.
Ovi,
I hoped nobody saw the first chart, I summed incorrectly so the chart was incorrect, sorry about that.
The STEO is based on expected future oil prices and expected future World GDP, any forecast is likely to be revised in the future as you are aware, so I don’t put a lot of faith in any EIA future scenario (nor my own) as assumptions about the future are invariably wrong. Basically we do not know what World output will be in September 2022 and much less so in December 2023.
Based on data we have through July 2021, demand for crude in the US has been increasing since April 2020. The average rate of increase annually based on OLS is about 1415 kb/d per year from April 2020 to July 2022.
We may see a dip in September and October due to fall refinery maintenance, as occurred in 2019. Though in 2018 refinery utilization rates dropped a lot less than 2019, so there is variation year to year.
https://www.eia.gov/dnav/pet/hist/LeafHandler.ashx?n=pet&s=mcrrius2&f=m
I agree that OPEC might be reducing output because they believe that demand may be falling. I think OPEC is misreading the data, if that is the case. I think it more likely that OPEC is looking at falling oil prices and wants to see them increase. I believe the supposed “voluntary cuts”, which will be more like 1000 kb/d rather than 2000 kb/d is mostly jawboning to stop the slide in oil prices. It may be that the “voluntary cuts” do not occur in November and December, especially if we see a spike in oil prices when SPR releases cease.
Dennis
To get the right trend one needs the look at the peak months, typically July and August. I have added arrows to your chart. As can be seen July/August 2019 is the highest. J/A 2021 is lower than 2019. J/A 2022 saw a further increase over 2021 but lower than 2019.
As I noted above, January 2022 opened higher than 2019. Then the price of crude rose and demand dropped. What will be interesting to watch is whether December 2022 exceeds July 2022. Typically there is a rebound but not quite as high as J/A.
Ovi,
I agree using 12 month cycles makes sense, picking just a couple of data points does not in my opinion. If do the regression on August 2020 to July 2022 (24 months) we include all seasonal data over 24 months, the result is an annual rate of increase of 1399 kb/d per year. For past 12 months the rate has been lower 1068 kb/d per year.
We have different ideas about the proper way to analyze trends in a data set.
I agree demand in July 2022 is less than July 2019, lets say the trend of the last 12 months continues, in that case July 2023 demand would be higher than July 2019.
Also the US is not a great proxy for the World in my opinion. Most of the growth in demand will come from China and India rather than US and Europe.
Dennis
I would agree that there may be more growth potential in China than the U.S. However, when the US grows, China and the rest of the world will grow but all at different rates.
I have been wondering about the China zero covid policy. I wonder if there is an alternative reason for that policy. It does reduce crude demand. Could this be their way of helping to keep the price of crude down?
As for next J/A, it will be interesting to see what happens. I am hoping you are right that it will be bigger than 2019 since that just might put stress on the OPEC supply chain and would test its real capabilities
Ovi,
I agree 100%, the rates of growth will be different in different places, but the forecasts I have seen predict greater demand growth in China and India, which makes sense because their rate of real GDP growth is roughly twice that of Europe and North America and demand for oil correlates strongly with real GDP at the World level over the past 50 years. It is possible this will change after 2030 to 2040 as limited supply and high oil prices speed a transition to other forms of energy for land transport or at minimum greater efficiency for ICEVs.
Ovi
Regarding your speculation on China’s rationale for dealing with Covid 19, my own take on their approach is that the Chinese are not stupid, and they are long term planners. They are preparing for fighting the next pandemic which could well have mortality rates in the double digit range, by developing support capacities for food and utilities, core public services and efficient communication and lockdown procedures.
Price of WTI in 2022.
If it’s not too hard, maybe a chart going back to 2000 on WTI, with gasoline and diesel would be interesting.
SS
Generating the charts is not a problem. Making them look useful is. I have charts starting in 2006 for ULSD and RBOB. These two only came out after 2000 and they are what is being sold now.
I have two charts. A long term one which shows the difference between RBOB and ULSD at only a few points. One thing is clear, they move together.
Also attached is a short term chart that better shows the gap between ULSD and RBOB.
Short term chart
WTI
Thanks Ovi.
I agree all three do move together.
But it does seem to be the $4 and $5 per gallon price points are possibly a psychological matter regarding reducing discretionary demand.
Maybe diesel prices aren’t as high in other areas as they are in the Midwest. In the Midwest they are high.
In fact, gasoline dropped today to $4.06 from $4.10 yesterday, while diesel jumped from $5.69 yesterday to $5.99 today.
SS
Maybe $4/gal is the new normal that people won’t like but will have to. Hopefully they are feeling relief that it is down from $5/gal. It seems that California is a more expensive market. Is that because they have more millionaires out there?
Ovi,
A lot of the western states have higher fuel taxes. California about 55 cents per gallon vs 30 cents in Wyoming and 20 cents in Texas.
Russian oil exports fell like a rock in September, yet what reports we could ferrett out, said production was either higher or flat. What can we believe? If those production reports were correct, then where are they storing all that oil they didn’t export. After all, there is a huge recession in Russia right now, so they should be consuming a lot less oil domestically.
Russia’s Oil Revenues Drop To The Lowest Level This Year
Falling crude oil prices and declining oil exports resulted in a $3.2-billion drop in Russia’s oil revenues to $15.3 billion for September, the lowest monthly oil export revenue for Moscow this year, the International Energy Agency (IEA) said on Thursday.
Total crude oil and oil product exports out of Russia fell by 230,000 barrels per day (bpd) to 7.5 million bpd in September, the IEA said in its Oil Market Report out today. The September oil export level was 560,000 bpd lower compared to Russia’s oil exports before the invasion of Ukraine, the agency estimated.
Russian oil exports to the European Union fell by 390,000 bpd in September compared to August, the IEA’s data showed.
“With less than two months to go before a ban on Russian crude oil imports comes into effect, EU countries have yet to diversify more than half of their pre-war import levels away from Russia,” the agency noted.
The IEA also warned that the EU embargo on crude oil imports from Russia and the ban on maritime services that go into effect in early December could lead to further production losses from Russia.
The EIA’s Short-Term Energy Outlook has World liquids declining by 760,000 barrels per day in October, this month.
The EIA has the ratio of liquids to C+C rising considerably. Since the peak in November 2018, to June 2022, the last C+C data we have, liquids are down only 3,536,000 barrels per day while C+C is down 5,207,000 barrels per day.
I have posted the data inside the chart below.
From Giovanni Staunovo :
Saudi crude inventories were at 141.603mb in August vs 142.058mb in July according to JODI.
Wonder if this had anything to do with their production cut?
I’m wondering why these storage levels didn’t rebound significantly during Covid. I’m also wondering how Jodi gets this information. Easy to understand how they make approximations of crude shipped, much harder to understand how they can estimate stored oil.
Stephen,
Nations report these levels to Jodi.
Exxon’s Russian oil output collapsed after rejecting local tanker insurance Bold mine
HOUSTON/NEW DELHI, Oct 17 (Reuters) – Oil output at the giant Exxon-led (XOM.N) Sakhalin-1 Russian Pacific project collapsed following the U.S. major’s refusal to accept local insurance for tankers after Western insurers pulled out due to sanctions, several industry sources told Reuters.
Western insurers withdrew cover from tankers operated by state-run Sovcomflot (FLOT.MM), Russia’s biggest shipping group, which was sanctioned following Moscow’s invasion of Ukraine.
SNIP
Oil output at the Sakhalin-1 project fell to just 10,000 barrels per day (bpd) earlier this year from 220,000 bpd before Russia invaded Ukraine on Feb. 24.
Exxon and Russia have had quite the falling out:
https://www.reuters.com/business/energy/exclusive-exxon-exits-russia-empty-handed-with-oil-project-unilaterally-2022-10-17/
Reuters reporting US has 14 million BO left to release of the 180 million BO SPR release committed to this spring. Also reporting Congress had long ago mandated another 26 million BO release in FY 2023, which began October 1, and that it is planned to release that soon also.
Will be interesting to see how another 40 million BO affects the crude market, as well as what happens when the releases stop.
Really has been a significant amount of crude oil released from SPR. Was at 640 million at the beginning of 2021.
Oil is coming down – right to the midterms.
That’s important, to bribe the voters voting “progressive”. Could be an idea of our government.
Is oil prices coming down because of SPR releases or is price of oil coming down because there are collateral issues in REPO markets that are making it harder for those who are long oil futures to stay in their positions?
Those Italian bonds or bills that account for 45% or REPO collateral in eurozone are under stress.
Just something to think about.
What’s about the stock markets? Here enough collateral is still available to fund all this long and short squeeze games they are doing.
When all the margin accounts are pressed with collateral (and rising interrest) issues, there should be a more severe market down turn, similar to oil. And there is still a lot of hot air in the tech stocks.
Yes, they are playing games in the options market with US stocks creating the spark needed to trigger the CTA machines to chase momentum.
That’s short term gain then they cover. It’s a shit show. The underlying macro is very negative for both stocks and oil prices.
China is falling apart. Europe is falling apart. Collateral is getting harder to come by. Dollars are getting really hard to source. When central banks start tapping the FED for dollar swaps you know shit is really bad. Not that the swaps solve the issue.
Eve of WWIII, perfect time to blow the reserve.
Non-OPEC production, less the USA and Russia, fell by 1,102,000 barrels per day from February to June 2022. Why? This was a time of the highest oil prices this year. Prices spiked in April after the invasion and did not drop below $100 a barrel until well into July.
Oil price news on July 1st.: 1. Market review: On Thursday, the two oil prices continued their decline, and WTI crude oil fell below the key support of 109, down about $5 from the daily high, and closed down 3.47% at $107.53 per barrel; Brent crude oil closed down 2.88% at $107.53 per barrel. $112.19/barrel.
What caused this drop in Non-OPEC production?
Ron
Pure fluke.
– Kazakhstan -460 kb/d. July was up and then pipeline issues dropped August production. See post chart
– Norway -439 kb/d. Summer maintenance. Now back up to 1,793 kb/d. See post chart.
– Canada -132 kb/d, summer maintenance. July was up.
– Total 1,031 kb/d
Thanks Ovi. Nice insight.
It’s not really as simple as that OVI. More nations were involved than those three. I am sure the combined total will be up in July, but not to February levels. Below is what each of those Non-OPEC did in that four months. Everything is in Kbp/d.
-1,321 . World
-460 …. Kazakhstan
-439 …. Norway
-132 …. Canada
-117 …. United Kingdom
-88 …… Brazil
-69 …… Ecuador
-52 …… Azerbaijan
-30 …… Indonesia
-29 …… Malaysia
-17 …… Thailand
-14 …… Brunei
-10 …… Mexico
-1,456 . Total for these 12 nations.
-30…….The combined total of all smaller producers with declines
+419 .. Total combined increase for all Non-OPEC nations, less Russia and USA, that increased production during those four months. The big gainer was Guyana, up 118 Kbpd for those four months.
Ron
I just wanted to point out that the three countries that made up most of the drop, 93.6%, was due to non-geology issues. The rest of the plus and minus countries essentially cancelled each other out. As I noted those three countries have bounced back.
Over the next few months, Brazil, Canada, Kazakhstan and Norway will be bouncing back. Kazakhstan has just announced that they will be able to restore 400 kb/d to its Kashagan field.
The point I was trying to make was that the drop was mostly summer maintenance and unexpected shut downs, such as in Kazakhstan. Looking at your chart, I think that June 2022 is slightly lower than June 2021.
I still think the most significant news in the above post is that September 2022 was peak production out to December 2023. I know it could be wrong but I still think that the EIA tries to get the best info available to make their projection. In fact you used their data to show that all liquids was going to be down in October.
An interesting comment from the September 2021 issue of the OPEC MOMR. Bold Mine:
Preliminary data for Russia’s liquids production in August shows a decrease of 0.03 mb/d m-o-m to average 10.72 mb/d, higher by 0.57 mb/d y-o-y. Total condensate and NGLs output from gas condensate fields is estimated at 1.13 mb/d, the same as July, up by 0.03 tb/d y-o-y. Annual liquids production in 2021 is forecast to increase by 0.19 mb/d y-o-y to average 10.78 mb/d, unchanged, m-o-m.
For 2022, Russian liquids output is expected to increase by 1.0 mb/d to average 11.78 mb/d, with 3Q22 and 4Q22 both expected to reach 11.88 mb/d, the same as in the last MOMR. Although insufficient drilling and brownfield declines may yet impact the forecast.
Ron,
Perhaps they did not anticipate the Russian attack on Ukraine and the sanctions that resulted, not many did.
I know that Dennis, that was my whole point in posting it. Perhaps I should have made that clear. Sorry.
But I also wanted to emphasize what insufficient drilling and brownfield decline would do. Both will be happening from now on. And that will be the case for several years. That means that Putin’s belief that Russian oil production will hold flat at 9.9 million barrels per day until 2025 is really quite absurd.
Ron,
We will see, the Russians have been under sanctions since they invaded Crimea in 2014, though the sanctions are considerably tighter now, we will see how it goes. Keep in mind that OPEC expected that without sanctions Russia would be at 11.4 Mb/d (assuming NGL is about 400 kb/d), Putin’s expectation may be that output can be maintained at close to 10 Mb/d does not seem far fetched, htough perhaps it will fall a bit after 2024, difficult to guess imo.
Dennis, the Crimearian sanctions did not affect oil exports or cause any of the major oil companies or oil service companies to leave. That is a big difference.
Putin’s expectation may be that output can be maintained at close to 10 Mb/d does not seem far fetched.
The EIA doesn’t think so. They have Russian total liquids at 9 Mb/d in March. Anyway, the really absurd thing about Putin’s estimate is he says they can hold production at 9.9 Mb/d for three years. What you and Mr. Putin don’t seem to understand is that even if they can export 9.9 Mb/d, the absence of the majors and oil service companies will cause everything to gradually get worse.
Very important question: What is the basis of your belief that the absence of the oil majors and oil service companies will have little to no effect on Russian oil production?
Not important but what is the significance of 2024 that you mentioned in your post?
Ron,
I believe I said the EIA prediction is likely wrong, the OPEC estimate seems more reasonable. The EIA predicts World real GDP grows at 2.2% in 2023 whereas OPEC predicts 2.5% annual growth in World real GDP, the IMF predicts about 2.7% growth in World real GDP. The OPEC estimate seems reasonable to me, while the EIA is a much less reasonable estimate in my view.
So this is not my estimate it is that of the EIA STEO for Russian C plus C and it is likely too low by at least 1000 kb/d.
Ron,
2024 is my guess as to when things will reach point that production may decline. The 9.5 estimate by the EIA may be similar to what OPEC is predicting for 2023 which is about 10 Mb/d for all liquids production for Russia, difficult to know how things will play out and how long the war in Ukraine lasts.
The 9.5 estimate by the EIA may be…
Dennis, the EIA estimate is not 9.5 but 9.0. And that is total liquids, so that would mean the EIA’s estimate for Russian C+C to be about 8.5 Mbp/d in March 2023.
Just wanted to make that clear. And for one time, I think the EIA is pretty close on this one.
Ron,
The EIA has Russia at 9.3 for all of 2023 (annual average), it falls to 9 Mb/d for one month, I think the EIA is wrong as is often the case. Typically C plus C is about 94% of Russian output, so 9.3 Mb/d of liquids would be roughly 8.74 Mb/d.
Wow, 8.74 Mb/d! We finally agree on something Dennis. I agree with you that the EIA’s estimated Russian production in 2023 is very reasonable.
I was a little shocked, however. The August estimate of Russian C+C production was 10,550 Kbp/d. A 600 kbp/d of that would leave them producing 9,950 Kbp/d. But you now estimate that in 2023 they will be down 1,810 Kbpd from their August 2022 production.
That would put them down 2,560 Kbp/d from their pre-covid level and down 2,340 Kbp/d from their post-covid February high. I am more than a little shocked by your prediction, but by golly, I can definitely agree with it. I think the EIA pretty well nailed it this time.
Reading that a new 250k BOPD refinery is going to be built either at Cushing or in Victoria County, TX. Goal is for it to be powered by renewables and for it to refine North American crude oil.
Company building it is Southern Rock Energy Partners. Estimated cost $5.56 billion.
Now that’s interesting.
SS
Timing
I’m living near a refinery that has a capacity of just a little over that amount. Absolutely printing money. It’s crazy.
But it will take how many years to build a new refinery? And what will the financial environment be like then?
One closed near us a couple decades ago. My wife’s first job out of college was there. It was a decent sized refinery, and would also be making bank now, but back in the early 1990’s the business was super tough. Heck it was horrible when COVID hit.
US to Repurchase Oil For SPR for $67/b to $72/b
Second, the President is announcing that the Administration intends to repurchase crude oil for the SPR when prices are at or below about $67-$72 per barrel, adding to global demand when prices are around that range. As part of its commitment to ensure replenishment of the SPR, the DOE is finalizing a rule that will allow it to enter fixed price contracts through a competitive bid process for product delivered at a future date.
The Administration is announcing its intent to use SPR repurchases to add to global crude oil demand at times when the price of West Texas Intermediate (WTI) crude oil is at or below about $67 to $72 per barrel. This will protect taxpayer interests because the SPR will be repurchasing at a lower price than recent sales, potentially allowing it to repurchase more oil than it released with sale proceeds. It will also help address producer concerns about uncertain demand in future years, encouraging immediate investment.
The current October 2024 futures contract price is $70.20/b. Do they really think some producer in Texas is willing to provide oil to the SPR for that price two years from now and having no idea what inflation might do?
https://www.whitehouse.gov/briefing-room/statements-releases/2022/10/18/fact-sheet-president-biden-to-announce-new-actions-to-strengthen-u-s-energy-security-encourage-production-and-bring-down-costs/
Heck, I figured they thought $67-$72 was way too high.
Cushing is low. Commercial is only where it’s at because of the large SPR release.
Better hope we have hit peak world demand. I am not seeing how they keep a lid on prices without bashing the economy by continuing to raise interest rates.
They keep telling us oil will become irrelevant. Seems it’s more relevant than it has been for a long time.
Shallow, I wasn’t able to respond to your prior question because of the lousy format here. My drilling career was circa late 80’s through mid-90’s. Exclusively directional and horizontal wells, GOM, Gulf Coast, and a year in the WCSB, with forays out into northern and SE Saskatchewan. I did some drilling in shallow wells after that back east, but we’re talking power swivel type stuff and small derrick workover rigs, nothing deep and mostly remedial work in production and injection holes, or doing plugging operations.
Seems to me the refilling announcements are just political butt-covering to deflect criticism for draining it in the first place. Barring a bad new pandemic or similar event it seems improbable the SPR will ever be refilled. While the SPR is a convenient band-aid for short term oil supply disruptions, over a time frame of a few years, the depletion of a couple of days worth of global consumption will fade to insignificance.
At the rate things are going, democracy/voting is going to become irrelevant long before oil will.
Could be?
http://www.smirkingchimp.com/thread/jaime-o-neill/103622/is-anyone-really-minding-the-store
Shallow.
I don’t think peak world demand for oil will happen any time soon.
Protests during 2022 against high oil prices have taken place in 90 countries around the world according to this report
https://www.bbc.co.uk/news/world-63185186
Delboy, surely you must realize that the article you linked to has nothing to do with peak oil demand.
But as life returned to the “new normal” and energy demands increased, suppliers have struggled to keep up with demand which has pushed up prices.
It is all about supplies Delboy, supplies, not demand. The article gives no hint about peak demand, but it is obvious that the oil supply is getting very tight.
Hi Ron.
Shallow Sand used the phrase “peak world demand”, and I was responding to that. The article is all about people around the world, wanting more fuel availability at a cheaper price.
I do have a problem with the term “Peak Demand”. To my mind, it is a term used by those whose intention is to confuse the issue. I studied economics many years ago, and not to a particularly high level, but I was taught that Demand is defined as “want backed by the ability to pay”. This is different from the dictionary definition of the word Demand, which makes no mention of the ability to pay. Thus the man in the street who didn’t take school economics might be misled.
I’m sure someone will put me right with a more up to date definition.
Out to year 2050-
I think it is doubtful that the world will have sustained production in excess of demand [“want backed by the ability to pay”], with the exception of a time of severe and prolonged depression.
I expect production decline due to depletion and geopolitical constraints to outpace any decline in need or want.
Hickory,
I disagree. I think that by 2035 there is roughly a 50/50 chance that oil prices will be falling because demand is falling at a faster rate than demand (in the absence of a severe World recession).
With the Worlds population increasing by 80 million people per year plus many of these people trying to increase their standard of living by burning more fossil fuels, I would say there’s no chance of peak demand happening in the foreseeable future.
Dennis. It will certainly be interesting to watch the race.
I appreciate your perspective.
I’ll bet you a silver dollar on it.
I hope you are correct.
I suppose the slope of the oil price trend in 2035 will tell the answer.
btw- I just ran some numbers and see that the oil production/capita of the world peaked in 2004. Also consider that the number of people who can afford oil derived products is greater than ever before. That number will continue to rise for several decades, with the exception of some years where economic catastrophe drops purchasing power. Prosperity/capita is a big wildcard- It affects how quickly EV’s are deployed, how many children are born, and how much discretionary oil derived product are consumed.
Hickory – Yes – it’s been that way since ~2016. Key exporters (Big 8 – see post above) have in fact lost ~25% of their net export capacity since then (23 MBpD vs 18.5 MBpD). Because these exporters still require somewhere between 20-40% of what they produce, the net effect is more extreme. The non-producing countries pay the price for reduced oil availability:
Japan, Mexico, UK, Germany, Venezuela and Egypt accounting for ~2.5 MBpD loss in consumption from 2016-2021.
In this same interval, oil price (per Bbl) climbed from $32 in 2016, $70 in 2018, then hitting a peak of $110 in 2022. Current breakeven prices for the Big 8 lie somewhere between $80 – $120, can’t imagine we will see too many producers willing to let it go for less than $75…so price volatility will continue, even under lockdown the demand for oil was incredibly strong, maybe only a production pullback of 10-20%, oil’s inelastic nature causes gigantic price swings in order to get producers to either increase production (if even possible) or close production when pricing goes too low.
I think the “demand” game is simply a tactic to scare producers into overproducing their fields, effectively telling them “hey, you better give me all your oil, pretty soon it will be worthless” – it’s so far-fetched that it is hilarious.
Oil price will likely need to climb back up into the 100’s, I see $10/gallon fuel in the US as a real possibility within next 12 months, we shall see…
A new post will be published before the end of today.
Further up, a few comments were made regarding Cdn oil sands companies. Below is what GS thinks. IMO, listed below, is the XOM owned Cdn subsidiary.
Goldman Sachs on Q3 Expectations for Canada’s Oil Sands Producers
11:27 AM EDT, 10/17/2022 (MT Newswires) — Goldman Sachs on Monday offered its take on expectations for third-quarter results from Canada’s largest oil companies, a list that includes Canadian Natural Resources (CNQ.TO), MEG Energy (MEG.TO), Cenovus Energy (CVE.TO), Suncor Energy (SU.TO) and Imperial Oil (IMO.TO).
“As investors look across subsectors in energy, one sector that continues to come up in conversations as screening attractive from a valuation perspective is Canadian Oils,” the investment bank said in a report. “Investors have queried why this valuation discount has persisted, and some have attributed it to ESG and others more so to challenged execution. In the near term, many investors believe widening WTI-WCS crude differentials have been weighing on the equities, particularly CNQ and MEG, as well as expectations for negative revisions into 3Q earnings. In our conversations around upcoming results, investors appear most concerned around CVE results given potential for weaker refining performance and uncertainty around Toledo, as well as CNQ/MEG due to commodity price exposure driving negative sequential moves in cash flow. For SU and IMO, investors appear less focused on the quarter and more focused on upcoming strategic updates around capital returns for IMO and leadership changes/asset optimization at SU.”
More oil than not so I thought I’d post it here. This is a must read.
OPEC⁺ and the diplomatic relationship between Saudi Arabia and the United States
https://www.bakerinstitute.org/research/opec-phenomenon-saudi-russian-cooperation-and-implications-us-saudi-relations
Excellent summary!
Biden just told oil companies to quit buying back their shares and invest in pumping more oil. He is guaranteeing them $70/b.
I guess that is also puts a bottom on the price of oil.
New posts are up
https://peakoilbarrel.com/opec-update-october-2022/
https://peakoilbarrel.com/open-thread-non-petroleum-october-19-2022/
Here’s an interesting look at the top 11 oil exporters, some have faded away (Nigeria, Angola), while others have have generally held their ground. Only country to grow significantly is Brazil. What is impressive is that in <10 years the peak value of their oil exports has dropped 50% from ~$1.4 Trillion in 2012 to ~0.7 Trillion in 2021. Role of the US shale oil likely playing a big part, peak oil also expected to play some type of role.
For almost all of the exporters, their fiscal deficits turn sharply negative after the 2012 timeframe, clearly they are not getting the price they need for their oil.
In contrast, US deficit fell from -13% in 2009 to a low of -3.5% in 2015.
It's very clear that peak oil covers a time period of ~2005 – ~2015, from a financial and production standpoint, I don't believe these top 11 exporters will get back to 50 MBpD.
In fact, 2022 estimates suggest a drop of between 5-10% for this group from 2021 (maybe Ovi/Dennis/Ron can check this, seems pretty high!).