The Texas RRC Oil and Gas Production Data is out. There appeared to be no decline in December production and may have even been a slight increase.
The Texas RRC data is incomplete and only gives an indication as to whether Texas production increased or decreased. The data appears to droop because each month the the Texas Railroad Commission receives a little more data and the totals increase, little by little, month by month, until after many months the data is complete.
In my charts I post the past six months of data in order to give some indication as to whether production is increasing or decreasing. The final data is through December and the EIA data is through November.
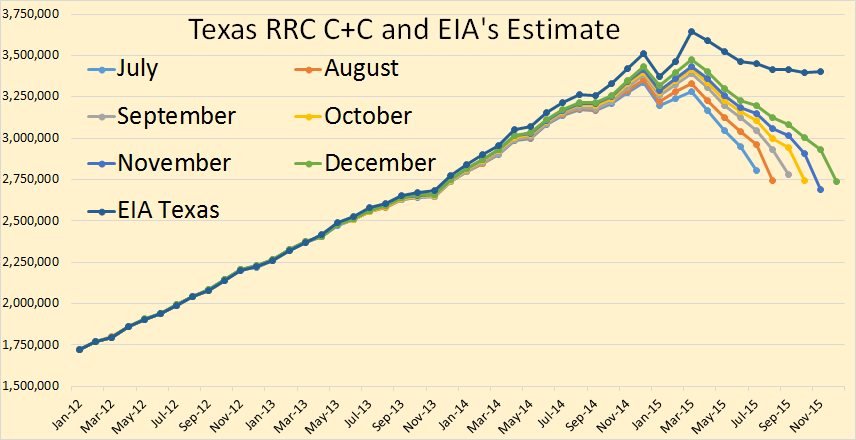
Texas crude plus condensate declined a little in November but seemed to make up that decline in December. Total Texas C+C seems to be on a flat plateau, declining in Eagle Ford but making up that decline in the Permian and the rest of Texas.
The EIA estimates the final Texas data through November. They have Texas peaking in March and down about a quarter of a million barrels per day since that point.
Dr. Dean Fantazzini, Deputy Head of the Chair of Econometrics and Mathematical Methods in Economics at the Moscow School of Economics, Moscow State University, has worked out an algorithm that predicts what the final production numbers will look like. He has C+C relatively flat the last few months and slightly above the EIA estimate.
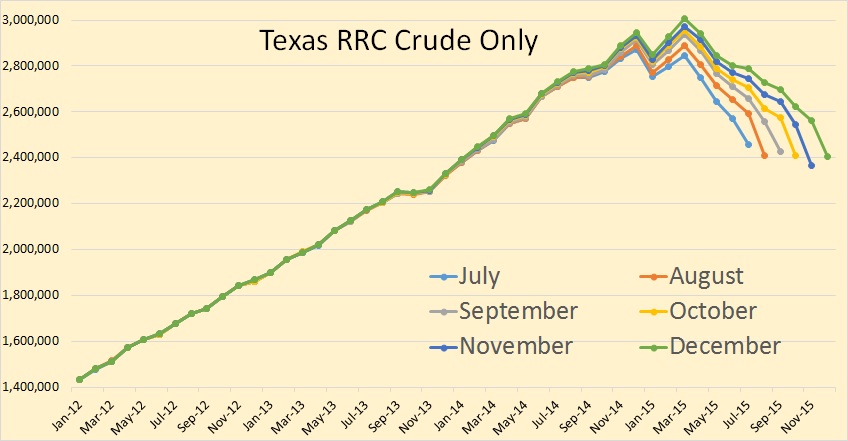
Texas crude only shows basically the same pattern as C+C.
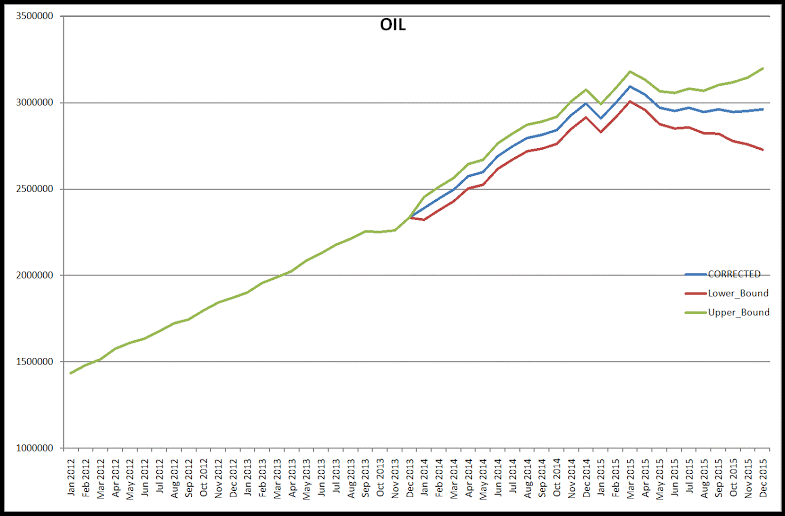
This is Dean’s estimate of what the final Texas crude only production will look like.
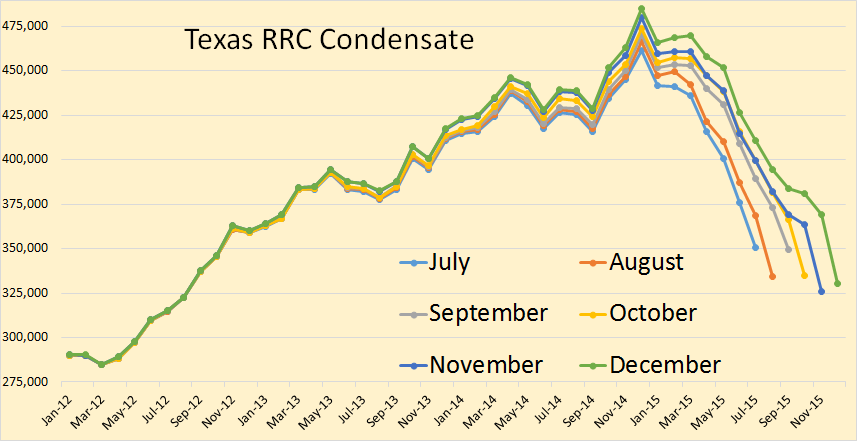
Texas condensate seems to have a slightly steeper decline than does crude only and peaked in December rather than March when crude only peaked. I use the term “peaked” to mean “peaked so far” and am not implying that it is the final peak. Only time will tell whether it is the final peak or not.
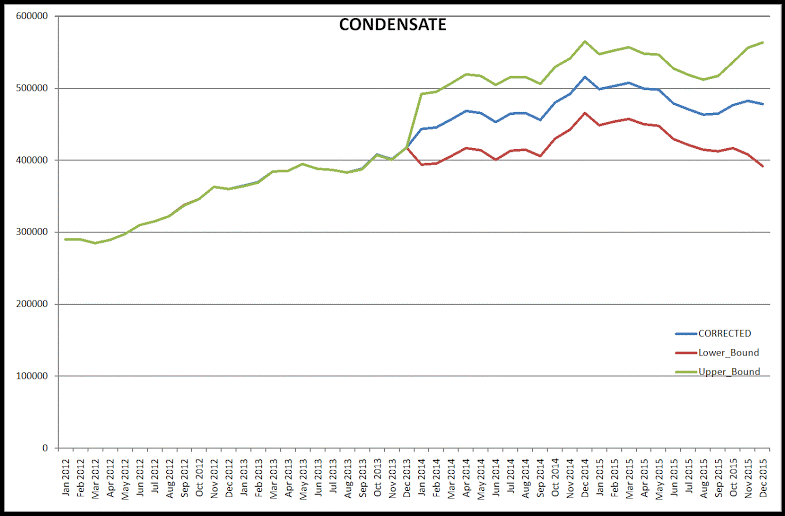
Dean’s data agrees that condensate peaked in December.
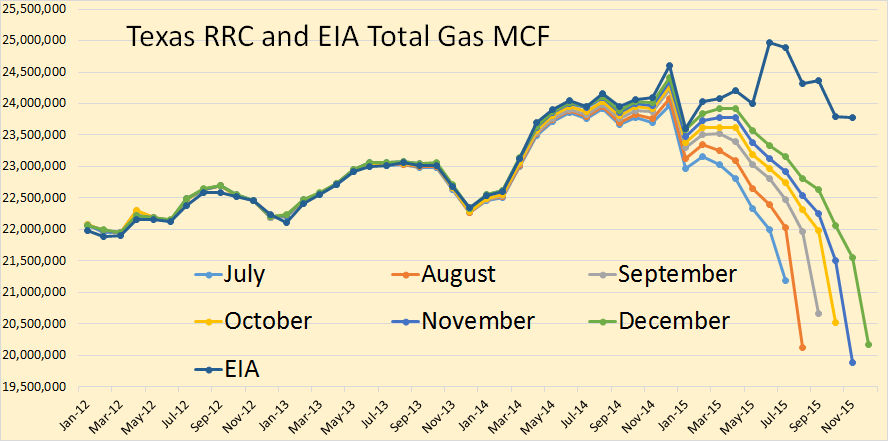
Texas total gas production, according to the EIA, peaked in June, so far, and now seems to be declining a bit faster than oil.
Dean shows Texas total gas production on a plateau with a slow decline. He has Texas gas production, in November, slightly above the EIA’s estimate.
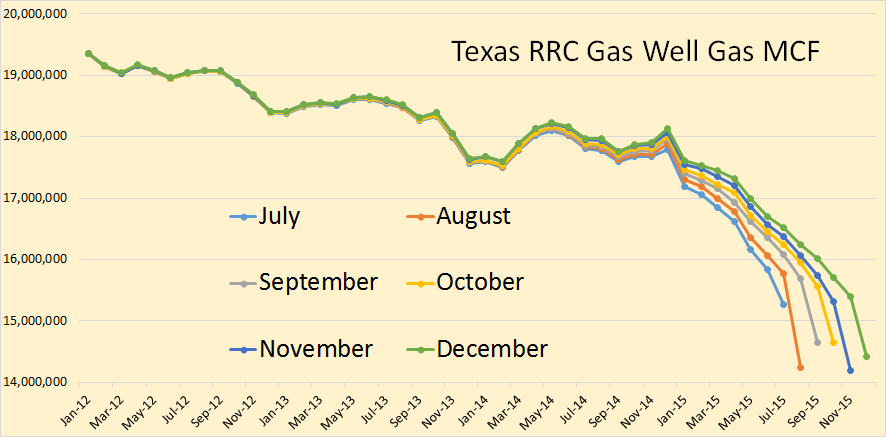
Texas gas well gas actually peaked in early 2009 and has since been in a slow but steady decline.
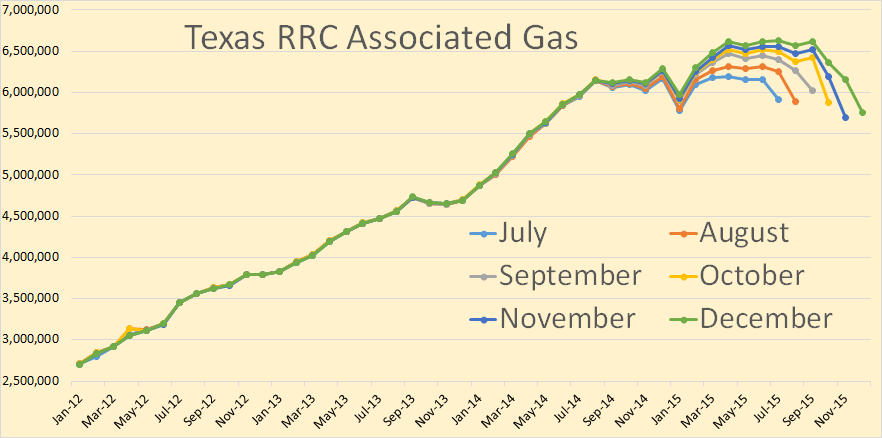
Texas gas production has been kept increasing by the increase of associated gas. The shale oil boom is largely responsible for the increase in Texas associated gas.
414 responses to “Texas Oil Production Still on a Plateau”
Available for pre-order http://www.amazon.com/The-Oracle-Oil-Geologists-Sustainable-ebook/dp/B00ZAT8WWO
While Marion King Hubbert was a revolutionary in oil industry, forecasting that American oil production would peak surprisingly soon and decline steadily thereafter, Marvin Minsky was a similar revolutionary in economics pointing out inherent instability of casino capitalism.
He advanced so called “Minsky financial instability hypothesis” which postulates that the booms and busts are inevitable under neoliberalism (aka “free market economy”) due to the nature of financial system ( https://en.wikipedia.org/wiki/Hyman_Minsky ):
What we experienced in July 2014 can probably be called “Minsky moment” for oil industry (although it is not the exact meaning of the term).
Here is a fragment of his review of Susan Strange book “Casino Capitalism” (
http://digitalcommons.bard.edu/cgi/viewcontent.cgi?article=1157&context=hm_archive ):
Just a niggle:
Thanks.
Hi all,
I noticed that Dean Fantazzini’s estimate for C+C for Texas is a little higher than the EIA estimate. The Nov 2015 estimate by Dr Fantazzini is about 115 kb/d higher than the EIA estimate. The December estimate for TX C+C output is only 70 kb/d less than the peak in March 2015 (3628 kb/d vs 3558 kb/d). I think Dean’s estimates are the best I have seen so this is worth paying attention to in my view, I expected output would have fallen by now. It has increased slightly from a low of 3487 kb/d in August to 3558 in Dec 2015. I couldn’t distinguish the blue and purple well on the Chart prepared by Dr Fantazzini, so I used a dashed line to make it clearer (for my eyes).
The post above used the wrong chart.
Chart below is correct same as in Ron’s post, but with a dashed line for EIA data to make it clearer to me, basically there is little difference between Dean’s estimate and that of the EIA (though my guess is that Dean’s estimate is better where there are any differences.)
Why wouldn’t we call the EIA liars in reporting far more Texas oil production than the RRC?
Critics say they are not lying as their difference with the RRC is initial reporting vs. final estimated reporting. If that critique were valid, then why is the oil production drop by the RRC from peak triple the fall that the EIA reports for Texas?
Coolreit, I don’t understand your complaint. The Texas RRC drop is not triple the EIA, all the data just is not in yet. More data comes in every month and after about two years or so they are equal, or almost so. Just follow the data back. The further you go back the closer they get until they eventually merge.
No, the EIA is not lying. Their guesstimate is actually pretty good.
Really? EIA keeps moving the old Texas numbers downward, and still way off. Texas is now reporting their cumulative numbers with both oil and condensate, now. I am quite sure the March 2015 numbers are no longer going to go up substantially, and that is around 106, 500, 000. EIA has it at close to 113, 000, 000. Substantial over statement by any stretch of the imagination. As I recall, they originally had it at around 115,000,000. Guess they can move it down within a year, and we can say how great the EIA’s estimation is, because it almost matches actual. Poppycock.
In reality, EIA and everyone who tries to predict Texas production based upon late reporting, may not be using the most current situations. My guess is that there is probably not more than a four month look back to get close to the right numbers. Not as much going on as there used to be. If so, that would make EIA numbers pretty far off. I remember looking at junk that were permits filed at the end or beginning of the year, and could see that there were a lot of low producing wells that just didn’t make it to the reports until then. Sometimes, almost a year back. Then too, I noticed some attempted slight of hand reporting that did not report excellent wells due to the fact the company obviously was trying to get the other areas around it. Some very late reporting on that stuff. Most of that is pretty much gone, now. I think they are caught up within about the last three months, based upon the completions I have been reviewing. Maybe not, but certainly a lot better guessing than what comes out of the EIA.
The EIA uses past data to extrapolate forward, they don’t make prognostications or employ oil prophets. No crystal balls either. I am sure very few people saw the price drop coming and the ensuing problems it would cause for oil producers.
The EIA only deals with data. So their downward adjustments would lag, as would any upward adjustments for the Texas numbers.
Hi Guy,
The current EIA estimate for March 2015 is 112,977 kb. and the RRC estimate is 107,761 kb or 4.8% lower than the EIA estimate, this is in line with the usual performance of the RRC PDQ reporting, they are very careful to get the data right, if there is any question about the data it goes into the “pending datafile” while the problem gets resolved.
It would be better if this data was just posted to the PDQ and then revised monthly, but I don’t run the RRC. It takes 24 to 36 months before the PDQ data gets to within 1% of “actual” output, it is what it is, they could learn a lot from the NDIC which does a far better job.
Ron:
I am not looking at EIA vs. RRC on a same month basis. I am looking at 8 month changes for RRC vs. EIA. RRC is down nearly triple in the last 8 months vs. what the EIA is reporting for the same 8 months.
I am with Ron on that part. Triple? For the same period as what you are to be looking at, I see maybe 10% over by the EIA. Their nimble numbers. Heck, I really can’t be sure there is actually a plateau. They completed only about 60% of the wells they did as before, so maybe they had time to post more online.
I am no fan of the accuracy of EIA, either. Any lunatic can balance weekly figures with a half million dollar plug for daily production. Was the plug for production, imports or what? Gimme a break
No, you still don’t understand what is happening. The RRC data is incomplete. The EIA data is just an estimate of what the complete data will look like when all the data is finally in.
The RRC data dribbles in. The latest months are the most incomplete and finally after a couple of years it is complete or nearly so. At that point the EIA matches the RRC data.
Look at it this way. The RRC data is just not all the data. The EIA data is all the data, or their estimate of all the data. And it will likely turn out to be a pretty good estimate.
I understand the concept. Then apply that to March 2015, which is 10 months past. Within 14 more months they are going to come up with 6.5 million more barrels of oil. Seems a stretch.
Hi Guy,
I think Ron meant that Coolreit doesn’t understand, if so I agree.
He seems to believe that the RRC data is complete, when for the most recent month reported it is about 30% too low (or only 70% of output gets reported). It takes about 25 months (or back to Jan 2014) before 99% or more of the full data is reported in the PDQ based on the past history (comparing Feb 2014 data from the RRC with Feb 2016 data from the RRC’s PDQ).
Hi Guy Minton,
It takes a long time for all of the oil to show up in the RRC’s PDQ, though there may be other reports (for taxes and such) that are more complete.
If we look at the RRC data that was in the PDQ from Feb 2014 (I saved it in a spreadsheet) and compare 11 months earlier (March 2012 data point) with the Feb 2016 reported output of C+C in March 2012 (which is probably very accurate), the old data point is 5% lower than the current data reported in the PDQ.
If the current reported data for March 2015 is too low by 5% that would be about 173 kb/d too low and the proper estimate would be 3650 kb/d of C+C output in Texas in March 2015. The EIA estimate is 3644 kb/d and matches very well.
I agree with Ron, the EIA estimates are pretty good, not perfect but good enough.
Hi Coolreit,
Nobody is lying. The RRC only reports some of the data in the PDQ, for the most recent 24 months the EIA data is a much better estimate of Texas C+C than RRC data from the PDQ.
Someone did something like this back in the Oil Drum days.
The world burns 1.26 trillion U.S. gallons per year.
The volume occupied by 1.26 trillion U.S. gallons is about 1.25 cubic mile.
The world burns about 1.25 cubic miles of oil each year.
So lets slice that cube up and see what we can cover with it.
There are about 80,000 Inches in 1.25 miles so we could cover 80,000 square miles with an inch thick of oil.
Now lets slice it 1/32 of an inch and we get 2.5 million square miles.
A 32nd of an inch layer of oil might not seem like much but put that much on your glasses and it would make it nearly impossible for you to see through.
US is 3.8 million sq miles
In a little over a 1.5 years we covered the entire US in a 1/32 inch thick layer of crude oil. What a mess!
World land surface area is about 57.5 million sq miles.
It takes us a little over 22 years to cover all of the land area on the planet.
Worlds oceans is about 140 million sq miles
In about 56 years we covered all the oceans in the world in a layer of oil
Earth has 197 million square miles of surface area.
So over the last 80 years we have more than covered the entire planet with a 1/32 inch layer of crude oil.
Now add in coal which is about another 1 cubic mile per year equivalent and you can almost halve those time frames, also making the 1/32 layer completely opaque, way more toxic, and very very messy.
Better yet, let’s burn the fossil fuel so we can travel around aimlessly breathing it and pretend it’s harmless to humanity
After Hadrian no competent measures were taken to protect the forests that remained. Today the few cedars that majestically stand at Bsharri are testimony to the ruthless exploitation through the ages by state and individual of the magnificent coniferous cedar forests of Lebanon.
http://forestcouncil.org/cedars-of-lebanon-the-backbone-of-ancient-traditions-and-culture/
Trees? Cut them as fast as you can for centuries and eons. Oil? Burn it all, who cares?
It doesn’t matter, humans will mow it down and pump it out, what have you, they’ll get that stuff done.
http://www.zerohedge.com/news/2016-02-21/panic-below-surface-banks-are-selling-energy-loans-cents-dollar-ensure-their-own-sur vival
As one banker put it, “we are looking to save ourselves now.”
It’s an election year. Harping on 250K firings is good strategy by the drillers because that, rather than shareholder loss, can push populist candidates to request the bailout from the Administration.
In comments, out of the clouds and convolutions, it’s little nuggets of synthesis and insight that I appreciate.
Mechanical
Watcher,
Non-conventional type of bailout already did occur and it is ongoing but only for shale portion of the oil industry. The only question is what Exxon’s and Chevron’s did to “deserve” this? I know hard to believe but we are at the point to shed tears for the conventional majors 🙂
Pssst. . .. .
http://www.zerohedge.com/news/2016-02-21/us-government-breathing-down-neck-large-banks-limit-their-energy-exposure#comments
Watcher.
I’ve been too caught up with figuring how the heck we, with zero debt (so far) are going to get through this $20 oil mess.
After running some numbers (I really need to buy software) I feel it likely that, on the whole, PV10 of lower 48 US oil and gas production is likely minimal in relation to the debt related to it at $30 WTI and $2 HH. Maybe something like 10-30% of the debt.
The problem, of course, is that well head realizations are between $8-27 for most oil and $.50-$1.50 for most gas.
For example, if I offered to give you Continental Resources or Chesapeake, provided you had to personally guarantee the debt, would you take it?
Look at Denbury Resources. They have shut in 2,300 barrels of oil production per day. Their operating costs, plus severance taxes, general and administrative expenses and interest are more than what they can sell their current production for. And they have $3.3 billion of debt. This is a 70,000 bopd company.
Same hold for California Resources. Almost zero PV10 when G & A and interest is included, and they have over $6 billion of long term debt.
Every MLP, I suspect, has zero PV10 when G & A and interest are figured in. I’d estimate they represent half a million boepd, if not more.
Sandridge, Ultra Petroleum, not small companies, likely minimal PV10, billions of debt.
After seeing where Denbury is at financially, really have to question OXY. They are the biggest CO2 producer in the US. Think about the P & A liabilities in total for their entire CO2 portfolio. At least OXY spun CRC, imagine if they still had that $6 billion of additional debt.
The supposed best company in the best basin is PXD. For crying out loud, $3.2 billion PV10 at $50 WTI. $3.2 billion of long term debt.
Heck yes, the OCC told the banks not to mark to market. If they did, every stinking reserve based loan would be called.
This $20 oil sub $2 gas is so surreal, you don’t see the forest for the trees.
If the US government is in any way behind this price collapse, they out to have their heads examined. Another dang TBTF created.
If you buy, you’re not buying on presumption of an oil price increase.
You’re buying on presumption of bailout. You’ll have to pick your instruments well because common stockholders were indeed smashed when banks were bailed out.
Buffet injected capital via preferred issues. Maybe a better plan would be conversion of debt into subordinated convertibles. You’re almost off the radar screen that way. You take a position, you won’t be part of common if the bailout kills all common holders.
There is GM, though. They wiped out everyone to save the union. Complete violation of all legal precedent, but it was “in the best interests of everyone (except the shareholders and bond holders) to forget that”. So playing the 250K firings card is a delicate thing.
The executives get to keep their jobs (or maybe more important their 401Ks and pensions get funded) and that may be all they care about in that scenario. It’s an easy rationalization to reach. “We’re already bankrupt. I’m not hurting the shareholders any by protecting my pension (and those of the workers) because they are already wiped out.”
Watcher,
“If you buy, you’re not buying on presumption of an oil price increase. You’re buying on presumption of bailout.”
That’s a very good point. Thank you !
Bailing gm out in the first place was also a complete violation etc
Always annoys me that bond holders got so self righteous on having their hands out but thought the workers should get nothing
The law making bondholders top priority is not a moral choice. It’s math. Tell them a priori that the law won’t be followed. Tell the union a priori that the law won’t be followed.
The union would elevate their pay demands because they can’t lose, even if the company is driven under.
Except that the bondholders would never have loaned money. There would have been no GM for the union to drain. Doing things as done was outright theft and total denial of recourse.
But don’t sweat it. We’ll see it again. Soon. And it will be even more apparent it is an argument over printed pieces of paper.
The law making bondholders top priority is not a moral choice. It’s math.
I never hear of that law. Bondholders are third in line after a bankruptcy, just ahead of stockholders.
Who gets paid first in a business bankruptcy?
1. First priority for debt repayment usually goes to persons who become creditors after the company files for bankruptcy.
2. Secured creditors, such as banks lending money backed by a mortgage on real estate, typically bargained for a lower level of risk.
3. General creditors, such as suppliers of goods and services, and other lenders and bondholders,…
4. Stockholders are last in line. They own the company and take greater risk. Stockholders can make money if a company does well, but they can lose money if the company does poorly. The owners are last in line to be repaid if the company fails.
Though bondholders are third, they are still grouped in there with “general creditors”, such as suppliers of goods and services and other lenders. So even though they are third, they still must battle it out or divvy up the remains with all the other “thirds”.
In other words, they are generally left with nothing, or at best, next to nothing.
Nah, you don’t understand bonds.
There are collateralized bonds (and certainly collateralized debt obligations) and there are bonds that are part of the DIP money. That puts them first.
Whoever described that called unsecured debentures “bonds”, which they are, but that’s a small subset of bonds.
Oh and btw the DIP folks have to get agreement from the first lien guys (higher priority bondholders). You can’t just declare top priority bondholders lesser priority after the filing because the company wants BK emergence to be funded by DIP. Usually they can get that agreement haha because often the DIP money is from those same bondholders.
A bond is a loan. A bank’s loan document is a bond. This isn’t complex. Only real diff is trading and that’s not relevant here.
oooh this is new:
In 2012, A trust representing “old” GM’s unsecured creditors filed suit in the Southern District of New York against GM over payments made to hedge funds in 2009 in exchange for waiving of claims against GM’s Canadian subsidiary. The deal, of which Judge Robert Gerber says he was unaware – despite its disclosure in an SEC filing on the day GM sought Chapter 11 protection – could prompt a reopening of the 2009 case.
hahah NOT A CHANCE IN HELL, regardless of validity.
Nah, you don’t understand bonds.
There are collateralized bonds (and certainly collateralized debt obligations) and there are bonds that are part of the DIP money. That puts them first.
Bullshit, I do understand bonds. I used to sell them. A collateralized bond is nothing but a bundled junk bond, bundled with other junk bonds in order to reduce the risk.
Collateralized Bond Obligation
A collateralized bond obligation (CBO) is a bond that uses a variety of high-yield junk bonds as collateral. These bonds are separated, or pooled, into tranches with higher and lower levels of risk.
Collaterizing a bond does not move it higher on the payout list. It just bundles it with other junk bonds in order to reduce the risk.
Bonds never, ever, ever, come first. They are next to last on the payout list, right in there fighting with other creditors. Bundling the bond does not change its ranking in the payout order.
Important: A collateralized bond cannot be a bond from just one company. By definition it is a bundled bond, bundled with many other junk bonds. All of those companies will not go bankrupt at the same time so a bundled bond is safer. Only a portion of the bond can be lost if one of the bundled bonds goes belly up. But the one that does go belly up is at, or near the very bottom of the list, just ahead of stockholders.
Watcher, if you wish to make a point then you should post a link that proves your point. You know… like I do.
America is the prey, not the predator.
Shallow,
Look at Denbury Resources. They have shut in 2,300 barrels of oil production per day. Their operating costs, plus severance taxes, general and administrative expenses and interest are more than what they can sell their current production for. And they have $3.3 billion of debt. This is a 70,000 bopd company.
A pretty typical story. The true cost of the extraordinarily low rates and availability of cheap credit since 2008 is the misallocation of resources up to and including emergence of a class of Ponzi borrowers (see below). In other words stability of 2010-2014 in oil sector was highly destabilizing.
As Art Berman noted
http://oilprice.com/Energy/Oil-Prices/When-Will-Oil-Prices-Turn-Around.html
Essentially he described what Minsky called “Ponzi borrowers”.
Following Minsky the key mechanism that pushes a given sector towards a crisis is the accumulation of Ponzi debt.
From wikipedia:
https://en.wikipedia.org/wiki/Hyman_Minsky
As soon as the use of Ponzi financing of operations became widespread the bubble is ripe for popping. When for some reason the asset prices stop increasing and start doing down, Ponzi borrowers go down with some time lag.
That changes attitude of lenders dramatically and they start tightening the conditions of borrowing and make it more difficult to roll over the debt even if interests payments were paid on time.
Dominoes start falling. That means that speculative borrowers follow Ponzi borrowers as they can no longer refinance (roll over) the principal even if they are able to cover interest payments.
Collapse of the speculative borrowers can then bring down even hedge borrowers, who are unable to find loans despite the apparent soundness of the underlying investments.
I hope the government will provide some lifeline at least by allowing refinancing of the loans so that the complete collapse of shale/tight oil bubble is avoided.
I know hard to believe but we are at the point to shed tears for the conventional majors
No tears from me! If it were up to me I would prosecute the management of those companies for crimes against humanity!
It seems that scientists from the AGU are also taking a stand against these companies!
http://blogs.scientificamerican.com/guest-blog/taking-a-stand-for-scientific-integrity/
More than 100 Earth scientists, ourselves included, have signed a letter urging our preeminent professional society, the American Geophysical Union (AGU) to cut financial ties with ExxonMobil. We are joining the growing chorus of scientists who refuse to turn a blind eye to the destructive behaviors of the industry partners of our profession, ExxonMobil being the most egregious. We hope that this action will inspire our community to embark on an open assessment of the role of fossil fuel companies in the Earth sciences.
Since the drug laws apply to both sellers and consumers, shouldn’t the criminal prosecutions also apply to consumers of fossil fuels?
J. Brown,
You have hit upon one of the shameful acts of civilization. We are still treating mental patients in horrible and shameful ways. It will take a bit more growing up before society separates the criminals from the addicts and starts medically treating addicts instead of treating them to exaggerated prison sentences and filling the pockets of their private prison cronies.
The problem is not addicts, the problem is the legal and social system addicted to punishment. Doesn’t work in this case, does it?
Fred,
I know where you are coming from but all I am trying to see through the fog of lies and disinformation. This whole oil price crash is not about renewables , or how big our carbon foot print is and if people should feel “not good enough” because of that.
This is power struggle between two opposite approaches between two camps. Elite is split along the lines who has more to lose between two approaches: continuous world conflict or cohabitation and gradual shifting of power to other parts of the world. Everything points that Bankers & Big Oil are in two opposite camps. Rest of us, including small & medium oil, are just collateral damage in all of this.
Do you really believe that these critical articles about Exxon are just suddenly appearing after 100 years of pumping oil? Do really believe that Bankers via their shale pet project just pumped 4.5 mbpd within just 6-7 years for reason of profit? There is no profit. Don’t you see the blame game and the deflection from the bankers that Saudis are “flooding” the oil market? Saudis are “flooding” oil as much Norwegians are “flooding” and that is – same as before. Do you see that only shale are the “chosen one” and have a luxury of keeping the credit lines open while Big Oil is forced cutting dividends for the first time in 100 years? Too many things are pointing to this struggle that would make this just coincidence.
Ves,
This is power struggle between two opposite approaches between two camps. Elite is split along the lines who has more to lose between two approaches: continuous world conflict or cohabitation and gradual shifting of power to other parts of the world.
Very interesting hypothesis. Thank you !
Now one question.
Was not Jeb! a representative of Bush clan and by extension Big Oil in the current race ?
If so, then please note that he is a typical neocon (former member of the Project for New American Century; with Wolfowitz as a political advisor).
Also it was an oil man Bush II who got us into Iraq.
Those facts make your hypothesis about Big Oil being against imperial adventures somewhat weaker.
Just asking…
likebz.
The whole game that we get through media is deception game so if we analyze what is really going on by sticking to the “labels” we could get confused because nothing makes sense. So the first thing is to acknowledge that there is a constant change of influence and power. So the power and influence is ALWAYS RELATIVE. But constant CHANGE is absolute.
So when talk about different power structures we are talking always about interest. In the past interest of certain power structures aligned but as I said there is always that CHANGE so the interest is not aligned anymore.
liekbz: “Was not Jeb! a representative of Bush clan and by extension Big Oil in the current race ?”
Could be. But he did pull quite early from the presidential race. So? Here is that CHANGE that I was talking about that could be reflection from things on the ground, mainly from the results of geopolical developments going in favour of Big Oil but from Russia/Iran.
And look who is absolute leader in the race – “Donald “I can sit and do a deal with Russians” Trump. Well I can tell you one thing Mr. Donald did not just decided out of the blue after filming the last episode of “You got fired” that it would be fun to be president 🙂
He represents certain interests that prefer to keep their relative power through some form of cohabitation. But things can change again. There is always constant and evolving change. And as result you could have Mr. Bush as Donald’s running mate on the ticket in November. It is always more beneficial to have “your guy” sitting inside the circle then outside.
Ron. I know I am an outlier as I focus quite a bit on lower 48 conventional oil production.
EIA will have annual state production posted 2/29/16. Unless the EIA data is not complete, there will be some sizeable declines in percentage terms.
I realize these states are but a blip on the world radar, but I wonder if there is some correlation between the US conventional states and world wide non OPEC and non Russian production?
The conventional onshore states generally show growth in 2014 and decline in 2015. I wonder if that is true in places such as India, non OPEC Africa, Europe, Austrailia, etc?
Yes, there is a correlation with Non-OPEC. Non-OPEC peaked in December 2014 and is down about 650,000 bpd as of December 2015. The US portion of that decline, since December 2014, is about 230,000 bpd. The US did not peak in December however, the US peaked 4 months later, in April and is down about half a million barrels per day in December. This is all JODI data.
I will have a post on that Thursday.
Thanks Ron.
FYI, unless I made a computational error.
US less the shale states of PA, ND, OH, OK, NM, TX, CO, as well as less Alaska and GOM:
12/14: 1,597 bopd.
11/15: 1,425 bopd.
Data Per EIA.
Some thoughts:
The states with higher 11/15 than 12/14 are OH, OK, NM and CO. From my review, these are the ones with the highest overall API liquids of the shale plays, so API gravity has likely continued the upward climb for the entire US liquids production profile.
Next, some of the non shale states actually went higher into the spring, so the decline is steeper than what is shown.
I expect 12/15 for the non shale states to be lower than 11/15, thus steeping YOY decline.
I expect January through at least April, 2016 to continue to decline regardless of price as Feb oil sales are not paid until late March and any sudden price swing would not be reflected until at least May. In reality, given the carnage, it is unlikely any of these states would rebound until 2017 given most will wait several months to see if price recovery is for real.
If $20s-$30s persists all year, there will be a steeper decline from 15 to 16 than from 14 to 15.
If non shale, non OPEC and non Russia world wide oil production follows the US non shale state pattern, OPEC and Russia would really need to ramp up, absent a decrease in YOY demand from 2015. Instead, they seem ready to at least cap, if not cut for the remainder of 2016. Further, demand is expected to increase 1.2 million bopd from 2015.
I suppose it is not realistic to think that 20-30 million bopd of non-US, non-OPEC, non Russian production fell by as much as 10% from 12/14 to 12/15?
Look forward to your Thursday post!
Thanks for fleshing out some of those numbers. It seems that the next couple years are going to reveal some interesting trends.
Hi Shallow sand,
Well we know C+C output went up for the World in 2015 by about 2.2 Mb/d from the average 2014 level. So if the areas you suggest decreased by 2.5 Mb/d, that would imply the other areas OPEC, LTO, and Russia increased output by 4.7 Mb/d. OPEC might have increased by 1 Mb/d, Russia possibly 800 kb/d, which would imply LTO increased C+C output by 2.9 Mb/d in 2015 on average over 2014 average levels.
I am fairly certain that is not the case. So yes it is not realistic to assume the rest of the World matched the US non-shale oil industry in its decline.
There were a number of long term projects in deep water and elsewhere that offset the declines.
World petroleum liquids production (ex biofuels and processing gains), y-o-y change in 2015 (mb/d)
Source: IEA oil market report, January 2016
Dennis. What did Canada, Norway and Brazil increase output by?
My focus in making
the comment is on conventional onshore. That is something the three countries I mentioned have little to none of.
I suspect we are seeing a rapid decline of onshore conventional production world wide.
The point I am trying to make is we are likely becoming much more dependent on LTO, offshore and tar sands than we realize.
Hi Shallow Sands,
AlexS answered above (thanks, you are wonderful). About 400 kb/d increase in total liquids from North Sea and Barents (Norway and UK), Brazil and Canada.
See table above from IEA for breakdown.
We will become more dependent on those resources over time and LTO will not be able to increase beyond 2025 if not developed outside the US, oil sands will develop slowly, I am not too sure on how much we can depend on deep water, but it requires oil over $80/b for most future development.
Well, it’s always a good time to get in the business if you are spending other people’s money and you don’t have to pay it back
http://www.bloomberg.com/news/articles/2016-02-02/chesapeake-founder-tom-ward-says-30-oil-a-good-time-to-get-in
But having done business w/ Tom and his minions, I will say that he is a very smart guy but I am not sure I want to repeat the experience.
John,
I wonder if Tom Ward mentioned the Sierra Club just sued Chesapeake, Devon and Dominion LLC last week for earthquake damages in Oklahoma and Kansas due to deep waste water injection?
Steve
My impression of TW is that he doesn’t lose sleep over the debris he leaves behind.
Is there any way of splitting out Eagle Ford and Permian data? I’m going to guess Eagle Ford looks a lot like the Bakken curve and peaked in early 2015 and is now in slight decline, while the Permian has been inching up but might be about to turn over.
There is, but definitely not easily. You could go by district and separate out the formations, but keep in mind the formation name may change. Especially when you get into districts 7-8 (and more) with the Permian. Because, there is no formation named Permian, it is a multitude of formations. I just take for granted what others report is close enough.
The Permian will no doubt see some decline, based upon the the overall drop in rigs. However, the decline rates are, overall, not nearly as deep as the Eagle Ford or Bakken. It won’t be as spectacular.
Oil firm bankruptcy in North Sea: http://www.oilandgaspeople.com/news/7398/suttie-pulls-plug-on-first-oil/
This is quite interesting from the article: “French bank BNP Paribas last week confirmed it would halt funding oil and gas companies with large capital requirements, particularly in the US.”
Anybody in this forum invested in UBER should try like hell to get rid of it double asap but small investors are probably STUCK.
It seems a UBER driver has gone around picking up fares and shooting people, this afternoon.The people he shot and killed apparently were NOT UBER customers, but still…………
I’m not a lawyer, and don’t have any idea what the LEGAL situation might be, but the stock is likely to nose dive as soon as the exchanges open.
This sort of thing can be final straw that makes or breaks changes in the law affecting new transportation industries and so is relevant to the discussion here.
Come on OFM, you should know better!
If you Google Taxi Driver kills passenger you get this result:
About 289,000 results (0.52 seconds)
Here’s the first one:
Man pummeled by taxi driver dies: police – NY Daily News
http://www.nydailynews.com/…/man-pummeled-taxi-driver-dies-polic…Daily News
Sep 24, 2015 – A man who was pummeled by his taxi driver after trying to evade paying the fare has … A cab driver told cops he beat a 42-year-old passenger to death in the Bronx because he … Cab driver shot, killed by passenger in Bronx.
OFM,
Just an fyi, Uber isn’t a publicly traded company and doesn’t yet have official plans for an IPO.
Uber has not yet gone public
That goes to show just how LITTLE time I spend following the stock market, in terms of specific companies.
It seems to me I remember reading about UBER having a market cap of so and so much, an ungodly amount.
So how do you come up with a market cap if there is no share price, because the shares are not for sale ?
Most likely I was reading about some other similar company and half asleep.
In any case , this rogue driver apparently did not harm any customers, but some of them are probably going to sue UBER just the same, for emotional distress, or something, because they rode with this guy last week or last month, and the negative publicity is going to tarnish the company’s rep with the public.
OFM,
The last time Uber raised money the amount of dollars each venture capital firm was willing to pay for a 1% stake of the company was equal to a total value of $50 billion. That is where the market cap analysis comes from.
For comparison, FedEx, a global company with massive hard assets of land and infrastructure, had a market cap of $47 billion at that time (probly less now due to stocks being down since then).
That fact alone would make me run from any IPO offering Uber does. Uber has valuable data to sell in regards to, say, Tesla, Apple, or Google wanting to appropriately supply markets with autonomous vehicles, but Uber has zero ability, in my opinion, to dominate the autonomous taxi market.
It would take a massive capital investment to purchase the necessary autonomous vehicles, which would devalue the company off the bat due to debt. On top of that, the leaders in getting autonomous taxis to market plan on doing it themselves. Why would google invest billions of dollars and a decade of time in developing the tech only to give their edge away to a young company like Uber?
Google and Apple keep trading places for the largest companies on Earth. If ANYONE has the capital necessary to invest in the hard assets of deploying autonomous vehicles it is them, with collaboration with parts manufacturers and/or in partnership with established car companies that have the capacity and infrastructure already in place to mass produce rapidly, efficiently, and cheaply.
If anything, Google, Tesla, and Apple already have enough data and the right talent to determine how to supply each market. Everywhere I go my Android phone is collecting data on where I go, at what speed, and how many OTHER Andoird phones are out and about. I personally feel Uber will be the MySpace or AOL of the disruption of the taxi business.
Uber will not vanish overnight, but, starting around 2020, will face a 10 year period where they are outcompeted by the far cheaper alternative of autonomous taxis. They’ll be phased out one metropolitan area at a time (it takes time to produce millions of autonomous taxis), and will eventually settle for being bought out for far less than the $50 billion they are valued at.
Thanks Brian,
Your analysis rings true to me. IF I were looking at investing in UBER, the first question I would ask would be WHY this company should be expected to dominate it’s industry, and the second one would be, whether the industry itself has legs.
I can’t see any entry barriers that are even remotely adequate to keep other companies from being as successful, or more so, in this car for hire industry, such as protect other industries. New companies just starting out are not going to be successful at manufacturing computer chips or cars, as a rule, the capital costs of getting into such industries are ENORMOUS.
For a service company, capital costs are trivial by comparision. You are dead on imo.
And for what it is worth, I expect to live long enough, if I am lucky, to see autonomous cars on the lot at local dealerships.
So UBER would fail on both accounts by my own methods.
I believe in real estate myself, so long as you also have sense enough to understand that fundamentals ARE fundamental, and that bubbles can and do happen even in real estate.
So far, nobody has been able to figure out how to manufacture desirable, DESIRABLY LOCATED land in a factory and deliver it to places where it would be worth megabucks. LOL
Out of all the companies including the small startups in Silicon Valley, most of them have either already gone broke, or will go broke or will be bought up by a larger company for peanuts. The winners pay a thousand to one, in terms of buying stock for a buck and selling years later for a thousand, but picking the big winners when they are still small is impossible.
OTOH-EVERYBODY who bought real estate in Silicon Valley in the early days made out like a bandit. EVERYBODY.
Well, UBER is going to need a new driver in Kalamazoo as of yesterday.
It is a privately held stock and that might be even worse, much worse. Google Ventures bought some.
http://fortune.com/2014/06/20/uber-plays-hardball-with-early-shareholders/
The shareholders who sold were lucky.
I’m sure this incident will just reinforce Uber’s already clearly expressed intentions to go completely driverless. Har har!
On a more serious note: I think this wacko’s random shooting of innocent bystanders has a lot more to do with a deeply diseased American society and culture than it has to do with Uber.
Uber should sue the media for promoting the connection. Many murderers work somewhere, but the places of business are usually not put on stage and paraded around if they had nothing to do with the crimes. All drivers are vetted at the local, state and federal level before being hired. Just think about the number of school shootings and post office shootings over the years. Yet media doesn’t blame the schools, at least not much.
Uber has it’s work cut out for it if it wants to continue growth. In order to go driverless they would have to become a taxi company (with all those added regulations and costs) or align themselves with taxi companies. Right now the drivers are subcontracted and Uber is the administrator and software providers for the rides. Also, I would not put my company at risk on a technology like autonomous driving until it was well proven in all conditions. Errors can be very expensive when dealing with passengers.
One thing I have never been able to believe is that using Uber reduces fossil fuel consumption.
It really has nothing at all to do with UBER.
UBER just happened to be unlucky that this nut case was a UBER driver.
The company name has been prominently mentioned in the vast majority of news stories about this tragedy, which is unfortunate for the company. It will deter some potential customers , and it will provide folks who have it in for the company an opportunity to bad mouth UBER for not screening drivers more carefully.
What seems to happen in comparable situations, is that the stock price of a company what has this kind of bad luck declines sharply, and quickly. If you own some, and you are quick enough, you can maybe sell ahead of the decline , and buy it back cheaper in a few days or weeks. This sort of thing does not usually have much if any long term effect on a solid company.
Now if this guy had shot a UBER customer……… THAT would have been a real disaster for the company. That sort of bad news has nine lives.
[…] peak oil barrel […]
Question about impairments.
CLR has taken few in 2015. They report earnings 2/24. They disclosed PV10 fell about $15 billion from 12/31/14 to 12/31/15.
$15 billion divided by the outstanding shares is right at $40.
So, will they report a loss that includes a $40 per share impairment?
The stock is at $17.46.
Further, PV10 at $50 WTI, less long term debt/outstanding shares = roughly $3 per share.
Interesting this one hasn’t tanked further.
Of course, with PXD, long term debt of $3.2 billion = PV10 of $3.2 billion. At $50 WTI.
They have a high percentage of 2016 oil hedged, but considerable amount with three way collars.
Who wants to bet that the aggregate PV10 of all US based non integrated E & P public companies is less than their aggregate long term debt at $50 WTI? And we are at $30 WTI.
Maybe I will try to add it up in about a month or so, once the 10K are out.
If that is true, how many billions of market cap is purely a bet that oil prices are headed well north of $50 before debt cannot be extended?
Wonder how the gas weighted stack up?
Shallow,
Can you explain to me if PXD, PV10 is =or< long term debt, why is not PXD declared insolvent, and suspended from trading, as they would be technically bankrupt.
Toolpush. Per their Q4 press release, it appears all categories PV 10 is $3.2 billion. From another press release the same day (2/10/16), it appears long term debt is $3.2 billion.
They are not insolvent if they can make debt and expense payments. They have hedges, which definitely helps them. Keep in mind, however, PV10 was calculated at $50 WTI and $2.65 HH.
Looked at Denbury, who has about 70K bopd, about half CO2 flood. Long term debt $3.3 billion, PV10 at $50 WTI $2.3 billion.
PXD stock at $122. Denbury stock at $1.
I guess that is why they call it a casino, the stock market thing we put our 401k’s in and W wanted to invest SS money in. LOL.
Thanks shallow,
It looks like I got my definitions of insolvency mixed up. Amazing that PXD can own more than they are worth and still be at $100 per share!
Toolpush.
I have been running some numbers at $30 WTI and $2 natural gas. Just plugging in numbers, not specific to any company. Assuming $25 well head oil and $1.50 wellhead gas. But I am including interest and G & A in addition to OPEX, transport, P & A.
There really isn’t any significant value, even with $8 OPEX, which is really pretty low for oil weighted companies.
For a company with OPEX like Denbury, the assets are not, they are liabilities, because they are cash flow negative now at those prices.
Note: I escalate OPEX at 3% per annum, which I have found is fairly common, at least for five years or so. Shale has almost no PV10 when you do that as it becomes CF negative in year 2-3 due to steep decline. I’m using 25% decline in the shale reference, per PXD saying ceasing activity in EFS will result in 25% decline in 2016, then tapering off 5% per year till getting to 5% annual, then holding at 5%.
SS,
PXD’s net debt is lower because they expect $1.6 billion in cash from the stock offering and $500 million in cash from the sale of the pipeline.
Still, at current prices PXD is trading at 20 times EV/EBITDA inclusive of hedges. I have been saying this for a long time – the market is pricing ALL shale companies as if the price of oil is $70 per barrel.
Texas Crude and condensate are basically holding flat, yet associate or casing head gas is on the increase. An indication of a rising GOR, similar to the Bakken.
Depending on which side of the fence you are sitting, It could be drilling more gassy parts of the reservoir, or those damn chokes, that keep vibrating open!
Shallow,
I’m curious what are low decline vertical waterflood properties selling for in this environment? Aren’t these in general better in a lower priced environment (say $50ish) than the shale plays? I can’t really figure out why horizontal permian gets so much hype in this environment. I’ve found 2 permian players that seem to make money at 50 and below, RSP permian and Callon Petroleum, but they are valued as if oil is +80 trading at over $100k per flowing barrel. The lowest cost producers I’ve found are all vertical producers and MLPs. MCEP is probably the lowest cost producer in the U.S. and they do pure low decline waterfloods. They have quite a bit of debt but even with that they’re trading at $40k per flowing barrel including all debt.
Kelly b. Right now, unhedged, 2/16 price looks to be $16-$26 depending on location.
I sincerely doubt there are many secondary projects will all in costs (excluding interest) under $20. Just look at MCEP.
How do you price assets that are barely making money, breaking even, or losing money?
Likewise, re shale. PXD values PUD PV10 at about $350 million. It isn’t too economic. They are saying that, not me. Some 600,000 acres in the Permian with PUD PV 10 of $350 million at $50 WTI.
The only value in lower 48 onshore is that prices rise substantially in 2016. It is practically all an option at current levels. The PV10 values tell us that.
What happens to GM, for example, if they can suddenly only sell new vehicles for $5-15K?
One company you mention is Mid-Con. In 2014 PV10 was $664 million. But look at costs. LOE $22.93, production taxes $5.56, G & A $12.58. LT debt $205 million.
Granted, in Q3 2015 they had hammered costs down to $19.60 LOE, $.46 production taxes and $5.04 G & A. At $25 wellhead there is $0 PV.
Yes, Mid-Con is hedged. Only way they may survive. I’d say almost secondary and tertiary projects are underwater at $30 WTI in lower 48, when G & A is included.
Shale oil LOE is only low due to a high number of new wells. I think 5+ year old wells have LOE $15-$30 for the most part, with outliers of course.
Shallow-
Have you looked at production declines for shale wells older than 5 years old? Shalies have touted the long flat tales with 5-6% declines into the future. I’ve been wondering how accurate those decline rates are, now that we have some older wells to look at.
John Keller. Take a look at Enno Peters shale profile.com. Very good info regarding Bakken and Niobrara. He is working on EFS and Permian for Texas also, but tougher job due to production reported on leases basis instead of well basis.
Note, CRZO reported today. They are one of the stronger companies in EFS and Permian. Yet PV10 is barely above long term debt at $50 WTI. They are fairly well hedged compared to some others. In fact, over a third of Q4 revenue was from hedges.
Lots of reports this week.
Thanks Shallow!
John,
Some time ago I had a look at the effect of refracking on well declines of old shale wells. The reason is that those refracks have an out-sized effect, if you just average the total production of old shale wells.
See below the year-on-year decline of shale wells in ND, if just 214 wells are removed (from which I strongly suspect they have been refracked – for some I have positive evidence). So far I don’t see evidence that the year-on-year decline drops clearly below 10% a year.
Enno,
Awesome chart. Thanks!
Is there a provision for “Survivor bias?”
In other words, how many wells that were put on line in 2007, 2008, etc. are plugged & abandoned or temporarily abandoned?
Jeffrey,
Yes, in my ND data I always add 0 production months after the last reported month by the NDIC. So no survivor bias in the info I present.
Do you have the percentages of non-producing wells by year? For example, currently non-producing wells as a percentage of 2007 completions.
Hi Jeffrey,
I have given you that data in the past. The well profiles do not have survivorship bias as long as a zero is entered for output for abandoned wells. That is what Enno does.
I can send you Enno’s spreadsheet or Ron can, just email and ask.
Let’s assume a fully developed lease with 10 wells, all completed in 2010, and 2010 production averaged 1,000 bpd. Let’s assume that we lose 200 bpd per year and let’s assume that we lose one well per year.
2010: 1,000 bpd, 10 wells
2011: 800 bpd, 9 wells
2012: 600 bpd, 8 wells
2013: 400 bpd, 7 wells
As I understand it, the approach you guys are using is that you divide the annual average production by the original 10 wells, to get the average production per well per year, in order to eliminate survivor bias.
However, note that when it comes to rate of change, there is no difference between calculating the year over year rates of change for total production, or total production divided by 10. For example, the exponential rate of decline from 2012 to 2013 for total production was 41%/year (natural log of 400/600), and the exponential rate of decline from 2012 to 2013 for total production divided by 10 was also 41%/year (natural log of 40/60).
In other words, it seems to me that the year over year rates of decline shown above refer to the rates of change in total production, and dividing by the original number of wells has no effect on the year over year rate of change calculations* (unless I am missing something).
In any case, since dividing by the original number of wells does not seem to have any effect on year over year rate of change calculations (versus using total production by year), I think that a useful chart would be to show the percentage, by year, in the number of plugged & inactive wells, divided by total original completions in a given year. For my example, the percentages would be:
2010: 0%
2011: 10%
2012: 20%
2013: 30%
Of course, when the percentage hits 100%, lease production hits zero.
Incidentally, it seems to me that there is an unavoidable survivor bias, since it stands to reason that the wells that are still producing after five years for example are the better wells, with a lower rate of decline than the wells that were plugged or became inactive in the first five years, and year over year rate of change in production numbers give no information about the number of wells that “die” along the way, which is why I think that a companion chart showing the percentage of plugged/inactive wells makes sense.
*If we calculate the surviving well rate of decline from 2012 to 2013, the year over year exponential rate of decline would be lower of course (27%/year, the natural log of 57/75).
Hi Jeffrey,
To me (and possibly Enno), using the original 10 wells in the denominator is adequate to calculate the average well profile.
Note that in the first five years the wells abandoned are very low (probably less than 1% per year).
As I said before, request Enno Peter’s data from Ron and make any chart you would like.
Oh and it would be nice if you stop claiming survivorship bias when both Enno and I have repeated this several times, but you continue to bring it up.
I’m sorry that the facts seem to offend you, but were there any errors in what I posted?
And why not show the number of plugged/inactive wells by year, since all you guys are calculating is the year over year rate of decline in total production?
In any case, let’s go back to my example and use some different assumptions. Let’s assume a fully developed lease with 10 wells, all completed in 2010, and 2010 production averaged 1,000 bpd. Let’s assume we have one good well and nine poor wells. Let’s assume that we lose 200 bpd per year and let’s assume that we initially lose three wells per year, until we are down to the one good producing well.
2010: 1,000 bpd, 10 wells
2011: 800 bpd, 7 wells
2012: 600 bpd, 4 wells
2013: 400 bpd, 1 well
My point is that the year over year rate of change calculations, regardless of whether one calculates it based on total production or total production divided by 10, do not reflect the fact that 90% of the wells are no longer producing three years after initial production. So, does the year over year rate of change calculation for 2014 and later years (reflecting production from the one good well) accurately reflect the overall rate of change for wells on the lease?
As I said before get the spreadsheet and do what you like.
There is no survivorship bias in the average well profiles published by Enno Peters.
End of story
People will believe what they want to believe, and I’m sorry that the facts seem to offend you.
US oil and gas rig count forecast by Raymond James.
It seems completely unrealistic, but they expect a sharp rebound in drilling activity from the second half of this year.
Source: http://www.ogj.com/articles/2016/02/bhi-us-rig-count-loses-30-in-latest-drilling-dive.html
In light of the recent declines, financial services firm Raymond James & Associates Inc. further reduced its forecast US rig counts for 2016-18 in its most recent industry brief.
RJA now projects an average 2016 count of 500, down from the 620 the firm projected just last month and down nearly half compared with the 2015 average. The new bottom is expected occur in April at 400 units, compared with RJA’s previous projection of 550 in June. [The most recent rig count is 514 – AlexS].
A drilling rebound isn’t seen until late 2016, the firm says, as many E&P firms are likely to first focus on drawing down their uncompleted well inventories and improving their balance sheets, while waiting for consistently higher crude oil prices and a labor force recovery.
The count is forecast to end 2016 at 700 units, adding just 300 during the second half.
… the lower activity this year should still lead to even more robust growth in 2017-18,” the firm said.
RJA expects the average count to jump 106% year-over-year in 2017 to 1,030, and rise 32% year-over-year to 1,358 in 2018.
“Despite the strong growth expected in 2017-18, we don’t see the rig count reaching the heights of 2014 levels again, as rig efficiencies continue to advance at a solid clip,” the firm added.
Alex,
I think their forecast is based on the belief that the US government will somehow (may be indirectly via OPEC June meeting) help to rotate the existing debt in 2008 banks bail-out fashion.
likbez,
They may also assume a sharp rebound in oil prices (I do not know what their forecast is).
Or they completely ignore the issue of shale companies’ negative cashflows, debt, etc.
Alex,
“Or they completely ignore the issue of shale companies’ negative cashflows, debt, etc.”
Possible. But IMHO Raymond James is often good with guessing trends (up/down).
I think their forecast is based on the belief that the US government will somehow (may be indirectly via OPEC June meeting) help to rotate the existing debt in 2008 banks bail-out fashion.
No, I don’t think that is the case at all. Oil companies are not banks and don’t have the same priority as banks. There will be no bailout of oil companies by the government. That is just not going to happen.
Who will have the money to buy the assets/acreage? Will it be domestic money, or will it be the big pools of money from China (currently has just over $ 3 Trillion in foreign reserves), or the Arab oil producing nations?
The following should interest a few people here. It is from the LinkedIn account of Amy Fox. as with POB, the comments are enlightening.
Amy FoxPresident & Founder, Chief Peddler of Geomechanics at Enlighten
Geoscience
How Junk Science Set the Oil and Gas Industry Back 50 Years
February 13, 2016 • 2,745 Views • 130 Likes • 46 Comments
Admittedly, I am stealing a headline by one of my favorite bloggers,
Liz Ryan at Forbes, who writes unabashedly about ludicrous HR policies
and how to avoid them (specifically, this post). But still, I mean it.
I went to a luncheon talk the other day about incorporating
geostatistics into reservoir modeling. I could sense the speaker’s
frustration at the lack of adoption of rigorous science in widely used
industry workflows. Despite being one of the preeminent names in his
field, he’d clearly been singing his song to deaf ears for some time.
At the end I asked him if approaches like the one he had just talked
about had already been adopted in other industries. His reply elicited
a collective gasp from the audience. He said that if he had given the
same talk to an audience in some other industries, they would think it
was the 1950’s. The 1950’s. That’s some food for thought.
Here are a few rhetorical questions that I puzzle on frequently:
Why is the lag between academia and industry longer in oil and gas
than other industries?
Why are the geosciences in general, and oil and gas in particular, so
reluctant to apply techniques that have been considered common
practice in other industries for decades?
Why is the oil and gas industry so quick to jump on “easy answer”
bandwagons and waste billions of dollars on them?
Why are so many people who are considered “experts” in their field in
the oil and gas industry often actually woefully behind the latest
developments in their fields? Worse, how can they be considered
experts when they lack a real understanding of the fundamental
concepts underlying what they do?
In west-central Alberta, the ballpark cost of a vertical well is
probably $1-2 million. The cost of a horizontal multi-stage
hydraulically fractured well is more like $5-10 million (I didn’t
research these numbers. I’m just basing them on what I’ve seen in the
past). Did multi-stage horizontals make producing from unconventional
reservoirs possible? Of course. Did they make it economic? For a
while, when oil was $100 per barrel. Did they make production
predictable? Not even close.
Predictability is the holy grail in this industry. Investors (external
or internal) don’t want to feel like they’re playing a game of chance.
They want to know that it’s more likely than not that their investment
will pay off. This, I think, is why oil and gas companies constantly
fall for red herrings (see, e.g., my many tirades against the
ridiculous oversimplification that is the “brittleness” craze). They
want an Easy button, which service companies are more than happy to
sell (often at steep cost). The service companies then sit back and
count their money during the years or decades it takes industry to
realize that the latest Easy button didn’t actually work. Those of us
trying to shout “It’s not that simple!” can’t be heard over the din,
or worse are muzzled because that’s not what anyone wants to hear.
To be fair, and I’ve said this before, there are pockets of innovation
in the oil and gas industry. But what worries me is that what looks
like innovation to us probably looks like late adoption from the
outside.
A couple of years ago I had an idea for better understanding caprock
integrity in operations like SAGD. It was geostatistical in nature. I
was having lots of trouble getting people to understand it, so I went
to literature to find an example. Guess where I found it…… in HIV
transmission research from the 1980’s.
Let’s look at hydraulic fracture modeling. In the latter part of the
20th century many good hydraulic fracture models were developed for
vertical wells in conventional reservoirs. They were calibrated with
real data. Today those same models are still being used routinely to
model multi-stage hydraulic fractures in horizontal wells with minimal
to no calibration. And we’re surprised when reality doesn’t look like
what the models predict?? That’s insane. Are there better models out
there? Sure there are, more all the time, but they are complex and
often expensive (as is collecting data for calibrating them). Are they
more expensive than a dry hole?
As I end this latest rant (I swear, I’ve got a sense of humor, but I
take this stuff pretty seriously), I’m going to quote Liz again. In
her post on the truth about online job hunting she said, “…when a
piece of technology or even worse, a mindset about technology is
installed and people get trained on it, they don’t want to change it.
They don’t want to learn anything new.”
Written by
Amy FoxPresident & Founder, Chief Peddler of Geomechanics
For a successful technology, reality must take precedence over public relations, for Nature cannot be fooled.
Richard P. Feynman
The month over month changes in the Texas RRC report have been basically flat during the end of 2015, yet the year over year changes are flabbergasting (see below chart for Texas condensate).
As this is due to the high growth rate in 2014, it shows nevertheless the increasing dynamics of the slowdown process. For condensate the year over year decline rate has been a staggering 29% (in November the year over year decline has been just 17%). The yearly decline for oil and gas well gas has been 17% and 20% respectively.
I know the numbers will be revised, yet the monthly change of the year over year decline is now way over 5%. So, this means annualized a 50% year over year decline for the next 10 months for all categories. The 50% year over year decline for condensate will come already during this spring.
All indicators, the bond market, rig count, low oil prices and the yet strong dollar point to an even accelerated trend over the current year. Only a major political event can now stop this train.
From IEA medium-term oil market report 2016:
Further, it is becoming even more obvious that the prevailing wisdom of just a few years ago that “peak oil supply” would cause oil prices to rise relentlessly as output struggled to keep pace with ever-rising demand was wrong. Today we are seeing not just an abundance of resources in the ground but also tremendous technical innovation that enables companies to bring oil to the market. Added to this is a remorseless downward pressure on costs and, although we are currently seeing major cutbacks in oil investments, there is no doubt that many projects currently on hold will be re-evaluated and will see the light of day at lower costs than were thought possible just a few years ago. The world of peak oil supply has been turned on its head, due to structural changes in the economies of key developing countries and major efforts to improve energy efficiency everywhere.
I fear that there will be a rude awakening for some in the next few years.
The WSJ has an article on the IEA outlook, with an interesting chart (do Google Search for access):
WSJ: IEA Sees Global Oil Markets Rebalancing Next Year
IEA says ‘supply and demand will gradually rebalance by 2017, with a corresponding recovery in oil prices from around $30 a barrel’
Copy of an email I sent to some Oil Patch folks:
Attached is an article in today’s WSJ about the IEA’s most recent outlook, for the balance between global total liquids supply & demand. There is a very interesting chart in the article. Apparently, oil prices were trading up today, because of the report.
However, the IEA outlook does not take into account two critical factors: (1) The composition of the global Crude + Condensate (C+C) inventory oversupply (mostly condensate, in my opinion) and (2) Even as production increases, net exports can fall, because of domestic consumption in net oil exporting countries.
Some of my comments on net oil exports:
Following is a link to a discussion, in three sequential comments, of the Export Land Model (ELM, a simple mathematical model which assumes a 5%/year rate of decline in production and a 2.5%/year rate of increase in consumption, in a net oil exporting country), the Six Country Case History (major net exporters that hit or approached zero net exports from 1980 to 2010, excluding China) and the (2005) Top 33 Net Exporters, with graphics for each item:
http://peakoilbarrel.com/opec-except-iran-has-peaked/#comment-556985
Note that what I define as the ECI Ratio (Export Capacity Index) is the ratio of production to consumption, and CNE = Cumulative Net Exports (for a defined time period).
Based on the mathematical model, which is confirmed by the empirical data (Six Country Case History), a declining ECI Ratio tends to correlate with an accelerating rate of depletion in remaining CNE.
For example, about the only metric that most analysts focus on is the top line production number in a net oil exporting country, and from 1995 to 1999, Six Country production rose by 2%, but in only four years they had already shipped 54% of their post-1995 CNE.
I estimate that Saudi Arabia may have already shipped in the vicinity of half of their post-2005 CNE. Note that annual Saudi net oil exports fell from 9.5 million bpd in 2005 to 8.4 million bpd in 2014 (probably remaining at about 8.7 mililon bpd in 2015, EIA + BP data). In other words, Saudi net exports, after increasing very rapidly from 2002 to 2005, have almost certainly been below their 2005 rate for 10 straight years. But the hidden danger, which almost no one is focused on, is the ongoing–and accelerating–rate of depletion in remaining volume of post-2005 Saudi and Global Cumulative Net Exports of oil.
Regards,
Jeffrey Brown
FYI oil was up in asia last night $1.50 rather a lot of hours before the report. Gradually, too. Not a sudden event like a leak.
It’s all noise.
The world of peak oil supply has been turned on its head, due to structural changes in the economies of key developing countries and major efforts to improve energy efficiency everywhere.
Increasing the extraction rate simply increases the depletion rate. I can’t see how anything humans do can change that fact. In other words, nothing can turn peak oil on its head.
“… structural changes in the economies…”
Yea, its called tanking.
Hi Jef,
I took a look at old IMF World Outlooks from 2008 to 2015 and they do tend to overestimate future real GDP growth (market exchange rates) for the World.
On average for the future two years (2016 and 2017 for current report) they tend to estimate about 0.6% too high (average of 2008-2014 reports) and for the following 3 years about 1.23% too high. When I adjust the current forecast to account for this tendency the average World real growth rate from 2015 to 2020 is about 2.2%.
Chart below shows individual years.
There is no growth, just the illusion of growth. All of it was borrowed. Every dollar unit of incremental GDP requires multiple dollars of incremental debt.
Hi Ves,
GDP is a measure of what is produced. If the cars produced run you over, that illusion hurts. Then you have to go to the imaginary hospital, in the imaginary ambulance.
The Matrix was interesting, but it was only a movie. 🙂
Denn – I know you are not ignorant of the fact that GDP measurement includes the “production” of debt which has been the largest element of GDP for some time now.
Hi Jef,
See https://en.wikipedia.org/wiki/Gross_domestic_product
GDP can be determined in three ways, all of which should, in principle, give the same result. They are the production (or output or value added) approach, the income approach, or the expenditure approach.
I prefer the production approach.
The OECD defines GDP as “an aggregate measure of production equal to the sum of the gross values added of all resident, institutional units engaged in production (plus any taxes, and minus any subsidies, on products not included in the value of their outputs).”
Note that for every borrower there is a creditor, for the planet as a whole there is no problem with debt as long as we aren’t borrowing from aliens. 🙂
Currently there is an excess supply of liquidity provided by central banks driving the price of borrowing (interest rates) to very low levels. The aim is increased debt to boost economic output, but clearly it is not working which implies that debt may not be as high as many believe.
The solution to high unemployment in this situation (near zero interest rates) is higher public debt through deficit spending by governments. This increases income and tax revenue as employment increases and eventually reduces the need for fiscal stimulus.
Basic Keynesian Theory, known since 1936 see
https://en.wikipedia.org/wiki/The_General_Theory_of_Employment,_Interest_and_Money
“Hi Ves”
Hi Dennis,
it was not me 🙂
Yep should have been VK, sorry.
Hi Frugal,
Correct. I think what has surprised many, including the IEA is that a few years ago they worried that high oil prices would be a problem as oil supply growth would struggle to keep up oil demand growth.
That has not proven to be the case from late 2014 until today as oil supply growth has outpaced oil demand growth. This is mostly due to a change in strategy by OPEC to focus on market share rather than oil revenue.
I believe that high oil prices will be back, but have been convinced by AlexS that it will not be as soon as I have been predicting. Long term projects that will come on line and be ramping up in 2016 and 2017 may keep oil prices under $80/b through mid 2018, we may not see prices rise to $100/b or more (2015$) until 2019, when the current delays in long term oil investment will start to affect oil output in a big way (2 to 3 Mb/d less output than if the projects deferred had been completed).
To me the undulating plateau scenario looks somewhat plausible, unless there is a financial crisis, in which case demand and price will fall along with output. I have no prediction for when such a crisis might occur, but the scenario below ignores that possibility.
The financial crisis is now. Stock crash due within a few months and maybe weeks.
http://www.hussmanfunds.com/wmc/wmc160222.htm
Hi VK,
Better bury your savings in the back yard.
The IEA has actually increased its medium-term global demand projections compared with the previous year’s report. This reflects a much higher 2015 base, but also slightly higher growth rates in 2016-2020.
As a result, projected demand in 2020 is now almost 1.5 mb/d higher than in MTOMR-2015 (100.5mb/d vs. 99.05mb/d).
From the new report:
“…our forecast for oil demand to 2021 is for annual average growth of 1.2 mb/d (1.2%) which represents a very solid outlook in historical terms. Oil demand breaks through the 100 mb/d barrier at some point in 2019 or 2020. A major change from the 2015 MTOMR is the higher base from which our forecast begins. In 2015 world oil demand increased by 1.6 mb/d (1.7%), one of the biggest increases in recent years stimulated to a large extent by the rapid fall in oil prices that began in the second half of 2014 and gained momentum in 2015. However, any expectations that the most recent fall in oil prices to USD 30/bbl oil will provide further stimulus to oil demand in the early years of our forecast and send annual rates of growth above 1.2 mb/d are likely to be dashed. In the first part of 2016 we have seen major turmoil in financial markets and clear signs that almost any economy you care to look at could see its GDP growth prospects downgraded.
Since 2014 the non-OECD countries have used more oil than OECD countries and the gap will widen in years to come. However, the rate of demand growth in the non-OECD countries is vulnerable to being pared back as the cost of energy subsidies becomes a major burden and governments take action. This will probably not have an immediate impact on demand in the early part of this forecast, but later on we might see that the reduction in expensive fuel subsidies in many countries, including the fast-growing Middle East, does have a significant effect on growth. Also, rising energy use has brought with it terrible environmental degradation, particularly in the fast-growing Asian economies, and oil’s part in this is recognised by measures to limit vehicle registrations and use. Although reducing subsidies and tackling pollution will affect the rate of demand growth, it should be stressed that non-OECD Asia will still remain the major source of oil demand growth with volumes increasing from 23.7 mb/d in 2015 to 28.9 mb/d in 2021.”
Global liquids demand (mb/d): IEA Medium-Term Market Reports 2016 vs. 2015
The IEA’s non-OPEC C+C+NGLs production estimate for 2015 in last year’s MTOMR proved too pessimistic.They have underestimated the resilience of high cost oil production, particularly that of the US LTO. As a result, actual non-OPEC production was 1.1 mb/d higher than in last year’s report.
Still, the agency expects non-OPEC production to decline by 0.6mb/d in 2016 and 0.1mb/d in 2017 before a gradual recovery from 2018. Projected decline in 2016-17 should be mainly driven by LTO. Expected non-OPEC production in 2020 is 0.4mb/d lower than in the MTOMR-2015.
From the new report:
In the year since the 2015 MTOMR was published, the supply side has provided many surprises. By far the most significant has been the resilience of high cost oil production and in particular that of light, tight, oil (LTO) output in the US. As oil prices cascaded down from more than USD 100/bbl it was widely predicted at various milestones that the extraordinary growth in total US crude oil production from 5 mb/d in 2008 to 9.4 mb/d in 2015 would grind to a halt and move rapidly into reverse. Growth certainly ceased in mid-2015 but the intervening period has seen a relatively modest pull-back and total US crude oil production in early February 2016 was still close to 9.0 mb/d, aided by expanding production in the Gulf of Mexico.
In our base case outlook, there is an element of the “straw breaking the camel’s back” and we expect US LTO production to fall back by 600 kb/d this year and by a further 200 kb/d in 2017 before a gradual recovery in oil prices, working in step with further improvements in operational efficiencies and cost cutting, allows a gradual recovery. Anybody who believes that we have seen the last of rising LTO production in the United States should think again; by the end of our forecast in 2021, total US liquids production will have increased by a net 1.3 mb/d compared to 2015. Such has been the element of surprise provided by the resilience of US oil production, and the wide divergence of views as to the future, that we have added a High and Low Case to our non-OPEC production analysis and plotted the impact on the global oil market balance of US LTO production falling by more than in our base case or, conversely, less. The eventual outturn is one of the most important factors – if not the most important – in assessing when the oil market will re-balance.
Non-OPEC liquids production (ex biofuels) (mb/d): IEA Medium-Term Market Reports 2016 vs. 2015
(Note: excludes Indonesia)
The IEA expects the oil market to re-balance in 2017, which is in line with the EIA’s and many other forecasts. However the accumulated excess inventories will return to long-term normal levels only by 2021, which should dampen the recovery in oil prices.
From the report:
For some time now analysts have tried to understand when the oil market will return to balance. A year ago it was widely believed that this would happen by the end of 2015 but that view has proved to be very wide of the mark. In 2014 and again in 2015 supply exceeded demand by massive margins, 0.9 mb/d and 2 mb/d respectively, and for 2016 we expect a further build of 1.1 mb/d. Only in 2017 will we finally see oil supply and demand aligned but the enormous stocks being accumulated will act as a dampener on the pace of recovery in oil prices when the market, having balanced, then starts to draw down those stocks. Unless we see an even larger than expected fall in non-OPEC oil production in 2016 and/or a major demand growth spurt it is hard to see oil prices recovering significantly in the short term from the low levels prevailing at the time of publication of this report.
It is very tempting, but also very dangerous, to declare that we are in a new era of lower oil prices. But at the risk of tempting fate, we must say that today’s oil market conditions do not suggest that prices can recover sharply in the immediate future – unless, of course, there is a major geopolitical event.
Global balance base case: IEA MTOMR-2016
Thanks AlexS,
I don’t have access to the report is there a reference oil price scenario?
If oil prices remain under $40/b for the remainder of 2016, we might see more significant decline in LTO output than 600 kb/d, my more optimistic forecasts for LTO were based on an assumption of an oil price recovery in 2016, which is looking less likely due to continued oversupply of oil.
At some point a “Minsky moment” may occur in the LTO sector and as all the investors head for the exit at once, we might see a sharp drop in LTO output as companies go bankrupt and financial chaos ensues. I don’t think this is high probability, but don’t think it highly unlikely either, maybe a 1/3 chance that a major crisis in the LTO sector is in the cards.
Dennis,
I don’t have access to full report. There is only free summary
Dennis,
The scenario of a ‘Minsky’ moment in the shale industry is exactly what I think is necessary to bring oil prices up again. Some call it capitulation.
There are still many people invested hoping for a turnaround without capitulation. Yet this will take a lot of time and will be painful. A sudden capitulation is much more likely and will be at the end less painful.
As the shale industry is still fighting to keep production up, the situation gets more tense and more painful by the day.
Hi Heinrich,
You may be correct, I agree for the industry as a whole capitulation would be better, but each company is trying to hang on hoping the other guy folds. It is a game of last man standing where everyone loses it seems.
Alex,
The IEA expects the oil market to re-balance in 2017, which is in line with the EIA’s and many other forecasts.
Do you think they can break with the party line of “oil glut” dictated by EIA? If so that would be an incredibly brave move :-).
Hi likbez,
The supply and demand data from the IEA suggests an oil glut at present, I am guessing they believe the data that they produce. The “market balancing” means the supply glut will be eliminated, then inventory needs to fall before oil price responds strongly in the 2018-2020 time frame. A lot depends on supply and demand and these are hard to predict even with an army of economists (or perhaps that makes it harder 🙂 ).
For a contrast to the IEA forecast I used BP data for production (adding in biofuels) and consumption in tonnes and converting to barrels using 7.3 barrels per tonne. This gives a better approximation of the energy of the liquids in barrels of oil equivalent. I have also added an oil shock model estimate where the 2014 level of biofuels is assumed to continue until 2021 and NGL is approximated from the medium natural gas shock model. The 2015 data point is estimated from the first 10 months of EIA data for C+C+NGL (along with biofuel liquids assumption above) and the plateau scenario for C+C is assumed.
For 2015 output is about 92 Mb/d with about 10 Mb/d of NGL and 2 Mb/d of biofuels, in barrels of oil equivalent (boe) the 12 Mb/d of NGL and biofuels is about 8.4 Mboe/d, so in energy terms (rather than volume) output is about 88.3 Mboe/d.
Hi AlexS,
I don’t see supply growth returning for non-OPEC in 2018 as fast as projected by the IEA unless oil prices rebound to $100/b by then, this seems unlikely given the supply and demand forecasts through 2017. It is possible that demand might be higher and supply lower so that the market might balance more quickly and drive oil prices up. Eventually it may become very costly to keep supply high enough to match demand unless high oil prices reduce demand. By 2020 I expect oil prices to be well over $100/b in 2015$ and the oil industry will struggle to maintain oil output (C+C) at 80 Mb/d.
For total liquids in Mboe/d, output will remain under 90 Mboe/d.
Scenario below does not include biofuels. If those were added (2014 level was about 1.4 Mboe/d) and remained at 2014 levels liquids, then output would be about 89 Mboe/d rather than 87.5 as shown in the chart below.
Dennis,
The IEA expects non-OPEC production to increase by 2.0 mb/d between 2015 and 2021, of which the US should account for 1.3 mb/d.
I do not know what are their current projections for other countries, but last year they expected the biggest growth in Canada and Brazil (690 kb/d and 680 kb/d, respectively, from 2015 to 2020).
Interestingly, the IEA’s estimates and near-term projections (2014-2016) for Canada in their January 2016 Oil Market Report are about 120 kb/d higher than in last year’s MTOMR. But they may have reduced projections for growth in 2017-2021 for both Brazil and Canada reflecting project delays.
In last year’s MTOMR, the IEA expected Russian oil production to fall the most among all sources of non-OPEC supply due to a “crushing impact of lower oil prices and Western sanctions”. They projected Russian production to drop by 560 kb/d from 2014 to 2020, including a 150 kb/d decline in 2015 and 410 kb/d in 2016-2020.
According to the IEA’s January 2016 OMR, Russian oil production has actually increased by 150 kb/d in 2015 (instead of having declined by the same amount), and they are now projecting a further 20 kb/d growth in 2016 (instead of a 130 kb/d decline). There is nothing about Russia in the summary of the new MTOMR, but I suppose they are still projecting a declining trend for Russia in 2017-2021.
To note, the IEA has also revised up its short-term oil production estimates and projections for some other non-OPEC countries, including Norway, the UK, and China. (I compare MTOMR-2015 with OMR-January 2016 numbers for 2014-2016). Most probably, they now expect steeper declines in these countries from 2017 to 2021.
I think that the biggest uncertainty in the IEA’s non-OPEC projections is LTO. The IEA expects an increase of 1.6 mb/d from 3.4 mb/d in 2017 to 5 mb/d in 2021. This is an annual average growth of 400 kb/d, which is achievable in terms of the resource base But the key question is the financial situation of the shale players.
Dennis,
I found the IEA’s projections for Canada. They are actually little changed compared with last year’s MTOMR
source: http://www.canadianbusiness.com/business-news/canadian-oil-production-could-slow-down-or-freeze-altogether-report-warns/
Growth in Canadian oil production is likely to slow down or grind to a halt five years from now once projects now under construction are built, the International Energy Agency warns in a report released Monday.
The Paris-based organization said it projects Canada to add 800,000 barrels a day of production by 2021, which would bring total output to 5.2 million barrels a day. Most of that growth is expected to come from Alberta’s oilsands, with bitumen production expected to hit 3.4 million barrels a day.
But a number of factors including the expense of producing crude from the oilsands threaten to curtail or put a stop to such growth, the IEA said.
“Heightened environmental concerns, a lack of pipeline access to new markets and the unknown impact of the victory by the New Democratic Party in Alberta’s elections last year are causing companies to slow development,” it said.
“As such, we are likely to see continued capacity increases (in) the near term, with growth slowing considerably, if not coming to a complete standstill, after the projects under construction are completed.”
A number of new developments in Canada recently commissioned or nearing completion will drive growth over the next five years, the IEA said. They include Imperial Oil’s Kearl expansion project in Alberta, which was completed in June 2015, and the Hebron offshore oil site off Newfoundland set to begin production in 2018.
Kearl expansion is fully ramped up, so won’t be driving future growth. Hebron is due for installation in late 2017, but has been beset by delays through it’s life. It has integrated drilling, with a single rig, and production, and produces heavy oil. That means ramp up will be slow compared to, say, subsea systems (e.g. initially they may need three wells to be drilled – disposal, producer and injector – before starting production, and then a series of producer-injector pairs to fill the 52 well slots over several years. They may not achieve plateau production of 150 to 170,000 bpd for 3 to 4 years. By which time decline in the other three ageing platforms in the same basin would have negated most of the gains.
Thanks AlexS and George.
Hi AlexS,
The IEA should report in boe as it is Energy not volume that they are supposed to report on. Or they can change their name to the IVA 🙂 . (V=Volume)
Low oil prices will make it difficult to expand supply. Their forecasts rely on yet to develop resources that may not be developed due to low oil prices. As supply becomes short oil prices will rise, but only enough to keep us on plateau. Dreams of 100 Mboe/d output will be dashed, I doubt we will see 90 Mboe/d, though I have been wrong in the past (mostly due to underestimating URR by 900 Gb). We might make it to 95 Mboe/d with oil prices at $160/b, but it would be a short plateau of 3 years around 2025 with steeper decline than my plateau scenario.
I agree the LTO recovery may be lower than the IEA expects if EIA short term price predictions are correct. The LTO plays in the US will not be increasing output until oil prices reach at least $75/b.
When will we reach that point?
I have finally been convinced by the great data that you dig up that projects already near the final stages or recently started may keep oil prices lower for a longer period than I had believed until very recently.
We might not see $75/b until 2018 and possibly later, until we finally see a crash in the US LTO sector. I keep thinking this will happen soon, but I have consistently been wrong, so I will not venture any guess, beyond some time in the future (not a guess at all).
Hi AlexS,
The only real change in the demand projection is that they adjusted for the underestimate of 2015 liquids demand. The slope of the demand curve from 2015 to 2020 looks identical to the 2015 report, so not really a big change in demand growth over the 2015 to 2020 period.
Dennis,
You are right.
They are projecting for 2015-2020:
6.1 mb/d growth in the MTOMR-2016 vs.
5.7 mb/d in the MTOMR-2015
1.2 mb/d per year is not a spectacular, but still a healthy growth
Hi AlexS,
If we account for the IMF’s tendency to overestimate future growth and pare back their growth estimates accordingly we get only 2.2% real GDP growth for 2015- 2020 on average.
Using that lower growth rate and correlating with BP consumption data in barrels of oil equivalent (tonnes converted to barrels at 7.3 barrels per tonne) from 1997 to 2014, I get the following forecast where real GDP is assumed to grow at 2% per year (market exchange rates) from 2021 to 2025.
Consumption grows by about 1 Mboe/year (note that if all of this was NGL and biofuels it would be 1.4 Mb/d growth). It may be that the IMF assumes half the liquids growth comes from “other liquids” or they may assume faster growth in real GDP.
The correlation between World liquids consumption and World real GDP in chart below.
A scenario for World Liquids that attempts to match my demand forecast. By 2020 inventory is back to normal levels (about the 2013 level of oil in storage) and oil prices start to rise sharply (to $150/b or more in 2016$) between 2021 and 2025, despite this oil output barely meets demand by 2025 and output peaks that year. I doubt oil output can actually rise to this level or it will create another glut as high oil prices destroy demand, the excesses of 2010 to 2015 may be repeated, humans often repeat past mistakes. Whatever maximum output level is reached between 2020 to 2030 will be the final peak in my opinion (if it is higher than the 2015 level). My guess is 92 Mboe/d for the most likely peak level with a range of (90 to 94 Mboe/d) between 2020 and 2030.
Scenario below shows highest possible output (low probability scenario).
Below is an optimistic World Liquids scenario which tries to match my liquids demand forecast above. Is does, barely by 2025.
I expect the peak in World liquids output to be between 90 and 95 Mboe/d between 2020 and 2030. It may even be a glut scenario like we had in 2015, (if we get to 93 Mb/d or more with high oil prices around $150/b or more in 2016$).
Difficult to predict with any confidence. Optimistic scenario in chart below (reality will be between this scenario and the plateau scenario in my opinion).
Sorry for the double comment, my first comment disappeared so I though it was gone forever.
$33.39
Did we hit bottom?
I have no clue. I never get future oil prices right, a year ago I thought we would be between $75 and $100/b by now. I was about as far from the mark as one could be.
Dennis. OPEC minister hit on the issue of US inventories being critical to price.
If OPEC cut imports to US, especially as refining maintenance ends, that may be all that is needed. 7-12 million bo draws for a few weeks would cause a reaction.
Is it really the Saudis call to limit exports? Are they storing crude in the US?
I would think it is more likely that this is crude that has been bought by American trading companies and refineries. It is thus their call to limit imports.
Hi Shallow sand,
The other possibility is that Jeffrey Brown’s hypothesis that the “crude” in storage in the US does not match the refinery set up for most of the US refineries might be alleviated by exporting the high condensate liquids to countries that can utilize these blends. That could conceivably take care of the excess liquids in storage in the US, but will take some time.
Dennis, Have you made any allowance for the growth rate of EVs in any of your calculations? My growing belief is that they will make a large and rapidly growing dent in the needed oil starting from about 2020 or even earlier with some of the changes coming especially in China where EVs get preferential treatment in access and fees.
For most oil importing countries some of these measures make a lot of sense in copying to help with balance of payments etc.
With all the major manufacturers now having plans to introduce several models and leading ones like Mercedes and BMW upping the range of EVs in the next couple of years, coupled with incentives by governments to use them, oil demand may fall rapidly with the next increase in supplies or even a threatened supply shock.
I know official demand figures for EV growth are fairly low, but China alone has a mandate for 2m EVs/yr by 2020, and with the introduction of cheaper models are easily likely to surpass that number. By 2025 we could be talking 20-50% of new vehicles being EVs in oil importing countries, with hybrids and just increased fuel efficiencies, also dampening or negating oil demand.
Hi Hideaway,
My hope is that the gap between supply and demand (not enough supply) that is likely to occur after 2025 may be filled by switching to EVs and plug in hybrids and hybrids as oil prices rise.
In addition, people may move to areas with better public transportation and more walkable and cycle friendly neighborhoods. This will increase the demand for more rail and light rail and demand for liquid fuels may be reduced from all of these factors. Coal(2025) and Natural gas(2040) will also peak and will increase in price leading to more rapid adoption of wind and solar power. So no I am not so optimistic that a lack of demand will cause the peak, but am hopeful that high fossil fuel prices will eventually reduce demand for fossil fuels as they are replaced with alternatives. Currently wind and solar power have been growing at 25% per year (1995 to 2014 BP data), these rates will decrease, but oil and natural gas output grew at an average annual rate of 6.6% from 1900 to 1979.
Below is a conservative scenario with growth rates diminishing from 20%/ year initially to 12%/year by 2030 and falling to 4% by 2040 and 3% by 2050. Output from wind and solar is at 66% of 2014 primary energy levels and almost half of projected 2060 primary energy demand.
At growth rates similar to 1900-1979 oil and gas growth rates (6.6% per year) for wind and solar from 2036 to 2060, all primary energy demand could be met by wind, solar, nuclear, and hydro by 2060 (no growth from nuclear or hydro after 2025 and 1.5%/year growth from 2015 to 2025).
Does anybody have a link to Saudi oil consumption broken down by month. A few years of data would be nice. I’d like to see what increased demand might look like as air conditioning/peak consumption season approaches. How many more barrels of oil per day are they likely to shave off their exports for their own use this summer?
Saudi Arabia’s oil consumption (kb/d)
source: JODI
Thanks a lot!
looks like about 900,000 barrels a day of crude is gonna get shaved of KSA exports this summer. It’ll be interesting to see how this moves prices.
Bloomberg has an article up by somebody saying that it is a “game changer” now that the US can ship oil all over the world to compete with OPEC. I would guess that the guy has never read anything by Jeffrey Brown. I think that he thinks that we are an Export Land in the model. How can they not know that, in effect, except for quality differences, we are just exporting oil that we imported from Canada or some other place.
There is so much ignorance out there that it is going to be a rude awakening when it happens. All these guys advising investors to sell everything related to fossil fuels because they are not making any money, but they think that they will make huge profits at $50 bbl. Except that when it does get to $50, it will plunge again because the huge flood of oil that will hit the market. What a joke.
Except for those with strong hedges, Q1 2016 earnings will shock these fools.
US E & P performed horribly in 2015 with SEC price of $50.28. January we averaged about $32 WTI, February will be worse.
I think the idea that rigs start piling back into the field at $50 WTI is nonsense. Read EOG CEO Bill Thomas’ comments on this. EOG needs to see stable $80 or higher for months before they will add significant rigs, per Thomas.
How can these companies borrow 2013 type money to ramp up their production at $50, when they are reporting now their reserves at $50 are generally worth less than long term debt, applying the industry norm discount rate of 10%? Further, almost all the value is in PDP, so new wells at $50 have little to no value per what the companies’ own independent reserve reports say.
Shallow .
$50 oil is old hat. You need to keep up, lol
http://www.reuters.com/article/us-usa-oil-hedging-idUSKCN0VS01J
As 2017 oil rebounds to $45, U.S. drillers begin to hedge anew
Many believe $45 will save the day, or enough to stop them going out the back door.
I think I will stick to selling the popcorn,and sit back and watch!
How can these companies borrow 2013 type money to ramp up their production at $50, when they are reporting now their reserves at $50 are generally worth less than long-term debt, applying the industry norm discount rate of 10%?
Generally they can’t. I can think of only two, rather remote, possibilities:
1. The oil price jumps higher than we now expect sooner than we expect. That’s not very probable, but still possible, especially if in June OPEC cuts production even if symbolically (making the natural depletion of wells to look like a cut). Expectation of “$100 really soon” might restore the flow of loans, at least partially. The switch from the bust to the next boom can be seamless 🙂
2. Some kind of bailout/loan rotation mechanism and additional financing of operations will be implemented, modeled on banks bailout of 2008 (see Tarp http://www.investopedia.com/terms/t/troubled-asset-relief-program-tarp.asp). I think we can call shale oil “a subprime oil”, without much problems 🙂 . To assume that Obama administration allows those companies simply rot is a pretty cruel assumption, at least, to me. Everybody was crying “drill baby, drill” ( including Obama himself, Congress and EIA ). If now they allow those companies that listened to this clarion call (and indulged in some excesses 😉 ) to hang out dry that would be not very good for the last year of Obama administration. Which, essentially, was a cheerleader of the shale boom…
And possibly they are running out of sites where even $80 works, they won’t know for sure until they start expanding out of the core areas and the proportion of sweet spots falls off.
Bloomberg had a similar column in 2010, where they discussed the outlook for Brazil (a net oil importer) “Taking market share away from OPEC.”
I think Bloomberg is mixing the export of condensate which is overproduced in the USA and does not fit the refineries tune up with the export of oil which might be a more challenging idea.
But a few parts of this disinformation sound almost realistic:
http://www.bloomberg.com/news/articles/2016-02-22/oil-sands-growth-seen-slowing-or-halting-after-current-work
It is unclear whether this is a “real” WTI or “artificial” WTI that the US refineries do not want. I think it is the latter.
In any case, US net imports are trending up. Most recent year over year comparisons (four week running averages for mid-February):
2015:
Net Crude Oil Imports: 6.8 million bpd
Net Total Liquids Imports: 5.3
2016:
Net Crude Oil Imports: 7.3 million bpd
Net Total Liquids Imports: 5.5
[…] Source link […]
Here is a reason the shale player maybe holding onto there production number so eagerly.
http://www.downstreamtoday.com/news/article.aspx?a_id=51165
As U.S. Shale Sinks, Pipeline Fight Sends Woes Downstream
Take or pay pipeline contracts.
Companies in Chapter 11 are trying to break them. Two cases currently in court.
In the discussions here and concerning Bakken LTO has either of these two articles been mentioned? They are by David Hughes and Jean Laherrere.
The David Hughes one in particular looks to have predictions close to what has been happening. They both question EIA estimates of the amount of oil recoverable. For example from Hughes:
“The U.S. Energy Information Administration’s (EIA) forecasts regarding tight oil production—published in its Annual Energy Outlook (AEO)—are commonly viewed by industry and government as the best available assessment of what to expect in the longer-term, with the EIA’s reference case typically viewed as the most likely scenario for future production. In my Drilling Deeper1 report published last October, I developed alternate production forecasts for two major tight oil plays, the Bakken and Eagle Ford, and reviewed the credibility of EIA AEO20142 forecasts for other major plays based on the fundamental geological characteristics of each play. In most plays the AEO2014 production projections were found to be highly to extremely optimistic when reviewed in the light of play fundamentals. For the Bakken and Eagle Ford plays, AEO2014 overestimated the likely recovery of oil by 2040 by 42% compared to my “Most Likely” drilling rate case found in Drilling Deeper.”
http://www.postcarbon.org/wp-content/uploads/2015/09/Hughes_Tight-Oil-Reality-Check.pdf
This is from the Laherrere article (posted at POB) and looks, for something 18 months ago, as prescient as anything I’ve seen in the light of subsequent events:
“It seems that most oil companies are spending more than their revenues by increasing their debts. Countries can live for a long time with huge debt increase, not companies. They count on the stock market by delivering optimistic reports and keep drilling to avoid the production to decline. With shale oil or shale play, in contrary with conventional where wells are dry or producing, oil can be produced even for a while if not economical.
Such behavior explains why most peak forecasts are wrong. But the main question is about the slope of the decline after the peak. EIA forecast a LTO (light tight oil = shale oil) peak in 2017 it is not too far after my forecast, the big difference is the slow EIA LTO decline.”
http://peakoilbarrel.com/bakken-oil-peak-jean-laherrere/
George Kaplan
Although these reports are very interesting, they ignore in my opinion financial conditions – mainly the bond market – and oil prices as major drivers for oil production. Jean Laherrere is fully aware of this fact, yet does not provide oil production scenarios at different oil price and bond market conditions.
So, if oil prices would fall below 20 USD per barrel for a long period I am pretty sure, oil production for Bakken and Eagle Ford would tend to zero within a short time and all above production scenarios would be irrelevant.
If oil prices would recover, production will start again.
Yet it is in my view not possible to sustain horrendous losses for a long time. Somebody has to pay the bill. It is already clear now that high US oil production supports the US dollar, yet brings the bond market to its knees. The bond – and equity holders are paying currently the bill, yet for how long?
This comes especially on the background of the US bond market facing a maturity wall of USD 4.1 trn over the next four years. http://www.highyieldbond.com/the-2020-maturity-wall-4-1t-of-bonds-to-mature-and-13-of-that-is-high-yield/.
Companies can roll over the debt, yet at much higher interest rates.
Might be so. If the production continues to follow the Hughes predictions though, I’d say that will cast a lot of doubts over how much impact short term price swings have had. Possibly the availability of cheap money through most of 2015 overrode any price signals and they just kept on drilling no matter how much losses they incurred. You talking about a maturity wall now – how would that have impacted production in the past, especially when in the beginning of the price fall producers were expecting prices to recover at any time and later were concentrating solely in staying alive for the next month and couldn’t afford to look much further ahead.
With data currently available the main message I’ve got from this is that there is probably a lot less oil in the Bakken and Eagle Ford than EIA are saying – at any price.
George,
This is also my impression.
Hi George,
Laherrere’s estimate is too low. Hughes has a good estimate for the Eagle Ford, but I think he may have assumed the USGS Assessment for the Bakken in April 2013 was for the TRR, but it was the undiscovered TRR, when proved reserves and cumulative production (in Dec 2012) are added, the TRR increases to 10 Gb and if probable reserves are also added the TRR becomes 11.4 Gb.
If we only consider proved reserves plus cumulative production we come close to Hughes estimate for the URR of the Bakken/Three Forks, for the North Dakota Bakken/Three Forks this is about 6.7Gb at the end of 2014.
Bottom line, there is about 25-30 Gb of combined URR in the Bakken/Three Forks(10 Gb), Eagle Ford(8 Gb), and Permian (9 GB, LTO only), but $80 to $150/b oil prices will be needed for it to be profitable to produce. If oil prices never rise above $80/b the URR will be about half this estimate.
Dennis – I think we will find there is a lot less than that in the Bakken. But it will be interesting to see.
Hi George,
I agree the EIA estimates are too high, in the AEO 2015 they forecast 50 Gb of LTO output from 2012 to 2040, output is likely to be about half that level at best. The USGS has a reasonable estimate for the Bakken (11 Gb) and Hughes estimate for the Eagle Ford is reasonable (about 8 Gb), I would guess 8 Gb for the Permian LTO (Hughes does not give an estimate.) When the Niobrara and other plays are added we might see as much as 30 Gb with high oil prices, 25 Gb would be a conservative estimate in a high oil price scenario (oil prices rising to $150/b in 2016$).
Time will answer these questions.
Keep in mind the Eagle Ford has 3.9 Gb of proved reserves at the end of 2014 and 2P reserves are likely to be 5.8 Gb, cumulative production was 1 Gb at the end of 2014 so URR would be 6.8 Gb at minimum, for the Bakken a similar calculation would be about 6.7 Gb. For the Permian 2P reserves about 4.8 Gb and about 2 Gb have been produced so a minimum URR would be 6.8 Gb.
So for these 3 plays the combined URR would be a minimum of 20.3 Gb, with 4.2 Gb already produced, so at least 16 Gb left to produce (if only 2P reserves are produced and there is no reserve growth or new discoveries, highly unlikely in my view if oil prices rise in the future to $75/b or higher).
So, if oil prices would fall below 20 USD per barrel for a long period I am pretty sure, oil production for Bakken and Eagle Ford would tend to zero within a short time
No, it wouldn’t.
This is a peak oil blog but I am astonished at how perpetually people don’t accept what that means.
Oil scarcity drives elimination of normalcy. Oil scarcity drives every imaginable form of desperation, and some not imaginable.
If oil flow is not economic, it doesn’t stop. It can’t stop or people will die. If oil flow is not economic, the definition of economic will be changed.
Hi Watcher,
Not all oil comes from LTO. If it is not profitable to produce it won’t be over the long term. Why produce the oil for $75/b when you can buy it elsewhere for less?
Watcher – do you consider us to be in oil scarcity at the moment. It’s hard to see how. If you assume that shutting down the LTO would automatically create a scarcity then I get your point. We are tightly stretched with little resilience and could switch to scarcity very quickly from any number of impacts. I think more so now than ever since WWII. The speed of such a trip and the spreading repercussions are the biggest concerns for me. The debt bubble, geopolitical posturing, wealth disparity, resource depletion and ecology issues, even the major terrorism threats, all end up at oil. As you say it is key to everything. I was sitting in a city centre coffee shop the other day trying to imagine how things would look it oil had never been formed – and really couldn’t.
Hi George,
The only way is all stops is if World War 3 starts, if that is the case we will have other problems.
Watcher seems to imagine a Soviet style economy where production is ordered and profits don’t matter. I suppose it is a remote possibility, but so is an asteroid strike, I don’t concern myself with events with vanishingly small probability.
I disagree, re watcher. He may not be communicating what he’s trying to express very well, but my feeling is that he sees society as an organism that will do what it is required to preserve itself. It has nothing to do with ideology or superficial political labels. I personally find that to be one of the best ways to understand modern industrial culture. If you haven’t spent time in the woods watching a large any colony at work, I highly recommend it, you might find what he’s saying is a bit closer to the truth than you might like to believe. Now, if you’ve never watched an ant colony in nature at work, it may be hard to understand this point, but that’s the side effect of detaching ourselves from nature, not a fault with the argument itself. If you take the meta culture view and drop the individual actor view (better put, fantasy, or delusion), which is an odd view to take of a purely social species like humans in the first place since our every thought comes from our culture, language, social constructs, it’s an interesting take. Makes occupying certain intellectual belief patterns somewhat awkward though, so carry on, lol.
http://www.reuters.com/article/us-usa-oil-lawsuits-idUSKCN0VV0DK
‘Within weeks, two low-profile legal disputes may determine whether an unprecedented wave of bankruptcies expected to hit U.S. oil and gas producers this year will imperil the $500 billion pipeline sector as well.
Could this be the first domino to fall….?
Coffeeguy,
Some time ago you mentioned a well in ND that had the biggest initial production so far, Riverview 102-32H of EOG. If you go to shaleprofile.com, select “Well quality over the years”, select EOG as operator, and “Antelope – Sanish” as “Field & Pool”, you can see the quality of 8 wells from EOG in this area. The Riverview 102 is the only well that started in 2015. The Riverview 01 is the only other well on the same pad, which is the only one that started in 2010. So basically by looking at the 2010 & 2015 graphs, you can see these individual 2 wells on the same pad, and the effect on each other.
I thought this is an interesting case to follow, because we can test here the halo-effect, and whether these mega-fracs cause a lasting high production. So far I see 2 things:
1) You can see nicely that the 2010 well was stopped for some time, when the completion was done on the 2015 well. After the completion the 2010 well was also started again, and indeed had a higher initial production, but it quickly leveled off. On the cumulative graph of the 2010 well you can see that the total “halo-effect” was marginal, at least so far.
2) The 2015 had a huge initial production, but the relative drop has also been exceptional: Whereas the average 2015 well drops 56% 5 months after the peak month, the Riverview 102 has dropped 77% in 5 months after the peak. It has had a very impressive start, but it still has to show it has staying power after this massive drop. In Dec, in its 7th month of production, its performance has dropped to the 5th spot based on cumulative oil production.
Another thing I noticed : EOG has hardly done any Three Forks wells, it looks like they’re not interested in marginal stuff.
Enno,
Thanks, very interesting.
As I understand, this is a general rule that high IP wells have steeper decline rates.
Do your statistics confirm that?
Alex,
I think so, yes.
The following chart shows the performance of all MB+TF+Confidential wells that started in the period from 2013 to 2015, grouped by the quarter in which the wells started flowing. You can clearly see that there is a trend to higher IP wells, but that around month 15 the production rate is still the same. So higher IP, higher decline (at least relatively). It may stabilize after 15 months, it’s not clear yet whether this 1 time gain (of on average about 20 kbo over this time frame) early on has to be given back later in life.
The same info, but now including all MB+TF+Confidential wells that started between 2010 & 2015 (so 6 years of data).
Thanks a lot!
Enno
Heading out the door now, will respond more fully later.
Just yesterday Mike Filloon also wrote on these two wells (Feb 22 “Whiting Hedges …”. He described what you just did with with more details.
Riverview 102 32H put out 270k in six months. Impressive.
Their ‘mega frac’ was DESIGNED to stay close to wellbore.
Strongly suggest you check out Bruce Oksol’s posts on Pershing field and Truax field this past weekend.
Mr. Oksol goes into a very detailed, incontrovertible display of how this halo effect is playing out in these cases.
Bottom line, it is and has been happening.
EOG is looking to radically down space (as their 3Q presentation described) by maximizing near wellbore recovery and adding more, closely spaced wells.
Great work on your part, IMHO, as always.
Enno
Real quick. Check out the two wells’ location on Gis map.
2015 well #30286 heads north, #19247 heads south.
Same pad, laterals VERY far apart.
Coffeeguy,
OK, good point, so this data doesn’t say anything about the halo effect then.
Enno
Actually, it still may, although not as one may originally suppose.
The 2015 well pumped a LOT of water for the frac (150,000 bbl).
The 2010 DID have moderate increase in produced water after the frac, thus there was almost certainly hydraulic communication, albeit somewhat minimal.
Now, EOG seems to have about 10 more wells currently on the confidential list that are located in this section.
The results of these future wells, along with the existing offsets may prove very enlightening indeed.
Seas are rising way faster than any time in past 2,800 years
WASHINGTON — Sea levels on Earth are rising several times faster than they have in the past 2,800 years and are accelerating because of man-made global warming, according to new studies.
An international team of scientists dug into two dozen locations across the globe to chart gently rising and falling seas over centuries and millennia. Until the 1880s and the world’s industrialization, the fastest seas rose was about 1 to 1.5 inches (3 to 4 centimeters) a century, plus or minus a bit. During that time global sea level really didn’t get much higher or lower than 3 inches above or below the 2,000-year average.
But in the 20th century the world’s seas rose 5.5 inches (14 centimeters). Since 1993 the rate has soared to a foot per century (30 centimeters). And two different studies published Monday in the journal Proceedings of the National Academy of Sciences, said by 2100 that the world’s oceans will rise between 11 to 52 inches (28 to 131 centimeters), depending on how much heat-trapping gas Earth’s industries and vehicles expel.
The deniers were standing on one leg and a crutch. Now the crutch just broke.
Ron,
The deniers were standing on one leg and a crutch. Now the crutch just broke.
Not to appease deniers, but a century is a very long time. We might run out of oil faster than that with some difficulties already surfacing around 2030 and in 2100 the whole issue might become mute.
Iikbez – You clearly don’t understand the problem. It is a problem now and will only get worse without extreme reversal.
All of the bad things that are tied to AGW are getting worse, nothing is getting better, name one thing. Everything has feed back loupes that are self reenforcing.
This is what I don’t understand about the deniers or uncertainty sowers on this site. They all understand and accept the science around peak oil but can’t accept it when applied to AGW.
Irresponsible human activity has done enormous harm to the earth’s environment. We have been taught that man is the only creature capable of higher order thought process. Yet, there is little evidence that humans collectively use that ability in responsible ways. Our baser selfish instincts have led to a “survival of the fittest” society in which those in control act to secure their positions of dominance regardless of the cost. Even when clear evidence and experience show practices to be detrimental and even dangerous humans persist in willful ignorance and buy into political movements that work against their own best interests. The world has been around a long time and gone through periods of dramatic change. For the first time, natural forces of change will not be dominant and humans will bring about their own downfall by making the world inhabitable for themselves.
My opinion, humans can only wish they had a hand in the weather and all it can do for the world. Then they could cause changes to it for the better. Maybe they do have the ability to screw it up to a certain point, but they don’t have any control button. European countries with all the cold and snow this year or New England states with all the cold and snow last year are examples of a good display of this. Without adequate snow removal there might have been over a hundred inches of snow blanketing the entire regions…sort of like a wee little Ice Age.
I do understand and accept the science around climate change. It just doesn’t say what you say it says.
For example the rate of warming is getting better not worse. It is clear that the rate of warming between 1976 and 1998 was higher than the rate of warming between 1998 and now. Global warming is not accelerating despite one third of human emissions taking place since 1998. That’s good news.
Yes Javier,
It is a coincidence that you chose 1998, the strongest El Nino (perhaps to be surpassed by 2015) before 2015 on record. Looking at BEST Land Ocean Data the rise in temperature looks pretty steady after 1980 when we consider 20 year average temperatures, so that we are looking at climate rather than weather.
Well, Dennis,
Let’s then choose 2002 after both El Niño and La Niña. After all if you are going to compare trends you have to choose a point.
The conclusion is clear. The rate of warming is not getting worse.
Hi Javier,
Fourteen years is not enough time to judge much. The natural log of atmospheric CO2 has increased linearly from 1975 to the present. For best land temperature data vs natural log of CO2, the data from 1850 to 2015 suggests 2 C of warming above 1951-1980 average temperatures would be reached at about 490 ppm of CO2. Land temperatures were used because ocean surface temperatures will lag as the ocean warms.
At the very least you will have to conclude that there has not been an increase in rate of warming despite the huge increase in CO2 emissions; won’t you, Dennis?
So this is an aspect of Global warming that is not getting worse, and a pretty crucial one. Not exactly what you would expect from models that with increased CO2 produce increased rate of warming.
Hi Javier,
Are you familiar with a logarithmic relationship. The data matches the model pretty well, don’t you think?
It is proceeding exactly as one would expect.
That a model fits past data through hindcast is to be expected. Just run the model to the future, make your predictions and wait to see if they come true.
Hi Javier.
The correlation shows that the data matched the theory, empiricism plain and simple.
Dennis,
This just got published in Nature Climate Change, and contradicts your interpretation while supporting mine:
Making sense of the early-2000s warming slowdown
J.C. Fyfe et al. 2016. Nature Climate Change 6, 224–228.
“Our results support previous findings of a reduced rate of surface warming over the 2001-2014 period – a period in which anthropogenic forcing increased at a relatively constant rate.”
“Newly identified observational errors do not, however negate the exitance of a real reduction in the surface warming rate in the early twenty-first century relative to the 1970s-1990s.”
“This slowdown is evident in time series of GMST and in the global mean temperature of the lower troposphere.”
Hi Javier,
I am interested in climate, not weather.
The differences in rate are due to ENSO, nobody thinks that the rate of warming remains constant, though the long term trend using 20 year averages (the proper way to look at climate) has been relatively constant from 1970 to 2015 as I have demonstrated already.
I am fairly sure we look at climate differently, you take a shorter term view or a very long view (where you are concerned about a new glacial maximum which is unlikely within the next 200,000 years.
Note that “the little ice age” is a misnomer, it would be better termed the “somewhat cool period”.
Dennis,
The proper way to look at climate is decided by climatologists, not by you.
That paper is signed by Michael Mann and Ben Santer. The pause, now christened as “the slowdown” has been officially sanctified.
You (and Tom Karl and Gavin Schmidt) are left alone to defend that there is no pause.
Bad luck.
The most recent La Nina was 2011 not 2002.
Do you just make this stuff up as you go?
Dennis,
Where did I say that the most recent La Niña was in 2002? Please quote exact words.
Do you just make this stuff up as you go?
Chart with Jan 1980 to Oct 2015 20 year centered moving average temperature. No big change in 1998. With linear trendline shown.
Of course won’t show there. It’s the last 10-15 years when the warming has slowed. It will not appear at the end of such long window.
Again two years is enough in sea level rise to claim statistically significant change of trend, but 10-15 years is not enough for temperatures. Curious statistics.
Hi Javier,
The rate of temperature change has been pretty consistent from 1970 to 2015 if we look at 20 year averages, which is typically how climate is looked at.
For sea level rise I don’t really know, haven’t looked at that closely, the chart you presented had a pretty clear anomaly from the straight line trend starting around 2012, and last I checked 2016-2012=4 rather than 2 🙂
Dennis,
If you want to study rate of change, you should start by looking at rate of change without long averages.
This figure is from UK Met Office. It shows several interesting things:
1. Maximal rate of warming appears to be constrained to about 0.4°/decade.
2. The increase in rate of warming for the period 1975-1998 is due to the increase in minimal rate of warming. A similar effect is seeing in the 1910-1940 warming period.
3. Since 1998 the rate of warming has been falling, hence the pause.
4. Nothing in rate of warming displays an anthropogenic signature.
“the chart you presented had a pretty clear anomaly from the straight line trend starting around 2012, and last I checked 2016-2012=4”
That is for tide-gauge data only. If you check Jason 2 satellite altimetry data that I posted below you will see that the only upward deviation from the 2.9 ± 0.4 mm/year trend has taken place in 2015.
Are we making a new trend from last year’s data?
Javier,
I am interested in climate not weather. So we are looking for 20 or 30 year trends, if we look at very short periods we are no longer looking at climate. I get very high rates of change in temperature on a daily basis outside my door, I mostly worry about that when backpacking or skiing. 🙂
Dennis,
Except if it is sea level rise, then 4 years is a good looking new trend for you.
“For example the rate of warming is getting better not worse.” ~ Javier
Better and worse are normative statements. Most folks with PhDs in the hard sciences don’t speak in normative terms. It’s because they don’t measure whether something is good or bad but instead are measuring whether it’s big or its small. How about you come out and tell us your name and what it is you have a PhD in? Maybe refer us to some of your published journal articles.
That won’t get you anywhere, even if you are a reincarnation of futilist.
I was answering to Jef and using his words.
For a PhD you sure are shy about who you are and what you’ve published. I call that a ‘red flag’.
My scientific career has nothing to do with my personal opinions on peak oil and climate change. In both, controversial issues, I defend a minoritarian interpretation. In these days people should be more careful with the footprint that they leave on internet. The hostility that I get in this blog just for espousing minoritarian views is just a sample of the types of issues that justify a cautious approach.
The fact that all Republican candidates for president reject scientific evidence that climate change is occurring and is indeed made worse by human activity should cause alarm in the electorate. Hopefully the majority of voters will reject this nonsensical and dangerous position and elect someone with a brain in the fall.
Robert,
That’s a sign of a larger problem for certain Republican candidates 😉
http://www.huffingtonpost.com/ronald-hendel/senator-rubio-and-the-bible_b_2185890.html
Not that I care for your candidates and nor do I sympathize with your somehow extremist (from an European pov) republican candidates, but the proposition that climate change is going to become dangerous is an unproven hypothesis not supported so far by any evidence.
An impartial observer would acknowledge that global warming has been very beneficial to humanity, as the LIA was a terrible time and millions died because of pre-industrial climate.
Javier,
You should go stand in front of a large speeding truck on the highway because it’s an unproven hypothesis that it will hit you.
Please
Robert,
You should go stand in front of a large speeding truck on the highway because it’s an unproven hypothesis that it will hit you.
Really ? Are you claiming that standing in front of speeding truck is equal to doubts about global warning ? Unless this is not a well though out hyperbola you are sick, my friend.
Classic mechanics is undisputable. So results of standing of an object with mass M in front of the truck with mass T and speed S are predictable to a high degree.
Let’s assume that global warning currently is happening as measured by average Earth temperature. But the assumption that it is happening due to human activity not some periodic cycle after which global cooling will re-emerge, is much less proven. Here we also need to include in the model the activity of Sun (big unknown which could have century long cycles), variations of Earth orbit, angle as well as possible speed of rotation variations, activity of volcanos, ocean currents and their long term dynamics, the level of transparency of the atmosphere (did you hear about such notion as “Nuclear winter”) etc. Earth with its atmosphere is a very complex system and to predict how Earth climate will change with certain anthropogenic inputs is a very challenging task. Because there are not the only one you need to include in the model.
The key problem is that for such a short period as one century it is unclear if we deal with human induced trend or some other trend correlated in time with a rise (and coming fall) of oil based human civilization which caused additional CO2 emissions (which still can be a contributing factor). And BTW what is the optimum temperature for the life on Earth ? May be it is higher then current. May be it is lower. But why it is assumed that temperature at the beginning of XX century was optimal for the life on Earth and should be preserved by all means?
See for example http://euanmearns.com/global-warming-and-the-irrelevance-of-science/#more-12591
Why such an uncompromising attitude. Are you a religious zealot ?
Did you study at school such notions as accuracy of measurements and error margins? What about statistical theory ? You remind me brave souls from EIA which provide four digits for measurements which at best has 1% error margin with some that has error margin closer to 10%.
While I personally think the humans might be the reason. I at the same time consider it to be an unproved, albeit plausible hypothesis. The one that has the right to exist along with many others. For example, a model that explains this phenomenon by century long (or so) variations of activity of Sun would be OK in my book.
Why this alternative hypothesis should be disregarded? Nobody measured activity of Sun for a century with any accuracy so this is just one unknown variable.
See also
http://rps3.com/Files/AGW/EngrCritique.AGW-Science.v4.3.pdf
https://www.heartland.org/policy-documents/7-theories-climate-change
http://clivebest.com/blog/?p=6143
http://connection.ebscohost.com/c/articles/62168414/global-warming-critique-anthropogenic-model-consequences
Hi Likbez,
Paul Pukite has considered a number of possible reasons that temperature has changed. Changes in CO2 level (C), changes in the Southern Oscillation Index (S), changes in aerosols (A), changes in the length of day (L), and changes in the total solar irradiance (T). He calls it the CSALT model, see
http://contextearth.com/2013/10/26/csalt-model/
I have checked and it does a fair job of reproducing temperature, see chart below where BEST land temperatures were used.
I am coming to the conclusion that the scientists that argue against AGW theory are loose cannons. Take this AGW denier Richard Lindzen from MIT, a run-of-the-mill scientific contrarian who makes up stuff that is trivial to debunk. I saved this tweet conversation that I had with a disciple of Richard Lindzen yesterday:
http://imageshack.com/a/img921/5169/AXob9w.png
That was based on an interview that Lindzen did recently on the state of climate science:
http://cliscep.com/2016/02/23/catastrophe-was-the-narrative-from-the-beginning-says-lindzen/
where he says “We increasingly are getting students who are not as sophisticated as they used to be.”
And thanks Dennis for the link to the CSALT model. In retrospect, that approach has some staying power. In some ways, despite the complexity of the climate system, it is actually easier to model than oil depletion, as there is no human game theory element. Its all physics so as long as you get the math right, you can do some impressive modeling.
Thank you, for all the knowledge you have shared.
From The Oil Conundrum (big document that takes some time to load, but is where I learned the Shock Model with Dispersive Discovery) see link below,
http://entroplet.com/ref/foundation/TheOilConundrum.pdf
or if the link above does not work try,
https://drive.google.com/file/d/0B4nArV09d398TW80QXJqV0xLdms/view?usp=sharing
to your more recent work at Context Earth
http://contextearth.com/
Scientific consensus: Earth’s climate is warming
climate.nasa.gov/scientific-consensus
That’s strange, Ron.
Somebody should tell NOAA, because their Laboratory for satellite altimetry has not detected any increase in the rate of sea level rise for the last 24 years.
Another case of different instruments saying different things?
from the article:
“An international team of scientists dug into two dozen locations across the globe to chart gently rising and falling seas over centuries and millennia. Until the 1880s and the world’s industrialization, the fastest seas rose was about 1 to 1.5 inches (3 to 4 centimeters) a century, plus or minus a bit. During that time global sea level really didn’t get much higher or lower than 3 inches above or below the 2,000-year average.”
So before 1880, the fastest measured global sea level rise was only ~0.3-0.4 mm/year. The current rate of change, according to the NOAA altimetry chart above (1993-2016), is nearly 10x that.
And why is that surprising?
The LIA that ended around 1825-1850 was the coldest period of the Holocene, with the largest glaciers and lowest sea levels in thousands of years.
Since then sea levels have been on the rise, but there is no discernible anthropogenic signature in that. It started long before our emissions and it would most probably proceed even if we reduce our emissions.
This graph is from EPA using CSIRO and NOAA data.
Note the data ends in 2011 in the chart above.
I have posted above the altimetry data between 1995 and 2015. No change in rate.
Looks like a statistically significant change in trend from 2012 to 2016. Perhaps you should have your eyes checked. 🙂
Perhaps he should take a stats course. PhD!? I call bullshit.
Hmm, you just said that 18 years is not enough, but now it appears that 4 is plenty. You are trying to have it both ways.
That’s the graph that I had, but as I showed above satellite altimetry does not show any acceleration in sea level rise, including data from 2015.
Anyway your beloved IPCC does not believe sea level rise has shown any acceleration during the 20th century.
Figure 3.14 from Chapter 3, AR5 WG1
You can read it there, at section:
3.7.4 Assessment of Evidence for Accelerations in Sea Level Rise
There is no excuse to defend that sea level rise is accelerating, as the information is there for all to see.
Hi Javier,
I see an increase from 1 in 1910 to about 3 in 1992 (altimeter).
Perhaps a factor of 3 change seems small, as the oceans continue to warm the water will expand and sea level will rise, pretty basic physics.
Dennis,
You seem to be missing that multidecadal variability in rate of sea level rise precludes any conclusion about increasing rates of sea levels.
You really should read IPCC position on the matter from the link above before arguing against it.
Hi Javier,
The IPCC can get some things wrong and I am not interested. Do you agree that the oceans are likely to warm in the future? Do you think it likely that higher temperatures will result in continuing melting of ice sheets?
You are correct that there has not been a clear acceleration of sea level rise based on the charts you showed, I have seen other charts of actual sea level (rather than the rate of increase) that suggest some acceleration. This may be an area in need of further research such as that covered at real climate.
http://www.realclimate.org/index.php/archives/2016/02/millennia-of-sea-level-change/
Hi Dennis,
It is obvious that higher temperatures would continue melting ice sheets. the question is that we don’t know what the future climate is going to be.
Right now Argo system tells us that several oceans of the Earth are not warming, and some are cooling. The warming is coming from Southern oceans 20°S-60°S.
Hi Javier,
It is the global picture which is important, the purple line (the one that matters) shows relatively consistent warming since 1970, also note that the Southern Ocean is relatively big because there is less land mass in the Southern hemisphere.
Future climate is unknown, but likely to be warmer than the present, it will take some time to cool the oceans once they have warmed.
Dennis,
You just answered. “Relatively consistent warming since 1970” means relatively consistent sea level rise since 1970. Doesn’t it?
Cooling of the oceans just requires an extra bit of vertical mixing. The average temperature of the oceans is very, very cold.
I do not know if future climate will be warmer, nor does anybody. Global warming is 350 years old and similar periods in the Holocene are two to four centuries long. Global warming will likely end one day, and then the planet will have Global cooling. That is 100% sure.
Hi Javier,
From p 258 of the IPCC document you linked it states that average sea level rise from 1901 to 2010 was 1.7 mm/year and that the rate from 1993 to 2010 increased to 3.2 mm/year. It seems the document says the opposite of what you assert. Screen clip from page 258 below.
Dennis,
Of course it does say that, and despite being true that does not mean that sea level rise has accelerated. It is the product of picking start and end dates. Check figure 3.14 I posted above. 1993 to 2010 rate should be compared to 1920-1940.
From pg 290 of the IPCC report:
“The trend in Global Mean Sea Level observed since 1993, however is not significantly larger than the estimate of 18-year trends in previous decades (e.g., 1920-1950).”
A post at Real Climate about sea level rise at link below:
http://www.realclimate.org/index.php/archives/2016/02/millennia-of-sea-level-change/#more-19203
Whether it is weather, climate change, El Nino or something new the state of Arctic Sea ice looks to be a major outlier at the moment (i.e. the winter maximum area/extent is well below anything seen recently and temperatures there are far above average, meaning ice volume is about to start falling when it should be still growing for a few more weeks).
http://nsidc.org/arcticseaicenews/charctic-interactive-sea-ice-graph/
The Arctic appears to act as a sort of overflow tank for northern hemisphere heat – i.e. excess heat gets dumped there by melting the ice without raising temperatures and in colder years the ice builds up ready for use next time. But if everything melts then this function goes away and the effects will be seen all over as more severe weather extremes.
It is more complex than that. During winter sea ice acts as an insulator preventing the loss of heat from a warmer ocean to a colder atmosphere. Right now the Arctic ocean is cooling more and that heat is being mostly radiated to space, since it is dark most of the time.
We cannot predict if this lower maximum will develop into a lower minimum or not.
Yes indeed very complex. That’s why we have trained climate scientists and specialised institutions and places of learning where they understand these things in detail.
Javier, I would like to know more about your credentials as well.
http://www.theguardian.com/environment/climate-consensus-97-per-cent/2016/feb/22/fossil-fuel-funded-report-denies-the-expert-global-warming-consensus
Sorry chilyb,
I do not provide any personal data over the internet. No exceptions.
Ron has my full name since I published a guess article sometime ago in his blog, and can check my publication record anytime. I am sure he would call my bluff if I wasn’t a real scientist. I would also provide it to him if he requested it. By email.
Hi Javier,
that’s probably a good policy. I didn’t think you were a climate scientist, but I just wanted to double check. If I recall correctly from your guest article (on population?), you are a biochemist. That’s OK , I am not questioning if you are a scientist. I know plenty of scientists that believe all kinds of crazy shit.
Climatology is outside my area of expertise, so I won’t debate the specific scientific points with you. I am actually more interested in how you can explain that the vast majority of climate scientists working for different institutions all around the world believe that AGW is real and, in fact, an issue for us to be concerned about? Do you think this is a global conspiracy? I actually know someone that thinks this. According to the Guardian article I linked above, there are almost no peer review reviewed publications that disagree at this point. I find it hard to ignore that.
In the end there are plenty of things for us to be worried about. Peak oil is one for sure. And even without the unproven theory of climate change (we are doing the experiment right now), plenty of other ways for us to poison the ecosystem. Or we could just run out of water. So I am with you that it would be great if there was one less thing to fear.
Hi chilyb,
Of course there is no global scientific conspiracy. That is silly.
It is actually very easy to explain.
1. Global warming is undeniable and AGW is part of it. We just don’t know how how much of GW is AGW versus NGW.
2. The CO2 hypothesis that explains all GW in terms of GHGs, although unproven (unable to reject the null hypothesis that an important part of GW is NGW), is the dominant hypothesis. Most scientists will back the dominant hypothesis because it is not their job to check its solidity. This has always happened.
3. Almost all scientific funding goes for studies supporting the CO2 hypothesis. It is almost impossible to get a study funded to challenge the CO2 hypothesis. Most scientists in a field will align with funding policies. That’s how governments control public research. IPCC was created to investigate exclusively AGW, NGW falls outside of their mandate.
4. A small field like climatology is dominated by proponents of the CO2 hypothesis and the main journals have aligned with them. By challenging CO2 hypothesis you damage your scientific career by publishing less, in second rate journals and you get less funding. On top of that you get personal attacks and character destruction in the MSM and internet. Who would want to go through that? That’s why many public opponents of the CO2 hypothesis are retired. They don’t risk that much.
5. Those scientists that are not directly involved in the controversy but have doubts about the CO2 hypothesis, have no incentive to speak up. They’ll say nothing and wait for science to sort the mess as it always does albeit sometimes it may take decades. When correctly and anonymously polled about 33% of climate scientists do not show support for GHGs being responsible for >50% of recent GW, and only 17% agree with the IPCC thesis that GHGs are responsible for >100% of recent GW with other factors causing cooling. These numbers are what you would expect for a dominant hypothesis, as scientists by definition do not agree much on unsettled scientific matters.
Does this explanation look plausible enough to you? Scientists are humans, and they are moved by the same desires of job security, personal gain, fame, and career advancement as anybody else. Right now the best way to achieve that for a climatologist is to align with the CO2 hypothesis, and for some to go to the MSM and spread alarmist opinions that immediately get published and amplified.
Hi Javier,
That is probably true of mediocre scientists. The good ones look for the truth, perhaps the majority of scientists in the field find the anthropogenic hypothesis valid.
Note that very few of them believe that there is no natural variation, their concern is that too much warming may be difficult to adapt to. Too much heat can also kill people, just as too much cold can.
There is also uncertainty about how much warming might result, we can assume that lower estimates are correct, but that is also an unproven hypothesis.
The data suggests the equilibrium climate sensitivity is about 3.3 C (based on 1850 to 2015 data).
The natural carbon cycle of the planet draws down atmospheric CO2 at very low rates, so once the anthropogenic emissions are reduced the atmospheric CO2 remains relatively high for 1000 years.
If 1500 Gt of Carbon were emitted by humans (all sources including land use change) atmospheric CO2 would rise to about 650 ppm and once emissions stopped atmospheric CO2 would take 1000 years to fall to 360 ppm. After that the CO2 level falls very slowly reaching 305 ppm after 100,000 years, so we won’t need to worry about another glacial maximum for 200,000 years or so.
See
https://geosci.uchicago.edu/~archer/reprints/archer.2005.fate_co2.pdf
Hi Javier,
So you suggest a complacency theory, not really a conspiracy theory? I think this is very doubtful, but on some level I am willing to accept that it is plausible. The two things I know with certainty are the infrared absorption spectrum of carbon dioxide and the keeling curve which has measured a doubling of atmospheric CO2 concentrations from pre-industrial levels. I think how much that has specifically contributed to global warming is much tougher to estimate as there are other potent greenhouse gas emissions to consider, such as methane (porter ranch?) and perfluoroalkanes. Also black carbon soot deposition on the ice sheets will certainly accelerate melting.
Anyway, thanks for interesting opinions. I don’t really come to Ron’s blog to learn about climate. However, I am curious if you are posting/debating your ideas on another message board with a higher level of expertise on this topic. I’ll be sure to take a look- thanks.
Javier, Your concerns are much too nebulous for anyone to get excited about. Its like complaining about the media and saying that they are all in cahoots, yet you can always find journalists that don’t toe the line.
Dennis said:
“The data suggests the equilibrium climate sensitivity is about 3.3 C (based on 1850 to 2015 data).”
This 3C estimate for effective doubling of CO2 concentration hasn’t changed since the Charney report in 1979. If it remained 3C after another 36 years, would you still complain ?
Dennis,
“Note that very few of them believe that there is no natural variation”
I have demonstrated over and over to you that IPCC does not believe there has been any natural contribution to 1950-2010 warming. Are you having trouble learning this?
“The data suggests the equilibrium climate sensitivity is about 3.3 C”
No it does not. Data from observations indicates a 1.5-2.0°C ECS. Data from models suggest higher values, but who trusts models above observations?
“The natural carbon cycle of the planet draws down atmospheric CO2 at very low rates
Untrue. Natural sinks have been growing as fast as our emissions so the remaining fraction is about 45% of human emissions. An increased rate of depletion reduces residence time and increases decay levels.
As far as I know high interglacial CO2 levels have never prevented glacial inception. It remains an unproven hypothesis that a doubling of preindustrial CO2 levels could prevent a glacial inception. An hypothesis that it is likely to be incorrect as it is based on assumptions of high climate sensitivity.
Chilyb,
” The two things I know with certainty are the infrared absorption spectrum of carbon dioxide and the keeling curve which has measured a doubling of atmospheric CO2 concentrations from pre-industrial levels.”
Yes 100% of scientists would agree on those two things.
Thank you for a civil discussion on climate change, that I always appreciate.
I am not a regular poster at climate change places. Over at WUWT I am attacked as an alarmist because I defend that CO2 warming is real and demonstrable. The debate is too politicized for my liking.
I do post on climate change at my own blog in Spanish, but my main interest there is Peak Oil and its consequences.
Of the two main perceived problems for humanity in the medium term, one is a real problem and the other is not. Curiously >95% of people on Earth have both wrong, believing that Peak Oil is not an issue but Climate change is. We are crossing the train tracks looking to the wrong side.
Hi Javier,
No you have demonstrated very little, note that there is a lot of time outside of 1950-2010. If the natural variation was sinusoidal (it is not) and the period of the cycle was 60 years then the level of natural warming might have been identical in 1950 and 2010. In that case climate scientists could claim that there is indeed natural variation (which they all do) but there are periods where most of the observed warming can be attributed to an anthropogenic cause.
In the past 800,000 years there has never been a glacial maximum with atmospheric CO2 over 250 ppm, usually it is under 200 ppm. Read the Archer paper, that is how science is done the atmospheric CO2 remains in the atmosphere longer than you believe.
If we use land data from Best (because the ocean will take 400 years or more to reach equilibrium temperature and keeps ocean temperatures cool in the interim), the ECS is over 3C. Just take the equation on my chart with the correlation of temperature and ln (CO2) to confirm using x=ln(400) and x=ln(280) to confirm. The transient climate response is lower. Note that most humans live on land so the land temperature is more relevant.
What IPCC believes about natural contribution to warming.
Zero.
IPCC
Climate Change 2014
Synthesis Report
Summary for Policymakers
Figure SPM3. page 6.
“The best estimate of the human-induced contribution to warming is similar to the observed warming over this period.”
Published equilibrium climate sensitivity values based on observations have currently an average value of 2.
In the past 800,000 years there has never been a glacial maximum with atmospheric CO2 over 250 ppm
In the past 2 million years every single glacial inception has taken place at maximum CO2 levels. There’s never been 400 ppm as far as we know during the present Ice Age, but that doesn’t mean that glacial inception is not possible at those levels. Past Ice Ages had much higher CO2 levels.
That glacial inception cannot take place at these CO2 levels is one more of the many assumptions not supported by evidence.
Jav – Please tell me why it is so important for you to generate doubt about AGW. You have said that you care not one bit about the politics of the thing which is where it ALL plays out.
By far the science is pretty clear and if even half of it is accurate humanity is in for one hell of a ride and there is even a possibility that it is a one way ride but you are making it your mission, going way beyond the pale, to refute all of it……WHY?
Jef, it is not important to me personally. I believe it is a non issue because there is no indication that global warming is going to proceed to the point of becoming dangerous. Peak oil is going to make it irrelevant.
There are two reasons for me to care about climate change.
The first is scientific curiosity. Climate change is one of the most interesting complex problems and is a very popular one. You can talk and discuss it with a lot of people, and new information is discussed widely.
The second is that it makes me mad that all the people in the world are being scared by an unproven hypothesis that looks wrong on many issues and that is trying to invert the burden of proof.
The question is not to generate doubt about AGW, it is to show that science has not decided about the CO2 hypothesis despite claims to the contrary, and to tell people that they have nothing to fear from the climate so they can have one worry less.
“to tell people that they have nothing to fear from the climate so they can have one worry less.”
That is your tell buddy. I am an old guy with no children. To me, the future extends to about ten years max. Frankly, after many years of arguing with folks like you, I no longer give a shit. The physical world is going to do what it is going to do regardless of spin.
But there is a very real agenda behind those who wish to create a sense of complacency regarding climate change. In my observation, most common, besides financial self interest, is ideology. The fact is that with a global problem like climate change that transcends boarders and effects everyone on its own time-scale the only proactive remedies involve collective action. And for a certain segment of the population, collective action is anathema. It is a threat to an abstract notion of “Liberty”. Even if this “Liberty” is the vehicle for self destruction.
In my experience, nearly all of the resistance to the scientific consensus regarding climate change amounts to a convoluted rationalization used to pre-empt a need for the logical response to the problem. Because the logical response doesn’t fit a certain segment of the population’s conception of what is ideologically acceptable.
Yes, SW, I don’t think Javier is the kind of guy that could interact at a place such as the Azimuth Project, where we are collectively 🙂 working on formulating mathematical climate science models amongst other projects.
https://forum.azimuthproject.org/discussions
It is probably too communal and socialistic for his tastes, and along with his buddy Fernando, reminds him of Castro’s Cuba too much, lol.
Is it difficult to find the time during the day to toe the party line regarding climate change on “means of messaging” such as Twitter and collectivist 🙂 scientific forums while also attending Bernie Sanders rallies at night?
SW,
I agree 100% on this:
“The physical world is going to do what it is going to do regardless of spin.”
The rest has nothing to do with science, so I don’t care much.
@Jav- for a guy that finds it not that important and claims not to care you sure seem to spend a lot of time and energy online at various websites refuting the significance of AGW. You appear to have an agenda and based on your extensive engagement and pursuit of opportunities to comment on the topic I conclude it is important to you. That you now deny it is important to you is called ‘deflecting’. You are just one big ‘red flag’.
You ask, I answer. You don’t believe it, that’s your problem.
Javier – probably you do not realize what a puerile, condescending creep you come across as. Mostly it is easily ignored, low level irritation, sometimes even half amusing. But when it comes to you thinking that you are somehow empowered to decide what the rest of the world should or should not worry about, you need to pause before posting, and then always, that is without exception, choose to shut the fuck up.
I do not expect any gratitude, Another Starry Night,
People are usually not grateful when they are told that science does not support their beliefs. And apocalyptic beliefs are deeply ingrained in Christian mythology that contaminates most Western nations.
But tell you what, I won’t tell you what to do and you won’t tell me what to do.
Interesting, since the thermal conductivity of water is 0.6 W/(m-K) and the thermal conductivity of ice is 2.2 W/(m-K). Just the opposite.
Also cloud cover keeps much of the heat from going into space.
“The multidecadal trends from surface observations over the Arctic Ocean
show increasing cloud cover, which may promote ice loss by the longwave
effect. The trends are positive in all seasons,…”
http://www.atmos.washington.edu/~rmeast/ThesisSub.pdf
You should tell NASA
“And sea ice creates an insulating cap across the ocean surface, which reduces evaporation and prevents heat loss to the atmosphere from the ocean surface. As a result, ice-covered areas are colder and drier than they would be without ice.”
And polar regions are the areas where more energy is radiated to space than it comes from the Sun, as their net balance is negative, specially during the winter and despite clouds.
http://peakoilbarrel.com/the-problem-of-the-human-population/
Looks like Javier does his homework. I am sure he has at least a GED. ?
I will predict that by the end of January of 2017, President Obama will no longer be the POTUS. har
Wow, so converting surface material to a higher conductivity reduces heat conduction. How amazing. As far as evaporation goes, most of it is initiated by photon impingement, not present in Arctic winter, and very little will occur at those low temperatures. Sublimation of ice does occur.
Do you have an actual scientific paper to support these claims rather than some essay for the public from someone whose listed papers are “Mayan Mysteries” and “Technical Communicators as Managers in the Informated Workplace”?
Your statement that “more energy is radiated than comes from the sun” does not apply to this situation. Doesn’t matter where the sources of energy originate. We are talking about changes in energy (differentials). The change in energy at the Arctic is positive. Also more clouds cause more longwave radiation to arrive at the surface, another positive heat input change. And more light is absorbed by decreased albedo. All positive inputs. Positive differentials are occurring across all seasons, winter included.
Where are the negatives.? Or is the ice mass disappearing for some other reason than increased heat? Maybe the polar bears are eating ice now. 🙂
BTW of course the Arctic ocean surface is cooling now, it’s winter, it is just cooling less than it did in past winters.
GoneFishing,
“Do you have an actual scientific paper to support these claims”
Do you have a problem running your own searches in Google scholar?
Sea Ice Effects on the Sensitivity of the Thermohaline Circulation:
“Both, the insulating effect of sea ice and the ice-albedo effect, amplify the formation of sea ice. Because the heat flux to the sea ice base is much slower than heat loss to atmosphere, high-latitude deep convection is suppressed.
Using a thermodynamic sea ice model, we conclude that the ice’s role as an insulator is more important than its impact on salinity.”
Ok, radiative flux from open water is greater than conductive flux from ice covered water. Had to dig deep to get that one. Not from your article which is a model of the ocean interface. Less insulation as sea ice disappears. Radiation goes both ways, as does conduction. The delta Q is positive.
However, it makes no difference since we are talking about changes in total heat and the net changes are positive. Since there is more open water, there is a positive heat gain from lower albedo and a greater gain from longwave radiation due to increase in clouds and greenhouse gases. Inputs of heat from warmer lower latitude regions will have increased due to heating there.
That is why there is one third the ice mass as measured in the 1980’s. One cannot talk away the massive changes seen in the Arctic regions in a very short period. The trend is continuing.
Hi Javier,
It’s my understanding that the temperatures have been well above average in the arctic this winter. And we may well see a lowest maximum sea ice extent on record. Things could be lining up for significant melting of the sea ice this summer. I defer to the expertise at the arctic sea ice blog on the analytical measurements behind this.
http://neven1.typepad.com/blog/2016/02/an-exceptional-exception.html
Yes, chilyb,
It is clear that temperatures have shown a significant deviation from average this winter in the Northern Hemisphere. That’s why we had a record warming. It is clear also that Arctic sea ice extent is so affected as to probably produce a lower maximum record by March.
What it is not so clear is what the situation is going to be next September and if we are going to have also a lower minimum record or not. That, nobody can tell at this point. There are a lot of things that are not straightforward with sea ice, and one of them is that
Melting sea ice increases Arctic precipitation, complicates climate predictions
The increased precipitations could mean more ice by September, not less.
http://portal.ransquawk.com/headlines/saudi-oil-minister-al-naimi-says-oil-freeze-is-the-beginning-of-process-and-a-reduction-in-output-will-not-help-23-02-2016
That’s what he is saying. Don’t filter it through your presumptions.
Wow.
This is a pretty big deal. Especially where I’m in (high cost oil country, namely Alberta).
The pain is going to be here for a good long while.
Of course, maybe China’s economy will pick up and grow like gangbusters. Or India’s. Or someone’s. Someone has to buy all this oil floating around!!!!
Yes, has anyone noticed swimming pools filled with oil in their neighborhood?
I haven’t.
Why would anyone let oil go on a tanker and leave port unless they were paid for it? Answer: They wouldn’t. They get paid for it because they had an order for it and filled the order. Why would they cut output and refuse to fill customer orders?
So who placed an order for oil they weren’t going to sell to someone else who would then burn it? Answer: No one did. They had customers and the customers placed orders for it because they needed to burn it, and then took possession of it and burned it.
Why contort thinking on this? It’s simple and clear.
Hi Watcher,
Yes it is very clear that there is an excess of oil being produced and that is why prices are so low, to everyone except you.
“Why would anyone let oil go on a tanker and leave port unless they were paid for it? ”
This is a common practice. The tankers leave ports and can several times change directions as the owner/seller of oil is trying to find the best buyer.
Interesting. How about offloading? That ever happen without paying the producer? Because if the theory proposed here is all the storage is in tankers, you’re going to have to find about a billion barrels sitting unpaid for — all whilst KSA says they produce what they have orders for.
Read, for example, this article:
Why oil speculators are turning to ships as floating storage
The Globe and Mail, Monday, Feb. 22, 2016
http://www.theglobeandmail.com/report-on-business/industry-news/energy-and-resources/why-oil-speculators-are-turning-to-ships-as-floating-storage/article28846311/
Other recommended reading:
IEA Oil Market Report, January 2016, p.33
About 20 to 25 of the world’s 650 supertankers, which can hold two million barrels and are called very large crude carriers, are in use as floating storage,
That’s 2 X 25 = 50 million barrels. The alleged oversupply of 3 mbpd for 20 mos (since June 2014) is 20 X 30 X 3 = 1.8 billion barrels.
Do they offload without paying the producer?
There was never 3 mb/d oversupply, not to say for 20 months.
The oversupply peaked at 2.2-2.4mb/d in 2Q15, according to various estimates (see the chart below).
From IEA OMR, January 2016:
“A notional 1 billion barrels of oil was added to global inventories over 2014 – 2015 and our latest supply and demand balances suggest builds will persist with up to 285 mb expected to be added to stocks over the course of 2016. Despite estimations of current space storage capacity and the outlook for significant capacity expansions over 2016, this stock build will likely put midstream infrastructure under pressure and could see floating storage become profitable. ”
The volume in floating storage is a small part of total global inventories.
It can belong to producers (particularly, the NOCs) or to large traders.
One more time.
Do they offload without paying the producer?
“I don’t know” is an entirely solid answer.
Who “they”?
Oil stored in tankers may belong to:
1) oil producers, particularly the NOCs (national oil companies). For example, Iran’s ~40 million barrels of crude and condensate stored in tankers belongs to the Iranian national oil company.
2) oil traders, who have bought that oil and are storing it in tankers in a hope that they could sell it later at a higher price.
Alex,
Can you please explain how in oversupplied Europe Iran suddenly found customers for more then 0.3 Mb/d (Italy, Greece and France; Spain is next).
You should see inventories rising by the same amount because according to the “oil glut” theory this oil can’t be consumed, don’t you ? And 0.3Mb/d is 9 Mb/month. Most large oil contracts are long term and you can’t break them without penalties.
Also in the USA no producer with reasonably good quality oil (“sweet” with reasonable API gravity) has any difficulties selling any volume he can produce. Moreover buyers ask for additional volumes. Note the word “selling”, not putting in storage at his own expense.
Theoretically within “oil glut” framework there is no place for this oil to go other then in storage. And storage costs now are very high in Continental US so there should be reasonable attempts to minimize losses due to large amount of stored oil, which should limit “new” oil buying.
So it looks like “glut theory” (which is essentially an extension of neoclassical supply/demand model) has some serious holes in it.
“Can you please explain how in oversupplied Europe Iran suddenly found customers for more then 0.3 Mb/d (Italy, Greece and France; Spain is next). “
Iran is selling its oil in Europe at a big discount trying to regain its market share in this region. The customers are happy to buy Iranian oil at a lower price than the Saudi or Russian oil. The market is oversupplied, therefore part of oil supplies goes to storage.
“You should see inventories rising by the same amount because according to the “oil glut” theory this oil can’t be consumed, don’t you ? And 0.3Mb/d is 9 Mb/month.”
1) Inventories in Europe are rising. Thus, according to the IEA, in December, even prior to the restart of Iranian exports, they have increased by 0.29 mb/d, or 9 million barrels.
2) Oil exporters are constantly adjusting their geographical mix of oil supplies. So with increasing volume of Iranian oil directed to Europe, Russia and others may have redirected part of their supplies to China.
“Most large oil contracts are long term and you can’t break them without penalties.“
Oil is not natural gas. Contracts are much shorter than typical take-or-pay contracts for gas supplies. A lot of oil is sold in the spot market. In general, the oil market is very flexible.
“Also in the USA no producer with reasonably good quality oil (“sweet” with reasonable API gravity) has any difficulties selling any volume he can produce. Moreover buyers ask for additional volumes. Note the word “selling”, not putting in storage at his own expense.”
When a customer in US or any other country buys oil, it may consume (process) it or put in storage. With the current low price of oil and a steep contango, it makes sense to put oil (or refined products) in storage. Therefore, oil and product stocks in the US are increasing.
“Theoretically within “oil glut” framework there is no place for this oil to go other then in storage. And storage costs now are very high in Continental US so there should be reasonable attempts to minimize losses due to large amount of stored oil, which should limit “new” oil buying.”
The contango in the oil market justifies storing oil even at a high cost. If not, customers are ready to buy oil only at a lower price. That explains the current downward pressures on the oil price.
“So it looks like “glut theory” (which is essentially an extension of neoclassical supply/demand model) has some serious holes in it.”
The oil glut in the market is empirical reality and has nothing to do with the neoclassical theories.
You and Watcher are the only ones who deny this.
@likbez
“Glut” is emotional word and it is has negative connotation if you are oil producers and very likely it is misused in the press in order to provide certain perception of abundance.
or pick word “Oligarch” or “Businessman” which is more emotional to you?
Better word would be “over-supply” of oil. But the real question is how much of over-supply there is?
AlexS,
Some of the tankers being used for storage hold gasoline, not crude. (You may already have mentioned this elsewhere.)
This is going circular, despite some good procedural information.
The issue is this. Does KSA put oil on a tanker and send it to . . . whatever destination with no order for it. Now that’s rhetorical in that the correct question could be Does KSA let oil leave that tanker without being a promise of payment.
Simply that, and you seem to be dodging. Is oil coming out of the ground — or if you’re happier, coming out of the tanker, without agreement to pay. And again, your reference made clear you’re talking about 50 and only 50 lousy million barrels. The decline in prices started June 2014. Quotes of oversupply have been up to 3 mbpd. Even that graph you posted would add up to hundreds upon hundreds of millions of barrels.
You’re not making your point. Are you saying KSA and other exporters pumped that much oil out without being paid for it?
Hi guys,
The oil of course is paid for, but the price is very low. A “glut” means an oversupply, how do we know there is an oversupply? Because many producers are selling their product at a loss.
For a commodity like oil which does not deteriorate in storage (like apples) there can be oil traders that buy and store oil in hopes of selling later for a higher price.
To make things simple glut=low price.
And in other Texas related news:
ERCOT sets another wind record, with over 14 GW serving 45% of system load
Texas is likely to set more records, as it led the U.S. in new wind build in 2015 with 3,615 MW, more than twice than second place Oklahoma’s 1,402 MW of new capacity. Texas also has over 53% of U.S. wind capacity construction activity, according to new numbers from the American Wind Energy Association (AWEA). [snip]
Wind energy now provides about 4.9% U.S. electricity and policies are in place that should make it possible for the industry to meet the U.S. Department of Energy forecast that it will supply 20% of the country’s electricity by 2030.
Surely this must be affecting demand for fossil fuels, in particular NG, especially when compounded with the following stories (not Texas specific):
U.S. solar industry built a record 7.3 GW of new capacity in 2015
Dive Brief:
The U.S. solar industry built a record-setting 7,286 MW of new photovoltaic (PV) capacity in 2015, according to new numbers from the Solar Energy Industries Association (SEIA) and GTM Research. Solar 29.5% of U.S. new capacity beat new build in natural gas.
The market grew 17% year-over-year and 13 states added more than 100 MW. Residential solar was the fastest growing sector, adding over 2 GW of new capacity, a 66% year-on-year jump. The non-residential sector added another 1 GW of new capacity.
The utility-scale PV solar sector added a record-setting 4 GW of new capacity, a 6% gain on 2014. In addition, SolarReserve’s Crescent Dunes concentrating solar power project began delivering its 110 MW capacity with 10 hours of solar thermal storage to the NV Energy grid in 2015.
Of relevance to Texas, the GTM source, linked to at the bottom of the Utility Dive piece, contains a table that ranks Texas ninth in order of capacity additions for 2015.
NREL analysis finds tax credit extensions can accelerate renewable energy deployment, impact electric sector CO2 emissions
In December 2015, the wind and solar tax credits were extended by five years from their prior scheduled expiration dates, but ramp down in tax credit value during the latter years of the five-year period.
The tax credit extensions are estimated to drive a net peak increase of 48–53 gigawatts in installed renewable generation capacity in the early 2020s.
Longer-term impacts are less certain and can depend on natural gas prices. After the tax credits ramp down, greater renewable energy capacity is driven by a combination of assumed cost reductions in renewable generation, assumed rising fossil fuel prices, and existing clean energy policies.
The tax credit extension-driven acceleration in renewable energy capacity development can reduce fossil fuel-based generation and lower electric sector CO2 emissions. Cumulative emissions reductions over a 15-year period (spanning 2016–2030) as a result of the tax credit extensions are estimated to range from 540 to 1,400 million metric tons CO2.
The EIA’s Electric Power Monthly should have a new update on Friday with data for December 2015, as well as, the complete annual data for 2015. I look forward to presenting the usual graphs when the data comes out. Should be interesting.
Two questions come to mind:
(1) What was the average annual percentage for wind power in Texas in 2015?
(2) What is the seasonal percentage low for wind power, in the high demand months, which I suspect would occur in August*, when we frequently have low wind speeds combined with very high demand?
*Average IQ in Texas drops significantly in August, because all of the smart Texans are in Colorado
Hi Jeffrey,
With some solar it balances the lack of wind. I imagine there is a fair amount of sunshine in Texas in August.
Wind produced 9.1% of all electric power in Texas in 2014. For the US as a whole wind power produced 4.4% of total electricity.
Note that there are some states such as Iowa that produced 28.7% of all electricity (net generation)from wind in 2014. The retail sales of electricity was lower than net generation (some electricity exported) so the wind power produced in Iowa was 34% of total retail sales in Iowa. Using a similar calculation for Texas bumps the wind power produced divided by electricity consumed in Texas to over 10%.
The seasonal low is 7.97% (August 2014 data) using net wind generation divided by total electricity consumed in Texas.
Looking at last month’s Electric Power Monthly (with data for November):
Table 1.3.A. Utility Scale Facility Net Generation shows total generation for November 2015 as 32,011 GWh down from 32,284 GWh in November 2014 (-0.8%)
Table 1.3.B gives the year to date data as 415,065 GWh up to the end of Nov 2015, up from 403,255 GWh up to the end of Nov 2014 (2.9%)
Table 1.14.A. Utility Scale Facility Net Generation from Wind shows wind contributing 4,792 GWh for Nov 2015, up from 3,994 GWh for Nov 2014 (20.0%) meaning wind contributed 14.97% of the Nov 2015 total for Texas.
Table 1.14.B gives the YTD figures as 39,679 GWh up to the end of Nov 2015 compared to 36,683 GWh up to the end of Nov 2014 (8.2%) making the contribution from wind YTD, 9.56%
For the heck of it, I looked at Table 1.17.A. Net Generation from Solar Photovoltaic, which showed solar PV at 40 GWh for Nov 2015 up from 37 GWh for Nov 2014 (9.5%), making it’s contribution for Nov 2015, 0.125%, one eighth of one percent. Table 1.17.A gives the YTD data as 564 GWh ytd up from 396 GWh (42.6%) making the contribution of solar PV ytd 0.136%
A web page at the Solar Energy Industries Association, 2014 Top 10 Solar States (2014) ranks Texas as number 10 with a cumulative installed capacity of 330 MW, with roughly 260 MW expected to be installed in 2015. So with less than 600 MW of installed capacity, Texas is generating a little more than one eighth of a percent of it’s annual electricity consumption. Very rough calculations suggest that about 4,800 MW (4.8 GW) will be needed to generate one percent of the annual consumption and 48 GW to generate 10%. It is worth noting that solar capacity was expected to grow more than 70% between 2014 and 2015 and can be expected to experience robust growth for at least the next few years, added to which solar production will be higher in the hot summer months when you (Jeff) say wind is not all that good and demand is highest. Interesting stuff!
islandboy, Jeffrey JB,
Rockman over at PO.com has made the point several times that, while Texas is the largest producer of wind power in the US, that has added to total power generation in the state but not substituted for what’s produced from fossil fuels.
You could ask him if that has changed in the last year or so.
Some 2015 data, through 8/11/15:
http://www.eia.gov/naturalgas/weekly/archive/2015/08_13/index.cfm
Nationally, coal-fired power plants have been decommissioned and replaced with NG plants or converted to NG, adding to the national NG consumption rate. Is that also a factor in TX? NG plants can be both more efficient and more flexible load-wise than coal, using combined cycle gas turbines. Rapid load response plants blend better with a renewable energy mix on the grid. Coal plants scream for a constant base-load.
There is an interesting article by Art Berman about natural gas:
http://www.artberman.com/natural-gas-price-increase-inevitable-in-2016/
Looks like 2016 could be very interesting for natgas.
Amazing prediction… Wildcards -> Weather, Demand, Production .. Art Shows US still a NG importer till 2017. Twilight zone considering: “Today, the oil and gas industry is in financial shambles”
If we make it through December:
https://www.youtube.com/watch?v=Z-IJxTd8dCo
Note that Art’s number for the volume of new gas production needed to maintain flat US gas production, 15 BCF/Day this year, is pretty close to the Citi Research estimate that I use (17 BCF/day).
Don’t discount natural gas demand destruction. Power burn will decline with addtional renewables, and will decline faster as jurisdictions start actively implementing measures to “flatten the duck curve”. It will be a race to see if the decline in gas supply is faster than the decline in demand.
Flattening the “duck curve” to get more renewable energy on the grid
David Roberts, Vox.com, on February 12, 2016
AWS,
You do have a point about the duck curve and demand destruction. Though the demand destruction for electricity, maybe correct, I believe, the demand destruction will involve coal usage rather than Nat Gas. Nat Gas is the much more flexible fuel, especially in a simple turbine, where as a combined cycle, may not be as flexible as a simple cycle, it is still more flexible than the coal plant.
When push come to shove, we even find nuclear plants being by passed, due to their inability to be flexible enough to work with the renewables and being out priced by Nat Gas, if the price remains at its current levels, but there are no guarantees on that.
Toolpush,
The flexibility of gas burn for electricity generation is the reason that it will encounter demand destruction. Coal and nuclear are already being hit by solar during daytime. It’s the duck’s neck where gas has been used to manage the “surge” of demand. Shortening the neck, “flattening the duck curve”, is where the demand destruction of gas will happen.
The precise phrasing from the Saudis, ignoring agenda laden headline writers, is . . . any glut can be addressed by free market forces, which will mean the high cost producers have to stop production.
This enters the territory of ALL. Not some. ALL shale loans will not be repaid.
The bailout will be epic. Justification? Systemic Risk. Or better yet, National Security. Or best of all, it’s an election year.
The bailout will be epic.
Total nonsense! There will be no bailout. Paulson initiated the bailout because, it would lead to a collapse of the economy.
Hank Paulson’s Telling Admission
The big banks, on the other hand, were virtually all neck deep in the mortgage sludge that they had been warehousing, packaging, and selling to investors. That changed things radically. When Citi’s financial problems got so serious that other banks wouldn’t lend to it and it had to be rescued, Paulson and his colleagues at the Fed feared that imposing harsh terms—eminently justified on moral-hazard grounds—would encourage short-sellers on Wall Street to attack the stocks of other big banks. And that, in turn, could have led to a generalized collapse.
No one in government, giving the political climate today, would dare suggest bailing out the oil companies. It is just not going to happen. You think it is going to happen because you think the economy will collapse without an oil company bailout. Or at least I assume that is what you think. Otherwise I have no idea why you think there will be an oil company bailout. But no one in government today, sees things that dire. They simply do not believe that any kind of bailout is necessary. After all, who in government today is talking about a government bailout of the shale oil companies that are in deep shit? Nobody!
There will be no bailout of the troubled oil companies. End of story!
Systemic risk comes from banks post 2009. Not from shale. You bailout the relevant lenders. Already underway somewhat.
The banks are in absolutely no trouble from the shale collapse. Sure they will lose some money but it is miniscule compared to what was at risk during the 2008 housing and real estate collapse. The banks can easily survive this crisis with no bailout. A lot of shale oil companies cannot. They will all, or most of them, go belly up. And there will be no bailout.
Damn Watcher, this is not all that complicated. The current shale oil company crisis does in no way resemble the 2008 housing and banking crisis. Shit man, this is obvious, get real!
Those who will lose money due to the collapse of the shale oil industry… some will be banks for sure, but most will be the stockholders of those companies, and those who bought their junk bonds looking for a very high return on their investment. For those companies that do go bankrupt, the shareholders and bondholders will lose every penny they had invested. But such happens every day. Not a national crisis.
Banks have huge exposure to the oil sector. According to Jim Rickards, the global oil price collapse is way bigger than subprime.
http://www.dailyreckoning.com.au/the-5-trillion-oil-debt-bomb/2015/10/22/
You bailout the relevant lenders. Already underway somewhat.
Nonsense! Got a link that supports that absurd assumption? Of course not.
Anyway, bailing out the lenders would in no way help the shale oil companies that go bankrupt. They still go belly up. How in Christ’s sake would bailing out the lenders help?
You are saying “bail out the lenders” but “fuck the borrowers”?
Watcher, do you ever try to think this shit through before you make such absurd assumptions?
Posted on your blog in the last few days. Had to do with use of a Treasury agency to meet with the lenders as a Fed proxy.
As a conservative/libertarian I do not agree with Ron on much of anything. It is even worse that he is a Bama fan. But on this we agree. This is one of those great times where policy and politics align. And for those reasons, no oil company should get or will get a bailout. There are consequences for drilling all of these marginal wells at these prices.
The systems needs to flush them out.
It is even worse that he is a Bama fan.
Damn man, that hurts. 😉
Roll Tide!
Hey we are the National Champions, and will be until next January… at least.
By the way, what’s your team Rneo? Where did they finish in the national standings? Giggle, giggle, giggle.
Geaux Tigers
Yeah, they were once a really great team… when Nick Sabin was their coach. 😉
See, this is symptomatic of the disease.
The system needs to flush them out.
That’s aligned with the concept of “reset”. Or “cycles”. Or “self correcting”. Or, indeed, BAU because BAU is what there has always been.
Scarcity kills. There is no flushing out to make it all okay again. Scarcity doesn’t have cycles. It doesn’t reset. You burn it; it’s gone. You start to lend money to get it and not pay the loans back, and protect the swaps issued on those loans because they can gut the whole system.
And the people focused on and who understand oil scarcity will not accept that they have been right.
It’s very odd.
Flush it out as in flush out all the companies drilling marginal wells on debt. I am a small independent and I would not drill these resource plays with your money. These plays have distorted the market and it needs to correct. And it will.
Whiting (WLL) IS 3.93 USD today, the 52 week high is 41.57 USD. That’s more than a 90 percent drop, Whiting is not doing so hot.
Marathon (MRO) closed at $7.01 today, the 52 week high is 31.53 USD. The all-time was about 85 dollars.
Marathon is having trouble going the distance.
Summer is on the way and Greenland is going to have lots of daylight for a few months, so there will be melt.
At 1005 pounds, the largest tuna ever caught off of the North Carolina coast was in January of 2015.
http://www.northcarolinasportsman.com/details.php?id=4800
Work is for people who can’t fish!
BNSF railcars of petroleum last week were 3,595 fewer than in 2015, at that pace, the BNSF is losing a billion dollars a year in income.
600×3595×52×12 dollars per barrel to haul is 1,345,968,000 usd in lost income for the BNSF in a year.
http://www.bnsf.com/about-bnsf/financial-information/weekly-carload-reports/
Lift the barge, tote the bale.
Whiting (WLL) IS 3.93 USD today
People must be getting worried about their annual report due out in 24 hrs.
Or information is beginning to leak?
1180 Williston Basin wells were shut sometime in the past two or three months. A reduction of at least 11,800 bpd. Oil stays in the ground, a perfect storage facility, costs very little to keep it in the ground at a depth of 10,000 feet.
Bakken most dangerous place to work:
https://www.revealnews.org/article/in-north-dakotas-bakken-oil-boom-there-will-be-blood/
Ronald,
Nasty accident, you cite there. Totally avoidable, with proper training, and following standard oilfield practices. One of the problems with brine, oil and gas travel very fast through it, and reaction times need to be that much faster.
It also appears the 3000psi BOP may have been under sized, though no numbers are mentioned.
Interesting commentary from a former EOG ceo-
http://www.bloomberg.com/news/articles/2016-02-23/shale-oil-architect-predicts-doom-for-some-drillers-amid-slump
Incidentally, I read today that he has formed a company that will begin trading on Nasdaq tomorrow- SRAQU
They raised $500 million to purchase distressed oil/gas assets-
http://www.reuters.com/article/us-silver-run-acqsn-ipo-idUSKCN0VW2MX
There are likely opportunities for the small guy to make private equity vulture like returns buying distressed bonds of some of these companies. They will likely file, yes, but bondholders can buy in now at .10-.20 on the dollar and likely get double that back in equity in a debt free company well set up for the next boom.
What I’m kinda surprised I haven’t seen happen yet is acquisitions where the buyer goes in and buys up all the unsecured debt then throws a takeover bid at the company.
Hickory,
I was with him until the last paragraph.
“The future is pretty bright for U.S. production, and I could envision the U.S. could be producing 13 to 14 million barrels a day of crude oil,” by 2022, he said. “The future could be a lot brighter than people think.”
If the US adds 4 to 5 mmbopd, in the next 6 years, the price of oil will be low, unless we have some large world growth in demand. And then all production facilities, pipelines, refineries, ports etc, that have been stretched to the limit with the US producing 9 mmbopd. These will all have to be expanded, at a time the approval process has been getting slower and slower.
Yes I have totally ignored the ability of the oil shale play to actually produce this. I will leave that to others to discuss.
Maybe he still has some of that snake oil salesman left in him?
I think unrevealing of the weakest shale is coming. Peace agreement in Syria is signed today and it is huge and there is no need to keep War party (from all sides) shackled with low prices any longer by keeping shale on life support.
I think in the next few weeks or months certain things will be iron out in terms of actual cuts from the major producers. No doubt that US production is already in decline and could be even more than what EIA numbers are showing, and it will be incorporated as official “cut” by US. But Saudis and Russians will cut too. The first sign was that “freeze” negotiation a week ago in Doha and it was building block.
Yeah Niami is still cooing “No cuts” but he is just bargaining. Last week I thought it would be by summer but it could happen earlier.
Why would he cut and leave customer orders unfilled?
no orders were unfilled at $100 either. It depends on level of production unless it is coupled with major producers start prancing around refineries and offering discounts like Saudis did and then everybody follows offering discount. And once ball start rolling you end up with price from 1990’s.
Oh, discounts were offered, and matched, by someone.
Regardless of what was available.
Hi Watcher,
How is price determined in your world?
By agreement between buyer and seller.
As opposed to creating models and graphs and getting it absurdly wrong and then presuming to talk about it again.
I’m curious what some of you guys that are more familiar with the e.i.a reports think about this:
http://tinyurl.com/hoeqzvj
http://griztrading.blogspot.ca/2016/02/eia-overestimates-us-production-huge_18.html
I’m not sure if he’s right because I’m not really familiar with what he’s referring to.
Yes, knowledgeable people please comment on this.
If you are reading this blog, you may have noticed that we had been many times discussing the discrepancy between the EIA’s weekly and monthly oil production statistics.
The weekly numbers are very preliminary and inaccurate, and historical data is not revised.
Monthly statistics are better, but far from perfect. Therefore, the EIA has to revise the monthly numbers constantly. What’s important, most of the revisions in the past several months were upward. This means that the EIA tends to UNDERestimate rather than OVERestimate the US oil production.
This chart comparing weekly and monthly numbers was posted in the previous thread:
“The balance sheets of shale producers are in disrepair,” said Mr Hess”
and
“Opec launched a price war against US shale and other high-cost producers, including Canadian oil sands and Brazilian deep-water oilfields, in November 2014 by not reducing output despite a global oversupply. Since then, oil prices have plunged by more than half, hitting a 12-year low of about $26 on February 11.
In a rare admission that the policy hasn’t worked out as planned, Mr El-Badri said that Opec didn’t expect oil prices to drop this much when it decided to keep pumping near flat-out.
Opec’s strategy began to shift last week, when the oil ministers of Saudi Arabia and Russia agreed to freeze their output at the January level, provided other oil-rich countries joined. Mr El-Badri said the new policy will be evaluated in three to four months before deciding whether to take other steps.
“This is the first step to see what we can achieve,” he said. “If this is successful, we will take other steps in the future.” He refused to explain what steps Opec could take.”
http://www.thenational.ae/business/energy/opec-head-el-badri-doesnt-know-how-it-can-live-together-with-shale-oil
The link has a .ae on it but it’s from Bloomberg
Opec launched a price war against US shale and other high-cost producers, including Canadian oil sands and Brazilian deep-water oilfields, in November 2014 by not reducing output despite a global oversupply. Since then, oil prices have plunged by more than half, hitting a 12-year low of about $26 on February 11.
This para is in the article, but is apparently not a quote of anyone but the reporter. It’s not attributed in the article.
The rest is much like it. Exact quotes scarce. Interpretation-without-portfolio not scarce.
Not surprising. It’s IHS/CERA week. They pour it onto the reporters.
Oh, this must not be spam.
Oil at 147, oil at -50 cents per barrel is looking more like a swindle than a trade at a set price.
Some oil traders outright steal the oil and market the stolen goods! Unbelievable!
That’s the way it goes moving west. I mean, Good Lord, ain’t nothing new under the sun.
How much do you want for your oil? I’ll give you fifty cents per barrel and you can have it!
Freaking hilarious, you can’t give the stuff away. You have to pay money to get rid of it.
Never mind that it is only 21,000 barrels per day, the other 1.08 million barrels are selling at the going rate.
As far as the tankers out at sea, they’re all looking for a buyer. They’re not going to run out of gas, the tanker has 2,000,000 barrels of oil as cargo, how are they going to run out of gas? We have two million barrels of oil in the cargo bay, where do you want us to go?
Circus barking! Get cher oil here, whatcha waitin’ fer?
Don’t worry, we’ll have it there, pronto!
Thank God somebody ordered some of this oil, it is a complete pain in the ass. It’s drivin’ me to drink! har!
A kneeslapper, so frickin’ funny.
SM Energy per their release.
PV10 at $50.28 WTI $1.8 billion
Long term debt $2.516 billion.
Note they are the first I have seen to report PV10 with hedges, which moves PV10 to $2.3 billion.
I wish they would disclose PV10 at various price points too.
Probably more note worthy, SM Energy’s Q4 2015 oil production was down 14% from Q4 2014.
Also, their netback, pre hedges, was just $6 per BOE. That means Q1 netback, pre hedges will be negative in all likelihood. They don’t have a lot hedged in 2016 compared to 2015.
Encana planning further workforce reduction
Encana says the 2016 job cuts will have resulted in a 50 per cent reduction in its workforce since 2013.
Chesapeake results are out and they look pretty bad to me at least. Would be interesting to hear from more knowledgeable people on this:
14.9 billion dollar loss for the year
Total net debt to capitalization ratio of 81% (from 29% last year)
Cash down to 825 Million at planned capex of 1.3-1.8 billion this year.
Interesting as well, that they plan to complete 155-265 more wells than they drill
Daniel:
From CHK press release:
Long Term Debt $10.354 billion
PV10 at $50.28 WTI $2.59 HH $4.727 billion
Q4 realized price per BOE $21.60
Expenses per BOE
Production: $3.62
Gathering: $11.34 (why so high?)
Prod taxes $.19
G & A $.84
Stock based comp. $.18
Interest expense $1.70
Q 4 net back (pre CAPEX) $3.73
Their average realized price for Crude oil in Q4 was $64.04 and gas $2.35. I assume will be worse in 2016.
PV10 is less than 1/2 of long term debt at $50.28 WTI and $2.59 HH.
So share price is up 20%. Crazy world!
Capital cuts and asset sales:
http://uk.reuters.com/article/us-chesapeake-enrgy-results-idUKKCN0VX1CD
I think some of that high gathering expense comes from the fact that CHK sold alot of their midstream assets to MLP’s. They increased the cost of the transport agreements so they could sell the assets at a higher price. Some royalty owners have sued CHK over these practices.
At the start of this post’s comments likbez had a comment about oil and the “Minsky moment”. He reminded me of what Mark Carney mentioned in his climate change and financial stability speech.
Breaking the tragedy of the horizon – climate change and financial stability – speech by Mark Carney
Bank Of England, 29 September 2015, Speech given at Lloyd’s of London
Nice post Hickery… on Papa’s new venture…. Excellent.
The Weekly Petroleum Status Report came out earlier today. The biggest news is that oil inventory levels increased by another 3.5 million barrels. They are at an all time high.
I understand that there are some folks out there who do not believe that there is currently a glut in the oil supply. I wonder how they would explain this record in stored oil. Of course this is just not in the US, there are similar stories around the world. We are running out of places to store oil. That’s not a glut? Then what the hell would you call it.
US crude oil production dropped by 33,000 barrels last week, according to the EIA’s algorithm that tries to track production. Understand that this is not an actual measurement of oil produced but a mathematical equation that tries to figure it out.
A glut of condensate?
As US C+C inventories increased by 100 million barrels from late 2014 to late 2015, US net crude oil imports increased:
http://oilpro.com/post/22276/estimates-post-2005-us-opec-global-condensate-production-vs-actua
The most recent four week running average data (through Mid-February), show that US net crude oil imports increased year over year, from 6.8 million bpd in 2/15 to 7.4 million bpd in 2/16. And US net crude oil imports, as a percentage of C+C inputs into refineries, rose year over year from 44% last year to 47% this year (four week running average data).
And links to articles from last year and this year that discuss refiners’ unhappiness with “Synthetic WTI” blends of heavy crude and condensate:
http://www.reuters.com/article/us-usa-refiners-trucks-analysis-idUSKBN0MJ09520150323
https://rbnenergy.com/just-my-imagination-how-full-is-cushing-crude-oil-storage-capacity-really
Hmm commenting bottom up, and probably won’t go higher than this in the scroll. Happened to note below the change of WTI definition so shale could get into Cushing more mathematically comfortable. Before I saw this.
Anyway, if you have diesel customers and your source is too high an API number, then you have to get more crude to supply your trucks. No avoiding it. If people want to believe there is reliable storage measurement, note that the non diesel output will be almost like toxic waste. Stored as a byproduct of making what you really wanted.
The seller? Keep the price low until you have punished the enemy sufficiently.
Ron, do we know what worldwide C + C storage levels have done since 2013?
If I am a US refiner, I would be filling every available inch of storage at sub $30 oil.
Are oil exporters doing the same?
Well we have the OECD storage levels for the last 6 years, courtesy of the IEA Oil Market Report And, as you can see they are at a high since January 2010.
If you substract US storage increase from OECD numbers, I think you should see a plateau. So the majority of the increase in oil storage is in the US, at least for OECD.
I have tried in the past to find information about non-OCED and OPEC storage. I have been unable to do so. If anyone has this information (AlexS?) I would appreciate it very much.
Per IEA, total supply, including refinery gains and biofuels stood at 97.1 million bopd. Of that, OCED was 24 million bopd, with refinery gains and biofuels in OCED making up another 4.6 million bopd.
This means that a little over 70% of world wide supply (production) is non-OCED and OPEC. So, without storage information for non-OCED and OPEC, seems it is a little difficult to obtain a clear picture of how much higher worldwide storage is now than it has been in the past?
It would seem if non-OCED exporters and OPEC desired to sell into this market and draw down crude oil storage inventories, they very well could do so, as refiners in importing countries would be inclined to buy as much oil as they could store, assuming that low prices will not remain forever. OTOH, when oil shot up to $140, clearly refiners in importing countries tried to keep from buying anymore crude than necessary, as there is much more risk in storing $140 oil losing value than $30 losing value.
Also, when we get right down to it, strategic petroleum reserves should be included into the mix. However, what weight they should be given is difficult, given the uncertainty of if and when they would be accessed.
The inventories for countries producing 29.5% of C + C, including refining gains and biofuels, have increased from about a five year average of 58 days, to 65 days supply. I wonder what has happened with regard to storage for the remaining 70.5% of world wide production?
I will give you an example of what I mean through a stripper well oil producer. Stripper well production is separated from water and goes into a stock tank. When the stock tank is full, the tank is picked up by a tanker truck and driven to a refinery.
In January, a stripper well operator may start with 1,000 barrels of oil on hand, produce 1,000 barrels in the month, sell 1,200 barrels in the month, and end the month with 800 barrels on hand. The next month, the operator may start with the 800 barrels, produce another 1,000 barrels, sell just 600 barrels, and end the month with 1,200 barrels on hand.
We know the operator produced 1,000 barrels each month. However, if I had not told you that, you might very well think the operator produced 1,200 barrels in January and 600 barrels in February.
Is it not possible that this game is occurring with regard to large producers for which we have no storage data?
For example, I sincerely doubt KSA suddenly shuts in wells to cut production, or opens up wells to increase production. I assume they have considerable storage, and when they ramped up production greatly, they really didn’t, they put a lot of stored oil on the market. I think it would be tough to suddenly increase or decrease production by 1 million bopd. Maybe they do, but I doubt it happens immediately.
Of course, I really do not know the above re KSA for a fact. However, it would be much easier for them, or any other producer, to manage supply, at least in part, through the use of storage.
Please understand, I have no idea what is really going on with worldwide oil storage. But that is my point, unless someone can point me to some good data, no one does. For all we know, storage levels in non-OCED and OPEC could be low?
Chris said:
“If you substract US storage increase from OECD numbers, I think you should see a plateau. So the majority of the increase in oil storage is in the US, at least for OECD.”
Wrong
OECD Asia & Oceania
But the largest increase in inventories was indeed in the US
How about since 1980? It’s curious that this stuff is only being presented in price fall territory. Do we have a description of methodology, btw.
If “this stuff” is inventory levels, it is shown in 2014-2015 because that was the period when global oversupply has emerged. There was no oversupply in several years before 2014.
Total Stocks in OECD Regions 1983-2015, million barrels
(crude oil and products)
sources: IEA Annual Statistical Bulletin, various issues; IEA Oil Market Report, February 2016
Relative to forward demand, OECD commercial inventories are likely to reach peak levels of the early 1980-s in 2016
OECD industry stocks*, days of forward demand
(*commercial inventories as per EIA definition)
sources: IEA Annual Statistical Bulletin, various issues; IEA Oil Market Report, February 2016
AlexS,
I gather from the data you have posted that there is an excess of around 1.5 billion barrels of C+C, which according to Jeffrey Brown probably has a bigger percentage of condensate that was the norm previously.
As global oil production is going down since mid 2015, and demand is growing somewhere between 1.3-1.7 % annual rate, if both trends continue this excess will probably disappear by early 2017. But the markets are likely going to notice this new trend in stocks reduction much earlier than that.
Unless the stock market fall is followed by recession and demand starts reducing, oil price should find some upward pressure within 6 to 9 months.
Do you see it the same way?
Javier,
According to the EIA and IEA projections, the excess supply will be eliminated by mid 2017. Until that time, inventories will continue to increase, putting downward pressure on prices.
On the other hand, I agree with you that the market often anticipates a change in supply/demand balance. So if the market notices that the excess supply is constantly diminishing, prices will likely start to rise.
Most of the current oil price projections are actually anticipating a gradual and rather slow increase in prices since the second half of 2016.
Hi
Thanks for the weekly graph – always great to see your data presentation.
Careful with the increase in crude stocks, because, as you surely know
gasoline, distillates (the low sulphur part) and the propane are all down the double,
so that total stocks (bottom line in top part of “data overview table 1” EIA) are
DOWN 5 mb last week!
I think people are gonna start reacting, 4 week averages are down, yearly cumulative production is down, the tide is turning. And as Mr Brown writes, imports are up too. The show goes on…
Best,
Ron,
Based on EIA own data (line 13 Adjustment; Formerly known as Unaccounted-for Crude Oil) the minimum error margin for this set of the USA data is around 2-3% (500/15828).
http://www.eia.gov/petroleum/supply/weekly/pdf/table1.pdf
So any change less then 3% should be discounted as statistical noise.
Y-o-y change for the USA Commercial Stock is negative
This year (2/19/16) 500
Year ago (2/20/15) 1,204
How would you explain evaporation of a half of “oil glut” in one year ?
likbez,
What are you talking about?
the table from your link shows that all categories of inventories have increased from a year ago
Commercial inventories (crude oil): 507.6 million barrels
year ago: 434.1 million barrels
Total stocks (crude + products, ex SPR) : 1,334.4 million barrels
year ago: 1,179.7 million barrels
Based on EIA own data (line 13 Adjustment; Formerly known as Unaccounted-for Crude Oil) the minimum error margin for this set of the USA data is around 2-3%…
Be that as it may, there is usually way more than a 3% difference between the weekly data and the monthly data.
Y-o-y change for the USA Commercial Stock is negative
This year (2/19/16) 500
Year ago (2/20/15) 1,204
I hope you’re joking. Stock changes are not stock levels. Look at the very top line of your link. That is the stock level. And it is not negative, not even the stock change. If it were negative it would have minus sign (-) in front f it.
Ron,
Thanks for the explanation.
The figure 500 is pretty close to the current commercial stock inventory. Citing Alex
And that’s what confused me.
If this is a change of +0.5 Mb/d * 7= +3.5 Mb/week then how it correlates with
This week 1,336.4
Previous week 1,341.4
Which suggest negative change of -5 MB in inventories.
NOTE: Please discard this objection. This 3.5Mb is actually correct. -5MB is because of the draw of gasoline.
Also unclear how annualized change in oil inventories 1,204 Kb/d (1.2 Mb/d) occurred ?
(line 11 of the referenced PDF).
An annual increase was only 73Mb (or 0.2Mb/d)
But 1.2 Mb/d * 365 = 438 Mb
Also what is the meaning of the column “difference”? which has values 193 and -704 for week and one year periods, respectively. Is this the second derivative (speed of change?)
Also you missed one interesting observation that I made. If total commercial stock is 1,336.4 Mb then 3% margin of error will be 40 Mb (and that’s pretty charitable because they use volume metric which due to differences in density between various products implicitly increases this error via “refinery gains” which are not any gains at all). From this point of view figures 1,336.4 and 1,341.4 are equal. And 1,179.7 (one year ago) just 4 margin of errors lower from what we have now. Not an impressive glut.
In other words:
1,336.4 is actually something between 1296.5 and 1376.5
1,179.7 is actually something between 1139.7 and 1219.7
likbez said:
“I am still confused. The figure 500 is pretty close to the current commercial stock inventory
Citing Alex
Commercial inventories (crude oil): 507.6 million barrels”
500 is THOUSAND b/d, or 0.5 mb/d, or 3.5 million barrels /week change in weekly inventories.
507.6 MILLION barrels is the current volume of commercial inventories.
You are really wasting your time trying to prove that there is no oversupply in the oil market 🙂
AlexS. Did you see my question above.
Do you have any data on non-OECD and/or OPEC stocks 2013-present?
shallow sand,
Yes I did see your question, but could not find any data on non-OECD stocks.
Still, I have found some uncomplete data on China’s inventories. They have almost doubled state-owned crude oil storage capacity from 103 million barrels in November 2014 to 180 million in mid-2015 (+77 mbbls in 7 months).
China’s total crude oil volume in storage, including non-state facilities, was 191 million barrels in mid-2015. They continue to build new storage capacity and I guess they were increasing oil in storage in the second half of 2015 and early 2016 as well.
I also did some back-of-the-envelope calculations based on the EIA data. They show that, in 2015, total OECD inventories have increased by 308 million barrels.
(See the chart below that I had posted a couple of weeks ago)
Given the global excess supply of 675 million barrels accumulated during last year, there is some 367 million barrels, that theoretically should include non-OECD inland stocks, floating storage, and “balancing items”.
I think that 367 mbbls is too much for the increase in non-OECD and floating storage, so part of these 367 mbbls should be classified as “balancing items”. They are also often called “missing barrels”.
If my calculations are correct, that may mean that:
1) Global demand was actually higher than estimated by the EIA; or
2) Global supply was actually lower; or
3) The OECD inventory numbers are not complete,
or some combination of 1), 2) and 3).
In other words, one possible explanation is that the amount of global oversupply may be smaller than the EIA’s global production and consumption statistics are showing.
Tomorrow will do similar calculations using the numbers from the IEA and OPEC.
Alex,
I am trying to understand the situation. And “oil glut” explanation for the oil price drop raised serious doubts.
One of them is the following. If we think that the current level of commercial oil inventories (474-506 band since Q1 2015) reflects glut why this level increased dramatically in just three quarters (Q3 and Q4 of 2014 and Q1 of 2015) reaching 474.8 at the end of the first quarter of 2015 and then did not changed much? 2015 ended with the level of 482.3. So three last quarters of 2015 gave us increase of 1.6%
BTW average annual raise of US inventories from 2000 to 2012 was around 6 Mb/year. So growth of inventories during the last three quarters of 2015 were not far above historical average.
Should not glut be continuous and the second half of 2015 replicate the second half of 2014? Or be even worse?
But inventory stayed in this “newly found” narrow band since the end of Q1 of 2015. Suggesting that “glut effect”, if existed, ended around April 2015 and after that it was something completely different that drove the oil price down even if we assume link between the level of glut and the oil price.
The USA daily input to refineries is around 15.5 Mb/d. So all “glut” increase is just approximately an additional week of inventories in comparison with typical 3-4 weeks. I would buy more then a week on inventories at $28 bbl just recently if I were a large US refiner. Where is this “greed induced” additional “glut” ? From this point too it looks like the whole glut theory as a mechanism of influence of oil production/consumption on oil price is highly questionable.
BTW sports fans, if you think there is an increase in storage, wasn’t that oil bought by someone to store?
Is that not thus customer demand, or maybe even consumption (given the sub 100% recovery of SPR crude)? So why would this demand lower price? It’s not oversupply if it has customers.
BTW who pays these inventory costs?
Watcher,
“BTW who pays these inventory costs?”
That’s the key question. It is one thing if it mainly refineries (as demanded by their production cycle) and the other if it is just an extension of exchanges with mainly “greed” motives.
“BTW who pays these inventory costs?”
Of course, those who own those inventories:
refiners, midstream companies, traders, vertically integrated companies, national oil companies of oil exporting countries, some final consumers (airlines).
Why We Consume: Neural Design and Sustainability
Peter Sterling February 2016
Exponential economic growth is rapidly destabilizing the biosphere. Among the many factors that stimulate such growth is the human tendency to consume goods and services far beyond what is required to meet basic needs. We have to grasp what drives this tendency in order to manage it. The brain’s core circuits were long believed to stimulate us to seek pleasure—greedily and selfishly—while higher cortical circuits try to rein us in. Neuroscience now shows that the core circuits serve not pleasure per se, but efficient learning. When we obtain a reward that our frontal cortex values highly, the core circuit delivers a chemical pulse that we experience as satisfaction—so we repeat the behavior. Satisfaction is brief and diminishes as a particular reward becomes predictable. This circuit design works well for pre-industrial societies in which rewards are varied and unpredictable. But capitalism shrinks the diversity of possible rewards, leaving the remainder less satisfying, and making stronger doses, i.e., more consumption, necessary. The path toward sustainability must, therefore, include re-expanding the diversity of satisfactions.
The evidence deepens daily that human activity is now imperiling the stability of the biosphere. The main cause is exponential economic growth, driven on the production side by capitalist competition, pursuit of profit, and financial manipulation. Yet persistent growth ultimately requires demand—that is, individual consumption. If people consumed less, stuff would accumulate and growth would slow. Economic growth far exceeds population growth, so if economic growth could be slowed, there would still be enough for all seven billion of us, at least if wealth were distributed more equally. So why do people consume ceaselessly, far beyond the point of meeting basic needs? There are social factors, such as competition for status, and personal factors, such as shaping a self-image. Advertising plays on these factors while also stimulating us to imagine how wonderful new goods will bring fresh satisfaction. And they do briefly, but desire always resumes. Something at our neural core continually stimulates acquisitive behavior, and we urgently need to identify and manage it.
more….
What insights from brain design might aid the transition to a sustainable civilization? First, we must grasp that humans consume compulsively—insatiably—in large part because our clever circuit for reward learning now encounters too few sources of small surprise. We may rail against the capitalist manipulations that drive consumption from the top down, but that will not satiate our innate, bottom-up drive to consume. Therefore, social policies should follow the precept “Expand satisfactions!” We should re-examine and enumerate the myriad sources that were alienated under capitalism. The list will resemble roughly what we do on vacation: more nature, exercise, sports, crafts, art, music, and sex—of the participatory (non-vicarious) sort.
http://www.greattransition.org/publication/why-we-consume
For the first time, federal regulators have prepared and made public a formal assessment of the potential environmental hazards posed by the use of hydraulic and acid fracturing, or “fracking,” technology in offshore oil and gas wells off the coast of California.
To the dismay of environmentalists, the draft assessment proposes to forgo new restrictions on offshore fracking and any changes to the permitting process.
The document also explains how offshore fracking technology works, and its potential impacts on marine environments in and around the Santa Barbara Channel, addressing the disposal of contaminated wastewater, the potential for accidents and spills, and the risk of inducing undersea earthquakes. Offshore fracking opponents quickly declared the assessment inadequate.
http://www.truth-out.org/news/item/34959-regulators-butt-heads-with-activists-over-assessment-of-offshore-fracking-hazards
The Bureau of Safety and Environmental Enforcement (BSEE) and the Bureau of Ocean Energy Management (BOEM) have jointly prepared an Environmental Assessment(glossary term) to review the potential environmental impacts of the use of well stimulation treatments(glossary term) on the Outer Continental Shelf (OCS)(glossary term) , Southern California Planning Area(glossary term) . On this website you will find the EA, additional information resources, and a form to submit your comments.
http://pocswellstim.evs.anl.gov/
Every single business in the world must increase its inventory when it increases it sales unless it is somehow able to get more efficient with its inventory turns. When growth is very fast like it has been in the US oil industry over the past few years, inventory turns almost always get less efficient, particularly if there are bottlenecks in product flows due to insufficient infrastructure or logistics which struggles to catch up with that growth. So when you are producing and selling record or near record amounts of a good then your inventory of that good should be at or near record levels. Also, when you build more inventory capacity you are going to carry more inventory particularly if you don’t like the price that you can sell that inventory now as is the case in the oil business. The inventory in the US will turn much quicker than people think as the production declines accelerate or more importantly the price goes up. Assuming either of those things ever happen again….
WTI definition was changed to allow more shale output flow into Cushing. Inventory definition similarly changes and loses all valid comparison to history. There’s no valid data on most of what’s going on.
Watcher: “There’s no valid data on most of what’s going on.”
One of your best observations.
Not surprisingly, several of today’s earnings releases did not include PV10.
Ironically, some Permian producers did release PV10, and generally the amount was about the same as long term debt, like PXD.
I heard today a good explanation for why Permian LTO producers are favored. They started later, and therefore haven’t burned as much cash and racked up as much debt yet.
Seriously, look at the wells they tout. Is 585 BOE IP, as Parley discloses as a strong well all that great, when QEP has TF wells which IP 2,500-3,000 BOE, with higher percentage of oil?
I know IP is not all that meaningful, but I am not understanding the Permian LTO advantage.
Wont be able to do a lot of comparisons till the 10K come out.
When it became clear the choke is agenda driven, the flow measurement comparisons lost their value.
Shallow,
Remember Texas is not the whole story. You should watch New Mexico production. SE New Mexico is a significant part of the Permian Basin and the Production is falling off. Some companies have severely curtailed fracking operations. Many of the companies you reference have significant operations in NM
Also, you may start to see compliance issues with regulatory agencies showing up in the 10ks. In NM you have state and federal agencies. Some are friendlier than others.
There were massive capex budget cuts announced at several shale drillers today. Some of them cutting to around 20 percent of 2015’s budget. CHK is planning on running 4-7 rigs in 2016 vs an average of 28 in 2015 and 64 in 2014. WLL is anticipating 2 rigs in Niobrara and 2 in Bakken, an 80% cut in capex from 2015. QEP is reducing capex from 1007 million in 2015 to around 450 to 500 million in 2016, they will have one rig running in Pinedale, Permian, and Bakken with a fourth rig somewhere later in the year. OAS is cutting capex from 610 million in 2015 to around 400 million in 2016. CLR is also cutting substantially as well as reporting a sequential decline in 4th Q 2015 production from 3rd Q.
One further thing to note about Whiting, making my conventional (vertical) decline point.
North Ward Estes CO2 flood
1/15 9,976 bopd, 11,901 mcfpd.
12/15 8,508 bopd, 9,902 mcfpd.
Hess CEO, cannot make money at $50, let alone $30, going to run 2 rigs so don’t have to disband the drilling department.
I am thinking the attitude now is, “You got us, we are toast without prices more than doubling.” We may be seeing the capitulation we should have seen this time last year.
Shallow,
We may be seeing the capitulation we should have seen this time last year.
A very good point. Looks like the attitude “you got us” became prevalent.
Delonghorn,
An interesting observation about CHK’s drilling plans, is they intend to only have one rig in the Marcellus/Utica area, normally considered the most productive and prospective area, while they will have 3 drilling in the Haynesville, normally considered past its prime.
I have to wonder if the lack of pipelines in the NE and the continuing delays in the approval process, compared to available pipeline capacity, and full HH price, has any bearing on their decision to stay with the Haynesville?
Why wonder? Probably all of the above and then some.
Toolpush,
One reason for CHK to maintain drilling in Haynesville could be contracts with pipeline operators.
What does this mean?
“North Dakota oil producer Whiting Petroleum Corp said on Wednesday it will suspend all fracking and spend 80 percent less this year, the biggest cutback to date by a major U.S. shale company reacting to the plunge in crude prices.”
…
“Denver-based Whiting said it will stop fracking and completing wells as of April 1. Most of its $500 million budget will be spent to mothball drilling and fracking operations in the first half of the year. After June, Whiting said it plans to spend only $160 million, mostly on maintenance.”
http://af.reuters.com/article/commoditiesNews/idAFL2N1632GE?sp=true
I means that by 12/31/16 prices will be higher than today!! Capitulation has set in.
How much higher?
And what expectations about demand developments is behind your statement?
How about . . . someone closed the money faucet OR
How does it cost $500 million to mothball equipment? Are they encasing it in gold?
What would happen if all storage were to be completely filled? The price of oil would probably immediately rise by 50%.
Think of it. All storage is full, including floating tankers. The Saudi’s could not export 7 million bbl/day – no tankers available. The tankers are full. So they have to cut production. So, 7 mil bbl/day off the market. Meanwhile, Japan, India, China, Korea, etc. need daily tankers full. They have to get some of the tankers that are storing oil to sell. The tankers say: “Okay, but we previously sold forward to 1/1/18 at $45 bbl. So, give us $45 bbl.
Just an amusing speculation at this point. But happens every day. An immediate need trumps everything.
You [a multi-millionaire] show up 2 hours before game time with your son, and your college football team is playing for the National championship. The stadium is full. No more tickets will be printed; no more seats will be added. You say: “Excuse me buddy, but could you see your way clear to part with your 2 tickets on the 40 yard line for – say $1000 each.”
Obviously, this is kind of frivolous – so do not go ballistic with replies.
“What would happen if all storage were to be completely filled? The price of oil would probably immediately rise by 50%.”
More likely price of storage would rise and not of oil 🙂
Ah, so that’s who pays the inventory costs . . . to store oil they ordered and paid for with no customer for it. That is a great business. You pay for something you’re going to pay to store.
Sort of like storing money at negative interest rates.
Watcher,
I was just answering hypothetical question to what clueless suggested.
My position is clear. The whole thing was/is political.
You are looking to find some kind stock market “scheme’ that “someone” arranged the 70% drop of oil. Yes it is in front of our eyes. Banks (with help of investors searching for yield) financed production of mainly unprofitable oil even at the price of $80 in the last 6-7 years. That is the “scheme”.
I don’t agree that there are lot of oil in storage since nobody builds commercially storages to store oil that is already in storage in their natural form. But I believe there was/is oversupply (little) and coupled with Saudis discounting the price (and everyone following it) is what brought the price where it is.
”What would happen if all storage were to be completely filled? The price of oil would probably immediately rise by 50%.
First rule, try to use something related to the real world.
What is the rationale behind your statement?
If all storage was completely filled (some of the demand now is driven by storage build), sellers would try to sell at a lower price.
As I recall, the reason for TX revisions is due to new leases, primarily, and some slow reporting by small operators, secondarily? So looking at conventional 12/15 should be fairly accurate, or at lest 10-11/15 should be?
I looked at a few of the big conventional producers in TX, including Sheridan, Citation, Legacy, Breitburn.
All big down YOY. SACROC is down, but Yates surprised me, it is up. Also, looks like XTO and Chevron kept their big leases up, wonder if they will in 2016.
Shale is going to take a dive in 2016, it appears. I suspect the “straight holes” in the USA took a dive in 2015, and it will get worse in 2016.
I know I am seeing more and more idle wells each week. They just aren’t being pulled, work over rigs stacked.
I assume there will be a lag till prices begin to rise, especially if KSA keeps trash talking.
Shallow, keep them coming.
The oil business is more about finances than most appear to recognize. For the near term (like the next 2-3 years) the developments will very much be related to the strength (or lack of) the oil companies balance sheets (as in assets/equities).
Rune. Looking at CLR 10K right now. They did something I hoped, gave PV10 given different price sensitivities.
Holding gas constant at 2015 SEC value, $2.58 per mcf, here is PV10 at various WTI price points:
$35-$4.599 billion
$45-$6.67 billion
$50.28-$7.986 billion
$55-$9.178 billion
Gotta give CLR credit for providing this information. I hope many do.
CLR long term debt $7.118 billion.
Point being, at $30 WTI, PV10 is maybe a little more than half long term debt?
Now let’s apply that statistic to the entire US
LTO industry.
I sure hope we have hit capitulation combined with resignation that plans for almost zero activity for 2016 must be stuck to in the USA, despite any price uptick, for survival purposes.
Shallow,
Give me some time to get a look at CLR’s 10-K….and get back to you.
On a general note, I am in the camp that low oil prices is NOT a good, taking a long term perspective. The low oil price is having huge effects (and causes a lot of pain), then add that companies took on a lot of debt in an expectation of demand growth and sustained high oil price (like $100/b).
A lasting, low oil price (and there are some time lags built into the system) will IMVHO (and professional) opinion do something to the total global supply (as in production) potential a few years (like 1-2) down the line.
The other side of the equation are demand (consumption) developments.
Rune, of course, I definitely agree $30 oil is not good.
However, I also do not think $100+ was a good thing.
It seems to me a $60-$70 price for WTI is where we should be. Just my opinion.
I do agree with you about demand concerns. 2015 does appear to be a strong demand year. Not so sure about 2016.
The problem, of course, is debt. It is everywhere. In USA, we go from housing debt, to auto debt, to student loan debt to credit card debt.
Many auto loans are 7-8 years now.
Most housing loans have 30 year terms.
Most student loan debt is paid over 10+ years.
Not to get off topic, other than the debt does affect oil demand, including, IMO slowing population growth by delaying family formation and decreasing birthrates. Maybe a hidden benefit?
Shallow, thanks for sharing.
I have one general observation about PV10 estimates and it is; these include a projected production profile.
So what kind of profile(s) was used for the PV10 estimates?
Comparing some companies typical well profiles (used for projections of future production and EURs) with actual data shows some deviations, actual data projects lower EURs and lower (future) production trajectories.
Wrt to demand/consumption developments, annualized consumption for the US (EIA data) has flatlined since Aug/Sep-15. Diesel in steep decline.
It is interesting that US oil companies’ shares are rising after the announcements of cuts in capex, asset sales and reduced production guidance.
This reflects a drastic shift in investors’ and creditors’ attitudes. Until recently they were rewarding high growth over capital discipline and hence were implicitly supporting irresponsible “shale boom” business models.
Now they are favoring capex cuts and asset sales even if that comes at the expense of future growth.
Is this a return to normalcy? Or everything will change again as soon as oil prices rise to $50-60?
”Is this a return to normalcy?”
It could be a refocusing on profitability (or other relevant financial metrics, like Return On Average Capital Employed).
Myopic focus on EURs, BOE’s, volume growth, frack stages, use of proppants, etc. has IMVHO been misplaced.
The game has been and always will be about financial profitability.
“The game has been and always will be about financial profitability” in most sectors of the economy, including most segments of the oil and gas industry.
But there are some notable exceptions. In the early 2000-s these were dotcoms.
And in this decade a notable exception was the shale sector, with its “Myopic focus on EURs, BOE’s, volume growth, frack stages, use of proppants, etc” instead of profitability.
AlexS. I would also include the housing bubble, where loans were booked to make commissions, with little regard of payment ability.
Thanks for your reply about non-OECD and OPEC oil storage.
There very well could be a large build in these stocks too. I have read Chinese storage builds. However, assuming Chinese demand continues to grow, albeit at a slower pace, it makes sense for them to build up SPR.
My primary focus is OPEC storage. I question that 60+ year old fields with massive water flood operations can be turned on and off like a faucet.
I have a hunch that the KSA and its smaller partners are nearing their limit on oil production growth and at least a part of the sudden boost in production seen last spring was a stock draw down, and not a sudden opening of wells.
I am not as sure about Russia. I tend to think production statistics are not managed through storage, given there are not large production swings. However, it would not surprise me if there hasn’t been a build in Russia as there has been in North America as Russia doesn’t import crude oil. Do you have any idea on Russian oil storage levels?
shallow sand ,
Commercial inventories in Russia are 57.5 million barrels, including 44.2 million of crude oil and 13.3 mbbls oil products.
The volume of stocks is fluctuating, but it is not much bigger than last year.
There is no state-owned storage capacity.
Commercial inventories of crude oil in Russia (000 tons)
source: http://www.riatec.ru/en/
Anadarko 10K shows PV10 standard measure (including the effects of income taxes) was:
12/31/14: $30.7 billion
12/31/15: $9.7 billion.
12/31/15 long term debt:$15.7 billion.
So why is their equity and debt holding up better than CHK?
http://www.prnewswire.com/news-releases/anadarko-announces-monetizations-totaling-approximately-13-billion-300225751.html
Actually $1.3 billion. Are they also in ExxonMobil’s sights?
Re: Survivor Bias in Calculating Declines Rates
In response to a question about projections for shale play decline rates falling to the 5% to 6% per year range, Enno produced a chart showing the year over year rates of decline for wells completed in various years, in the Bakken Play. Following is a link to the chart, and I have shown Enno’s comment.
http://peakoilbarrel.com/texas-oil-production-still-on-a-plateau/#comment-560628
I posed a question to Enno about “Survivor bias,” and following is Enno’s response:
I gather that the approach is to always divide the production values by the original number of producing wells. While this seems like a valid approach for average production per well, it seems to be a pointless exercise when it comes to calculating year over year rates of change.
Up the thread, I showed a couple of simple mathematical models. Following is a model with more relevant (hyperbolic) simple percentage decline rates. I assume a fully developed lease with 10 producing wells, all completed in 2010. There is one very good well, with 9 relatively poor wells. Production drops by 40%, then 30%, then 20% and then settles down to a 10%/year decline rate. The lease loses three wells per year, until it is down to the one good producing well. Here is the model:
2010: 1,000 bpd, 10 Producing Wells
2011: 600 bpd, 40% decline, 7 Producing Wells
2012: 420 bpd, 30% decline, 4 Producing Wells
2013: 336 bpd, 20% decline, 1 Producing Well
2014: 302 bpd, 10% decline, 1 Producing Well
From 2014 on, production declines at 10%/year, from one well.
Note that regardless of whether one calculates the year over year (simple percentage or exponential) decline rates based on total production or based on total production divided by 10 (the original number of producing wells), the rates of decline are identical, i.e., unless I am missing something, dividing all production values by the original number of producing wells does nothing to correct for survivor bias, in regard to rate of change calculations. We are simply calculating the year over year rates of change in total production, and the rate of change numbers tells one nothing about the number of wells that “die” every year.
Although I posed my question to Enno up the thread, Dennis jumped in with his usual qualitative objections to a quantitative argument, and insofar as I know, no one else has addressed the issue.
So my question is, am I right that Enno’s approach does nothing to correct for survivor bias, when it comes to rate of change calculations?
As my example model shows, one can produce a year over year rate of change chart that looks a lot like the Bakken year over year rates of change, but by the time that the decline has settled down to 10% per year, 90% of the wells completed in year one of the model (2010) are no longer producing.
I don’t know what the percentage of inactive wells is for the Bakken Play by year, for example, the percentage of Bakken wells completed in 2007 that are no longer producing, and I don’t know whether the percentages are material, but there are numerous examples of very high abandonment rates in other shale plays.
For example, Chesapeake claimed that their 2007 vintage wells on the DFW Airport Lease, in the Barnett Shale Play, would produce “For at least 50 years.” Five years later, about half of the 2007 wells had already been plugged and abandoned.
Pursuant to a request, my net exports comments regarding the ELM, Six Country Case History and Global Net Exports of oil in one location:
The Export Land Model, The Six Country Case History and Global Net Exports of Oil
Jeffrey J. Brown
Independent Petroleum Geologist
Following is a summary of my work on net oil exports, and what I call “Net Export Math.” Some definitions:
Production = Total petroleum liquids + other liquids production (EIA)
Consumption = Total liquids consumption
Net Exports = Production less consumption
ECI Ratio (Export Capacity Index) = Ratio of production to consumption
CNE = Cumulative Net Exports (for a given given time period)
Export Land Model (ELM) = A simple mathematical model
Export Land Model (ELM)
In late 2005, I began to wonder what happens to net oil exports from a net oil exporting country, given an ongoing production decline and stable to rising domestic consumption. I constructed a simple model, which I called the “Export Land Model” or ELM, which stipulated a 5%/year production decline and a 2.5%/year rate of increase in consumption, and I was stunned at what happened to net oil exports.
Based on the ELM, and based on various scenarios for a hypothetical net exporter, I concluded that given an ongoing production decline in a net oil exporting country, unless the exporting country cuts their domestic liquids consumption at the same rate as, or at a faster rate than, the rate of decline of production, the resulting rate of decline in net exports will exceed the rate of decline of production and the rate of decline in net exports will accelerate with time. Furthermore, if the rate of increase in domestic consumption exceeds the rate of increase in production, net exports can decline, even as production continues to increase.
Following is a normalized chart for the Export Land Model, assuming a production peak in the year 2000, with declining production and rising consumption (2000 value = 100%). Note the rapid rate of depletion in remaining post-2000 CNE (Cumulative Net Exports), which corresponded to the decline in the ECI Ratio (the ratio of production to consumption):
http://i1095.photobucket.com/albums/i475/westexas/Slide1_zps53b4428b.jpg
Six Country Case History
The Six Country Case History consists of the major net oil exporters that hit or approached zero net oil exports from 1980 to 2010, excluding China (China, like the US, is an unusual case history, since both countries became net importers, as production continued to increase.)
The combined Six Country (total petroleum liquids) net export peak was 1995. From 1995 to 2002, their combined production fell by 7%, but their combined net exports fell by 35%. The kicker is that in only seven years they had shipped 84% of their combined post-1995 CNE (Cumulative Net Exports).
A one percent per year rate of decline in production corresponded to a post-1995 rate of depletion of 26%/year in their remaining supply of post-1995 CNE.
Note that their 1996 to 1999 production exceeded their 1995 production level, but because their rate of increase in consumption exceeded their rate of increase in production, net exports fell. And as production rose from 1995 to 1999, they had already shipped 54% of their post-1995 CNE.
In other words, a 0.5%/year rate of increase in production from 1995 to 1999 corresponded to a post-1995 rate of depletion of 19%/year in their remaining supply of post-1995 CNE.
So, the model is shown above, and a similar chart for the Six Country Case History is shown below.
Anyone see any similarities?
Note that the 1995 to 1999 time period for the Six Country Case History is analogous to the (so far) post-2005 time period for Saudi and overall Top 33 net exports, to-wit, the rate of increase in consumption outpaced the rate of increase in production, but as noted above, a 0.5%/year rate of increase in Six Country production from 1995 to 1999 corresponded to a post-1995 rate of depletion of 19%/year in their remaining supply of post-1995 CNE:
http://i1095.photobucket.com/albums/i475/westexas/Slide2_zps6c3a6280.jpg
(2005) Top 33 Net Exporters
Following are similar normalized values for the (2005) Top 33 net exporters, showing normalized data for 2005 to 2012 (2005 values = 100%). The post-2005 CNE estimate is based on the 2005 to 2012 rate of decline in the ECI Ratio (ratio of production to consumption):
http://i1095.photobucket.com/albums/i475/westexas/Slide3_zpse00789d2.jpg
A similar CNE estimate (extrapolating the seven year rate of decline in the ECI Ratio) for the Six Country Case History produced a post-1995 CNE estimate that was 23% too high.
The 2013 values for the 2005 Top 33 were as follows (EIA has not released complete consumption data for 2014 yet):
Production: 102%
ECI Ratio: 83%
Net Exports: 93%
Est. Remaining post-2005 CNE: 74%
To recap, the model showed that remaining post-export peak CNE declined faster than the ECI Ratio.
The Six Country Case History showed that their remaining post-1995 CNE declined faster than the ECI Ratio.
And an extrapolation of the decline in the Top 33 ECI Ratio suggests that remaining post-2005 Global CNE are declining faster than the ECI Ratio.
Based on the 2005 to 2013 rate of decline in the Top 33 ECI Ratio, I estimate that we had already, through 2013, burned through about one-fourth of the remaining post-2005 supply of Global Cumulative Net Exports of oil (Global CNE), and it’s quite possible that in the 10 year period from 2006 to 2015 inclusive, we have already burned through about one-third of remaining post-2005 Global CNE. A similar estimate (extrapolating the seven year rate of decline in the ECI Ratio) for the Six Country Case History produced a post-1995 CNE estimate that was 23% too high.
Pemex lost $32 billion last year. That is more than the GDP of Latvia, Cameroon, Paraguay and 89 other countries. It is 2.5% of Mexican GDP.
The CEO has issued a statement slashing costs:
http://www.pemex.com/en/investors/investor-tools/Presentaciones%20Archivos/Message%20CEO_i_160229.pdf
I’d interpret that to mean we should expect 4 to 8% decline rates in their production from here on.
http://www.zerohedge.com/news/2016-02-29/mexicos-oil-giant-posts-record-32-billion-loss-cuts-crude-price-forecast-25
The global economy seems to be tottering on the edge even with cheap oil. If the price had stayed at $110 and these losses had been covered by OECD consumers where would we be (or well will we be if the price does recover eventually) – I guess even more debt until the bubble really does pop.
[…] Read full post at peakoilbarrel.com […]