The Bakken and North Dakota tight oil production data is out.
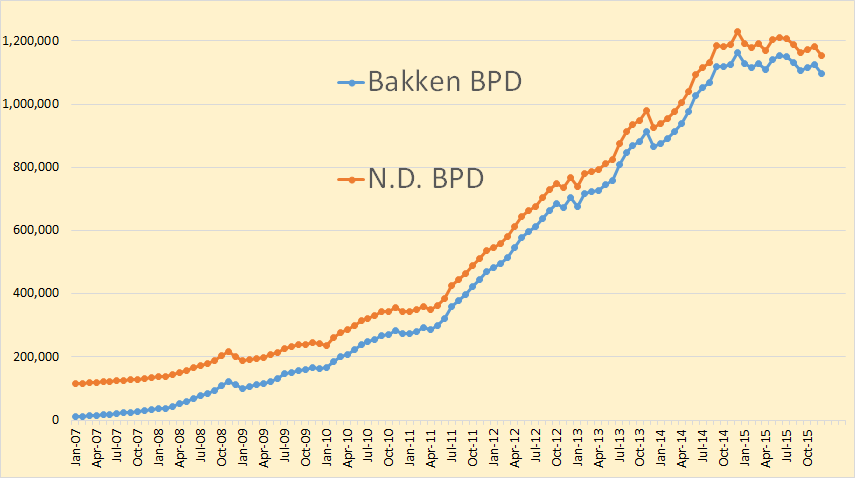
Bakken production was down 28,604 barrels per day to 1,096,044 bpd. All North Dakota was down 29,506 bpd to 1,152,280 bpd.
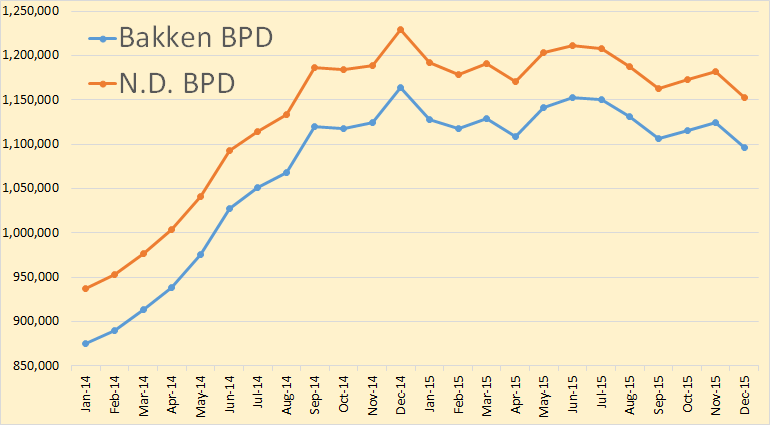
This is just the last two years of the chart above. It gives a slightly better look at what is happening.
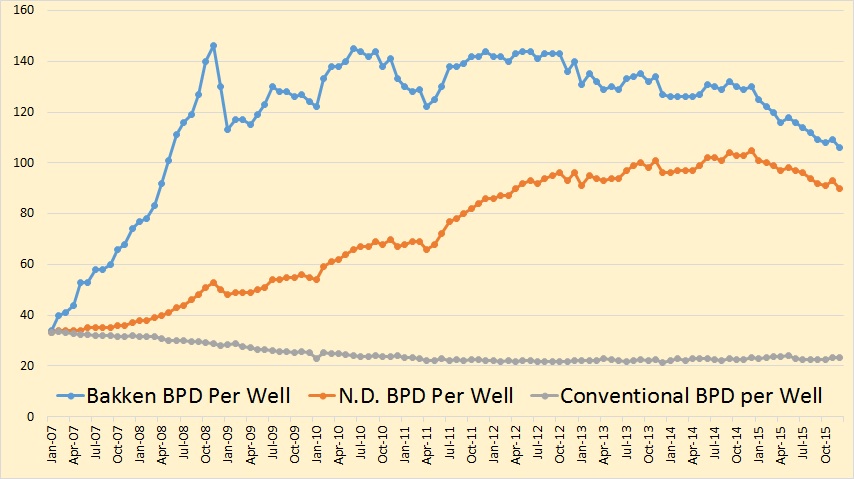
Barrels per day per well fell to 106 in the Bakken and to 90 in all North Dakota.
From the Director’s Cut
Producing Wells
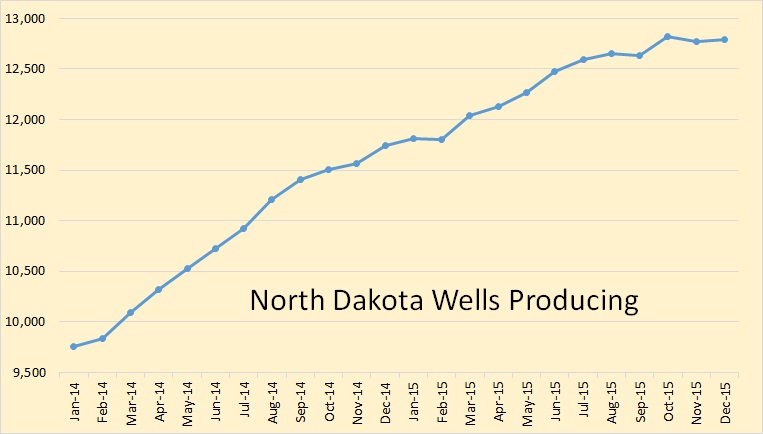
November 13,100
December 13,119 (preliminary)(all time high was Oct 2015 13,190)
10,756 wells or 82% are now unconventional Bakken–Three forks wells
2,363 wells or 18% produce from legacy conventional pools.
–
Permitting
November 125 drilling and 0 seismic
December 95 drilling and 0 seismic
January 78 drilling and 0 seismic (all time high was 370 in 10/2012)
–
ND Sweet Crude Price
November $32.16/barrel
December $27.57/barrel
January $21.13/barrel
Today’s $16.50/barrel
(lowest since February 2002)(all-time high was $136.29 7/3/2008)
–
Rig Count
November 64
December 64
January 52
Today’s rig count is 41 (lowest since July 2009 when it was 40)(all-time high was 218 on 5/29/2012)
The statewide rig count is down 81% from the high and in the five most active counties rig count is down as follows:
Divide -85% (high was 3/2013)
Dunn -76% (high was 6/2012)
McKenzie -75% (high was 1/2014)
Mountrail -88% (high was 6/2011)
Williams -90% (high was 10/2014)
–
Comments:
The drilling rig count was steady from November to December, fell sharply from December to January, and again into this month. Operators are now even more committed to running fewer rigs as oil prices remain at very low levels. The number of well completions remained steady from 77(final) in November to 76(preliminary) in December. Oil price weakness is now anticipated to last into at least the third quarter of this year and is the main reason for the continued slow-down. There were no significant precipitation events, 5 days with wind speeds in excess of 35 mph (too high for completion work), and 2 days in Williston with temperatures below -10F.
Over 97% of drilling now targets the Bakken and Three Forks formations.
At the end of December there were an estimated 945 wells waiting on completion services2, 24 less than at the end of November.
Crude oil take away capacity remains dependent on rail deliveries to coastal refineries to remain adequate.
The drop in oil price associated with anticipation of lifting sanctions on Iran and a weaker economy in China is expected to lead to further cuts in the drilling rig count. Utilization rate for rigs capable of 20,000+ feet is about 30% and for shallow well rigs (7,000 feet or less) about 20%.
Drilling permit activity declined November to December then fell further in January as operators continue to position themselves for low 2016 price scenarios. Operators have a significant permit inventory should a return to the drilling price point occur in the next 12 months.
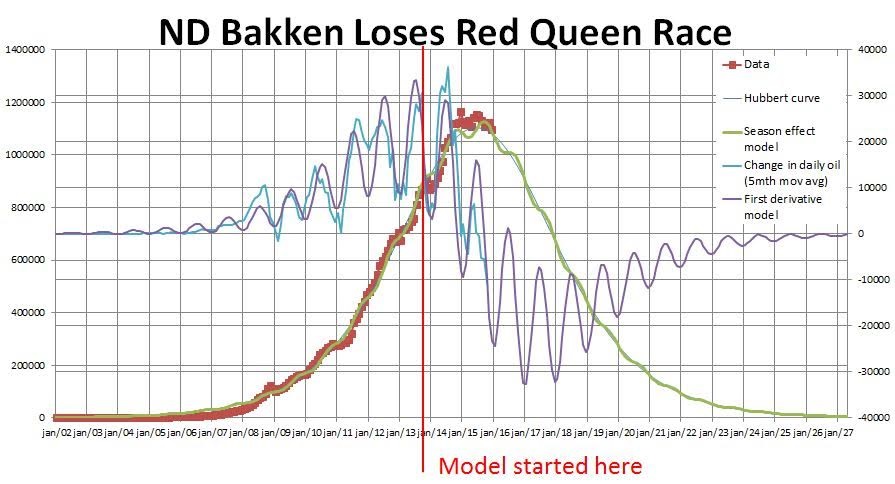
Bruno Verwimp posts me the above chart. He says so far the Bakken is following his curve exactly.
399 responses to “Bakken December Data, Big Decline”
Winter just started affecting the North Dakota production numbers. There is more decline to be expected the coming months. Consider seasonal conditions combined with the maturity of the field and with low prices. The peak is behind us.
The accuracy of your curve would suggest that the drop in oil price hasn’t had as marked an impact as would be expected – i.e. the decline was going to happen anyway, no matter what. Can you comment on that?
I am, honestly, stupified myself by the accuracy of the curve, that is 25 months old now without ever tinkering the parameters of the model. It was based on Hubbert analysis, adding a seasonal effect on it. So basically it is pure geology, no impact of price whatsoever. Besides that, one needs to aware of the price collapse and the possible impact on the industry. So I might be just “lucky” to be right with my prediction, because the price collapse happened to coincide with the predicted decline in production.
For that reason I added the other set of curves: the first derivative of the model and the change in production (5 month moving average). The cool thing is: there is basically no disturbance of the expected/predicted changes in the data. The changes in the data do follow the first derivative of the model too. Would there have been a sudden policy change (due to lower prices) there would occur a mismatch between the first derivative of the model and the change in the data. That did not happen. So, basically, I believe ND Bakken is producing every barrel it can, from a geology point of view – despite the low prices.
Hi Verwimp,
Can you remind us what the URR of your Hubbert model is?
I ask because Proved plus probable reserves at the end of 2014 were about 9.3 Gb, cumulative production was about 1.2 Gb at the end of 2014,which suggests a URR of 10.5 Gb, if no new reserves are added from possible reserves or contingent resources in the future.
The decline has very little to do with geology and much to do with the oil price.
If new wells were being added at a rate of 150 new wells per month in a scenario where oil prices only fell to $80/b instead of $50/b in 2015 and then gradually rose from $80/b in June 2017 to $160/b in Oct 2020, then output would increase until mid 2020 and then gradually decrease.
If we assume profitable well locations run out at about 40,000 total wells drilled, we get the scenario below when 150 new wells per month are added from May 2015 to Sept 2031.
“If new wells were being added at a rate of 150 new wells per month in a scenario where oil prices only fell to $80/b instead of $50/b in 2015 and then gradually rose from $80/b in June 2017 to $160/b in Oct 2020, then output would increase until mid 2020 and then gradually decrease.”
Why is it that you get to make up wild, pie in the sky scenarios that logic and economics virtually guarantee has zero chance of occurring and everyone accepts it as if it were a legitimate view point?
Anyone else want to dream up a scenario with a different outcome?
Since when is a resource that is not economical to extract not a geological issue?
Why is it that you get to make up wild, pie in the sky scenarios that logic and economics virtually guarantee has zero chance of occurring and everyone accepts it as if it were a legitimate view point?
This ” wild pie in the sky” is in your head, not in Dennis’s. Suppose you outline your reasons for thinking you know so much more than Dennis?
“Since when is a resource that is not economical to extract not a geological issue?”
Your are obviously “challenged” in respect to your reading and comprehension skills, or else just have it in for Dennis for some reason of your own.
“The decline has very little to do with geology and much to do with the oil price.”
If you will go to a dictionary, and look up the word “context”, and study it until you understand it, and read the quoted line just above, carefully, slowly, you will eventually understand that the Dennis’s comment, IN CONTEXT, is about oil that was being produced when the price was HIGH , and is now being shut in when the price is DOWN.
The geology of the oil field has not changed.
Methinks you habitually take a cheap shot at Dennis once in a while.
Now I call “bullshit” once in a while myself, but when I do, I have something to say about WHY I believe what I do.
When other folks tell us that Wall Street has driven the price of oil down to peanuts, they never bother to explain just how Wall Street manages this trick.
If they want to explain it by saying Wall Street has had such a bad influence on the economy that the world cannot AFFORD oil at more than twenty to thirty bucks, and is so broke it can only afford ten dollar oil, they ought to say so in so many words, and be done with it. THEN they might have an argument with legs to stand on.
But talk about traders, who do not generally own oil fields, or oil companies, or oil field contracting service companies, or pipelines, or tanker ships or tanker rail cars, or refineries, or tank farms, or fleets of eighteen wheelers that deliver to retailers, or retail stores that sell gasoline and diesel fuel, WILL NEVER make any sense.
All the people who own all these various things respond to price, sure as hell.They respond in real life. They produce oil that goes thru the distribution and processing chain right up to the retail store where it is bought by the collective customer, who buys as much as he wants, and has near zero use for more.
If it were MILK, he could at least feed an extra gallon to the family dogs and cats. Being as gasoline and diesel fuel are nasty, and actually dangerous to have around, and expensive to store, the average user would buy very little more, over the short to medium term, than he buys today, even if the price of it went down to FIFTY CENTS a gallon.
Over the longer term, the average user will perhaps buy a nicer, larger, more powerful car, if he can afford a new car.
The airline industry will cut ticket prices,eventually, being forced to do so by competition, because fuel is a HUGE part of air line expense items,but they will hold off as long as they possibly can. Even so, it will take a while for air travel to pick up just because ticket prices are down.
There is a logical, air tight, exceedingly simple explanation for the low price of oil.
More oil is coming to market than the end user wants, and the price will stay low until production falls back enough that the end user HAS to pay more for oil.
I am waiting for the smoke and mirror guys to explain how it is that Wall Street forces producers to pump and sell oil.
Wall Street may have loaned the money to the folks in the tight oil business—- But who thinks Wall Street lent that money with the INTENT of putting the borrowers into bankruptcy, with the CONSEQUENCE the loans would not be repaid?
ANYWAY, Saudia Arabia and Russia aren’t financed by Wall Street. Chinese oil companies are not financed by Wall Street.
MOST of the oil produced in the world is not financed by Wall Street.
As the price goes up,the end users who are least prepared to pay higher prices will necessarily cut back , and the oil they DON’T burn will be burnt by the people who can afford to pay more.
You can learn all this stuff at any REAL university, where the econ professors are not PC idiots, in the first basic course.
Hell’s bells,I learned it in COW COLLEGE over half a century ago. They still teach it pretty much the same way in most real universities, so far as I have checked.
Hi Jef,
Both geology and price influence output. If oil prices had remained $80/b or higher, output would not have declined. Both geology and economics are included in the model, following the work that Rune Likvern has done in the past and using the data that Enno Peters has so graciously provided to develop better well profiles for the average Bakken well.
Hi Jef,
The point of the scenario was to show what might have happened if the price had not decreased. It was to serve as a counterpoint to a Hubbert analysis that suggests prices don’t matter, only geology.
I think geology is important (that is why I use the well profiles developed from actual output data from the NDIC).
I don’t know what future number of wells will be added, but I am sure the oil price will imfluence the decision of how many wells to complete.
One way to think of the scenario above is if I had done it back in July 2014 when oil prices were still about $100/b.
I certainly didn’t see the future drop in oil prices coming and would have thought the price scenario was very conservative.
Clearly such a scenario would have been wrong, as most of my scenarios are. The future is difficult to predict.
“The future is difficult to predict.”
Oh I think it is very easy to predict that the global economy can not endure $100 + oil humming along supporting current demand yet alone the growth required for your predictions.
Hell it’s not even a prediction it is simple observation but don’t let that get in anyones way.
Hi Jef,
The World endured oil prices over $100/b from 2011 to mid 2014. World Economic growth was between 2.3% and 2.8% per year from 2011 to 2014 according to the World Bank.
http://data.worldbank.org/indicator/NY.GDP.MKTP.KD.ZG/countries?display=graph
As oil becomes more expensive (as it is in Europe due to proper tax policy) people will use it more efficiently.
I support policies that would make oil more expensive (through higher taxes) so we would use less of it. People would demand more public transportation (light rail and rail which can be electrified) and better urban design so biking and walking would be preferred modes of transport.
No doubt you would claim that is BAU lite, but BAU is changed gradually over time unless there is a crisis and then change becomes more rapid (US during Great Depression). Unfortunately a crisis can lead to other outcomes that are less desirable.
Those growth % are only due to the fact that the central banks of the world pumped trillions of dollars into the FIRE economy. The other 90% of the global economy, some call the real economy suffered greatly.
The only reason oil production didn’t collapse is because of that same trillions of $ pumped into the economy.
If you think that any of this is natural, sustainable, or repeatable you have another think coming.
Hi Jef,
The real economy is not affected all that much by the central banks. The expanded money supply just circulated more slowly.
If you are concerned about the distribution of wealth, I agree that is a big problem.
Less developed countries have been growing more rapidly than OECD nations so they are catching up, much more of this needs to happen as it leads to more educated women and lower births per women which will eventually solve the population problem.
The growth in GDP happened, it may not be sustainable over the long term, it will slow as population peaks and declines (peak around 2050 for population.)
Dennis – Is there a reference for the URR numbers – I’d guess USGS. I think their numbers cannot be used the way official oil company numbers can (i.e. their reserves are really more like resources (i.e. technically recoverable, but with no price associated). In California shale their numbers dropped by 97% overnight. The Verwimb curve looks to give about 2.0 to 2.5 URR, is that not in line with Campbell and Laherre, who might underestimate a bit as that is what reservoir engineers do, but not too much.
I’m not sure how to interpret probable, possible and contingent reserves in LTO terms. In conventional reservoirs they often relate to neighbouring areas that look similar in geology (i.e. may contain traps with oil) or fault blocks in the same formation which haven’t been drilled, or uncertainties about recovery factors or oil/water contact. To turn them to proven reserves requires drilling exploration wells. The uncertainties when drilling source rocks seem different – the area is known but productivity can be orders of magnitude different.
Your numbers would be right if the assumptions are right but there seem many more ways for them to be wrong – i.e. have even thousand wells actually been profitable to date, let alone 40000 in the future.
Hi George,
The wells would be profitable if prices had remained above $80/b (or this would be true for the “average” well, some would be more profitable and some would be less, but we know that every oil company drills “above average” wells. 🙂
The bad California LTO estimate was the EIA and not the USGS.
The EIA gathers proven reserve data and for the Bakken at the end of 2014 this was 5.5 Gb, there was 1.2 Gb of cumulative production, so at minimum the URR would be 6.7 Gb, if we assume the average well has an EUR of 250 kb and the probable reserves are zero (highly unlikely), then 6700 Mb/0.25 Mb per well would be 26,800 wells. Typically probable reserves are about 70% of proven reserves, let’s be conservative and use 50%.
That results in 8.3 Gb of proved plus probable reserves, then add 1.2 Gb of cumulative output from 1950 to 2014 and we have a URR of 9.5 Gb. Note that I have assumed no new discoveries or any additions to 2P reserves in the future to get this 9.5 Gb URR estimate. I think that is too conservative and usually use 10 Gb as a round number for the URR.
The EIA reserve data is at the link below:
http://www.eia.gov/dnav/pet/hist/LeafHandler.ashx?n=PET&s=RCRR01SND_1&f=A
At the end of 2014 proven reserves were about 6 Gb and at the end of 2006 they were 0.4 Gb, I have assumed that most of the increase in reserves was due to Bakken/Three Forks reserves because most of the oil produced from 2007 to 2014 in North Dakota was from the Bakken/Three Forks.
The USGS Bakken/Three Forks Assessment presentation can be found at the link below:
https://drive.google.com/file/d/0B4nArV09d398cDZMNW5yRWxVM1k/view?usp=sharing
See slide 16, mean undiscovered technically recoverable resources (UTRR) in Bakken/Three Forks is 7.4 Gb.
See slide 18, North Dakota has 78.6% of the Bakken/Three Forks UTRR or 5.8 Gb. Add proved reserves (note that we are assuming probable reserves are zero which is very conservative) of 3.3 Gb at the end of 2012 (the assessment was published in 2013) and also add 0.7 Gb of cumulative output to the end of 2012 and we have a TRR of 9.8 Gb.
If we had added probable reserves of 1.6 Gb (50% of proven reserves), the TRR would be 11.4 Gb.
Also note that Jean Laherrere has always argued that proved plus probable (2P) reserves is the best estimate and is what should be used rather than proved reserves. So the best estimate for URR is 11 Gb rather than 10 Gb as long as oil prices in the future are high enough to make production profitable.
Dennis – so EIA had a large estimate for Monterey shale, reduced it a bit and then USGS knocked it down to almost nothing. Why can’t something similar happen on the undiscovered ‘reserves’ that EIA are quoting for Bakken?
2P estimates from conventional fields, where the producing companies hold all the rights but maybe haven’t drilled in all areas, have usually come out pretty close to final recovered oil. There are legal obligations on the operating company to be as accurate as possible, they will have good seismic and have spent a lot of money checking upside and downside before FID on the project. With numbers from EIA on land which no company has yet shown interest in and requiring unconventional wells, I can see some significant differences (not that I’m saying one way or the other – I don’t know enough in general in LTO or the specifics in Bakken – just an interested observer).
Hi Eustace,
The undiscovered resources are USGS estimates
see
http://pubs.usgs.gov/fs/2013/3013/
The EIA estimates are proved reserves gathered from company data see
http://www.eia.gov/dnav/pet/hist/LeafHandler.ashx?n=PET&s=RCRR01SND_1&f=A
Take 2014 reserves and subtract 2006 reserves and that gives an estimate of Bakken/Three Forks reserves in North Dakota. Cumulative output at the end of 2014 was 1.2 Gb, so proved reserves plus cumulative production was about 6.7 Gb at the end of 2014. Typically probable reserves are between 50% and 80% of proved reserves, a best guess would be 65%, but a conservative estimate would be 50%, this would suggest a URR of at least 9.4 Gb, if no possible reserves were added to 2P reserves in the future (which is unlikely at best).
Dennis,
As far as I can see in your above chart you are assuming that new wells will grow by close to 160 new wells per month.
However, December growth from November were just 19 new wells from 13,100 to 13,119 and down from October 15. In addition, the tight credit conditions will very likely force companies to abandon wells.
As your price forecast has been catastrophic on the wrong side and you have also missed the huge opportunity to short oil (buying DWTI instead of UWTI), there is already mounting evidence that your production forcast is going horrible wrong.
Isn’t it time to rethink your models?
Hi Heinrich,
The point of the second scenario was to show that if we ignore the oil price (as Verwimp does) we can get a very optimistic scenario.
Why has the number of new wells added each month decreased?
It is because the price of oil fell from $110/b to $30/b. It is not only a matter of geology it is both geology and economics.
I note that when I ask what you think the future price will be, you don’t give an answer, then in the future you can say, see I was right about the price, I said it would be “higher” than most people think. Can you tell us what most people think, do you mean the futures price of $40/b for Brent in Dec 2016?
If that is what you mean, that is far from a bold prediction. If the Dec 2016 average spot price for Brent is $41/b, you can say, see I make very accurate predictions as you have all Brent oil prices from $41 to infinity covered by your “prediction”, very clever indeed.
So how about a little narrower range for your Dec 2016 average spot price for Brent crude?
Note that the first scenario I posted is what I think is likely, the second is what might have happened if the price of oil had remained at $80/b or higher as most people (including the futures market) believed in Sept 2014.
Looking at EIA futures prices for crude, contract 1 (next month’s futures contract) in Sept 2014 averaged $93/b in Sept and contract 4 (4months ahead, so Jan 2015) was $91/b. How accurate were these futures prices? Let’s look at the spot price for WTI in Oct 2014 ($84/b monthly average, or $9/b lower than the average futures price in Sept) and Jan 2015 ($47/b monthly average or $44/b lower than the futures price from 4 months earlier).
It is pretty easy for oil price predictions to be wrong, the only way to be correct is to make no firm prediction, maybe zero to infinity will be the future oil price, then all bets are covered.
However, December growth from November were just 19 new wells from 13,100 to 13,119 and down from October 15.
Heinrich, that is not exactly correct. In December there were 19 additional wells producing. Wells producing are the total of new wells minus wells shut in. A lot of wells are being shut in these days. Helms says there were 77 well completions, meaning new wells. Enno may have a different, and more accurate number however.
Hi Ron.
Enno’s estimate is 79 new wells added, probably at least 78 of them were Bakken/Three Forks wells.
Dennis, The URR of my Hubbert Curve is only 2.77Gb. That just gave me the best fit to the data prior to december 2013.
I have a problem with any assumption of a constant number of wells being drilled every month for decades to come. If there really are another 30k something wells to dril, Americans will go for it as soon as possible. When there is a dollar to be earned today citizens of the USA will not wait until tomorrow. They go for it. So an assumption of 150 new wells per month during decades will never materialise. It will grow until, lets say 600 new wells per month within a 5 year timeframe (the production of rigs needs to follow, as does the road infrastructure.) and then fall back to zero, resulting in a Hubbert curve once again… (I am generalizing all citizens of the USA now, I know, and that’s never right, but you know what I mean.)
Hi Dennis,
“The decline has very little to do with geology and much to do with the oil price.” It might. Absolutely. But… Please follow the thought experiment below:
(1) I made my model, not taking price into account.
(2) As far as until now: the model fits.
(3) I did not, and still do not, need price to explain what happens.
(4) We indeed had a fall in price, and a fall in drilling activity.
(5) Notice: correlation does not mean causation, and cause and consequences might be the other way around than intuitively understood.
The popular statement is: “The price fell because OPEC refused to close the tap.” Is that correct? When I check Ron’s graphs OPEC didn’t add much production lately, the USA did! It’s the USA that flooded the markets with oil. The USA caused the price collapse. Shale oil caused the price collapse. Shale oil caused it’s own demise. Falling price was just a consequence of producing more than a certain critical level whatsoever. You see? 🙂
If you check long term oil price evolution and production evolution, there is basically no link at all. I think more than by price oil production is driven by hope to make a profit.
Verwimp,
Being analytical, the time coincidence of the peak in your graph and the oil production peak, could be due to:
a) Chance
b) The model correctly capturing oil production dynamics.
Since your model does not include oil price, and oil price has changed drastically, for b to be correct, it follows that oil price has to be irrelevant for oil production dynamics, because if it is not, then a is correct.
I don’t think anybody here thinks that oil price is irrelevant for oil production.
You just got as “lucky” as anybody predicting Peak Oil for 2015 before the summer of 2014. Without the price crisis Peak Oil could have been delayed.
I have always had a problem with pure geological “Hubbert” models. Oil production depends also on the economy and if you don’t include the economy you can only get it right by chance and since the economy is a lot harder to predict than geology if you do include it, then you get a cloud of scenarios, and therefore you are not predicting much.
Javier, Bakken is a Hubbert poster child. Look at the linearisation, please. There is no change in the field dynamics post june 2014. There is no change in the field dynamics post price collapse. As for now: I rest my case: (b) The model correctly capturing oil production dynamics.
Hi Verwimp,
A Hubbert linearization is not reliable when such a short period is used, it is typically done using annual data of at least 10 years. Even then it often underestimates the eventual URR.
The Hubbert linearization technique has many flaws see
http://www.theoildrum.com/node/2357
Annual data of at least 10 years results in 10 datapoints. I use monthly data of >6 years, resulting in >70 datapoints, of which most of them are nicely collinear, besides the annual winter dip. Why would this not be reliable, when apparently every new datapoint fits with the model so far, in such a way that the 25 datapoints result in an R²=0.92 compared to the model?
One typically uses annual data because of a lack of monthly data. One typically uses at least 10 years because one needs to consider a significant timeframe in the history of the field. I consider the entire history of the field.
Hi Verwimp,
The history of the Bakken/Three Forks goes back to 1953, so you do not really capture the entire history of the field.
Below I will demonstrate what happens when a Hubbert Linearization is done too early.
As Dennis pointed out, Hubbert Linearization is indeed deeply flawed. Any curve that shows an inflection point like we are experiencing now will show linearization over such a short time period.
Convolution-based approaches such as Dennis applies are more mathematically sound as they use actual physics and observational data. He is also doing a good job of applying demand effects into the formulation.
Sorry Verwimp,
I am not buying your argument, because it is logically faulty. Your graph is just a model that depends critically on production following a particular logistic curve and not other. The price crisis has reduced the number of rigs and production bringing the peak forward maybe a few years. The new logistic curve is more similar to what you modeled, that is all.
You cannot extract any conclusion from the fact that your model and oil production correlate. It was not inevitable as production has been affected by the price crisis. You will fool yourself if you think otherwise.
Hi Verwimp,
You are correct that for the economy as a whole, oil output does not correlate well with the price of oil, it tend to be tied to economic output. I will not try to convince anyone, but in my view the causation arrow between oil output and GDP points from GDP to oil output. Higher GDP results in higher income which increases demand for oil, raises oil prices, makes oil production more profitable, and leads oil producers to increase output.
Consider the following thought experiment. Oil demand increased at a level that was equal to the increase in oil output and the oil price remained at $110/b. Would the well completion rate in the Bakken Three/Forks have fallen from 2200 new wells per year to about 1000 new wells per year in that scenario?
If so what would be the reason for the decrease in well completion rate.
It is absolutely true that oil producers are in business to make a profit. That is the reason the price of oil matters.
Note that my claim is not that geology does not matter, it is that both geology (supply) and the economy (GDP which determines demand) are important.
The URR of your model (2.8 Gb) is less than proven reserves plus cumulative output(6.7 Gb). It is not surprising that it would have reached a peak in April 2015 at about 50% of the URR.
You are correct about a steady 150 new wells added per month being too low, it may be higher than that, there is always a limit to how high these rates can go determined by infrastructure. Exponential growth does not continue, the growth becomes linear and gradually slows to a stop due to geological constraints.
Note that the USGS Assessment suggests a TRR at the F95 level of 10 Gb, that is there is a 95% chance that the TRR for the North Dakota Bakken/Three Forks is more than 10 Gb based on the USGS analysis.
I agree with your criticism of my model, the linear addition of new wells is a simplifying assumption to try to model decreasing new well EUR. Something that needs work.
I would note however that the rate that wells were added to the Bakken /Three Forks increased gradually from May 2012 to Oct 2014 (12 month centered average rate of well completion) from 150 new wells per month to 185 new wells per month over about 30 months, just a little over one well per month.
Eventually the increase would flatten to a maximum rate due to infrastructure, social, economic, and geological constraints.
Scenario below tries to adjust in consideration of your criticism (which I appreciate).
“If so what would be the reason for the decrease in well completion rate.”
I don’t know, Dennis. I really don’t know. Some fysical limit. Too many oil trucks blocking one another on every road crossing, damage to roads, too many dry wells outside of the sweet spots, … I have no idea. I live 4000 miles away from Bakken. Someone here living in the Bakken might tell me what these limits were.
In the 1970’s oil production in the lower 48 declined while prices increased dramatically. It was just post peak decline. Nothing to do about it. Now we see stagnation (and soon decline) of production in times of declining prices and there is a causal relation seen in these events. I don’t need that causal relation to recognize a peak and post peak decline. That’s it actually. If price did influence Bakken production, something would be visible in the first derivative, or at least in the Hubbert Linearisation. Both did not happen. (see above) Please realise it still might happen! That would be it! That would result in a downward bent of the linearisation and that would result in even more extreme production decline! Woow!
Hi Verwimp,
See the following,
http://peakoilbarrel.com/bakken-december-data-big-decline/#comment-560185
There are many problems with HL especially its tendency to underestimate URR.
Oh, the Hubbert linearization tends to be concave up rather than linear, so the results tend to be an underestimate of the URR.
Hi Verwimp,
Your suggestions for physical limitations might explain why output could not increase faster than it has, but North Dakota had no problem completing 185 new wells per month over a 12 month period (the maximum 12 month rate) and was able to truck oil and water just fine at 1163 kb/d in Dec 2014 so there is no reason they could not continue at that level, in fact there is a great deal of excess rail capacity to move oil out of North Dakota.
The drop in oil price is the explanation and it does not matter who “caused” the oil glut, producers will cut back their investment when profits fall and that is exactly what we see happening in North Dakota. As I said before there are many reasons the “geological” hypothesis for reduced output is not convincing, it is much more a matter of oil prices and profitability.
Dennis,
“for the economy as a whole, oil output does not correlate well with the price of oil, it tend to be tied to economic output.”
Is a lot easier. Oil output correlates with upstream capital spending, and capital spending depends on how well oil companies are performing economically, what are the economic perspectives, and price of oil.
Now this graph tells you two things not reflected in a Hubbart linearization:
– That upstream capital spending since 2005 has been growing a lot faster while oil production has been growing a lot slower.
– That upstream capital spending is undergoing its biggest reduction in history.
Both together define the 2015 Peak Oil.
Hi Javier,
No it doesn’t describe peak oil, it simply shows the market is oversupplied and this is how it balances.
Basic economics my friend.
I agree with you on Hubbert Linearization, not a great method for determining URR.
Is Javier Spanish for denial?
If something is backed by evidence and hurts your feelings then you can “Javier” it into my imaginary land!
Dennis,
The market you talk about is to the left of the red arrow in the graph. To the right of the red arrow you have a situation that requires ever increasing amount of investment just to keep production flat.
“The greatest shortcoming of the human race is our inability to understand the exponential function.”
Albert Bartlett
Now, if we just need increasing investment just to keep production flat, and investment doesn’t grow, we get a reduction in production, but if investment declines, we get an exponential decline of production, and if investment declines hugely as it is happening, we are going to watch a huge decline for a long time. Then to make up for the losses we would have to triple or quadruple the investment, and we will simply be unable to do so. Our weakened economies running on less oil will not be able to do so. Our consumers, burdened by debt and stagnant wages and multiple part time jobs will not be able to pay the oil prices necessary to do so.
Dennis, define the conditions necessary for you to accept that Peak Oil has taken place. Time with production not raising above 2015 levels, or decline in production or combination. Seems to me that some people will never accept Peak Oil no matter the time or the decline since last peak. They will always think that higher production is possible and will find justification outside Peak Oil for the production decrease.
Hi Javier,
The test is simple. High oil prices (over $100/b in 2015$) for 3 years or more with no new peak in C+C output.
See following article:
http://www.woodmac.com/analysis/PreFID-oil-projects-global-breakeven-analysis
The decline in investment will mostly affect output in 2018 and later chart below from article linked above.
Dennis,
Then what happens if oil prices never go over $100/b in constant money as Gail Tverberg defends? Or if it goes over but comes down again before 3 years?
Do you have a definition of Peak Oil that does not depend on oil price?
Hi Javier,
I don’t agree that prices will remain low, when an important commodity becomes scarce its price will rise. You and Gail assume there will be an economic collapse and I assume you both must think that it will be permanent.
If that was the case peak oil would be the least of our problems, but I do not find such an analysis convincing.
Essentially the argument is that there will be no supply constraint, there will be a demand constraint that will keep oil prices permanently at a level where the oil output level remains below 2015, and I think that is unlikely over the long term.
Output will dip a little in 2016, oil prices will recover to $75/b or higher and oil investment will resume.
If we ignore price and simply look at output levels it took 17 years to get back over the 1979 peak after the oil shock of 1980-82, so that could be our time, after 18 years we might conclude the peak was behind us. Or we could look at the drop in overall output from 1979 to 1983 where production dropped by 15%. So if we assume 2015 annual C+C output is 79.9 Mb/d we might conclude the peak had been reached if output drops by more than 15%, so under 67.9 Mb/d.
For me without high oil prices as I first suggested, this would be needed, especially prior to 2030. I believe by 2030 we will be at or beyond the peak (this would be an undulating plateau scenario at around 80 Mb/d from 2015 to 2030.)
Oh and I do think oil output will peak, I am not convinced that 2015 will be the peak, I think it will be between 2020 and 2030, depending on what happens to the economy and oil prices in the future.
Dennis,
>15% decline in oil production then. That can be achieved easily in less than 10 years. Before 2025. Just watch.
“If that was the case peak oil would be the least of our problems”
Obviously, but Peak Oil is the main cause of our problems. The Peak conventional oil of 2005 caused the price increase that made the subprime bubble and the financial leverage unsustainable. The Peak exports of 2007 contributed to the downfall of the highly indebted oil importing countries in the debt crises of 2010 and 2012. The oil reduction that is coming is going to wreck the global economy. Lack of oil will not cause high prices, will cause poor economic performance and thus low or moderate oil prices. But you are right, oil will be the least of our problems as unemployment will be very high and unemployed people consume less oil.
Hi Javier,
Without high oil prices, about 2042 to get to 67.5 Mb/d, I doubt the economy will perform as you foresee.
Mr Verwimp – thanks. It would seem amazing that price changes like we have seen didn’t play a part but: a) the actual flattening of the curve started in late 2014 before the OPEC meeting that killed the price, which means drilling/completion strategies would have been changing in the six months before that, when prices were still high; b) through 2015 till now the price crashed by a factor of four to six – but could anyone look at that undulating plateau and explain it in price terms.
I worked on North Sea projects (and a very short time on an Alaskan one) in the late 1980’s and there was an apparent price disconnect then in a different way, prices were very low but projects just kept getting approved, while Houston was going bust.
I’ve never seen first derivative and seasonal cycle trends used like that before. They are pretty smart and add useful insight.
There was a sharp deceleration in the Bakken ND production growth rate from 2Q12 to 1Q13 (the effects of low base).
But from April 2013 to December 2014 growth rates remained relatively stable at around 30% y-o-y.
It was falling oil price (after Nov 2014 OPEC meeting) that caused a sharp decline in drilling/completion activity and, a result, in the Bakken production growth in 2015.
Bakken ND y-o-y oil production growth, 2010-2015
Hi AlexS,
Exactly right. In addition prices started to fall after July 2014 which gradually reduced the completion rate, in addition the wells were being added at a pace that was outstripping the ability of completion crews to keep up so that was the main reason for the fall in the growth rate to 30%, they were at their maximum completion rate and eventually this slowed due to lower prices.
Bakken ND y-o-y oil production growth, 2013-2015
Bakken ND y-o-y oil production growth vs. WTI oil price, 2013-2015
AlexS,
Not much to be said except very nice work! Thanks.
This seems like it might be a spurious correlation though, unless that is the average WTI over the prior 12 months.
Otherwise, how is the price in a specific month meant to predict the production change over the previous 12 months?
gwalke, I think you are reading this wrong. Price in a specific month is not an issue, it’s the general decline in price over several months. And price is not predicting production. Year over year production decline is just following price decline.
Hi Gwalke,
I agree with Ron.
Notice that the price decline occurs about 6 months prior to the decline in output growth. The number of wells completed has decreased, that is a fact.
Do you propose the decrease in oil prices has nothing to do with the decrease in the number of wells completed in the Bakken/Three Forks?
If you are arguing that there is a lag, I agree, the chart shows pretty clearly that this lag is about 6 to 8 months.
If you are going to argue that oil price doesn’t matter, what is your explanation for the decreasing rate of well completions?
My complaint is that correlation is not causation. These are presented together to suggest a causal link. Your causal mechanism for y-o-y production growth change is price month by month in that graph.
All I’m saying is that you can’t attribute the difference in production Jan14-Jan15 to the price change Jul14-Aug14, which is what is happening in that graph and what you have both said in these comments. You need to compare them over the same time scale, otherwise its apples to oranges.
All I’m saying is that you can’t attribute the difference in production Jan14-Jan15 to the price change Jul14-Aug14,…
Ahhh but I think you can. Shale oil is very expensive to produce. And it is only natural that when the price collapses, then production of this very expensive oil slows dramatically… with about a six month delay of course.
If you think that, you need to explain why the price and production figures in the other 11 months had no effect on Jan 15 production.
Bakken oil rig count followed with a 5-month time lag the decline in oil prices.
The rig count started to decline only in November 2014, when oil price dropped below $70/bbl after OPEC decided not to cut output.
Bakken oil rig count vs. WTI oil price
In turn, y-o-y change in the Bakken oil production is closely correlated with the rig count.
Y-o-Y change in the Bakken oil production vs. monthly-average oil rig count
verwimp has a compelling chart that shows price independent change.
You have a compelling chart that shows price dependent change.
So what do we conclude?
Hi Commenter,
Verwimp’s charts are nice, but as Javier suggests correctly the decline on his chart and the current decline in actual Bakken output are a coincidence. The URR happened to have been chosen so that the peak almost coincided with the drop in oil prices. Note that the URR of 2.8Gb is too low by a factor of more than 3 based on USGS estimates and that proven reserves plus cumulative production are 6.7 Gb so at minimum we would expect the URR to be at least 6.7 Gb, when we add probable reserves to get 2P reserves (this would be the petroleum engineer’s best guess with a 50/50 chance of reserves being higher or lower), the URR estimate rises to at least 9.5 Gb.
The USGS TRR estimate of 11 Gb would result from 1.5 Gb eventually being added to 2P reserves from the “possible” reserve category as more drilling defines the basin more fully.
My pleasure. And thanks for your comment, Mr. Kaplan.
It’s a good run, and a very interesting and smartly made model, well done. But I would caution that price did indeed play no real role in the 25 months in question. Operators basically had no financial constraints due to 0% interest rate policies and yield chasing banks, and Wall Street rewarded ever-increasing production. I have said this time and again in response to the guys who see shale as “responsive” or “the new swing producer” – it simply hasn’t responded to price previously.
However, if we see a series of large bankruptcies (Whiting is a prime candidate here), with assets changing hands to more circumspect operators and creditors getting burned with losses, price is likely to play more of a role. That may well result in a tick upwards and possibly a second mini-peak (i.e. at a lower level than 2015 averages) on that downward slide the other side of peak.
That said, we also argue that companies are overstating their reserves, which suggests a quicker decline.
“price did indeed play no real role in the 25 months in question. Operators basically had no financial constraints due to 0% interest rate policies and yield chasing banks, and Wall Street rewarded ever-increasing production.”
Then why did they reduce their capex by 40% in 2015?
Because their costs fell as service companies lowered their prices and they switched to infill drilling, plus they spudded fewer wells.
Now we need to answer: Given this, why did yearly average Bakken production grow in 2015 over 2014 if it responds most to price? Why did it remain pretty much flat month to month over 2015?
Answer: many companies are debt ponzis and thus don’t respond well to price. Instead, they are focussed on gaining more debt funding. As such, they respond to Wall Street metrics (total production being one), and they need revenue to service debt, even if that revenue is gained at a loss. Thus they grew production by increasing initial production in the first 18 months of a well’s life at the risk of less overall recovery. Meanwhile price focussed companies’ production declined (most notably EOG). The two broadly balanced out, so production was flat. If all companies responded to price, production would have collapsed in 2015.
Thus price played little role in the first ramp-up of production, but will play more of a role in preventing a resurgence of shale output if assets change hands from debt ponzis to price responders.
Perhaps no role in 25 months is hyperbolic – how about “no role in the first 13 months, and then a small role in 2015”?
Hi Verwimp,
The monthly HL can be done, but does not always give good results.
For Saudi Arabia the HL for 1973 to 1990 using monthly data gives a URR of 67 Gb, chart below.
Hi Verwimp,
Continuing with Saudi Arabia HLs, the HL above seems that it might be a little low, would you agree? Perhaps it was a little too soon for an accurate result after 216 data points? So let try another period from 1991 to 2007 which results in a URR that is about 3 times higher (2.8 times higher in fact) at 190 Gb,
chart below.
Hi Verwimp,
So a final Saudi Arabia HL using the most recent data from 1993 to 2015 (again this is monthly data, about 260 data points), the URR in this case is about 250 Gb, about 4 times the original URR estimate of 67 Gb (3.7 times in fact). Perhaps your estimate of 2,8 Gb should be multiplied by 3.7 which would give us 10.4 Gb and be in the right ball park? 🙂
Chart below.
I agree completely: KSA oil production did not follow the bell shaped Hubbert curve, so the results of the linearisation of their data are not collinear. Why? Because they purposely slowed back their production during the 1980’s! Because they purposely did not let their production grow during the 1990’s and the 2000’s. Because they decided to leave something for their next generation. Because they are such a big player, they would derail the entire oil economy if they would have let the beast go. You see the same pattern with gas in the Netherlands: they keep production flat and they are making profits for 40 years now. But it’s my impression that this all feels very un-american, isn’t it? To slow down and to keep something for later, when it comes to make money? That’s why the USA has boom and bust cycles so often and so severely. Like Bakken conventional oil (I presume) between 1988 and 1995: very boom and bust. This was an era with stable oil prices (WTI = ~20 USD).
Verwimp – I agree. Any OPEC country, but especially Saudi, is a bad example for H/L predictions. Hubbert predicted as much himself. Any imposed outside constraint such as a price cartel or onerous environmental limits will lead to a flattened peak and a thick tail. The pure logistics curve comes from population growth and decline where the only constraint is access to a finite resource (food) combined with a fixed gestation period. Recent shale developments with free money supply might turn out to be as close to this as the oil industry has ever got – time will tell.
I think the converse of this might also apply. If production is artificially boosted other than by natural resource price signals, e.g. in a command economy requiring high income for cradle to grave welfare programs or military adventures, then production would be accelerated (such as by in-fill drilling programs), the peak would be skewed later and a Seneca collapse might ensue. Again we’ll wait and see, but hopefully not.
Hi Verwimp,
The same analysis applies to the US lower 48 output.
I just don’t have monthly data for the US going back beyond 1994, which is why I chose Saudi Arabia.
The HL does not give a reliable estimate when annual output is 20% or more of cumulative output as was the case every year from 2008 to 2015 for the Bakken/Three Forks. For the US from 1864 to 1870 the annual output divided by cumulative output(aP/Q%) was about 15 to 20% and the HL pointed to 90 million barrels at the time. Since that time the US 48 aP/Q% has been under 20% every year and somewhat reliable HL analyses only occurred when aP/Q% was under 5% for the most recent year of the HL. Example of a US48 HL done too early resulting in a URR estimate too low by a factor of 4.
Hi Verwimp,
North Dakota Bakken/Three Forks HL estimate using annual data, notice aP/Q% is about 25% in 2015. The URR estimate of about 4.5 Gb is too low by a factor of about 2.4.
Hi Verwimp,
The US did have production controls through the RRC up to 1972 where Texas acted as the swing producer for the World to maintain price stability, the output for the US lower 48 output still followed a Hubbert curve to some degree from 1930 to 1972 (the period the RRC controlled Texas output).
Bottom line a Hubbert Linearization is unlikely to give reliable results at this stage and as I have not convinced you by now, only future results might change your mind.
Verwimp: “That’s why the USA has boom and bust cycles so often and so severely.”
It is not just US phenomenon to have boom & bust cycles but in all capitalist monetary systems where there is built in price inflation and there is need for constant “reset” (deflation) of the system you have boom& bust cycles.
Hi all,
An alternative to Bruno Verwimp’s model where the wells added decreases due to low oil prices and then increase when oil prices increase in the future. The URR is consistent with USGS estimates of about 10 Gb for the Bakken Three Forks.
Dennis,
I think that flat output in 2015 and the likely decline in 2016 is mainly due to low prices, not depletion.
Therefore I agree with you that Bakken oil production will rebound and there will be another peak, higher than December 2014
I think it is largely a question of where the assets are held when the dust settles. If it is with the majors or other conservative institutions, the rebound will definitely be slower and probably peak at a lower level than the boom years. If held by venture capital hoping to make a quick buck, we may see a rebound at boom-type speeds, followed by another crash when they (or the greater fools they sell to) run out of credit.
Hi Gwalke,
At the peak 12 month period there were 183 new wells per month completed in the Bakken. I have assumed the completion rate gradually ramps up to 165 new wells per month over a 30 month period and then remains at that level. The infrastructure is already in place, this should not be hard to accomplish.
Note that under the oil price scenario I have assumed the NPV of future cash flow at a 10% real discount rate (13% nominal at 3% inflation) for the average well is $7 million for wells completed July 2017 and peaks at $9.4 million (2015$) in Jan 2020. At that point the number of wells completed levels off at 165 new wells completed per month.
A more realistic model would have the number of new wells gradually decline as the NPV declines to $0.5 million by Oct 2030. The model is by no means perfect.
A modified model is below with new wells completed decreasing after NPV falls under $5.8 million in Dec 2023, NPV falls to $0.5million in Aug 2037 and new wells are no longer completed.
URR is 9 Gb in this scenario, peak is 1180 kb/d in early 2023.
Nice to meet you again, Dennis! I was waiting for you. 🙂 The future will tell who had the best idea. Reality may turn out to be something in between our ideas. At least I understand for the coming year we agree. Down down down. Prices may (and will) rise again. But I do not see another 27k wells being drilled in that North Dakota landscape. Just look at it on Google Maps. There are wells everywhere! Where are the North Dakotans going to drill 27k new wells? The USGS is an important institution, but I believe they overestimate Bakken URR greatly.
Bruno,
According to Lynn Helms, potential number of North Dakota Bakken-Three Forks wells is 60,000.
http://oilpatchdispatch.areavoices.com/2015/08/14/10000-bakken-wells-drilled-50000-to-go-helms-says/
There are currently 10,756 producing unconventional Bakken–Three forks wells. Even including the shut-in wells, the total number of drilled Bakken-TF wells unlikely exceeds 12-13 k.
So the number of potential well locations is still high.
Many of them are outside the sweet spots, but if and when oil prices rebound, a large part of potential B-TF wells may be economically viable.
Potential would surely mean take the area of the source rock and divide by the minimum average well spacing. They can’t know all the petrogeology until they start drilling in new areas.
Hi George,
I agree the 60,000 well number is too high, but I think the range of 40 to 45 thousand North Dakota Bakken/Three Forks wells is reasonable.
Note that I double checked my average well profile for the Bakken/Three Forks and it is 320 kb. So taking round numbers of 80% of 10 Gb (a conservative USGS mean TRR estimate) or 8 Gb and dividing by 0.32 Mb/well we get 25,000 wells.
If we take our 11 Gb TRR estimate, but we assume the EUR gradually decreases when the sweet spots become saturated with wells, then we might use a lower EUR for the average of all wells drilled. Let’s assume EUR is 250 kb on average for all wells drilled and the URR is 11 Gb,
then 11,000 Mb divided by 0.25 Mb/well would be 44,000 wells drilled.
Hi AlexS,
My guess is that 400 to 500 wells have been shut in since drilling started in the Bakken, prior to 2004 the drilling rate was very low, most of the drilling has happened since 2005 and not very many of those newer wells have been abandoned. There were 10,373 wells producing in the Bakken Three/Forks, and my estimate is that about 10,734 wells have been drilled and completed through Dec 2015. So if 38,000 wells are drilled, that leaves 27,000 locations. Note that I have tried to estimate profitability, but well costs could increase less or prices might rise higher than I have assumed, the 60,000 well estimate by Helms may assume a much higher TRR than the USGS mean estimate.
I have assumed a well cost of 8 million which rises gradually to 9.2 million from Dec 2015 to Aug 2020 and then remains at that level in 2015$. This is because more frack stages and proppant will increase well cost over time.
Oil prices rise from $75/b in Jan 2017 to $160/b in Oct 2020 and then remain at that price level until 2050.
Wells become unprofitable to complete in Oct 2030 and the wells completed quickly drop to zero by Feb 2032 (15 month period where 10 fewer wells are completed each month).
Hi Verwimp,
Note that the idea is that of Rune Likvern, though any errors are mine not his. I have taken his Red Queen Model and used the great data which Enno Peters has gathered from the NDIC and very graciously shared with me and many others to develop average well profiles in combination with the number of new wells added each month (it was 79 new wells in December according to Enno Peters data). That is the model, it is an accounting exercise. Assume all wells are “average wells” with an average production profile, determine the number of new wells added each month and add it all up in a spreadsheet. That is the model and it was first presented by Rune Likvern at the Oil Drum in Sept 2012.
See http://www.theoildrum.com/node/9506
I first tried to reproduce Mr. Likvern’s work at my blog at link below.
http://oilpeakclimate.blogspot.com/2012/10/using-dispersive-diffusion-model-for.html
Looking at it now (eighth chart in the post is closest in assumptions to what actually happened to the well profiles from 2012 to 2015) it is amazing how close I came to production in Jan 2016, I was too optimistic about how many new wells would be added, but mostly it was pretty close. About 1225 kb/d predicted in Jan 2016 with about 12,500 wells drilled, there were only 10730 wells drilled through Dec 2015, maybe 10,800 by Jan 2016. Also my well profile had very limited data at that time based on data very graciously shared by Rune Likvern.
Rune Likvern’s original model needs no work, combined with the wonderful data shared by Enno Peters it is the best model we have.
Predicting the future well profiles and the future number of new wells added future will always be difficult.
As the sweet spots run out of room the average well profile for new wells will have a lower EUR.
One wrinkle in my model is I try to guess at when this decrease will start and how rapidly the EUR will decrease. This in turn depends on the rate that new wells are added, more new wells per month implies a faster decrease in new well EUR. There is only so much oil that can be recovered, I have assumed that the USGS TRR is roughly correct.
I meant to show the chart from my Oct 2012 blog post,
this was just reproducing the work of Rune Likvern, though I guessed farther into the future than he did at that time, my guess for the total number of wells added was too high, especially in 2015, my estimate for Jan 2015 was pretty close, but I did not anticipate a crash in oil prices and my guess for the number of new wells added was too aggressive in 2015 (about 2300 new wells, the actual number was about 1450 new wells). In any case it is surprising that this first guess was as close as it was.
Mr. Verwimp, that is one frightening graph you have there. If the production follows the graph for the next six months, people are going to start to really notice.
I do have a question though. If there continues to be completions of wells in the 70’s per month, will that be enough to level the descent, considering the increased initial output due to better or more intensive fracking techniques?
Hi GoneFishing, the graph is just as frightening as it has been ever since I built it 25 months ago, (and published in the comment section on this blog once every three months approximately.) Now it is getting attention, suddenly.
People are already starting to notice in the shale gas fields, they are clearly past peak.
As for your question on how many wells per month are needed to level the descent, I would like to point to the models Dennis Coyne presents here. That is, basically, exactly the exercise he undertakes. As far as I understand, he needs something like 150 wells per month to keep production at the actual level.
You should understand there are some 10.000 wells now, all of them are declining according to the average well profile (this is: huge decline during the first year, more moderate decline later on.) Anyway: I don’t believe 70 fresh gushers a month will compensate for the decline of 10.000 wells. Neither do I believe 70 wells will be added on average during the next months.
Hi Bruno,
My model for each month takes the average well profile, which has not changed for 12 months or so and simply substitutes past guesses at future number of wells with the actual number of new wells completed. That is it. I do tend to change my guess of the future number of wells completed based on new information, such as the current price of oil and future forecasts of oil prices along with well cost and information about capital spending by LTO focused companies.
In scenarios I presented in 2012 I did not foresee the present oil glut and I assumed new wells would continue to be added at 2400 to 2800 new wells per year. For the past 12 months the well completion rate has been about 1450 per year and for the past 3 months the rate has dropped to 908 new wells per year (annualized past 3 months).
Note that for your model to be correct, at least 60 new wells per month will be needed, notice that my model has only 50 new wells per month from Jan 2016 to June 2017, but that output is lower than your model.
For example my model has output at 800 kb/d in Jan 2017, but your model has output at about 840 kb/d, that would require about 60 new wells per month from Jan 2016 to Jan 2017, if my model is correct.
We do agree that 70 new wells per month will not be completed, we could both be wrong, the LTO players stubbornly complete new wells seemingly impervious to low prices.
I keep thinking they will slow down, but they are doing so more slowly than I had anticipated.
Additional buried costs of Unconventional extraction are surfacing. Fracking and production liquids are live costs – how often is liquids disposal cost breaken out for the life of the well?
“Though fracking industry proponents scoff at any intimation their so-called vital industry poses even scant risks to the public, a new study published in Toxicology and Applied Pharmacology just proved those critics right — fracking wastewater causes cancer.
Using human bronchial epithelial cells, which are commonly used to measure the carcinogenesis of toxicants, researchers confirmed fracking flowback water from the Marcellus Shale caused the formation of malignancies.”
http://www.zerohedge.com/news/2016-02-17/heres-new-study-fracking-industry-doesnt-want-you-see
Fracking wastewater causes cancer. CRUDE OIL CAUSES CANCER!!
Really?
http://www.zerohedge.com/news/2016-02-17/if-oil-stays-35-what-energy-company-leverage-will-look
“Citing up-to-date analysis of production data and cash costs from over 10,000 oil fields, Wood Mac said it believes 3.4 million b/d, or less than 4% of global oil supply, is unprofitable at oil prices below $35/b.
Even the majority of US shale and tight oil, which has been under the spotlight due to higher-than-average production costs, only becomes cash negative at Brent prices “well-below” $30/b, according to the study.”
So why are so many producers struggling and/or going broke?
That $30 to $35 mark must be well-head costs of production without overheads?
The present ND price is $16.50 for one thing. The analysis is for operating fields and does not include exploration or new developments, without which oil companies would have a short lifetime.
One also has to consider both Lease Operating Expenses (LOE) and G&A costs (plus debt service).
I think they are only including OPEX or what I call LOE.
As I have mentioned previously, these expenses typically include only the electricity or other power costs to operate the wells, the chemicals used on a regular basis down hole, minor repairs, and direct lease labor. At least that is the way the shale guys report it. Otherwise, why do they always report $4-$8 per BOE in company reports, yet I see much higher than that on the lease operating statements sent to non-operated working interest owners for interests for sale on the auction?
I have my doubts as to whether they are including in OPEX finding and development costs, including the costs to lease the land, permit the well, drill the well, complete the well, equip the well, any subsequent equipment that is capitalized and not expensed, including replacement of tubulars, rods, down hole pumps, etc. over the life of the well, both ordinary work overs such as repair of tubing leaks and replacement of down hole pumps, as well as work overs such as sand pumping, acid, re-perforation, re-fracking, all transportation costs, all general and administrative expenses, all severance, extraction, production, income, ad valorem, etc. taxes, and interest payments on debt.
In the real oilfield, not the one displayed by the shale cos. in their Urban skyscrapers, what is most important is what goes in the checkbook, what goes out of the checkbook and the current balance in the checkbook. Classifying a rod job as CAPEX does not change the fact that a check has to be written within 30 days (apparently 180+ days for shale) to the contract company who pulled the pump.
Due to the skyrocketing of costs in the industry from 2005-2014, I believe this crash is more severe than 1998-1999, despite Brent and WTI oil prices not quite falling to the inflation adjusted lows of that period, as well as the fact the basis spreads are much wider for certain crudes (think Bakken, Western Canadian Select, etc.) than they were in that era.
We are suffering much more than in 1998-1999 for sure, on the very same leases. The combination of cost inflation, reserves that are tougher to produce, and in the case of marginal producers like us, natural decline, makes dropping into the $20s (or below) brutal.
The vast majority of US publicly traded E & P have PDP PV10 reserve values LESS than long term debt at $50 WTI. At least I suspect the 10K will show that in the next 15-45 days as they are released.
Keep in mind we have been hovering around $30 WTI in 2016, after hovering around $40 WTI since last fall. I imagine PDP PV10 is less than half at $30 WTI as opposed to $50 WTI. I further suspect that PUD PV10 in almost non-existent in the US onshore lower 48 fields at $30 WTI.
Remember that reserve based lending standards typically do not allow for a borrowing base in excess of 65% of PDP PV10 (recently PV9 due to historically low interest rates). This includes not only first lien bank debt, but any other types of second lien or junior debt.
Therefore, at $50 WTI, almost all US onshore based E & P DO NOT qualify for reserve based credit with US banks. And we are at $30 and change today.
In reality, any equity value these companies have is purely a bet that the current WTI and HH futures will not hold, but will go substantially higher in the near future (yet this year).
I know I and others have been beating this drum for a long time, but dang it the truth has to be said. Just because 1% of wells in the Sprayberry Wolfcamp play in Midland Co., TX are worth drilling and completing at $30 WTI does negate the fact that the entire industry is in jeopardy without a significant price spike.
I would really like to know how much industry debt to banks is delinquent. I bet there is still a lot of pretending going on by the banks with regard to provisioning energy loan losses.
Make no mistake about it, this has been a price crash of epic proportions.
“I think they are only including OPEX or what I call LOE. ”
Woodmac mentions cash operating costs, not full-cycle costs
Cash operating costs include not only LOE, but also taxes, G&A.
Not sure if they include interest expense.
As regards LTO full cycle costs:
“full life cycle economics require an oil price in the range of $40-$60,” Wood Mackenzie said.
http://www.marketwatch.com/story/oil-output-barely-dented-despite-crudes-plunge-2016-02-05?mod=MW_story_top_stories
AlexS. They may include taxes and interest, but I bet a lot of costs that are necessary to keep the lease producing are put in CAPEX and not included.
For example, I look at a lot of LOS for shale wells.
LOE runs $10-20K routinely per well in the Williston Basin, with newer wells tending to be more costly due to higher produced water disposal costs.
Invariably, however, there will be a monthly LOS with an extraordinary charge, some times in excess of 5 times the routine monthly LOE. Sometimes it is not readily apparent what these charges are for. Sometimes they are routine work overs, pump changes, tubing leaks. In any event, I believe at least some of these costs are being capitalized. Anything permissible to reduce the per BOE cost of LOE in company reports will be taken advantage of, and likely even required by GAAP, and reported differently for income tax purposes.
It appears ND is granting operators the ability to idle wells producing 40 bopd or less for up to 24 months.
Based on Enno Peters shale profile website, it is apparent many wells fall below 40 bopd within 60 months of first production. I suspect most wells under 40 gross bopd in the Williston Basin cost $25 per BOE+ to keep online. Given the differential to WTI in that basin, I suspect they generally are in the negative at current prices.
Regardless, if a 3-4 million bopd cut were announced by Russia and OPEC, I suspect prices would rally significantly. So even if Wood Mac is including all the necessary expenses to keep production online, 3-4 million bopd underwater is a big deal.
shallow sand,
Based on 3Q reports by some large shale players, their cash opex is well within $30/boe. Some of the costs you have mentioned may be capitalized.
But in any case, if the current wellhead price in the Bakken is $16.5, they are all in the red (ex hedges)
“if a 3-4 million bopd cut were announced by Russia and OPEC”
Don’t count on this. There will be not cuts
AlexS. I agree there will not be 3-4 million bopd of cuts. There may not be any cuts. However, Russia, GCC, Iran and Iraq are talking and trying to come up with something. They are not able to withstand $30 oil for years on end, $30 is painful now. As I stated, they saw traders pushing to the teens, and this step is an attempt to at least stop that.
In any event, 3-4 million bopd underwater cannot go on indefinitely. My point is at least some of that 3-4 million bopd will come offline and/or shrink via natural decline. Because adding new wells requires more than $35 bopd in many places, likely most places, what is coming offline wont be replaced until prices rise.
I think you have indicated you see prices slowly rising, so I think even you agree that $30-35 wont be a multi year price.
My comments are directed to the way the US industry reports expenses. Go to websites where working interests are for sale. Invariably there will be an economic summary that will have an “*excludes non-recurring costs” statement. Then look at the non-recurring costs, hidden in the data package. To me, non-recurring costs are the costs for a new well, or the costs to increase production from an existing well, such as opening a new zone, re-stimulating and existing zone, etc. Non-recurring costs should not include routine down hole and surface repairs. However, US companies routinely categorize them as such.
My comments on costs are very US centric. US onshore is really the only thing I have knowledge of. I apologize if it looks like I think the US is the whole world, which I know it is not.
US companies have to impress Wall Street. I have reviewed Russian company reports at your suggestion. It is noteworthy they are more fact, and less fluff. Not many “pretty” optics or financial measures like IRR, EBITAX, CAGR, etc. You should read some US company conference call transcripts. The US companies have to impress people who, IMO, do not seem to understand the important things, but have learned to speak the jargon. Fortunately the SEC requires 10-K and 10-Q reports. Lots of good information there.
Look at the company statements about CAPEX spend. It is not all to increase production. Facility improvements are usually listed. I wonder what all is included in that category.
Another of my broken record points is new, flowing wells under one year old have very low OPEX and therefore I predict OPEX will rise quickly as there are less new wells added proportionately to the total.
I am just reporting anecdotal reviews of lease operating statements in US shale plays. I agree, likely the lesser wells are usually the ones that are for sale.
On a worldwide basis, it would be neat to have access to a database which categorizes production by age. For example, of the world’s 78 million bopd, 7% comes from wells completed prior to 1980, 18% 1980-1990, etc. (Number I made up).
Although we are hyper focused on the short term, due to being in survival mode, the recent chart you referenced on CAPEX spend US and world wide is crucial. We really haven’t seen a huge increase in production worldwide despite the large CAPEX spending increase.
Assuming we survive this, we are in it for the long haul (decades health willing). If worldwide demand continues at 1 million bopd increases year over year, the price must necessarily rise, cut or no cut.
I still think US LTO needs $80 or higher to be a viable business and $100+ will be needed to add 1 million bopd per year, akin to 2011-2014.
I think that Qatar is the poster child for post-2005 crude oil versus Crude + Condensate (C+C) production.
OPEC 12 data show that Qatar’s reported crude oil production, despite billions of dollars spent on enhanced oil recovery, fell from 0.8 million bpd in 2005 to 0.7 million bpd in 2014 (OPEC crude only data), while EIA data show that Qatar’s C+C production increased from 1.0 million bpd in 2005 to 1.5 million bpd in 2014.
Production of condensates rising in Qatar http://www.oxfordbusinessgroup.com/analysis/production-condensates-rising-qatar
Thus my characterization of the global oversupply as a house of cards built on an unstable supply of actual global crude oil production that requires vast capital expenditures in order to keep crude oil production from crashing.
Mr. Brown – this is a minor point in the great scheme of things but I find it annoying I can’t get the answer. Do you know how Qatar (or ‘other sources’) report liquids from their GTL plants (Oryx and Pearl). There are condensate and NGLs that come with the gas feed but then there are diesel and lighter liquids that are made from the gas in the GTL process. Do these get counted as gas, liquids, both or neither? The total adds up to at least 200,000 bpd which is a significant portion of Qatar’s output.
I would assume, but I don’t know for sure, that GTL products would be counted in the EIA’s total petroleum liquids + other liquids category.
The EIA and IEA report GTL as “other liquids”.
It is counted as other liquids.
Qatar
Qatar was the world’s fourth-largest dry natural gas producer in 2013 (behind the United States, Russia, and Iran), and it has been the world’s leading liquefied natural gas (LNG) exporter since 2006, with 31% of market share in 2014.2 Qatar is also at the forefront of gas-to-liquids (GTL) production, and the country is home to the world’s largest GTL facility. The growth in Qatar’s natural gas production, particularly since 2000, has also increased Qatar’s total liquids production, as lease condensates, natural gas plant liquids, and other petroleum liquids are a significant (and valuable) byproduct of natural gas production.
Shallow sand,
“My comments on costs are very US centric. US onshore is really the only thing I have knowledge of. I apologize if it looks like I think the US is the whole world, which I know it is not. ”
I appreciate very much your comments, as they help to understand the real picture in the US onshore oil industry. The US is not the whole world, but the US LTO is a very important part of the global oil.
In the past 3-4 years I was also paying primary attention to shale players, and I came to conclusion that their financials, not just their resource base, are very “unconventional”.
“Russia, GCC, Iran and Iraq are talking and trying to come up with something. They are not able to withstand $30 oil for years on end, $30 is painful now. As I stated, they saw traders pushing to the teens, and this step is an attempt to at least stop that.”
I agree. Oil exporters are trying to change the sentiment in the market and to neutralize the attempts of speculators to push oil prices below $20.
“I think you have indicated you see prices slowly rising, so I think even you agree that $30-35 wont be a multi year price.”
$30-35 is obviously unsustainable. The market will gradually re-balance itself. I expect a $40-50 range by the end of the year. It seems that investment banks’ analysts are also projecting a gradual oil price rebound.
WTI oil price consensus as compiled by Bloomberg vs. forward curve
Hi Shallow Sand,
I always appreciate your analysis. Thanks.
If the price forecast in AlexS’s chart is correct how would that affect onshore conventional production in the US?
I would think there might be some temporary abandonment and deferred maintenance and I imagine there would be some decline in LTO output as well. What would your guess be as to how much US L48 output would decline if the oil price forecast above for 2016 is correct (looks like about $41/b for the 2016 average price.)
Dennis. Thanks. So many moving parts. However, I did post awhile ago about the decline in lower 48 US conventional production from 12/14 to 6/15.
As I recall, that decline annualized was about 14%. A drop of around 200K bopd, from 2.6 million to
2.4 million, roughly speaking from memory.
There are about 50 land rigs drilling for conventional oil in the lower 48. That is significantly lower than the 1999 oil rig trough per EIA data.
Further, I tend to doubt there is a frac log of vertical oil wells. I assume the drilling cost is still higher than the completion cost for most conventional wells, or at least a much greater percentage of the cost.
Conventional onshore lower 48 production is fading away, and it appears maybe Gulf of Mexico oil production is headed there too.
US future production growth is strictly LTO it appears. All you have to do is read the public comoany reports The big players are divesting overseas, stoping offshore CAPEX and pinning hopes on US LTO (and Canadian tar sands). Only exception are the largest (XOM, CVX) who are still actively pursuing Middle Eastern and Russian oil, to the extent they can politically and securely. If Kurdistan’s and Rumalia’s geology was located in North Dakota, they would stay away from the middle east for sure.
As I think long term $80-$100+ is required over all the LTO Basins, I do not think you are off in thinking we will again see those prices. However, increasing OPEC supply and/or decreasing worldwide demand is tough to gauge. It is all in the timing.
US onshore lower 48 conventional will likely fall to near 2 million bopd before the end of 2016 with an average price of $41 WTI in my opinion. So maybe 500K drop from 12/14-12/16 is my guess on lower 48 vertical onshore wells.
From what I understand CO2 EOR project expansion is completely dead. Just operating what is in place. Look at Denbury resources stock, they are a big EOR company California Resources is a big steam-flood company and their stock is also almost to $0
If MBP is reading he could give us better insight on the state of CO2 EOR, I am sure.
Just opinions, take with grain of salt.
Hi Shallow sands,
Thanks. Your opinions are worth 1000 times mine because you actually know how oil is produced, I do not.
On this I am sure all would agree.
“The vast majority of US publicly traded E & P have PDP PV10 reserve values LESS than long term debt at $50 WTI.”
SS,
It is no different in District XI aka Canada 🙂
And how many loans are created in consumer/real estate economy based on oil being $100 where was incentive to provide enough liquids at that price for our endless car circling that we call GDP. That debt is no different than E&P debt and will be crashing down at same time.
Shallow,
I am not going to mention any names publically but I know of one operator based in Midland in the Wolfcamp & Bone Spring plays whose bankers are making him liquidate his acreage position. They loaned the operator $300 million for acreage and it is doubtful in my mind that they will recoup 1/2 of the cost.
Also, a lot af acreage is probably going to be surrendered this year in the Permian.
John S. I’ll give you an example of 2016 expiring acreage. Noble Energy bought Rosetta. A large chunk of acreage acquired appears to be in Gaines Co. 30,000 gross acres, 19,000 net acres. One productive Wolfcamp hz well, 41K cumulative oil, currently 25 bopd gross, gas being flared. 2 other wells drilled, never completed, to be plugged. 1/4 royalty burden.
I assume they wont get $1 million for this package? What do you estimate that acreage cost them?
Once again, why break even is so hard to quantify. Also, once again why I am skeptical of the Permian hype that things work below $80.
Gaines is one of the highest oil producing counties in the US? But apparently not so hot on the resource plays. The acreage is somewhat checker boarded, and appears to cover the whole county, except for where the big legacy units are located.
I bet I have seen 200K gross acres for sale in the Permian in the last 3-4 months. Most either had zero strong wells, or had a small number of strong wells and many weak ones.
Once again, anecdotal. I think hz Permian has a story to be told by an objective person.
“…I would really like to know how much industry debt to banks is delinquent…”
Shallow,
no body knows for sure (for various reasons), but best figures at the end of Q4 2015 were in the $180-$200 billion range.
According to Deloitte (by far the leader in auditing this thing worldwide), 35% of publicly traded oil and gas exploration and production companies around the world (about 175 firms) are at high risk of falling into bankruptcy.
For 50 of them that outcome is “…highly probable…” in 2016.
Companies range from small to multi billion dollar ones.
http://www.cnbc.com/2016/02/16/35-of-drillers-at-high-risk-of-bankruptcy-report.html
Be well,
Petro
Reminder, it’s not all banks. It may not be even mostly banks.
The high yield bond market is awash in sub investment grade issuance sold to the public. And not necessarily sold to the public by the oil companies. Big Wall Street names bought it, and then sold it to the public when danger appeared.
If you really want to track down a systemic risk, have a look at swap positions of the banks that could not foist that paper elsewhere.
…my comment got lost…in the mail..
Be well,
Petro
Watcher,
I understand your point.
However, I work in this business and you give the “big guys” far more credit than they “deserve”…
-NONE of them predicted the rout in oil will last this long, NONE!
So, while they repackaged and sold some of the high yield crap to the public, they still have plenty of it left on their books.
-And you got this backwards:
It was not the oil companies that started this. It was the big guys who (with giant bags of “funny money” – read: TARP…QE99 – borrowed for next to nothing from the FED) “convinced” CHK , Devon and al., to issue high yield debt, for (according to them) since it was backed by “real assets which will makeAmerica energy independent” – it was safe.
Then, they had their lackeys (i.e. Moodys, S&P, etc) stamp a “AAA” rating on them and off we went…
Now…this was 2009-2014…
Fast forward to today: that “AAA” has turned into a C-
Most importantly, what you fail to comprehend is that – even if you are correct and the big guys sold all the crap already – things like: OTC derivatives, CDS and big Pension Funds owning this crap directly or indirectly – make your point a nuisance….
When this sucker goes down (to paraphrase one of our brilliant recent leaders: GWBush), there will be no paid Hitlery speeches good enough to saveGoldman (and all of us for that matter!)…not this time!
Be well,
Petro
Petro: ” NONE of them predicted the rout in oil will last this long, NONE!”
Because it does not depend on them (Big guys) how long the rout will last. They did their part in setting up the rout for sure and maybe extending a rout little bit longer buy extending shale credit lines last October. But Saudis are not playing the ball, yet. Wl Street guys need help from the Russians. When Russians clear Saudi proxy in Syria then Saudis are going to cut. Could be by summer. I really hope.
-Prediction is not dependence.
Your comment has very little to do with what I wrote to Watcher.
Be well,
Petro
Wells in the Williston Basin that produce 40 barrels per day and less are going to be shut. I think it is about a tausend of them, if they have been shut already, it would explain the 29,000 bpd drop. Shut wells will result in an increase of daily production per well.
When the price of oil increases, the wells will recommence pumping.
Thank you, Ron, for this update. Assuming Bakken decline follows Bruno Verwimp’s predicted curve we are going to see an increase in the rate of fall over coming months. Noting that the model is Hubbert, seasonally adjusted, implies that it is price insensitive; we shall see.
This will focus minds on the reality of the Red Queen and, to use another fairy tale analogy, demonstrate that the Emperor has few clothes.
It will focus nothing.
If you have to have it, you do whatever you must to get it. Discussion of Red Queen doesn’t make oil flow and oil flowing is all that matters.
Watcher,
Discussion of Red Queen doesn’t make oil flow.
True, true. But I am enjoying ND following Verwimps’s curve and intrigued to see if and when any deviation comes about. If the Bakken shale as a whole can be described as one Hubbert area then the model limits production regardless of effort, within sane bounds. And even then, excess short term production will just get pulled down to trend later on, and vice-versa.
What this is suggesting to me is that Mr Verwimp’s 2.8Gb URR estimate is much nearer the true figure than USGS’s ca. 10Gb.
Hi Jonathan.
If one believes the oil price has no effect on oil producers, then Verwimp’s model would be correct. Time will answer this question, but on the face of it does it not seem that a fall in oil prices by a factor of 3 would have some effect on producers?
Dennis,
Of course, yes. But as people here have come to notice over the past year, LTO production has remained stubbornly high in the face of seemingly atrocious economics – this may yet change.
The question I am asking myself is this: If the Bakken can indeed be viewed in isolation for the purposes of Verwimp’s model, then is it also a valid example and test of the model?
High oil price post 2009 brought about adoption of fraccing and thereby opened up new areas, that had no prior production from the shale zone. So we’re looking at a good candidate for a Hubbert depletion curve. There are few constraints at the start from finance – it’s there by the shedload. And the area as a whole can be focused on, as its scale is on a par with drilling resources.
So production from the start was in keeping with that expected when opening up a new play. Verwimp applied his model and by fitting the numbers came up with his Hubbert URR estimate as the curve developed and the rate of production increase started to level off. He tacitly assumes that the play will behave in a predictable manner, with bbl/d being determined by a URR.
Deviation from the Hubbert curve can of course be brought about by man-made factors. Folks can drill/frac more or less as time goes by – effect of price – but this just causes an offset from the forecast and tends to push future output back onto trend. Or so the story goes.
My understanding, therefore, is that what comes next at any time is in part determined by what has gone before. Or to put it another way, if one were hypothetically to turn up in the Bakken today with no prior knowledge that any production had already come to pass, then you would find that your production could be correlated to a new curve indicating a URR that would be equal to Verwimp’s 2.8Gb, less production to date.
The reasons have been extensively discussed as to why Hubbert works, at least in some circumstances. I agree that the current low price may have the effect of pushing output off and below trend, but what I really question in this case is that there will be a future surge as in the graphs in earlier comments, thus indicating a greater URR than presently determined.
And of course, it’s when, not if, that the production from new wells can no longer offset the declines from existing wells, which is what happens at a production peak–whether it be a field, a play, a country or the world.
And therefore, the higher the production level, the closer one is to a production decline–from a field, a play, a country and the world.
Hi Jonathan,
The Hubbert Linearization technique does not work until annual output divided by cumulative output is under 5% and even then the results are not very good until it gets to about 3% or less.
For 2015 annual output in the Bakken/Three Forks was 408 Mb and cumulative output was 1638 Mb or 24.9%, a hubbert linearization for 2009 to 2015 results in about 4.5 Gb, but this is still much too low.
Proved reserves plus cumulative production was 6.7 Gb at the end of 2014. There would be about a 90% probability that the URR will be higher than 6.7 Gb and at least a 50% probability that the URR will be more than 9.5 Gb, assuming 2P reserves are at least 1.5 times proved reserves.
WTF!!
I read an article on Bloomberg a couple of days ago, saying that if oil gets to $50/bbl, that the US oil companies will sell forward contracts and flood the market with oil.
I hope that Ron comments on this. But, I see some problems. The first problem is that the average oil company has PROVED [with $100’s billion of write-offs and worthless junk bonds] that they cannot make a profit at $49 oil [2015 PV-10].
The second problem is: Suppose, at $50 oil, a company could sell forward 2 years of production at $55. They cannot. Why not? Because they have no collateral. All of their assets are pledged to existing loans. Why do they need collateral? Because, what if the price rises – to let’s say to $85. In that hypothetical, they need $30/bbl of margin CASH. I believe that Ron will confirm that you HAVE to make margin calls within 24 hours or your position is sold out.
Well, how did companies like Chesapeake Energy do it. Well, at the time [several years ago], they had enough reserves that were not pledged on any loans, even though they were highly leveraged. So they pledged that collateral to, like Goldman Sachs, to cover any margin calls. So GS would put up the margin calls, if needed.
Today is different. Most to these companies do not have any unpledged collateral. So, it is a catch 22. They will not be able to sell forward contracts.
Something tells me that Wall Streets hunger for oil investments may be diminishing.
SVO,
There’s an article at Downstream Today about hedge funds applying to buy oil assets, including infrastructure, in North Dakota. It seems that there’s a lot of money looking to move in, and Lynn Helms is quoted at some length as being not at all happy about it.
He says that the ND government is looking hard not only at data on the companies applying but on the top personnel as well. His big worry is that (surprise) there’ll be no expertise available for utilizing what outside money might buy.
Whatever hands on , day to day operational expertise exists today will still exist a year from now. The guys who have it aren’t going to die or retire THAT fast, and there are not that many opportunities for them elsewhere.
If the current low price persists for two or three years, there really will be a lot of people retiring, and a good many others will have been doing something else, elsewhere, long enough to have gotten established in their new life, and that bunch will not come back.
Syn. Take a look at shale profile website. Resource Energy Can Am LLC. PE that bought American Eagle assets out of BK. Steep decline.
Note American Eagle had been reporting LOE of around $25. So although they bought assets that cost north of $200 million to develop for $36.5 million, they are surely cash flow negative unless they are well hedged. They closed in November, so likely not well hedged.
shallow sand,
I’m just passing along the reference. My interpretation of it is that Lynn Helms is looking at large amounts of money knocking at ND’s door, money that, in oil-patch terms, is naive and ignorant. Helms doesn’t want that money let loose to charge around the state.
In his shoes, neither would I.
Syn. I agree with you and I think you are making a great point in passing along Helm’s concerns.
ND is looking at going from large independent oil companies operating the majority of Bakken wells, to small PE type companies operating a much higher percentage.
The PE companies will no doubt employ competent people to manage the properties, but the decisions will still come from the top, and short term financial issues will be much more of a decision making driver.
I also think Helm’s is concerned about this development because it may be showing that the Bakken is not quite as “world class” as he hopes.
The example of the field we operate in should give you an idea of what I am referring to.
Our field was discovered over 100 years ago, by wildcatters. As the field was delineated, major companies came in and bought out the wildcatters, who took the $$ and moved on to discover other fields.
The major companies operated in our field from over 100 years ago, until the 1990’s, when, after 5+ years of low oil prices, the majors liquidated their lower 48 onshore holdings, en masse, to small companies, like us, and others.
So, in our field’s case, the major companies operated here for around 80 or so years before deciding the field was too played out.
The Bakken started in 2007-08, at least as far as more than a few initial wells in 2003-2006. We are just to 2016, and divestures are already occurring.
People keep thinking the majors will come in and buyout the “wildcatters” in the Bakken and other shale plays. It just really has not happened. Debt is a reason why. However, I also think the majors do not see a 10+ year investment horizon on these shale plays. It looks like EOG and Whiting have already drilled up their best acreage. Take a look at Enno Peters’ shaleprofile.com. with regard to EOG and Whiting.
I assume Mr. Helms isn’t so happy about these developments.
Great point Clueless!
Maybe Bloomberg thinks Wall Street can float more unsecured paper to the yield starved masses so companies can lock in mythical break even.
Totally agree. You cannot expect them to turn it on like they did in the boom years – who is going to pay for it?
In theory they could if let’s say oil reach $60. The same how housing was re-inflated from 2008. But there are always consequences. In 2008 there was choice: to save banks or real productive economy. It was the banks that were saved and real, productive economy is in worst shape then in 2008. So in theory you could re-inflate and create mini boom if the price is north of $60. But to what extent? That would be like financially bankrupting terminally ill patient through “modern” health care practice. But it happens every day.
I agree in principle, but I think there are important differences between shale and housing.
1. Banks have massively more political clout than shale operators.
2. You lose elections if, having convinced everyone that homeownership is necessary/a good way to get rich quick, house prices then crash on your watch. Jobs are lost with shale, but in most places people will not be able to directly link their hardship to it.
3. Banks were already bailed out once, and if you make them whole on their shale losses, this may also be politically expensive.
The the nine hundred forty five wells awaiting completion is in ND is probably an accurate number, plus or minus maybe a couple of dozen, depending on how up to date the data is.
I read somewhere a couple of days ago that there are about four thousand wells awaiting completion, in total, in the USA.
Is this a realistic estimate?
“Is this a realistic estimate?”
Yes
source: Rystad Energy
When an LTO well is drilled does it give a reasonable indication of how good it will be or does that only become apparent after completion. If the first do the companies schedule completions accordingly, and therefore the bad wells would be pushed to the back and their completion may depend on certain price thresholds to make money (i.e. some might never be completed in the present or near future price environment).
The reduction in DUC in Bakken appears to be accelerating but only slightly, so the completion crews are being cut along with the drilling rigs. Anyone know how the fracking is contracted, e.g. long or short term, by company or area etc. and how easy it would be to ramp up again.
Driving up 101 today from Pismo Beach, passed the San Ardo oil field. Shiny new rigs were pumping, lots of activity it seemed. Surprised me — figured the whole operation would be in mothballs at today’s prices.
Maybe a “price” measured in printed pieces of paper doesn’t matter. Maybe the price measured in anything doesn’t matter if you HAVE to HAVE it.
Thanks Ron,
I also updated my interactive presentation on the Bakken, here.
Enno,
Many thanks again! Great site!
One question.
You say that the number of new producing wells in Nov was 77 and in Dec 78.
This is more or less in line with the number of well completions according to the Director’s Cut
(77 in November and 76 in December).
The number of wells spudded in December was 88. Is that a trend, that the number of spudded and drilled wells is bigger than well completions?
I’m asking that because Rystad Energy shows that the number of DUCs in the Bakken is declining.
Thanks Alex,
My widest measure of the DUCs (spudded & not producing wells) in ND has not changed much from Oct to Dec (around 1050). I can’t tell yet for Jan, as I don’t know the number of newly producing wells yet.
With rigs dropping as fast as they are, and with prices where they are, I expect both drilling and completion to drop significantly these months. So I expect no significant net change until say March. After that, I expect it makes much more sense to complete existing wells, instead of getting rigs back on the field to drill more wells. So it would quite surprise me if DUCs would show an increase from here onwards.
Thanks Enno,
I agree that it makes sense to complete the DUCs, especially as long-term drilling contracts have expired.
I was actually thinking that relative stability of the Bakken oil production in 2015, despite sharply reduced rig count, was due to the reduction in fracklog.
Anyway, it seems that companies, including Continental, are planning to further reduce their rigs in the Bakken.
Alex,
“I was actually thinking that relative stability of the Bakken oil production in 2015, despite sharply reduced rig count, was due to the reduction in fracklog.”
I think the biggest reason that Bakken production held up well in 2015 was that drilling & completion help up rather well especially early in the year. Wells haven’t really improved.
In 2014 each month on average 184 wells started production, in 2015 this was still 121 (vs 109 spudded). So indeed, there was about a 10% reduction in the spudded & uncompleted wells. I think it took some time before operators realized that prices would be “lower for longer”.
Last month (January) just had 60 oil wells spudded, and the rig count has kept dropping. Helms expects it to drop to below 30 by mid year, but he has been relatively optimistic before (I guess because operators are not very open about their plans).
Ron,
thanks for the update.
Be well,
Petro
There was a story on CNBC about reduced Bakken crude by rail deliveries to east coast refineries being a symptom of low prices and relatively high rail costs. I thought it was likely just a sign of reduced production in the Bakken. Then I saw this thread…LOL.
Is winter coming back to Europe?
Despite virtually unnoticed from the media, winter is coming back to Europe. In January there has been a huge cold wave mainly in Poland and East Gemany.
http://www.chicagotribune.com/news/nationworld/ct-poland-cold-weather-deaths-20160104-story.htm
Even Britain – mainly in the North experiences wintry conditions:
http://www.telegraph.co.uk/news/weather/12162400/UK-weather-Thursday-ice-and-snow-trigger-commuter-travel-warnings.html
and now we get another wave in Saxony:
http://www.bild.de/video/clip/schneefall/wetter-b95-27444670.bild.html
In addition there is massive snowcover in Alp glaciers of up to 4 m.
As this may be just an outlier, it is one of the strongest winter over the last years and may provide some relief to the fears of a climate catastrophe.
El Nino effect?
Eustace,
Maybe it is the post El Nino effect. It would be interesting to understand what is behind this pattern.
In my view there are many reasons possible for climate change, which has been even a major driver for evolution in the World.
There is a research group which claims that we experience a mini ice age every 200 years, which has nothing to do with CO2. Even the recent history has been influenced by this and many immigration waves and revolutions may have been occurred by mini ice ages climate change.
The reason can be the instable earth axis and the fluctuating path of earth around the sun.
Do you have more information about the background of climate change?
Heinrich Leopold,
That must be the 210 years de Vries solar cycle. The reason is the solar variability. It is divided in two halves and acts on top of a 1000 years cycle, so the big coolings take place on the lows of that 1000 years cycle.
Solar variability influence on climate is highly controversial. There are literally hundreds of scientific articles on the issue and more published every month, yet the mechanism is unknown and so it is not generally accepted.
Some scientists defend that we are approaching a grand solar minimum for 2030-50. I do not think so. I think it would be a minimum similar to the one around 1900. We might see some cooling, but not a lot.
Javier,
Very interesting. I have heard something about the Maunder minimum.
Is this the time of the ice fairs in London? Hendel gave also some concerts in icy conditions, which would be unthinkable today. The French revolution in1789 correlates also with a temperature minimum.
During Maunder minimum the river Elbe was frozen during the summer. The temperature swings during this time have been also one reason for the huge witch hunting – some claim.
Do you have a good source which describes the climate history? I have read just one book and a few articles about this and would like to know more.
The more I read about European climate history, the more I am convinced that the latest 30 years have been extremely stable conditions. However some articles claim that we get another Maunder min.imum in 2042 +/-11
Yes Heinrich Leopold,
The Little Ice Age (LIA) is the coldest period within the Holocene during the past 11,000 years. In a wide sense it started around 1250, after the Medieval Warm Period, but was not uniformly cold, there were warmer periods within the LIA and very warm years, but the coldest winters also took place and glaciers reached their maximum Holocene extension.
It contains a succession of grand solar minima, starting with the Wolf minimum between 1250 and 1350, the Spører minimum between 1420 and 1550, the Maunder minimum between 1640 and 1720, and the Dalton minimum between 1780 and 1825. Such a clustering of grand solar minima is quite unusual and takes place only about every 2500 years. Next LIA should take place in about 2000 years and should be even colder. Perhaps a glacial inception event.
The coldest period appears to have been during the 17th century, which was a terrible time for most of the world. It as been named The General Crisis.
Crop failure was common and led to some terrible famines. During 1695-1696 one third of the population of Finland died of hunger, imagine that today. The ill years of 1696-1699 in Scotland saw the dead of 15% of the population and contributed to the decision to join Great Britain a few years later. Modern agriculture was developed at that time in the Low Countries and perfected in Great Britain as a response to bad climate conditions, with the introduction of the four rotation system, the introduction of turnip as an animal feed in winter so animals did not have to be sacrificed, and the Chinese plough introduced by the Dutch.
This is what we talk about when we talk about pre-industrial climate.
If you are interested in this time you can check:
Global Crisis, war, climate change & catastrophe in the seventeenth century by Geoffrey Parker. You can read some pages at Google in the link.
Current global warming starts at the end of LIA around 1825 and continues to this day, and is the best thing that could happen to humanity after such hardship. We are truly living a climate optimum, specially for people at mid-high latitudes. We have lost perspective because every generation forgets what the previous ones learned. Climate is always changing and cooling has always brought misery to humanity.
I do not know of any general climate history up to date, and there is a lot of revisionism as of late to support the CO2 narrative. For example, most people don’t know that for the past 6000 years CO2 was increasing while temperatures were decreasing.
My personal opinion is that we are reaching Peak Warmth in the 21st century but conditions should continue being good for 100 to 300 years more, barring some really big volcanic eruption. Climate alarmism is as bad on the side of warming as on the side of cooling.
I would add to Javiers summary, that the past 10,000 yrs have been a relatively warm and stable period of global temperatures, compared to the hundreds of thousands of preceding years (as best we can estimate from indirect indicators of temperature).
This short period of general stability just so happened to coincide with mankinds shift towards permanent settlements, agriculture and population explosion.
We would be correct to consider this past 10,000 or so years to be a warm and mild aberration.
Massive gyrations in temperatures on a global scale should be considered typical, and shifts towards or away from ice ages have happened more quickly than most of us would guess.
https://en.wikipedia.org/wiki/Temperature_record#/media/File:EPICA_temperature_plot.svg
Javier
The estimate from Indermuèhle (1999), ‘Holocene carbon-cycle dynamics based on CO2 trapped in ice at Taylor Dome, Antarctica’ suggests a rise of about 20ppm gradually from a Holocene low 7ky ago. This compares with the industrial period rise of 120ppm. Calculations and interpretation of the earlier 20ppm rise are in the paper.
This later paper, Ahn, Brook, et al (2012), ‘Atmospheric CO2 over the last 1000 years: A high-resolution record from the West Antarctic Ice Sheet (WAIS) Divide ice core’ has a very nice Figure 2 showing CO2: plateau at around 280ppm with a bit of a dip by a few ppm 1600 to 1700AD, then does hockey stick in industrial times toward our present 400ppm.
best
Phil
Yes Phil, thank you.
The Holocene increase in CO2 between 6800 yrs ago and about 1300 AD is of 25 ppm according to E. Monin et al., 2004 (258 – 283 ppm). Which has to be compared with the increase of 75 ppm from the Last Glacial Maximum to the Holocene, so it is about one third of that. We think we know why the CO2 increased during the Holocene, although proponents of the Ruddiman hypothesis disagree.
What we do not know is why with CO2 rising temperatures were dropping, and current models cannot explain it. This is called the Holocene temperature conundrum (Liu et al., 2014).
Mr. Leopold – one year’s worth of data counts as weather not climate. Climate models are only just reaching the level of spatial gradation where they can look in detail at effects on land areas the size of the Alps so I’m sure they are a long way from predicting future ski conditions years in advance, assuming that will ever be possible.
A warming climate would lead to more precipitation because of increased moisture held in the atmosphere, but whether it comes down as snow or rain would be very dependent on local conditions. Also warming tends to lead to more extreme rain events (floods) with longer recharge periods (droughts) but whether this applies to snow as well, which occurs in a lower energy environment than rain, I have no clue.
Heatwaves and Coldwaves are just manifestations of weather, not climate. It is really not helpful to argue about climate change every time the weather changes.
What most people don’t understand is that many of the extreme weather phenomena is a manifestation of the latitudinal thermal gradient, the difference in temperature between the equator and the poles. And in a warming planet the latitudinal thermal gradient diminish, as the poles warm more than the equator, thus reducing the frequency of extreme weather phenomena.
Bull*!
I worked as a nature conservatist until just recently, and spend much time outdoors every day. Winters up till the one 2013/14 were cold in north Europe, but then came the 14/15 winter. I used my winter gloves 2 days the whole winter. This winter was colder than the last, but nowhere near the winters up to and including 13/14. The latest 2 weeks have been colder than the rest of the winter this year, (although still weaker than previous winters). But that to is no surprise:
WINTERS ARE ALWAYS COLDEST IN FEBRUARY.
If this is enough for you to think climate change is no longer a worry, then you don’t worry enough. We had 2 or 3 weeks of slightly colder than the rest of the otherways warm winter. Global warming is over? Right.
After recording its warmest year on record in 2015, Earth continued its record-warm streak into 2016, with January 2016 being the planet’s warmest January since record keeping began in 1880, said NOAA’s National Centers for Environmental Information (NCEI) on Wednesday
http://www.wunderground.com/blog/JeffMasters/earth-rings-in-2016-with-its-warmest-january-on-record?utm_content=buffer28293&utm_medium=social&utm_source=twitter.com&utm_campaign=buffer
Share dilution is the only game in town now. Devon just issued 69 million shares with underwriters’ option to take up an additional 10 million.
The company did it after cutting capex by 75% down to $1 billion, cutting the dividend by 75%, cutting workforce by 20%, and decreasing opex and g&a by $800 million.
I’m waiting for another Bloomberg article to tell us how American ingenuity is saving shale producers and lowering breakevens. I am also looking forward to seeing Harold Hamm come on CNBC and tell us about all the money that OPEC/Saudi Arabia is losing by producing oil in current quantities.
It seems like the Permian focused companies are the ones able to do this, for the most part.
It is the toughest LTO area to analyze from the outside, so the hype machine has latched onto it.
I really hope Enno Peters figures out a way to put the Permian and EFS on shale profile.
I see Energen is going to issue shares. Energen was a natural gas utility who invested in gas wells in New Mexico. Then they got into the Permian. The company stock performance has been very strong over the years. I think the diversification of stable utility earnings was a big plus.
Then they “got smart” and liquidated the utility for around $1.6 billion and dumped the entire amount into Permian Basin LTO. I read their conference call. They are looking to sell off around $1/2 billion of upstream assets this year and are diluting the existing shareholders. Will be interesting to see debt to PV10.
EGN sold the gas utility to The Laclede group in 2014.
The two year chart shows The Laclede group stock is up 44.62% and Energen stock is down 69.01%.
Many smart people got sucked into this LTO boondoggle.
http://dotearth.blogs.nytimes.com/2016/02/15/oxfords-halley-professor-on-how-the-climate-challenge-could-derail-humanitys-destiny/
Says we are doomed unless we get off FF’s now. Is he right? I think so.
So, given that, how come I and all people of like mind (many) shouldn’t consider you oil proboscideans here present enemies of the people worthy of the most severe reprehension?
wimbi. Lay out your vision of what happens if, by year end, ff use ceases throughout the world.
Then things might start to get really interesting…
http://www.theecologist.org/News/news_round_up/2758982/belgian_nuclear_reactors_riddled_with_16000_unexplained_cracks.html
The discovery of over 16,000 cracks in two Belgian reactor vessels may have global implications for nuclear safety, says the country’s nuclear safety chief. He and independent experts are calling for the immediate checks of nuclear reactor vessels worldwide.
If we do not transition to a civilization powered by 100% renewables in the very near future then there simply will be no future for humanity. Anyone who is cognizant of this reality and isn’t working toward that goal is public enemy #1, no if s ands or buts about it! To be very clear that means no more fossil fuel powered electrical energy production and no more ICE powered cars, buses,or airplanes. It also means an end to most industrial and agricultural practices as we know them today.
Is such a transition possible for 7+ billion humans and what might it look like, I certainly don’t have a clue! My guess is it means a lot fewer humans on the planet living with a lot less energy consumption.
It is going to look very different from what we have now, that I’m sure of. 🙂
Don’t know why I can’t edit my comment… BUT Here’s one persons vision of what that transition might look like.
http://goo.gl/VKzNd3
Clients often ask me about what might be a “black swan” (an event that comes as a surprise to conventional wisdom, has a significant impact and is often rationalized after the fact) for the oil industry. Lately I’ve been thinking how a dramatic breakthrough in battery technology could be such an event. The implications for the petroleum industry might be broader than you think.
Elon Musk
IMHO climate change, peakoil, and technological disruption are coming together in a perfect storm to put the final nails in the fossil fuel business model. Here’s why.
So what is the black swan event? It is not only that such a mass market electric vehicle could threaten oil demand growth, but that the underlying technological innovations necessary to be competitive with ICEs threaten the entire hydrocarbon industry – not just oil, but natural gas and coal as well. My hypothesis is that if a battery is capable of storing enough energy to move a $25,000 mid-size sedan 300 miles, then it would be cheap and small enough to mount another battery in the garage. If the garage battery is charged by roof-mounted solar and/or wind, it removes the need for incremental electricity generation from central power plants fired by natural gas or coal.
Heck of a lot of if’ing going on there.
I personally feel more hopeful when living with real world solutions instead of make-believe ones that don’t exist.
Besides Elon’s future is simply the same industrial mess that we have now only instead of ICEs its toxic batteries.
Batteries can be recycled, burnt fossil fuels can’t. So which is a more realistic solution?
You need to learn a lot more about the process of recycling especially Li-ion. Nothing realistic about it.
Recycling solves nothing and in fact historically only allows for increased consumption.
We should all use no resources at all, yes that is it. 🙂
What a stupid immature comment.
I have never even implied that but since you bring it up we obviously should use a fraction of the resources that we do use now or reduce the population at the same rate as we consume the planet.
Which do you advocate?
Hi Jef,
Using fewer resources and lower population would both be good so I advocate both strategies, you don’t seem to like recycling, I think it reduces resource use. I also think manufacturers should be responsible for the disposal of the products they create, this would encourage better products that last and products would be designed so that they could be recycled.
A buildout of renewable energy infrastructure would require far fewer resources than continued use of fossil fuels.
Better education of women throughout the World should be a high priority because more highly educated women have fewer children.
You need to learn a lot more about the process of recycling especially Li-ion. Nothing realistic about it.
Thanks for the tip, Jef, I’m doing exactly that. I actually helped setup a metals recycling center in South Florida for a Hungarian company a few years back. So I have some idea as to what it entails. But you are right I still have a lot to learn…
As for saying that recycling Li-ion batteries is unrealistic, let’s just say I think you are the one who needs to learn a lot more about a lot of things…
https://www.technologyreview.com/s/532896/discarded-laptop-batteries-keep-the-lights-on/
Many of the estimated 50 million lithium-ion laptop batteries discarded every year could provide electricity storage sufficient to light homes in poor countries, researchers at IBM say. In work being aired this week at a conference in San Jose, researchers at IBM Research India in Bangalore found that at least 70 percent of all discarded batteries have enough life left to power an LED light at least four hours a day for a year.
Now we could also do the same with power tool batteries. Why don’t you go ahead and find out how many million such batteries are discarded every year.
So long before we break apart the old batteries we can still get a lot of life out of them. BTW I’m talking about the individual cells inside the laptop batteries. Obviously you do have to break the old laptop batteries to get to them but that’s just a plastic cover which can also be recycled. Google 18650 Li-ion batteries.
I am not “against” recycling. I am simply stating that first off it isn’t happening to any degree that really matters.
Second it is mostly a palliative that only serves to encourage the increase of waste, as an industrial designer specializing in plastics I saw this happening first hand.
Thirdly recycling requires lots of energy and is, in most cases, highly toxic, Li-ion is one of the worst and so far is completely uneconomic, you don’t get much out of the process in the end.
“A buildout of renewable energy infrastructure would require far fewer resources than continued use of fossil fuels.”
This is a lie! It would be 100% reliant on FFs and if we want to maintain any semblance of an economy while doing this build out we would still need FFs for that too so, as many have noted before me, it would increase FF use for a long period of time.
Hi Jef,
At first it would rely on fossil fuels, gradually the reneweables will replace fossil fuels.
Again this is in addition to using less energy through greater efficiency.
You say it cannot be done, I disagree, the future is unknown, we do the best we can with the time we have.
I propose solutions, what is your alternative to improved energy efficiency (so that less energy is used) and more renewables to replace depleting fossil fuels?
Fred, much as I like the idea of a steep penetration of electric vehicles into the market, I envision a response from the ICE builders. Current and startup builders will produce ICE vehicles in the 80 mpg plus range for half the cost of an all electric vehicle and will have no range or recharge station limitations to deal with. These vehicles will be lighter and less technically advanced than the Tesla but will provide a significant affordability gap that will be difficult for the all electric or complex hybrid vehicle to cross.
So until fuel becomes very expensive, the electric market will be throttled back by high mpg ICE vehicles worldwide. Will make for a very interesting upcoming decade.
If one was educated on a subject, they would think and not feel of solutions in the real world
No more ICE powered airplanes? How are you planning on powering them? Rockets?
How are you planning on powering them? Rockets?
Nope! I’m suggesting doing without fossil fuel powered ICEs entirely. That means no casual air transport for the masses. If you can’t imagine such a world, then that’s just your lack of imagination. Because it’s going to happen whether you like it or not.
A few will have private electric planes and where it is absolutely necessary to use combustion engines then for those very few cases there are other means of producing the necessary liquid fuels.
http://www.scientificamerican.com/article/impossible-electric-airplane-takes-flight/
People who keep suggesting that that alternatives are fantasy and fossil fuels are the only possible solution have got it completely backwards!
http://gawker.com/ford-cuts-ties-with-right-wing-climate-denial-group-ale-1759797786
Car maker Ford has ended its relationship with the climate-denial lobbyist group ALEC, the Guardian reports, joining tech companies like Google, Facebook, eBay, and Yelp, as well as the energy companies like Shell and BP in distancing themselves from the Koch-funded network.
Looks like more and more corporations are reading the writing on the wall. If you are still on the side of the Koch’s then you might think about forging new alliances…
Cheers!
Monumental crapola.
https://en.wikipedia.org/wiki/Airbus_E-Fan
That’s this breakthrough you’re hyping.
60 lousy kilowatts of power. 745 watts/horsepower –> 80 horsepower. You’re hyping ultralight power levels. That number is less than a Cessna 172. It’s about half. And the 172 has been in production since the 1950s.
https://en.wikipedia.org/wiki/Cessna_172
“Range” carefully quoted as 1 hr. The Wiki lays out cruising speed of 86 knots. So you can go 86 nautical miles between tank refills, that require an hour (if you can find a charger).
Just stop. Stop humiliating yourself.
“Range” carefully quoted as 1 hr. The Wiki lays out cruising speed of 86 knots. So you can go 86 nautical miles between tank refills, that require an hour (if you can find a charger).
Just stop. Stop humiliating yourself.
Why should I? I’ll humiliate myself as much as I want thank you very much! At least I can laugh at myself!
BTW, just to keep things in perspective…
In 1903 Orville Wright describes the first ICE powered flight. … Orville’s brother Wilbur piloting the record flight lasting 59 seconds over a distance of 852 feet.
Talk about humiliating, eh?!
To All of you who can’t let go of the fossil fuel world. Your world is already dead! My world may never be born or it may be still born, However it is still infinitely better than your dead world! BAU sucks!
https://medium.com/life-learning/be-a-fucking-weirdo-bb842a0250d#.yr9c3nvr1
Cheers!
“That means no casual air transport for the masses.”
Ah OK. You are talking about the end of air transportation. I thought you have discovered another way of powering air transportation. You have not suggested zeppelins or hot air balloons as air transport for the masses.
High speed rail is one alternative. Video chat is another. Civilization will continue without the rich being able to fly half way around the world in a day.
“wimbi. Lay out your vision of what happens if, by year end, ff use ceases throughout the world.”
Stupid binary question, the world will transform over a longer period of time.
“Lay out your vision of what happens if, by year end, ff use ceases throughout the world.”
My vision would be big on famine.
Hi Jimmy,
Yes I suppose. One has to accept the premise which is absurd.
Kind of like, no more water in one year.
That would be bad, but it is not a realistic scenario so not worth wasting time thinking about.
Fred,
so we are not going to have “…casual air transport for the masses…” ( as you so eloquently put it!) – such as it exists today, but yet somehow we are going to have “…electric airplanes…” that travel the world when needed!?!?
Wow!
You certainly got a very good grip on how modern, complex societies evolve and work….and most certainly you got no lack of imagination!
Be well,
Petro
somehow we are going to have “…electric airplanes…” that travel the world when needed!?!?
Some electric planes yes, just like a very few super rich will still have luxury TESLA’s. And to be very clear I didn’t for a moment suggest that those electric planes would be travelling the world as needed, certainly not with 7 billion Joe Six packs at the controls.
Interesting side note. In Brazil Embraer produces a little single engine ethanol powered crop duster. It works really well where they have lot’s of sugarcane for ethanol production but I would never suggest it will replace global air travel.
BTW, As someone who has worked in business around the world in fields as diverse as technology, science and art and as someone who has a multicultural background I can say with some confidence that I actually do have a pretty good grasp of how complex societies work. For the record, IMHO, among those societies the USA is quite an aberration to say the least… I have lived and worked in a few other societies so I like to think that I don’t have a one dimensional view on this topic like most people who have only lived in the USA.
As for imagination and creativity, that I have in spades!
I still think BAU is for all practical purposes dead. I think there will be a reset in global population. Ecosystems will be damaged and much diminished.
If there is a civilization on the other side of the bottleneck I’m willing to bet it will be powered by energy sources such as solar and wind, hydro, wave energy and thermal and not by fossil fuels and nuclear purely because the last two are no longer feasible or sustainable in terms of EROEI and impacts on the biosphere.
Quite frankly I really don’t give a rat’s ass what anybody else thinks about me anymore. I’m just going to do, say and think, what I want and have as much fun as I can I for as long as I’m still able!
And I’ll be the first to admit that much of what I say should be taken with a quite few grains on NaCl. 🙂
Cheers!
The technology exists today to extract CO2 from the atmosphere and convert it chemically back into hydrocarbons that can be burnt in an ICE, using electricity as the power source, and a lot of fancy fuel cell chemistry. It is not remotely economic at current prices, but when fossil fuels cease to be available, it is a far more likely technical fix for keeping the super rich flying than electric battery planes.
Easier to start with duckweed. Grown in all that crap them super rich put out.
Fred,
no personal insults were intended or implied!
-I read your comments here with interest and from time to time learn from them.
-However, your idea that we are going to drop to a much lower standard of living – which we most definitely are in the very near future, and I personally think (if you have read my comments here) that we are headed for end of society and possibly worse… – and yet somehow be able to make/produce/build things that, even nowadays while we enjoy this wonderful bounty, are part of “Star Wars” crowd imagination…..that is a bit off and naive to me.
But I digress.
Be well,
Petro
no personal insults were intended or implied!
No worries. None taken!
we are headed for end of society and possibly worse… – and yet somehow be able to make/produce/build things that, even nowadays while we enjoy this wonderful bounty, are part of “Star Wars” crowd imagination…..
I think it all depends on who you include in ‘WE’
My personal opinion is that there will be small groups that have both the resources and the knowledge to do so.
I do agree with you that the vast majority of humanity is headed for the, as you put it, ‘Much Worse’.
Cheers!
“Quite frankly I really don’t give a rat’s ass what anybody else thinks about me anymore”
Cheers !
Hay Fred, Let’s assemble a POB group and launch a kickstarter and acquire us some ready-to-go chain reactors . – Guess not working out to well for Entergy.
http://www.al.com/news/index.ssf/2016/02/tva_considers_selling_unfinish.html?hootPostID=c294aba7a6503c7f5b0922dd9810c56d#incart_river_home
http://ecowatch.com/2015/10/14/nuclear-power-bites-dust/
They are 40 year old plants with aging vessels. I have proposed designing for a 50 year lifespan with an allowance to account for micro cracks. But old designs do need to be replaced with new nuclear power plants.
Shallow. Good question, easy to answer. No imagination req’d. Just look around and see what people who have had the oil jerked away from them have done. Cuba, etc. And of course, those billions who have never had it in the first place. What did they do? Just look and see. Miserable? Sure, but not necessarily so.
And, BTW, if USA were suddenly told by the gods from above that from this day forward, they got no more FF’s, they would right then get very frugal with what they have right now. That would take them a fair bit down the road to something good enough.
I have just finished lunch with some friends on our nice sunny warm front porch/greenhouse. We talked about what we were eating and how far it had come. A fair bit of it came from that great central valley of Cal, a few thousand miles somewhere thataway.
The vote was unanimous, we could very well get along without ANY of the Cal stuff we were enjoying.
I like avocados. Do I need them? Hell no. I could have happily lived my whole life without even knowing such a thing existed.
Airplanes? My good frugal Quaker friends all lead a simple life, except, strangely, they fly a lot without much apparent thought. They have a skimpy car and don’t drive much, but they burn 10-20 times that in their flitting around to no needed purpose. When I mention that, they look very unhappy and change the subject real quick.
Too bad. Big shock coming up.
My own opinion – people would be FAR MORE happy doing more meaningful stuff themselves, that is, not getting oil to do it for them. We have lived here 55 years. We have a big productive garden. We have put near zero FF in it. Lotsa elbow grease. So what. Grease better there than smearing up the TV table.
Hi shallow sand,
One year, really? Does that seem realistic? How about a gradual decline of fossil fuels with gradually rising prices over a 30 to 40 year period? Now that is more likely to happen in the World where we actually live.
Dennis. That is my point. We are being told by some we need to get off all fossil fuels immediately. That to me = we need to stop eating food and drinking water immediately.
“get off all fossil fuels immediately”
For those who understand the situation, immediately means 30 to 40 years. The first step is to point the ship in the right direction and pick the low hanging fruit(EV’s, reduction in coal uses).
Hi shallow sand,
I get it. I am fairly sure what is meant is that we should start the transition to a World that uses less fossil fuels as soon as possible (now would be best).
I am assuming that you believe that one day peak oil will be reached, this is also true of coal and natural gas.
It would be best to start a transition before the peak is reached or such a transition will be far from smooth and perhaps catastrophic.
So we start installing more PV and more wind turbines, buy more plugin hybrids and EVs and try to keep up with the impending decline of liquid fuels, coal, and natural gas.
I think many of us think along these lines. As opposed to no fossil fuels one year from now, which is unlikely.
ignore
Every time I drive through the agricultural areas of California, I am stunned at the scale of industrial agriculture. There’s no way we produce as much food as we do today with electric powered farm machinery period much less when the electricity comes from wind and solar. Heavy industry can’t get by on solar and wind — how many panels would it take to power an aluminum smelter?
Greer had a good post on this subject: http://thearchdruidreport.blogspot.com/2016/02/renewables-next-fracking.html
Then, of course, there’s always population growth which eventually negates any efficiency gains.
Oh well, I guess most of us are dead then, eh? At the very least we aren’t going to have the kinds of heavy industry that can’t get by on solar and wind.
But it is absolutely feasible to smelt aluminum on an industrial scale without the use of fossil fuels. It is already being done today.
http://www.alcoa.com/sustainability/en/info_page/energy.asp
Securing a Sustainable Energy Future
Energy is critical for our global operations. We strive to reduce the amount of energy we consume while increasing our use of renewable energy sources.
Globally, we control more than 2.8 gigawatts of generating capacity to provide for the energy needs of our smelting and refining system and regional wholesale markets. We supplement this with purchased electricity, of which more than 64% is from renewable sources. In addition, more than 62% of the purchased electricity used by our smelters globally is renewable.
Emphasis mine.
Also: Study done in 1995
http://www.nrel.gov/docs/fy06osti/39819.pdf
http://phys.org/news/2011-05-underscores-advantages-renewable-energy-future.html#nRlv
So who do we believe?
Me, of course. Yet again! 🙂
(Wipe that smirk offa ya face, wim. Stay humble like grandma said.)
Great! TKS, Wimbi, now I have something to read this evening. 🙂
Here’s a link to the PDF Summary for Policy Makers and Technical summary Special Report on Renewable Energy Sources and Climate Change Mitigation. Note: Full Report is 900 pages this summary is only 246 pages.
https://www.ipcc.ch/pdf/special-reports/srren/SRREN_FD_SPM_final.pdf
N.B. Before any of the climate change denial gang, the IPCC haters and anti renewables crowd, attack the conclusions in this report, may I suggest they also read it, so at least they can argue against specific points and don’t waste anyone’s time with unsupported claims of: ‘IF IT AIN’T FOSSIL FUEL, IT CAN’T WORK!’
Cheers!
Fred – You keep saying that anyone who doesn’t buy into you magical future BAU scenario is a FF advocate. That is not what I hear anyone saying (well maybe Jav).
All I am saying is that an industrial civilization anywhere near the level of civilization we have now is not possible with “renewables”.
If we attempt to create one anyway we will have to ramp up industrial production including FF use for the foreseeable future
virtually guaranteeing our demise. A possible “renewable” future is one where we have and do about 25% of what we have and do now. I have yet to see anyone realistically map out how we can get from here to there and still have anything remotely resembling civilization.
You need to stop promising a future that has about zero chance of happening.
Hi Jef,
And Fred says over and over and over and over that BAU is dead. He agrees with you so why are you arguing.
Do you agree that some energy will be needed in the future?
How would you suggest that the energy be provided (assuming that you believe that a society that uses no energy is not likely to be viable)?
Most people , including me, think that society will be transformed into something very different from BAU.
Do I know what it will look like? No, nobody does.
Just because you and I cannot imagine what the future will look like, does not mean that the World will not adapt to less fossil fuel energy through more efficient use of energy, building quality products that last almost forever and can be repaired, reusing stuff as much as possible and recycling stuff that cannot be reused.
All of this is possible and scarcity of energy and other resources and the increase in prices that results will require that people become more frugal.
Will such a transition be easy? Absolutely not
Possible? I believe so.
Dennis, I have never questioned whether or not we will adapt to a much lower energy input to society. Of course we will… finally…. adapt. After the chaos, we will adapt. But we will adapt at a much lower population level. And the survivors will inherit a world much poorer in animal life and animal diversity than we have today.
And all this will begin no later than half a century from now. It could be much less than half a century, but I am being optimistic. And it will be all over, that is settled out at a much lower population level, in less than one century from now.
Have a nice day.
Hi Ron,
I agree population will be lower, animal diversity will be reduced, and energy use per capita will be lower. I just disagree about the time frame, I think this will all happen over about 200 years and that rather than collapse there will be a gradual transition, though with fits and starts no doubt with another Great Depression sometime in the next 20 to 30 years.
Greer is smart and fun to read. He is NOT an engineer or scientist, and hasn’t a clue about just how versatile us naked apes can be when it comes to a pinch.
I thought about getting in and out of town on 1/10 the fuel energy we use today, all from biomass. Easy. Just schedule right, and everybody crams into the same van at the same time.
Like the way most people do in most places.
Not the way we do it? Of course not, that’s why we think we are in deep soup when in fact we’re not anywhere near as deep in as billions of other people who are doing sort of ok with FAR less.
Buncha crybabies. And way worse, crying toxic tears.
I totally agree. We in the U.S. are so much better off than most of the world that a big decline in our standard of living would still keep us comfortable by world standards. However, decline has a long horizon. I won’t live to see the worst of it. My son might.
Right on wimbi, the developed world has a lot of wiggle room when it comes to adapting to lower energy use. Mostly because they use way too much energy now and a lot of it is not necessary.
People will think they are doing major changes in their lives as things tighten up, but they will just be tossing away some useless frills and fancies. It’s the businesses that will feel the tightened belt both as costs go up and people stop buying a lot of unnecessary items. Businesses often are already running fairly efficiently and reducing waste, so they don’t have as much wiggle room.
Much like the carriage and buggy whip business died when the automobile took over from the horse, certain businesses will just disappear as they become neglected and new ones form to meet the changing demands of society.
It’s all happened before, just not on this scale. Mistakes will be made, but so will successes.
Everybody in the last five or six comments above has possession of a chunk of the truth.
Ron imo has the biggest chunk.
A HELL of a lot of people are going to live very hard and short lives between now and 2100. There just won’t be enough resources to manage a transition away from fossil fuels for all of us, and even if the resources were available, half or more of us will not display the collective good sense to give up the easier life sooner so as to LIVE at all, later. Mother Nature doesn’t give a shit, and will hand out DARWIN AWARDS freely, by the billions.
If a currently rich and powerful society, well situated in terms of resources , population, geography, climate, etc, TODAY, gets the necessary Pearl Harbor Wake Up Bricks upside its collective head , then such a society has a fighting chance of transitioning to a ” new generation” business as usual.
We just AREN’T going to run out of fossil fuels, or anything else, abruptly.There is coal enough to EASILY supply the ESSENTIAL uses of coal, such as manufacturing new steel from ore, for thousands of years, keeping in mind that with a low, stable population, steel can be almost one hundred percent recycled. Besides recycling, we won’t necessarily need much steel anyway. Ditto oil, most of the oil we burn today is not truly NECESSARY to our living decent lives.
Unemployment may turn out to be the single biggest and toughest probem, because renewables may enable us to keep the ESSENTIAL wheels of society turning.
Jumbo jets full of people flying hither and yon are utterly unnecessary, except to the people who earn their living as the result of those jets crisscrossing the sky, endlessly.
How are we going to manage the unemployment issue?
After thinking about these things for the last ten years, on a daily basis, while watching renewables continue to get cheaper year by year, I am about ready to conclude that unemployment is going to be a tougher nut than scaling up renewables and solving the storage problem.
We already have a dozen viable partial solutions to the energy storage issue, but most people manage to over look just how well these partial solutions will work, in combination.
IF we put our minds to it, and we make the necessary tough choices, we can conserve and stretch our endowment of oil and gas long enough and far enough, in a country such as the USA, to learn how to live ok with very little oil and gas indeed.
Hi Old Farmer Mac,
One solution is shorter work weeks.
Yair . . .
I see all these comments/opinions as to what may happen when the world runs low on energy and it seems to me that (for the most part) folks forget that humans thrived and completed some of the greatest engineering projects ever conceived before the existence of electricity or fossil fuels.
Provided we don’t stuff up the climate completely I believe that when the population crashes to a sustainable level the human race is going to get by just fine.
Australia has about the same land-mass as the US lower forty eight and just a couple of nights ago the population ticked over to twenty four million . . . and even at this level our country is under stress.
We need a die off . . . and politicians with the basic intelligence to grasp the simple fact that economies cannot grow indefinitely and we have to arrive at steady state.
To my mind the excess of energy in the system is the root cause of many problems. For instance, the populations in the “sand country” as OFM puts (even in my life time) used to be regulated by the natural availability of water and food.
Now the surfeit of energy allows Antanovs and Boings to fly in food and bottled water to be distributed by Mercedes Benz, Volvo and M.A.N.
It is all artificial bullshit prolonging the agony and the sooner it ends the better.
Cheers.
Employment, income, lack of any logical relation between:
http://www.communitysolution.org/blog/2016/2/16/i4ui222xxxv0lvbd0mbgfsfy2htw4v?mc_cid=8b98a395b4&mc_eid=4134af8cfd
Venezuela hikes gas prices for first time in 20 years
Maduro said the price of 91 octane gasoline would rise 1,329 per cent to 1 bolivar (22 cents Canadian) from 0.07 bolivars, while 95 octane gasoline would rise 6,086 per cent to 6 bolivars from 0.097 bolivars as of Friday.
Even with this 13-fold rise in price, gasoline is still dirt cheap in Venezuela. Who’s next Saudi Arabia?
Yea, the new price seems to be about eleven yankee cents a gallon, which would mean if a barrel came out of the ground in the form of ready to use gasoline, it would be sold for less than five bucks.
After considering the cost of production, processing, and distribution, the loss must be at least twenty five or thirty bucks a barrel. If you want gasoline to be wasted, there could be no better policy devised to guarantee that result.
The miracles of socialist economics never fail to impress me. LOL
At least this idiotic policy results in a few poor people making a living, humping gasoline across the border in jerry cans, selling it and trading it for food and medicine.
( Note, I am planning on voting for Bernie, so I am making this sarcastic remark in jest, rather than making fun of socialism. There are plenty of so called capitalist idiots out there as well. )
Look up “Maduro’s Miniscule Adjustment” with a search engine. I would post a link but I’m being sent to spam. So I’m trying this way.
Even the Russian Oil Minister is getting bearish on the future of Russian oil production.
Russia Sees Oil Output Slump in Worst Case Amid OPEC Talks
Russian oil production may slump 14 percent in the next five to 10 years under a worst-case scenario prepared by the Energy Ministry.
Crude output may drop to 460 million metric tons (9.2 million barrels a day) by 2020-2025 from 534 million tons last year, before starting to show slight growth, the Energy Ministry’s press service said by e-mail Thursday, in response to a report in Vedomosti newspaper. The worst case, prepared for the nation’s long-term energy strategy, envisages oil prices remaining at about $31 to $33 a barrel in 2016-2017 with a rebound to $42 in 2020, it said.
My opinion is the Russian Oil Minister is still a bit overly optimistic here. 😉
Hi Ron,
I think the Russians probably have a good idea how much oil they can produce, perhaps you meant the slow growth part, I think the oil minister believes that higher oil prices may allow a little growth after 2025, perhaps that is too optimistic. I think a plateau for Russian output from 2025 to 2030 is realistic with high oil prices. If there is an economic collapse between now and then the demand for oil will drop along with oil prices and most scenarios by government agencies and international agencies will prove optimistic.
And the worst case scenario for oil prices is not very realistic in my view.
Dennis, I would never questioned what the Russian Energy Minister knows. I think I said that once before, but apparently you missed it and still think I am talking about what the Minister knows. I am not. I do question what the Energy Minister says. It is his job to be optimistic and put the best face possible on the future of Russian oil production. And that is all he is doing.
The Russian decline oil production will only accelerate after 2025. They are still getting over 60 percent of their production from those giant Western Siberian fields. Over the past decade those old fields have been kept their production level up by massive infill drilling. Infill drilling keeps the decline in check but dramatically increases depletion. To think that can continue to increase production a decade from now is absurd.
Dennis, it is just so damn easy to spin the future. We see it from almost everyone. Helms did it in North Dakota, the EIA does it with OPEC production. The IEA does it with OPEC production. Why in heavens name can you continue to believe that Russia has the only Energy Minister who does not optimistically spin his country’s future prospects?
The Russian Energy Ministry has always been cautious in their forecasts.
Over the past several years, actual oil production was always higher than the Ministry’s projections made at the end of the previous year or in the beginning of the forecast year.
It is interesting to look at forecasts made 10-15 years ago.
In 2002, when Russian oil production was 380 million tons, projected output volumes were 360 mtons by 2005 and 360-370 mtons by 2010.
Actual production was 470 mtons in 2005 and 505 in 2010
This is a stress scenario (worst-case), assuming $31-33//bbl oil price in 2016-17 and gradual growth to $42 in 2020. It assumes a moderate recovery in output levels after 2020.
What would be global oil production if prices follow this scenario over the next 5 years?
And can prices follow this scenario if global oil production sharply declines?
According to the article in Vedomosti, there is also a conservative scenario, which predicts:
516 m tons by 2020 (-3.3% vs. 2015);
505 m tons by 2025 (-5.4% vs 2015);
476 m tons by 2035 (-10.8% vs. 2015).
Finally, the base case scenario remains the same as in 2014 version of the Energy Strategy: stable output at 525 m tons until 2035.
Note that these forecasts were prepared by the Energy Ministry, which is lobbying against the increase in taxes for the oil industry and for previously approved tax concessions for new projects.
Note that these forecasts were prepared by the Energy Ministry, which is lobbying against the increase in taxes for the oil industry and for previously approved tax concessions for new projects.
Alex? I am shocked! You would not suggest that the Energy Minister would spin the facts would you? Don’t tell Dennis, he will never believe you. 😉
At least we can agree on the spinning. Just which direction future oil production is being spun is a question. Is it possible that the Energy Minister would lobby against something Putin wants? That could get him killed. 😉
Ron,
You would be surprised, but Russia is not North Korea.
There ARE different views and fierce debates within the Russian government.
Each ministry is defending the interests of its industry or the sector of the economy.
For example the Finance ministry is lobbying for the increase in oil taxes, while the Economy ministry and the Energy ministry are lobbying for maintaining the existing tax rates, as higher taxes would lead to declines in oil production.
The aim of stress scenarios is to persuade the government not to increase tax burden.
Besides, over-optimistic scenarios are actually negative for the Energy Ministry. If they are not fulfilled, the blame will be on the Ministry.
Hi Ron,
Everyone has an angle. My main point was that I did not think the forecast was optimistic, as AlexS points out it was pessimistic for a reason and as he also points out the Russian Energy Ministry’s Base case forecasts have tended to be conservative for Russian output. The same can be said of EIA forecasts of US output at least since about 2008. Most of the Annual Energy outlooks have underestimated future US output.
OPEC output is difficult for everyone to predict, generally everyone assumes OPEC will produce enough to satisfy demand, at some point this will no longer be true. That is when peak oil will finally be recognized by the man on the street.
@Ron Patterson
Please answer this honestly. How long have you been predicting that Russian oil production is about to enter “terminal long-term decline” ?
If you have been predicting something different, then I would love to see it.
How long have you been predicting that Russian oil production is about to enter “terminal long-term decline” ?
Since 2014, about the time most Russians themselves started predicting Russia’s peak and decline.
Peak Oil Barrel Russia’s Take
That is a post on Russian Think Tanks that predicted Russia’s peak and decline:
Global and Russian Energy Outlook to 2040
If you have been predicting something different, then I would love to see it.
No, I have never predicted anything else but if these Russian Think Tanks start predicting something else then I just might.
I only predict what I have strong data to support!
http://portal.ransquawk.com/headlines/saudi-arabia-will-not-cut-oil-output-according-to-afp-18-02-2016
Weekly iea numbers. Production dropped 30000 bpd last week and another 50000 bpd this week. If those numbers are only halfway acurate that would be huge
Can you expand a bit (e.g. production from where) and provide a link.
He meant EIA, not IEA. And he is talking about the EIA’s Weekly Petroleum Status Report. Click on:
9 U.S. and PAD District Weekly Estimates
The weekly data is highly suspect. It is based on an algorithm, not actual data. And the historical data is never revised, They only adjust the current data when they figure out their historical data is way off.
EIA’s weekly US oil production statistics.
Can be also found here:
http://www.eia.gov/dnav/pet/pet_sum_sndw_a_epc0_fpf_mbblpd_w.htm
They are “very preliminary” and tend to diverge from the monthly data. Now both set of data show a declining trend.
EIA weekly US oil production statistics vs. monthly data and forecast from the STEO
[…] Bakken December Data, Big Decline […]
[…] The rest is on Peak Oil Barrel. Now you go read that […]
Maybe someone in here can explain how API and EIA can have so huge difference in estimates for inventories.
API 2016-02-17: -3.300M
EIA 2016-02-18: +2.147M
That is just latest, this is a common phenomenon do they have so different models and input?
OR is it that they all doing some nice guessing?
Quite a big drop in production this week from EIA, Lower 48: -50.000/day
EIA’s short-term forecast for the Gulf of Mexico:
Oil production in federal Gulf of Mexico projected to reach record high in 2017
February 18, 2016
http://www.eia.gov/todayinenergy/detail.cfm?id=25012
U.S. Gulf of Mexico (GOM) crude oil production is estimated to increase to record high levels in 2017, even as oil prices remain low. EIA projects GOM production will average 1.63 million barrels per day (b/d) in 2016 and 1.79 million b/d in 2017, reaching 1.91 million b/d in December 2017. GOM production is expected to account for 18% and 21% of total forecast U.S. crude oil production in 2016 and 2017, respectively.
Production in the GOM is less sensitive than onshore production in the Lower 48 states to short-term price movements. However, decreasing profit margins and reduced expectations for a quick oil price recovery have prompted many GOM operators to pull back on future deepwater exploration spending, reduce their active rig fleet by scrapping and stacking older rigs, and restructure or delay drilling rig contracts. These changes added uncertainty to the timelines of many GOM projects, with those in the early stages of development at greatest risk of delay or cancellation.
Contributing to the forecasted production growth are 14 projects: 8 that started in 2015, 4 starting in 2016, and 2 anticipated to start in 2017.
How come they don’t include Julia tie-back to Jack / St. Malo which is supposed to start this year – if it’s delayed it should still be by 2017. And Stones is not the first FPSO in the GoM – BW Pioneer is already there on the Cascade-Chinook fields. I’m losing a bit of faith in EIA.
Saudia Arabia and maybe a few other oil exporting countries may very well be at risk of collapse, in the middle or long term.
http://www.theatlantic.com/international/archive/1857/11/saudi-arabia-collapse/463212/?preview=PfoXioca1_iHQ9_7TgFj5JtnX7I
The Atlantic is a truly outstanding publication, as the mass media go. No outfit is always right, but the Atlantic is one of the relative handful always worth reading.
SA might hold on for another generation of bau, or the country might explode like an overheated boiler any given year.
I can’t see any possible hope for the country surviving in anything at all like its current form once the oil starts running short, or if for some reason the price of oil STAYS down around thirty bucks or less.
Although I was not a big fan of the man I am often reminded of something he said:
“Reports that say that something hasn’t happened are always interesting to me, because as we know, there are known knowns; there are things we know we know. We also know there are known unknowns; that is to say we know there are some things we do not know. But there are also unknown unknowns – the ones we don’t know we don’t know. And if one looks throughout the history of our country and other free countries, it is the latter category that tend to be the difficult ones.”
I think everyone knows who I’m talking about.
There is one more combination of those two worlds; unkown knowns, to wit, things that are in the data but perhaps haven’t been fleshed out yet or are being obscured by interested parties.
Iran recently managed to agree to sales of 300,000 barrels a day of oil to Europe. In a glut? Gulf coast refineries are increasing imports of crude from overseas. In a glut? There are too many cross currents in the stream and a lot of contradictory messaging and behaviour.
I don’t pretend to know what’s happening or is gonna happen but I do know what bullshit smells like and I do know rising geopolitical tensions look like. My prediction is black swan. Don’t know how. Don’t know when. But the cheque is in the mail, as they say.
“My prediction is black swan.”
You cannot predict black swans. By definition, if you can they are not black swans. LOL.
A black swan is a highly improbable event. It is not necessarily an unpredictable event.
Black swans may be unpredictable, but a predictable event that is highly improbably can be one too.
Black swan is a metaphor that describes an event that comes as a surprise, has a major effect, and is often inappropriately rationalized after the fact with the benefit of hindsight. It can also be described as unprecedented and unexpected. The theory around Black Swan events was introduced by Nassim Nicholas Taleb in 2007.
According to Nassim Taleb:
“What we call here a Black Swan (and capitalize it) is an event with the following three attributes.
First, it is an outlier, as it lies outside the realm of regular expectations, because nothing in the past can convincingly point to its possibility. Second, it carries an extreme ‘impact’. Third, in spite of its outlier status, human nature makes us concoct explanations for its occurrence after the fact, making it explainable and predictable.
I stop and summarize the triplet: rarity, extreme ‘impact’, and retrospective (though not prospective) predictability.”
So if it can be predicted it is not black.
retrospective means in hindsight?
prospective means a prediction?
This doesn’t exclude some genius who dies a second before the black swan event from predicting it.
Any event on the planet earth “could have been predicted”…but maybe it wasn’t cause us humans are fucking idiots.
How can an event be understood by humans in hindsight…not be understood by humans in foresight….
I like taleb…but that is a hole in his criteria…
I need to go to bed.
My wife wants sex ( a black swan event).
thanks Javier!
As far as is understood, it does exclude that, and from what is recalled (it’s been awhile), fundamental unpredictability reigns supreme.
[…] Source link […]
Marathon oil lost money last quarter and have cut spending by 75% compared to 2014. In particular:
“Marathon Oil has reduced conventional exploration spending to $30 million, down from more than $250 million in 2015 and from more than $500 million in 2014. Activity in 2016 is limited to existing commitments in the Gulf of Mexico and Gabon, with no exploration wells planned.”
Is that a company that can last very much longer?
Hundreds of companies are going to disappear soon if prices stay low. The stronger ones will survive. By the way my comments are disappearing. This is the last one I try today.
Marathon has been in business since 1887. At least they split the refining and pipeline segments off, so there have not been mass job losses in those segments.
I bet COP, MRO, HES wish they hadn’t listened to Wall Street re the spin offs.
Ref Venezuela comments above, I had a reply saying I was being marked as spam. I’m going to try to repost it here:
This link takes you to the International Crisis group assessment of what is happening in Venezuela
http://www.crisisgroup.org/en/publication-type/alerts/2016/venezuela-on-the-edge.aspx?utm_source=sm&utm_medium=tw&utm_campaign=venezuela-alert
This the Devil’s (Miguel Octavio) assessment of the measures proposed by Maduro.
http://devilexcrement.com/2016/02/17/maduros-miniscule-adjustment/
I have a lot of incoming information in Spanish, most of it grim. Yesterday Oscar Arias and Lech Walesa, Nobel Peace Prize winners, gave terrific speeches in Caracas, messaging to Maduro to listen to the will of the people, and avoid violence.
EOG is stacking their only rig in the Bakken.
Other than maybe QEP’s Grail, IMO the have had the most prolific wells in the Williston Basin.
However, take a look at their recent wells on shale profile.com. Not as strong. Same with Whiting.
Are Sanish and Parshall already past their prime?
I think a combination of price and geology is at work here.
Shallow,
I saw on the ND rig page that EOG rig was down to stack, then today EOG has spudded another well on the 19th. I assume it is the same rig, and on the same pad, though I did not record the details of the last well. Not sure what is going on.
Anybody else have any more information?
Reuters on renewed hedging activity by the US shale companies:
As 2017 oil rebounds to $45, U.S. drillers begin to hedge anew
Feb 19, 2016
http://www.reuters.com/article/us-usa-oil-hedging-idUSKCN0VS01J?mod=related&channelName=ousivMolt
U.S. oil producers reeling from an 18-month price rout have cautiously begun hedging future production this week, fearing this may be their best chance yet to lock in a $45 a barrel lifeline for 2017 and beyond.
As oil markets rebounded from 12-year lows this week, U.S. shale companies – for the first time in months – started inquiring and placing new hedges for the next few years, according to three market sources familiar with money flows.
The re-emergence of hedging interest, which traders said was still limited in scope for now and mainly in the form of inquiries rather than execution, came as a surprise to some, surfacing below the $50 psychological threshold that some traders had thought would be needed to coax back producers.
The activity likely reflects both the growing investor and lender pressure to safeguard heavy debt requirements down the road, as well as the fact that drilling costs continue to decline, allowing companies to break even at lower prices.
“The $45 is break-even for a lot of producers. It’s not just about making a profit, it’s about staying alive,” one trader said.
Denbury Resources Inc (DNR.N), for instance, said on Thursday that it had “recently” increased its fourth-quarter hedges to cover 30,000 barrels a day at around $38 a barrel.
“These are not great prices, but they protect our liquidity and will minimize our borrowings in the event that prices are lower for longer, because these hedges are above our total current cash costs,” Chief Financial Officer Mark Allen told analysts.
On an investor call last week, Scott Sheffield, chief executive officer of Pioneer Natural Resources, one of the most heavily hedged drillers in the business, said he saw a good chance of more rumors stoking prices.
With talk of declining U.S. shale output or supply curbs, “you’ve got to use events like that to put hedges in the marketplace.”
Just a month earlier, Pioneer’s chief operating officer, Tim Dove, had told Reuters that the company would be looking for a minimum price of around $50 a barrel to lock in more hedging, but oil’s relentless rout may have softened that view.
Matador Resources said this week it had added to its hedges over the past two weeks, but did not say by how much. It now has 43 percent of its estimated 2016 oil output hedged at weighted average floor and ceiling prices of $44 and $66.
Hedging for future production is common among U.S. oil and gas producers, who use it as a lifeline to protect future profits and continue pumping. The need to hedge appears to be greater than ever, with some estimating that only 14 percent of 2016 oil output is protected.
Some dealers have warned that companies’ increased appetite for hedging may stymie a sharper recovery in prices, allowing them to increase drilling more quickly than they otherwise might.
“If I were a producer, I’d be saying that we will be lower for a lot longer. So I’d be locking in prices now,” said Tariq Zahir, an analyst at Tyche Capital Advisors in New York. “But any spikes we see will just turn shale back (on).”
Bruno,
I like the seasonal factor in your model. If prices roughly stay where they are, you may also have projected a reasonable outcome for 2016. Helms expects ND to hit about 1 million/day by early next year in current conditions.
However, longer term it is clear that your model is way too pessimistic. It doesn’t take into account that the wells decline less later in life. If completion of wells would have stopped from last month onward, the Bakken would still produce almost 400 kbo/d by the end of 2022 (just from existing wells), whereas you project less than 100 kbo/d. This is based on existing well profiles. Clearly completion of wells hasn’t, and will not completely stop.
Yes indeed. But I read some wells later in their lifespan are plugged. I do not know how general this practice is, but it means, for that well, a production decline of 100% at once.
On the other hand: I am surprised myself this model, more than 2 years old now, is still relevant. It would be cool if it stays relevant for another year or something. I am not really thinking about the end of 2022 yet. 🙂
Sometimes things that are workable and practical are entirely overlooked.
IF an electricity utility OWNS wind and solar farms, the same way it owns coal and gas fired generating plants, then the issue of allocating the obviously large cost of maintaining the grid and back up capacity is SOLVED, to the extent the utility owns its own wind and solar infrastructure.
I have not noticed any body pointing out this obvious fact. Nobody tells me how to allocate the usage and maintenance of my car and my truck. I do that to suit myself, as best suits my own situation.
Rystad Energy on key factors affecting global future oil supply:
– New production from projects whose development started several years ago;
– Accelerated decline rates at old producing fields due to lower investments and reduced drilling;
– Delays and cancellation of new projects.
Excerps from the article:
‘Selfish’ oil firms relish new production despite glut
Feb 18, 2016
http://www.reuters.com/article/us-oil-projects-idUSKCN0VR1Q5
As oil firms scrap dozens of billions worth of mega projects essential for supplies in decades ahead, fresh output from huge fields already being developed is set to weigh for many more months on an oil market struggling to shake off a glut.
A collapse in oil prices over the past 20 months to below $30 a barrel has taken a heavy toll on production around the world, reversing spectacular growth in U.S. shale oil and halting plans to develop costly and complex fields deep in oceans or treacherous seas such as the Alaska Arctic.
But companies that have been investing often more than $10 billion in projects that were approved in the first half of the decade, when oil fetched in excess of $100 a barrel, are pushing ahead with many of their developments.
These include the TEN field off the coast of Ghana, operated by British company Tullow Oil, which is set to start production in the middle of this year, expansions at Chevron’s Jack/St Malo field in the Gulf of Mexico and at Cenovus’ Foster Creek oil-sands field in Canada.
Around 3 million barrels per day (bpd) of oil production is set to come on stream in 2016 from projects whose development started as early as 2013, according to Oslo-based consultancy Rystad Energy.
These projects will add a further 1.5 million bpd in 2017, with around two-thirds of the production coming from offshore developments.
Patrick Pouyanne, chief executive of French oil major Total, was unapologetic about boosting his production by more than 9 percent this year even as the world faces a huge production overhang.
“We are all still investing in projects we decided in 2012-2013 and 2014. These projects will be put in production in 2016, 2017 and still 2018,” Pouyanne said last week at the International Petroleum Week conference in London.
“I am not sure we participated in the stabilization of the market, but you know, there is only one good reaction when you face a crisis, that is to be selfish and produce as much cash as you can.”
Total in recent years began production from the CLOV field off Angola’s coast, in which BP, Statoil and Exxon Mobil are partners. It is on track to launch the ultra-deepwater Kaombo project, also in Angola, in 2017.
In January, Anadarko started production from its Heidelberg project in the Gulf of Mexico which was discovered in 2009 and started development three years later.
The U.S. Energy Information Administration expects production in the Gulf of Mexico to rise from 1.5 million bpd in 2015 to 1.8 million bpd in 2017, offsetting some of the declines in shale oil production.
CORRECTION UNDER WAY
With more than $220 billion of oil and gas projects canceled or put on hold since the start of oil’s price decline and companies slashing spending plans, a correction in global supplies is under way, Rystad Energy head of analysis Per Magnus Nysveen told Reuters.
Production from mature fields is nevertheless set to decline by around 3 million bpd this year due to natural field decline and lower investment.
“Behind the scenes there is a lot of correction going on because old producing fields are declining faster than they used to because there is less drilling,” Nysveen said.
Rystad Energy’s estimate of delayed upstream projects:
Nearly 230 BUSD earmarked for pre-development projects deferred since H2 2014, delaying over 3 MMboe/d of supply
January 28, 2016
http://www.rystadenergy.com/AboutUs/NewsCenter/PressReleases/project-delays-commentary-
Schedule slippage is an ever-present reality for E&P projects, especially for the more complex mega-projects. In addition to subsurface challenges, above-ground issues, such as government red tape or delays in reaching binding sales agreements, can derail planned sanction schedules.
On top of this, the drastic drop in revenues due to the oil price shock has imposed stricter financial prudence on E&P players. Risky exploration spending has been called off; incremental developments such as infill drilling at already producing projects have faced higher hurdles for approval. However, post-appraisal pre-sanctioned projects have borne the brunt of the bloodletting as BD teams tried to balance budgets.
Rystad Energy has been tracking delays announced (or inferred) since the second half of 2014 for pre-development projects, where sanctioning could have reasonably been expected within two years of the delay. Compared to our mid-2015 update, the delayed projects count has risen from 40 to 63. Much of this increase has come from delays to smaller, less complex projects, often operated by smaller players. Thus, even though the delay count has risen by 58%, total resources and capex delayed figures rose by 30% & 38% respectively.
The first casualties as oil prices plummeted were the more complex & costlier oil sands, LNG and deepwater projects. But as the oil price continued its slide during the second half of 2015, E&P companies eager to highlight their cost-cutting cred found easy targets in the smaller, simpler projects in their portfolios.
The mid-2015 delay list mainly featured the majors, international NOCs and the larger independents. Smaller E&P players have less of a footprint, and in general tend to partner rather than operate their projects. But by the second half of 2015 the downward price spiral snagged smaller operators…
Rystad Energy estimates the deferral of these 63 projects will result in over 3 MMboe/d (60% crude & condensate) of supply delayed at a peak production that is expected in 2026. Nigeria, Kazakhstan and Indonesia are the main countries affected, followed by Norway and Canada.
The deferred 230 BUSD would originally have been expected to be largely spent during 2015-20…
Rystad Energy estimates liquids production impacted by project delays at just 2 mb/d,
while WoodMac’s estimate is ~ 3 mb/d
How do they decide how long a delay lasts for? In reality the oil industry has a finite capacity for development projects, which is probably being gradually eroded with current redundancies and closing of yards. To assume a bunch of projects can be delayed for say three years and then be done in parallel with all the putative projects that would have been planned at that time is possibly wrong (but see below). It’s like deferring production from a new development in the early years – you can only make it up after the plateau period, which might be ten years away.
Do they say anything about discoveries? The IHS meeting is next week which is traditionally when they announce last years tally for C&C and gas finds and revisions. 2014 was the worst for over 20 years (I think less than 5 billion boe total TBC?). My guess is 2015 won’t be much better for oil, although ExxonMobil did find 700 million off of Africa. Natural Gas might be up though, with the Egypt field from Eni.
If discoveries are dropping off then there may not be a lot of new projects in 3 to 5 years and the delayed projects could therefore be accommodated.
These charts include total potential production from the pre-FID projects, assuming they were not delayed, and nothing more.
They are not forecasting when these projects can be approved and restarted and what will be their combined output volume by year.
They say nothing about new discoveries, because these projects should develop already discovered fields.
Lowest gasoline price in my fair city this morning $1.27
Significant cluster of stations in the $1.30-$1.40 range.
Absolute highest price 1.90
Never thought I would see this again.
At these gas prices? I wouldn’t just rush out and buy a bigger SUV nor giant off-road pickup truck used for hauling the kids to sporting contests at school, however.
(sly wink)
-b.g.
Interesting is the fact that December 2019 crude oil is going, today, at $46.66 a barrel. There are 8,293 open contracts. That means, likely, that over 8 million barrels of oil is hedged at $46.66. I say likely because not all of them are hedged barrels. Some are just speculators betting that oil will be below that point in December 2019. Of course those taking the long position, betting that oil will be above that point in December 2019 are, very likely, mostly all speculators.
There may be some refineries going long who want to guarantee that they can get oil at that price then. But that would be a huge gamble for them because if oil is still around $30 at that time they would lose their shirt. They could only sell refined products at a much lower price but must still buy at that high price. If they did not gamble, they would still make a small profit on every barrel and would not go bankrupt. There is very little reason for a refinery to hedge.
Light Crude Oil
Still, in the grand scheme of things, that is not a lot of barrels. But there are over 26 million barrels hedge at around $45 a barrel for December 2018.
Crude oil is currently in rather steep contango. Speculators are betting oil is headed up.
Spent some time trying to find a description of negotiation process refineries use getting a price with an oil exporter.
Found nada. Any refinery guys here who know?
http://www.coqa-inc.org/related-links
Why have we never heard of these people before. They are well funded apparently and the arbiters of . . . oil?
One of those links is CCQTA, Canadian Crude Quality Testing Assoc.
Lotsa pages laying out what’s in their various regional bitumen.
And one of their upcoming projects is an analysis of “Condensate Quality”.
As a writer, it is very interesting to me how the myth-making of the fracking industry as it ramped up is now coming to bite itself on the ass. To wit, the industry propaganda machine convinced Wall St et al that it could produce virtually unlimited quantities of oil and profits at ever lower numbers: $80/bbl, then $60/bbl, then $40/bbl. Whether it is all true or not I am not one to say, although it does seem unlikely. But the myth is out there, and has effectively put a ceiling on the price, because all the traders are telling themselves that if oil goes up too high, all the frackers will ramp everything back up again and then there will be another glut. Until this emperor is shown to have no clothes (and that will likely take a few years and a significant extended oil shortage), the oil price will rise very slowly. This is on top of the Saudi myth that they will also flood the market if there is too much fracked oil on the market. Stories drive the market, just like our lives, methinks.
Stephen,
Thanks a lot for your post. We need more critical thinkers like you. Mythology is an important tool in human societies and a very powerful force. I agree with your point:
It resonates with my thinking.
The whole neoclassical supply-demand model for oil is highly questionable. I think oil should thought for civilization much like water is for plants. So increased supply of oil (up to a limit) is beneficial to economy growth and, if you wish, GDP growth (and please note that GDP is a very questionable measure of economy growth in its own right). IMHO excessive supply within several percent of total volume (let’s say 3-5%) is seamlessly absorbed, so for those range of excessive supply the whole idea of “oil glut” is open to review. The illusion of glut can be created by exogenous factors like “Great Condensate Con” hypothesis suggests or by action of particular countries (Watcher idea of predatory pricing used by Saudi Arabia to decimate oil price for purely political motive) .
For example, none of oil producers in the USA other then those with high sulfur oil have any difficulties selling all what they can produce and actually can sell more.
Iran magically found the possibility to supple Western Europe with at least 0.3 Mb/d of additional oil despite all those fairy tails of “oil glut”.
To me all those talks is just game of market speculators to increase their profits via creating an artificial trend from which they can extract their rent. And they control media (contrary to Ron’s thinking they do). As low oil price are beneficial to the US economy and geopolitical interests EIA (which is at least 50% a propaganda agency and only 50% statistical agency) is on board. So they have a field day now. IEA is more or less a US lapdog too.
So the question now is not a balance (calculated on data with high error margin that agencies provide) but a severe, undeniable shortage which can ruin the myth. The myth which obtained its staying power due to constant repetition (brainwashing effect). It confines itself to a few points and repeat them over and over.” As Joseph Goebbels aptly noted
I have some shares in a small oil company, the price of the shares are not 100 dollars per share, they are much less than that, like about 99.3 percent less. lol
Anyways, how come the ask on the put is 9 times the price of the stock?
The options expired yesterday, so they are worthless now. However, how can the option be much more expensive than the price per share?
If there is an answer, I would like to know.
Frankly, R. Walter, that sounds like bubble market behavior when options are priced ridiculously outside of any conceivable rate of return for tolerating that kind of risk.
GPM
R Walter, an option can have intrinsic value. That is the amount the option is “in the money”. Everything else is time premium. If the option expires out of the money, then it is worthless. However if the option, at expiration, is in the money, then the amount that the option is in the money, at expiration, must be paid by the option seller to the option buyer.
So if you bought a put that guarantees you the right to sell a stock at $5 a share, and at expiration the stock was at $1 a share, then the put is worth $4. That is the seller of the put must buy the stock, from you, at $5 a share. Of course no stock will be exchanged. The contract will be settled for cash. The seller of the put must pay you $400 for each contract he sold you.
An option that expires in the money is not worthless. It is worth the amount the option is in the money. That is the intrinsic value of the option. All option contracts that are not closed before expiration are closed at expiration by the clearing house. And if it is in the money then the clearing house will settle it at that point, debuting the sellers account for the amount the option is in the money and crediting the buyers account for that amount of money.
The Texas RRC data is out. However I will not have a post out until tomorrow or Sunday. There is no rush since the Texas RRC data is incomplete and does not tell us a lot. However from what I can tell by looking at what they do have, there seems to be no decline, and possibly a slight increase in Texas oil production in December.
Has anyone here got a straight-through link to consultant group “The Hill’s Group” which has been heavily cited in various peak oil literature for their astounding prediction that without “39 trillion invested” in cap-expenditure in the oil and gas industries, these industries face a dire future, even systemic collapse, within 20 years or so?
It all sounds very dramatic, but no one in these stories links to the actual consultant group making the dire prediction. It’s part of “vetting the story” as they say.
The Kochs Are Plotting A Multimillion-Dollar Assault On Electric Vehicles
The oil and gas industry may have thought it had killed the electric car, but sales — boosted by generous government subsidies — rose dramatically between 2010 and 2014, and energy giants are worried the thing may have come back to life.
Time to kill it again.
A new group that’s being cobbled together with fossil fuel backing hopes to spend about $10 million dollars per year to boost petroleum-based transportation fuels and attack government subsidies for electric vehicles, according to refining industry sources familiar with the plan. A Koch Industries board member and a veteran Washington energy lobbyist are working quietly to fund and launch the new advocacy outfit.
http://www.huffingtonpost.com/entry/koch-electric-vehicles_us_56c4d63ce4b0b40245c8cbf6
Ya those sales are in freefall. Must be the evil right wing.
“Those sales are in freefall”
Freefall, at least in Newtonian physics , is a body falling towards another body at an ever-accelerating rate, related to their relative masses. Let’s look at the time-based sales declines and calculate the annual decline rate to see if “freefall” fits.
First, compare monthly sales for the most recent month (January) over the past few years.
Per insideEV’s monthly plug-in sales scorecard: (US sales)
Jan. 2016 : 6,291
Jan. 2015: 6,051
Jan. 2014: 5,680
freefall?
Annual sales:
2015: 116,222
2014: 122,438
2013: 97,507
2012: 52,607.
freefall?
Yes, with very low gas prices and many models in-transition between models, 2015 was 5% lower than 2014, but the long-term trend is not “freefall”.
2016 has all sorts of new models rolling out both domestically and world-wide, with longer range, more varieties, lower prices, and a more knowledgeable customer base. Tesla Model X, Gen 2 Volt. Upgraded Leaf. Chevy Bolt in 4th qtr 2016. All sorts of new PHEV’s. FCA Pacifica mini-van. The demise of “clean diesel” will have a major impact on EV sales in the EU – both BMW and VW group is going all-in for electrified vehicles. The health of the domestic and global EV market is sound and may finally have the momentum of a Victor- Hugo-idea – “an idea who’s time has come”.
That the Koch’s are targeting EV’s with a negative campaign speaks volumes. They actually see a potential threat. But their efforts, and expenditures, probably will be for naught. The EV is an idea who’s time has come.
http://insideevs.com/monthly-plug-in-sales-scorecard/
Look, this is not even debateable.
Go thru that list and exclude everything unaudited by Wards or with a gasoline engine in it.
The Leaf is the poster child. Down 43%. That brand alone kills all of the non gasoline sales.
Stop deluding yourself.
Figure out how to kill the enemy.
A bad idea whose time has come?
Like high-rises? (Among JH Kunstler’s peeves which include car-related/-oriented/-scaled development, which includes sprawl, overpaved farmland, roadkill, pollution/AGW emissions, and problems with scale vis-a-vis the human?)
Or the idea of getting an HVAC specialist to solve problems (sometimes created or exacerbated by HVAC systems, themselves) that could be solved by simply having windows actually open?
Has anyone here got a straight-through link to consultant group “The Hill’s Group”
thehillsgroup.org
email address
[email protected]
Don Stewart
“Stories drive the market, just like our lives, methinks.”
I will go along with this generalization to a certain extent, because the human species really does live by the narrative. Group think rules, to a substantial extent, in the lives of men.
But in the end, people buy as much oil, and as many services dependent on oil, as they want and can afford.
I find it just about impossible to believe that the people running the nationalized oil companies in the Middle East, or the oil companies in Russia, or Mexico, or China or Venezuela, believe that traders can control the price of oil. Traders can BET on what they think the price of oil will be, and they can thus exert great influence on oil companies that are independently owned and operated, in terms of how much they will invest in future production.
But just because the futures market says REAL physical barrels will be available at a X per barrel on a certain date is no assurance at all that such barrels WILL be available. Who ever has the REAL barrels might be able to sell them for considerably more, or might have to sell them for considerably less. The folks holding contracts for paper barrels will either win or lose. Producers who have hedged will know how much they will get for their oil,guaranteed, after settling up their wins or losses on their hedges. That will be the price at which they hedged, minus the actual cost of hedging.
So far, other than arguing that the actions of Wall Street have a big or controlling influence on the ENTIRE world economy, I have not seen any rational argument made concerning just how traders can control the DEMAND FOR OIL. If the demand is there, it will be produced, if it can be produced at a profit.
The low price expectation could vanish like fog in bright morning sun, just like the high price expectation vanished.
Nor have I seen any rational argument to the effect that they can control the investment decisions of Saudi Aramco, etc.
We simply don’t know how fast production might drop off as depletion bites, and as BUSINESS oriented oil companies shut in marginal production, and scale back upstream spending in the face of low prices. We don’t have any RELIABLE way to predict whether the world economy will have a heart attack, or soldier on, for the next two or three years, maybe even perking up a little, or soldier on , just gradually contracting a little.
I must assume that the people who run such oil companies as Saudi Aramco have superb access to the actual DATA involving the geological situation, via their business muscle, and via industrial spying operations. This data access would extend to just about the entire world, so far as the data actually exists.
So they will have a pretty good idea how much oil can be produced at how much cost, and where, barring new technological developments, which usually take a good while to be debugged and widely adopted.
So -If the Saudis for example think oil will be worth eighty or ninety bucks again within the next few years, a straight up business decision on their part would be to continue upstream investment. Of course geopolitical power struggle considerations might trump the business decision, at least temporarily.
If anybody at all has a TRULY RELIABLE crystal ball when it comes to predicting the behavior of the economy, I have not yet heard who they are.
The futures market might be way off. Futures are a win / lose game.
So far I have never run across a convincing example of anybody being able to control the price of any good or service, unless by means of either controlling demand for it, or controlling the supply of it. Gasoline would get to be dirt cheap indeed if getting caught in possession of a gallon of it meant paying a thousand dollar fine. This absurd example is merely intended to illustrate that demand CAN be controlled, if the controlling agency has power enough.
Why should I believe that Wall Street can control demand for oil, specifically ?
Why should I believe that Wall Street can control the behavior of oil producers, especially producers that are not in need of Wall Street money, or controlled by yankee regulatory departments or agencies?
Why should I believe that Wall Street can control the behavior of oil producers, especially producers that are not in need of Wall Street money, or controlled by Yankee regulatory departments or agencies?
They do not control producers directly. Their control is indirect due to the fact that moneywise physical oil now dwarf paper oil and futures contracts and options are allowed to settle in dollars without any commodity changing hands. In other words oil became just another currency and its price is driven up or down using all the dirty tricks of the currency games (See Soros attack on British pound).
Typical USA volume is about one million contracts a day. One contract is 1000 barrels. So one billion barrels of paper oil changes hands daily only in the USA. Add London and other European exchanges and ratio of 1:200 of “real” to “paper” oil is not unrealistic.
http://peakoilbarrel.com/the-ieas-oil-production-predictions-for-2016/#comment-558698
In other words “paper oil” radically changed the game.
It is a foolish argument to think that financial manipulations or trading vehicles can change the value of the underlying (a barrel of oil or a british pound) for more than a short timeframe, if the the market for the underlying is a wide open high volume one.
So, to think that Soros caused the British Pound to fall is faulty thinking. He and his partners just saw the writing on the wall earlier and more clearly than others, and had the balls to take a big risk that they had the timeframe right. Regardless of his trades, that pound was way overvalued relative to other currencies and the market would have worked it down just same (likely more slowly).
Today, the most over-valued big currency is the Chinese renimbi. I just don’t have the sophistication to put a big bet on it, or I would.
“It is a foolish argument to think that financial manipulations or trading vehicles can change the value of the underlying (a barrel of oil or a british pound) for more than a short timeframe, if the market for the underlying is a wide open high volume one.”
I like your faith in the innocuous nature of neoliberal marketplace. As reflected in your statement above. Yes we can. Keep the faith brother !
Another consideration is that there is no market as we used to understand it. Instead there is a financial casino in which due to commodities modernization act the trend down can be fed with dollars and acquire its own momentum like snow avalanche and crush everybody and everything on its way. Amount of dollars that can participate is the amplifying the downtrend (“paper oil”) is much larger then the amount of “”real oil” so it a way it does not matter. Add HFT to the picture (which really can drive the prices down as was confirmed by GS during Aleynikov trial) and you have more or less complete image of the modern “marketplace” were most trades are executed by robots not by people.
Still if “a short timeframe” is 18-36 month you are probably right. But it can be longer, especially if you add some help from Saudis (predatory pricing). I doubt that this situation can last till the end of 2017.
I see this debt cliff as a yet another blowback of neoliberalism, which automatically generates bubble after bubble. Not that different in nature from dot-com bubble of subprime bubble. You see, an effective CEO does all he can to juice shareholder value, often measured quarterly. So, with low or no profits, many chose to borrow money to increase shareholder value by “carpet bombing” fields with wells thereby increasing share price. Or they chose to juice dividends. Those easy money is what created and sustained shale boom. After all they used to have huge hopes for the future.
Now Wall Street is keeping them by the balls as the level of debt does not allow to cut production which would rebalance the market. So this downtrend proved to be sticky. They need all the money they can make to service the debt or they are gone with the wind. In other words they are hostages of their own debt and financial companies which provide it and can’t cut production without severe adverse effects. That actually include not only shale players but such conventional players as Rosneft.
In other words they are no an independent players capable of making their own decisions. Negative cash flow can do wonders with the management worrying about managing their own debt.
See also shallow sand comment in the current discussion dated 02/20/2016 at 3:41 pm (
http://peakoilbarrel.com/bakken-december-data-big-decline/#comment-560410 ).
Which explains “masters of the universe” mentality better then my post:
We are completely Hopeless. This is just unthinkable. First Flint, MI now this:
California Farms Are Using Drilling Wastewater to Grow Crops
http://www.bloomberg.com/news/articles/2015-07-08/in-california-big-oil-finds-water-is-its-most-prized-commodity
There is no way they are going to be able to remove 100% of contaiminates. To use it for Agraculture is just plain insanity. I will no longer be consuming any food that originates from California.
In you eat fertilizer, it will kill you. But, it all seems to turn out okay if the plants eat it.
It is rather unlikely that whatever contaminants are in fracking water will actually be absorbed by food plants and thus eaten by people, but this is a generalization about water pollutants as a class.
It is true however that some metals, metal ions, and some hydrocarbon molecules ARE are absorbed and incorporated by various types of plants. Some of these might be present in drilling waste water in significant amounts.
Whether this use of drilling waste water is a health hazard depends on what it is polluted WITH. I personally have no idea, and as far as that goes, no specific expertise even if I did know.
One thing is obvious, that is that the amount drilling waste water must be miniscule in comparision to the amount of other water used for irrigation, and it will be used as close as possible to its point of origin because water is expensive to transport.
I would worry more about the effect on the soil and water table underneath , over a period of years, than I would about specific associated effects of eating the food grown in California.
The odds of a randomly selected lettuce or pepper from California being irrigated with drilling waste water are probably millions of one against, probably tens of millions of one against.
But I still don’t like the idea of using such water for irrigation. Some people might wind up eating a LOT of stuff from fields irrigated this way. A given grower might sell on a continuing basis to a given local supermarket for instance.That could be bad news for somebody who habitually shops at that supermarket.
I agree that using drilling waste water to irrigate food crops is a BAD idea and a potential public health problem.
But California is a BIG place, and the amount of drilling waste water must be extremely small in relation to the amount of irrigation water used.
The odds of any given tomato, or pepper, from California, having been grown with drilling waste water are probably millions of one against. And even then, the odds are that there would be no detectable amount of absorbed contaminants or pollutants from that waste water, depending on what it is contaminated WITH. There are some things that plants suck right up.
OFM wrote:
“But California is a BIG place, and the amount of drilling waste water must be extremely small in relation to the amount of irrigation water used.”
I partially agree, but is likely playing Russian roulette. How do you know that that the food your eating isn’t from a contaminated farm? I am sure if this made front page news, there would be a major boycott of California produced food.
Clueless Wrote:
“In you eat fertilizer, it will kill you. But, it all seems to turn out okay if the plants eat it.”
The fertilizer doesn’t contain heavy metals and other known toxins that are in Drill wastewater. I would imagine that this will slowly make the fields unusable since my understanding is that Drill wastewater is usually contains dissolved salts.
Clueless, if someone sent you produce from a known contaminated farm, would you eat it? would you like your kids eat it?
My first about drilling water and irrigation comment didn’t post, it probably went to spam and Ron apparently rescued it.
I finished it up with this paragraph:
“But I still don’t like the idea of using such water for irrigation. Some people might wind up eating a LOT of stuff from fields irrigated this way. A given grower might sell on a continuing basis to a given local supermarket.That could be bad news for somebody who habitually shops at that supermarket.”
We are all exposed to quite a lot of environmental toxins, day after day, year in and year out, and yet most of us are still metabolizing. 😉
The odds of any particular person suffering any ill effect from this sort of irrigation are extremely high.
You are far more likely to get killed by an earthquake, or run over by a bus, or to catch a fatal case of the flu. If you spend all your time worrying about all the things that could make you sick or kill you in the environment, you would soon feel compelled to move to Antarctica, or maybe to the remotest part of Alaska.
Your kids are hundreds of times more likely to get a lung disease from breathing the exhaust fumes of the millions of automobiles on the road and from the mercury released by burning coal in power plants, or breathing the second hand smoke from your cigarettes.
Most people, including even technically well educated people , don’t have the faintest clue as to what’s what when it comes to the contamination of food with foreign substances.
THE ONLY THINGS you are even remotely likely to eat in your food in the USA that will make you sick are the intentionally added extra salt, sugar, trans fats, preservatives, dyes, and other such ingredients.
The only real exceptions to this general statement are bacteria that bring on food poisoning, and on rare occasions, parasites from meat not thoroughly cooked.
There is an EXCELLENT case to be made that organic fruits and veggies are actually more likely to cause you to get cancer than the ones grown by conventional farmers using pesticides.
( This is not to say that either conventionally grown OR organic foods represent serious risk factors for cancer, except when consumed to excess as part of an unbalanced diet. )
The scale of agriculture here is unimaginable. And the thirst for water is equally immense. This winter has been good — we’ll see just how good in a month when the rainy season ends. Even so, demand for water is insatiable.
If they use the treated water on just pistachios and almonds, I’m not too worried. I’d like to know just how good the treated water is, but at least it’s not on lettuce (i hope). But population growth combined with climate change and resource depletion will inevitably lead to this kind of thing more and more.
Of course, they could stop growing unnecessary crops like almonds and pistachios, which are very thirsty, but money talks and those crops are very profitable.
“almonds and pistachios, which are very thirsty”
Almonds and pistachios are not very thirsty at all. They are East Mediterranean crops adapted to dry conditions. Almonds are grown in the East of Spain where it rains very little and pistachios are one of the main crops of Iran. Of course, if you water them you can increase the yield, but they are very drought resistant trees.
I stand corrected, I guess. I’m just repeating what I read in the news about those trees and how much water they use. But when I wonder if in Spain they plant thousands upon thousands of acres of the trees in tight formation as they do here. The groves go on as far as the eye can see. I imagine the water is used to maximize yield, which is the whole point of planting them.
Javier,
They sound like olive trees. They will survive extreme drought conditions, but for commercial yield point of view, require up to 900mm of water per year. As olives are normally grown in dry climate the water deficit is made up by irrigation.
Yes. An olive tree can live for hundreds of years, but its peak productivity is like 30-50 years once they are about 8-10 years old.
Now-a-days they are planted as hedges and fertirrigated, so they mature in just 3-4 years, but they only have peak production for 10 years and afterwards they are substituted.
Special machines take care of the olive trees hedges with very little human labor.
But investigations have shown that the best olive oil requires that at certain times during the cycle the trees suffer from water starvation. If the trees have all the water they can take, the olive oil is of worse quality, worse nutrition properties and worse taste.
Almonds alone use about 10 percent of California’s total water supply each year. That’s nuts. But almonds are also the state’s most lucrative exported agricultural product, with California producing 80 percent of the world’s supply.
http://www.slate.com/articles/technology/future_tense/2014/05/_10_percent_of_california_s_water_goes_to_almond_farming.html
I too live in California.
I look at the water a little different than the typical urban dweller (SVObserver)
It is more important to use the water for agriculture than for the 30 million plus people living in the cities.
I say this based on the idea that very few places in the world have as promising a set of factors to produce high yields of food as does the central valley of California. My county alone produces about $5 billion worth of food each year.
Irreplaceable confluence of soil, climate, terrain.
The hordes in their boxy houses could live in other areas, easily. Places less valuable in terms of agriculture.
I am one of those, since although I have a degree in Agronomy, I do not work in the Ag sector. In fact I have a medical technology job that allows me to work from where I choose.
Does anyone know what the status of crude pipelines to haul Bakken oil is? I ask because I believe that the decline in rail car loading is greater than any decline in production. So, I am curious how much of the Bakken oil is now avoiding the extra cost that rail shipment incurs.
The CEO of Devon [which cut 75% of their drilling budget] essentially asked: “Who would ever drill for new production at these prices.” Then Marathon came out with essentially the same thing with their budget. And, EOG will not have any rigs running in ND. I think that Harold Hamm finally got religion over at CLR.
So, the big unknown now seems to be how fast they will complete the inventory of drilled but uncompleted wells. I am sensing an emerging consensus to just bite the bullet and bring production down as fast as possible unless a lender forces the issue.
Clueless you’ve piqued my interest. What do the rail car loadings infer, and where can you access that information.
I agree it seems that a number of the we still make money at (whatever price or lower) operators have capitulated, and they are shutting down now. It may be too little and too late for a large number of operators domestic and international. How long it will take for the effects of lower capex and depletion to clear the market, and who will be left are big questions now.
Of course, there are two ways to assist clearing this market. Opec can hold back production, or consumer nations could pull some barrels off the market. If we were to add to our strategic petroleum reserve now, we would be better off when the current glut has run its course, and prices go up up and away. While reserve additions might not be enough to solve the problem, they sure would not hurt.
Clueless,
There are two now pipelines in the works, which I believe will take care of any rail capacity that is now in use. The last I read, they were waiting for various approvals, but are looking to be on line in about the next 12 months, This is off the top of my head, when I get some time, I will look up some references.
When they are online, it will direct Bakken oil to the gulf coast, then Jones act ships to the east coast, will be cheaper than rail.
Clueless,
Here is an RBN link, that sums up the current state of play.
New pipelines coming in 2017, take or pay contracts on rail.
https://rbnenergy.com/slow-train-coming-why-bakken-barrels-stay-on-the-tracks-as-crude-by-rail-volumes-decline
Baker rig count is out. Another 27 rigs are gone
The Baker Hughes Rig Count below.
For those interested in Bakken economics, take a look at Enerplus release today. Very good and detailed information.
The same pattern, yet another company. As in “No one wants to die” (Steve Jobs).
http://investors.enerplus.com/2016-02-19-Enerplus-Announces-Strong-2015-Results-Low-Cost-Reserves-Additions-and-Reduced-2016-Budget-and-Dividend
Note assets sales and 10% drop in production forecasted for 2016.
Shallow Sand,
Whiting announced today that they are suspending the drilling of 20 wells in the Bakken.
And this, just in: ExxonMobil’s reserve-replacement ratio for 2015: 67%.
First time in 22 years it hasn’t been at least 100%.
Syn,
Usually when Exxon, can’t be bother drill exploration wells, they go drilling on the corner of Wall and Broad St NY.
Obviously the prognosis is not looking so good there as well!
Pusher,
Yep. Obtaining reserves with the drill bit is so last century.
Ron,
a few comments of mine got lost somewhere…
…can you help?
be well,
Petro
btw HFT engines don’t read stories. Generally just headlines.
Anyone with knowledge of the industry care to chime in on which companies are most likely to survive this low price environment, based on things like low debt, strong cash flow, the best assets- human and otherwise?
I think the major integrated companies will survive. I think Oxy will prosper. Oxy is one of the largest producers in the Permian and a leader in Tertiary Recovery ( although that sucks right now). It’s just my opinion but all of the unconventional companies have a little red target on their backs. Few of the Oklahoma based companies will survive in their present form.
John S. Is OXY on the hook for California Resources debt?
Not to my knowledge. I think they managed to stick the CR shareholders with the debt.
Oxy recently closed a very interesting deal with SandRidge to take SandRidge out of the West Texas OverThrust. Oxy has embarked on. 10 well CO2 program in Pecos County that is earmarked for its Century Plant .
Several years ago when it committed to build the Century Plant in a SandRidge JV, Oxy told analysts that when the Century Plant went on line that Oxy would immediately book an additional 500 million barrels of proved producing reserves and increase its daily production in the Permain by 50,000 barrels / day.
Oxy and the West Texas Overthrust bears watching in my humble opinion.
Where can I find OXY Moodys or other credit rating? Would love to see a chart of all Credit ratings.
Just look at these charts and find the ones with the least bank debt to 50% of ’14 SEC value:
http://seekingalpha.com/article/3753016-e-and-p-borrowing-base-scorecard-4th-quarter-long-banks-punt-deep-2016
That doesn’t mean those are necessarily the best companies but the way the game is rigged bank debt provides liquidity so the more of that available the longer they can last.
Kellyb. Raw Energy’s articles on Seeking Alpha are among the best.
For all interested, note in the article the tables showing debt to PV10 (2014 SEC value) and then debt to 50% of 2014 SEC PV10.
I am sure Raw Energy will update the tables when 2015 number are released.
As I have repeatedly indicated, 100%+ debt to PV10 means technically insolvent and 60-65% debt to PV10 should mean no ability to finance with banks.
It is looking like a slow, painful death for the US industry. I have also continuously maintained the only savior will be a OPEC cut (or major supply disruption).
Just look at the losses E&P is reporting for 2015 with $50 WTI.
Shallow sand,
I notice the PV10s I’ve seen come in thus far have been considerably worse than 50% of ’14 SEC. Many of them are down around 70%. DNRs was down 74% and they’re mostly PDP with CO2 and waterfloods. How exactly is a PV-10 calculated? I understand the 10% discount but do you just take revenues – lifting & development costs or does it also account for G&A and interest?
Kelly b. From what I have read on the subject G & A and interest is not included.
Income taxes are included in standard measure. However, standard measure is usually not the PV10 calculation companies and investment banks reference.
Also, plugging and abandonment costs are included. However, you will note practically every SEC reserve report estimates p & a = equipment salvage.
Mike and Rockman get a chuckle out of that one I am sure.
Google FASB Accounting Certification Standard Topic 932. Shows exactly how to calculate.
I have thought about buying reserve software and doing my own calculations, but right now don’t think I will spend the $$. Plus, only dorks like me seem to care about PV of future cash flows. LOL. CAGR, IRR and EBITDDAX people seem to get invited to the cool parties. LOL.
One of my friends who is in marketing has a Far Side cartoon in his office. It says something to the effect of “marketing meeting” on one sign and “two drink minimum” on a sign immediately below.
I think that cartoon could be modified to “shale investment presentation” without missing a beat!
According to NASA, the global surface temperature index for January 2016 reached 113 or 1.13 degree C warmer than the 1951-1980 average
And the heat is most pronounced in the north, particularly in the arctic where vast amounts of methane is teetering on the brink of release.
Queue the deniers. Folks this is for all the marbles so ….
Cool down, just like the Pacific is doing:
http://www.cpc.ncep.noaa.gov/products/NMME/current/images/nino34.rescaling.ENSMEAN.png
I hope this isn’t the foolish David Archibald that thinks he is smarter than the entire global climate science community ( and the US Navy, and the Russian Military, and NASA…..).
I seriously doubt the US Navy and the Russian Military (building military bases in the arctic) are in a conspiracy together! GOOD GRIEF!
Anyone with basic common sense can understand the greenhouse effect if they aren’t (for some diabolical reason) motivated to misunderstand it.
Jef, those of us who don’t think that man is changing the climate, don’t doubt the climate can change. Don’t get the 2 mixed up. But those of us who argue on behalf of real science protest when the government or the government’s scientists declare the entire debate over and the science settled. For I would say most knowledgeable folks know that for a science to be real, it must always be open to discovery, not hidden away with data and models that are kept secret. So frankly I find it really slanderous to declare that because we don’t believe in the Anthropogenic aspect of climate change that we’re somehow evil people. We just believe science shouldn’t be used to try to scare people in to doing one thing or another but to improve quality of life around the world and find new energy sources. We don’t want to unnecessarily use politics of fear to strip the American public of its liberties or stifle Freedom by controlling everybody’s lives under a false pretense. I also can assure you that our air, waterways, and oceans are much cleaner today than they were in the 1970’s when pollution was all the talk and I was serving in the United States Air Force. And I bet every one of us here is all in favor of having clean air and water. We just didn’t have to throw around the words “global warming” to get it done back then, and we shouldn’t have to today either.
Good god…that is absolute biased bullshit disguised as an “honest” attempt at reasoned thought.
We don’t want to unnecessarily use politics of fear to strip the American public of its liberties or stifle Freedom by controlling everybody’s lives under a false pretense.
No of course not! People like you would only want to do that when it becomes necessary! Which is when your personal world view and interests are threatened.
Do you work for these guys by any chance? Because it sure sounds like you do!
Koch Brothers Declare War On Electric Cars
https://goo.gl/DsWhte
I demand the “liberty” to piss in your soup.
Troll alert.
This is called a Gish gallop.
Predictions, forecasts or concerns for the effects of humans on the climate don’t have to be ‘settled’ to be proven correct or to be a source of serious concern.
And yet you appear to be doing exactly that by your sentence here; using ‘politics of fear’ by suggesting the stripping of liberties and the stifling of freedom under what you claim is a false pretense.
Ironically, some people’s conspicuous (and peculiar) appearances– out-of-the-blue politically-loaded [‘American liberty’; ‘right-left’; ‘Democrats/Republican’; etc.] comments from relative unknowns that arrive from, and are precisely targeted at, anthropogenic climate change or anthropogenic global warming articles and comments– appear to go against their own apparent case by underscoring/highlighting the potential seriousness of the issues.
Bravo. Keep up the good work.
This makes me think of a kind of lighthouse– a beacon along the stormier seas and craggy disappearing shorelines of anthropogenic climate change.
Sometimes things can work counterintuitively.
Like controversy-as-promotion. Like guerrilla marketing.
Like ‘wardrobe malfunctions’ or ‘twerking’ by previous-unknowns. Tits-and-ass: They’re a fundamental. (How do you work it in without appearing obvious? One answer: You ‘twerk’ it in.)
Like forum-/comment-targeted drive-by politically-loaded so-called AGW-denialism.
But sometimes some can’t scream any louder if they tried and had a battery of searchlights pointed at the sky.
Oh well…
Jef, the heat this year is largely due to El Niño, and thus neither anthropogenic warming nor climate warming, but weather warming.
According to models El Niño will be substituted by a strong la Niña by 2016 Fall. Expect a cooler 2017.
However as the cooling will be deemed natural, the warming is being labeled as anthropogenic. Ironic, isn’t it?
ENSO forecast by NOAA
So not entirely then?
Cooler than what/when? The warmest year on record?
Seems like you’re cooking your comments, Javier. (JCW)
“So not entirely then?”
Nobody can tell. We just know that strong El Niño years are much warmer than average.
“Cooler than what/when? The warmest year on record?”
Cooler than average.
“Seems like you’re cooking your comments, Javier.”
Just providing some facts. Some people prefer storytelling.
“wait for the global cooling to kick in” – Javier PhD
you’re a living joke.
You don’t understand natural cycles. From 2017 to 2030 there is not going to be any warming and we could see net cooling. I rather don’t see any cooling because where I live we are now much better than in the 70’s, but that is what nature is telling us.
It is funny to see alarmists so happy that we are breaking temperature records, and deniers so happy that La Niña is going to bring cooling. It should be the opposite, but it looks that for most people winning a meaningless debate is more important. Alarmists should be rooting for cooling, but there you are, hoping I am wrong and we get more warming so you are correct.
Who exactly is trying to win a meaningless debate?
For someone who claims to specialize in biology, rather than climate, and claims a debate to be meaningless, you sure seem to be putting a whole lot of inordinate and questionable effort, which feels couched in subterfug, toward this issue of anthropogenic global warming.
Leaving out your clearly biased judgements, Caelan, I am not interested in the debate that is taking place in US politics about climate change, since I care zero about US politics. I have no skin in that debate.
As a scientist I am moved by an innate curiosity and desire to know the truth. I did not get into science to know only about my limited specialty. Climate is a difficult problem and thus I am attracted to it, but by no means is the only scientific issue that interests me outside my field. I am also very interested by evolution, history, agriculture, economy, the origin of our species and many fascinating issues, on which I put my brain to work, to learn.
As I said many times I do not come here to discuss climate but to learn about oil. But knowing as much as I know, I do not like so much alarmist disinformation being spread in a totally unscientific way. I am thus compelled to set the record straight, the same others are doing with oil related issues. I obviously do not expect any recognition from climate jihadists that try to spread here their religion.
Oho
Cooler than the average of what?
If an El Niño is a warm phase, where it tends to cool off afterward relative to it, would your ‘cooler than average’ forecast be a bit less of a forecast; a bit of a no-brainer/goes-without-saying and a touch misleading/disingenuous in the context of AGW and your response to Jef?
Oho
Caelan,
You seem to be having problems to understand even the simplest things so I will put a figure.
The average in that figure is a 37 month running average, but any average larger than 30 months would do, because El Niño or La Niña usually don’t last more than 2 years.
Vertical arrows indicate where El Niño phenomena increased temperatures above average, and circles indicate where subsequent La Niña cooled temperatures below average.
Current El Niño and predicted following La Niña are very likely to show the same temperature behavior.
Now, let’s see if you get this. ENSO (El Niño Southern Oscillation) is not considered climate but weather, as climate is considered long term changes in the pattern of weather, not seasonal ones, and ENSO is considered natural variability in the weather. As far as I know IPCC does not believe that ENSO is a cause for global warming, as it is all anthropogenic for them, and they don’t even know what could happen to ENSO due to further warming (see ENSO + Climate Change = Headache).
When I tell Jimmy about climate cooling for the next decade and a half I am not referring to the coming La Niña. What La Niña could do is to restore the pause by putting temperatures again below average. The Sun hasn’t had this low activity in 100 years. This is going to be a cooling factor that is not properly accounted for.
The warmest El Nino year on record means El Nino on top of a warming trend.
As with the last time we had a discussion about comparing recent global temperatures to the temperatures of an historical average, we have to be mindful that such comparisons aren’t always fair or provide a one-to-one equivalence. That is due to the changes in the accuracy of hydrometeor instrumentation over the previous century and beyond of instrument manufacture as well as certain discrepancies that do come up from time to time regarding the exact placement of said instrumentation, either in the present time or in the past.
Refer to the comments previously made here: http://peakoilbarrel.com/opec-except-iran-has-peaked/#comment-556675
On a related note, a colleague recently shared with me the work of a man named Klaus Hager. He is a veteran meteorologist from Germany who is worth investigating if you have any sort of interest at all in the general history of 20th Century temperature recordings. His work includes an eight and a half year study in which he placed dozens of old-style mercury thermometers side-by-side with modern thermometers at an observation station in the Bavarian city of Augsburg.
The startling findings from the study showed that the new instruments on average recorded temperatures 0.93°C higher than the old instruments. Even more intriguing are the implications concerning the temperature records of Germany, as the old Hg thermometers had been the accepted way of recording temperatures in the country up to 1986, when they began being replaced by the newer, “warmer,” thermometers. The changeover was completed at all German observation stations by the year 2000.
From your link:
Further down…
LOL
El Niño reached the Tropical Pacífic peak in December, now the water temperature anomaly should drop. The troposphere should heat the peak in April and after that all indexes should dive down into La Niña conditions.
I’ve been chuckling as the current Niño impacts temperature and we see all sorts of excited comments about high temperatures. Now I wonder if the dropping anomalies will be reported with the same enthusiasm?
What may happen next is that subsequent ‘La Niña conditions’ may bring, in part, an increase in Atlantic hurricanes in 2016 and/or soon thereafter, as, from what is understood, El Niño (‘modoki’ notwithstanding) acts, or can act, to suppress hurricanes, so that’s where your enthusiasm may displaced to.
So, while 2017 may see cooler temps on average as per ‘La Niña conditions’, it may also see an increase in other forms of AGW anomalies, their effects which may include flooding and general damage to trees and human infrastructure.
I was hoping to see Freddy, come in with his GOR and WOR graphs.
After last months increase in legacy production, it would be interesting to see the results!
Hi,
I was actually not planning to share anything this month. Maybe it´s not interesting to see the graphs every months as the changes are not that big. But if you are interested, sure.
The legacy production did not increase in December. It decreased for all years except 2008. The initial production from new wells have been high the last three months. There were just not enough new wells put on production to make up for the loss from old wells in December. Number of new wells put on production (conventional plus unconventional) was 72, 77, 80 October to December according to my data.
In the GOR graph bellow we can see that it has not increased much or even decreased except for 2014 since last month. BUT because it shows the profile, every data point contains data 12 months back as the age of the wells need to be of the same. So it´s not a good graph for showing what has happened lately. I will show a better graph for that.
This graph shows average GOR by date by wells of any age grouped by the year it started production. GOR is still increasing for most years.
Here is the water cut profile graph.
Weird, it’s almost as if all those later wells were interconnected via their fractures? They are hovering at 45 % water cut?
Yes that is a thought. But why not the ones before 2010/2011? The new wells should be drilled close to them too. Weird indeed.
How about increased stage count needing a lot more water in later years?
Something that could interesting to see is how the GOR distribution looks like for the wells. I made it last month but I don´t think I published it.
Here is what it looked like in January 2014. It´s not cumulative production, it´s just what it looked like that particular month.
I didn´t bother to make one for December as the changes should be small. So here is what the GOR distribution looked like in November. You can see that it has moved to the right compared to January 2014.
The effort to capture gas is relatively young. Might be progress on that rather than geology. Unless they measured and reported what they flared.
It´s gas produced, not sold.
I bet the gor for the low gor population is mismeasured. Or misreported.
GOR can vary quite a lot for individual wells from month to month. I can show you one example of a well that had a GOR of 0,08 in January 2014. GOR is 1,13 in Dec 2015.
The table shows date, oil ,water, gas. It´s the total for the month.
WERRE TRUST 44-34H, XTO ENERGY INC., 18294
DUN, BEAR CREEK, Three Forks
3/2010 14973 10280 6188
4/2010 25850 6592 16800
5/2010 14895 4189 16592
6/2010 14895 2411 11382
7/2010 9181 2004 9617
8/2010 6961 1690 8783
9/2010 8649 1524 0
10/2010 335 117 8997
11/2010 6693 1129 0
12/2010 8987 1455 8164
1/2011 7101 1278 7046
2/2011 6208 1084 6227
3/2011 6601 1206 6662
4/2011 5794 1054 5748
5/2011 5497 976 5406
6/2011 4945 866 4744
7/2011 4747 874 4604
8/2011 4344 831 4143
9/2011 3854 653 3628
10/2011 3465 565 3647
11/2011 10744 2138 12242
12/2011 3368 795 3545
1/2012 7812 1682 8722
2/2012 7146 1572 8616
3/2012 7048 1625 8943
4/2012 6418 1535 8420
5/2012 6148 1537 8073
6/2012 5660 1435 7459
7/2012 5137 1298 6657
8/2012 4859 1158 5499
9/2012 4224 1005 4750
10/2012 4306 1027 4478
11/2012 4862 1168 5500
12/2012 2449 624 2437
1/2013 2118 393 1702
2/2013 3988 1062 205
3/2013 5419 1310 500
4/2013 5002 1223 370
5/2013 4315 1005 305
6/2013 2979 748 145
7/2013 4136 938 990
8/2013 3819 832 579
9/2013 3390 738 280
10/2013 2977 668 225
11/2013 3477 777 290
12/2013 4365 1068 290
1/2014 3791 840 295
2/2014 1901 458 2423
3/2014 0 0 0
4/2014 1900 308 655
5/2014 5197 1453 1676
6/2014 3779 852 1954
7/2014 3847 1157 5532
8/2014 3649 792 4207
9/2014 3270 790 4411
10/2014 4251 1038 6770
11/2014 2748 662 3955
12/2014 2625 545 3291
1/2015 92 0 13
2/2015 0 0 0
3/2015 0 0 0
4/2015 0 0 0
5/2015 0 0 0
6/2015 0 0 0
7/2015 0 0 0
8/2015 0 0 0
9/2015 7623 6719 7857
10/2015 10165 10450 11112
11/2015 11991 9804 14084
12/2015 10563 7415 11985
Here are the pdf files the data comes from:
https://www.dmr.nd.gov/oilgas/mprindex.asp
They reported no gas produced 9/2010 and 11/2010. Yeah right.
It appears as if some companies have reported the same value for gas as for gas sold. That could of course explain some of the increase in GOR if a higher percentage of the gas is sold as Watcher pointed out. But GOR started to increase a lot about when the price dropped. So I don´t think it´s a major contributor.
Moody’s drops another hammer with eight more ratings downgrades
“Moody’s says it has downgraded a total of 28 energy companies since December, including another eight yesterday.
Anadarko Petroleum (NYSE:APC), Continental Resources (NYSE:CLR), Hess (NYSE:HES), Murphy Oil (NYSE:MUR), Southwestern Energy (NYSE:SWN) and Western Gas Partners (NYSE:WES) were cut to junk levels.
National Fuel Gas (NYSE:NFG) and Noble Energy (NYSE:NBL) were lowered to Baa3, one notch above junk.
Outlooks for Cimarex Energy (NYSE:XEC) and EQT Corp. (NYSE:EQT) were confirmed above junk without downgrades, while EQT Midstream (NYSE:EQM) was affirmed in junk territory but not downgraded.
Moody’s says weakness in prices for crude oil and natural gas has caused a fundamental change in the energy industry, whose ability to generate cash flow has fallen substantially – a condition Moody’s believes will persist for “several years,” so it is in the process of recalibrating the ratings of many energy companies to reflect the industry shift.
More downgrades are sure to be on the way following last month’s move by the ratings agency in placing the credit ratings of 120 energy companies and 55 mining companies from around the world on review for possible downgrade.”
Thanks Freddy,
Looking at your Graph #& graph #2. As I understand it they both using the same numbers, but just using different start points on the x axis. If this is the case, in graph #2, we have 6 years, 2007, 08, 09, 12, 13 & 14, increasing GOR in the last month, where as Graph #1 differ significantly.
Can you please show me what i am not understanding.
Anyway, graph #2 makes it seem as though the trend of rising GOR is continuing.
No graph 1 and 2 do not show the same data. Graph 1 shows the profile which requires the wells to be of the same age in the same data point. Graph 2 shows the data for a particular date and does not care about the age of the well. For example the 2014 curve in the first graph has the last data point 12 months after first production. The wells from January 2014 were 12 months old January 2015 while the wells from December 2014 were 12 months old December 2015. So if you are interested in how GOR changed in December compared to November, then only 1/12 wells in the last data point comes from the December 2015 data. I think the second graph is the most interesting one for you.
Freddy
Those numbers are about as clear an example of the halo effect as you can get.
There is no possible way to go from 700 barrels of produced water to 10,000 barrels unless it is flow back from a nearby, Newly frac’d well.
The accompanying tripling of oil and gas output displays this.
I did a quick check on the ND DMR Gis map and it shows this well is on a now-four well pad.
It is a certainty, verifiable by checking the production records, that the three new, adjacent wells were frac’d and brought online during the time this well was shut down.
I know extremely little about natural gas production.
The rig count at 100 has never been so low.
How is it possible that monster wells in PA and OH can keep prices at a level where virtually all gas in the US is being produced at a loss on an operating basis?
Oilpro.com had an article about the EU importing LNG from the US and Australia, in order to reduce their reliance on Russian gas. My response:
Based on production and consumption data through 2014 (BP), and ignoring changes in storage volumes, in 2014 Russia had net natural gas exports of 16 BCF/day, Australia had net natural gas exports of 2.5 BCF/day and the US had net natural gas imports of 3 BCF/day. So, as of 2014 anyway, combined net natural gas exports from the US + Australia would be approximately zero.
And as I commented on another post, a couple of years ago Citi Research put the gross decline rate from existing US gas production at about 24%/year. This would be the rate of decline in the absence of new wells. Note that Louisiana showed a 20%/year net rate of decline in total marketed gas production from 2012 to 2014 (this was the net rate of decline after new wells were put on line). So, the Louisiana case history would seem to confirm the CIti estimate.
The estimated volumetric loss of US gas production from existing wells, about 17 BCF/day per year, matches or exceeds the 2014 annual dry gas production of every country in the world, except for the US & Russia (2014 BP data).
So, while the Marcellus/Utica Play has some very impressive wells, in round numbers it seems likely that we need the productive equivalent of a new Marcellus Play every year, or the productive equivalent of all of Qatar’s gas production every year, just to offset the declines from existing US wells–as the overall US rig count has declined about 70% from the rig counts we have seen in recent years.
Thanks for keeping the facts flowing.
We get a distorted view also our side of the pond.
I know that USA will not suddenly “run out of NG” but it does feel sometimes like I am watching an oldfashioned egg-timer.
best
Phil
Jeffrey,
The big question mark is Australia, I think. The Gorgon field off West Australia is coming online–that’s Chevron’s, I believe–and there are other projects that are still in development. The last I read, a couple of months ago, Australia’s LNG production and export was supposed to surpass that of Qatar. Or maybe that was supposed to be Australia plus the US. It’s worth looking into.
Syn,
Jeffrey’s, 2014 figures do not include any of the new wave of Aussie LNG plants. Santos, Origin and BG, have all had/have 2 train LNG projects under construction. A Japanese company is working a large project called Ichthys, 9 m ton /year. Gorgan is 15 m ton/year. If you include PNG, Exxon/Oil Search, have also brought on line 2 trains, and plan a 3rd.
I see a lot electricity being generated by Nat gas in the North hemisphere, to consume all this LNG, and help counties with their CO2 emissions.
As I understand the CO2 accounting, Australia wears the CO2, to liquefy the gas, while the consuming country books the savings on CO2, from burning coal to Nat gas. As we all know, suppliers of commodities are suppose to be 3rd world countries, and we all know, 3rd world countries do contribute to the CO2 in the atmosphere! /sarc off
Toolpush,
Shhh…You’ve figured it out but don’t SAY it so loud.
Shallow,
I know a little about natural gas production but over the last 8 years I have found that I know very little about natural gas “markets”. But I think we both agree that everything in this business has been hugely distorted over the last 8 years or so.
I fault the business model for a “high IP reserve” quick declining production company that will be flipped in 3-5 years to a greater fool. I loath the Oklahoma companies and their business practices which have been adopted by many Texas companies and the bastardization of regulatory practices which have enabled the “get rich quick” pursuit of yield at any cost for all but a select few executives and investment advisors.
Personally, I am overjoyed to see NG rig counts at a historic low. I think the train is about to run off the tracks. There is simply no possibility that 100 rigs can drill enough rock in a year to replace the reserves produced on an annual basis. And if annual production is not replaced each and every year then we are SELF LIQUIDATING!
I am very suspicious of these so called monster wells in the Maecellus and Utica. I am willing to admit that some exist but am very doubtful that repeatable wells exist on the scale claimed by that the cheerleaders.
Free money in my opinion caused the market distortion between natural gas and crude oil pricing. I think the historical price ratio might be restored so if gas is marketed for $2/mcf then oil will be priced around $20/bbl. If Heinrich is right about natural gas and the gas recovers to $6-8/mcf then maybe we will see oil priced at $60-80/bbl.
So after my rant, let me just say that I personally see light at the end of the tunnel. I just hope that I’m not standing on the wrong track and that that light is a train headed straight for me.
John S. I agree but many of the financial people do not.
A friend of mine who is a financial person predicted $20s oil in 2013. I told him he was nuts, explained to him costs. He said he could care less about costs, said price has to revert to historical norms.
He now says oil will average below $35 for at least the next five years. I tell him that will bankrupt almost
all US producers and many nations. He says doesn’t matter, that stuff is not relevant, not even a part of the equation.
I would say he is full of it except he predicted $20s. He says oil producers in no way determine oil prices, that prices are all determined by traders. He says traders do not care about anything concerning the upstream industry.
I do not agree with him, but this is the way financial folks think. And they are the ones trading the oil futures.
Ron, you were in the financial industry. I assume you agree my friend is full of crap?
Of course he is full of crap
He says oil producers in no way determine oil prices, that prices are all determined by traders. He says traders do not care about anything concerning the upstream industry.
Producers do not determine prices but their production does. That along with demand. The upstream industry (production) is half the equation, downstream demand is the other half.
And yes, I agree, your friend is full of crap.
Hi SS,
ASK HIM if he can name ANY industry that has survived running at a loss, long term. A bottle of good whiskey says he cannot.
The only way oil can possibly stay cheap long term is if the world economy goes to hell in a hand basket. New tech and efficency and substitution of other energy sources are NOT coming on THAT fast, and WON’T come on that fast.
If the economy goes downhill, steadily , so as to reduce the consumption of oil FASTER than legacy oil production declines, THEN the price will stay low for as long as this scenario holds true.
The question is how much new production will come online to offset legacy declines, assuming the economy holds up.
This is not an easy question to answer, because apparently Iran and Iraq both apparently have the ability, if they are lucky , to bring a million or two barrels of new cheap production, maybe more, to market.That could wipe out one years legacy production decline.
And there are some big upstream projects started well before price crash that are nearing completion, and that will be produced, if they generate any net CASH , at current prices. How much new oil might come to market from these projects is anybody’s guess.
The price ain’t gonna go up much , for long, until either production falls off some, or consumption grows some, or both.
“I just hope that I’m not standing on the wrong track and that that light is a train headed straight for me.” ~ John S
“Hope in reality is the worst of all evils because it prolongs the torments of men”
~ Nietzsche
Be well,
Petro
John S.
I believe Heinrich predicted $20 /mcf last July, for the end of 2015. He has since recanted the time frame, by 6 months. I do not believe he recanted the $20/mcf. I challenged him that this could not happen, but he stuck to his numbers.
BTW, current Nat gas price =$1.80, storage at record levels for this time of year, NE production hitting record number as per Bentek. It is hard to see high prices until after next winter.
On the other hand if the shale plays decline as Jeffrey Brown suggests, $8 /mcf Henry Hub price may be possible, but the electricity industry will be burning a lot more coal, rather than gas, and every shipload of LNG on the water will be heading for the US and all of the brand new US LNG plants, will be mothballed, just like all the regassifcation plants have been in mothballs for the last 5 or so years!
Toolpush,
I am still behind my forecast as I think the fundamentals even have improved over the last half year (future markets went into backwardation).
However timing is difficult as this depends very much on the bond market, which finances production. The bond market has finally collapsed last December and drags down merciless the whole US mining sector including oil and gas production. (see below chart)
December RRC Texas numbers, which came out recently, show already a massive 29% year over year decline of condensate production. Although the numbers will get revised, the monthly decline stands at around 5% per month for most products in Texas including natural gas. Referring to the recent decline of rig counts, this trend can only intensify.
Timing is difficult as there is very much at stake and companies are fighting ferociously. It is exactly the unbreakable attitude which delays the market turnaround, yet increases the damage even further and makes the future recovery more intense.
The warm winter in the US also had an effect on gas storage.
Heinrich – All that chart says to me is that those two parameters are not correlated in any way. Is that the point you’re trying to make?
I don’t know the history of $20 / mcf prediction but if it is sustained not only will power plants switch to LNG and coal you’d see a switch back to oil as well, unless you’re expecting that to go to $150 and above at the same time? And I’d imagine most of the economy would be hit hard by power costs, so oil demand would be shrinking. Tar sands rely on cheaper natural gas for energy in primary recovery and upgraders – i.e. a lot of there (ex) profit was arbitrage from converting NG contained energy to oil contained energy – they’d be on their knees at that price, not just wavering a bit like now.
George Kaplan,
My graph shows all the three bubbles of the last decade – internet, housing and now the shale bubble.
The internet and housing bubble did not influence oil and gas production as at this time the shale industry has been very small.
However, over the last year there is a strong inverse correlation between bond market yield and the oil and gas production index. I will show the graph around summer again and by then I am sure you will understand what I mean.
Heinrich, you say: “I am still behind my forecast as I think the fundamentals even have improved over the last half year (future markets went into backwardation).”
I think that you are talking about nat gas. But, backwardation is when the front months are priced higher than the back months. And, that generally would be bullish because the market is saying I need the product NOW. So, if you put it into storage, you will lose money because the future price is lower.
Contango [sometimes referred to as a carry market] appears to be in place for nat gas. Contango is when the front months are priced lower than future months. That is generally bearish because the market is telling you that it does not want the product NOW. So, it tells you to put it into storage now and sell it in the future for a higher price. Full contango is when the higher amount that you receive in the future is greater than your cost of money + storage fees. When it is much larger than that, the market is telling you that it is getting harder to find storage and you may just have to stop producing. Think of like right now putting excess oil into floating tankers – a very high cost, but worth it if the contango is great enough.
Obviously, there are other factors involved, but the above should give you the general idea. Many people look at contango and, erroneously I believe, think that it is primarily telling you that people are speculating that the price will rise in the future.
“How is it possible that monster wells in PA and OH can keep prices at a level where virtually all gas in the US is being produced at a loss on an operating basis?” ~ Shallow Sand
-You continue to think and analyze the situation the old fashion way: supply-demand fundamentals.
That is why you are (continue to be…) puzzled!
-This time is different (as I explained “thusly” numerous times before).
The way things stand at the moment, price upstream means very little to price down stream…
Be well,
Petro
See my post about above Petro.
I did…
…thanks.
Be well,
Petro
Year 2014 production by formation:
http://www.dmr.nd.gov/oilgas/stats/2014Formation.pdf
There are 3100 wells in the Williston Basin that are producing 40 bpd and less, if they all are producing close to the forty barrels per day, the shutting of those wells will reduce the production by some 120,000 bpd, maybe. Daily production would fall to one million bpd and maybe even close in on 900,000 bpd with decline.
Madison Formation wells and Red River Formations have produced plenty of oil over the years, nothing like the Bakken though. If you view the pdf, the production for each formation is right there. Bakken well horizontals are known to fill up with sand, so you have to keep pumping oil to prevent plugging the horizontal. You will need two hamsters in the wheel to make it go faster.
Madison Formation oil is a heavier oil than Bakken oil, the classic dark green gray color of the oil is there, it is oily oil, clings to the side of the jar, not the light stuff like Bakken crude. A distinct color difference between the two oils.
I have never seen an oil sample from the Red River Formations, so I have no idea what the oil would look like.
Rolls-Royce jet engines:
http://www.rolls-royce.com/products-and-services/civil-aerospace/products/civil-large-engines.aspx
It’s Saturday, so it is almost beer time!
Nice looking car.
http://www.wired.com/2016/01/gm-electric-car-chevy-bolt-mary-barra/
Evolve this to a car that has an easily/quickly swappable battery pack and then provide the ‘swap station’ infrastructure, and I could see evolutions of this car being very useful for use by Uber/Lyft/similar companies’ drivers and for Zipcar-like fleets.
All that will be mighty handy to serve commuting and error-running needs for the time when oil production unambiguously declines.
Of course, some folks with enough disposable income will own their very own handy little electric rides.
Folks who live out in rather rural areas will still likely need ICE vehicles, as will people who truly are farmers, ranchers, and construction workers.
Urban/Suburbanites will be able to rent longer-range roomy ICE vehicles for the occasional road trip to the State/National parks or to Grandma in the woods or to WallyWorld or whatever.
Changing circumstances will drive new paradigms.
It will not be driven by ideology, or world-view, but it will be driven by reality.
Agreed about the Bolt, and the need for a swappable battery module.
I wouldn’t buy one until it had a swap-out feature.
It would also help with sales and market penetration if the swap-able battery was leased to the purchaser, rather than having to be purchased along with the car.
Everybody who needs lots of horsepower for long periods of time, such as tradesmen hauling heavy loads of tools and materials long distances and people running construction and farm machinery will have to depend on the ICE for another decade at least and maybe forever. We just don’t know how good batteries may eventually come to be.
But the large majority of rural people don’t live all that far from the nearest town, where they usually work, if they commute, and where they do most of their shopping and see their doctor etc in any case.
An electric car with a two hundred mile range will meet their needs almost every day of the year.
Personally I just don’t see battery swapping as ever being as practical and economical as just having plenty of fast charging stations and charging up mostly at home.
It’s hard to say how much the peak use hours of HIRED cars might vary from the peak use hours of personally owned or leased cars, but my guess is that we are always likely to have a morning and afternoon rush hour with a smaller noon rush as the prevailing overall pattern.
It will be damned near impossible to put more than a hundred to a hundred and fifty miles on any car during these rush hour peaks in traffic, if it is used in a high traffic area.
So there will be plenty of time to recharge such a hired or even autonomous car between the morning rush and lunch rush, and again before the evening rush hour.
Recharging will work just fine imo for almost everybody, once plenty of recharging stations are available, and my opinion is that they will be built just about everywhere, as a matter of necessity, in order to MAINTAIN the customer base, at some point. Eventually the typical driver is going to avoid a shopping mall or hospital or apartment complex without charging stations the same way we avoid places these days if they don’t have public restrooms.
Charging stations aren’t exactly CHEAP, but compared to battery swapping stations they will be DIRT cheap. The space requirements are less by a mile, and no paid attendants are necessary. Hardly any money need be tied up by the owner operator compared to a swapping station. Don’t forget swapped out flat batteries will have to be charged, just like ones charged in the car.
Charging connector cables can be easily standardized, and the rest of the charging process can be tailored to the car in question by software, thus easily updated as new cars with differing charging requirements come into the market.
Swapping will require standardized battery dimensional packages , standardized mounting systems, and Sky Daddy alone knows how much in the way of automated lifts, storage racks, money tied up in batteries kept on hand to manage say five or six customers showing up in short order, etc.
Those of us who simply cannot tolerate waiting twenty or thirty minutes to top off our electric cars will have the option of driving plug in hybrids.
A plug in hybrid will still enable most of us folks who have to drive long and hard on frequent occasions to cut their overall gasoline consumption by half or maybe three quarters or even more. In five years a plug in hybrid will probably run on the battery at least sixty miles, meaning a person with a two hundred mile round trip commute can get over half of the commute on battery by recharging at work.
If hiring and retaining good employees and tenants is not enough incentive for employers and landlords to install charging stations, the law almost for dead sure will provide additional carrot and stick incentives as necessary to giterdone.
Some people may actually believe oil is cheap and may always be cheap, because traders wants it that way, but personally I think they are naive and deluded to put it as mildly as possible.
This forum IS after PRIMARILY a peak oil forum. Within a decade, or two at the most, the typical man oth the street is going to understand that oil is a depleting resource, and that buying imported oil in a seller’s market means eating more beans and fewer steaks, not to mention maybe shipping of the young guys and girls ( who are generally smarter than men, but dumb enough to want to go to war as infantry (wo) men) off to get shot at, and occasionally hit, at ENORMOUS expense.
Let’s try to remember oil comes out of holes in the ground, and not even the commies or redneck republicans are dumb enough to believe it ever RAINS oil to refill the holes.
We have a Leaf, and it works just fine for our use, which is just into and out of town, and little trips to ladies meetings. Very cheap to operate. And, when we want, we can jump right into that Honda we gave our daughter/granddaughter, or one from kith or kin.
They are real happy to swap.
Most anybody can get an IC car just as quick. So I recommend my friends take advantage of the local bank’s zero interest loan for EVs,, and go together to get used Leafs identical to mine at 1/4 my cost. A real best buy for most car uses.
As for plug in battery, I like the idea of a smart trailer better, snap on/off in an instant, unlimited range. Driver can’t feel the trailer, since it has a powered wheel and goes where the attachment forces say it should to make it non-existent to the driver.
Just to clarify- when I mentioned a battery swap out,
I was referring to the time when the original battery module no longer had good capacity due to degradation, be it 5 or 7 years down the line.
At that point you’ve got to be able to get that module out and swap for a new one.
This unknown battery life is a big part of the overall cost to own equation.
If the battery is built into the car chassis you are screwed.
Hi Hickory,
Sorry I misinterpreted your comment.
So far as I know, swapping out the battery in all the cars currently manufactured by the major automakers is a routine maintenance or repair operation, albeit one that the average back yard gear head is not apt to be able to perform due to the size and weight of the battery.
A side post auto lift will be needed, so as to allow plenty of access to the underside of the car, plus a second lift mechanism to carefully and safely lower the old battery, and raise the new one into place. A couple of new dedicated ( single purpose ) tools may be needed as well.
So far I have not seen either a VOLT or a LEAF advertised at a cheap price due to it being in need of a new battery.
I haven’t been able to find out how fast currently manufactured batteries go down hill once they get to the customary so called “worn out” eighty percent capacity threshhold.
But I am sure of one thing, and that is that a LEAF with a battery that has declined to say fifty miles range is not necessarily in need of a battery , in terms of still being a perfectly serviceable and useful car, for anybody who seldom ventures far from home.
If it turns out that it will go another twenty thousand miles before the range drops from say fifty miles to forty miles, then it will still be serviceable as the ONLY family car at a lot of houses. There are PLENTY of people who seldom if ever go even twenty miles from home, round trip, people who take anywhere from a couple of years to four or five years to drive twenty thousand miles.
Just about all of them would be able to borrow or rent a car in the event they need one for the occasional longer trip.
And there are tens of millions of people who could use a Leaf with “worn out” battery good for only forty miles as second or third car.It would still get most people to work and home again, or to the grocery store and back , no problem.
Gasoline powered cars will always go hundreds of miles, even when worn slam out, but are prone to breaking down,and so the price of them eventually declines to a thousand dollars or so, even when they are still looking pretty decent, due to high mileage.
Given the reasonable expectation of high reliability , cheap electricity and EXPENSIVE ( later on ) gasoline, and almost no routine service costs except tires, I strongly doubt the price of a battery electric car that will go ONLY forty miles will fall below two or three thousand bucks.
Eight or ten grand spent on a NEW battery ten years down the road from new would result in a car almost as good as a new one, in terms of long term dependability, with much lower property taxes and cheaper “full coverage” insurance.
A well cared for nicely appointed ten year old battery electric car with two hundred thousand miles on it will be WORTH spending ten grand on a new battery to make functionally almost as good as new for another two hundred thousand miles.
Folks you are hearing this from an old gearhead who has been mucking around garages off and on for well over half a century, and has his OWN well equipped garage, with side post lift and two six foot high roll around tool chests PACKED with expensive tools.
Between the depletion of oil, and the inevitable incremental improvements in battery performance and costs, the handwriting is not just on the wall..
It’s carved in stone over the roll up garage doors where ever you take your car for service and repair.
People I talk about EV with express two concerns. First by far is they don’t know anything about them and don’t know anybody who does. Second, in a vague sort of general way, they are worried about batteries. And, as always, first cost.
So we got together a local EV club, where people who do know are able to inform the others from first hand experience, we got the bank to offer no-interest loans to highly trustworthy people, and we got some people to search around for used bargains in the nearest city. In the range of 10-15K for near new, like mine.
That way, we got a good number of localLeaf buyer pledges, who are happy, and so that accelerates the whole process.
As for the battery swap, I was thinking of my wife’s situation, where she sometimes goes 100 miles to the city. At present, we just get the Honda, but it seems to me to be feasible to have that smart EV snap-on trailer, so she starts here with one, gets there with full in-car battery for her city jobs, and then snaps on another trailer for going back home.
The club owns the trailers, and charges what it takes.
But anyhow, this is the beginning of EV time, and things are changing real fast. I am wasting my time dreaming up solutions. Ten thousand other good people are doing it full time. Let’em.
Good posts to think about from you and OFM.
Eventually how we go about fulfilling our transportation needs will change, as we chase down those last hours of ancient sunshine.
It is inevitable.
It would be beneficial if more people stopped resisting the inevitable and put on their thinking caps and engaged in planning for and implementing the changes.
Turkey’s increasingly desperate predicament poses real dangers
https://www.washingtonpost.com/world/middle_east/turkeys-increasingly-desperate-predicament-poses-real-dangers/2016/02/20/a3374030-d593-11e5-a65b-587e721fb231_story.html
I already said at the time that the downing of the Russian plane was a major strategic mistake that was showing NATO how unreliable Turkey was.
US is not going to approve the intervention of Turkey in Syria. That is the type of thing that could start a war that could implicate NATO. The Russians seem to be winning this one since Bashar al-Assad looks better than the alternative. Now the only involvement of the West would be against his enemies, and even Turkey is shelling his enemies. Let’s hope the Syrian civil war ends soon, and the best bet is to let the Russians do what they know how to do as they did in Chechnya.
Jav,
It is not at all how it appears by watching TV or reading the papers. All NATO members sleep in the same bed but all of them have different dreams.
As disgruntled shale shareholders would say: “Could you put some color on that investor presentation in order to understand what is really going on” 🙂
Old posts from TOD [-] robert wilson on October 28, 2012 – 12:04pm Permalink | Subthread | Parent | Parent subthread | Comments top
” Seis allows much greater details than just using the geology seen in wells themselves. Especially when there are very few wells in the area. Additionally in some areas it’s possible to see direct evidence of the presence of hydrocarbons, especially NG. This allows a much higher success rate.”
Rockman Does that mean that I must stop using the old cliche – ‘only the drill bit knows’?
[-] ROCKMAN on October 28, 2012 – 1:14pm Permalink | Subthread | Parent | Parent subthread | Comments top
Robert – Hell no! But even that bitch of a bit can lie to you! I’m on a well right now getting ready to run the final electric log. So far it’s been difficult to determine productivity from the mud log, the electric log, the side wall cores and even two production tests so far. Sometimes Mother just won’t give up her secrets easy.
Energy requirements for recycling copper, silver, etc. according to Faraday’s Law. http://www.ausetute.com.au/faradayl.html
Per Baker Hughes, there are 45 onshore rigs drilling vertical wells in the lower 48, 44 oil and 1 gas.
Conventional onshore lower 48 oil and gas is dying.
It would be very interesting to me if we knew where those wells were being drilled.
It would also be interesting to me to get some idea of how many conventional oil and gas wells have been shut in in the USA.
Wonder why, in this era of big data, no one is trying to gather that? Or maybe they are, and aren’t sharing? Genscape comes to mind.
There are an ever growing number of wells shut down where we are. A big jump since 1/1/16. I know Wood Mac says little shut in, but when was that and where did they look? I know we are high cost, so maybe its just us?
I suppose US conventional is so small, 2 million or so, that a percentage of it being shut in is no big deal?
http://www.renewableenergyworld.com/articles/2016/02/visualizing-the-power-of-today-s-solar-panels-an-infographic.html?cmpid=renewablesolar02212016&eid=291109020&bid=1316858
According to this link, new top flight solar panels will on AVERAGE produce 500 kWh in the USA. Even a juice hog electric car will go a hundred miles on fifty kWh, or a thousand miles per panel. Twelve panels will be enough to produce enough juice for the owner of a typical driver, driving a typical electric car, in the USA.
Methinks a hell of a lot of prosperous people can solve nearly all the storage for DRIVING PURPOSES ISSUE issue by owning two or three electric cars, and leaving one plugged up at home and driving the other.Two four or five year old electric cars will cost no more and maybe less to own and drive than one new car, if insurance and property taxes are within reason.
And fairly new used cars nowadays can hardly be distinguished from brand new cars, in terms of LOOKS, if they are well cared for, except by car nuts.
I rode in a ten year old pickup truck yesterday with eighty thousand miles on it that is indistinguishable from new inside, excepting the after market floor mats covering the original carpet, which IS still new. The owner keeps it clean and in a carport, so as to keep the sun off the paint, and you can’t tell it from new at twenty feet, unless you just know what trucks look like according to the model years.
Every year, every new model necessarily looks more and more like other new models and last years models due to the fuel efficiency mandate, so styling as a matter of show off status is in decline. The average hot young blossom cannot distinguish last years sporty car or luxury car or econobox from this years, or next years model.
The owners of a couple of electric cars will also be able to draw on their car batteries in order to reduce their domestic peak load thus getting a utility bill discount if peak load pricing is in effect, and peak pricing most likely WILL be in effect in most parts of the country within a decade or so.
Beyond THAT, they might also be able to buy off peak juice pretty cheap to charge up their cars in the event the sun is not cooperating. Lots of utilities have excess capacity in the wee hours, mid morning to mid afternoon, weekends, etc, except during exceptionally hot or cold weather.
But these happy possibilities aren’t going to cause our hands on oil guys one speck of trouble NOW , or for years to come. Ten years from now, there MIGHT be enough electric cars on the road to significantly affect the price of oil.
Basically what this boils down to is that anybody who owns a south or west facing roof in most of the USA can in effect OWN HIS OWN defacto miniature oil company and service station if he wants, at an affordable price, within the next decade.
My prediction for oil a decade from now is a hundred fifty to two hundred per barrel in current day money. Depletion never sleeps.
Lest anyone forget, if the number of additional wells does not increase in Bakken year-over-year, then the result will be as we showed in the last of The Oil Drum posts
http://www.theoildrum.com/node/10221
Individual Bakken wells have little long-term capacity, so that the decline effects are seen almost immediately.