This is a guest post by Javier
Javier holds a PhD in Biochemistry and Molecular Biology and has been a scientist for 30 years in molecular genetics and neurobiology. He wrote a blog on macroeconomy and investments from a cyclic point of view for over two years and currently writes a blog in Spanish about the economic crisis, energy crisis and climate change at http://www.rankia.com/blog/
Opinions expressed in this post are those of Javier and not necessarily those of the blog owner Ron Patterson. This post was translated from the Spanish by computer and may therefore contain some grammatical errors.
The Problem of the Human Population
However, there is concern for decades that in a finite world at some point should be the limits of the world’s population, and that may not be very smart to reach those limits. Although efforts to limit population growth in some countries like India or China, today these efforts have been abandoned or are abandoning were made in the second half of the twentieth century, mainly due to the pace of population growth is declining alone globally.
As in all matters based on the laws of nature, we can use science to analyze the problem of the human population. The science that helps us in this case is ecology, which has a specific branch of human ecology . Anyone who thinks that we do not apply the laws of biology, is that it has lost touch with the reality of human nature. For very rational to presume to be, we are still animals and not very rational forget.
1. How many and how fast we grow?
The world’s population at the time of this writing is 7,301,880,780 people on the face of the Earth. You can see the current figure on pagehttp://www.worldometers.info/world-population/
Seven 1300 million and growing at a rate of 1.1% per year, ie 80 million people each year , the equivalent of two Spains completely filled each year.
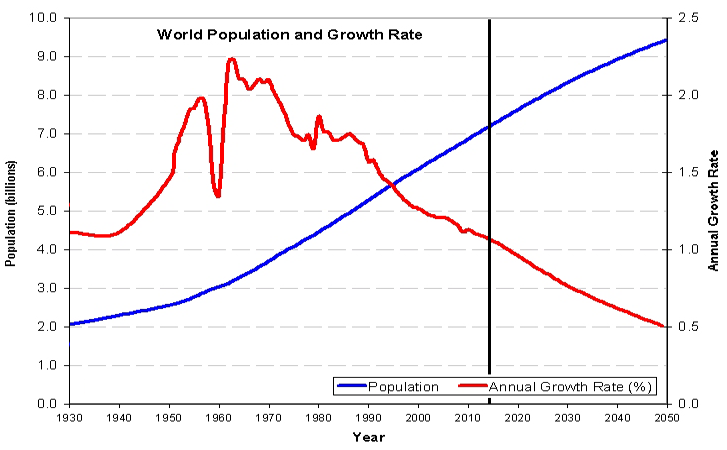 Fig 1 Growth of world population and growth rate estimates up to 2050. Source: World Population Data
Since the growth rate is declining naturally, if not intervene any new factor human population on Earth would peak slightly above the 10 billion people by 2062 according to the United Nations. This is the problem size. The odds that this issue is addressed in political form before 2062 are very low. Political campaigns to reduce the growth of the human population are decreasing, not increasing. The most effective of all, China’s policy of one child per couple is relaxing and and only a third of the population is subject to this limitation (Source: The Australian ).
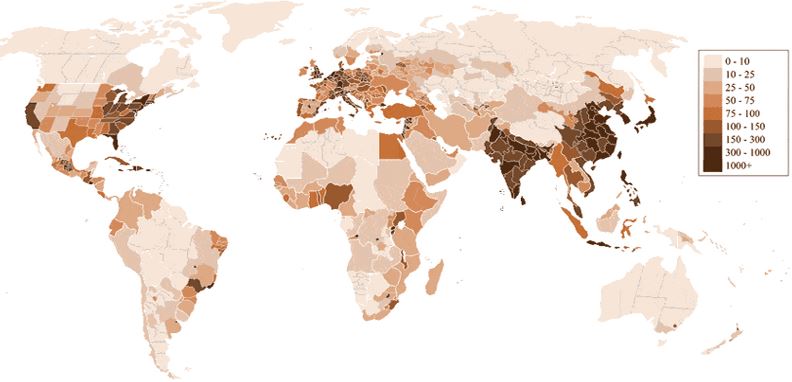 Fig. 2. The population of Earth is very unevenly distributed. Population density in 2006 at national or subnational level people per km2. Source: Wikipedia
The question therefore is not to analyze whether the Earth is able to support 10 billion people, as it most likely can, but if it can do it indefinitely. And here’s where ecology can help us. The capacity of an environment to support a species is called carrying capacity.
2. The carrying capacity
In the context of ecology, the carrying capacity (K) is a theoretical concept, which represents the maximum number of individuals of a species that is capable of supporting ecosystem . This concept demonstrates its practical usefulness when observed that populations with capacity growth tend to occur in many species, a sigmoidal growth asymptotically approaches a value that was defined as capacity (Odum, Fundamentals of Ecology, 1953). Another more modern working definition is that the capacity of a population is the size of the population (N) when its growth rate (r) becomes zero and stops growing (Molles, Ecology: Concepts and Applications, 2012).
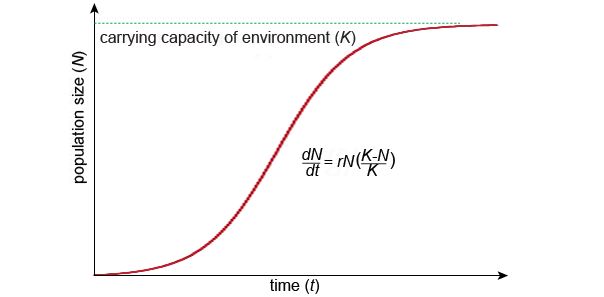
Fig. 3. The growth of a population (dN / dt) limited by its capacity (K) follows a sigmoid curve, which is proportional to its maximum growth rate (r) by the population size N and a factor is less the closer N to K.
The carrying capacity is not a static value as shown in Fig. 3, but to depend on the environment and the interaction of the species with the same, and indeed may vary varies with time. Natural areas managers measure key indicators of species and habitat to determine which populations are responsible below the carrying capacity. Experiments in natural areas under management by government agencies show that populations are limited by the medium. Essentially the availability of food, but also to a lesser extent by other factors such as water, shelter and space (see for example: Carrying Capacity – How many deer can we Have? ). Populations living therefore tend to fluctuate naturally around a certain level which is defined as its charge capacity. An animal population may be below its carrying capacity in the spring after a hard winter, or temporarily above it during the winter, a situation that usually lasts a short time and that inevitably leads to a decline in population due to multiple natural limiting factors (eg mortality, disease, migration and decrease the rate of reproduction).
The concept of carrying capacity also applies to human ecology . The study of human populations shows the recent evolution of their capacity. If we analyze the population of England and Japan over the last few centuries (Fig. 4), we can see that in both cases the population had reached the end of its sigmoidal growth, stabilizing their populations in the value of their capacity, 5 million in the case of England and 35 million in the case of Japan (K1). The Industrial Revolution began in England in the mid-eighteenth century and Japan in the second half of the nineteenth century, substantially increased the capacity (K2) to current levels, causing a rapid increase in population in both cases, to the new level (Meyer & Ausubel 1999. Carrying Capacity: A Model with Varying Logistically Limits ). Note that the shorter duration of the industrial revolution in Japan (77 years) due to be later, it corresponds to a growth in population correspondingly faster.
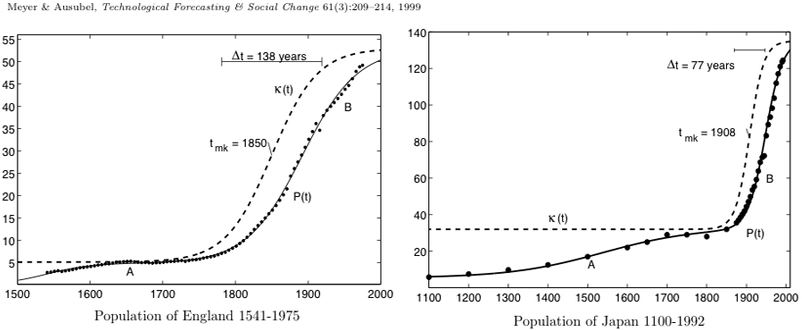 Fig. 4. Evolution of the population of England and Japan in recent centuries. We can see how the lifting capacity (K, inferred) results in the increase of population (P million) according to a sigmoidal curve to stabilize at the new value. Source: Meyer & Asubel 1999 .
Numerous studies can relate the increase in capacity in human populations with increased food availability . See for example Hopfenberg 2003, Human Carrying Capacity Is Determined by Food Availability .
The factors leading to an increase in human carrying capacity are essentially :
- Expansion . Increased cultivated by two processes, increased land area exploited by man and change in land use (forest -> grass -> culture) surface towards higher productivity.
- Increased energy expenditure . Extensive farming mechanization, irrigation, use of fertilizers, herbicides and pesticides.
- Increased knowledge . Selection of seeds and species, use of improved agricultural techniques, improved fishing technologies.
- Positive climatic factors . Increase in temperature and humidity. Increased rainfall Increased CO2.
Factors leading to a decrease in human carrying capacity are essentially :
- Declining resources . Aquifer depletion, rising and declining fuel and energy, collapse of fish populations.
- Environmental degradation . Pollution, soil loss, nutrient loss, desertification, deforestation, loss of pollinators, pest favoritism.
- Adverse climatic factors . Droughts, floods, weather extremes (El Niño and La Niña), reduction of temperature and humidity.
Historically the global carrying capacity of humanity has experienced a gradual increase, although there have been local collapses because the positive factors have predominated over the negative . Especially with the industrial revolution energy costs soared and a strong increase of knowledge which subsequently led to the green revolution began, all of which produced an exponential growth of the human population. This past success leads to much of humanity to think that future increases in knowledge and technology now can not imagine allow indefinitely increase the capacity , or at least we are far from a maximum load. This theory however contains hidden errors and fallacies that completely disabled. These errors are as follows :
- Technological progress is ambivalent because it also allows an increase in the rate of consumption. Is technological progress in fishing techniques which led to the collapse of fish populations.
- Increased capacity is subject to the law of diminishing returns . The cost is becoming progressively higher for a progressively smaller profit. As the population increases the effect of the positive factors per person (dilution effect) is reduced, while increasing the negative factors and cost.
- The decrease of non-renewable resources or overexploited renewable is a function of the rate of exploitation , which increases as a function of population growth.
Therefore we can conclude that there is a maximum carrying capacity for humanity . However there is no agreement on the best way to measure and both methods to measure their results are widely variables. Methods based on determinations constrained by a constant factor, be it surface, amount of food available, or other factors or combination of factors results give very variable and highly dependent on questionable assumptions.Based methods of curve fitting and extrapolation population lacking a theoretical basis. JE Cohen in 1995 in an article in Science ( Earth’s Population Growth and Human Carrying Capacity ) and a book (How Many People Can the Earth Support?) analyzed 65 different estimates of the capacity of mankind. Although most studies tended to estimates between 8 and 16 billion , the change was tremendous, about three orders of magnitude (from millions to billions). The findings appear to be carrying capacity depends on the assumptions one makes and the method used to calculate it . A very unscientific answer.
There is another independent way to calculate the maximum load for the human population, which consists in calculating the proportion of products of photosynthesis on Earth that humans are suitable for use. A 1986 study by Vitousek et al. Human Appropriation of the Products of Photosynthesis estimated that about 40% of potential photosynthetic primary production of the Earth was in the service of humanity or unused pollution, urbanization, desertification, soil loss etc. Since the population in 1986 was 5 billion people, if calculations Vitousek et al. are correct, the ceiling can not be far away from those 10 billion planned for 2062, at which essentially all of the photosynthetic capacity of the Earth will be at the service of humanity and the factors that promote a reduction in capacity they become dominant in the system. Others have made similar estimates and dispersion range of estimates is much lower than in the case of carrying capacity, calculated that ownership does humanity of primary production of the Earth between 25 and 50% (Day et al 2009. Ecology in times of scarcity ; Haberl et al 2013. Global human appropriation of net primary production (HANPP) ). The factor of 2 which separates these estimates is extremely small considering the short time it takes the human population to double.
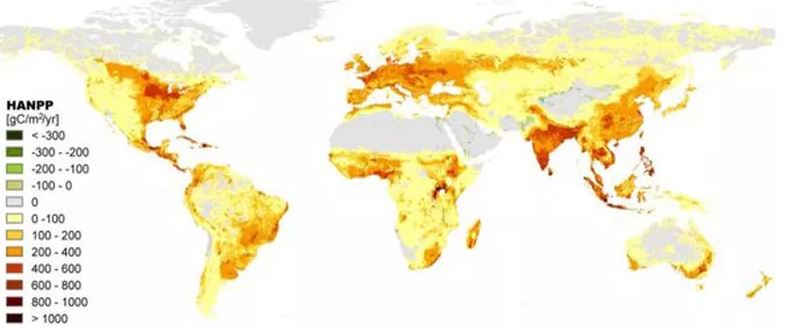 Fig. 5. Global Map of the human appropriation of net primary production (HANPP) in 2000 in absolute units (gC / m2 / year). This value can be negative (green) eg on sites where the desert is irrigated, and the Nile Delta. Source: Haberl et al. 2013
We can therefore conclude that the maximum carrying capacity of the Earth to humanity exists and is well above the estimated maximum population of mankind in 10 billion for 2062. It should be noted that such a degree of appropriation of net primary production of the Earth is at the expense of a strong destruction of biodiversity and increasing environmental degradation, which puts into question that this capacity can be sustained indefinitely.
3. Overshoot
Analyzing the carrying capacity takes us to the important question of what happens when it is exceeded. We have seen that populations above their carrying capacity have their population reduced by natural limiting factors such as mortality, disease, migration and decreased rate of reproduction. When a population is above its carrying capacity it is said to be in overshoot.
The overshoot is common in natural populations. For example, many animals experience high mortality during the winter at high latitudes and high mountain, to recover their numbers during the summer, indicating that during spring are below the carrying capacity and fall over.
Throughout history has often been human populations that have been found have overshoot. The most common response has been emigration .The ancient history to the Maya, is packed dropout urban settlements when their environment is degraded to make unsustainable population. There are strong indications that both the invasions of the Sea Peoples in the Late Bronze Age, as the barbarian invasions which began in the Middle Ages were actually induced migration persistent drought conditions around the Black Sea and in the steppes of Central Asia respectively, which reduced the carrying capacity below the population.
But often the overshoot is part of the ecological strategy of the species, which breeds explosively above its capacity regularly subsequently suffering a collapse. Equally common is that the excess is present when the capacity is altered temporarily , since every species has the potential to grow exponentially. An interesting example is the medium ground finch (Geospiza fortis) one of the famous finches of the Galapagos. The population inhabiting the small island of Daphne Major, a volcanic cone of 0.4 km2, was studied exhaustively by Peter Grant et al. for 30 years. When researchers began the study in 1976 there were 1200 individuals of G. fortis on the island, but the drought of 1977 reduced the population by the end of this year to only 180 copies, a reduction of 85% of the population in just one year . Although a few birds may have migrated to other islands, most died of starvation, because during drought plants that produce seeds which are their main food did not. In 1977 he fell through any chick on the island. Between 1977 and 1982 the population of this small bird that can live about ten years, remained at about 300 copies. In 1983 the weather conditions known as El Niño occurred and precipitation increased about ten times the average of previous years. The conditions were ideal, both for the production of seeds which are the main food of adults, and the caterpillars that feed their chicks. Consequently the medium ground finch population increased to about 1100 individuals, quadrupling in size in one year. Since finches have a set of three eggs that means essentially that year onwards all couples took all her brood of two clutches, resulting in maximum growth . In 1984 and 85 they returned to take extreme drought and population began to collapse. Even in later years one could observe that most of the copies of the island were born in 1983, given the high birthrate of that year.
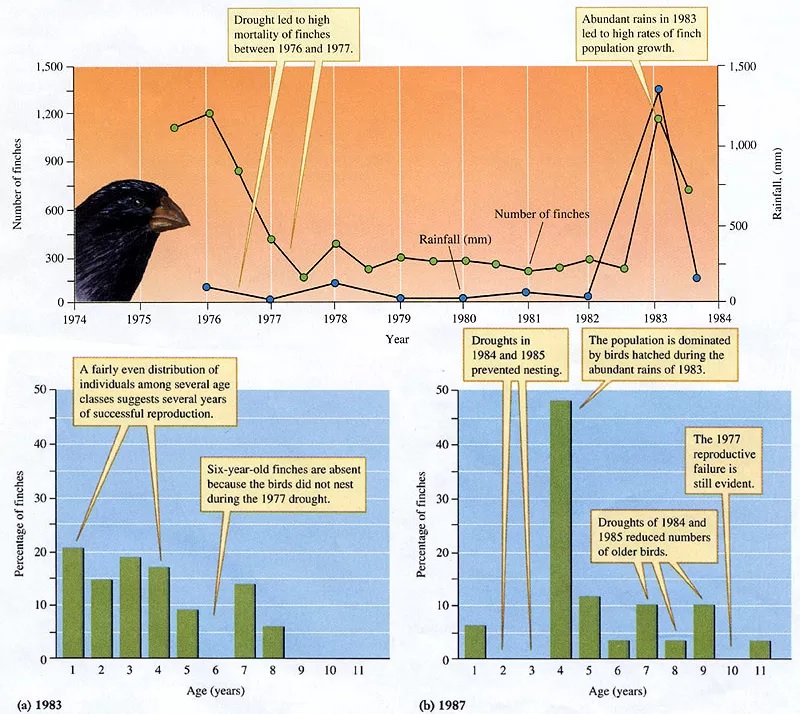 Fig. 6. Top. Population of medium ground finches on Daphne Major (green) and rainfall (in blue). In years of high rainfall population of finches is triggered. Below.Distribution of the population of finches in percent by the age of individuals in years. The lack of individuals born in drought years is observed. (A) Population in 1983. The distribution is regular except for the absence of individuals born in 1977 when no nidificaron finches. (B) Population in 1987 still lacking the generation of 1977, while the population is completely dominated by the generation of 1983 with abundant rainfall. The droughts of 1984 and 1985 have not only prevented reproduction but have reduced the number of survivors of the other years. Source: Molles, Ecology: Concepts and Applications, 6th Ed 2012..
When analyzing the carrying capacity of Geospiza fortis on Daphne Major island we find the already known problem of determining its value since in dry years the island supports a population of about 200-300 birds, while in wet years the carrying capacity is at least four times higher. To take a weighted average does not make much sense, and neither does to try to estimate the number of wet or dry years. Clearly above average annual rainfall temporarily modifies the carrying capacity upward, as in other ecosystems and other species the temporary modification might be downward. Populations simply adjust their number by changing their birth and mortality rates.
From a population standpoint finches are not interested fourfold in wet years since that exacerbates competition the following year and leads to an even higher mortality, which is distributed across the population unnecessarily reducing the total number of individuals . From an individual standpoint, every finch interested in having the largest number of offspring possible to maximize the chances that anyone survive the carnage. We can see that the conflict is resolved in favor evolutionarily exceeded the maximum possible at the cost of the worst possible subsequent mortality.
4. Overshoot and oil
Can the human species in a situation of temporary modification to increase its capacity and address a situation overshoot? It is reasonable to ask whether the human species is analogous to the medium ground finch in a wet year remain Island Daphne Mayor our world.
Energy moves the Universe and energy is the basis of life. In terms of energy, a greater accumulation of heat during the El Niño conditions transfers more energy to the sea surface resulting in a greater water abundance in the atmosphere and increasing rainfall over Daphne Major. Water availability allows plants to take advantage of a greater amount of solar energy to grow and produce seeds. The energy stored in the chemical bonds of plant molecules allows the multiplication of caterpillars and their predators the finches. The energy flows taking place: Sun -> Water / Sun -> Plant -> Seed -> Finch / and Sun -> Plant -> Caterpillar -> Chick Finch, are the essence of this system operation. When the flows of energy increase the number of finches increases, and when the energy transmitted lessens their number is reduced.
Considered worldwide human population keeps growing well below capacity during most of its history. Much of its growth comes from its expansion to other continents and increased acreage. It is however from the industrial revolution as we have seen, the capacity rises substantially and with it increases the availability of food and parallel growth of the population. Since the industrial revolution does not occur simultaneously worldwide, the global effect is shown as an increasingly rapid gradual increase in population. The increase coincides with the increasingly widespread use of energy from fossil fuels, coal first, and then oil and gas, which make possible an increase in productivity.
It is the increased availability of energy from fossil fuels which allows first release of most of the population of the tasks of primary food production , and secondly the appropriation increasingly faster a increasing share of net primary production of the Earth . It is incontestable that the availability of abundant cheap energy from fossil fuels which allows humanity to increase its capacity . The increase of knowledge is a transversal factor. On the one hand is the one that enables the collection and use of a fossil fuel that had always been there;moreover knowledge growth is due to the release of tasks primary production and increased productivity and economic development that allows the use of fossil fuels, and finally increasing knowledge requires a increasing amounts of energy. Nobody is aware that no energy from fossil fuels the current state of our knowledge would be much lower.
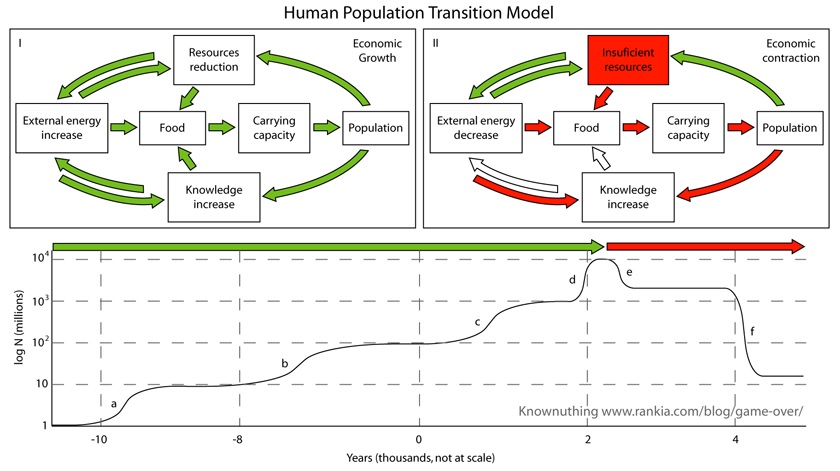 Fig. 7. Transition Model of human population. In the mode of operation that has taken place in the history of mankind (Mode I), increased energy has allowed a more rapid decline in the resources of the Earth (more resources for humanity) and increased knowledge with three factors potenciándose by positive feedbacks (green arrows). This leads to an increase of the available food, increased capacity and an increase in population. Economy belt acts as facilitating operation while expands. In the first mode all the feedbacks are positive, so any increases ever faster and humanity feels invincible and is not able to detect the boundaries. The model fails when resources become insufficient and enters mode II. In mode II insufficient resources and reducing external energy remains positive feedback, so that less energy and less fewer resources less energy resources, while reducing energy acts negatively on increasing knowledge. Food production decreases, and with it the capacity and population. The population continues to reduce the resources of the Earth despite its decline, but the decrease acts negatively on the increase of knowledge. As a result the knowledge stagnates or declines and does not act on reducing energy, resources and food. The economy is no longer able to act and contracts. In mode II positive feedbacks have negative effects, like negative and humanity feels powerless and unable to find solutions. Below, model representation of population transition. The end of the last glacial period (a), the implementation of basic agriculture (b), global expansion and advanced agriculture (c), and the industrial revolution (d) have expanded the capacity of mankind for about a factor of 10 each. Since mankind has not been able to exercise any self-control, mode transition occurs at the maximum population, causing a decrease in capacity due to lack of resources and energy (e). The onset of the next ice age will represent another decrease in capacity (f).
Although the rapid growth of the human population goes back centuries, when we analyze its growth rate, what we see is that this is triggered from 1910 (Fig. 8). There is the widespread use of coal which triggers the population worldwide, but the widespread use of oil, which has a direct effect on farm mechanization and the transfer of people from farm work to the secondary and tertiary sectors of the economy. The increase in the growth rate reaches its peak in the 60s of last century, when oil use is spreading worldwide, and decays since decreasing parts of the globe that are to incorporate the development induced energy from oil. Interestingly, the maximum rate of global growth is achieved by 1962, years before the green revolution to take place, so that increased food production, avoiding a humanitarian catastrophe is not actually increasing the growth rate of the population, this had taken place before.
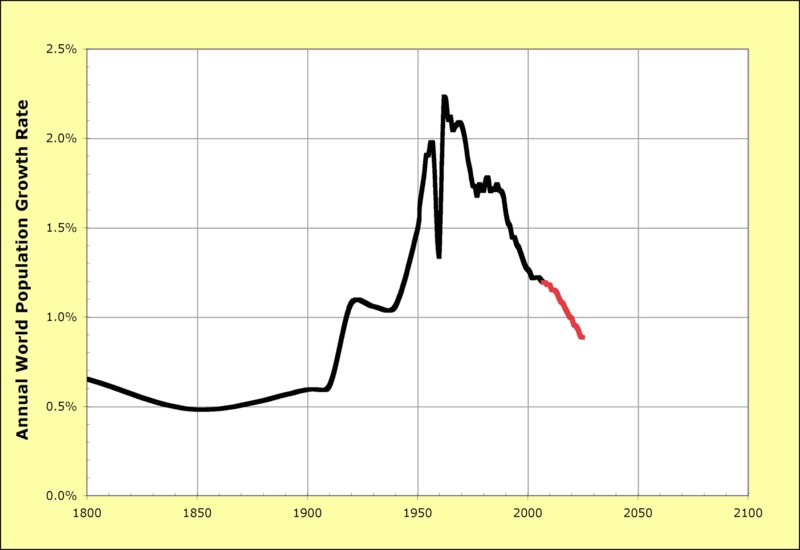 Fig. 8. Evolution of the rate of increase in world population between 1800 and 2005. The rate soars from 1910 when it doubles once before World War II and again after. The fall in the late 50 corresponds to the Great Leap Forward Mao Zedong, which led to a population crash in China. Source: Wikipedia. Data: US Census Bureau.
Oil is therefore equivalent to increasing rainfall for Daphne Mayor Finch. It is the main channel of energy whose increase has allowed the multiplication of mankind to current levels. The expression that humanity is in the Oil Age is correct.
Caution is however before the analogy between humanity and finches too far. Finches have no control over the production of their food, while mankind has enough control over the production of his. Increasing food production has an immediate effect on the population of finches, whereas although that was true in the past of mankind, now the situation is reversed. Is population growth which leads to increased food . Nobody is aware that agricultural production in Spain could be much higher, but there is growing demand simply because the population has decided not grow. In fact the recent history of Spanish farming is a history of limitations and reductions both from the EU as due to global competition.
We can conclude that the increase in human carrying capacity has been made possible by a steady increase in energy from fossil fuels, especially oil. Such energy increase continues to make possible the rise in carrying capacity against an increasing environmental degradation, loss of fertile soil and resource depletion. Since fossil fuels and other resources are finite and are subject to increased exploitation due to population growth,mankind is in a situation of temporarily elevated carrying capacity. When this situation comes to an end the decrease in carrying capacity will inevitably lead to a human population in a state of overshoot that will undergo a proportional reduction.
5. The case of the Soviet Union
We have several examples of overshoot in the history of mankind. One of the best known is that of the Soviet Union. Without going into the causes of its collapse, which is a matter of debate, we can stick to a number of illustrative facts:
- In 1987 the Soviet Union reached its peak oil production and two years later his peak consumption. In just eight years its oil consumption falls by 50% (Fig. 9).
- For the next 1987 years the country will join in a severe economic crisis characterized by shortages widespread.
- Between 1988 and 1998 grain production fell by 37% (from 103 to 65 million tons per year), the production of meat, heavily subsidized in the Soviet era, fell by 56% (from 10 to 4,400,000 MT per year ). Grain imports also fell by 90% (from 21 to 2,100,000 MT per year) Source: Liefhert et al. 2010 Russia’s Transition to Major Player in World Agricultural Markets .
- Since 1988 the birth rate, which was stabilized, begins a steep descent and continue down to the end of the crisis in 1999. At the same timethe mortality rate begins to grow more acute growth in 1991. As a result of Therefore, the growth rate was two decades stabilized at 0.5% plummets turning negative in 1991. The population is reduced for 20 years, and has not grown back (Fig. 10).
- In 1991 the political entity divides into many smaller countries.
Without going into an analysis of causes and consequences, the Soviet case seems a textbook example of how peak oil and the severe economic crisis that accompanies it are related to a reduction in food production and population decline.
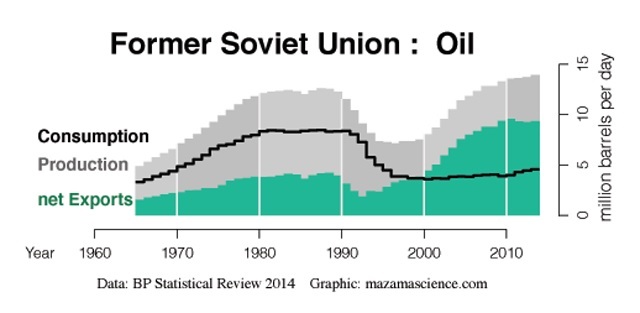 Fig. 9. Production and exports of oil consumption corresponding to the former Soviet Union until 1991 and all countries that formed since. Peak oil is observed in 1987. After more than 25 years, production has recovered, but not consumption. Although the peak, the Soviet Union never lacked oil.
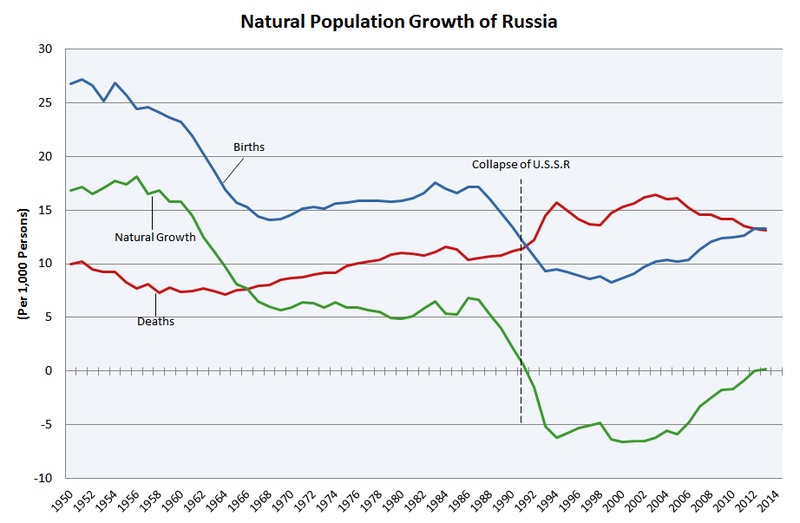 Fig. 10. Evolution of the population in Russia between 1950 and 2012. Natural growth in green, blue births and deaths in red (data on annual ‰). Between 1987 and 1994 the effect of the collapse of the USSR, followed by stabilization until 2001 and slow improvement since then notes, having recovered the level of pre-crisis growth. Source: Wikipedia.
At the moment I’m interested to bring three points to the analysis of the Soviet collapse. The first is that the collapse took place amid a global prosperity . The rest of the world was perfectly able to export to the Soviet Union all goods demanded it. But that did not prevent imports were reduced. The demand is not what you want or need, but what you can afford, and the Soviet Union was able to pay less and therefore got less and less the rest of the world. His demand collapsed.
The second point is that food production suffered a sharp decline even though the fields were still fertile, agricultural workers were still available tools and knowledge was undoubtedly Russia he lacked enough oil to agriculture since remained exporters. And of course food production fell even though the Russians wanted to keep eating just as well. That is, all pieces were completely in place except the economy. Despite being a command economy whose main objective was to feed all citizens, demand plunged, because citizens had a much lower purchasing power, and supply sank because the producers had trouble paying to get the inputs necessary and to collect their products. It is a clear warning that food production depends on the economy , and the capacity can sink, triggering hunger and starvation, even though it has the capacity to produce enough food.In Spain we are well able to significantly increase our food production, yet in the wake of the 2008 crisis had to enable that school cafeterias open during the holidays to combat child malnutrition among the most disadvantaged.
The third point is that the Soviet collapse was caused by a reversible reduction of available resources . As a result, after 12 years of crisis Russia was able to correct the situation, and although today almost none of the analyzed parameters recovered from 1986 levels, recovery is remarkable. A collapse due to an irreversible reduction of essential resources is not likely to be reversed.
6. sustainable carrying capacity.
As we have seen in the case of finches, a fundamental property of all living beings is their ability to grow exponentially rapidly to reach its capacity. If birds and bees do well, it is natural for humans to have done. The novelty from a biological point of view is that we are failing to do so and there are countries that could still raise their capacity but have zero or negative growth. But carrying capacity achieved by mankind is based on exhaustion and dispersion of a unique heritage of natural capital which includes not only fossil fuels but also fertile soil, groundwater, minerals and biodiversity are depleted or degraded quickly to current population levels. Humanity is reducing their potential for future load by eating and degradation of this natural capital received.
If humanity is in a temporary situation of high carrying capacity has primarily been made possible by the energy extracted from oil and other fossil fuels, such capacity will be reduced according to the availability of these fuels is reduced. Any reduction in the carrying capacity overshoot immediately put us in causing increased mortality and decreased birth to adjust the population to the new capacity. To determine the seriousness of the problem and imagine how far he can take it down before stabilizing population indefinitely, we investigate the capacity of mankind under sustainable conditions without damaging the environment. Of course this exercise is highly unlikely, since as we have seen, is difficult enough to calculate the current carrying capacity under known circumstances.
For human carrying capacity to become indefinitely sustainable it should not rely on non-renewable resources and must rely on renewable resources only to a level that allows their maintenance. This is an astringent criterion since mankind has never done well maintaining within a sustainable carrying capacity. Almost as soon as behaviorally modern humans appeared, about 50,000 years ago, they began to cause the second worst extinction of the last 55 million years, the LQE (Late Quaternary Extinction) that eliminated the vast majority of megafauna (≥ 44 Kg ) as well as much of the slow breeding fauna and all surviving members of their own gender (Koch & Barnosky 2006, Late Quaternary Extinctions: State of the Debate). And all that before reaching a million humans. Not a bad start for such a brilliant species.
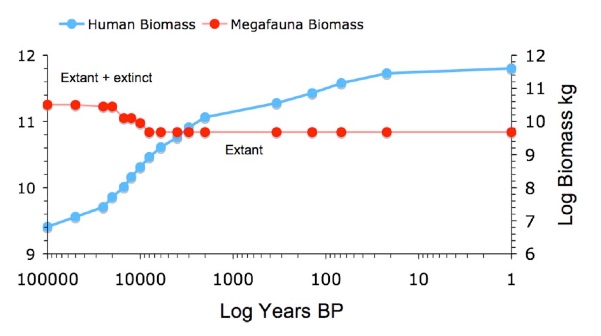
Fig. 11. Anthony Barnosky the EQA was essentially an exchange of megafauna biomass (red, right scale) for human biomass (blue, left scale). To Barnosky, the total biomass of megafauna and man before the EQA was the same as the existing megafauna biomass, man and cattle 200 years ago, but has increased since July. Barnosky concludes: “The normal basal level of biomass is exceeded only after the Industrial Revolution indicates that the abnormally high current level of biomass megafauna is supported only by fossil fuels If biodiversity is indeed a choice between human biomass. biomass of other species, as indicated by both the EQA and theoretical considerations, then the depletion of fossil fuels without replacement by alternative energy sources mean that a collapse of the biomass is imminent, this lowering human biomass and causing extinction in wide range of other species. Source: Barnosky 2008 .
In 1977 Mark N. Cohen in his book “The Food Crisis in Prehistory: Overpopulation and the Origins of Agriculture” suggested that agriculture was imposed to humanity despite entailed major work, poorer health, higher mortality and higher risk due to population pressures worldwide demanding an increase in the number of calories obtained per unit of space (see Cohen 2007 CID Rethinking the Origins of Agriculture ). This theory has been supported by multiple lines of evidence, including the evidence that agriculture could not be developed during the last glacial period because its climate was extremely hostile to the beginning of agriculture for their high variability is climate, its dryness and its low CO2 (Richerson et al. 2001 Was Impossible Agriculture During the Pleistocene but Mandatory During the Holocene? A Climate Change Hypothesis ).
Agriculture Before the man had begun to alter the landscape to make it more productive using the fire . With the development of agriculture, deforestation is accentuated , and obtaining metals, with its high consumption of charcoal, caused an even greater increase. During Roman times there is plenty of historical and scientific evidence that the increase in population and economic development led to degradation or deforestation of many forests did not subsequently recovered, especially in Italy, the Iberian Peninsula and North Africa (Harris 2013 Defining and detecting Mediterranean deforestation, 800 BCE to 700 CE .). Shipbuilding, with a high requirement of wood, especially of tall trees, was also an important factor in deforestation since fleets from ancient Greece to the maritime powers of the XV to XIX, especially Spain and England suffered an abundant deforestation.
The main conclusion is that throughout its history mankind has behaved according to their biological programming, struggling mightily to increase their capacity with no regard to their sustainability, and therefore there is no Paradise Lost man in balance with nature. The phrase “Be fruitful and multiply; fill the earth and subdue it; have dominion over the fish of the sea, the birds and all animals” (Genesis 1:28) is a particularly insightful description of humanity. We have fulfilled this mandate more biological than divine origin and this has been our most successful and simultaneously our greatest failure .
If mankind were to match the capacity conferred by the sustainable use of renewable resources, what would be the size of population? Again it is difficult to obtain and highly hypothetical answer. We can start with the calculation of the ecological footprint , the concept proposed by W. Rees of the University of British Columbia in 1992, and has led to an international NGO that promotes sustainability, Global Footprint Network . The ecological footprint is measured by determining the amount of land and sea needed to sustain biologically productive consumption and assimilate the waste of the population, comparing them with the actual area available (Rees 1996, Revisiting carrying capacity: area-based indicators of sustainability ). According to the calculations of ecological footprint, the current population of the Earth consume resources and generate waste that would require 1.7 planets to sustain . According to these calculations, the sustainable carrying capacity of the Earth at current consumption is 4,300 million. It is a chilling calculation, because it is a figure 41% lower than the current and 57% less than the 10,000 million expected in 50 years. Now we begin to understand what being a finch in Daphne Mayor at the end of a wet year.
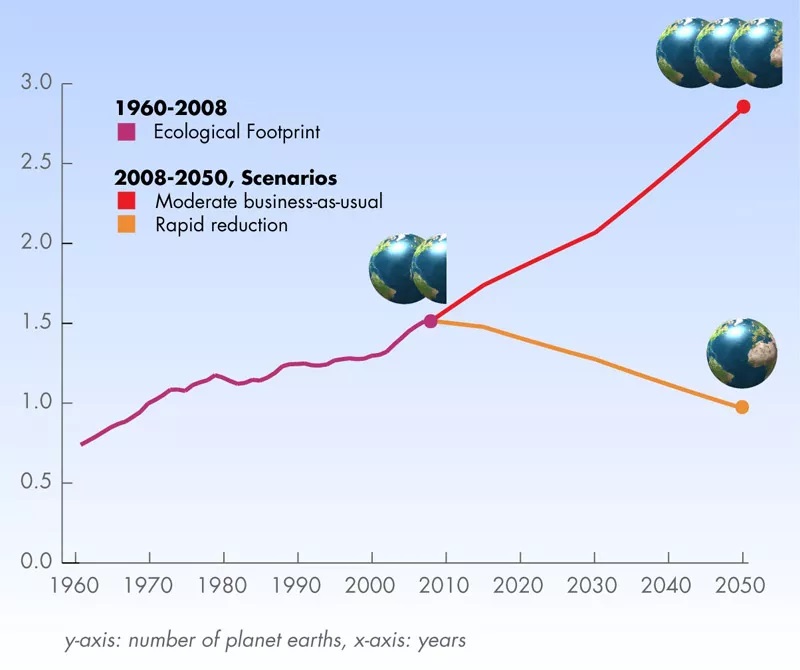 Fig. 12. Representation of the global ecological footprint. Since 1970 the Earth is negative and is currently 70% in the red. Source: Global Footprint Network .
However, for those who want even more worrying, there are even more stringent than those of the ecological footprint, such as energy criterion criteria. The carrying capacity is determined by the amount of energy through the system . For humanity we can distinguish between intrasomática energy, which comes from the foods we eat and holding our population, and extrasomatic energy, which is all the energy we have been using since the domestication of fire and animals that use intrasomática to increase our energy and our population as well as for many other applications, some relevant to our capacity as warm us and defend us from disease, but most can be considered irrelevant use for the subject matter. If we remove from the equation of energy from non-renewable sources, fossil and nuclear fuels, we will be eliminating 90% of our extrasomatic energy. With the 90% base much of the increase of our intrasomática energy due to the mechanization of agriculture, fertilizers, herbicides and based on the oil and natural gas pesticides leaves. A global energy we would be in a similar situation 1870 when it had a population of 1,500 million people who used approximately 10% of the energy we use today. Of course now we have more advanced knowledge of agriculture and improved seeds, is our agriculture would be more productive than then, but at the same time have degraded much soil, groundwater and ecosystems, so that the final productivity could not be higher. Of course we still talking about hypothetical figures, and you can argue that we can greatly increase energy from renewable sources by that we do not have much of nonrenewable energy. That is true and I hope so, but also arguably remains to be demonstrated that renewables are able to self-replicate , ie wind turbines and solar panels are able to sustain their surplus energy mining operations in remote areas , transport over long distances and the manufacture and assembly of the parts needed not only to maintain but to produce new wind turbines and solar panels when their useful life is over, and remove and recycle old. So far renewables have acted only as extensions of fossil fuels and nobody has proven that it can not sustain indefinitely a society of current technological level based only on renewable .
If you want to know what sustainability means bringing our limit, and ensure that the human population is not only completely sustainable and does not cause any harm to the environment, but allows a maximum biodiversity for the rest of the planet’s species, we compare our population with other mammals of similar size . Charles Fowler conducted this analysis in 2003 and discovered that the human population is two and a half orders and more abundant magnitude as the most abundant populations of large mammals (Fowler & Hobbs 2003, Is humanity sustainable? ).That is, the maximum number that we assign the biosphere, our real place in the world is 25 million human . Although there have been large mammals over that figure on Earth, without exception were ruminants, such as bison of the American prairies. For an omnivorous species like ours, a green figure of 25 million is correct. It is estimated that mankind had that number some 4,000 years ago, toward the end of the Bronze Age.
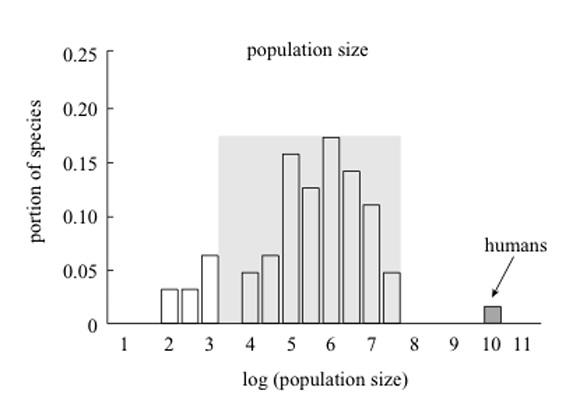
Fig. 13. Size of the human population (dark gray bar) in logarithmic scale on the X axis, compared with 63 species of humanlike body size in mammals. The limits of 95% confidence among nonhuman species are indicated by the shaded edges in light gray area. Source: Fowler & Hobbs 2003
7. Capacity and Climate Change
Seems to be little concern about the effect of global warming on the carrying capacity, however after over 200 years of warming since the lows of Little Ice Age, no one has observed a negative effect of warming on human carrying capacity . Quite the contrary, agricultural productivity per unit area is still increasing, and crop growing seasons lengthen at high latitudes. Donohue et al. have shown in 2013 that satellites show a 11% increase in plant foliage arid temperate zones between 1982 and 2010, attributed to the fertilising effect of CO2 (Donohue et al. 2013,Impact of CO2 fertilization on maximum foliage cover across the globe’s warm, arid environments ).
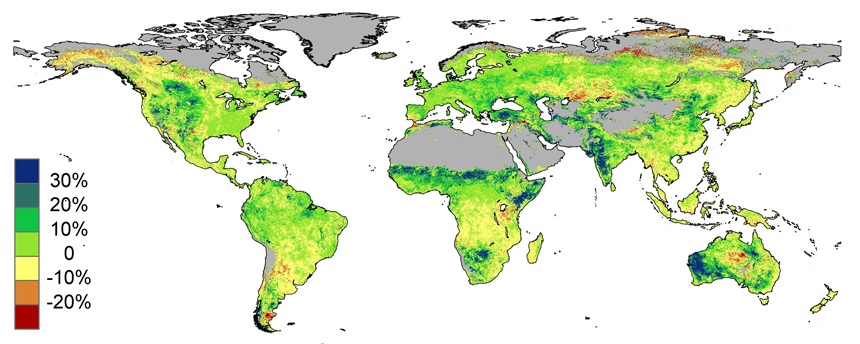
Fig. 14. The greening of the world. The satellite images show an increase of foliage between 1982 and 2010 than in temperate arid areas reached 11% and is attributed to the fertilizing effect of CO2. Source: Donohue et al. 2013 .
The Earth has been in substantially warmer, wetter and more CO2 than today passed, and the effect has been more productive Earth. In fact fossil fuels have occurred in times like this. Based on all this evidence it is logical to think that humanity has little to fear of global warming on what their capacity is concerned. Not so with respect to a global cooling that would be extremely dangerous .
There is abundant evidence of the damage done to the human carrying capacity of the Little Ice Age , from the complete eradication of the Vikings from Greenland to the elimination of a quarter of the population of Finland in the years 1696-1697. Losing 15% of its population to Scotland for “The ill years” between 1695 and 1699 was instrumental in his decision to join England in 1707. During the Little Ice Age famines were so abundant in many countries, which organize conferences among historians dedicated exclusively to it (ZiF 2015, Famines During the Ice’Little Age’ (1300-1800) ).
Reaching the end of the exceptional situation within a glaciation of living in an interglacial period is to cause undoubtedly a brutal reduction capacity of mankind, and not just because a good portion of the northern hemisphere is buried under permafrost. The glacial periods of glaciation must also be extremely hostile to agricultural production times . A limitation posed by low temperatures on plant productivity, add the other phenomena that accompany it, lower humidity of cold air, resulting in lower rainfall and a decrease of CO2 that causes a depletion of growth. It should be added increased flooding from melting. To make matters worse, during glacial periods the millennial-scale climate variability (Dansgaard-Oeschger events) is about three times larger than that experienced during the Holocene , which by comparison has been remarkably stable. This climate variability is reflected in a corresponding variability in the ranges of vegetation (Pickarski 2013, Vegetation and climate history During the last glacial-interglacial cycle at Lake Van, eastern Anatolia ). The return of such conditions would be very difficult to establish sedentary civilizations based on agriculture lasting more than a few centuries in many parts of the globe, promoting nomadism, and significantly decreasing the capacity of the world, probably below hundred million people.
 Fig. 15. Dansgaard-Oeschger events in the pollen record from Lake Van in Turkey. Scale in thousands of years before present with oldest on the right. Top red stable isotope data of oxygen in the NGRIP record are an indicator of temperature. The peaks marked (•) and numbered corresponding to the DO events that take place every 1-3 thousand years and consisting of a sudden heating followed by cooling may be abrupt or gradual. The width of the heating and cooling is 3 times that have occurred in the Holocene, including the current warming. Below, arboreal pollen (AP) expressed as a percentage of total pollen, which shows the rollover to the vegetation is subjected during the DO events. Source: Pickarski 2013 .
The end of the interglacial is not something to be concerned personally, but it is clear that unless premature extinction, is what awaits mankind. The astronomical signing of our interglacial indicates that belongs to the group of short duration , with an average of 13 ± 3000 years (Tzedakis et al. 2012, Can we predict the duration of an interglacial? ), so it could end in about 1,500 years, although this climate would have cooled considerably in the coming centuries, possibly suffering another Little Age Ice even colder beginning in about 300 years. This possibility can not be ruled out at all and for a species of mammal hairless should be a matter of more preparation than heating.
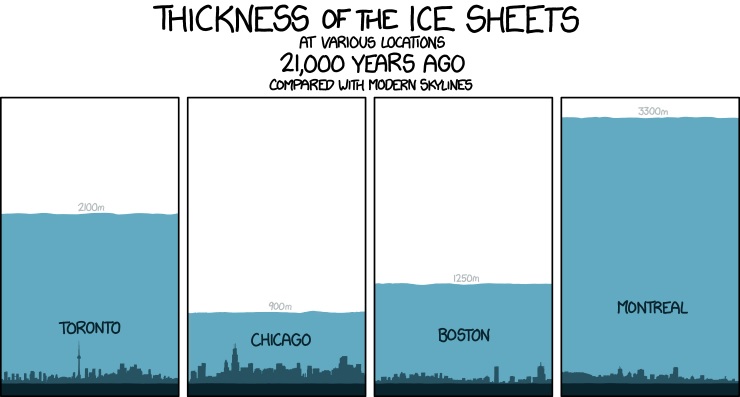
Fig. 16. The thickness of the ice cover in several places compared to the height of buildings. Source: XKCD .
8. Concepts and myths.
A. Humanity is well above its capacity.
This depends on which one wants to expand the definition of capacity up to match your vision of the problem. The concept of carrying capacity has an outside source to ecology, in shipping where denotes the maximum carrying capacity. From there it goes to the management of natural areas in the early twentieth century to define the maximum population of large mammals should be allowed before finally invade ecology, where most of the ecologists used to define the maximum achievable population. According to this definition widely used humanity can not be above its capacitysince its population is not only supported but still clearly expanding.
An alternative use of the concept of carrying capacity is to add the requirement to be “sustainable indefinitely” or “without harming the environment” or “no overexploit resources.” This automatically allows putting the human species above the capacity of the medium, but does so at the expense of loading the concept, because by definition the carrying capacity for any species varies constantly (can not be permanent or stable) and may not be a theoretical fixed number. Also makes the carrying capacity can not be calculated because as we have seen not calculate these situations lack of damage to the environment or sustainable exploitation and therefore the carrying capacity becomes longer arbitrary and have utility other than to scare people.
B. Humanity is in overshoot.
Again this involves expanding the definition of overshoot to serve our goals. Overshoot is by definition a situation where the population is in excess of the carrying capacity. Individuals of a population in overshoot do not get on average the minimum resources for sustenance and the population therefore presents negative growth during that generation. Supposing that a population that does not present these characteristics is in overshoot requires knowledge of the future. Daphne Major finches were not in overshoot during a wet year. They were in overshoot the following year when rains failed and seeds were not produced. If a wet year is followed by another, and then another and another, finches would not be in overshoot, but in their carrying capacity, which manifest the impropriety of saying that a species is in overshoot when it is obtaining sufficient resources.
C. The reindeer on the island of St. Matthews is a good example of overshoot and collapse due to excessive population growth and overexploitation of resources.
29 reindeer, introduced to the island of St. Matthews in the Bering Strait in 1944, had played to over 6000 in 1963, when its population collapsed in the winter of 1963-64 to less than 50 individuals in poor conditions in 1966 they had produced no offspring (Klein, DR 1968. The introduction, Increase, and crash of reindeer on St. Matthew Island ). From the beginning the case was presented as an example of the effect of uncontrolled growth and overexploitation of resources, leading to a population collapse .
The death of almost all of the reindeer on the island of St. Matthews in a single winter is suspect. Seasonal variations in the availability of food for the reindeer do when it becomes scarce high mortality occurs during several winters followed to reduce the population to more sustainable levels by the annual growth of vegetation. This is what has been observed in other cases. As stated by Miller et al. 2004 ( St. Matthew Island reindeer crash revisited: Their demise was not nigh-but then a, why did They Die ) there is evidence to suggest that the death of reindeer can be attributed to an unusually cold winter in 1963-64 could do that snow cover harden while the reindeer were unable to reach the food underneath. If so, would have the same number of reindeer, because its capacity is reduced to zero. The experience taught to distrust too good examples.
D. The natives of Easter Island are a good example of the collapse of civilization by overexploitation of resources and ecocide.
Easter Island is a small island of 163 km2 located 3,700 km off the coast of Chile, which is believed to have been colonized by Polynesians between 400 and 800 AD. Its inhabitants brought with them a culture developed in very different climatic conditions, where logging was a much more sustainable than in Easter Island practice. To make matters worse, the inhabitants soon developed indigenous cultural practices, the erection of moai (megalithic statues), requiring transfer from the quarries to their places of location. The population of the island is estimated that perhaps reached 15,000 by 1600 and entered into cultural and poblacionalmente slope to that date. At the time of first contact with Europeans in 1722, the island was completely deforested and the population was estimated at about 3000 inhabitants. A popular theory is that due to burning and indiscriminate felling of trees to clear space for agriculture, and to move the statues of Easter Islanders deforested the island and its environment degraded to the point of reducing its charge capacity below its population , so they resorted to cannibalism wars and to adjust its population to the new situation of the island. This theory has proved popular and is defended by example by Jared Diamonds success in his book “Collapse: How Societies Choose to Fail or Succeed” (2005).
However there is an alternative theory of the lack of scientific evidence to support the theory of ” The islanders committed ecocide about themselves “. The alternative theory advocates the following points:
- Based on radiocarbon dating and the East Pacific Polynesian colonization, colonization took place centuries later, around 1200 AD .There was no time for human overpopulation.
- Rats brought by the colonizers as food were the main cause of extinction tree to reach overpopulation and feed on seeds and tender stems of palms as in other islands (Auld et al. 2010 Disruption of recruitment in two endemic palms on Lord Howe Island by invasive rats ).The slash and burn and use of wood by the islanders were contributing factors, but the fragile ecosystem and the slow growth of palm trees against the explosive reproductive capacity of rats made the result was a foregone conclusion.
- The islanders did not depend for their livelihood on the trees , feeding on crops of sweet potato, rats and chickens that get brought to the island and fish from shore, and fought successfully erosion and loss of soil nutrients with stone gardens. Its population was well fed judging from archaeological remains of skeletons.
- Moai were designed to move upright without using palm wood, which also is not dense enough to support much weight. Watch the video: The statues that walked.
- No evidence of widespread violence and cannibalism would have been exceptional. The collapse of the population of Easter Island took place as a result of contact with Europeans due to epidemics and finally to the nineteenth century slave topped it off. Is once again the genocide and ecocide not responsible for the damage.
The new theory of ” The islanders are an example of success in adversity and challenges of a difficult environment and with serious ecological problems “with the evidence that supports it has been exposed by Hunt & Lipo 2009 ( Revisiting Rapa Nui (Easter Island ) ” Ecocide ”).
 Fig. 17. The statues walked. With relatively few people and effort, a replica of a moai of 5 tons walks with surprising agility to swing it from side to side. It is not known that such is developed on the slopes. Source: National Geographic.
9. Conclusions
1. Despite dramatically increased the carrying capacity of the Earth to its species, mankind has done at the cost of ownership of a large percentage of net primary production of the planet, greatly increasing pollution, degradation the environment and biodiversity loss , indicating that we do not have much to grow.
2. Estimates indicate that in the absence of changes in the trend world population will reach its maximum in about 50 years in the vicinity of 10,000 million people before starting down .
3. The explosive growth of the human population is a recent phenomenon, primarily between 1910 and 1962 and is related to the increased availability of petroleum energy in production and distribution of food worldwide and the reduction of labor in the field it allows.
4. The increase in carrying capacity of mankind is dependent on a steady increase in the use of oil and other fossil fuels which makes it temporary and condemns our species to suffer the consequences of an overshoot when fossil fuel consumption finally decreases.
5. The consequences of an overrun necessarily have to include the declining birth rate, increased mortality and a higher percentage of the population engaged in the tasks of primary food production .
6. The scale any overrun and thereby the reduction depends populational multiple hypothetical factors and can not be predicted. In the most extreme case could exceed 99% if the onset of the next ice age finds us in a situation of low extrasomatic energy.
Further reading
Gerald G. Marten. Human Ecology. Basic Concepts for Sustainable Development .
816 responses to “The Problem of the Human Population”
“Karl Marx once said that history repeats itself, first as a tragedy then as a farce.”
Can you say ‘‘ecocide’’?
The example of Russia is instructive. Any good source on what happened in Cuba in the late 80’s-90’s? How did they survive the lack of oil? How did their agriculture hold up? Did the population decline? etc..
Thirunagar, when I was in cuba all the private property was nationalized. This led to the destruction of agriculture, and within months we started going hungry. I left before the Soviet Union fell, but my first cousin left in the 2000’s and described her experiences. She told me they went hungry, that her friends had lots of abortions to avoid having children, and many yearned to escape and move to freedom.
From what I can see the Castro family dictatorship carried out a social genocide. They tore apart the fabric of society, starved and repressed people, and tried to control their minds.
The blowback was a population which had quite a few escape, and the ones which remained were mostly lacking in morals. Male and female prostitution proliferated and became quite acceptable, divorce is common or they never marry, theft from state enterprises is the norm, corruption is common, and the state uses a high level of violence against anybody who dares criticize or ridicule the dictatorship.
The result today is a nightmare for those of us who knew what existed before. They live in ruins, dress like beggars, are extremely cynical and lack work ethics, many are thieves, engage in prostitution, and don’t think much about tomorrow. Population, in spite of the outflow of runaways has increased very slowly, much slower than in other nations (I think it was 25 % in 55 years of Castro dictatorship.
The population growth rate in Cuba has been significantly lower than that of Haiti https://www.google.com/?gws_rd=ssl#q=cuba+population
http://www.google.com/publicdata/explore?ds=d5bncppjof8f9_&met_y=sp_pop_totl&idim=country:HTI:DOM:CUB&hl=en&dl=en
I know little of Cuban situation during the Soviet collapse years, but what I understand is that a lot more people went into food production, with a lot of urban gardens and a lot more farmers. That is the response that I would predict and one of the conclusions of the article. Is like a reversal of the Industrial Revolution.
The Castro dictatorship owns all the land, after nationalization a lot was covered with weeds and marabù (a tough thorny plant good for nothing).
Recall that cubans lacked transportation, and this meant the inability by large urban populations to go and try to plant on state owned lands.
When we started going hungry I was about 10, and I started a garden in an empty lot next to a friend’s house. We planted venerables, but we experiencienced a lot of theft. So we tried growing rabbits, and that worked.
Anybody who could grab a boat ran away, and if you tried to build a raft they would toss you in jail, so fishing was out of the question for most people.
I think most people tried growing what they could, but it’s important to understand these guys are communists, they really go for the collectivized agriculture and all that bs. And they are extremely violent. The Castro dictatorship isn’t as bad as say Pol Pot’s or the Kim’s, but they do torture and murder people as needed.
I don’t think Cuba is that good an example because it was always distorted by Fidel’s nature as a megalomaniac and a psychopath.
I did not choose Cuba as a test case for similar reasons. It is hard to separate propaganda from reality. But it is a country that experienced peak-oil and consequent food availability decrease and it did respond with a back to {forced] ecological agriculture answer. They have developed lots of urban gardens were around 200.000 people dedicate time to agricultural production. I think it would be useful to know the result.
Now we know that autarchy is one of the worst possible answers in economical terms, but autarchy might be imposed on us by circumstances beyond our control. If there are ways to improve the transition we should know about them without much thought about political considerations.
Dear Javier
I would also add to the list of issues surrounding Cuba is the perilous state of food in almost all of the Carribean islands. A farmer friend of mine is presently working in Jamaica, trying to rejuvenate local agriculture. In both Jamaica and Puerto Rico, more than 90 percent of the food is imported. Cuba is more self-sufficient than either Jamaica or Puerto Rico, but still imports a significant amount of food. In my opinion (from a distance), Cuba made the right strategic decision favoring home gardens for fresh vegetables and fruits with more reliance on imports for staples.
One could ask the question whether any of these islands can be self-sufficient in food, given that they are subject to devastating hurricanes.
Don Stewart
Don, Cuba isn’t a typical Caribbean island. With a few exceptions, Caribbean islands are part of a volcanic arc and are fairly small. Cuba is mostly a micro continent which migrated and collided with North America, but the eastern part of the island does have a volcanic origin.
The net result is that cuba measures 1000 km long and has very extensive land areas covered with excellent soil. My maternal grandparents were farmers near Remedios, they sold the farm in the late 40s, but we still have relatives who live in Remedios, and we hear the farms are mostly destroyed.
Cuba has been hit by hurricanes forever. When we know a storm is coming we go cut down branches, in some cases the whole plant is cut (for example, what you call a banana tree has to be cut right at the ground level). At least in Cuba’s case there’s no problem with hurricanes, but I read Fidel Castro had been making excuses using hurricanes, and that’s typical of that sob.
Fernando,
I agree that there were/are some things wrong with the Castro Regime in Cuba… one being their economic dependence on Russia leading to the Special Period any many people not having enough food to eat. I would argue though that their regime is not communist/socialist but state capitalist… and I hope you are not trying to argue that the system under Batista and many other corrupt politicians in Cuba before Castro was any better or even equal… Way more prostitution, way more poverty, way more illiteracy… The Castros did improve literacy to nearly 100% in around 10 years, have a fully functioning health care system (yes albiet slow and not efficient at times but free… I got service several times there when I visited). The people are not living in abject poverty there now and I would argue never were… or at least I can’t find any reputable sources that say otherwise…
Communism/Socialism is when workers and communities control production… period… anything else is pure hogwash… and the Castro government does not support worker councils and worker ownership and management of production… agriculturally or industrially so I would consider them State Capitalist… much like China and Nordic Countries
Craftsmanship.net has an interesting article on Cuba’s agricultural strategy:
http://craftsmanship.net/cubas-harvest-surprises/
Perhaps economics forced Cuba to modify its agriculture in ways that have turned out to be more sustainable and could be a model for other countries. I expect that there are going to be some agri-tourists paying a visit.
Yeah, I’m sure there will be tourists. Not everybody goes for the male and female prostitutes.
Aftrr we overthrow the regime we can build a museum to remember the victims of the communist dictatorship, our version of a Holocaust museum. And we can offer tours of the prison in isle of pines where so many political prisoners were tortured and murdered by Castro’s henchmen.
Whatever – I don’t subscribe to your version of cuba
I bet. You must have an utopian version of young cubans singing songs to honor Castro and feeling groovy because they are kept isolated from the world.
I was educated in their system, which means I wrote my own version of the Communist Manifesto, read it and you’ll learn something about what I call the Freedom Seeker’s dialectic.
http://21stcenturysocialcritic.blogspot.com.es/2015/03/the-new-poor-working-class-will-destroy.html
Hi Fernando,
All dictators do the kinds of things that Castro has done.
Nothing special about communism in that regard.
The problem is authoritarian rule. I think Pinochet was probably as bad as Castro, there have been many dictators that have done terrible things to those deemed a threat to the state. All of them are terrible, both on the right and the left. So your special hatred of communists seems strange to those of us who did not experience life in Cuba.
So your special hatred of communists seems strange to those of us who did not experience life in Cuba.
I have two concerns with it.
1. The US has been hating communists for decades. What has it gotten us? So I’m not sure what Fernando thinks we should be doing that we haven’t already been doing.
2. He sees communist conspiracies that I don’t believe there are. His belief that the Nebraska rancher opposition to the pipeline and the Silicon Valley’s support of solar are fronts for communist activities overlook the real reasons for those groups supporting those causes. I know people involved in the Nebraska protests and I know lots of Silicon Valley types. Those in Nebraska are Republicans. They just don’t want a pipeline through their properties. It’s all about private property rights to them. The Silicon Valley types are definitely not communists. They lean more libertarian than anything.
I suggest you let me discuss my ideas instead of distorting what I believe. I don’t “hate” communists. I consider them a threat. I happen to know the system and how it abuses people.
Do you perceive capitalists also as a threat?
They seem to be doing a wonderful job of ecological destruction. If you don’t, you must be packing some serious cognitive dissonance!
My apologies Fernando, your comments led me to think you felt more strongly about communism.
Cuba imports about half of its food. Much of it from the USA
Despite embargo, U.S. is Cuba’s main food supplier
http://www.directorio.org/mediacoverage/note.php?note_id=1422
Cuba is not the rest of the world. Cuba can grow food year round, No so I in most of the world because of winter.
No so I in most of the world because of winter.
Winter of course limits what can grown in the ground during those months, but in some places empty warehouses are being converted to urban gardens.
The ones that depend on electric light for growing would be a problem in areas of limited electricity, but some places will be able to run winter greenhouses that can be warmed with passive solar.
Javier,
Nice article and charts. Most of the conclusions at the end of your article make perfect sense except for:
NUMBER 2: world population will reach its maximum in about 50 years in the vicinity of 10,000 million people before starting down.
Now, if we look at the climate calamity already taking place in California which estimates say the state has about one year worth of water left, I don’t think we are going to get ANYWHERE NEAR 50 more years of population growth to 10 Billion Joe-Bag-Of-Donuts running around on the planet.
I would be surprised if we don’t start to see serious climatic-weather events that gets the depopulation BALL ROLLING within the next decade.
steve
50 years is extremely optimistic.
In the next 5 years things will be more than interesting.
Of course we don’t know the future. Last 50 years trend can change, but the 10 billion figure is important because it is probably a maximum. It says that we are not going to grow to 15 or 20 billion for population dynamics reasons, even if we could.
Hi Javier,
Nice post. I agree that population above 10 billion is unlikely, does a maximum population between 8 and 10 billion sound reasonable? There has been quite a bit of progress on World total fertility ratios(TFR), where they fell from 5 to 2.5 over 40 years, based on the experience of several developed countries, it would seem that there is no reason to expect the TFR will stop at 2.1 (replacement level) for humans.
The concern about another ice age is overblown. Even if only 1300 Gt of carbon (4770 Gt CO2) are emitted by humans (all sources since 1750 AD including land use change).
Atmospheric CO2 would rise to about 500 ppm and then slowly decline, it is not until CO2 gets below 300 ppm that there is much risk of another ice age.
In the year 3000 AD CO2 would fall to about 390 ppm and by 25,000 AD atmospheric CO2 would be at about 300 ppm, assuming no carbon emissions after 2100 AD.
The ice age risk in the near term is low, also solar output is slowly rising (though this is a small effect over these time frames.) In addition there are earth system effects that may cause warming above the equilibrium climate sensitivity, so cooling will not be a problem for thousands of years.
Chart with atmospheric CO2 with 1300 Gt of carbon emissions from 1750 to 2100 AD, chart has a logarithmic horizontal scale. Atmospheric CO2(ppm) on vertical axis, year (AD) on horizontal, covers year 3000 AD to 33,000 AD.
CO2 is 390 ppm in 3000 AD and 290 ppm in 33,000 AD.
There are a lot of assumptions on that Dennis.
First, that we know what CO2 levels really were in the past. It is not the case. While no proxy measure of palaeo levels of CO2 is satisfactory, ice cores appear to have a large bias to the downside and to reduced variability. There is even important disagreement between ice core CO2 levels. GISP2 ice core CO2 levels, show much higher and variable levels of CO2 than Vostok or EPICA, and are therefore rarely used.
Discussions about the reliability of CO2 measures from different techniques.
http://www.skepticalscience.com/plant-stomata-co2-levels.htm
http://wattsupwiththat.com/2010/12/26/co2-ice-cores-vs-plant-stomata/
http://www.geocraft.com/WVFossils/stomata.html
If any measure of peak Eemian CO2 levels is below 350 ppm when ∆T was +2ºC at least, that measure is with all probability wrong as it is physically impossible in this world to have had higher temperatures in palaeo times (up to 400 My) and less CO2.
Second. The data that no ice age has started with levels this high of CO2, besides the known problem of not knowing past levels, does not really say it cannot happen since we know little about why ice ages take place. So far none has failed to show up and that is a pretty strong statistic to beat.
Third. You presuppose that CO2 drives temperature and not the other way around. There is quite a lot of evidence from records that changes in temperature preceded changes in CO2.
Your conclusion that the next ice age has been delayed or prevented seems premature to me.
Hi Javier,
There are many things that affect global temperature besides CO2, during the eemian the insolation was different (greater solar forcing due to different orbital parameters), there was greater melting of icesheets and a reduced albedo which also led to greater warming, so your theory that CO2 levels must have been higher may not be correct.
It is pretty well agreed that CO2 levels have not been significantly above 300 ppm for the past 800,000 years. Note that of course there is uncertainty about the past, temperature reconstructions can also be in error. Pointing to the Eemian leads one to the possibility that very high earth system sensitivity may be possible. Let’s say global temperatures were 1C above average pre-industrial Holocene temperatures during the Eemian. If insolation and albedo were the same in the two periods (they were not), this would suggest an earth system sensitivity of 7.5 C (I am assuming 320 ppm CO2 during the Eemian and an average temperature 1 C above Holocene average preindustrial)
The understanding of climate is not perfect, but it is better than you seem to think.
I don’t know if it is agreed or not that no CO2 levels above 300 ppm had taken place. I do know that there is no hard data to back that belief. CO2 in ice cores is known to present problems. I suppose you are referring to the Lüthi et al. 2008 Nature 453. Well they notice and reported some of the problems, specially a falling baseline with age (see fig. 2), but instead of the logical explanation, that CO2 in bubbles was decaying with age and depth (some experts believe that to be the case) they went with the illogical explanation that baseline temperatures were lower the older the glacial period.
Our understanding of climate is a joke. Models are not only unable to predict anything, but they are unable to reproduce every salient aspect of past climate as ice-ages, D-O events, etc. We don’t even have good explanations for them. As experimental sciences go, climatology is shameful.
Javier,
Climatologists only have one test subject. If you would magic them up a few more Earths to experiment with I’m sure they’d be extremely grateful. In the meantime, they’re doing a pretty good job given all the limitations they have to work within.
FWIW I think your knowledge of climate science is out of date and you seem to have accumulated a few denier memes; eradication of these nasty brain worms is recommended, easily achieved by updating your climate science knowledge.
Out of date? So you mean that in the last few months all those big claims based on inconclusive, poorly researched or anecdotical evidence suddenly have found strong scientific support but somehow the news haven’t made it to the MSM? You mean that in the last few months their models have started working and started to make predictions that connect with reality? I’m sure I would know if they had tossed all their old models because they don’t work.
Skeptics are often pointing to big holes in the Gruyere cheese that is the consensus view of how climate operates. Climatologists are so fond of and so close to the cheese that don’t seem to notice how badly it smells. It is a problem that many climatologists spend their time and grant money at their computers playing with models without getting out of them the lesson that they teach, that they do not understand how climate works and should expend more time collecting data and studying data.
That they don’t have another Earth is a lame excuse for expending all day playing at the computer. Are they grown ups?
Hi Javier,
In molecular biology and biochemistry, computers are not used? Interesting.
There are plenty of climatologists that spend a lot of the time in the field and in the lab collecting and analyzing ice cores which give excellent data on past CO2 levels.
Then some people just toss out the data and say we have no idea what past CO2 levels are. So we can ignore the evidence we don’t like, but that does not really seem to be the best way to proceed. The Eemian temperatures are well explained by looking at all the evidence, carbon dioxide is not the only thing that affects temperature, your understanding of geophysics seems pretty limited.
Hi Dennis,
I think we have left climatology in the hands of physicists and that is a problem as it is a too complex issue and requires multidisciplinary approach.
Clearly their models don’t work, and clearly they cannot explain the most important features of Earth’s climate. That is not their fault and probably they are doing what they can.
However it troubles me deeply that given the state of their knowledge, they pretend to know what the future climate is going to be, and worse they pretend to tell us how our lives should be lived. There are a lot of scientists that like me believe that these climatologists are going too far, that their conclusions are not warranted, and that the politization of their results is bad for science, yet we lack a channel to express our concern and given the political climate is not wise to go public on this.
I am not tossing out the data on CO2 from ice cores, but it is very important to know the limitations that they have, and that their values cannot be taken at face value when they do not agree with data coming from other techniques.
I know perfectly well that CO2 is not the only thing that affects temperatures. The Sun, oceanic currents, cloud formation and volcanoes affect temperatures a lot more than the IPCC gives then credit for. In fact I have very serious doubts that CO2 levels drive temperatures. I believe that is the other way around and temperature changes drive CO2 levels.
Hi Javier,
The temperature changes drive the CO2 to increase in the Milankovitch cycles. So in that particular case the temperature change due to an increase in insolation causes the increase in CO2 to begin.
The physics shows that the rise in temperature cannot be explained without the greenhouse effect. This creates a positive feedback where temperature increase causes CO2 to increase which increases radiative forcing, etc.
Now if there were no anthropogenic emissions of CO2 causing a rise of atmospheric CO2 in 115 years similar to the rise to the Eemian interglacial over 5000 years, then you would be somewhat correct that temperature changes were what cause CO2 to change.
The causality runs both ways but the CO2 level has a very important effect on the radiative forcing, without this effect, it is not physically possible to explain the current temperature of the earth. It is also not possible to explain the glaciation cycles over the past 800,000 years without accounting for the effect of CO2, which despite your misgivings is well accepted by scientists in the field.
Did you have some solid (peer reviewed) references that gives a very different picture of CO2 levels over the last 800,000 years from the links below?
http://cdiac.ornl.gov/trends/co2/ice_core_co2.html
http://cdiac.ornl.gov/images/air_bubbles_historical.jpg
Hi Dennis,
I am not denying a role for CO2 in raising temperatures, as I am not denying a role for water vapor in raising temperatures. Once the Earth starts getting out of glacial conditions both CO2 and water vapor increase in the atmosphere (and methane, etc.). Once there is enough water vapor though, CO2 has less and less effect because water is a lot more abundant and quickly saturates the absorbed spectra from essentially all the wavelengths except for a minor CO2 absorption peak at 4 µm. CO2 has more effect the dryer (i.e. colder) the air.
Depends on what you consider very different, certainly many measurements above 300 ppm.
There are only 3 sources of information from past CO2 levels. Two are real data proxies. The other is a model that is supposed to be very good, but that I am not able to evaluate, so I distrust.
1. GISP2 ice core.
The CO2 Concentration of Air Trapped in Greenland Ice Sheet Project 2 Ice Formed During Periods of Rapid Climate Change.
H. J. Smith et al. 1997. J. Geophys. Res. 102. 26,577
2. Stomata.
Stomatal density and stomatal index as indicators of paleoatmospheric CO2 concentration
D.L. Royer 2001 Rev. Palaeobot. Palynol. 114, 1
Rapid atmospheric CO2 changes associated with the 8,200-years-B.P. cooling event
F. Wagner et al. 2002 PNAS. 99 12011.
Last interglacial atmospheric CO2 changes from stomatal index data and their relation to climate variations
M. Rundgren et al. 2005 Global Planet. Change 49 47.
Stomatal evidence for a decline in atmospheric CO2 concentration during the Younger Dryas stadial: a comparison with Antarctic ice core records
J. C. McElwain et al. 2002 J. Quater. Sci. 17 21.
Reproducibility of Holocene atmospheric CO2 records based on stomatal frequency
F. Wagner et al. 2004 Quater. Sci. Rev. 23 1947.
Climate forced atmospheric CO2 variability in the early Holocene: A stomatal frequency reconstruction
C.A. Jessen et al. 2007 Global and Planetary Change 57 247
Atmospheric CO2 during the 13th century AD: reconciliation of data from ice core measurements and stomatal frequency analysis.
Van Hoof et al., 2005. Tellus 57B 351.
3. Geocarb III
GEOCARB III: A Revised Model of Atmospheric CO2 over Phanerozoic Time
R. A. Berner & Z. Kothavala 2001 Am. J. Sci. 301 182
Hi Javier,
So you think the stomata would be more accurate than the data from the ice cores which measure the CO2 directly? The stomata data has pretty large error bars,
even if Holocene average pre-industrial CO2 levels were somewhat higher than ice core data show (which I believe are more accurate), this would change things very little from 280 to 300 ppm.
One would then need to argue that the Antarctic measurements are biased low by say 20 ppm so we would have the glacial to interglacial at roughly 190 to 320 ppm.
Now a 500 ppm CO2 level would be a similar difference to the glacial interglacial CO2 difference, which corresponded to a 5 C change in global temperatures (over 10,000 years), bit CO2 rose very slowly over 5000 years or so.
This really changes the story very little if equilibrium climate sensitivity is 4C, and preindustrial CO2 was 300 ppm then 450 ppm leads to 2.3 C of warming above preindustrial and 500 ppm CO2 leads to 3 C of warming.
Dennis, ice core dating can go back less than half a million years. The Ginkgo, still in existence today, dates back 200 million years. One leafy tree goes back almost 400 million years: Wiki, The early to middle Devonian trimerophytes may be considered leafy.
So I really don’t think it’s a matter of accuracy but it’s the fact that stomata measurement goes back a lot further than ice core measuring, by a factor of about 500.
Hi Dennis,
I am enjoying my discussion with you and I believe we both are learning from it even if neither of us changes its position on the matter. This is how scientific discussion is carried out in scientific avenues and usually positions don’t change until new evidence is made available that alters the view.
No. Obviously not. We do not have a good proxy for CO2 levels in the past. Stomata proxy tells us what is wrong with ice core data. Ice core based CO2 levels lack variability (Younger Dryas is hardly visible), show a very strong averaging (peaks disappear as do lows and highs) and have a falling baseline (the underestimation is higher the older the date).
Stomata data on the other hand is not free from criticism. It is very hard to obtain and to accurately date, so it is fragmentary, and needs to be properly calibrated, which is also difficult and prone to big errors.
Geocarb III data is the main tool to infer distant past CO2 levels. I cannot evaluate it but experts seem to like it. It is very long term oriented so for the Neogene it only gives an average of 260 ppm. That is way higher than what the ice core data says. I do not know how meaningful that is.
My only point in this matter is that we do not have evidence to claim that CO2 levels have been below 300 ppm for the past 800,000 years. We don’t even have evidence that CO2 levels have not been this high in the past 800,000 years, because if they had been this high we would not know it.
Stomata data indicates that transient CO2 spikes are quite common and usually associated with transient temperature spikes. It follows that higher temperatures in the distant past (Eemian interglacial), could very well have been associated with higher CO2 levels than most researchers are prepared to accept.
If one knows what past CO2 estimates are about, one has to be very prudent before drawing conclusions that depend on past CO2 levels, as it is the equivalent of walking on thin ice.
And again, climate sensitivity appears that it is going to settle on values between 1 and 1.5 ªC causing a terrible headache to IPCC estimates.
What we do know is that CO2 has been turning into rock for billions of years.
Javier,
Prove you are a real scientist and post your CV. Thanks.
Javier, excellent postings. As you know, demographers make projections not predictions. No one can know birth rates or especially death rates in 10 or 50 years.
Yes thank you. Projection is a much better term.
From the article by Javier.
Javier holds a PhD in Biochemistry and Molecular Biology and has been a scientist for 30 years in molecular genetics and neurobiology.
Ha ha. I find this very hard to believe.
I think it is high time that Javier post his CV, and links to peer reviewed, published scientific articles.
Ron should have checked Javier’s qualifications before subjecting everyone to this crap.
You can in real time watch the growth in the United States and world population, if you are so inclined:
http://www.census.gov/popclock/
This, despite decades of declining birth rates, contraception, and resource wars which accelerated in 2001.
All I can say, good luck to the cornucopians. You’re going to need it.
“Estimates indicate that in the absence of changes in the trend world population will reach its maximum in about 50 years in the vicinity of 10,000 million people before starting down ”
-Perfect statistical models of a “linear” plateau/stabilization and fall never work in practice.
If microorganism (i.e.: bacteria) planted on a Petri dish double themselves lets say…every minute, only 1 minute before collapsing (being poisoned from their own waste) they would have occupied only half of the dish.
None of them (microbes) at that point when they had occupied only half and had the other half at their disposal would have “thought” that a minute later they would be all dead.
-In reality, a very steep mountain down-slope, or what is called a “shark-fin” type of collapse is far more likely.
And that does not account for the fact that only us (humans) have the capability of intentionally destroying ourselves (hint: nuclearWar). In this scenario the “line” just stops…in an instant.
Nobody left to interpret the data…….and it seems that we are well on our way to make it a reality!
Be well,
Petro
I always had a problem with calling it a shark fin profile. The down slope on the trailing edge of a real shark fin typically bends backwards, making it an unphysical representation. In other words, It would mean that time would go backwards and people would scratch their heads over this. The accusation is that Peak Oilers are always exaggerating and this doesn’t help counter that view.
-Hah…
…fair enough!
Be well,
Petro
Hi WebHubTelescope.
‘Peak oilers’ is a Madison Avenue invented term. There is no peak oilers club or movement. Most websites that concern themselves with the peak oil issue are either outright denial sites, or sites which sidle up and try to soft pedal the issue, like this one.
There is no ‘we’ that is always exaggerating the peak oil issue. ‘We’ have nothing to be ashamed of. ‘We’ don’t need to get together to counter a false meme. The idea that ‘we’ need do so is itself a false meme.
The shark fin is a good analogy for a Seneca Cliff, which is a good analogy for fast collapse. There is no reason to soften the analogies. It does no good to soften the truth for the squeamish. If anything, ‘we’ should be more forceful if ‘we’ want to be heard.
Most websites that concern themselves with the peak oil issue are either outright denial sites, or sites which sidle up and try to soft pedal the issue, like this one.
That’s a load of horseshit if one ever existed. I don’t soft pedal anything here.
Ron Patterson, Of Fossil Fuels and Human Destiny
Ron does offer time-lines in regards to when oil production will terminally decline and it is 2015/2016. Furthermore he has stated that initially the decline will be slow but will then accelerate as we reach the end of the decade so time-frames are provided.
As to the nature of collapse, I believe (correct me if I am wrong Ron) he thinks collapse will be more rapid than slow. I think the issue of giving precise dates is not so much about soft pedalling but one of unpredictability. At the end of the day we live in a world of complex systems so while general trends and long-term changes can be anticipated naming a precise date for these changes in system behaviour is exceedingly difficult.
Saying all that personally I find it hard to believe the financial system and by extension the global economy can hold itself together if the world experiences declines in oil production for 10 straight years. Collapse will likely happen within that time frame and if that occurs global trade will be cut off and you will get a major problem with unemployment. It is at this juncture where things could go anywhere. How people and society react at the realisation that business as usual cannot continue will play a decisive role in whether we get a fast or slow collapse. It is at this point of chaos when it becomes even harder to predict how people will react and this will only be compounded by the fact there is likely to be a number of black swan events taking place that cannot be predicted at this time but will likely be very relevant to the situation then.
If there is any guide on how things can work out it will be through history although like all guides we must not lean on them too much and acknowledge their shortcomings. The most obvious analogy would be the collapse of the Roman empire (and the underlying system of debt servitude/slavery). After the collapse of the empire the economy of the region shifted to a more localised/self-sufficient feudal system. The physical monetary system largely disappeared as did outright slavery but then people were never really freed as they were bound to the land and their position in life. Perhaps a neo-feudalism type society could be our future. However a degree of caution should be exercised in this as today (unlike the time of the Roman empire) the whole world will be in a state of overshoot and there needs to be a correction in population to match the renewable resources of the planet. The collapse of the Roman empire did not need such a large population correction in relative or absolute terms so the outcomes will be different.
Hi monsta666,
That is a great description and exactly my thoughts. I subscribe everything you say.
For the same reasons I’ve done my own research of the Roman collapse and I have produced the following graph from the best available bibliographic sources.
There is a lot of info in that graph that basically allows to follow the Roman descent into the Dark Ages. But the main info can also be extracted from Meadows’ Limits o Growth. Collapse is a complex issue involving many factors and many peaks, that takes time. Something that simple-minded people like Futilitist cannot grasp and so they will always be wrong.
My view of our impending collapse is similar to that graph except that very much compressed in time. We are already seeing our own commerce peak and about to see industrial production peak. What it is not seen in the graph is the political shift at the critical point from Republic to Empire, that was probably a reaction to the situation. We are already close to our own political shift, as political events in Europe indicate.
Other things that can be seen from the Roman example are that economic collapse was the fastest and most thorough, and that epochs of partial recovery, like the fourth century are possible.
Livestock can be seen as a proxy for agricultural surplus. The Russian example agrees that when things get rough we get rid of livestock to reduce the impact on human carrying capacity.
Coordinated blocking maneuver.
Hi Monsta666. You should let Ron speak for himself.
Hi Javier. Please post your CV. Thanks.
Hi Ron. Please answer my post:
http://peakoilbarrel.com/the-problem-of-the-human-population/comment-page-1/#comment-508057
Roman Empire isn’t a good analogy: There was no underlying economic growth. It was a Ponzi empire, fueled by an evergrowing outer periphery of theft from new conquests. They ran into peak food and peak wood. There was no way it could end well.
We *don’t* have a declining energy resource base. We are surrounded by an abundance of affordable energy: it’s only a question of our ingenuity in taking advantage of it. For instance, current human energy consumption is very roughly 12 terawatts. Well, the sun bathes the earth in 100,000 terawatts of continuous, very high quality energy!
The English in Roman times were surrounded by coal. Why didn’t they use it? It took time to develop the ingenuity to take advantage of it. In the same way, we’re surround by wind, solar and nuclear power. They are scalable, affordable, high energy-ROI, etc., etc. Their cost is declining quickly – they’re already affordable, and well on their way to being truly cheap, in a way that fossil fuels never truly were.
NickG,
I must say, I find this statement incredible.
We absolutely do have a declining energy base, and have for 30-40 years now. We are using debt to rapidly deplete the known reserves of fossil fuels faster than new sources can be discovered. Every aspect of our economy is tied to this. The entire global economy is one big ponzi scheme.
Moreover, attempts to continue business as usual by the substitution of alternative energy sources are doomed to failure. There is no such thing as free or renewable energy. All of our attempts to capture energy require energy and materials to develop. All sources of energy require a constant stream of inputs to maintain. All human activity is, in the end, local and subject to diminishing returns. Even if we saved the system by a massive build out of an alternative energy infrastructure, the very fact of doing so would merely delay the day of reckoning, as the population would thereby expand more, reach a higher level, and ultimately deplete the inputs needed for the new infrastructure. This behavior is genetic and inbuilt as a result of our being organic creatures. We have never existed in a steady state, and, absent suicide, virtually all human beings act to maximize their life, power, and resources at the expense of others and the surrounding environment.
Once we reach global peak oil (probably happening now), the primary energy input into the economy will be forever on the decline. Correspondingly, all the others will decline in a similar movement. All bets would be off on political arrangements, debt, and trade. If we are indeed at peak oil now, it means the global economy is set for irreversible decline, with much of the move (50% or more) set to happen in the next 30 years.
I’m wondering if you are purposefully trolling or simply in denial.
It’s hard to know where to start. Here are a couple of thoughts:
Try thinking about your comments about transitions in the context of the transition from wood to coal. That transition was successful. Why? because the new source was more scalable, and had a good E-ROI. And…the same is true of wind and solar: more scalable, and good E-ROI (actually, wind’s E-ROI is much better than for fossil fuels).
As for population always rising: read the Original Post, by Javier. He disagrees. We can see that clearly in places like the US, or Japan: they’re affluent, they have more than enough food, death rates are falling. And, yet, fertility is below the replacement rate of 2.1 kids per woman (in the case of Japan, well below). Why? Because people simply choose not to have kids. One or two are enough. In fact, even in the US people want fewer kids, not more: roughly 40% of all pregnancies are unplanned. If contraception worked a little better, there would be even fewer kids!
Start with ‘renewables’ and then work your way toward EV’s. Has that not essentially what you’ve been doing for the past ~10 years here and at TOD?
But before you do, call all of us up and inquire, without leading questions or agendas, what we actually want/need, and then discuss/do that instead.
.
What a nonsense cartoon. EVs on the U.S. grid are quite clean compared to normal petroleum fueled vehicles: http://www.ucsusa.org/clean_vehicles/smart-transportation-solutions/advanced-vehicle-technologies/electric-cars/emissions-and-charging-costs-electric-cars.html#.VRrMPO7F958
Wouldn’t the grid need cleaning anyhow if it was as dirty as depicted? Emissions aren’t the only reason to do EVs anyhow. Peak oil would be one of those reasons. Another that is frequently addressed on this site is energy security.
Hey Monsta666.
Why did you make this comment? You should have let Ron answer the question I asked instead of stepping in the middle. You did this on purpose. What do you have against me? Did RE send you?
Of course, Ron removed my original question to him. Then he put your comment down here at the bottom of the page, followed by his comment, then Javier’s, all jumbled out of original order. Very clumsy editing.
Loren Soman (futilitist)
If this site does not meet your expectations to content, why do you not (together with your follower!) start your own site?
I understand it is both depressing and disappointing for you to wake up day after day after day through several years just to discover that collapse (according to your expectations) have not happened.
Has the etp model been subject to peer reviews?
Just to illustrate how curve fitting may be applied, I curve fitted (exponential) the oil price developments as from 1859 to 2013 (BP data so everyone who wishes can try it by downloading BPs Statistical Report) in several steps;
1859 – 2013
1960 – 2013
1970 – 2013
1980 – 2013
Guess what?
Using the data set as from 1960 to 2013 gave the best fit (R squared). This does not give the model any predictive powers.
So why is the etp model just covering the time span 1960 – 2013? Why not 1900 – 2013?
You base all your expectations around some model and if this is the “holy grail” of all oil models I take it you have studied it and have such insights into it that it would be easy for you to convince others about the etp model’s powers. When called upon to do so (about the etp model) you stonewall or refer to the owner of the etp model. That is not a reassuring response.
As shown above a simple curve fitting using price data from BP for 1960 – 2013 results in just as good a predictability.
What if your world view has been shaped from a model that has several flaws, where do that leave you?
Excellent comment Rune but it reminds me of the time I tried to argue with a Jehovah’s Witnesses (You know, the door-to-door preaching-dudes known for The Watchtower and Awake!) In other words, you would have more chance of success talking to a fence post because these guys already have ALL the answers. For the record, I’m a curve fitting skeptic as well.
Hello Doug and Rune.
Welcome back from the physics conference, Doug.
Rune, you are going to Rune your reputation.
Please take the Futilitist Collapse Challenge. I dare you.
http://peakoilbarrel.com/eia-confusion/comment-page-1/#comment-504528
No one here has ever beaten the Futilitist Collapse Challenge.
PS—
Rune, I have asked you nicely to stop repeating my real name over and over again. Oil depletion is a very sensitive and emotional subject. People are tense. It sounds very much like you are trying to encourage some nut job to hunt me down and kill me. This is very uncool. You have crossed a dangerous line with this. Please stop at once.
Call me Futilitist.
Relax, you’ll live longer that way.
Lighten up, Francis
The birds in the trees thing sounds real scary and all, but there is no time frame given. That is soft pedaling.
And that is pure bullshit. Only a fool gives exact dates for future unknown events.
Why did you give a tireless climate change denier, like Javier, a guest posting at the top of your site? It does not reflect well on your judgement.
Several people have emailed me questioning my judgement as to why I let such a bullshitter like yourself continue to post on this site. I am beginning to see their point.
I’m baffled also.
Ron has launched my go to site on energy and oil, and has great traffic, a good and very literate group that I learn from daily, and Ron is science centric and uses equanimity.
Imagine a first time visitor enchountering Javier as a lead presented on a topic?
They would run in horror from that ideological simpleton.
Would this first time visiter be more impressed by a dogmatic poster stating I will countenance no belief other than my own?
If it was no belief but my own.
However, that is not the case, by simple observation.
Postmodernism is so in the rear view mirror.
cytochrome C, are you Futilitist?
I haven’t a clue.
I have so many avatars, I often get confused who I am.
But it doesn’t ring a bell.
Last time I checked, I was a small hemeprotein found loosely associated with the inner membrane of the mitochondrion.
Fair enough. I seem to recall Futilitist mentioning some sort of educational background in biology.
Although I have taught biology, environmental education and ecology, my main work is with history and politics.
Energy is consuming more time, but I’m a neophyte.
Climate takes a bit of my time.
The illiteracy on that subject is astounding.
As one who is not specialist in some fields I want to get a better picture of, it can be frustrating to get a clearer picture sometimes. I realize that is not always possible, but still.
Last time I checked, I was a small hemeprotein found loosely associated with the inner membrane of the mitochondrion.
I believe you are also involved to some degree with both respiration and photosynthesis and can be found attached to chloroplast membranes as well, which probably means you are about 3.5 billion years old. Which also reminds me that Chlorophyll and Hemoglobin have rather similar structures.
Real scientific inquiry is so much more interesting than this politically and ideologically motivated doubt mongering BS we have been seeing here recently! But it seems there is a group of people with vested interests for whom the scientific truth is quite inconvenient. Try as they might, in the big picture and the final analysis their attempts at obfuscation won’t matter, because as the late great Richard Feynman was wont to say: “Reality must take precedence over public relations, for Nature cannot be fooled.”
Hi Ron.
“I don’t soft pedal anything here.”
Why did you post Javier’s article without checking his qualifications?
Please don’t throw this in the trash like you did last time.
This place is like a three ring circus.
Most discussions on population talk about percentage growth figures such as 1.1% per year. This sounds innocuous enough. What 1.1% per annum really means is that the number will double in 65 years.
The staggering extent of the problem is better understood by our limited human brain, when we distil this down to a daily number. For example the Indian population grows by around 41,000 !!! each and every day. Their fleet of motor vehicles grows by around 27,000 every day. The Chinese population grows by 16,500 every day. The United States population grows by 6,575 every day.
These a mind boggling numbers that much better communicate the state of emergency we are really in. Humanity has become a raging pest. We can assume that the fleet of motor vehicles grows by at least a similar proportion of population growth of India which is about two thirds. For every 3 additional world citizens we have 2 additional motor vehicles. Our already choking cities are burdened with yet more exhaust and trash in addition to the already astounding numbers. And the demand on oil becomes greater accordingly. This happens the world over.
I cite these examples to illustrate the magnitude of the problem in a digestible fashion. Each month America has to build the equivalent of a new town of 200,000. We need to declare human population growth the number one emergency. What poses as economic growth to which our politicians congratulate themselves, is in reality a bubble that must come crashing down.
Would all discussions on population please use digestible daily numbers for better communication? Talking about the decline of the rate of growth hides the problem from the untrained mind.
The World Bank has annual population numbers for each country. Simply deduct last year’s number from this year’s and divide it by 365 to arrive at the daily increase.
Unfortunately we are politically and economically of the perspective that DEpopulation would be a problem. The economists and politicians of the world agree that a growing population is the only way to make social programs sustainable, and improves GDP growth in general.
Because of this no politician in any major developed country will embrace depopulation, and will likely continue to do everything they can in terms of incentives to coerce their population into increasing.
Since the current view is on the complete other end of the spectrum it will take a long time for political perceptions to switch. I don’t have much faith that the worlds leaders will embrace even stagnant population growth in the near future. They look to countries like Japan, and see a declining population is a major problem… not an asset.
This train has no brakes, which is pretty unfortunate because the only thing that will stop it is a concrete wall.
Growth is a basic human desire. We expect children to grow. We expect plants and trees to grow. We expect to grow our knowledge base. We expect our bank accounts to grow. We expect our number of Facebook friends to grow. Growth in GDP causes the economy to grow. Businesses grow market share. Population decline is too depressing, so we want population growth. It’s that simple. 99% of the population is going to say growth is the most desirable thing for everything – children, knowledge, salary, economy, business, and, most importantly, humanity.
Until we can no longer feed ourselves, then we’ll see if people still demand more growth!
Co2 is a plant food right? Nice!!! That has left a bad taste…
10 billion. …. Good luck with that…
Thanks for the good posting.
Even though we may be using the incorrect terminology when we say “overshoot” or carrying capacity” (from an academic standpoint), nonetheless most people who use these terms have a good sense for the meanings on a practical basis and I therefore think it is just fine to keep using them to discuss these issues.
We are clearly in population overshoot on the basis of energy alone, not to mention issues like water and soil.
I also concur with the author that global cooling will be a bigger threat to the human population than global warming- in the long run. But in the short run global warming is likely to be a vary big problem, particularly in regard to water supply.
How could that be? From a global point of view a warmer world has a more active water cycle and is wetter. Globally we could get more floods, but on average plant productivity increases due to more water availability. We know that not only from theory, but also from palaeontology.
Now regionally you could get some areas to become dryer due to local conditions, like South Western US, but globally water supply is going to improve due to warming.
Javier, you are about to be attacked mercilessly. The warmer wetter world does have a positive aspect, but there’s also a negative due to sea level rise. I think we should be fine until average temperature increases about o.8 degrees C above last year’s average. That shouldn’t be reached until 2100 given the current climate performance.
Yeah, I know, puff.
Hi Fernando,
I think it may warm somewhat faster than you believe, but let’s say your somewhat lower estimate is correct, it will continue to warm after 2100 because there will be a lag due to the energy being input into the ocean. If carbon emissions are only 1300 Gt and climate sensitivity is only 3C, we might remain under the 2C temperature limit (atmospheric CO2 at about 500 ppm).
There are risks that less carbon may be sequestered in the future, that carbon emissions will be higher than 1300 Gt, or that equilibrium climate sensitivity(ECS) will be 4.5 C. The higher ECS would lead to 2.6 C of warming and I have ignored methane and other greenhouse gases.
Note that some theories suggest 600 ppm of CO2 in the atmosphere is a tipping point that would result in deglaciation of the Antarctic. Atmospheric CO2 has been below 600 ppm for the past 40 million years. Global temperatures of only 2 to 3C above preindustrial may result in significant polar warming which could potentially cause a loss of the Antarctic and Greenland ice sheets and significant sea level rise (this would take thousands of years). The reduced albedo would result in further warming.
I guess there are some people that dismiss the idea that warming above 2 C above preindustrial is a problem. Pointing to a time millions of years ago when carbon dioxide levels in the atmosphere were much higher seems pretty silly to me. In the past 40 million years CO2 has been about 600 ppm or lower.
I would think someone with Javier’s background would realize that evolutionary changes don’t happen all that quickly and the current flora and fauna of the planet are not well adapted to global temperatures of say 4C above preindustrial temperatures (Holocene from 5000 BC to 1750 AD average global temperature.) Perhaps my understanding of the speed of evolutionary changes is flawed.
Precisely, someone with scientific background has to be very skeptic of big claims (not talking about you) based on poor evidence.
Global mean temperature is a really a bad measure for about any discipline that I can think of. We are pretty certain that temperatures during Eemian interglacial were higher than today’s, and almost all species were alive then. D-O events cause very abrupt climate changes during glacial periods, at least as abrupt as today’s.
Tropical species are not affected by temperatures changes because of the gradient makes changes there very small. Higher latitude species react by changing their range, moving North or South as required. There is very little evolution involved. Actually evolution is favored by populations that get isolated by climate change. Goats evolved that way when the Sahara dried up.
Species have to worry about us. We are their main problem.
Hi Javier,
Trees have difficulty migrating and not all species can adapt to warmer climates. It was a little warmer during the Eemian, no more than 2C above Holocene pre-industrial. Most biologists think more than 2 C above pre-industial Holocene average temperatures will make adaptation difficult for a majority of the Earth’s fauna and flora.
I am fairly sure that other biologists are familiar with migration, that alone will not solve the problem.
Yes man is the main problem, unfortunately the climate change will only make things more difficult for other species. Warm weather is nice, but it can be too warm for many plants and animals.
Tree species have no difficulty migrating and taking refuge in warmer or cooler areas as required. They do have problems crossing high mountain ranges like the Alps, but even that they manage. See: Brewer et al. 2002 http://www.gi.ee/~veski/10688.pdf
Palinology shows the comes and goes of vegetal species with climate changes. Figure 15 in my article above is an example.
Two degrees above Holocene puts Eemian temperatures were no modern man has gone before. Over a degree higher than 2015. We will see when we reach that if we ever reach that.
Since climate change is not the problem for species, but mankind, we are not going to solve anything focusing on the wrong problem and should instead focus on stopping man-made diversity destruction that have been proved consistently and without question.
Climate is always changing. The species that we destroy are gone forever.
Hi Javier,
Yes the species that are destroyed by all of man’s actions including rapid climate change due to a very rapid increase in CO2, over hundreds of years rather than millions of years, will be gone forever.
Dennis, can you tell me a single species that has been driven extinct by current warming?
Cold has been the mass killer of species during Earth’s history, and mankind is the main species killer nowadays, but by habitat destruction mainly followed by contamination, not by climate change.
Hi Javier,
The reasons for any extinction are complex, no single cause could usually be given.
In most cases extinctions are no doubt due to habitat destruction by humans. If the polar bear becomes extinct, climate change will be a major part of the cause.
Polar Bears evolved about 400 Kya which means that they have gone through 3 interglacials, including warmer Eemian. Why should they go extinct by climate change at this interglacial?
Besides, polar bears are not an endangered species. Around 1000 are hunted every year from a total population of around 25.000. If we want them to increase to their carrying capacity we can always stop hunting them.
All these extinction by climate change is magnified. We drive species to the edge of extinction and when something pushes them over we claim that was the cause. As long as we leave species alone, they have nothing to fear from climate change. They’ll do better than us when the next ice age comes.
So, to conclude. Zero species gone extinct from climate change. That’s an impressive number.
Hi Javier,
Species extinction is really not the major issue for climate change.
So you win that I guess, I will leave it to others to argue the point.
If you are arguing that no species have gone extinct solely because of climate change, that is an argument that it easy to win.
There have likely been zero species extinctions due to a single cause of any kind. So if this is an argument that climate change that is very different from previous interglacials (where CO2 was likely no higher than 300 to 320 ppm) will not be a problem, I think that is unproven.
Most biologists think that global temperatures of more than 2 C above preindustrial Holocene averages will be a problem.
We may reach much higher temperatures than this due to earth system effects (due to lower albedo from changes in ice cover and vegetation cover).
The lack of understanding of the climate system should be a reason for caution rather than the reverse.
Not at all. We know of hundreds of species, perhaps thousands gone extinct by a single cause. From introduction of a new predator in an island ecosystem to the land connection between North and South America.
You have a biologist here thinking otherwise. ∆T of 2 ºC over Holocene average is what we had during Eemian. Mankind and 99% of extant species went through that unscathed. Those are facts. They do not support a catastrophic outcome.
If cautious means doing more research and finding solid evidence before making big bold claims, I am all in favor. If it means taking decisions that put our global economy at risk, based on weak, inconclusive evidence, then we don’t agree about the meaning of being cautious either.
Hi Javier.
Post your CV please.
Giant Camel Roamed the Arctic
Evidence of climate change:
https://www.youtube.com/watch?v=aDXYx9eb7sE
But Fernando says he is a “highly educated engineer with a genius IQ”
He doesn’t need to show his work because he is evidently smart enough to do it all in his head. Apparently you can simply trust all his assertions concerning global warming.
Personally, I prefer Fernando’s mind to the East Anglia (?) fraudulent science as documented in their own emails.
Clueless “knows” that someone somewhere in the UK did fraudulent science because some (stolen, private) emails said so.
Clueless “knows” this, despite not being able to cite the institution or people involved.
Clueless “knows” that all climate science must therefore be dodgy and isn’t worth bothering with.
Clueless is a good name!
Clueless is infected with a denier meme brain worm, please provide appropriate medical care!
Rowan, clueless was simply defending me from a cheap and scurrilous attack, expressing the fact that I’m more trustworthy than the East Anglia folk were in their heyday. I tend to agree with clueless 100 %.
Hi Fernando,
So the baby should be thrown out with the bathwater. Should all knowledge from climate science be ignored, because a few e-mails. Seems a little extreme, it actually seems that you find Javier’s views on climate change a little extreme, though if you don’t step up people will think that your views are similar to his.
Dennis, I stated I’m more trustworthy than the East Anglia folk. This is a true statement. You are extrapolating beyond what I wrote.
Hi Fernando,
We will just have to trust you on that. 😉
The “climate gate” emails is a knows fraud. While the emails are real, the interpretation made by denialists are false. The emails are published on a web site (google and thee shall find) so anyone can read them. The claims by denialists have been analysed (google again) and those claims have been proven false.
Climate Gate is yesterdays news, if they ever was. Move on.
From a global point of view a warmer world has a more active water cycle and is wetter. Globally we could get more floods, but on average plant productivity increases due to more water availability.
When a lay person makes such a black and white simplistic statement I take it with a grain of salt but when a scientist with a background in the biological science says that I really have to wonder.
See my comment down thread.
“How could that be? From a global point of view a warmer world has a more active water cycle and is wetter. Globally we could get more floods, but on average plant productivity increases due to more water availability”
California farmers are loving all the extra CO2
http://www.wsj.com/articles/central-california-farmers-anticipate-no-federal-water-amid-drought-1425060533
That’s a local effect. Overall the earth is getting greener, and the water cycle does accelerate and it rains more as the world warms. I could point out its rainmg more in the Atacama desert, but that’s weather. It has natural variations and odd events.
Hi Fernando,
It is true that it rains more and that the events tend to be more extreme where the rain in heavy amounts over short time spans does a fair amount of damage to the flora and mostly runs off into the rivers and oceans.
Were you joking about sea level rise? At a CO2 of 630 ppm (your estimate I believe) there is some chance of the melting of Antarctic and Greenland ice sheets which could lead to significant sea level rise, though it would likely take hundreds of years.
A 4C rise in global temperatures coupled with polar amplification (when earth system effects such as albedo changes kick in) could lead to large sea level changes. You said we should worry about sea level, but you did not respond to Javier’s assessment that sea level would be no problem until 2100 (which is likely correct).
I wrote that sea level rise was my main concern. This means I’m not that concerned about the other stuff. I think it’s exaggerated and hyped.
Maybe the government has a secret peak oil agenda and they want to scare people with this global warming bs?
Hi Fernando,
The fact that our understanding of the climate system is incomplete makes some people uncomfortable with experimenting with the climate with geoenginnering.
Many scientists, and the majority of experts in the field of climate science think that the conclusions reached by you and Javier are incorrect, as do I. Sea level rise will be a problem, global temperatures of 3 or 4C above preindustrial Holocene averages will also be a problem in my opinion.
In fact the solutions to anthropogenic climate interference and peak fossil fuels are largely similar.
For that reason I am not sure why I am arguing about it except that I disagree strongly with the notion that atmospheric CO2 at 600 ppm will be no problem, the earth has not seen atmospheric levels that high in the past 25 million years or more. It will take thousands of years for those levels to decrease back to 400 ppm.
What we are doing is normal.
This is what we are supposed to do.
There is no feeling involved.
Pretty black and white to me .
The answer is there is know answer .
When man made time is up ,its over.
P.S…..if we can fiqure out the void (darkness)of our sleep you will get your answers.lol
To make a big song and dance out of overpopulation is no differnet then a five year old asking why he was born ..haha
For some reason the English version of the model figure didn’t make it to the post. Perhaps Ron can add it to the post.
I have made the correction.
The Earth has been in substantially warmer, wetter and more CO2 than today passed, and the effect has been more productive Earth. In fact fossil fuels have occurred in times like this. Based on all this evidence it is logical to think that humanity has little to fear of global warming on what their capacity is concerned. Not so with respect to a global cooling that would be extremely dangerous .
Actually there is nothing logical about that statement! Just because there were massive algal blooms when the earth was warmer, wetter and had more CO2 than today it doesn’t follow that humanity will continue to prosper in such an environment. Furthermore there seems to be evidence indicating that the kinds of vegetation that do benefit from such conditions are not necessarily those that benefit us or for that matter, that increased Co2 benefis plants in complex 0ld growth rainforest ecosystems.
I recently posted links on this site to scientific papers showing a link between increase in CO2 and old growth trees dying of more quickly after an initial growth, it seems these trees show a sped up life cycle, displaying high early mortality rates thereby increasing desertification of rain forests. Given the population pressures humans are already placing on such sensitive ecosystems I would not be making blanket statements about how great a warmer, wetter world with higher levels of CO2 will be!
Anyways the point may be moot because our recent population overshoot seems to have been in large part a consequence of our easy access to fossil fuels and we may indeed be due for a major correction caused by a populational die off as our agricultural systems become less and less productive in an age of diminished and more difficult access to cheap oil!
Coming from someone who is a scientist with a background in the biological science, this overly simplistic idea that CO2 is automatically good for plants, is rather troubling to say the least. And satellite images of areas of expanding vegetation tell us very little about the quality of that expansion or what the unintended consequences might be.
Perhaps some global cooling would have been a good thing if it had kept our population from growing the way it has.
Any generalization is simplistic, however the only hard evidence that we have is that >200 years of warming had been good to mankind’s agriculture (only last 70 with widespread oil use). The burden of proof is on those defending that the continuation of this warming trend is going to reverse its effect.
Any climatic change is good for some plants and bad for others. The observation is that distribution ranges change, as in the figure of arboreal pollen from lake Van in Turkey show.
¿Where do we have warmer and wetter conditions? In the tropics. ¿How does tropical vegetation productivity compares with higher latitude productivity? I will leave that one to you.
Sea level rise should be the main concern.
I am not very concerned with sea level raise. It has been 1.5 mm/year for the last 200 years, with peak rate at 2.5 mm/year. Even if it goes up to 3.5 mm/year by 2100, we can perfectly cope.
Please note that sea level rise has been linearly accelerating since 1750, while anthropogenic forcings have been rising only from 1960, so it is difficult to conclude that they are related.
Hi Javier,
If one thinks in very simple terms, that would be the case, but the issue is more complex than anthropogenic forcing increases, therefore sea level rises, there are natural forcings which change over time (solar, volcanoes, natural system variation due to ocean current effects, etc.) and there is movement of the underlying ocean floor as well.
I am all in favor of natural forcings that change over time. Why don’t we see them in IPCC reports? It is all man-made there.
Hi Javier.
I don’t think you are a real scientist. Please post your CV. Thank you.
when unable to attack the argument, attack the arguer. Typical Ad Hominem tactic.
By the way, I am in the Bakken right now.
My CV includes metallurgy, materials science, electrical engineering, failure yield analysis, and 30 plus years of solving complex problems for a profit.
I absolutely deplore how transparently some posters (posers?) devolve every post comment string into the religious debate about “climate change”.
No, I am not one of your acolytes, and no, I will not be drug into your endless circular arguments that only end in shrill name calling and accusations.
I come here to find the data needed to plan accordingly for whatever reality is to follow the immensely cheap-to-date energy stream that liquid fossil fuels provided to modern civilization.
As for the rest of the mindless conjecture and personal assaults and diversions from an otherwise worthwhile debate, I’ll use an easily understood term used almost daily in the patch: Blo Me.
At the end of the Permian when temperatures shot up there is evidence that H2S producing creatures proliferated (the oceans basically rot). The end of the Permian was the worst mass extinction in Earth’s history, it’s unlikely mankind can survive that type of event.
Methane from hydrates and permafrost melting is a big part of the problem, even if civilization collapses tomorrow, we may already be past a tipping point and CO2 levels will continue to rise for a very long time.
You can worry about meteorites and solar flares also. Sulphur bacteria are killed by oxygen, so they are confined to the bottom of the seas and other anoxic places. The chances of a return to Permian conditions are nil.
We do not know if CO2 levels will continue to rise for a very long time. Past experience is that when temperatures go down, CO2 goes down. There is a delay but that is what has happened many, many times before.
Hi Javier,
There is very little evidence that CO2 levels have been as high as they are at present for 800,000 years. About 40 million years ago Antarctic glaciation began when CO2 dropped to 600 ppm.
It will take 25,000 years for CO2 to drop to 300 ppm from about 500 ppm (if we manage to keep CO2 that low), your concern over ice ages is unfounded in the near term.
Sea level was much higher during the Eemian, but the forcings were different. Sea level will be a problem in the future, but in the near term you may be correct, the understanding of how quickly the ice sheets will melt is not very good, hard to say how quickly it might accelerate at the climate continues to warm.
Yes Dennis, you are right that there is little evidence of higher CO2 levels in the past, but considering how little evidence we have of past CO2 levels, absence of evidence is not evidence of absence. We cannot and should not rule out higher CO2 levels in the past.
We don’t know how fast can CO2 levels drop. As far as I know during glacial terminations they fall pretty fast, perhaps with a delay of a few thousand years. But the general problem that I have is with your belief that temperatures follow CO2 and not the other way around. We have lots of records were CO2 is following temperatures. If the Earth was to cool down in the next centuries we would most likely see a drop in CO2.
Sea levels is one of the best proxies for temperature. We know that sea levels were higher in Eemian, we know that temperature was higher in Eemian and we know that Greenland ice sheet did not melt and Antarctica did not melt in Eemian. Climatologists keep saying that this time is different, now I have heard that a lot in economy and investment and usually preceded significant loses when it turned out that this time really was not different enough.
Little Ice Age was a warning. The end of the Holocene is getting closer. There is the question if high CO2 levels could change that. My belief is that they will not. Earth’s neogene climate moves between two quasiestates and the cold one dominates the system 85% of the time. I don’t see that changing just because we are farting a little CO2 into the wind.
Hi Javier,
If we choose to ignore the ice core evidence, I suppose we could make up any belief we choose.
Do you have some peer reviewed literature that suggests global atmospheric CO2 levels were much higher than 300 ppm over the last 800,00 years (excluding 1950 to 2014)? The eemian temperatures are well explained by the evidence we have. You can offer alternative explanations, but they must be backed up.
Hi Dennis.
Around here? Since when?
How come these rules don’t apply to you?
I agree with what you’re saying, but I must ask – wasn’t the continent of Antarctica much further North 40 million years ago as well?
I’d imagine using Antarctica as a reference that far back is a bit more complicated than simply CO2 since continents move and ocean circulation changes quite a bit as continents shift over millions of years.
Not to say that it invalidates what you’re saying since I presume you have a source for the connection between an icy Antarctica and CO2 levels.
I often wonder if the release of CO2 through fossil fuel combustion isn’t actually a good thing on a geological time scale. We’ve had quite a lot of Ice Ages over the last few million years!
Let’s face it, biological diversity is much richer on a planet with less tundra. May be a bit rocky for the next 10,000 years, and very bad for Homo sapiens well being, but on a longer time scale we may be doing the planet as a whole a huge favor.
We’re not creating CO2 out of thin air. It was once in the atmosphere, and without us clever apes a majority of it may have been forever trapped in the Earth.
Then again, on geological time scales things like the Sun’s increasing luminosity, and changing ocean currents due to the effects of continental drift likely make our impact questionable due to their out-sized influence.
I suppose I’m skipping over the series of regular 10,000-200,000 year processional cycles that force climate changes on the Earth. I know we are at a phase of these cycles where the Earth should be cooling, so clearly our impact is already large enough to supersede their influence and we haven’t even experienced the warming that is “baked in the cake” from our current CO2 levels. I know very little on this subject, so I’m hoping you can elaborate on all this, and lend me a more concrete knowledge on my thinking.
Sea. Level rise should still be a concern regarding what happens if temperature rises 1 degree above today’s temperature. I believe thats global warming’s worst economic impact impact. Higher seawater temperatures do increase sea level. And it really doesn’t matter if the temperature rise is anthropogenic or natural.
Well, obviously we should keep an eye on sea levels, but, is there reason to believe that the sea level is going to raise by a couple of meters in the next 100 years? The answer is no. At current rates we can expect 25 cm in a century. At accelerated rates 35 cm. That is only fast in millennial terms. Of course rates can change, but not only to more, also to less.
Going to problems, yes. You can get some problems from a 35 cm raise in sea levels, but they are easily countered by adequately protecting cities. Of course you have to do it right like the Dutch. Much of their country is below sea level and I don’t see them so worried about sea level raise.
What I see is the Tuvalu people doing everything they can to damage their islands and then asking for compensation at the UN. Coral atolls have been there during past glacial periods so they have seen changes of hundreds of meters and did fine.
The data coming out over the last 2 years concerning Greenland and Western Antarctica have the scientists studying these areas… well… how do I put this – the people who study those two regions are truly astonished at how quickly Greenland and West Antarctica have destabilized.
What has happened over the last two years wasn’t suppose to happen for another 50 years, if at all. Massive sections have begun irreversible collapse. The people whose lives are dedicated to collecting and analyzing this data are saying the IPCCs estimates are radically, radically conservative due to what has happened, especially in 2014.
These ice sheets have undergone this radical shift with much less warming than expected, and there’s nothing we can do about the warming trend we’ve already guaranteed ourselves for the next several decades.
It is not a fringe, or conspiracy subject matter. It is the most recent events, their magnitude, and scope that have caught researchers by surprise. It’s actually quite scary and completely unexpected what has happened to these ice sheets recently.
Sea level rise thus far has been almost purely due to water expansion due to ocean heating. We have not seen the effects of seas rising from ice sheets melting, and the ice sheets that have destabilized are the land based ones that will make sea level rise due to thermal expansion look like a farce.
I highly suggest watching the award winning 2013 documentary “Chasing Ice” on Netflix, and this 2015 Vice documentary on the Greenland and West Antarctic ice sheets: https://www.youtube.com/watch?v=7Yq-sfWSWLg
Most of those videos are created to feed on climate hysteria. They are like “The Secret Life of Jesus: From Carpenter to God” for evangelicals.
As I wrote I’m concerned about sea level rise because I think that’s the worst impact from global warming up to an additional 1 degree C increase (more or less). Evidently it’s a teensy impact, and the impact of global warming is overall positive, probably until the end f the century.
Lucky for us, there’s more snow fallng in Antarctica and Greenland, and Antarctica, other than the W. Antarctica peninsula and nearby areas, seems to have more ice. Sea ice is also increasing around the continent.
“Most of those videos are created to feed on climate hysteria”
Take 5 seconds to research “Chasing Ice”. It’s about hard science, as is the Vice documentary I linked.
But you did an excellent job showing how reliant on research and evidence you are instead of subjective emotional reaction.
I gave detailed information, and then presented two sources that are highly regarded for their scientific accuracy, and, without doing one modicum of actual research to analyze these two documentaries specifically, you instead say “Most of these videos are created to feed climate hysteria”.
I don’t disagree with that statement, but it is an egregious, stubborn defense of ones own ignorance. If someone says “Daniel Kahneman is a well respected research psychologist who won the Nobel prize for Economics” you do not respond “well most research psychologists are quacks”. No shit, that’s why I cited one specific example instead of “most climate change videos”.
Judge it on its individual merits, instead of disregarding it without even doing 1 second of research and throwing out useless dribble like “most carrots are orange”. Yes, most, but not all, and not the specific ones I cited.
Sorry if that’s a bit harsh, but if there’s one thing I cannot stand it is someone failing to critique the validity of a specific source material by using the logical fallacy of a straw man to make sweeping generalizations.
Tell me why those 2 documentaries, and the info in them is inaccurate. Compose a literate criticism, and act like the intelligent man that I know you are. You’re an incredibly sharp guy. I am shocked to see such a poor statement coming from you.
Disprove them on their specific merits, and I will be glad for I will have learned something new instead of adamantly defending a false reality.
I don’t usually watch videos like that. I read papers. books and blogs.
Right now I’m watching Bulgaria beat Italy but I’ll see if I can watch it later and give you my critique.
I saw your video. It’s BS. Intended to feed climate hysteria.
Have those scientists published those findings? It sounds quite amazing, since during the past interglacial the world was warmer and yet nothing of that sort happened. Sea levels were higher and there was less ice, but Greenland and Antarctica continued the same or we would have no ice cores to study.
The average temperature is always much less than freezing there. As long as water evaporates and precipitates over the pole, the ice will accumulate.
Hey WebHubTelescope,
Just hypothesizing but is it possible that the unusually rapid rise in CO2 levels could cause a historically unique situation with maulins, melt water, and lubrication that has no comparison to previous warming events?
Previous warming cycles happened more gradually, so perhaps maulins are larger and absorb more heat than previous cycle due to albedo effects. Simultaneously there may be a far larger accumulation of water lubricating the bottom of ice sheets in Greenland.
A drizzle isn’t enough to cause a car to hydroplane, but a downpour will. How rapidly CO2 levels rose may in itself be a positive feedback loop compared to historically similar events.
This is total conjecture that I don’t necessarily subscribe to, but I am certainly curious. The result would be a relationship between CO2 levels and ice sheet melt dependent not only on CO2 levels alone, but also the rate of increase in CO2.
Previous cycles may have happened gradually enough where lubrication and albedo effects did not happen quickly enough to truly get the ball rolling if you will.
Such a scenario clearly isn’t happening yet. There is no historic precedent, so it wouldn’t be in the models until it already was underway.
It’s a phase change scenario where a car doesn’t show any sign of hydroplaning as the ground becomes more saturated… Until suddenly, it does.
It’s a weak analogy that I don’t mean as literally or dramatically as it implies, but it’s certainly worth thinking about.
Hi Javier,
The preponderance of evidence suggests that during the eemian atmospheric CO2 was around 300 ppm at its peak. Without anthropogenic interference atmospheric CO2 levels remained between 170 and 300 ppm from 800,000 years BP to 1950 AD. If atmospheric CO2 doubles and the earth system sensitivity is 4.5 C, less than the glacial to interglacial value due to the absence of large ice sheets in the Northern Hemisphere, then we begin to approach the point where there may be significant melting in Antarctica and Greenland, it is doubtful that the ice sheets would disappear, but significant sea level rise would result (over perhaps one to two thousand years).
Say what? 4.5 ºC sensitivity? Roger Andrews did a bibliographic statistic to see what sensitivity values were climatologists currently measuring, and it came out below 2 ºC, with a high likelihood to go below 1.5 if current temperature plateau continues a few more years.
http://euanmearns.com/zeroing-in-on-the-true-value-of-climate-sensitivity/
We are still far from Eemian values of temperature and sea level. We are most likely below Holocene Optimum temperature values. There is no guarantee that warming is going to continue. Regarding CO2, we don’t really know. Besides the problems already commented, those values are really averaged over many decades or centuries, so if there were spikes like ours for just a few decades we would not detect them.
Hi Javier,
The level of CO2 in the atmosphere decreases very slowly over thousands of years, temperature can spike from volcanoes or changes in ocean currents but the CO2 in the atmosphere decays slowly.
The ice age cycles indicate an earth system sensitivity(ESS) of 6 C over thousands of years as vegetation and ice sheet changes equilibrate due to a hypothetical doubling of atmospheric CO2. I reduced this to an ESS of 4.5 C as a rough estimate due to smaller ice sheets than a glacial maximum.
The equilibrium climate sensitivity(ECS) is uncertain and mainstream climatologists (Roger Andrews is not a climate scientist) put the ECS at 1.5 to 4.5 C with a central estimate of 3 C.
Note that the safe approach is to assume higher levels of sensitivity, just as one would not build a bridge to support half the expected load, you would typically build the bridge a little stronger than necessary (typically 2 to 3 times the expected load) just to be safe.
Assuming ECS is 1.5 C is like building the bridge so that it will collapse when the first heavy truck tries to cross.
Hi Dennis,
That is not true according to stomata evidence. In this graph you have proof of very rapid decreases in CO2 of about 100 ppm in about a century or two.
You missed the point. Roger didn’t make an estimate, but a bibliographic research. The value of < 2 ºC is the average from every climatologist that is measuring it and published their results during 2013-14. That is the value that climatologists believe to be true now, not 5 years ago. I guess that the ∆T (anomaly) plateau is making wonders in real sensitivity measurements.
I did not understand the engineering analogy. Scientists do not put safety margins on their measurements.
Hi Javier.
I don’t think you are a real scientist. Please post your CV. Thank you.
¿Where do we have warmer and wetter conditions? In the tropics. ¿How does tropical vegetation productivity compares with higher latitude productivity? I will leave that one to you.
No, please don’t leave it to me because there are 100 scientists eminently more qualified than myself who have spent the last 30 years doing research on precisely this topic. I’m sure that as a scientist you have access to the Journal Nature and you can go there to read the full paper yourself should you wish to do so. Who knows you might even be able to publish a paper of your own that shows that this research was poorly done or the interpretation of the data flawed in some way. So I invite you to refute their findings if you can.
In the meantime here is a summary of their findings:
http://www.sciencedaily.com/releases/2015/03/150318145416.htm
The results of this monumental 30-year survey of the South American rainforest, which involved an international team of almost 100 researchers and was led by the University of Leeds, are published in the journal Nature.
Over recent decades the remaining Amazon forest has acted as a vast ‘carbon sink’ — absorbing more carbon from the atmosphere than it releases — helping to put a brake on the rate of climate change. But this new analysis of forest dynamics shows a huge surge in the rate of trees dying across the Amazon.
Lead author Dr Roel Brienen, from the School of Geography at the University of Leeds, said: “Tree mortality rates have increased by more than a third since the mid-1980s, and this is affecting the Amazon’s capacity to store carbon.”
Initially, an increase in carbon dioxide in the atmosphere — a key ingredient for photosynthesis — led to a growth spurt for the Amazon’s trees, the researchers say. But the extra carbon appears to have had unexpected consequences.
Study co-author Professor Oliver Phillips, also from the University’s School of Geography, said: “With time, the growth stimulation feeds through the system, causing trees to live faster, and so die younger.”
I am curious to hear your scientific opinion with regards this topic and if upon reading the paper you might be at least a bit more cautious about making blanket statements about the unequivocal benefits of increased atmospheric CO2 concentrations to tropical rain forest vegetation.
Thank you for bringing this article to my attention, Fred.
Ok. This very extensive and interesting study clearly states:
1) That there is a decline in carbon sink in the Amazonia due to higher tree mortality that contrasts with an increase in terrestrial global carbon uptake. They provide more bibliography on the global phenomenon:
Ballantyne, A. P., Alden, C. B., Miller, J. B., Tans, P. P. & White, J. W. C. Increase in observed net carbon dioxide uptake by land and oceans during the past 50 years. Nature 488, 70–72 (2012).
Le Que re , C. et al. The global carbon budget 1959–2011. Earth System Science Data 5, 165–185 (2013).
They do not know the reason for the higher mortality.
2) That they observe a long term increase in productivity that still continues (see figure). ¿Didn’t I tell you? All these experts are not contradicting me. They are contradicting you.
3) To reconcile these two observations they have an hypothesis. This is pretty normal stuff. You have to have an hypothesis, but the hypothesis is not the data, you can take it or leave it. Different hypothesis can explain the same data. They propose that trees are living “la vida loca” and dying younger.
4) That all this is contrary to expectations based on models. Big surprise. What models predict doesn’t happen, and what does happen models don’t predict.
To conclude, most people have the wrong expectations about nature and about climate. They expect that things should remain the same and if they don’t something must be wrong. But the fact is that nature is changing all the time and climate is changing all the time. If you record something for 30 years you are bound to find changes (that guarantee you a publication at least). It is interesting that one records those changes and better if one can find why they take place, but for all we know, these dudes may have stumbled on a cycle of some sort produced by climate or what else, and if they continue their study 30 more years they might see those trends reverting. Alternatively contamination might be killing old trees faster as we increase our numbers. Hard to tell. More research is needed so keep the grants coming.
Maybe they need to look at rainfall and river flow. I noticed the jungle and the eastern slope of the Andes is really humid, this could lead to more rain, increased erosion in the mountains and a variable flux of water and sediment as the climate oscillations alter rainfall patterns. Do you want to see a map displaying humidity?
Maybe they need to look at rainfall and river flow.
Really, Fernando? You don’t suppose that among the 100 scientists working for a period of over 30 years on a research project to study plant growth in the Amazon, that maybe some of them might have considered looking into that? Maybe you should contact the lead researcher and offer them your services as a consultant who would tell them what they need to look at. I’m sure they could use your help!
Fernando, if you have it at hand, sure. It doesn’t hurt to have more information.
Javier, I don’t know for sure, but take a look at the rainfall data for Manaos over the last 50 years, and let me know what you think.
http://scholarworks.umt.edu/cgi/viewcontent.cgi?article=1002&context=decs_pubs
I did not make much out of that article. It is rather long and quite focused on the development of precipitation proxies more than on the precipitations.
Hi Javier.
I don’t think you are a real scientist. Please post your CV. Thank you.
Sorry to keep asking, but Ron seems to have edited my original request off the page.
Javier, In large part I agree with much of your response.
However my main point was that simply stating outright that increased CO2 concentration in the atmosphere is automatically a good thing for plants doesn’t really address the truly complex nature of tropical rain forest ecosystems. And as you say they have a hypothesis and that further research is needed:
Different hypothesis can explain the same data. They propose that trees are living “la vida loca” and dying younger.
Of course! That is how science works and as you also say:
That they observe a long term increase in productivity that still continues (see figure). ¿Didn’t I tell you? All these experts are not contradicting me. They are contradicting you.
Well yes and no, In the past I have also posted studies on plant physiology which put a slightly different interpretation on on increase in productivity because studies show that an increase in CO2 is not necessarily beneficial to all the plants under all circumstances due to other limiting factors.
http://www.plantphysiol.org/content/155/1/117.full
SINK LIMITATIONS AND DOWNWARD ACCLIMATION
The reason for the much lower growth-rate enhancement than the enhancement of photosynthesis may be understood with reference to Figure 4. Extra carbon can only lead to extra growth if plants have a use for it, which may be for the growth of new foliage, roots, or other sinks such as developing seeds. If a plant’s capacity to utilize carbon is limited (sink limited), any increase in photosynthesis cannot be sustained and will be curtailed through feedback processes. Hence, the rate of photosynthesis measured under standard conditions, or the concentration of photosynthetic enzymes, is usually lower in plants grown under elevated CO2, here referred to as “downward acclimation.”
And to your point:
To conclude, most people have the wrong expectations about nature and about climate.
Most definitely agree with you on that however what that also means is that you yourself might be wrong too,especially when you make blanket statements about how beneficial more CO2 is to plant biomes.
So in conclusion since very few of us are able to do the research ourselves we should keep an open mind and give the scientists who are involved the chance to do the work they are doing. So far it seems we are getting plenty of evidence that humans are having major impacts on ecosystems all over the planet.
BTW, I’m a native Brazilian and travel to the Amazon upon occasion and I have friends there who are biologists in a number of fields. I can tell you two things about them, one they are very worried about what humans are doing to those ecosystems, and two, they are most definitely not doing the work they are doing to get rich on research grants!
Cheers!
Fred
Fred, we are starting to agree then. I also agree on what you say.
The effect of an increase of CO2 on plant productivity will change from one place to another and from one plant to another, but in general terms it can only be positive and not negative (in particular terms could be negative for some plants in some places). The prediction from theory is that the effect will be bigger on C3 plants (the great majority) and smaller on C4 plants (some of our most important crops), and it will be bigger on arid-adapted plants because CO2 is negatively coupled to water loss through stomata. The observations agree with the theory and the biggest positive impact is seen on semi-arid regions were the increase in foliage detected by satellites is an amazing 11% in just 20 years.
The problem arises because climate change is becoming a sort of cult where people feel good just blindly following the priests statements and thinking that they help the planet while the effort has to be put by someone else. To these people CO2 is a pollutant with which we are poisoning the Earth. It therefore can do no good and whoever says so is a denier that attacks the cult. Since the priests decide on the issues there is no point in arguing about evidence. If they questioning those beliefs that puts them automatically outside the cult.
I do not doubt that those biologists are doing a hard job and earning little since science is very vocational and with some exceptions in most countries is not well paid at all for the quality and preparation of the scientists. We all have reasons to be very worried about the rainforest, including the Amazonia, and in general for all ecosystems as we are literally destroying them. I just don’t think there is evidence to be worried about a negative effect of increased CO2 on vegetation globally, and that there is evidence of the contrary.
Cheers.
Hi Javier,
A simple explanation for increased global uptake of carbon is the higher concentration of CO2 in the atmosphere. A hypothesis for the increased mortality is that the Amazon rainforest is not a greenhouse where atmospheric CO2 is increased, but at the same time the proper amounts of water and other nutrients are added to enable better plant productivity. The absence of other limiting nutrients is likely the cause of the increased mortality. The increased carbon uptake is easily explained by higher CO2 levels and longer growing seasons in temperate areas. There is also a tendency for albedo to be reduced as forests grow in higher latitudes due to warming, which may lead to more warming.
Yes, Dennis. I agree with that.
We can only speculate on the reason of the increased mortality, but your explanation sounds reasonable to me.
Hi Javier,
It is possible(or even likely) that overall plant growth could be increased by more CO2 in the atmosphere.
There could be an adverse affect due to temperature increase and there definitely is a lag between CO2 increase an temperature increase because a lot of the increased radiative forcing warms the ocean rather than the atmosphere.
The physics is quite well understood for why increased levels of CO2 will lead to increased temperatures, but the system is quite complex, with trying to understand how clouds will be affected ( as this will influence the earth’s albedo and insolation), the interaction of clouds and aerosols, the various ocean effects (ENSO, AMO, PMO, etc). If we could put the earth in a laboratory do multiple controlled experiments the science would be much easier.
The fact that this is not the case is what leads to using computer simulations to model the climate. Nobody claims that these models are perfect and that is why there are many groups working independently to create as realistic models as are possible with current scientific understanding.
Climate has indeed always changed. The increases in atmospheric carbon dioxide levels in the space of a few hundred years is unprecedented. The rise in atmospheric CO2 from 296 ppm to 400 ppm over about 110 years compares with a similar rise from 210 ppm to 290 ppm at the start of the eemian, the important difference is that the rise in CO2 from 133 ky BY to 128 ky BP took 5000 years rather than 115 years, about 50 times more slowly.
The change in climate may be very different in this case due to the rate of change and the ecological impact may be different as well.
Hi Dennis,
Sure but that well understood physics leads to predictions that are not met by evidence, like the prediction that warming at the Troposphere should be 1.2-1.4 times the warming at the surface. That extra warming predicted by the physics is nowhere to be found.
We always go back to past CO2 levels, and as I always tell you, that is a contentious issue because no adequate proxy record for that is available. As long as you draw your conclusions on supposedly accurate past levels of CO2 agreement is not possible.
But the real problem is that even if we accept that the CO2 change is unprecedented by a big factor, the temperature change is not unprecedented in any way. This disparity can be resolved in many ways. Your preferred explanation is that there is a delay and temperatures will match that disparity in the future. Evidence is not showing that to be the case.
I don’t see a disparity because I believe that CO2 levels are not too far away from what they should be given present temperatures and that in the future, CO2 levels will more or less follow temperatures with a delay of a few decades, as they have always done.
According to my interpretation, CO2 levels should start to increase more slowly in the next decade due to lack of warming, regardless of how much fossil fuels we burn. Since after 25 years of IPCC we have not reduced our burning of fossil fuels one iota, there is no reason to expect that we are going to do it in the next decade, so we will soon know.
Hi Javier,
Well the scientific evidence is clear to most scientists in the field. Clearly neither of us will convince the other, but the future certainly will show which of us is correct.
The slow down in the rise in temperatures is easily explained when all forcings are taken into account.
See
http://contextearth.com/2013/10/26/csalt-model/
My simple attempt at the CSALT model in chart below.
Hi Dennis.
I don’t think Javier is a real scientist. What do you think?
What is troubling is people like you who pick and choose what bits of evidence you accept and which you will not even contemplate. I could put numerous detailed experiments which show the effect of various levels of CO2 on plants. Instead of accepting provable and repeatable scientific data you would make the opposite conclusion. Why? Because you have decided you are right and no amount of evidence will open a closed mind.
The best level of CO2 for plants is around 1000ppm, current levels are around 400ppm.
Why is it that most plants do the very best at 1000ppm? Perhaps they did not read the same literature as you did. At optimal levels of CO2 plants need less water, plants produce far more food, plants are more disease resistant, plants are able to resist parasites better.
None of this will make any difference to a person who is convinced that increased CO2 is bad.
If increased Co2 is so bad where was all the CO2 before coal was formed?
It was in the atmosphere fertilizing and powering the greatest growth of trees and plants which covered the entire earth.
Sounds good to me.
If anything saved the whales, it was oil.
Russian abortion statistics
If you count the number of abortions from 1957 to 2013, it is well over 160 million in that time period. It goes without saying that it will have an effect on population growth.
The Soviet Union was the first modern political state to legalize abortion.
The reduction in the number of abortions in the later years is probably due to birth control methods.
If one group of hunters and gatherers on the south slopes of the Caucasus spot a herd of cattle and then another group of hunters and gatherers forty miles east spot the same herd of cattle, then do a roundup and the other group of hunters and gatherers find out about the herd of cattle absconded, stolen, by the other group of hunters and gatherers, there might be a conflict. The cattle herd then becomes property and subject to theft.
You form an army to protect your resources which some other group believes is public domain, there for the taking, it’s theirs.
Chances are, you’ll need some form of government, an agriculture department, first and foremost, and then an armed group of humans to protect those food sources, an army.
Opens up a whole new can of worms, cooperation between two groups of former hunters and gatherers turned civilized to prevent too much loss of human life.
‘We can’t war on each other, it is not productive, causes too much pain and misery, grief. Let’s hammer out a peace and live together. If we work together and build the cattle herd, we all benefit, there will be more for everybody. Somebody plant some olive trees and raise doves.’
Advancement of knowledge, a market, not a slaughtering of humans and animals.
Then there’s tobacco, which is helpful in controlling the ebola virus, i.e. kills the virus before it kills the host. Needs a group of scientists doing research. Three cheers for tobacco.
Without organized groups to form governments, laws, nations, there is conflict. Sometimes, governments fail miserably too, and then it’s back to war mode.
There is plenty of suffering in this world already from diseases and calamities, war only makes it all worse. War wastes resources and humans suffer once more.
Peace is better.
I like peace. Peace is cool.
Ronald, I wonder if you or anyone has any ideas on how to voluntarily lower human fertility. Some people suggest that only dire events (wars, famines, disease, that sort of thing) can lower human population. Somehow I think the “demographic transition” isn’t going to work here. I notice that the fertility rate in the Soviet Union fell post-collapse. I also notice that Virginia Abernethy put forward an economic opportunity hypothesis, in which fertility expands and contracts depending on perceived economic opportunity.
I don’t have a theory I’m pushing here, I’m just wondering if anyone has some ideas, since obviously human fertility would be relevant to the question of human population.
Well, if you aren’t immunized for mumps and don’t contract them when you are a child and do contract them when you are an adult, you’ll go sterile.
One way to insure a reduction in the population is to not vaccinate children and let nature takes its course, which has ethical implications, but it is plausible. Seems to be happening with the measles outbreak, mild as it is.
Withholding all vaccinations to the general population is a possible plan.
If anything saved the whales, it was oil.
What makes you think that the whales have been saved?!
As a companion piece, I suggest reading this interview with Daniel E. Lieberman, a professor at Harvard.
http://thesunmagazine.org/issues/471/too_much_of_a_good_thing
Oversimplified, Lieberman points out the ways that we have constructed (with a lot of help from fossil fuels and the industrial economy) a world we are not physiologically or psychologically designed to live in. If we think of it in terms of a Limits To Growth type model, civilization is creating pollution, which becomes a drag on the system.
Suppose, against all odds, humans should develop the Sapience that George Mobus keeps looking for and failing to find. Then, in the US, at a minimum 15 percent and more likely 50 percent of our GDP simply vanishes. Then we are in a situation comparable to the collapse of the Soviet Union in the mid-1990s. The economy stops working and work which makes eminent sense cannot be executed. And so more people starve than would be the case if we had a perfectly adaptable economy.
Post collapse, would we find a Putin to lead us back to a reasonable track?
Don Stewart
Hi Don,
The Soviet Union went through a severe social change due to its breakup and the formation of a new capitalist economy to replace the old soviet structures. There may be severe social changes due to peak fossil fuels as well, but we will not be attempting to change from a state socialist system to a much different system at the same time.
It will still not be an easy transition, but population decrease would help, reduced fossil fuel use will help with climate. Population is key, for the more pessimistic scenarios, clearly population decrease would be quite rapid, I would prefer a more gradual decline where the demographic transition to lower birth rates becomes worldwide and total fertility ratios drop to 1.3 births per woman.
That is not likely to happen, but maybe we can get to 1.75 before 2100 and try to mitigate the problems as best we can.
Dear Dennis Coyne
When he was still the President of the Dallas Federal Reserve Bank, Richard Fisher said that he wasn’t concerned about the collapse in the oil patch because ‘we are a consumption economy now’. Then he retired and took a job on the Board of Pepsico. Practically everything that Pepsico makes is ‘too much of a good thing’ by Daniel Lieberman’s views. However you want to characterize the current economic system in the US (capitalism, financial globalized capitalism, crony capitalism, or consumerism), the change which we would have to negotiate between the current system and any future system with a lot less fossil fuels would be at least as wrenching as the change the Soviet Union went through. At least it seem so to me.
Don Stewart
Hi Don,
I agree, it will be as bad or worse that what the people of the former Soviet Republics experienced when peak fossil fuels hits, increases in the price of fossil fuels may help to speed the transition, but if they rise very quickly recession will result or possibly a depression.
Smart government policies in response to peak fossil fuels could help a little and only a crisis would allow such policies to have a chance of being implemented.
The first step is for the peak to arrive and then 5 years later maybe society will realize that changes need to be implemented.
On Topic Podcast Book Review: Wed 3/25/15 Hr 4 : Guest: William Rosen, author, The Third Horseman: Climate Change and the Great Famine of the 14th Century.
http://johnbatchelorshow.com/podcasts/wed-32515-hr-4-guest-william-rosen-author-third-horseman-climate-change-and-great-famine
I found this article very interesting:
Fears That Iran Will ‘Flood’ the Oil Market Exaggerated
Mallinson estimates that towards the end of this year and into 2016, Iran would only be likely to lift production to 3.1 million barrels per day, from 2.8 million barrels per day now. “Even if 30 million barrels held in floating storage are released over April, May and June, that will amount to just over 300,000 extra barrels a day,” he says. “That’s a noticeable amount, but it’s not a flood.”
300,000 barrels per day in 2016 is not going to change my prediction that we are at peak oil right now one whit.
I know you know, but many article writers forgot to remember the oil industry is always running up the down escalator. We have to add new production sources and work very hard to reduce decline rates.
I tried to explain the current mess in the Middle East to someone, to the very limited extent that I understand what’s going on, and their response was pretty much “Are you f—king kidding me?”
In any case, Jon Stewart noted that it seems to him that we are engaged in proxy wars against ourselves in the Middle East (launching air strikes in support of Iranian backed forces in Iraq while supporting Saudi air strikes on Iranian backed forces in Yemen):
http://thedailyshow.cc.com/videos/1xg427/wait–whose-side-are-we-on-again-
I have read a number of articles on “this is what you need to know about Yemen” and not a one has mentioned your net oil exports take, which more or less predicted this and the next several years
I wonder if you would consider doing an editorial. yemen had xx people and xx production and xx consumption. It now has xxx people, and though it still produces oil, it no longer exports
implied oil subsidy was xxx per person, now is negative
And by the way, other countries where this has happened are Egypt in 20xx, Syria in 20xx. etc
Did you see the ?head? of Egypt had an editorial in the Washington post where he said the country could collapse?
I think your work is incredibly valuable, and I hope policy makers get it, but you see people blaming Obama for being passive, or others for other reasons, and the reality is the economics went south as you show
It could be the difference between triggers and underlying causes. I’ve used the example of lit match dropped into a dry forest, with a lot of dead underbrush. The trigger was the match, but the dry underbrush and wood was the fuel for a firestorm that that only needed a trigger. So, declining net exports, to net importer status, in some cases could be triggering explosions in underlying problems.
But what almost no one understands, or wants to understand, is (IMO) the huge, and accelerating, rate of depletion in remaining Global CNE (Cumulative Net Exports).
You would have better math than me, but if I did it right, Yemen net exports in 2007 times oil price would have been very roughly a subsidy of $250 per person, which rulers could use to subsidize fuel, food, etc.
That $250 was more like $100 in the 1990’s, with more exports and lower price. It rose and then fell to $150 in 2011, $50 in 2012, and negative in 2013 or so. This ignores all the cost of production etc.
GDP per Capital in 2007 was $1000. So 25% subsidy to GDP evaporates and goes the other way (I am not sure how to flow excess oil profits into GDP and am not trying to, just making a compare)
Other industries according to the CIA factbook:
crude oil production and petroleum refining; small-scale production of cotton textiles, leather goods; food processing; handicrafts; aluminum products; cement; commercial ship repair; natural gas production
Economy, CIA factbook
Yemen is a low income country that is highly dependent on declining oil resources for revenue. Petroleum accounts for roughly 25% of GDP and 63% of government revenue. Yemen has tried to counter the effects of its declining oil resources and continuing attacks on its oil pipelines by diversifying its economy through an economic reform program initiated in 2006 that is designed to bolster non-oil sectors of the economy and foreign investment. In October 2009, Yemen exported its first liquefied natural gas as part of this diversification effort. In January 2010, the international community established the Friends of Yemen group that aims to support Yemen’s efforts toward economic and political reform. In 2012, the Friends of Yemen pledged nearly $7 billion in assistance to Yemen. The Yemeni Government also endorsed a Mutual Accountability Framework to facilitate the efficient implementation of donor aid. The unrest that began in early 2011 caused GDP to plunge almost 11% in 2011. Availability of basic services, including electricity, water, and fuel, has improved since the transition, but progress toward achieving more sustainable economic stability has been slow and uneven. Yemen continues to face difficult long-term challenges, including declining water resources, high unemployment, severe food scarcity, and a high population growth rate.
There were 8 million people in 1980, 12 million in 1990, 17.5 million in 2000, and 25 million today.
Speaking of firestorms only needing a trigger, note the discussion of Saudi Arabia and Yemen down the thread.
Jeffrey,
Few countries seem as ripe for something like collapse as Yemen. They appear to have experienced peak water and likely peak grain in recent years. The middle east has also been experiencing a nasty run of droughts in the last few decades. Combined with population growth of 500% since around 1960, and fierce tribal rivalries, you might as well have coated the underbrush in gunpowder before dropping the match.
I don’t really see how it ends well.
It appears that die-off will begin in the ME, and also blaze a convenient path to the spOils.
I superimposed a population density map over a food production (calories/person) map, and 4 areas really stand up. I believe most of the early action is probably going to take place in those areas.
Middle East might be able to trade oil for food so it is difficult to be sure, and the calories/person situation is not that bad in East Asia, but half of the world population lives there and that cannot be good.
I wouldn’t rule out Pakistan as the first major country over the cliff.
In population overshoot, ecologically devastated, water and energy issues (dependent on imported energy), a uneducated illiterate population immersed in religious fundamentalism.
Oh, and run by a corrupt military.
“Oh, and run by a corrupt military”…………..
……Oh, and which is in possession of a few nukes, too…..
Petro
http://wsm.wsu.edu/researcher/wsmaug11_billions.pdf
Note the areas of the world with the highest percentages, which is where we can expect the highest number of incidents and persistence of food insecurity, ecological degradation, racial/ethnic/religious conflict and violence, social and political instability, political reaction, war, disease, and mortality.
http://video.ft.com/3440325502001/Food-imports-set-to-grow-in-China/World
http://video.ft.com/3440325502001/Food-imports-set-to-grow-in-China/World
http://www.asiaperspective.net/chinas-increasing-appetite-imported-food-beverage/
http://www.reuters.com/article/2014/07/28/us-china-environment-idUSKBN0FX0S520140728
http://www.motherjones.com/tom-philpott/2014/05/china-us-food-pork-wine-export-import
China’s food situation is rarely discussed, but the country will increasingly be required to import food and energy in the years ahead, which will significantly drag on growth of real GDP per capita along with the deceleration of growth of fixed investment and production hereafter.
China has increased per capita GDP in 50 years from a similar starting point that it took the US and Britain 100-150 years, and Japan 75-80 years. China has created an utterly unsustainable, western-style, oil-based economy with oil at $45-$100 vs. what the US, UK, and Japan did at $10-$20 (2015US$).
As such, China is where the US was in the late 1920s and Japan in the late 1980s. China faces debt/asset and price deflation and real GDP per capita growth plunging from 6-9% to 2-3% (where it actually is today, properly measured) and then ~0% by the early to mid-2020s.
http://www.fao.org/worldfoodsituation/foodpricesindex/en/
http://www.fao.org/economic/ess/ess-fs/en/
http://www.fao.org/economic/ess/fbs/en/
While food prices have fallen in nominal terms with production so far keeping up with population growth overall, food supply utilization (a less published and understood indicator that has also become more guarded among those charged with compiling, analyzing, and distributing the info, as it has become a sensitive national security data point since 2005-08) is flagging because of declining soil fertility, loss of arable land and topsoil, increasing instability, failed states, trade growth decelerating, the US$ strengthening, etc.
Real food prices are at 40- to 45-year highs.
“It appears that die-off will begin in the ME, and also blaze a convenient path to the spOils.”
An argument can be made that the die-off in the ME has already begun. Probably about one Million people in the ME have died in the past 10 years from war. The war is now spreading out. North-Africa, Ukraine, and probably a new theater of war in Asia in the next 3 to 5 years. Asia has always been a hot-bed for war during periods of poor economics or resource shortages.
Correct: Add Turkey to expanding War. There appears to be some sort of internal conflict with a major blackout a seizure of a courthouse by a Marxist group.. Story developing.
I guess I was the one extrapolating implied collapse, but to me the policy implications are different if certain countries are kinda hopeless versus if they are just having a bump. The public debate seems to imply Yemen can be fixed with military action.
I do think as others hit this situation in 10 or 20 years it is hard to see the middle east doing well. I would love to See Jeffrey’s charts with both updated 13/14 and with extrapolations of annual net exports instead of CNE, though I think his point is that it goes pear shaped fast rather than linearly.
I just don’t totally get from the CNE the timeframe in which it gets harder/dicier.
You have seen gasoline and diesel subsidies come off in Egypt and Indonesia, two of the other countries he highlights, which I find interesting to think about, though both are more diverse and Yemen is a particularly concentrated and sad case.
It’s worse than you think…this was from last month. All their enhanced water isn’t…
Will Yemen run out of water?
If reports are to be believed, Sana’a, and other cities in Yemen, will soon be the first in the world to run out of water. Can this crisis be averted?
http://geographical.co.uk/places/cities/item/753-will-yemen-run-out-of-water
Nice post!
Not strictly on subject, but related I below continue a discussion of the previous post on POB in case others take an interest.
Futilitist wrote:
http://peakoilbarrel.com/jodi-iraqi-reserves-and-ghawar/comment-page-1/#comment-507384
”So, why not use the very accurate Etp model to forecast a possible price range constrained by physics, and then use your expertise in all the details to fine tune that forecast? That would make sense to me.”
In the world we live in, the oil (other energy) price range is not physically constrained, but by total debt and credit creation. Debt/credit creation is not physically constrained (there are reserve requirements for issuers of credit, but these rules may be changed at will).
In the system/paradigm we have now credit/debt creation comes first, then energy demand and supplies. Most of the credit (thus money in circulation and changes to this money stock) comes from commercial banks creating credit “ex nihilo”. Credit works as money.
I will repeat my standing on this issue;
Any forecasts of oil (and gas) demand/supplies and oil price trajectories are NOT very helpful if they do not incorporate forecasts for changes to total global credit/debt, interest rates and developments to consumers’/societies’ affordability.
PLUS
Complete oil (energy) supply considerations should include the health of the oil companies’ balance sheets, their resource portfolios and their requirements for return.
Economics may be used to bend physical constraints for some time. That is what debt/credit, deficit spending and interest rate suppression allows for.
but these rules may be changed at will
Words that define the post 2008 reality.
I am trying to look beyond even that. As Russia and China and probably India, with the majority of the world’s population in combination, seek to isolate their transactions from the USD and ignore it, what will this mean in the context of oil production and consumption when there is no remaining measurement of money / barrel.
Russia will produce oil internally priced in rubles because their oil workers will be paid in rubles. China produces 4 mbpd last I looked and their workers will be paid in renminbi, which may soon have no peg at all to the USD. China particularly has a history of defined goals for things economic, so they may define a certain amount of oil production, and spend internally their internal currency to achieve it — with perhaps FX trading forbidden in Shanghai.
The world of scarcity can credibly trump money and eliminate it. The issue for Russia only becomes relevant if they export. They don’t really HAVE to export.
But if they choose to, some non monetary prices would be wise from their perspective — perhaps disarmament. But for the time being, they will want money, so your focus is excellent.
I do note tho, as I have before, that when your goal is to destroy your enemy, you can price it any way that will accomplish that, ESPECIALLY if you have read all of the above and know that in the near term future you won’t care about what money you sold it for. You’ll be willing to cut price to smash the enemy (shale).
Hi Rune,
You are correct that the all encompassing model that you describe would be very nice.
Have you seen such a model?
No!
And that is why, IMVHO, several of the major institutions, major oil companies and others will get their forecasts/projections wrong.
Hi Rune,
You are correct in my opinion. It just seems like it is a nearly impossible task to put together all the information needed to construct such a forecast. Probably part of the reason it is not done. For the oil industry there is a lot of information from National Oil companies which is not available. Trying to assess credit/debt and forecast this for the World economy seems problematic as well. Basically there are no good forecasts.
Speak for yourself, Dennis. The Etp model has accurately forecast the price of oil since 1960.
And if there are basically no good forecasts, why do you spend all your time making forecasts?
No it hasn’t, the real oil price has not followed the ETP very well, could you remind us what it predicts for 2015?
We will see at the end of 2015 how close it is.
I will say WTI will be over $70/b between Sept 1, 2015 and Dec 31, 2015. Do you think WTI will be under $50/b during that time frame (we could do the average price over that period, or we could both be correct with volatility.)
“The Etp model has accurately forecast the price of oil since 1960.”
If this true then did someone, BWHill perhaps?, make billions of $ through investment strategies using this model?
Zoomed out as such, any exponential curve would fit as well, but it doesn’t predict or explain price run-ups that appear if you look closer. I’d be interested in hearing a justification for the ‘maximum affordable price’ curves and why the price of oil should decline to zero as depletion deepens. Doesn’t sound like anything based on economic theory to me.
By the way, I’ve enjoyed reading OFM’s posts since TOD days. I miss his input. Mac may have been a bit wordy, but he got his point across without inflaming readership, and didn’t overstate his relevant background. Your points are a bit unclear. What are your qualifications vis-a-vis energy, Futilitist? Are you Loren Soman, the Shrek animator?
Chris, a.k.a. POBox from TOD days
Hi POBox.
“Are you Loren Soman, the Shrek animator?”
Yes. My Propellerhead Design (PhD) partners and I started the Shrek project at Dreamworks.
Old farmer mac is welcome here any time, as far as I know.
As far as energy and peak oil is concerned, I don’t have any “official” background or expertise other than the fact that I took a lot of physics, biology, and psychology. My degree is in Biomedical Visualization. I am currently working on my Phd in social psychology/social theory. My special area of concern is societal mechanisms of denial. I have also been studying ecology, carrying capacity, and social collapse since the early 1980’s.
I am here to talk about the two most important things a person needs to understand today. Social collapse and human nature. I thought at least that part was pretty clear.
As far as the Etp model goes, you should check out the links that bwHill provided. They explain the model pretty well. If you have any further detailed questions about the Etp model, you should ask bwHill.
Shrek was and still is a great success. Nice piece of work!
I’ve read quite a bit on bwHill’s site. Disregarding the “model” for a moment, there seems to be a tacit assumption that lack of affordability of oil will cause its value to decrease to zero. With over a billion vehicles worldwide running on gas or diesel (1.2B in 2014) what are the chances of even a 10% conversion to another fuel source by 2020? I’d say they are rather slim, but conversion or optimization (something we engineers are pretty good at) may be the only way to avoid your Catch-22, where the two curves cross.
Economics 101 would say as oil peaks and becomes less accessible, the price will go up, not down. Are the “maximum affordable price” curves a red herring to engender a meaningful discussion on collapse? I don’t think most POB readers are willing to pay $70 to find out.
Good luck on your PhD. There are some good people here and much can be learned by sticking around a while and listening…
/c
Yes, I am learning quite a lot.
Rune,
As a physicist by training the phrase “Economics may be used to bend physical constraints for some time.” concerns me a little! As far as I am concerned, the laws of physics are cast iron, while the laws of economics are, comparitively, made of rubber.
Would it be perhaps more accurate to say that economics may, for a time, cause us to act in a way which is far from sensible and to the detrement of our long term selves? The last time I checked, none of the oil drilling in the bakken was in contravention of the laws of physics (though it was perhaps in contravention of the laws of common sense). Debt or no debt, we are still able to consume that which we produce (or extract). Ultimately, I view debt and other financial/monetary tools as drivers and modifiers of human behaviour, as opposed to anything ‘concrete’ or real.
Sam,
I for one is open to suggestion for better (as in more precise) phrasing and sometimes when posting in the public domain I admittedly use “easy” explanations.
I have often encountered the expression “It is just a question about money” if some objective was to be achieved, like consume more now, which you describe as “drivers and modifiers of human behavior”.
If you had one drilling rig, you could only drill one well at the time. If you went deeper into debt you could contract one more drilling rig and drill two wells simultaneously.
In that way money/debt allowed you to overcome a physical constraint.
And no, none of natures physical laws were modified in that process.
Without credit/debt creation, there would be financial constraints on consumption, while (still) physical feasible.
I agree credit/debt allows us to “over”consume (there are now no physical constraints for that, until it is!).
Debt allows for consumption to be pulled forward in time (adding to aggregate demand). At the same time repaying that debt (with interest) becomes future claims on underlying (and shrinking base of) affordable (easy accessible) resources. As debt grows (in aggregate) there is not a simultaneous increase in the physical oil in the ground (apart from that a higher price may allow to go after costlier oil).
Rune,
Thanks for the clarification. I see what you mean, but I found the phrasing a bit jarring first time around!
I suppose it all comes back to the maximum power principle, doesn’t it. Whatever system allows us to consume at the fastest rate (in this case, the concept of debt) is likely to be the one which is selected going forwards, as we seek to maximise our consumption and growth. The only problem is, as you rightly point out, that this concept eventually leads to absurd conclusions (ever increasing claims on ever more rapidly diminishing sources of natural wealth). However, this is not a bug, it is a feature! In my head I imagine that perhaps we could have stumbled upon other constructs instead of debt, such as religious orders or certain different types of society which would have ultimately led us to the same place that we are in now. But that is getting metaphysical, and it is a Friday night and I have a nightclub to attend!
And you can dance the night away secure in the knowledge you are right about our inevitable destiny. Although the other hypothetical paths you propose would very likely have arrived at our destiny too soon. That is why we chose the fucked up system we did and not some other one. Evolution is pretty damn efficient.
Sam Taylor said:
The last time I checked, none of the oil drilling in the bakken was in contravention of the laws of physics
If you use entropy analysis you will find that they reach the dead state fairly quickly. All you need is the mass flow rate, the specific heat, and the temperature of the reservoir. All of these values are readily available. Since oil is essentially an incompressible fluid Cp = Cv. For a good ball park estimate you can ignore the gas flow, most of the Bakken runs a GOR of about 500:1 which is primarily methane. It has a fairly high specific volume. We use an exergy of 140,000 BTU/gal for crude. That is for an API of 37.5 deg. The Bakken runs an API of about 45 factoring in condensate, but again, for a ball park estimate 140,000 will be pretty close.
For a mass flow rate David Hughes’ data is very good. We went through the 4598 wells he posted in Drill, Baby Drill, and plotted the curve. The equation of the curve is:
y = 23.35 / (1- 0.95e^(-0.011x))
y = barrels/day: x = months
The curve is a logistic curve with a correlation coefficient of r = 0.998. We have also plotted about a dozen other production data sets out of the Bakken, and they all turned out to be logistic curves. Of course, you can plot your own function if you are so disposed. As a physicist this should be a piece of cake. If you have any specific questions just drop me a note at the site.
http://www.thehillsgroup.org
Could you clarify what a GOR of 500:1 means?
GOR = Gas Oil Ratio
http://en.wikipedia.org/wiki/Gas_oil_ratio
“The gas/oil ratio (GOR) is the ratio of the volume of gas that comes out of solution, to the volume of oil at standard conditions.
…
The GOR is a dimensionless ratio (volume per volume) in metric units, but in field units, it is usually measured in cubic feet of gas per barrel of oil or condensate.”
Nice,
and the Bakken GOR is 500:1?
Like 500 Mcf (gas)/ Bbl (oil?
No, not Mcf.
I think it’s 500 cubic feet of gas per barrel of oil.
Dear Loren Soman
If you cared to check out actual production data with NDIC you would easily have found that the GOR is in the range of 1.23 – 1.25 Mcf/bbl.
So what?
Rune Likvern /b> said:
Could you clarify what a GOR of 500:1 means?
Gas Oil Ratio (GOR)
Rune, I’m pretty sure you know what I’m about to describe, but I’m going to do it for the general audience to avoid confusion:
In the USA the GOR units are cubic feet per barrel at stock tank conditions. The reservoir GOR can be estimated by sampling the well fluids and performing a lab study. A simpler “eyeball” method is to look at the production data, observe the initial GOR and how it changes. If GOR is steady for a few months then it’s fairly safe to say that’s the actual GOR. If GOR starts increasing we can deduce the reservoir pressure (at least in the near well region) has dropped below the bubble point.
I believe the Bakken has a GOR around 1000 scf/BSTO, but I could be wrong.
Turning to the energy available to produce the oil: the oil, when it contains a significant amount of gas (1000 is significant), has a pretty decent compressibility. Once the reservoir reaches bubble point the gas forms tiny bubbles and this allows system compressibility to be higher than the compressibility of the oil by itself. To the oil and gas compressibility we must add rock and water compressibility. And then there’s the energy available from any aquifers connected to the oil reservoirs, which contribute via their own compressibility. A tight rock reservoir Shouldnt have that much aquifer energy, but I notice the Bakken wells do produce water. This tells me they are plumbed to water layers, and these do contribute to system energy (although if the geometry is wrong they can reduce oil recovery, so water in this case could be a negative factor).
In conclusion, the energy used to lift the oil is derived in part from the compressibility of the reservoir fluids, and when the well is older we use energy to lift the oil. The energy used to lift the oil in a remote field (say offshore) is usually obtained from the associated natural gas. In the USA I believe they just purchase it, and that energy is derived from a mix of sources.
As I wrote before, in some cases the energy can be obtained from a wind source, and in others we use hydropower, and I’ve seen studies which considered using nuclear power. To us it’s a cost issue. We deliver a product people seem to want.
Evidently if the energy we use is excessive then the overall system sucks. This is usually reflected in the OPEX.
Hi BW Hill,
By dead state, you mean that net energy is zero?
I will let Sam speak for himself, but to my mind petroleum will still be produced even if it is not an energy source as long as the companies can make a profit doing so. This depends on the price of oil. The net energy of the produced barrel of oil does not matter to the consumer as long as the gas or diesel allows their car to function.
For the economic system as a whole, the thermodynamics applies, for the individual consumer, Walrasian economics results in a better analysis.
Dennis Coyne said:
By dead state, you mean that net energy is zero?
7.2.2 The Dead State
“If the state of a fixed quantity of matter, a closed system , departs from that of the environment, an opportunity exists for developing work. However, as the system changes state toward the environment, the opportunity diminishes, ceasing to exist when the two are in equilibrium with one another. This state of the system is called the “dead state”.
Moran and Sharpio
“Fundamentals of Engineering Thermodynamics”
ISBN 0-471-89576-8
see above mentioned text for a definition of the “dead state” for control volumes
http://www.thehillsgroup.org
Forgot to mention: by permission of John Wiley & Sons, Inc.
The Bakken wells can be approximated quite well using a hyperbolic function, to give a reasonable estimated ultimate recovery when the annual decline rate falls to about 10% I use a simple exponential decline.
Once a well has been drilled the oil will continue to be pumped as long as the oil can be sold for more than the cost to get it out of the ground(OPEX, royalties and taxes). If a low cost energy source (electricity from a coal fired power plant) can be used to run the well pump, then we might be producing oil with a negative net energy.
The oil company and the consumer don’t know and they don’t care whether the oil is net energy positive or negative.
Dear Dennis
‘If a low cost energy source (electricity from a coal fired power plant) can be used to run the well pump, then we might be producing oil with a negative net energy.
The oil company and the consumer don’t know and they don’t care whether the oil is net energy positive or negative.’
I agree with your statement in theory, but I think there may well be problems in practice. I have argued, for example, that the EROEI which is relevant is the EROEI for the delivery of a desired product or service to a consumer. Consider the energy we get when eating a potato. The least relevant question is whether the fuel used to bake the potato has a good EROEI. Fuel wood or natural gas or crude oil or a lump of coal are NOT what the consumer wants and is willing to pay for. Therefore, talking about the EROEI of intermediate products is frequently not very productive. If the calories in the potato can be delivered with a highly positive contribution from photosynthesis and passive solar heating, plus energy negative factors such as the metal fork with which the potatoes were dug, the oven which aided in the baking, plus the fuel used to create the heat, and the whole thing makes thermodynamic sense, then all is well.
But in practice, Mother Nature tends to select out of the gene pool those organisms and practices which waste energy. Consider the peacock’s tail. It seems like a terrible waste of energy and a stupid thing to grow in the presence of predators. But the fact that peahens make choices and, if an individual peacock wants his genes to stay in the pool, means he has to play the game. But I would hazard the prediction that those peacocks who are most efficient in producing the tail will tend to outcompete those who are inefficient. There are many examples of exquisite selection to make the most productive use of energy.
If oil were a minor factor in production, then using coal to subsidize the oil might work for a very long time. But I doubt that the strategy will work in the real world for very long. The thermodynamic penalties involved plus the scale of the problem would probably result in collapse of the whole scheme.
As I have said, the system would reorganize at a lower energy level. For example, oil might be pumped with coal so that the oil might be used to grease the axles of ox-carts. The scale of oil use would be orders of magnitudes lower, and the subsidy scheme might work for quite a while. The relevant EROEI boundary is the oxcart plus ox plus grease plus human labor driving the ox delivering a load of potatoes to market. If the EROEI of that system is adequate, then the grease might well be produced…because ox-carts don’t work well without grease and petroleum is a good lubricant. Of course, what we are thinking about conceptually might be considered a ‘collapse of life as we know it’.
One of the things I find attractive about the ETF model is that it cuts away a lot of this complexity and simply considers whether the whole system can go on as it is, or whether it must collapse and be replaced by something new. (At least, in my fallible understanding of the ETF model.) Once we are thinking in broadly the right terms, we can consider details.
Don Stewart
Hi Don,
I guess we will just have to disagree. For the economic system as a whole the net energy matters. For individual products or industries, as long as the product can be produced and sold profitably, net energy is of no importance.
Dennis
Don’t want to argue the point extensively. Just consider how selection and evolution work…a weeding out process.
Don Stewart
Does anyone know what the attached image represents? (What might be its net energy?)
Can we handle it?
Can we handle fusion, should it arrive, in the context of our planet, ourselves?
Can we even handle FF’s?
Burgundy and I touched on this over at TOD some years ago and I think that is in large part what this is all about; our increasing incapacity, as a small scale species, to handle increasingly larger-scale energies and the effects/symptoms (overpopulation included) and complexities that come with it.
The increasing technological specialization that is required ostensibly and paradoxically decreases the control, and therefore also appears as a kind of built-in natural limiting factor for our species and what we can do with energy, how far we can take it.
Renewable energy is a much lower energy form, and thus closer to our ‘energy-management potential’ but it seems to rely on a larger energy scale as input, at least initially, and is still complex.
Hi Rune.
You can’t be serious! Wow.
Back to the Etp model. Here was my entire post to you from the other page:
“So, why not use the very accurate Etp model to forecast a possible price range constrained by physics, and then use your expertise in all the details to fine tune that forecast? That would make sense to me.
After all, the Etp model’s output seems counterintuitive to you, yet it is derived from the laws of thermodynamics, and has been very accurate to date. This means that you could make some fundamentally wrong assumptions when applying only your more detailed methodology that could potentially lead to far less accurate forecasting.
You are not suggesting that economics can override physics, are you? That would lead to a looping Schrödinger’s cat problem, since the system is driven by physics, and our free will must, in the end, remain with us (the cat), forever trapped in Schrödinger’s box.
We can only pretend to be Schrödinger. Humans are not smarter than yeast.”
So, you are suggesting that economics can override physics! Wow.
If economics can really override physics, as you claim, why has the Etp model price curve been so amazingly accurate since 1960? Please answer this question. The Etp model has maintained it’s accuracy despite all the money tricks that have ever been played.
So, once again, why not use the very accurate Etp model to forecast a likely price trajectory constrained by physics? Armed with a forecast based on the physical limits to price, you could then use your expertise in all the debt/credit details to fine tune your more detailed forecast.
Alternative energy proponents could use the Etp model to realistically evaluate their visions for the future. Knowing the price of oil is going to decline fairly rapidly, changes the debate quite drastically. At least the debate could be contained within a more realistic frame. Same goes for the climate change “debate”, as well.
Policy makers could use the Etp model to make sensible economic/monetary policy, if possible. If no sensible decisions are possible, essential triage measures could be imposed before the whole system implodes.
The price of oil is first constrained by the laws of physics. Any debt/credit trick can only very temporarily alter the price of oil beyond the limit proscribed by physics.
And the longer the energy/economy system is held out of physical equilibrium, the worse the overshoot will be in the process of inevitable mean reversion. So, in the long run, debt/credit based oil price manipulation will cause more harm than good. Scotty was right. You really canna defy the laws of physics.
Rune, I am afraid you have the debt/credit cart before the energy physics horse. 😉
Futilitist,
I used the word physical (not physics) and also clarified what I meant by the word physical as a response to a comment further up. And that was before you posted, so bring yourself up to speed!
Perhaps you first should read what I wrote before you put opinions in my mouth.
Creating a debate based upon what I have not said and/or intended or putting words in my mouth will get you nowhere.
For a starter you can start proving how serious you are with posting under your real name.
Rune, I am afraid you have the debt/credit cart before the energy physics horse.
Prove the above!
If you can answer the following questions satisfactorily, I will evaluate if it is worth to use more time on your claims.
Futilitist;
How does the etp model account for changes in the money supply and the velocity of money?
What oil price does the etp model project for 2020?
Hi Rune.
What an attitude!
I doesn’t. And it doesn’t need to. That is my point.
I don’t know exactly. Less than $18/barrel, I think. Ask bwHill.
Don’t be so condescending. I am having my own conversation with you. What you say to others about the same topic is interesting, but this is between me and you.
I quoted you exactly and completely from our conversation only. I am not pulling from some sort of ‘database’ other than your last comment addressed to me.
My name is Loren Soman, but you can call me Futilitist.
I don’t have to. The proof is in your own statements.
I have answered all of your questions, sir. Quid pro quo:
If economics can really override physics, as you claim, why has the Etp model price curve been so amazingly accurate since 1960?
Futilitist,
Again, I never claimed that economics can override physics!
To maintain whatever credibility you have left, pls point to where I made such a statement.
Give a rationale for your answer, a statement from you gets you nowhere!
You have not answered my questions!
Tick, tock, tick tock
“In the world we live in, the oil (other energy) price range is not physically constrained, but by total debt and credit creation. Debt/credit creation is not physically constrained (there are reserve requirements for issuers of credit, but these rules may be changed at will).”,
~Rune Likvern
It sounds a lot to me like you are saying that economics can override physics!
I think the phasing of my question was very fair, but I sure wouldn’t want to put words in your overly sensitive mouth. So, here is my revised version of the question you keep refusing to answer:
If, “in the world we live in, the oil (other energy) price range is not physically constrained, but by total debt and credit creation”, as you EXACTLY say, why has the Etp model price curve been so amazingly accurate since 1960?
To maintain whatever credibility you have left, sir, please stop stonewalling and answer my question. Tick, tock, tick tock.
Yes, I sensed you put something else into it than what was intended.
I never studied the etp model and I do not intend to either.
When did being accurate become the same as sensitive?
Rune,
I guess that finally answers my important question to you, just not very well. Your position doesn’t sound very sensible at all, considering that the Etp model has accurately forecast the price trajectory of oil since 1960, despite all manner of economic tricks.
But thanks for answering my question, sort of. Please go back to what you were doing before. I am sorry to have troubled you.
I wish that Ron Patterson would officially weigh in on the topic of the Etp model.
If you’re convinced as you appear that this particular model is the be all and end all of peak oil modeling then why do you even care what anyone of us thinks of it?
If true, you’re running out of precious time to prepare before total collapse. Maybe a better use of your time (rather than trying to convince us) would be stocking the doomsday bunker?
Hi Futilitist,
I have looked at the chart, but obviously anyone in hindsight can plot a line through historical data. My question is if the model can really predict the oil price with that degree of accuracy why would the author be selling his model for a mere $70 I mean seriously you could open a trading account and be very rich very quickly this would of course apply to any commodity or tradable asset. Would you try hawking a model to peak oilers or become a billionaire?
Hi Marcus,
News flash, the Etp Model went on sale for $39.99.
And if you act now…
But wait there’s more…
To answer your question, bsHill probably figures if peak oilers are stupid enough to buy all those Doomer books and tapes out there, they’re probably stupid enough to buy his Etp Model.
He’s not interested in serious trading, because he knows the Model is BS.
And BTW, if his Model predicted that everything was going to be fine (instead of the world running out of oil in 15 years), NO ONE WOULD BUY IT.
Such is the case for marketing Doom.
You live in a fantasy world, John B.
Dear Loren Soman (Futilitist),
If the etp model has such predictive powers, why do you not argue for why it is so and enlighten us who still remain helplessly in the dark.
Most models I have seen is nothing else but simple curve fitting after the fact, which does not translate into predictive powers.
It appears to me that anyone that does not support Loren Soman’s (Futilitist) perception of the predictive powers of the etp model will be subject to Loren Soman’s (Futilitist) version of Dantes “9 Circles of Hell”….at best.
Loren Soman’s (Futilitist) objective is clearly not to further any discussions on POB (disagreements and discussions are great as long these are rooted in facts and logic).
May I ask what professional background (degree, professional experience) Loren Soman (Futilitist) has in thermodynamics?
Futilitist has extensive experience in failed predictions.
E.g. this one from 3 years ago at “The Oil Drum”:
I know it is rather an extreme position to take here, but I really do believe we are no more than a few weeks or months away from the onset of a very serious economic crisis, quite possibly leading directly to a rapid, wide spread, systemic collapse.
Smear campaign.
Tu quo quo. I was wrong once. You are wrong all the time, John B Troll.
Futilitist, Rune Likvern has forgotten more about the oil and gas industry, every aspect of it, than you will ever know. Did you just try and explain to him what gas to oil ratio was? That’s hilarious. He knew what GOR was before you were hatched.
I believe, clearly, you are intentionally trying to hijack this site with the express purpose of running off everyone you can. I am amazed you are getting away with it, actually. When I read your posts I feel like I need to go take a shower.
By the way, I’ve watched hotshots think they can predict the price of oil for over 60 years. When they rarely get it right they puff up like chickens (and now days write their links on bathroom walls, I guess), when they don’t you never see them again. Your beloved Etp model is dumb and way over priced for it’s real purpose. Charmin is much cheaper.
I’ll be back when you leave.
Mike
Hi Mike,
Great to see you again.
Rune: “Could you clarify what a GOR of 500:1 means?”
Futilitist: “GOR = Gas Oil Ratio”
Rune: “Nice,
and the Bakken GOR is 500:1?
Like 500 Mcf (gas)/ Bbl (oil?”
Futilitist: “No, not Mcf.
I think it’s 500 cubic feet of gas per barrel of oil.”
So, why did Rune Livkern ask the GOR question in the first place? Why the confusion over the GOR units? I did a quick google search and found the answer quite easily.
And I believe, clearly, that you are trying to scapegoat me. That is a good sign. I must be ruffling some feathers. I am just asking some simple questions that people here really, really don’t want to answer. I wonder why?
Last time you stormed out, cursing me as you walked out the door, you returned in pretty short order, as I recall. Your act is getting kind of stale.
Bye, Mike. See you again soon.
Futulitist. Please stop the attacks. They are not appreciated.
Alternatively, if you must attack someone, attack me because I do not think I will care all that much if you do.
I am trying to learn about matters relating to oil, for obvious reasons. I find that there is good information here. There are many posters who bring a broad array of knowledge and experience to this location, all for free. Please do not insult them and/or chase them off.
You asked me previously about what I think of the etp model, which I have read about some on the other site, where the handle shortonoil posts about it a great deal.
I do not have the strongest of math and science backgrounds, but did manage to obtain grades of mostly A, a few B, in high school biology, chemistry, physics, trigonometry, statistics and calculus. I obtained a BS in finance. That has been a long time ago, so I am very rusty.
I cannot understand the etp model. I have been skeptical of it due to a post of shortonoil where oil prices for prior years were stated and were not accurate.
In any event, given my background, is it possible for you to explain the model in a way I can understand it? In particular, since the ultimate goal of any oil project should be to earn a return on investment, please explain how the etp model incorporates this goal. Thanks.
Hey shallow sand,
I like how Mike attacks and scapegoats me out of nowhere, and I fairly answer him back, and you now tell me to stop the attacks. You first. Quit piling on.
I am sorry that oil prices are not going to rise enough to sustain the oil industry. But don’t shoot me, I am just the messenger.
I had a theory about oil prices falling from here on out. When I was presenting that theory here, Kam posted a link to the Etp model. I was amazed. I can’t explain all the details on how it was constructed, but I read them over, and they seem pretty sensible.
I was a physics prodigy in high school, and I tested into a college fast track physics program (but when I got to college I got deep into biology and never looked back).
The Etp model closely matched my intuitive theory about why oil prices will continue to fall. Now I can run the model in my head. I am trying to learn how best to explain it to people by discussing it with people. That’s all. It helps me to understand the model better.
I wish it was a friendlier discussion, too.
(I submit that any attacks by me against Dennis Coyne were well warranted and should not count against my record. Be fair.) 😉
Rune has a brilliant mind, would dazzle Goethe.
On the other hand, Mr. Futilitist, you are just baffling everybody with your bullshit and that is it.
Are you sentient?
Just who in the hell do you think you are?
What do you want? Eggs in your beer?
I don’t know if you are an antagonist or a bigot, probably both.
Anyhow, you’re like a crazed baboon.
Futilist, GOR can be expressed in different units. In metric terms it’s cubic meters of gas per cubic meter of oil. But I’ve seen engineers use thousand cubic feet per barrel in high gas ratio fields (or the inverse, barrels per thousand cubic feet).
Hey Fernandoo.
I knew that. That is why, when Rune questioned the GOR units, I answered back with:
So what?
Now, Rune claims he tricked me! Wow. Ha ha.
Dear Loren Soman (Futilitist) you wrote,
”So, why did Rune Livkern ask the GOR question in the first place? Why the confusion over the GOR units? I did a quick google search and found the answer quite easily.”
That question was directed to BWHill whom I take understood what I meant.
I was surprised to see that Loren Soman (Futilitist) stepped in, but then decided to jerk you around and remember you asked for it!
My point being to demonstrate for those who cared to follow that thread that Loren Soman (Futilitist) are clueless.
Thanks for playing the game!
By the way if I was the owner of the etp model I would by now start to be worried about the potential damage from Loren Soman’s (Futilitist) activities.
Rune, I asked you a simple question about physics and the economy which you decided not to answer. I don’t deserve this attack from you at all. You are *WAY* out of line.
People here are very evasive when it comes to the Etp model and what it indicates about future oil prices. Everyone here was evading my questions about the falling price of oil before I even heard of the Etp model. I think it looks very suspicious.
The other day, someone tried to suggest that I was shilling for bwHill, and now you are suggesting he should sue me for damages. Ha ha.
And what is with the Loren Soman, Loren Soman, Loren Soman, Loren Soman thing? I asked you to call me Futilitist. Please respect that, sir.
Now, back to the serious topic at hand. These are the important questions:
Do you think the price of oil can ever rise enough to pay for the total cost of it’s own production in the future?
Is it possible that we are reaching the end of economic growth?
Google “Futilitist”
He’s on about 50 different boards, driving everyone crazy.
I find it somewhat amusing.
I don’t find you very amusing at all. I doubt anyone does. Troll.
Hi John B,
Usually we do not agree, but there is a first time for everything.
Yes, Dennis, you and John B are both trolls.
Futilitist said:
I don’t know exactly. Less than $18/barrel, I think. Ask bwHill
The answer to that is that we don’t really know! If you look at the second graph on this page:
http://www.thehillsgroup.org/depletion2_022.htm
your will see that the downward portion of the curve is cut off at around 2020. To explain, there is a huge amount of embedded energy in the world’s petroleum production infrastructure. At some point the producers will begin extracting that energy by not replacing the production equipment that has reached its economic limit. They will run it until it fails. Much of the world’s infrastructure is used in the production of petroleum; roads, harbors, pipelines, and many, many others. They all have the potential to input energy by being depreciated out, and not replaced. That will slow the price descent, and that is why we show arrows in the second graph. Just exactly how fast, and how efficiently that extraction process can take place is anyone’s guess. The only thing that we can say with any certainty is that it can not go past the 2030-2035 “dead state” point.
Sorry that there isn’t a better answer, but the Model has its limitations; like all things.
http://www.thehillsgroup.org
Dear Learned Commenters
First, a disclaimer. I am not a hydrocarbon professional. I have been interested in hydrocarbons, and particularly oil, for a very long time. I have been wrong on numerous occasions. In 1964, courtesy of the US Army, I had a lot of time to spend in the base library. I did some research and concluded that the world was running out of oil So I invested my meager savings in Jersey Standard. We all know what happened next.
I try to start out with some imaginative view of how the world works or might work, and then try to look at some numbers. I DO NOT just start with arithmetic.
At the present time, I see at least three different imaginative views of the future which might guide our design or selection of a model.
If we think that globalization is going to crash and burn, then we might look at the world through the Export Land Model. The world will be divided up into fiefdoms, either ruled by warlords or hereditary nobility or charismatic leaders: Ghengis Khan, the Kings of the pre-WWI empires, or the Hitlers and Maos. All these types of rulers have the incentive to hang onto a precious resource such as hydrocarbons and deny that resource to their enemies. Arguing against this potential environment is a recent statement from the British that they see no problem buying whatever hydrocarbons they need, because everyone wants their British pounds sterling.
Another imaginative possibility is that people will sacrifice almost everything before they will give up hydrocarbons. They will sacrifice the accumulated and current production from photosynthesis, and they will perform triage among the current uses of hydrocarbons to cycle more resources back toward extraction and severely repress consumption. They will use three card monte techniques to finance things, if necessary.
The final imaginative possibility is what I deduce from my foggy understanding of the model used by bwhill and his group. I particularly call your attention to Chart 160, which can be found here:
http://www.thehillsgroup.org/depletion2_022.htm
Note that from 1900 to 2012, the maximum affordable price was above the cost of production. But in 2012, the cost of production exceeded the maximum affordable price. The enormous surplus from 1900 to 2012 accounts for the development of the economy that we have witnessed in the recent past, the growth of that economy, the growth of population during that time, and our tendency to see such developments as ‘normal’. Therefore, we get the Central Bankers trying to restore ‘normal growth’, when the thermodynamic conditions which enabled that growth have fundamentally changed.
It is not my purpose (nor my expertise) to offer a critical assessment of Mr. Hill’s work. I CAN see that it makes sense in explaining what happened during the 20th century, and the troubles we are encountering in the 21st century.
There are many questions about Mr. Hill’s model that I cannot answer. For example, if we take a look at Mobus and Kalton’s textbook on Systems Science, around page 112, we can find a discussion of potential and realized complexity.
‘If you found a bag containing a bunch of pocket watch parts all jumbled up (potential complexity), you would not consider this to be a very complex ‘thing’, because it is highly disordered. Whereas if you pulled a fully assembled and working watch out of the bag, you might be inclined to think of it as a complex object.
The movement from potential to realized complexity will require careful and extensive consideration. It not only highlights the thermodynamic framework of systems science, it also introduced us to the nature of process, emergence, and evolution.
In some respects, we constantly assess potential connectivity as we deal with every situation (always processes!), from crossing a street to eating a sandwich. In other ways, potential always moves forward beyond our grasp as realized connections make entirely new forms of connectivity possible.
With hindsight, it is evident that students in a university taking a course in systems science were one of the potentials, now a realized complexity, of the universe. It is a challenge for systems science to figure out, with hindsight, the process of transforming, evolving connectivity that has brought this realization. For an observer studying systemic potential just after the big bang, such a potential would be deeply buried in layers of modes of potential connectivity (chemistry, biology, sociology, economics, etc.) that would evolve over billions of years.’
How does this relate to Mr. Hill’s model? And I don’t know all the answers to that question. From looking at his graphs and numbers, I suspect that he is saying that the cost of producing oil includes the costs of maintaining the economy which has evolved to produce and use oil over the last 120 years or so. So…it’s not about drilling a single well…it’s about maintaining the economy which is able to produce all the pieces required to drill the well, and the economy which is required to maintain the consumer’s ability to pay for the oil. Mr. Hill further asserts that the costs of the larger economy plus the narrowly defined costs of drilling the well have now overwhelmed the ability of the consumer to pay.
Suspend your disbelief and assume that there is some truth to Mr. Hill’s theory. Then Mobus and Kalton would predict that the current economic system will, of necessity, be reorganized to operate on a much simpler and energy efficient basis. Predicting exactly how that reorganization might go is of the same order of difficulty as predicting, shortly after the big bang, that the Kardashians would become a major part of GDP in the 21st century.
For what it is worth, my guess is that the reorganization will be painful. I suspect that, despite Janet Yellen and the other Central Bankers, most paper wealth will be wiped out. I suspect that most of us will go through a process much like Cuba. Photosynthesis and passive solar will be our primary sources of energy.
To be clear, I am not making an endorsement of Mr. Hill’s model. First, he can speak for himself, and, second, I don’t have the credentials to do so. But I do think that some of the graphs associated with the model put the important questions front and center.
Don Stewart
Don,
Well put!
Our economies are complex machines which works due to thermodynamic flows (which are not visible). These thermodynamic flows are directed/regulated by the financial system(s).
The key word is “complex” and the energy system is part of the financial matrix and for some decades/centuries the financial matrix ran the show and will likely continue to do so for the near future, and it is up for debate if present complexity can be sustained.
Hi Rune.
Nice ringing endorsement of an opinion contrary to your own. I hate to be the one to tell you this, but Don Stewart was disagreeing with you! I just wanted to say that, in case any casual readers may still be confused as to your position. We wouldn’t want to muddy the waters, now, would we?
Hi Don,
The surplus energy comes from all the energy inputs into the economy, so we have to look at oil, coal, natural gas, and all other energy sources, rather than oil only to make a judgment on the surplus energy available.
Secondly, the maximum consumer price that is affordable has very little to do with the net energy in a unit of oil and is primarily a function of the supply and demand for oil. The maximum price of oil will depend upon the available supply of oil at that price and the price that consumers are willing to pay at a given level of income. This in turn depends on the price of substitutes and consumer preferences.
Dear Dennis Coyne
I tend to look at ALL energy sources, from photosynthesis through passive solar and including the fossil fuels. I don’t look much at nuclear, because I think it is not much of a source of surplus. But I think that the central importance of oil is in terms of transport. Transport is a key ingredient without which our very complex society could not have developed. The navigable rivers and the canals and the coal fired railroads were fine in their day, but oil greatly multiplied transport which led to the complexity which we see around us. I think that the smartphones contain ingredients from more than a hundred countries, for example. And within a country, some of the sources would be hard to reach from a seaport in the absence of oil.
For those reasons I think that high-cost oil (as differentiated from high priced oil) will start a major reshuffling in terms of the connections which comprise the complexity of our global economy. Since there will be less energy, thermodynamics tells us that things will get less complex. Exactly how that less complex system will look is beyond the powers of my crystal ball.
Don Stewart
Don,
“For those reasons I think that high-cost oil (as differentiated from high priced oil) will start a major reshuffling in terms of the connections which comprise the complexity of our global economy.”
The important key words are costlier oil (high-cost oil).
We (IMO) are blindsided from looking at the cost of money (interest rates) as opposed to looking at the cost of capital when planning our future.
Hi Don Stewart,
My point is simply this, transportation is important and is primarily fueled by oil.
The importance of transportation will mean that oil will be produced whether it is net energy positive or net energy negative. As prices for liquid fuel rise due to the increasing costs of producing oil, people will use liquid fuel more efficiently, more long haul transport will be done with trains, more people will use public transportation where available, people will demand that more pubic transportation is built, people will move closer to work, and to walkable neighborhoods, demand for better planned more walkable towns and cities will increase.
There may also be some move to EVs as battery costs are reduced.
Some (maybe most) say such a transition is impossible, higher fuel prices and the realization by society that peak oil has arrived may cause consumer preferences to change more quickly than many think possible.
I do not think there will be a sharp decline in oil output unless an economic collapse occurs in response to higher oil prices or if EVs, light rail, rail, and electric busses make oil obsolete (this scenario seems too optimistic to me.)
Dear Dennis Coyne
I was born before WWII started. I well remember the war years when everything was rationed. My family was quite poor by modern standards. Neither my grandfather nor my father ever drove a vehicle to work. My grandfather delivered ice with a horse drawn wagon We lived in Texas with no air conditioning.
Therefore, I am quite skeptical about people who say that change toward a lower energy consumption lifestyle is impossible. I will agree that the more than tripling of the global population and the unbelievable increase in debt and promises to pay since I was born makes it all harder. But I think that Janet Yellen saying that ‘no deflation will be permitted’ is perhaps our biggest obstacle. A rearrangement of the components of the economic system very likely would mean that the paper assets people hold would be severely depreciated.
David Graeber, in The Utopia of Rules: On Technology, Stupidity, and the Secret Joys of Bureaucracy points out that:
‘for most of Eurasian history, ordinary people used informal credit arrangements. Physical money, gold, silver, bronze, and the kinds of impersonal markets they made possible remained mainly an adjunct to the mobilization of legions, sacking of cities, extraction of tribute, and disposing of loot. Modern central banking systems were likewise first created to finance wars.’
I think that SOME people are resilient enough to reinvent that kind of earlier society, and be reasonably happy. I don’t include Janet Yellen in that group of resilient people.
In my optimistic moments I visualize us using the fossil energy we have left to assemble the infrastructure we will need in a lower energy environment. And that we stop destroying resources such as soil and water. I won’t bore you with the moments of pessimism.
Don Stewart
Great comment, Don, and one that most, it would seem, can understand, too, such as we ‘lumpenproletariats’– a term that may find some salience in the years ahead, peak specialist and all that.
Hi Caelan.
I agree.
People here should be able to express their ideas in common, direct language. If they claim a lot of special knowledge, and their ideas don’t make sense, they are trying to deceive.
We are in overcomplexity mode and rely, precariously, on specialization and those who specialize.
In a sense, Watcher, for example, and through no fault of their own, occupies a particular echo-chamber with a particular door for access. If you do not have the keys, or have limited access, and want to hear anything, you have to press your ear to the wall for example, but what you hear is going to be muffled and garbled. At the same time, Watcher is trying to ‘watch’ other echo chambers, and vice-versa and so on.
We all, in a sense, occupy our own little echo chambers, and this is part of the state of our age and a large part of the problem.
Channel Z
Don. I have the same poor, hot, prewar, history, and share your opinion more or less exactly.
I have spent my life in engineering R&D, and from that know from personal experience how fast technology can evolve if it’s under a lot of pressure to do so.
Think of, for example, fighter planes during the war. They had to get better faster than the other guy’s, and they did-on both sides. Head to head race all the way. Same with ICBM’s, where I started.
So, if we all noticed that we were actually under a lot more pressure right now than any war has ever put on us, we could move real fast to something that worked.
My bet is solar, and to kick it off, I just went ahead and did it for my own house and car, and it worked wonderfully. So here in my tiny micron of the system, we are fixed for life of free-from-now-on electricity–in fact, we have an oversupply.
Nothing to stop the millions who have the resources to do the same right now. Let them be the lead examples, and take off from there.
We can do it, so, just do it. Goddam it.
Hi Rune,
Excellent response to Futilitist.
Now watch him twist what you say into something totally different.
Looking at BW Hill’s chart it looks like the 2015 oil price forecast is $87/b, 2016 about $65/b and continuing lower from there, I believe these are nominal prices for WTI.
To me the 2015 forecast looks high and I expect 2016 and beyond are too low.
If the ability of the World economy to support current debt levels does not continue and a severe economic contraction occurs before 2020, then oil prices will be lower than I predict.
My estimate is that the peak in oil output will be around 2020 with a slow decline for 5 years or so, then output decline will steepen and a quick rise in oil prices to $175/b (2015$) or more will cause a depression by 2030.
It is very doubtful that this estimate will be accurate. Obviously.
Dennis Coyne said:
Looking at BW Hill’s chart it looks like the 2015 oil price forecast is $87/b, 2016 about $65/b and continuing lower from there, I believe these are nominal prices for WTI.
It would probably behoove you to take a closer look at the graphs, and commentary before you attempt to critique them.
1) The 2015 maximum price point is $76/ barrel, not $87
2) The graph gives maximum affordable price, it is not a prediction of what the price will be. It merely states that the price can not exceed that level. Otherwise, there would be a reduction in overall economic activity until it falls to that level. It gives the maximum price that the economy can afford to pay for petroleum at any point in time.
We can not predict the price of oil anymore than anyone else can. If the US got into a full scale nuclear war with Russia the price of oil would obviously become zero really, really fast. What we can predict is the maximum price that oil can sell for at any point in time. That is not a prediction of the price, it is a statement of the boundary conditions for the price of petroleum. In 2015 that will be between $0 and $76; in 2016 it will be between $0 and $66. At some point we expect the rate of decent to slow as the world begins to gut its capital stock to provide oil.
http://www.thehillsgroup.org
Hi BW Hill,
Thank you. I should have looked at the chart more carefully.
Was I correct that these oil prices (or maximum possible oil prices) are in nominal dollar terms rather than constant (or inflation adjusted dollars)?
I believe that in 2016 your maximum affordable price prediction will be incorrect and that the nominal oil price will be above $66/b (average spot price for WTI in 2016). Time will tell.
The price of oil is not directly related to its net energy, it is determined by market supply and demand.
Hi Dennis.
What is this prediction based on? Guessing?
Hi Futilitist,
All forecasts of future oil prices are guesses, including those of Mr. Hill.
My guess is based on economic analysis. I expect that oil output will be relatively flat slightly lower at the present oil price level. I expect demand for oil to increase by May and the excess oil in storage will be drawn down, as the storage levels reach more normal levels prices will increase by Sept 2015, unless there is a World recession demand will continue to increase as the World economy grows and prices will rise to at least $80/b for an average price in 2016.
As BW Hill gives a range from 0 to $ 66, I will give myself a $25/b range and say $75 to $100/b will be my guess for 2016 oil prices. I think BW Hill’s guess for 2015 is very good, but expect the price will be closer to $77/b than to $0/b.
Dennis, you make guesses.
bwHill built a model based on physics to make his Etp price curve. Thousands of man hours went into the creation of the Etp model, which has very accurately predicted the price of oil since 1960.
You aren’t even in the same league as bwHill and the Etp model. Not even close. ha ha.
I very seriously doubt that anyone takes you seriously on this.
Dennis,when you make your so called forecasts, you do so with no basis in reality. Your guesses are no better than flipping a Coyne! 😉
Hi Futilitist,
I have in illusions about my powers of foresight, bw hill’s model looks suspect to many who have looked at it. You should buy some futures and bet against the current futures market, you should make a killing. Good luck with that.
There is no good model of future oil prices, I can tell you what prices have been in the past, that is all BW Hill can tell you, his price curve does not prove his model. The price of oil is not determined by thermodynamics.
Dear Dennis and All
I know 2 people who were predicting lower oil prices before the collapse started: BW Hill and Gail Tverberg. We know about BW’s model. Gail thought (and still thinks, I believe) that the most pressing limits are debt, which constrains purchases on credit, and thus the ability of consumers to buy. I think Gail’s view is very wide, including the entire economy…not just oil.
In addition, 5 years ago Richard Heinberg formulated the idea of a ‘Goldilocks’ zone for prices which are pretty close to BW Hill. Richard said the price needed to be between 60 and 80 dollars to permit the economy to grow and producers to make a profit.
http://blogs.reuters.com/environment/2010/02/18/goldilocks-and-the-three-fuels/
There are probably others who predicted the price decline, but I am just not aware of them.
Don Stewart
Gail thought (and still thinks, I believe) that the most pressing limits are debt, which constrains purchases on credit, and thus the ability of consumers to buy.
I believe debt is isn’t the constraining factor. Debts can be cancelled. And as QE has shown, we can keep creating money without much fuss as long as there isn’t much inflation.
However, I do believe the consumer’s ability to pay for oil will decline as their incomes decline. A small group of people are getting very wealthy (even though it is mostly paper wealth), but not investing that wealth into ways that filter back to the masses. So the wealthy stay wealthy, the 99% slow their consumption, and at some point oil use declines. The wealthy have money to buy oil, but they can only use so much of it.
So I think it is income inequality (and declining consumption), not debt, that will keep oil prices down. At least for awhile. I think that the long term trend is for oil prices to rise until substitutes are found. But those substitutes aren’t limited to new forms of energy. They can also include efficiencies and disuse of oil burning machines. For example, walking can be a substitute for oil.
At any rate, oil gets scarce, the price goes up, and people use less of it. But that process isn’t linked to debt unless we plan to allow the consumer unlimited credit to continue to maintain current rates of consumption.
I believe debt is isn’t the constraining factor. Debts can be cancelled.
I find that comment rather astonishing. It’s a little like saying cancer can be cured by death. Capitulation on our debts, public and private, is not an answer. It would cause many times the problems it cured. It would be the end of the US economy as we know it. It would cause the total collapse of our banking system. In effect, money would become worthless.
I know, it just sounds so damn simple but Boomer, you really have not thought this one out.
Capitulation on our debts, public and private, is not an answer. It would cause many times the problems it cured. It would be the end of the US economy as we know it. It would cause the total collapse of our banking system. In effect, money would become worthless.
Oh, it would be disruptive. But Gail argues that all of civilization will end because of debt.
I’m suggesting that debt won’t be the reason humans don’t survive. When it comes to survival, financial accounting won’t be nearly as important as water, land, food, energy, etc.
We can continue to shuffle around numbers on computers if we must. Basically we’ll end up taking the money away from the rich. They’ll get by.
As others have suggested here, the Fed will keep shuffling around numbers as long as possible to keep things propped up. If inflation is under control, it will probably keep doing it indefinitely if need be.
When it comes to survival, financial accounting won’t be nearly as important as water, land, food, energy, etc.
You might find a little water without finances but not much of anything else. How much energy are you going to get without money? How many windmills are you going to build?
Whether you are willing to admit it or not, finance keeps everything running. Close down the money spigot and you close down the world.
You might find a little water without finances but not much of anything else. How much energy are you going to get without money? How many windmills are you going to build?
The world has operated without debt or money before.
I’m just saying that I don’t put nearly as much importance into debt as Gail does. I think most of today’s debt is merely digital. It’s like saying that Beanie Babies are worth $100 a piece. They are only worth that if someone is willing to pay that.
Because most of the world’s wealth is held by a small group of companies/people, when push comes to shove, it’s their net worth that declines, while the rest of the world gets by as it has done: The underground economy. Barter. Trading. Sharing.
The more the 99% are impoverished, the less debt means to them in their day-to-day existence. What are the bankers going to do? Foreclose on everyone? What good are a lot of empty houses for the wealthy?
As we see now, QE is propping up the stock market, largely to the benefit of the wealthy. Is it ever going to end? Is there a reason for it to end if there is no inflation?
I agree.
Hi Don,
Leo Maugeri also predicted a price decline because oil supply would be abundant.
That is closest to correct, but his forecast that prices will remain low for the foreseeable future will be incorrect.
Oil prices will rise in the future, to $70-80 at first in 2015 and then gradually (2016 to 2017) up to $100/b or more.
That is my guess, and like all other price forecasts, it is only a guess.
Dennis
Another person predicting the fall in the price of commodities has been Nicole Foss. We in North America haven’t heard much from her since she moved to New Zealand. Here is her current spiel. 35 minute mark. She makes her comments about financial and commodity collapse in the first two minutes.
http://holmgren.com.au/great-debate-the-video/
Don Stewart
Hi Ron.
I agree.
I also very much agree with Don Stewart.
*For some reason, the comments above this are seriously out of order (impossibly so, actually). I obviously did not agree with Boomer. This is to correct any misimpression that this error might have caused. Thank you.
Dennis Coyne: “The price of oil is not directly related to its net energy, it is determined by market supply and demand.”
Demand for oil will fall because it will provide less and less net energy. So the price will fall too. In other words average worker will be poorer and poorer, so he will buy less stuff, and to produce stuff we use oil.
Hi Kam.
I agree with you on this.
Hi Kam.
Do you know how much net energy is in the gasoline tank in your car? Net energy for individual products makes no difference to the individual consumer.
Only the net energy of all energy products in the economy matters.
Many of the energy inputs to the petroleum producing process have positive net energy, the oil will continue to be produced because of its energy density and convenience regardless of its net energy.
http://exergy.se/
http://www.exergy.se/ftp/introduction.pdf
http://exergy.se/goran/pdf.html
Gents, thanks for the discussion.
One of the least understood concepts is “exergy”/”exergetics” (in addition to net energy per capita to sustainable scale, which is related, of course).
If one were to fully understand it, which I can assure you virtually all eCONomists and the vast majority of the population do not, one would be possessed of the epiphany that the civilization the West has built with cheap, easily accessible “energy slaves” per capita cannot sustain the existing oil-, auto-, debt-, and suburban housing-based (un)economic model, nor the petrochemical-based industrial agribusiness model.
Moreover, should this be a fact, neither have we the “exergetic” capacity to simultaneously build out a “renewables” infrastructure AND maintain the existing fossil fuel infrastructure AND achieve ongoing growth of real GDP per capita indefinitely.
Something has to give, and it’s giving in the sense that US real GDP per capita since 2007-08 has been the slowest cyclical and 9-year average rate since the 1930s-40s, 1890s, 1830s-40s, and Japan since 1998, i.e., “secular stagnation”. The rub is that during the foregoing periods, the economy was either agrarian/shopkeeper- or a low-energy-density per capita industrial economy, not the increasingly complex, high-entropy, hyper-financialized, valued-added (???) services economy we have today.
Hi Rune,
“In the world we live in, the oil (other energy) price range is not physically constrained, but by total debt and credit creation.”
Bingo!
…finally somebody who truly understands !
Be well,
Petro
“In the world we live in, the oil (other energy) price range is not physically constrained, but by total debt and credit creation.”
~Rune Livkern
To hell with the laws of physics, we’re the masters of the world! Yipee! 🙂
https://www.youtube.com/watch?v=4HbJBQ91ZZs
“Those citizens who questioned, those suspect harborers of doubt, were brought before a panel of the Ministry of Health. They were tested, and encephalagramed, till rendered quite insane, when in accordance with the laws, they repossessed their brains.”
~Klaatu
“To hell with the laws of physics, we’re the masters of the world! Yipee! :)”
-Hi Futilitist,…
….would you like to know what it is , or what it should be!
-Peak will never come from supply constraints – THAT IS WHERE YOU AND 99% OF THOSE WHO COMMENT IN THIS FORUM AND OTHERS LIKE THIS ARE WRONG!
-Peak will come BECAUSE we CANNOT AFFORD energy anymore, NOT because we will (physically) run out of oil.
If we can grow debt/credit and afford it, we can drill on the MOON if we need to, and never run out of oil.
-We are running out of AFFORDABLE oil!
This time is a DEMAND/AFFORDABILITY issue, NOT an “oil has run out” issue.
Perhaps this will help:
https://www.youtube.com/watch?v=u8BJUWKZKHM
Minute 8:00 of the video is especially helpful – watch it carefully!
Be well,
Petro
The moon doesn’t have oil.
I am happy that you clearly and obviously understood what I meant
with: “…drill on the Moon , if need be…”.
Be well,
Petro
P.S.: just out of curiosity, indulge me please: how do you know that there is no oil on the Moon?!?!
The moon never had conditions for life, and it lacks an atmosphere. It’s just a big rock covered with sand and dust.
….errrr,
I really hoped you would not take the bait and answer that challenge….I feel bad for you.
You made me laugh though…..thanks!
Petro
“The moon never had conditions for life, and it lacks an atmosphere. It’s just a big rock covered with sand and dust.”
FWIW: He didn’t say which Moon 🙂
Titan is a moon of saturn, never had life, but abundant in hydrocarbons.
I am just waiting for some like Dan Yergin ( CERA, IHS) says that PO isn’t a problem, will just drill on Titan.
-More help…and not only for you…!
https://www.youtube.com/watch?v=tt3dGOTyGaE
Petro,
I am not sure why you posted those videos. I agree that supply constraints are not the problem. Oil affordability is the problem. That is what I have been saying all along.
This is where we clearly do not agree. There is no way to grow debt/credit enough to raise the price of oil high enough to pay the full cost of production ever again.
Hi Petro and Futilitist,
I think that everyone (except Watcher) agrees that the price of oil matters and that peak oil will be a result of both supply and demand for oil as it usually is in a market economy.
The question is what is the price of oil that the economy can afford? A second question is what determines the price of oil in a market economy?
Different people have different answers to these questions.
Everyone does not have to agree on what those answers are.
The first question is harder to answer, I use an oversimplified analysis based on the percentage of spending of the World economy on crude plus condensate which has caused recessions in the past. James Hamilton does a much more sophisticated econometric analysis of the United States which indicates that a fast rate of rise in the price of oil causes economic disruption (the economy cannot adjust quickly enough) and leads to a recession. My skills in econometrics are limited and trying to reproduce Hamilton’s analysis on a World level has not been attempted by me.
The second question on what determines the price of oil has at least two takes:
1. The oil price is determined by the supply and demand for oil in the market as usually analyzed by standard neoclassical (Walrasian) economic analysis.
2. The oil price is determined by the net energy of the marginal (lowest net energy) barrel of oil.
BW Hill claims that for any barrel of oil produced that if the energy out is not more than the energy in ( net energy is positive), that the value of that barrel of oil ( the price) should be zero. He cites Hubbert for authority.
I submit that the claim by Hill ( and Hubbert) that the net energy of a barrel of oil must be positive for the barrel to be produced is false.
There is something called arbitrage.
If natural gas prices for oil extraction from oil sands on an energy basis ($/Joule) were higher than what the extracted oil ($/Joule) sold for, there would be no oil from oil sands.
The pricing system with low natural gas prices allows for arbitrage, whereby the input of cheap natural gas allows for (until recently) higher priced oil that makes a financial profit.
Same thing with GTL (Gas To Liquids)/CTL (Coal To Liquids) (Fischer- Tropsch), it is priced arbitrage that makes those processes profitable.
You can substitute a lower priced energy source to produce higher priced energy (or more versatile sources like oil/liquid energy).
If oil is deemed/found more versatile/valuable for society than a portion of natural gas/coal, it is possible to run the process with negative net energy….for some time.
Hello Rune and Dennis (and John B).
Both (all) of you fools are wrong.
“Gosh, Futilitist, take it easy. How can you say such a thing? Rune seems like a pretty smart guy.”
~Loren Soman
I can say such a thing because neither (none) of these guys can solve the Futilitist Collapse Challenge:
http://peakoilbarrel.com/eia-confusion/comment-page-1/#comment-504528
“I suppose you are right, again, Futilitist. No one here seems to be able to solve such a simple riddle involving only three moving parts. That must mean that the price of oil cannot ever rise high enough to pay the total cost of it’s own production, just like you said.”
~Loren Soman
Yeah, that about sums it up, Loren. The oil industry is going to unwind, and with it, the civilization that depends on oil for it’s survival. Collapse has begun.
Sorry.
Hi Futilistit,
“I am not sure why you posted those videos”
That is precisely my reason: you not being sure!
“This is where we clearly do not agree. There is no way to grow debt/credit enough to raise the price of oil high enough to pay the full cost of production ever again.”
-That is in complete contradiction to what you replied to Rune and, if this is what you think, we should agree – NOT disagree!
Debt is collapsing and not growing anymore and, is the REAL reason the oil is going down and NEVER to reach $100-$150 (today’s dollars) again, not because the Saudi minister said so.
There shall be no Bakken, Eagle Ford and Kashagan to save us this time around.
If you own oil sell now while you can, for it is going the way of ’98-’99…..(a few spikes here and there notwithstanding)
…and when it goes there hide and prey!
Be well,
Petro
Hi Petro,
Is there evidence that debt is currently collapsing, I thought it was expanding?
Do you expect debt will collapse in the future? That would make more sense, it is not clear that this has begun.
It is by no means clear to me that debt will collapse, but I would agree that the growth of debt will be slowing down until it reaches sustainable levels and then grows at the same rate as GDP in the future.
That is a very long answer Dennis, but let me say that since 1968, we live in a totally financialised economy, credit-ism, if you will!
There is NO connection between the classical supply-demand laws anymore. Supply/demand can be moved forward at any time just by increasing credit/debt. That is the real reason we have Bakken, Kashagan and 3 mile underwater projects, even though technology was there decades ago, but only happened AFTER 2008. That is why Rune, and a few others are correct in saying that peak oil this time shall be not physically constraint!
We did this by TARP1, TARP2, QE1….QE99….
By increasing credit/debt at our will, we shall NEVER reach Peak oil (that’s what Simmons and Campbell did not predict – printing money at will – and their timing was not “precise enough”!)
On this type of economy we are in, debt/credit MUST grow by 2.4%(roughly and variates) of previous year, or we always enter recession!
In 2014 it grew by “only” 1.8% and the difference was fit by QE.
There comes a time however, that when debt reaches a certain level (I am talking about the total outstanding debt, not the 18 trillion you see everyday on the news which is a tiny fraction of that), the not “growing enough” is equal to debt “contracting” and collapsing and we are there NOW.
This reason makes “tapering” QE impossible and expect QE4…..infinity coming soon. Right now QE from Japan, China and Europe is fitting the bill and is clearly not enough – hence oil $40-$50/brrl.
Expect oil (a tick here and there due to Yemen being invaded notwithstanding) to go the way of ’98-’99…meaning down, way down.
-We shall never see high prices again!
I am not talking local war zone high prices, but stabilized world marked prices.
And when the prices reach certain level (let say $20-30) for sustained periods and all the high priced producers are bust, then and ONLY then disruptions in supply and price volatility (skyrocketing) will hit us… and then social calamity and war!
Exactly what happened in 2008 (from $20/brl we went to $147/brl to $30/brrl).
This time however we shot our LAST bullet (QE) so we have nothing left.
That is why I replied to you in another post:
“…pray that Yellen, Kuroda, Draghi etc do not fail anytime soon…”.
We have crossed the Rubicon – Alea Iacta Est!
This time is a bonus for us!
There shall be no EV and PV (and whatever) by 2030-2050 and that is why Javier’s article (which seems to be more of a dissertation theses than a blog article – my personal opinion and no offense intended!) projections shall never be observed in practice.
We are at the peak of everything!
Only down hill from here.
Simmons and Campbell were not wrong!
It looks like the down slope will be far steeper than they wrote about.
Hope it helps…..again, the answer to your question requires a lot of time and space.
Be well,
Petro
There comes a time however, that when debt reaches a certain level (I am talking about the total outstanding debt, not the 18 trillion you see everyday on the news which is a tiny fraction of that), the not “growing enough” is equal to debt “contracting” and collapsing and we are there NOW.
But given that QE is basically putting more money into the hands of the very few, if the debt situation collapses, aren’t these very few the ones who lose wealth? (The 99% no longer having much wealth left to lose.)
Hi Boomer,
(The 99% no longer having much wealth left to lose.)….
That is why the demand is collapsing and hence oil@ $40/brl
Again, what Dennis asked requires a lot of time and space to answer.
Many years in energy/investment banking and I have still not completely figured it out
Be well,
Petro
“…The map is a simulacrum that, as a model, loses all reference to reality… reality exists only as rotting shreds that are attached to the map, and this is the state of our age according to Baudrillard; that the model, itself, has primacy for us; the real has become irrelevant…” ~ Frances Flannery-Dailey
“Animals don’t do what humans do via speech, namely, make a symbol stand in for the thing. As Tim Ingold puts it, ‘they do not impose a conceptual grid on the flow of experience and hence do not encode that experience in symbolic forms.’ ” ~ John Zerzan
Debt/Credit/Money/Detached Reality
……Continued……………………………………………………….
Dennis,
The reason Hubbert was precise almost to the year and month in regard to US peaking was that then, we were on a semi-gold standard. Credit/debt growth was kept in check (almost) entirely.
Dollar’s gold backing ended in 1968 and that forced Nixon in 1971 to officially and formally end conversion of dollars to gold (a.k.a. BretonWoods accord)
We had 1 trillion of outstanding debt then, we have 60 trillion now. We had 4 trillion of unfunded liabilities then, we have >200 trillion (and growing by 5-10 trillion every year) now.
These are ONLY US numbers. Total oustanding debt for the world is > 100 trillion.
This explosion in credit/debt made our world. Without it, our fancy electronic iGadgets and 10 mile/gallon gas guzzlers would have never been possible. China would still be in its
pre-Nixon/Kissinger visit medieval obscurity.
At that time laws of supply and demand were functioning (almost) entirely and we had (almost) free, unmanipulated markets.
Had that been the case today, Simmons and Campbell would have been accurate to the month (if not week/day) of the world peaking!
We would have never had Bakken, EagleFord, Kashagan, etc
All of that credit/debt that made this possible started collapsing in 2007-2008-2009.
I know they are vilified by a lot of people here, but had there not been for Greenspan, Bernanke, yYellen and had we let the laws of economics take over and do their business at that time (2008-2009) we would be eating each other for food right now – literally!
Whoever tells you that we need balanced budget, gold standard, sound economic principles (and bullshit like that) right now, is either a moron (i.e.: Jim Sinclair, Richard Russell, etc) or has other agenda (i.e.: Jim Rickards)
If we put our fiscal house in order right now, we would plunge in the Dark Ages…in very short order!
We have crossed the point of no return!
That is why you hear Yellen say that we need inflation to be 2%-3% anually.
We are not doing that now. Is less than 2%. That is why debt is collapsing and with it the price of oil.
We ALL should pray that Yellen and co. finds another “trick” in the book and expand credit/debt once more.
It is bonus time for us and we all should enjoy it.
The future looks very, very dark indeed!
Do not waste time in “electric cars in 2030”, or “10 billion people by 2050” type of discussions.
-We should have had the EV people in abundance during the ’70s…it is too late now!
-We should have had the “anti FED and the balanced budget” crowd in abundance and possibly in power during the ’70s – it is TOOOOOO late now!
Enjoy and pray!
Let me know if my answer helps!
Be well,
Petro
P.S. Ron, I apologize for going long and out of topic! Thanks
Petro is there a link between the US going off the gold standard and US peak oil occurring about the same time in your opinion?
Very good question (and observation) Shallow Sand!
-Not directly. Just coincidence. The peak was very accurately predicted By Hubbert long before the dollar’s gold backing ended.
-That said however, the expansion of credit (therefore economic activity -therefore energy consumption -therefore oil consumption) might have brought peak forward by a few years.
After all, Hubbert did say early ’70s not December of 1970 (when the US peak happened) to the dot!!!
Again, very good question.
Thanks for paying attention.
Petro
Hi Petro,
I think the oil price fell because oil supply expanded faster than oil demand leading to a collapse in oil prices. Global debt has been growing slowly since 2011, relative to 2001 to 2011, perhaps more debt growth would be better than less.
The debt to GDP ratio based on BIS debt data and IMF GDP data (PPP) has risen a little from 87% in 2002 to %120 in 2012, but fell to %115 in 2013. The peak was in 2011 at %124 of debt to GDP. World real GDP grew at about 3 to 4% per year over the 2011 to 2014 period with decreasing debt levels. Once we get to a 100% debt to GDP level debt can continue to grow at the same rate as GDP.
I just don’t see the problem with current debt levels, in fact too little debt, and conservative fiscal policy in Europe is a big part of the problem.
Hi Dennis,
You either did not read, or understand what I wrote.
Perhaps my fault!
Debt to GDP ratio and CLASSICAL/STANDARD supply and demand law are sooooo outdated …..they stoped existing in 1971.
They are up there with classical fractional reserve banking as money creator (that C. Martenson talks about).
I think your mind is set on how this works and my answer will not change things.
What’s the word I am looking for…..:let’s agree to disagree.
Shall we?
Be well,
Petro
P.S.: perhaps devoting less time to Futilistit might help see things clearer and calmer.
Just a thought….
https://www.youtube.com/watch?v=AZm1_jtY1SQ
http://www.2112.net/powerwindows/downloads/smartphone960x854/Rush-2112-2.jpg
“Attention all planets of the Solar Federation.
We have assumed control.
We have assumed control.
We have assumed control . . .”
😀
From my vantage, as cynical as it possibly can be and can tolerate, the finance side of the world’s economy is looking more like a form of genocide, at least a pogrom of some sort.
“The financial side of the world’s economy” implies that you are talking about every economy, or almost every economy, in the world and that they are all conspiring to kill people.
I find that accusation truly absurd.
Ron, his phrasing might have been precise. “The finance side of the world’s economy” is not how you interpreted. Finance is not economics. It’s not monetary, either.
Edit:
Or rather, adding
Finance is flinging about assets and liabilities to advance the cause. It’s not economics, which hell, could be called pseudo psychology.
There is some abusive finance going on right now. Has been since 2008. Massive choices to do share buybacks rather than expand business. Keeping money overseas to dodge taxes. And, dare one say it, loading up a balance sheet with high yield paper to extract oil out of the ground, rather than burning up the enemy’s oil first and still having yours to use when he doesn’t.
Genocide – noun 1. the deliberate and systematic extermination of a national, racial, political, or cultural group.
Nevertheless genocide implies a deliberate attempt to exterminate a group of people. And Ronald used the words “world economy”. That would have to mean a group of financiers, all over the world, are conspiring to exterminate a certain group of people.
I know he really believes no such thing. No one could possibly believe in such a conspiracy. Nevertheless that is kind of harsh language to just toss around.
Totally absurd, yes. Harsh words, yes.
Just abject cynicism.
Nothing is sacred and there is humor in anything. Frank Zappa and Tom Lehrer knew it all too well. Lenny Bruce was a master at being cynical, insulted everybody, ad absurdum.
Speaking of absurd, let’s visit some tulipmania:
The nursery catalog of the Haarlem florist P. Cos (1637) is unique among tulip books in that it mentions the name, weight, and price of the bulbs that were sold. The most expensive was the Viseroij (Viceroy), a Violetten illustrated in the gouache above, a bulb which sold for 3,000 guilders and another heavier one for 4,200. Even the lower price was twenty times the annual salary of a skilled craftsman. A contemporary pamphleteer provides a vivid sense of what 3,000 guilders would have purchased at the time: eight pigs, four oxen, twelve sheep, twenty-four tons of wheat, forty-eight tons of rye, two hogsheads of wine, four barrels of beer, two tons of butter, a thousand pounds of cheese, a silver drinking cup (as well as clothes, bed and mattress, and a ship!)—all this for a bulb that weighed 410 aasen or a bit more than half an ounce.
@Ronald: “From my vantage, as cynical as it possibly can be and can tolerate, the finance side of the world’s economy is looking more like a form of genocide, at least a pogrom of some sort.”
In the US since 2008, total annual net flows to the financial sector equal total annual GDP output.
Moreover, total imputed compounding interest to credit market debt outstanding to average term now equals 100% of GDP. That is to say, all labor product, profits, and gov’t receipts are pledged to the financial sector and its top 0.001-1% owners in perpetuity.
But it’s worse. Take the PV of US gov’t unfunded liabilities of $200 trillion and discount the imputed net interest costs out 30 years at the current interest rate (assuming no increase in rates), and the average annual net interest just to federal gov’t debt (not counting local and state and private debt’s interest costs) would eventually absorb an equivalent of total annual private wages in perpetuity.
Thus, the US economy and fiscal conditions are no less unsustainable than that of Greece. In fact, by established accounting practices, the top 0.001-1% own direct and indirect rentier claims on all US income and everything of economic value in perpetuity, leaving the rest of society effectively broke and dependent upon gov’t promises than can never be met mathematically.
Well I think of finance in the following way:
-it concentrates wealth at the very top
-by concentrating wealth at the very top, more and more people are thrown into poverty, which means escalating welfare/health care spending, deficits, etc. in a never ending spiral; or, if you will, private sector profit moves up along with total debt
The banks and the welfare classes are on the same side! Both benefit from extraction from the productive economy, which is enabled by financialization
Nobody can diagnose the problem, and interestingly enough this means that the modern way we think about political division is wrong; it’s actually the productive middle and working classes against both the top and bottom which are dependent on finance
There’s nothing we can do anymore; the productive classes and savers are going to be wiped out, and after they are gone, the banks and welfare classes will follow as they no longer have a productive economy to pilfer; and only once this happens will lessons be learned
dolph9, I think your assessment is correct, regrettably. See my response to Caelan below.
We have created a kind of rentier-socialist system benefiting primarily the top 0.001-1% at the expense of future real value-added economic output for the rest of us, resulting in the top 1% no longer perceiving that they need to engage in the competitive profit-seeking productive economy, whereas the bottom 50% are now subsisting from payroll taxes on the labor product of the working class and deficit spending the gov’t requires to prevent contraction of nominal GDP.
Moreover, beginning in 2007-08 and persisting to date, the so-called “industry requirement costs” (see BEA) of the underlying economy required to allow for the value-added output of the economy we commonly refer to as “GDP” has matched and recently exceeded in incremental terms the capacity of “the economy” to sustain, let alone grow, real, value-added output per capita.
IOW, the costs are now prohibitive WRT maintaining “the economy” (80-85% services in value-added terms) in real, per capita terms, but NO ONE in position of intellectual, institutional, political, or mass-media influence and authority is permitted to say so.
Therefore, there will not be disclosure of the nature of our situation forthcoming from those who know (or ought to know) and who have the capacity, credibility, legitimacy, and authority to inform the masses and thus frame properly the nature of our challenges such that pragmatic, comprehensive, mathematically feasible “solutions” can be proposed, debated, assessed for their cost-benefit merits for all, and implemented so that we can avoid system financial, economic, and political collapse of a system that simply cannot be sustained energetically, exergetically, fiscally, and mathematically.
Ronald – Okay, you got me. Usually I disregard your comments, but now you have made me curious. Which ethnic group or religious group is the target of the pogrom that you see? And why “them” whomever they are? Please educate us.
The Irish! Get those Paddies out of Ireland!
No particular ethnic or religious group in mind at all.
The Phoenicians and Sumerians?
I’m really thinking more of working people who have saved all of their lives and end up having nothing simply because of the fiat system that everyone worships faithfully ends up making them poorer. It becomes a stealth bankrupting of the general population, nothing new there. It has happened before.
The Weimar Republic is one example, German’s used those Reichmarks to fire their cook stoves.
Millions of middle-class Germans, normally the mainstay of a republic, were ruined by the inflation.
The experience of the Swedes
It’s all happening again and it ain’t over ’til it’s over.
The Pareto principle
Caelan, thanks for sharing this important concept, of which most are unaware.
In fact, in the US, the 80-20 rule has become the 96-4 and 99.2-0.8 rule since the 1990s-2000s, i.e., the second- and third-order Pareto distribution, which by historical precedent is the “r-evolutionary” or “collapse” distribution.
Note that the top ~1-4% know this, or at least a large enough plurality of the principal, influential members of the caste know it and have prepared for a VERY LONG TIME for the inevitable outcome.
It’s not going to be a happy ending for most of us and our progeny, regrettably.
Yes, this setup’s winding down, or unwinding…
A day or two ago, I saw a news clip on Russia Today about very recent protests in Montreal, and who they had on mentioned, interestingly, how the protesters have lost their fear of the police. Maybe it’s nothing…
It’s Oh, Canada, after all (so far). 🙂
I expect the rate of change of population growth to begin an increasing deceleration as soon as the end of this decade to the early to mid-2020s, a peak in population in the 2020s, and decline beginning as soon as the 2030s from no more than ~8 billion.
I also expect the Gleissburg/Suess/de Vries solar cycle minimum convergence (lowest average number of sunspots in 200-210 years, along with reduced solar irradiation and solar wind) to coincide with mid-latitude cooling and mega-drought conditions (similar to conditions that caused an end to the Anasazi/Pueblo and Maya civilizations) for at least the next 20-30 years.
Peak Oil, cooling, mega-drought, falling ag and livestock production, and the resulting (failed) attempts at mass population migration, racial/ethnic/religious conflict and violence, genocide, war, failed states, and the last-man-standing contest between the West and China for the remaining resources on the planet will contribute cumulatively to conditions that will cause the human population to peak and decline in the next 10-20 years.
Let the good times roll…
(for Nick G)
” . . . if the illusion is real / let them give you a ride / if they got thunder appeal / let them be on your side”
🙂
Exactly.
In the previous post on POB, Ron put together a lot of (public) information about Ghawar (and other oil fields in Saudi Arabia).
What caught my attention a while back was the growth in drilling rigs in Saudi Arabia while output according to public sources remained constant.
A while back, I got an e-mail from someone closely monitoring the development of international oil supplies. There is a lot of explanations floating around trying to rationalize the Saudi policies ranging from protecting market share, to curtailing US tight oil.
The author of this e-mail raised an interesting question related to operations and depletion strategies (reservoir management), which could be of interest for readers/posters on POB and which may throw some different lights on Saudi policies and which are related to reservoir management.
It is well known, for those who has followed Saudi developments somewhat, that water flooding (and other EOR measures) has been widely used in Ghawar (and other Saudi fields).
What if
The Saudis have to maintain production through water injection as it may be difficult to cut much back without changing the whole drainage strategy (reservoir management) for their fields. And if they cut back, it could become challenging to restart the water injection dynamics and bring oil production back on planned trajectories.
There are likely readers of this list who are more experienced in the dynamics from water flooding than myself, that hopefully may throw some relevant light on the challenges of changing the flow dynamics for a field in its mature/late phase and how that may affect total recovery and thus the economics.
A good point Rune, but I really think Saudi could cut back a little if they really wanted to. After all they cut back a considerable amount after the crash in 2008.
I received this in my email box this morning. It is a 45 minute BBC video:
Saudi’s Secret Uprising
In Saudi Arabia’s oil-rich Eastern Province, protesters inspired by the Arab Spring have been venting their anger against the government for the last three years. Saudi journalist Safa Alahmad got unprecedented access to the area.
Thus the rapid, and I think unprecedented, Saudi military response to the Iranian backed Shiite rebel forces in Yemen (I believe that the unrest in Saudi Arabia’s Eastern province is where the highest percentage of Shiites are located). I think that Saudi Arabia is best described as “Metastable,” i.e., superficially stable, but inherently unstable.
Is it just me or is anyone else starting to think that there may be a lot more oil left in the ground than any peak oiler thought possible?
In my estimation, globally we have already, through 2013, burned through roughly one-fourth of post-2005 Global CNE (Cumulative Net Exports of oil), as the volume of net exports available to importers other than China & India fell from 41 mbpd in 2005 to 34 mbpd in 2013.
What does that mean, Jeffrey, and/or what are the implications?
Some “Net Export Facts of Life”
http://econbrowser.com/archives/2015/03/u-s-oil-supply-update#comment-189114
Thanks, Jeffrey, I will read it later, along with Javier’s article… Looks like I will have a lot of homework today.
Dear Jeffrey Brown
Peak Oil modeling has been centered on countries, for the most part. And sometimes, that is probably the right way to look at it…Saudi Aramco IS an arm of the Saudi royal family.
But there is another, and I think, equally valid, way of looking at the issues. When Exxon-Mobil and Rosneft drilled the well in the Arctic which found a lot of oil, that oil belongs to Exxon-Mobil and Rosneft. And one of the owners of Rosneft is BP. So what we really have is several corporations, one of which is partially owned by Russia, owning some oil.
Far away, a company in Cupertino, CA, has managed to become the most valuable corporation in the world, with money stashed all over the globe.
The question I pose: Do you think that Apple will be able to persuade those corporations to give them some of their oil? And the answer is, ‘Of course’. It really doesn’t matter that Cupertino doesn’t produce any oil, or that Apple doesn’t produce any oil.
I don’t think that the United States government, the government of California, or the government of Cupertino is really very important to Apple. Saying that Apple is an ‘American company’ is sort of true, but not very informative.
Similarly, I think that discussions about the oil in the Russian Arctic are mostly about corporations and markets and so forth, and only secondarily a question of whether the oil is found in Russian waters, or Alaskan waters, or Canadian waters, or Norwegian waters.
I assign a secondary importance to the country, but even that is probably a declining factor. If we can believe shortonoil’s graphs, the big bulge indicative of great wealth being produced by oil is now declining rapidly. If oil costs 120 dollars to produce (perhaps the oil well in the Russian arctic) and the oil sells for 120 dollars, there really is no net benefit. Russia would get something in taxes, but then they probably have to spend the tax receipts on infrastructure.
In terms of geopolitics, it seems that power might flow to countries which meet several conditions:
*The oil is produced by state controlled companies within their own territory
*The price at which the oil can be sold significantly exceeds the all-in cost of production
*The country’s elites deem it more important to divert some of the surplus into the country’s economy, rather than stash money around the world, as Apple is doing.
Don Stewart
Excerpt from my Econbroswer post:
Dear Jeffrey
All I’m saying is that country boundaries frequently have little explanatory power. Suppose Jobs and Wozniak had been born in Luxemburg (which doesn’t produce any oil). They started Apple 40 years ago, and it became the behemoth it has become. Would Luxemburg’s imports of oil have increased? Doubtless they would have. Would that be a bad thing? No, it’s just a reflection of the fact that the company has been successful, and people have been employed by the company and paid pretty well and can afford petroleum products. And all that doesn’t necessarily have very much to do with national policies in Luxemburg.
You use separate lines for China and India. Both import oil. Why has their ability to pay for imports strengthened relative to the OECD countries and to basket case countries such as Yemen and Syria? Probably it doesn’t have very much to do with national policies relative to oil. I can think of many different rationalizations, but I wouldn’t claim any of my rationalizations could the called a ‘theory’.
I’m not saying national policies are NEVER relevant. The US does, for example, have a policy against crude oil exports, but that has only become relevant due to the flood of light tight oil which needs admixtures of heavier oil. So the US policy is a gnat flying around annoying people, but the really important US policy has been easy money and lax securities and banking regulation.
My point is that oil is a global commodity and will seek its highest bidder, unless one has special circumstances such as heavily subsidized domestic production or generally lax or strict business regulation, etc.
I would just reiterate that it’s a lot about surplus value over cost of production. A country may have tons and tons of salt, but since it doesn’t have very much value, it doesn’t afford one much geopolitical clout. Oil may be losing its ability to afford geopolitical clout, not because of its abundance or scarcity, but because there will be a narrow margin between cost and price. If the price increases again above 100 dollars, then those who can afford to pay will squeeze out those who cannot afford to pay. It looks like Apple will get all the oil they need, regardless of how things go for the US as a whole. Probably businesses in Yemen won’t get any oil, unless the Saudis do them some favors.
Don Stewart
Don,
Perhaps you could furnish us with some examples of oil exporting countries, with meaningful levels of consumption*, showing long term production declines, where the rate of decline in net exports did not exceed the rate of decline in production?
In any case, I tend to get qualitative objections to a quantitative argument, but the following are mathematical facts, not subject to qualitative objections:
*Some smaller exporters have consumption which basically rounds to zero
Don and all, a point of trivia follows.
Regarding that company building the Mothership in Cupertino, CA, at the current market capitalization to US and world GDP, and at the trend rates of growth of market cap and GDP, that company’s market cap will reach 100% of US GDP by the mid-2020s and world GDP by some point in the 2030s.
Note that this is similar to the market cap trajectory of Cisco Systems (CSCO) during the Dotcom bubble in the 1990s.
Moreover, a similar log-periodic, super-exponential, blow-off trajectory has been underway for the biotech (“biobubbletech”) stocks since 2011-12.
The crash and mass consolidation of capacity, employment, debt to wages and GDP, equity values, and equity ownership of firms in the years ahead will rival, if not exceed in many sectors, the crashes in 1837-43, 1893-98, 1929-42, Japan in 1990-2009, and the US in 1973-75, 2000-02, and 2008-09.
Cheers.
Normalized liquids consumption for China, India, (2005) Top 33 net oil exporters and the US, with annual Brent crude oil prices shown in red, for 2002 to 2012 (same trends continued in 2013, when Brent averaged $109).
Link to full size chart:
http://i1095.photobucket.com/albums/i475/westexas/Slide14_zpsb2fe0f1a.jpg
The Ratio of Global Net Exports (GNE) to Chindia’s Net Imports (CNI) from 2002 to 2012. There were some revisions to prior years, but the decline in the ratio continued in 2013. There are about 155 net oil importing countries in the world. At a GNE/CNI Ratio of 1.0, China & India alone would theoretically consume 100% of GNE, which of course won’t happen, but that is where we were headed, up to and including 2013.
Link to full size chart:
http://i1095.photobucket.com/albums/i475/westexas/Slide20_zps26112103.jpg
Caelan MacIntyre says:
March 27, 2015 at 12:31 pm
“Is it just me or is anyone else starting to think that there may be a lot more oil left in the ground than any peak oiler thought possible?”
Jeffrey J. Brown says:
March 27, 2015 at 12:44 pm
“In my estimation, globally we have already, through 2013, burned through roughly one-fourth of post-2005 Global CNE (Cumulative Net Exports of oil), as the volume of net exports available to importers other than China & India fell from 41 mbpd in 2005 to 34 mbpd in 2013.”
Caelan MacIntyre says:
March 27, 2015 at 12:48 pm
“What does that mean, Jeffrey, and/or what are the implications?”
Jeffrey, you posted a lot of cryptic, techy stuff and charts and graphs to “answer” this question. But I don’t see how any of your posts actually answer Caelan’s simple, direct question.
Let’s try again.
“It seems like there may end up being a lot more oil left in the ground than any peak oiler thought possible.”
1) Agree
2) Disagree
Explain your answer. Thanks.
Caelan, this has been discussed over and over again.
It’s not how much oil is left; it’s how much we can actually get to and profitably extract and sell in a given amount of time; in other words, the flow.
So while it is important to continue to debate how much is remaining, it makes no difference at all to collapse dynamics. Once the flow declines, game over on the present system.
That’s what was meant: It is not how much oil is left, it’s whether it can even be accessed/produced amid increasing chaos (of various forms).
But also, once/if the dust settles, I seem to recall a ratcheting-down kind of effect whereby production never returns to previous levels. Is that correct?
With regard to your ‘game over on the present system’ phrase, what is your take on renewables, then, or even EV’s? IOW, how deep do you think this ‘game over’ reaches, and how soon?
I can see a circumstance in which the price goes up, this drives consumption down, but the price continues climbing because we have no quick additions to the production kit.
However, we could then move to massive deployment of temporary solutions, such as coal to liquids.
I see this as an unlikely scenario, but I wouldn’t toss it until it’s looked at carefully. It seems to me might as well use coal for other purposes, but I’ve never considered massive deployment of coal to liquids.
Ron,
Like with most things (and as you allude to) there may be a combination of reasons.
2008 is some years ago.
FWIIW,
The chart below shows Saudi Arabia’s C + C production as of October 2014 (EIA data) together with the oil price and total number of rigs (from Baker Hughes) per February 2015.
What caught my attention is the rapid growth in total number of rigs since mid 2013, while so far little response to C + C supplies.
It looks to me like they are desperately trying to keep production as high as it is. They don’t have any new fields so all those rigs are drilling their old existing fields. Their rig count jumped about 44 rigs since October 2013.
But I can’t figure them out. Why would they want to do all that infill drilling just to get what oil they have left out a lot quicker?
I am at a loss. I have no idea what their strategy is.
I would think that they want to corner the market to make sure that in the following decades they are still influential.
Just think about the alternative. They cut or let their production fall. They lose market share and income, American shale play remains alive and kicking and steals the show. Once after peak-oil Saudi Arabia becomes a third tier to Russia and US and are seeing as losing influence and power with the Iranians increasingly powerful.
If they manage to kill or seriously damage the shale, they have a chance to keep running the show based on their cheaper oil and American military support. I don’t think they care too much about the future when the oil runs out. They are probably planning to leave the country at that point.
That sounds about right Javier. Shale producers need to learn a “lesson”.
https://www.youtube.com/watch?v=BumrgKlhRBc
Ron & Rune,
Have you considered that Saudi Aramco may be sending out drilling rig crews just to drill dry holes as to keep the skilled laborforce happy? 🙂
Steve
Ron and all, SA’s demographic situation since the 1990s is such that they need to pump oil furiously at any price in order to fund the level of social services and real GDP per capita they have promised to their population.
With the crash in the price of oil (leveraged futures being deleveraged with global demand weakening and US shale producers levering up to unprofitably increase production), surging overpopulation of poor, alienated, and radicalized people at their borders increasing social and economic instability, and the recent death of their longstanding monarch, SA is at a particularly vulnerable domestic and regional geopolitical situation that could unravel and become irrecoverably destabilized AT ANY MOMENT.
In fact, the collapse in the price of oil will result in the Saudis running a deficit and being required to borrow, albeit at rather low global interest rates.
Still, SA is at risk of destabilization and even collapse during the post-Oil Age epoch, requiring the US and NATO to plan to invade and occupy the peninsula at some point to prevent Iran, China, and Russia from acting on designs on the oil fields of the peninsula, which goes all the way back to WW I and Britain’s occupation following the end of the Ottoman rule (and the real reason the western powers acquiesced to create a fascist-militarist garrison-state affectionately known as “The State of Israel” after WW II to prevent the Soviets from doing the same).
Still, SA is at risk of destabilization and even collapse during the post-Oil Age epoch, requiring the US and NATO to plan to invade and occupy the peninsula at some point to prevent Iran, China, and Russia from acting on designs on the oil fields of the peninsula,
You’re assuming that the price of oil will go down, destabilizing the country, but that there will still be enough oil there to justify Iran, China, and Russia invading SA?
@Boomer II: Yes, I suspect that demand destruction per capita in real terms will become persistent and globally destabilizing (which the Pentagon, SIS, MAD, NATO, and M__ad clearly do, too), resulting in a decline in consumption and oil production, along with global real GDP per capita and trade.
But this is what is implied by Peak Oil, population overshoot, demographics, climate change, and resource depletion per capita resulting from “Limits to Growth”.
But this is what is implied by Peak Oil, population overshoot, demographics, climate change, and resource depletion per capita resulting from “Limits to Growth”.
I haven’t disagreed with these concepts. Where I differ from some of the severe doomers is how I see it playing out.
I think the human population will decline until it reaches a sustainable level. That sustainable level probably will involve less per capita consumption. But so be it.
I don’t see humans disappearing entirely. And I don’t think all humans will suffer equally. I think some will do well enough to keep the species going.
Rather than thinking in terms of “collapse,” I think in terms of right-sizing the human population given the available resources. It’s likely to be traumatic, but I don’t think our species will disappear unless Earth becomes uninhabitable for most forms of life.
I suppose I just chalk it up to the social evolution of mankind. Life will change.
Agreed. Species extinction is an extreme expectation in, well, the extreme. 🙂
Still, I suspect that the way down to a sustainable human population will be “extremely” traumatic to nightmarish over the course of the 20-50 years for a growing plurality and eventually the majority of us and our progeny.
Already, the emerging mega-drought in California and the Southwest, should it persist as the climate cycle suggests it will, could eventually result in mass population out-migration that overwhelms the resources of the region to which the population migrates, e.g., PacNW.
There are simply too many of us human apes on this warm, wet, finite, spherical rock, and population growth, or limiting it, is among the last taboo subjects. Therefore, nothing will be done collectively until Nature does it for/to us collectively.
Just an idea, not backed by anything more than personal experience and observation.
The last thing one wants to do with a water flood project is to shut it down for more than a brief period of time. Once it is shut down for a few days or more, in our area, it likely will never come back to its previous oil production rate, at least not without drilling more injection wells. As the guys in the field say, “You will lose your push”. That is why the rural electric cooperative gets so many calls from those in the field asking when power will be restored after a storm.
This is why you will see most water floods in the US kept going until the money absolutely runs out. This is also a reason I think Russia has difficulty cutting production, assuming they have a lot of mature water flood production.
I also think this could be a reason why KSA and Kuwait do not want to cut, they really cannot shut in water flood operations without permanently stranding some reserves.
Again, my opinions are uneducated guesses and observations from a sandstone field discovered more than one hundred years ago that has been under water flood since WWII. Do not know how same applies in other areas, but would be very interested to hear from others with more knowledge and experience with water floods
I also think this could be a reason why KSA and Kuwait do not want to cut, they really cannot shut in water flood operations without permanently stranding some reserves.
Boom.
Boom goes the narrative of OPEC “choosing” to not cut back.
They have no choice.
Well, while it is a nice theory, would the be on water flood on the new large projects opened up in the past few years and if not, why could they not cut that instead of ghawar
All Saudi’s new projects started off with water injection.
Manifa Arabian Heavy Crude Project, Saudi Arabia
Also included in the project is the construction of four on and offshore pipeline networks and a water supply system. The water supply system will be used by Aramco to inject around 1.35 million barrels of acquifer water into the oil reservoir a day to maintain the required pressure for optimum crude oil production.
Saudi Aramco Khurais Mega Project, Khurais, Saudi Arabia
In 2009, the project added 1.2 million bpd of high-quality Arabian light crude to Saudi Arabia’s export capacity. The Khurais programme also increased the capacity of the Qurayyah seawater injection system by 4.5 million bpd of treated water for injection at the Khurais and South Ghawar fields in 2008. The total project cost is estimated to be about $10bn.
Khurais had almost no natural pressure whatsoever. That why it lay in mothballs for so many years. Finally they laid the pipeline and are now injecting almost 4 barrels of water into the field for every 1 barrel of oil they get back.
Ron, that field either cuts over 70 % water or the water injection rate isn’t as high as you stated.
The concept of keep the pressure up or lose eventual total reserves is quite credible.
The pores are there, the oil will migrate into them if you give it time and some of those may not be recoverable. Same sort of thing as the Strategic Petroleum Reserve. 100% recovery is not presumed for it. The oil can get into pores and stay there.
That’s the sense I get.
Watcher: The oil is usually found in pores in the rock. Dropping the pressure in a well managed field means the pressure drops below the bubble point of the fluids (the oil releases natural gas bubbles). The gas bubbles coalesce and form gas channels which allow the gas to move out of the reservoir. The oil viscosity increases as it releases gas, this in turns makes it harder to sweep with water.
Injection can be stopped for a while but it’s important to keep an eye on the pressure. The optimum point to waterflood a field is just above the bubble point. If a CO2 flood is feasible, it helps to do it as soon as possible to try to achieve miscibility.
Yes it really does fit nicely. The pieces of the puzzle are all coming together. BTW this was meant to be in reply to Watchers “Boom” comment.
Appreciate the comments, shallow sand (and MBP below), as it was one of the things I was curious about. I would also be interested in others’ opinions about this.
The Saudi fields are probably being flooded just above the bubble point. The typical approach would be to reduce the producing rate in producers, keep pumping water in injectors and monitor reservoir pressure. The pressure can be monitored by closing injectors.
It’s usually better to cut back in the newer or up dip wells making 100 % oil. Cutting back or shutting in wells equipped with ESPs which make water can pressure cycle the seals, this reduces pump life.
I don’t think the Saudis have a problem cutting back production. They have brand new developments.
Rune,
A very good point you bring up, which I had not thought of before for some reason. Almost everything that I work is either a waterflood or a CO2 flood. Most of the fields that I work are not infill drilled very much anymore, they have reached their densest spacing without major interference from offset wells which messes with the economics. They do 6-8% decline as long as economics are such that down wells can be fixed. I do work some fields that are heavily infill drilled to keep decline <3%, and if we stop infill drilling decline will steepen greatly and we will never get it back down to <3% no matter how hard we try. That might be their fear.
The same could be said for steamfloods. Once you build the steam bank up, if you stop injecting steam and lose the bank water encroachment happens almost immediately and you will never be able to recover the bypassed oil.
I also wonder if they fear dropping below bubble point in the Ghawar if they stop injecting. I have no idea what the bubble point or gas situation is with the Ghawar, but it was just a thought.
MBP they wouldn’t want to drop below the bubble point at this point in the field life. I’ve worked in fields with wide spacing and we always had to keep a close eye on pressure to make sure we kept it at the proper level (too high a pressure reduces recovery factor).
FWIIW,
The chart below shows Kuwaits’s C + C production as of October 2014 (EIA data) together with the oil price and total number of rigs (from Baker Hughes) per February 2015.
What caught my attention is the rapid growth in total number of rigs since late 2013, while so far little response to C + C supplies.
The same pattern is found for UAE.
Several posters (with real oil field experience!) have pointed to the importance of pressure support/maintenance and the importance of remaining above the bubble point in the reservoir.
WoW! Jav – You do realize that in all your claims wrt CO2 increase the opposite is happening right now. The Amazon rain forests are not up taking carbon and are in fact releasing it. Deserts are expanding all around the world. Rainfall where it does fall comes so heavy that it just runs off causing massive damage without replenishing watersheds.
CO2 uptake, as I am sure you know as a biologist, it totally reliant on other elements present. You can not simply add one element without adding others. You can say that nitrogen is beneficial to plant growth so more nitrogen is always good right? WRONG!
I think you might want to focus you analytical skills researching gravity. I think Newton was full of bologna.
Admittedly, when I read the credentials (no offense, Javier) the thought occurred as to when Ron might have a guest article by an autodidact, lumpenproletariat or holistic practitioner.
Caelan, with all due respect I don’t find Javier’s that out of line with mainstream (peak oil) thinking. You may disagree with some of his thoughts on climate change but his population predictions were quite reasonable though I thought them a bit overly optimistic.
No I was serious too! ‘u’
And I have yet to finish reading the entire article as well. Back soon!
Jef you sound like a sensationalist tabloid. Obviously if we cut trees they stop taking up CO2. Living in a semi-arid country I can tell you that deserts are not expanding, quite the opposite. Droughts have become less frequent that they used to be a few decades ago. Studies on the Sahel (South of Sahara) find little evidence of increased desertification, and in fact report increased vegetation as I already said. See also:
Eklundh, L. and Olssson, L. 2003. Vegetation index trends for the African Sahel 1982-1999. Geophysical Research Letters 30.
As far as I know the biggest exchange in CO2 was between atmosphere and the oceans and last time I checked they were still there.
I don’t really give a damn about what you think I should do.
I tried that link, it was blocked. I would be interested to see that. I lived in the Sahel in that timeframe, and at least locally it had gone from forest to sand in 2 generations
Possible more due to human influence, but then I thought that was part of the issue.
Try googling for the title and hitting the PDF result. It is pay-walled but that worked for me. If that doesn’t work we’ll think a way of getting it to you.
Man is a heavy desertizer. It is best to ask the satellites since they get the pict from large areas or the entire world.
“As far as I know the biggest exchange in CO2 was between atmosphere and the oceans and last time I checked they were still there.”
All that CO2 is making the ocean too acid for critters.
FRISCO — The steady increase of atmospheric carbon dioxide is already causing large-scale shifts in the ocean carbon cycle, according to University of Colorado, Boulder scientists, who calculated the calcification rate of marine organisms in the Southern Ocean.
According to the scientists there has been a 24 percent decline in the amount of calcium carbonate produced in large areas of the Southern Ocean over the past 17 years.
The study shows that a ubiquitous type of phytoplankton — tiny organisms that are the base of the marine food web — appears to be suffering from the effects of ocean acidification caused by climate change. The scientists used satellite measurements and statistical methods to calculate the calcification rate — the amount of calcium carbonate these organisms produced per day in surface ocean waters.
http://summitcountyvoice.com/2015/03/27/report-shows-growing-impacts-of-ocean-acidification/
Ocean acidification is an interesting issue. It’s pretty new stuff so we have to do a lot more research. I have not looked it up in depth, but at first sight it appears “strange” because of the amounts involved. The atmosphere carbon content is small compared to the ocean’s and the amount of calcium in the sea converts CO2 to carbonate at great rates, but who knows. It seems that the highest acidification is measured in the North East Pacific which is a big upswelling area, so perhaps the acidification comes from the bottom of the sea.
In any case nobody has seen that ocean acidification has to do with carrying capacity or temperature. We can always speculate, but as usual damage done by mankind to marine ecology is a problem several orders of magnitude more severe and more present.
Ocean ph from Eschenbach at
http://wattsupwiththat.com/2015/01/02/a-neutral-view-of-oceanic-ph/
http://portal.ransquawk.com/headlines/libyan-oil-output-is-believed-to-be-around-622-000-bpd-according-to-the-state-oil-firm-27-03-2015
Diesel!
The Baker Hughes Rig Count is out today. The decline in rig count slowed down considerably this week according to Baker Hughes. Total US rigs were down 21 and Canada down 20. Oil rigs were down 12 and gas rigs down 9.
They have North Dakota at 96, down 2. The NDIC has North Dakota at 97. Last Friday North Dakota had the rig count at 107.
Only 18 rigs drilling for oil in Canada. Wow
Does anybody know when was the last time this figure was so low?
http://finance.yahoo.com/news/how-american-frackers-plan-to-beat-opec-143601751.html
Such bizarre delusion.
Look at Magnum Hunter’s financials, plug in current oil and natural gas prices and then tell us if they are “winning the war” against OPEC.
Yes indeed, oil and gas producers in the United States are fully enjoying this opportunity to become, “leaner and meaner”. LOL.
The one bit of accuracy in the story is that US finance is apparently doubling down on shale, with banks continuing to lend, and with investors continuing to buy equity and debt, ignoring generally accepted lending practices, basic financial parameters and history.
What a perverse situation, where home mortgages are difficult to come by in the US, but public companies who are insolvent at current oil and natural gas prices can continue to issue stock, bonds and draw on revolvers to drill for more sub $50 oil and sub $3 natural gas.
We only know of one significant secondary, and it hasn’t found buyers yet.
Patience. It’s only March.
Watcher,
Did Whiting complete their deal? It was suppose to have been completed Friday, but I don’t see any mention when I search for it.
http://www.businesswire.com/news/home/20150327005942/en/Whiting-Petroleum-Corporation-Announces-Completion-Offering-Common#.VRYDQfyUc6A
It looks like the deal is done.
That’s the underwriter money. The underwriter has to place the shares. Don’t know the details but it’s not unusual in a secondary for there to be a refund if there are no buyers.
I’m more intrigued with the purpose of the money. To repay all of the amounts outstanding on its credit agreement. That smells like line of credit, not bonds, and apparently they had a billion or two of that.
They did say they did a private placement of unregistered bonds. That is not traceable. JPM aka Fed could have bought them.
It’s really not rocket science. They are doubling down, and they are doing it with shareholder equity and praying for a price jack. If it don’t come, some oil guys are going to lose their wives, spelled with a w.
That’s the underwriter money. The underwriter has to place the shares. Don’t know the details but it’s not unusual in a secondary for there to be a refund if there are no buyers.
Yes, I was wondering who would buy these. Back in the dotcom boom days underwriters would give their best clients the opportunity to buy stocks that were going to zoom up on the first day. But at other times, they would force clients to take bad stocks to make sure they sold.
On an overnight block deal I could see that being true, but I would be surprised if a marketed non ipo primary was taken at risk
though i would be interested if I am wrong
Watcher,
Thanks for the education, your stock market certainly works different to ours.
I see the share price took a tumble today. Down 3% to 50c above the offer price. The commentators, put it down to the Yemen effect. No mention of the cash raising having any effect. I am sure the market makers were working overtime to keep the price above the offer, until the cheques are signed/cashed.
The price on Monday should be a good indication of how they went selling over the weekend.
The timing for Whiting is very fine, with the end of the first quarter on Tuesday.
How Analysts Reacted To Whiting Petroleum Corp Equity Issue
shallow sand,
Let’s wait for 1Q results. I think we will see some very interesting numbers
AlexS. Have you been plugging numbers in like I have? It is brutal.
Heck, ours are brutal. Haven’t figured out why shale is exempt.
Looked up some first quarter EPS consensus estimates on Nasdaq website:
COP. .08
MRO. -.37
EOG .08
CLR. -.05
HES -.83
WLL. -.68
QEP. -.20
STO .34
OAS .33
MHR -.31
SM .63
SN -.44
APA -.66
APC -.44
PXD .12
PE .06
EGN .12
LGCY -.23
LINE -.17
BBEP .06
XOM .79
CVX .74
Refining helps the last two. Assume includes hedging gains.
Watcher, sometimes you make a very astute comment. This is one of those times. [My definition of “astute:” Some comment that I readily agree with. And, I like the word “bizarre.”]
Looking back at the automobile industry collapse of 2008/2009, I guess that everyone is now buying new cars that cost 50% of what they did in 2007. No? Really? What happened? They could not make auto workers work for minimum wage? Really? Why not? Look at all of the unemployed. Chrysler went bankrupt, and people went to the dealers and could not understand why they could not buy a Chrysler auto product for 10% of the sticker price [that is a comment on the US education system, which is another subject, that would require maybe 100 blogs like this to explain.]
I happened to see a CNET vid the other day about car tech.
Average age of a car presently on US roads: 11 years.
Anything younger than 1 or 2 years has a big touchscreen on the console doing, according to them, only one thing significant — the ability to upgrade engine software via flashdrive.
Beyond that, how can you blame subprime borrowers getting financed at nearly 0% and not making even those payments.
Clueless. You make a great point. I will bet that 60+% of the cost of drilling and completing an oil well in the Bakken is in the labor, when you include FICA, unemployment taxes, both federal and state, health insurance, retirement plans, worker’s compensation insurance (which can cost up to 50% of payroll), etc.
So the business plan to become leaner and meaner is to cut wages, benefits, etc. for a group of people who came to the region with the sole purpose of making a significant amount more in wages and benefits than they were at home? Wonder how well that will work in Karnes County, TX, Odessa, TX or Williston, ND?
Have a relative who went up to ND to work in the early 1980s boom on a drilling rig. When the bust hit, he did not stay up there searching for work at half of what he was getting before, he came home.
Denial is not a river in Egypt. US oil and gas is in big trouble if current prices remain long term. Wait a minute, looking at the 2014 10K’s, I would say it already is.
These guys may say this BS to MSM, but in private it is a different attitude all together. The banks shut them off, they are toast.
Or the typical US response, automate the process so there are few workers.
Strangely enough, as drilling operations have become more automated and computerized, the rig crew count has gone up. Most offshore rig built in the 70’s had accommodation for 100 or less. Over the years as these rigs have gone through refits, I would say all have had additional beds added. 120 to 130 beds are now the norm.
Most of these requirements have come about due to safety. An example, Where you had one Mud engineer, covering the 24 hour period, which was no problem when things were running ok, but if problems were encountered he would end up working silly hours, now we have two on board, doing 12 hour shifts.
Automated drill floors, still require the same drill crew, in fact quite often an extra hand, as there are two drillers chairs, but the maintenance crew, has gone from a mechanic and electrician, to 2 mech, 2 elec, and 2 ETs. There used to be a saying, it shouldn’t be on the drill floor unless you could fix it with a sledge hammer. These days the fix often requires a laptop?
Drilling automation has not been brought into the industry to save labour. I was brought in firstly for safety, keep the men out of the danger zones and secondly for control, gathering information and record keeping.
Where does renewable energy fit in this?
Out with the insignificant folks who choose to ignore a cities starving scenario and occupation troops taking their stash.
See my comments below to Nick G
Right now we are running the show on oil and FF. In the future who knows, but any transition looks problematic to say the least.
Javier,
In the body of the article you acknowledge that renewable energy may replace fossil fuels: “you can argue that we can greatly increase energy from renewable sources by that we do not have much of nonrenewable energy. That is true and I hope so, but also arguably remains to be demonstrated that renewables are able to self-replicate…
Now, you didn’t present any evidence that renewable energy is inadequate. Given the high E-ROI of wind and solar, and their scalability and affordability, that seems like a big omission. Still, that discussion was not unreasonable, especially given limitations of space.
But your conclusions flatly say: “The increase in carrying capacity of mankind is dependent on a steady increase in the use of oil and other fossil fuels “.
That’s not supported by the article at all.
Why this contradiction??
Because one thing is what we want to have and a very different one is what we do have. Globally the percentage of energy that we get from fossil fuels has not gotten down from about 85% in decades. As far as projections go, how can we think that we will have a transition made in time for when it is needed?
My conclusion is the real situation now and for quite a few years to come. I cannot put a different conclusion when the available evidence does not support it.
That’s a puzzling answer.
First, it doesn’t answer my question: the article says one thing, and the conclusions say something different. Why?
2nd, your article isn’t primarily about fossil fuels: it’s mostly about Peak Oil. Solving Peak Oil doesn’t require renewables: it mostly requires electrification of transportation – the power can come from any source.
3rd, you still haven’t presented any evidence for your argument just now. It implies that renewables haven’t grown “in decades”- but it isn’t a very specific argument: what period of time are you talking about? What area are you including: the US? Europe? The world? Are you suggesting that because hydro has declined in some areas, or that nuclear has plateaued, that this tells us something about their ability to grow? Finally, what data are you basing it on?
I don’t think you have to look far to see that wind and solar are growing fast, and have been for decades.
4th, your argument just now isn’t that there’s evidence that non-fossil fuel sources won’t work: it’s really an argument that we haven’t really tried very hard to transition away from fossil fuels yet, and that we may be running out of time. Right?
First I’d like to know that we are not having a language issue. I spent quite a lot of time polishing the English, but due to a technical problem the published version was not the final one and that could not be fixed.
What the body paragraph should actually say is:
There is absolutely no contradiction between that and “The increase in carrying capacity of mankind is dependent on a steady increase in the use of oil and other fossil fuels”
Let’s make sure we are not mixing things:
Carrying capacity depends:
1. On oil for direct food production (diesel for farm mechanization).
2. On oil and gas for feedstocks for food production (fertilisers, herbicides, pesticides).
3. On oil for food transportation and distribution.
4. On oil and energy for food packaging and processing.
5. On oil, gas, carbon, and energy for a working economy,
6. On energy for standards of living, heating, healthcare, jobs, etc.
The conclusion is therefore pretty straightforward. For an increase in carrying capacity you need to increase all those. This is the reality now and we cannot count on changing that before peak oil consequences catch up on us. So as conclusions go I think it is solid.
Now going back to the body of the article, I was answering possible arguments that for the future our extrasomatic energy could be provided from renewable sources and thus avoid serious overshooting due to a depletion of energy from fossil fuels. That is a big if and is reasonable to have serious concerns that a complex civilization like ours can be run on renewables or that such a transition can be made successfully on a world that is running out of a lot of things.
The article is written from a world perspective. Percentage of global energy coming from fossil fuels has not gone down since the late 80’s, about 25 years ago. Current evidence does not support a successful transition away from fossil fuels for many years. A forced transition is unlikely to become successful.
Really I can’t see what part you find controversial. All this has been argued to death here and at TOD. You may agree or disagree, but it is really standard stuff.
Graph from Euan Mearns IIRC
Javier,
Your reply didn’t really answer my questions.
Your arguments raise doubts, and questions of risk (“That is a big if and is reasonable to have serious concerns”, “we cannot count on changing that”), and then make strong statements for which you have no evidence. You suggest that there’s a lack of evidence that non-fossil fuel will work (which isn’t true, but that’s another point), and then say that indicates that non-fossil fuel won’t work (” as conclusions go I think it is solid.”). That doesn’t follow. The logic isn’t not solid.
TOD is not an accepted authority. Heck it’s a bunch of different people who don’t agree.
You don’t address EVs, which don’t need renewables to work.
You point to some important uses of oil, but none of those *require* oil. They can all be done with substitutes.
Finally, an analysis which looks at the growth rate of a mix of hydro, nuclear, wind and solar is not a rigorous analysis. It really tells us nothing, which your Original Post recognizes in the case of fossil fuel – it doesn’t treat FF as a lump, it looks at oil vs coal vs natural gas.
Even if wind and solar weren’t growing (which isn’t the case – they are growing fast) that wouldn’t tell us much: nuclear, for instance, could be made to work, but it’s just not competing well against wind & solar. But, because something wasn’t the most competitive solution wouldn’t mean it’s wasn’t workable.
Again, your argument really comes down to “it’s too late”, but provides no evidence for that argument. See my latest comment below…
Wind and solar can’t compete at this time due to the lack of cost effective energy storage. We could say “the ain’t got the battery”.
No matter how many times you repeat this, and still won’t be true.
Wind power is already affordable: if we assume $2/W (including transmission); 7% cost of funds; and 30 year life (average of components); and 30% capacity factor: we get $.061/kWh. That’s very affordable (it’s less than conventional US coal, with sulfur scrubbing etc., but not CO2 sequestration). Solar is at grid-parity in large areas of the world.
The variance of wind and solar isn’t nearly as hard to deal with as some opponents suggest: utilities have been dealing with such variance from *both* supply and demand since the birth of the industry. Again, every kind of generation has it’s variance: for instance, a 1GW nuclear plant can trip at a moment’s notice, and be out for days (or longer).
There’s a wide range of proven techniques for dealing with variance. Demand side management is very powerful and underutilized, geographic diversity will reduce variance, and we have lots of NG for balancing. In the very, very long run we can use DSM and storage for daily variation, combined with overbuilding and some modest backup from “windgas” and biomass for seasonal variation.
Your asumptions are wrong, because you don’t have a battery. Tell you what, I’ll scan a book review in Scientific American about the subject so you can read about it.
Don’t bother. I’m fully familiar with the literature.
There are many discussions about batteries and energy storage in grid storage, and they certainly have their place. On the other hand, we won’t need them on a large scale for quite a while, and they’ll never be the primary, optimal strategy. Raising them as a primary strategy right now is a distraction, a red herring.
Here’s a longer discussion of the issue:
Variance isn’t the same thing as unpredictability/unreliability. Wind output can be predicted to a large degree, which allows planning, and reduces or eliminates a need for spinning reserves.
As we add multiple windfarms, presumably with output either non-correlated or only partly correlated, the ratio of variance to mean output falls sharply. Also, many windfarms are negatively correlated, so that careful site selection reduces system variance.
Geographic balancing between parts of the grid only requires transmitting balancing amounts, not the whole load. A cost optimized grid will not have world-girdling, massive transmission lines.
Only a small % of a region’s wind power would need to be transferred between regions in order to provide balancing, and possibly not as far as one might think. Sometimes it’s just a matter of a number of sub-regions getting their power, on average, 100 miles from their west, rather than 100 miles from their east, and in effect you’ve transferred power from the western edge of the overall region to the eastern.
We really don’t need much more peak capacity – perhaps none at all for many years, with good time-of-day pricing and DSM. That renders most of this argument moot, at least as a boundary: we can use existing generation if we have to as a backup.
Wind farm peak capacity credits are a little like getting a dog to talk: the interesting thing isn’t how well the dog talks, but that it talks at all. The fact that even a small cluster of wind farms can have a 1/3 of average capacity credit, or wind at a regional level have an average 55% credit, is important.
I see local wind capacity credit as solving roughly 40% of the diurnal intermittency problem; long-distance transmission solving about 30%, and DSM solving the rest. DSM alone could make an enormous contribution: think 220M EV’s (with 2.2TW peak demand or output) doing a dance of load balancing with the grid. This doesn’t even touch the legacy peak capacity which could provide backup – this we’d want to minimize to minimize CO2 emissions, but that wouldn’t be hard with DSM as a short-term factor: we’d only need it for very unusual, long-term lulls.
Biomass would be enormously useful for grid stability. Biomass is an obvious, and workable, candidate for the job of providing backup for seasonal lulls in wind & solar production. OTOH, it’s not necessary.
Solutions for seasonal lulls in renewable production include overbuilding; production of hydrogen, ammonia, methane or other synthetic hydrocarbons with surplus electricity; compressed air storage; pumped storage; nuclear; overbuilt geothermal; etc, etc, etc.
There are a number of workable solutions to intermittency. Some are cheaper than others, some combinations are more optimal than others, but there are wide variety of ways to skin this cat.
——————————————————————————————————————
Once again, here’s an example of high grid penetration of wind power without batteries:
“forecasts are helping power companies deal with one of the biggest challenges of wind power: its intermittency. Using small amounts of wind power is no problem for utilities. They are accustomed to dealing with variability—after all, demand for electricity changes from season to season, even from minute to minute. However, a utility that wants to use a lot of wind power needs backup power to protect against a sudden loss of wind. These backup plants, which typically burn fossil fuels, are expensive and dirty. But with more accurate forecasts, utilities can cut the amount of power that needs to be held in reserve, minimizing their role.
Before the forecasts were developed, Xcel Energy, which supplies much of Colorado’s power, ran ads opposing a proposal that it use renewable sources for a modest 10 percent of its power. It mailed flyers to its customers claiming that such a mandate would increase electricity costs by as much as $1.5 billion over 20 years.
But thanks in large part to the improved forecasts, Xcel, one of the country’s largest utilities, has made an about-face.
It has installed more wind power than any other U.S. utility and supports a mandate for utilities to get 30 percent of their energy from renewable sources, saying it can easily handle much more than that.
..forecasts from NCAR are already having a big effect. Last year, on a windy weekend when power demand was low, Xcel set a record: during one hour, 60 percent of its electricity for Colorado was coming from the wind. “That kind of wind penetration would have given dispatchers a heart attack a few years ago,” says Drake Bartlett, who heads renewable-energy integration for Xcel. Back then, he notes, they wouldn’t have known whether they might suddenly lose all that power. “Now we’re taking it in stride,” he says. “And that record is going to fall.””
http://www.technologyreview.com/featuredstory/526541/smart-wind-and-solar-power/
Batteries not included.
Nick, I have a book which contradicts what you write. I started getting really worried when I read about the controversy the subject causes in Spain, then I read about the issue in several white papers (one of which is linked in my blog as German intermittency), and being an engineer really helps. What you discuss simply costs way too much.
This is really a pretty simple issue. Either the renewable technology delivers or it doesn’t when oil starts getting scarce. I’m afraid right now I don’t see doing even 30 % of what it will have to do. I presume all the talk about collapse is a confirmation that, thus far, we have too much population and no way out.
I also suggest you try to think about other nations. I usually think of Congo because it’s a very large, unstable country with a huge capital city (7 million and growing). Try that one on for size.
http://peakoilbarrel.com/the-problem-of-the-human-population/comment-page-1/#comment-508488
Hi Fernando,
Why do you keep saying that we don’t have a battery?
You do realize that Lead-Acid batteries have been used in off grid solar systems effectively for the past 50 years don’t you?
Lead-Acid batteries are cheap, easily recycled, and last a long time, as long as they’re used properly. The only real disadvantage for transportation use is their weight. But that’s not really a problem for Renewable electricity storage, is it?
https://share.pnmresources.com/Public/Pages/Project-Details–Specifics.aspx
John, they aren’t cheap enough. Try an experiment: use a country such as Mexico. Look up its energy demand, gradually cut its oil production to zero, allow some gas imports from the usa, burn coal, assume you build a couple of nuclear power plants, build say 7 % of the country’s energy demand using solar power, then fill in with wind. Work out how much storage they need, see if you can build hydro pumped power, and add it all up. I don’t think they can afford that storage.
I worked the numbers for the usa and I arrived at $74 trillion, I believe. On top of that there’s the cost for a super grid, building triple the peak in wind (because wind doesn’t work all the time), and filling in with nukes. The USA may be able to do it if the country leaves WTO and all the equipment is manufactured local.
But what woks for the USA, done under near war conditions, won’t work for ANY other nation, except for say Iceland which has geothermal and wind resource.
I realize this is a Motley Fool piece, but I link it to show what I think is an important aspect of this renewable energy issue. Integrated microgrids appear to be gaining importance. Fits in well with smaller scale distributed energy.
http://www.fool.com/investing/general/2015/03/29/solar-energy-has-a-silver-bullet-that-could-upend.aspx
Well Nick G I thought I was making myself clear.
For the last 25 years the world has depended basically on an 85% of its energy needs on FF and over 90% of its transport needs on oil.
This indicates that globally we are not seeing a significant energy transition.
As I have explained our carrying capacity is very dependent on oil and other FF, more than the average of our energy needs, so > 85%.
Peak oil is upon us. In a few years or decades we are going to have a lot less oil. Due to this we are most likely going to have economic problems.
An energy transition that globally has barely progressed in 25 years is unlikely to take place satisfactorily under conditions of harshness.
Right now, for reasons of EROEI, price, or other, there is no satisfactory fuel that can substitute oil for the deployed transport infrastructure.
EVs have captured an insignificant world light vehicle market share and given current oil prices that is unlikely to change significantly for some years. If our economic situation deteriorates, it is even less likely that deployed oil vehicles will be substituted by EVs since they are more expensive to buy.
When oil availability declines it is highly unlikely that we will have a substitute in place so we will suffer economically making it even less likely to transition successfully to an alternative.
One consequence will be a reduction in carrying capacity.
My mention of TOD was about me thinking that you must have heard all this many times before, so I don’t see much point in the discussion. If you believe that renewables are going to save the day, I respect that belief and although I hope it is true I don’t share it. It is pointless to argue about beliefs.
When oil availability declines it is highly unlikely that we will have a substitute in place so we will suffer economically making it even less likely to transition successfully to an alternative.
Well, there will be a substitute of sorts: doing without. People who don’t have cars will walk or ride bikes. The commercial airline industry will significantly decline because it will be too expensive for most people to fly. There will be more localization of food (the way it used to be).
Less than 100 years ago people didn’t drive much, didn’t fly, didn’t ship perishable food half way around the world, etc. It’s okay to live like that.
Of course the problem is we don’t exactly know how to live like that anymore. But I agree and even that it was better than ok to live like that. Much better than now. Now, we are living on draw-down, outside of reality & stealing from the future. It’s not ok to live like that.
But I agree and even that it was better than ok to live like that. Much better than now.
Yes. Much of the oil we have pumped out of the ground over the years has been been wasted and has facilitated excess. Having both of those disappear isn’t a bad thing.
“Doing without” is going to do wonders to our economy, Boomer II.
“Doing without” is going to do wonders to our economy, Boomer II.
Haven’t we established that the economy will go down the tubes anyway when the oil gets scarce?
Doing without makes the best of not having enough oil.
I was distinguishing between “doing without” voluntarily now, versus “doing without” forced by circumstances later. In the first case you kill your economy. In the second your economy dies. A lawyer or a politician will clearly see the difference and the politician would not do it voluntarily under any circumstance.
In the first case you kill your economy. In the second your economy dies. A lawyer or a politician will clearly see the difference and the politician would not do it voluntarily under any circumstance.
First of all, the “economy” and “growth” as currently factored is not necessarily the best measurement. Currently it doesn’t assign negative factors to environmental damage or poor health. Therefore an economy with less consumption and less traditional growth might well be a more sustainable economy.
Secondly, you are right that most politicians won’t advocate a no-growth policy. But that doesn’t mean it won’t evolve, probably by necessity.
It doesn’t really matter in the end whether the downsizing is voluntary or not, because most of the people here expect it to happen. Where we differ is whether it will happen chaotically and whether we will be happy with what we end up with. Some of us think a world less dependent on fossil fuels will ultimately be a better one, or at least a more sustainable one, or at the very least, one friendlier to the overall ecosystem.
I essentially agree. I do have a contention with the better world concept since better is a relative term that totally depends on the point of view. One has to define the point of view before constructive discussion can take place. Very few people consider the Dark Age to have been better than the Roman period it replaced. Yet it is clear that the Dark Age was more sustainable. That illustrates the problem of the point of view.
Oddly enough, you haven’t really addressed any of my objections. We seem to be at that point in an argument where people are just repeating themselves.
Sometimes it helps to provide specific numbers, details or sources – otherwise, it’s just “arm waving”.
Well, let’s try to deal with one thing at a time. Your basic argument seems to be: “If a transition hasn’t taken place already, it can’t take place in the future”.
So, let’s look at oil. It was around in the US from 1859 to 1910, but neither transportation nor agriculture had transitioned to oil. In fact, oil had a big niche in kerosene lighting in the 1800’s, but it was displaced by electric lighting by 1910.
So, should an observer in 1910 have concluded authoritatively that oil could never handle transportation or farming?? Should an observer in 1929 have concluded that the transition to oil would absolutely, definitely fail because of the Great Depression?
That’s probably because I can’t address them as they fall outside my area of expertise.
I am an expert in the particular areas of Biology related to my work. I am very knowledgeable in Biology and related disciplines, including Ecology. I have good knowledge (above 99% of the population) on climate change and Economy. I come here to learn about peak oil and to follow it.
There’s quite a lot of people here that know more than I do about oil, peak oil, and energy. It would be stupid on my part to try to teach them on that. But my article deals mainly with population and ecology.
If you are asking me those questions about energy transition and renewables because you want to learn, you are asking the wrong person. Post them and somebody will answer them.
If you are asking them because you know more than I do and want to teach me, please do. Post what you know and I will read and learn.
If you are asking them because you want to demonstrate that you know more than I do about that, there is no need. It is clear to all that oil and energy is not my area of expertise.
If you disagree with whole or part of the article that’s fine with me. An article is made of data and opinion. If you disagree with my opinion that’s fine. If you disagree with the data presented just bring your data and we will discuss it as others are doing.
I just don’t see how can you disagree with data that is not presented in the article. or sources that are not cited. Then you are disagreeing with a different article and I can’t help you with that.
Actually, that makes perfect sense to me.
I just don’t see how can you disagree with data that is not presented in the article
Well, that’s exactly what I was trying to say. Your conclusions at the end didn’t come from the article: they’re assumptions you’ve drawn from other material.
As it happens, I disagree with those assumptions. If you’d like to pursue that here, that’s fine with me. We can discuss the growth rate of wind & solar, or the likely timing of peak coal. If you want to start that conversation, it might make sense to start with a reply to my comment elsewhere about the timing of EVs.
But, I think maybe we can conclude this conversation with a suggestion: that you draw your conclusions from your article, and if you want to include some ideas from elsewhere, make it clear that these are risks that others have raised as a possibility. If you want to say that you find them plausible, that would make sense, but then it would be clear to the reader that they were not your conclusions.
Does that make sense?
I disagree with you on that, Nick. I base my conclusions on the current situation and they are quite prudent. I consider them valid now and probably for several years to come. Obviously if the situation changes a lot and in a few years we get a really huge amount of renewables deployed they might no longer be valid. But I don’t care that much about possible scenarios that might or might not happen.
First, as you said, this isn’t your field. You’re relying on other people’s expertise. So, such statements shouldn’t be presented as conclusions to *your* work.
2nd, you’re presenting a risk analysis, right? You’re saying that you feel that it’s unlikely that renewables can grow quickly enough once a “peak crisis” hits. If so, you should say that this is an estimate of risk, not a foregone conclusion.
3rd, if Peak Oil is your primary concern, then renewables aren’t really very relevant, are they? Renewables are a substitute for coal and natural gas, which show no signs of peaking right now or very soon. The current importance of wind and solar is for reducing CO2 emissions. But, that’s different from Peak Oil.
If we’re concerned about Peak Oil, then the more important thing is substitutes for oil for transportation, which are here and now, cheaper than ICE vehicles, and able to be ramped up very quickly.
Peak oil is upon us.
1. We won’t know that oil has peaked until several years after the peak, so you can’t state that as a fact right now. Peter Odell says oil won’t peak until 2035.
http://old.globalpublicmedia.com/kenneth_deffeyes_and_peter_r_odell_on_counterpoint
2. You are underestimating current renewable energy production, and future potential.
http://www.ren21.net/Portals/0/documents/Resources/GSR/2014/GSR2014_KeyFindings_low%20res.pdf
http://www.iea.org/newsroomandevents/pressreleases/2014/september/how-solar-energy-could-be-the-largest-source-of-electricity-by-mid-century.html
1. Current oil price situation is conductive to oil production reduction that is also known as peak oil. For the last years growth of global oil production has depended on growth of North American oil production. North American oil production is reacting to the current oil price crisis in ways that indicate that growth cannot be maintained beyond some months. I find Ron’s forecast of a peak-oil in 2014-2016 to be congruent with present data and therefore not a future unknown. Certification of peak oil will take years as certification of recession takes months. That doesn’t mean that we cannot know that we are entering recession months ahead of it being certifiable or that we cannot know that we are undergoing peak oil years ahead of it being certifiable.
2. I don’t care much about future potential as it has a ceteris paribus condition. Future potential depends on the economy functioning normally and no having hit any limit. If those and other conditions are not met future potential will not take place. To draw conclusions based on future potentials makes them highly unreliable.
North American oil production is reacting to the current oil price crisis in ways that indicate that growth cannot be maintained beyond some months.
Temporarily, while oil prices remain low. But, when prices rise again, N. American production has a pretty good chance of rising as it did before when prices were high. To say otherwise is just a guess. Possibly a reasonable guess, but still a guess. Anybody relying on such a guess should acknowledge that it is a guess.
Future potential depends on the economy functioning normally
How do you know? PO pessimists say that, but what’s the basis for this claim? We have evidence to the contrary: The transition to oil for transportation and farming continued through the Great Depression. The transition away from oil for power generation continued during the 1979-1981 deep recession.
In fact, all the evidence says that oil shocks cause temporary recessions, and that even a longterm decline in oil production would not cause a long-term economic decline: people and businesses would adjust, and spend their money on other investments and forms of transportation and energy.
Actually the number for fossil fuels globally is about 10 points lower than that, and declining.
http://www.ren21.net/Portals/0/documents/Resources/GSR/2014/GSR2014_KeyFindings_low%20res.pdf
I rather trust the BP statistical review data
2013 BP
32.9% oil
30.1% coal
23.7% gas
86.7% FF
6.7% Hydro
4.4% Nuclear
2.7% Renewables
http://www.bp.com/content/dam/bp/pdf/Energy-economics/statistical-review-2014/BP-statistical-review-of-world-energy-2014-full-report.pdf
Looks like BP data is not that accurate.
From your link, US data for 2013 is as follows:
Renewables – 5.3%
Nuclear – 8.2%
Fossil Fuels – 86.0%
However, EIA data for the same period has more than double BP’s number for renewables:
Renewables – 11.4%
Nuclear – 11.0%
Fossil Fuels – 78.5%
http://www.eia.gov/totalenergy/data/monthly/pdf/mer.pdf
I suspect BP is leaving out renewables that are not easy to count.
E.g. solar water heaters, off grid solar, traditional biomass, etc.
Also, a common argument for fossil fuel proponents is that renewables only provide a very small percentage of total energy production. And therefore, do not have the potential to replace fossil fuels.
So BP may have some incentive to deliberately undercount renewables.
That’s a 225 page report. Would you kindly list the page number you want us to see? I could not find a comparable figure.
Page 13 of the .pdf. The numbers are listed in Quadrillion BTUs, so you’ll have to do a little math to get the percentages.
BNSF weekly carload report
Petroleum total carloads at 10,810 – up ~2400 from week 10, up 150 from week 11 of 2014.
Coal carloads at 45,089, up approximately 1700 from week 11 of 2014.
What was it a month ago?
10,125
BNSF week of 2/28/2015
BNSF archives
I did this article 5 years ago which needs updating:
9/4/2010
Australian Population Scenarios in the context of oil decline and global
warming
http://crudeoilpeak.info/australian-population-scenarios-in-the-context-of-oil-decline-and-global-warming
We have to look at the geo-politics of population growth in some critical countries:
6/7/2013
Egypt’s future crude oil import requirements for 3 population scenarios
http://crudeoilpeak.info/egypts-future-crude-oil-import-requirements-for-3-population-scenarios
It is a nice and well researched article on Australian population, Matt, but it does go to show the difficulties of predicting, specially when setting dates.
One that gets delayed several years. We have cheap oil instead.
I am sure however the all the population trends are proceeding along as expected in the BAU scenarios. Population trends change very slowly.
The climate change predictions are by far the wildests
It seems we are getting a record instead.
Nope. Not increasing warming, just same old pause. And a solar minimum is not the period between two solar cycles. Apparently we are still working our way towards a future possible solar minimum.
The only strongly apparent thing is that Hansen was a joke. He, Al Gore and Pachauri. What a trio. What was the name? The three stooges?
That is complete bonkers and goes to show how many nutcases are making a living out of climatology. You will do better checking how much has sea level raised in the last 25 years and extrapolate. If you are feeling rather adventurous you could increase that estimate by 50%.
I said it needs updating. The date 2015 was without US shale oil and the year has not ended yet.
29/3/2015
The battle for the Middle East’s future begins in Yemen as Saudi Arabia
jumps into the abyss
http://www.independent.co.uk/news/world/middle-east/the-battle-for-the-middle-easts-future-begins-in-yemen-as-saudi-arabia-jumps-into-the-abyss-10140145.html
In any case, the problem has been delayed by just a couple of years.
Cheap oil is explained in the following articles (which I have already posted on this blog)
2/2/2015
Peak affordable oil
http://crudeoilpeak.info/peak-affordable-oil
15/2/2015
Free oil! Next stop free oil crunch
http://crudeoilpeak.info/free-oil-next-stop-free-oil-crunch
In relation to climate change the terms like “joke”, “stooges”, “bonkers” and “nutcases” are not helpful. Why don’t you start your own website with your calculations on Arctic sea ice and the energy balance of planet Earth as a function of CO2?
You are right I shouldn’t use those terms. I got carried away because 40 years of failed climate change predictions are not deterring some supposedly experts from making even wilder (and apocalyptic) predictions.
I don’t need to make those calculations. They are being made by experts and I trust them more than I would trust my own calculations. The problem is not with the data but with the interpretation of the data, as always. Data is being interpreted/modelled in ways that lead to failed predictions indicative of poor understanding of the system function. We ought to interpret the data in different ways that are more conductive to solid conclusions. Alternative hypothesis should be given serious consideration, specially since some have shown better predictive capability (e.g. 60-year period North Atlantic oscillation).
40 years of failed climate change predictions are not deterring some supposedly experts from making even wilder (and apocalyptic) predictions.
Javier,
I have to ask: have you done a similar analysis of the accuracy of Peak Oil forecasts, either historically, or over the last 10 years?? If you look at the PO forecasts on TOD, I think you’ll find that the language you use above applies equally to them.
Now, you can argue that PO predictions were wrong in the past but they’ll be right *eventually*. But don’t you want to apply the same standards to both areas??
If it weren’t for Rudolf Diesel’s peanut oil fueled engine, we’d all be standing out in a field somewhere scratching the surface to eek out an existence.
Thank Rudolf Diesel for your daily bread and beer.
If it wasn’t for Haber Bosch N2 fixation many of us would not exist to drink beer. “It is estimated that half of the protein within human beings is made of nitrogen that was originally fixed by this process.” And with peak beer we all would be screwed. http://en.wikipedia.org/wiki/Haber_process
Bingo!
We have a winner.
We turned oil into people.
Can anyone see a problem?
It’s Peak Beer everyday, been that way for years, centuries, long before Haber and Bosch. It’ll be Peak Beer long after Peak Oil.
If you grow a crop of pinto beans one year, the next year you can grow a crop of barley and not use any anhydrous, you’ll get a bumper crop.
The pinto bean crop fixes nitrogen into the soil. If you have a field of alfalfa, there’ll be plenty of nitrogen for other plants growing with the alfalfa, the grasses will flourish too. You’ll be able to make hay when the sun shines. All you’ll need is light, the right temperature, and enough water, the field of hay will grow.
When you spread manures out onto the fields, it is making the soil like it is new again.
C3 plants, the stomata close, photosynthesis stops. C4 plants, photosynthesis all of the time. C4 plants, the grasses, maize, sugarcane.
Explained better here.
There’ll be steam powered tractors using coal or coal liquids powering tractors with Diesel engines or biofuels can manage to power tractors if given the chance. Those engines are not going to stop once the oil is gone. Farmers will be able to grow fuel to run an operation, it’s just the transportation problem and if the elevator is only twenty miles away on a railroad siding, it’ll be little problem to be able to continue modern farming with fuels to power Diesel engines. Diesel engines do not have to have fuel refined from oil, Diesel engines are part of the solution, not a problem at all.
Biofuels, the use of, will be a carbon neutral input, they’ll pull double duty.
Coal will come to the rescue, it can and it will.
Railroads can have new steam engines manufactured and they’ll be good to go. Won’t need any diesel fuel refined from oil.
The beer will get there.
Any thoughts about this? Because of the potential for damage, I have hoped new Arctic drilling won’t happen or at least will be put off until we get desperate.
Are the economics such that this is likely to happen soon?
Oil council: Shale won’t last, Arctic drilling needed now: “There will come a time when all the resources that are supplying the world’s economies today are going to go in decline,” said Rex Tillerson, CEO of Exxon Mobil and chairman of the study’s committee, in an interview with the Associated Press. “This is will be what’s needed next. If we start today it’ll take 20, 30, 40 years for those to come on.”
If that is plan C, we are screwed.
I was working on an Offshore Arctic project in 1991-1994. Later I switched to onshore Arctic and offshore oil terminal construction, because we felt the offshore was too hairy to allow oil production. But I can see a little bit of oil coming from Arctic waters, say 1-2 million BOPD if oil prices go up to $120 and stay there. It’s not that significant.
LOL
We will need some stickier tape.
You don’t think oil prices will stay above 120?
Unless there are some kinds of ‘give’ in the global economy as a whole, no.
The problem seems to be related to ‘the parable of the tribes’, but I am unsure… I mean, if ‘give’ means measures to use less oil, who does it first? US? China? India? But doesn’t more of that resource equate to more power? So who gives up this power first, and how?
Hi Caelan,
There is the possibility that when peak oil is clear to all there will be a race to see who can reduce their oil dependence most quickly by expanding public transport, rail, light rail, EVs, better urban design, etc. So demand for oil could in principle decline more rapidly than supply.
This overly optimistic scenario (in my opinion) could lead to a decline in oil prices due to lack of demand and a lot of oil might be left in the ground because it is not needed or cannot be produced profitably at the lower price levels.
A more realistic scenario is that the transition to alternatives to fossil fuels for transportation takes place slowly so that oil prices stay high, it is quite possible that oil prices will become so high it will lead to an economic depression by 2030, collapse is a possibility, but that depends more on a demographic transition and population levels. Hard to say when or if collapse will come in my view.
Hi Dennis,
If the economy’s energy shrinks even if renewables take off, and growth slows or reverses, how does government pay for things like pensions and various social programmes, etc.? Does government rely on a growing economy? As jobs thin out, such as to save energy and become more efficient, does government thin out for similar reasons, and/or from a thinning out tax-base? Looking at this from a systems perspective, such as if it were the climate, what do you think might be some feedback mechanisms/delayed responses/critical thresholds?
The economy is a vast ‘hierarchical/neo-feudal’ machine that runs predominantly on oil (and other assorted plunders and pillages). There seem in need of a lot of retrofits to get it to run more on other energy source forms– retrofits in the wake of a shrinking economy, and that, ultimately, won’t fit the bill anyway.
Is government thinning out yet? How about CEO’s salaries? Land-grabs? Power structures? Foreign policy/activity? Social unrest?
Hi Caelan,
The government can spend more to get the economy moving through deficit spending, this is essentially how the US (and World) got out of the Great depression, through deficit spending.
The fact that most economists have forgotten the lessons that John Maynard Keynes taught us in 1936 with his General Theory of Employment, Interest, and Money dos not make this less true.
Milton Friedman argued that monetary policy alone could take care of recessions and depressions, but recent history has disproved that in the US where too weak a fiscal stimulus did not improve the economy at first and very expansionary monetary policy had very little traction.
There is a lot of room to increase government deficit spending in the face of a crisis, currently US debt to GDP is about 100%, Japan has been above this level since 1998 and is now at 220% debt to GDP.
So in the face of peak oil and an economic crisis, the US govt (or governments in general) put tax and spending policies in place to encourage rail, light rail, better urban design, wind, solar, nuclear, water efficiency, better agricultural practices, and other ideas (research maybe).
No doubt this would not go smoothly and perhaps would not work at all, hard to say for sure economics is more uncertain than climate change.
It just requires a little bit more efficiency and a smarter use of plastics. For example they could stop wrapping a single USB cable in 2 kg of plastic. Women can wear miniskirts and men wear tight pants. Or something like that.
Hi Fernando,
We are hoping to keep population down! 🙂
Dennis,
I fervently oppose that population control is done through abstinence. XD
Hi Javier,
I agree, so I suppose the tight pants and miniskirts won’t matter as long as modern birth control is widely available. 🙂
The ability to observe actual reality of our conditions is somewhat disturbing.
It makes the existential problem even more problematic .
!! Beware: Fracking Is Where Money Goes to Die !!
“the greatest credit bubble in history ”
http://dailyreckoning.com/beware-fracking-is-where-money-goes-to-die/
” And it doesn’t matter to Wall Street what happens to leverage loans after they’ve been repackaged into highly rated Collateralized Loan Obligations (CLOs) that are then sold to others. CLOs are hot.
What matters are the fees.
But the oil bust tripped the banks up, and some of them have gotten stuck with their formerly hot leveraged loans that suddenly no one wants. Banks have been discounting them, and still, they’re having trouble unloading them.”
Guess we hear about this on CNN/Fox/CNBC when it’s too late..
Yellen’s Q&A today was philosophically revealing. There Shalt Be No Deflation. It is verboten.
And thus, defaults are verboten. Defaults shrink money amounts in existence, aka deflation. So . . . they won’t be allowed. Just like your CDOs. Don’t mark them to market and they don’t default.
Maybe instead share issuance will be done, and find a buyer, of unregistered shares in private placement to Fed proxies. And maybe later they will be found not to exist and were an accounting error, restoring the dilution. Why would the Fed care? Mission accomplished.
So . . . too many people involved to keep that secret. Hmm, rather than focus effort on some other mechanism of survival, perhaps focus effort on reducing the number of aware people (before the fact, not via murder after the fact).
It’s not a zero credible scenario. All you have to do is be sure the people aware of it all gain from the arrangement. They would have no reason to talk.
Nah, too many know the secret. Some flunky at the Fed would talk. It is much more likely that the players are all betting the farm on price rise to $100. Because what? Because there is utterly no other low or medium risk path to wealth, and even that high risk path is denied them if they fold.
There IS something . . . drainage of a different sort. If you keep the wheels turning and the LLC running, you can do capital distributions, especially if you pay off covenant heavy instruments and leave yourself with debt instruments that do not inhibit massive dividends. Basically get the money out before you fold.
Seriously, how can we not see what is happening?
My primary concern is seeing idiots encouraged to conduct BAU.
As I have said, my main reason for being here is to learn more about the economics of fracking because I live in an area that I don’t want to be torn up by fly-by-night companies.
At least with the dotcom crash, investors took their lumps. There were no bailouts.
The fracking/bank/underwriter situation looks like it could turn ugly.
Boomer. Up post Watcher linked a story Yahoo featured big time today about how US shale companies are going to defeat OPEC. The person quoted is the CEO of Magnum Hunter, named Gary Evans. He said something to the effect that, “We made a lot of money at $100 oil and we will make a lot at $50 oil.”. Read the link if you have not.
Until this evening, I knew very little about this company. I spent a little time reviewing the company’s SEC 10K tonight. I encourage all to read it too.
The author of the Yahoo story needs to explain who put him or her up to this story, and why such a story was written with a centerpiece such as Magnum Hunter.
Magnum Hunter has lost money every year from 2010 to 2014. The have a net operating loss carry forward of over $700 million. Their PV10 all categories is about $900 million, which is based on 2014 average pricing, so rest assured they are lucky if it is half that under current pricing. Despite this, they have debt of over $1 billion. They had cash on hand at year end of $53 million.
The 10K states they violated loan covenants effective year end, but that those violations were waived by the lenders and then modified. I wonder why the lenders waived them?
It appears also the SEC has an action pending against the company surrounding the late filing of a previous year 10K as well as the circumstances surrounding the company changing auditors. There are also other lawsuits pending against the company that seem out of the ordinary.
To top it off, Magnum Hunter is primarily a natural gas company trying to make a go of it in the Marcellus and Utica. Only about 20% of year end PV10 is oil, and it appears most of the oil is non-operated working interest in ND Bakken. It appears they are operator on only 7 wells in ND. To be fair, the company sold out of a lot of its oil interests, so they used to be more oil weighted. Still, strange we are quoting a guy who runs a company that primarily produces gas, attacking OPEC.
On a final note, per Yahoo Finance, despite 5 straight years of losses, Mr. Evans was paid a salary of over $1 million in 2014, and other senior management was paid in the half a million range each. The company has a current market cap of about half a billion, the share price currently is about $2.50, and since 2006 has traded as low as .20 per share.
No wonder KSA oil officials take this stuff personally. You have a guy running a gas company in this shape attacking OPEC for merely keeping output steady, and our national media picks it up and runs it as a major story.
Come to think of it, I think I heard Mr. Evans on CNBC not too long ago. Something really fishy going on here. The idea that shale companies can survive these prices despite the obvious facts in their 10K is being pushed way to hard, and this story takes the cake.
Watcher, I’m trying not to be a conspiracy theory guy, but this one makes it tough.
It’s only March. Patience. Be vigilant for some obscure SEC announcement next week on how a change to scheduling of reserves valuation can take place that excuses companies for another quarter or so.
Why would a bank force them into a bankruptcy, rather than just waive some covenants? If the pv10 was correct at $900 million, then the debt of $1 billion could be paid back with interest of 5% rather than 10% if prices go back to where they were. If you get a forced sale now, at these crummy prices, you will get no interest and lose over half the principal. I think that they believe that the higher prices will return. When people missed mortgage payments, why did the banks let them stay in the house? Better to try to preserve the value. PS: The average American has been attacking KSA/OPEC since the 1970’s. I doubt that they notice this crap.
PS: The average American has been attacking KSA/OPEC since the 1970’s. I doubt that they notice this crap.
That’s a legit point. That guy is beneath their notice.
As for moderate terms so they survive, the collateral is the oil underground. Wiping out the company still leaves you with the collateral. If the price rises, you get pricier oil lease holdings to sell to someone before the lease/production clock expires.
Moderating terms does your own bank shareholders no good if the price doesn’t go up because the borrower is going under anyway, so this should not be a bank strategy. Take the collateral and boot those guys.
It all smells like PR crap.
Clueless. Good points. I assume as long as they do not miss interest payments no bank action will be taken. 10K also says bank requires them to comply by end of second quarter, I think. Doubt that is possible.
I also agree that this one story affects nothing KSA does. But I am pretty sure they are following the shale situation pretty closely. I bet they are happy to see insolvent US companies continue to drill uneconomic wells.
I don’t get what these Magnum Hunter guys are doing: According to their p+l, their expenses were nearly twice their revenues in 2012, 2013 and 2014. And even taking out reserves writedowns and other amortizations, they were still bleeding red ink every year. What kind of business model is that?
“What kind of business model is that?”
A pretty good one, according to the quote above:
“On a final note, per Yahoo Finance, despite 5 straight years of losses, Mr. Evans was paid a salary of over $1 million in 2014, and other senior management was paid in the half a million range each.”
That’s what all this is about.
Thanks Ron for all your hard work. I have a few questions..
1. with so many rigs down how are they keeping production up so much.. and does that mean when the price goes up again and they start adding these rigs back that production is going to sky rocket.It just seems like there is something rotten in Denmark.
2, Has anybody figured out how much each Country uses to sustain itself before it exports any of there product. what I am getting at here is what are we going to do when the oil producing countries stop production at just what they need and no longer produce any extra for export. Isn’t this what we should be watching for? I know the world produces about 90 million barrels a day, if you take out of that what each country uses domestically how much of the 90 million is left. Sorry if this is a stupid question Im a newbee so be easy on me..
In case Ron is busy:
1) There is a backlog of drilled holes not yet fracked. Fracking takes much longer than drilling. So you can sit drill rigs down and not cause frackers a problem . . . assuming they are going to frack. And so, in general, the rig count isn’t going to affect production until the backlog is exhausted. Worse, some of that backlog may not be fracked because the money isn’t flowing to fund the expensive fracking step. So even more so, the rig count isn’t all that compelling for quite a while. It’s an indicator of things, not a direct correlator.
2) Almost all production numbers you’re seeing are months old or extrapolations and not real numbers. The newest real number was from the Bakken a few weeks ago and it was reporting January production (which was down about 38K bpd). That number has not been incorporated into the EIA extrapolations yet.
3) All oil is not created equal. 90 mbpd is not oil. And you can find country consumption recorded various places. The countries of significance in that regard are Saudi Arabia, Canada and Russia. They all extract a lot more from the ground than they burn. And yes, when they decide they have enough printed pieces of paper and are better off keeping oil for their grandchildren, the wars start.
Pocapm, Watcher pretty welled nailed it but I think he got one thing wrong. It does not take longer to frack a well than to drill it. A well can be fracked in a few days. However it cost more to frack a well than to drill it. Lynn Helms said it cost 4 million dollars to drill a well and 5 million dollars to frack a well. Nevertheless, in January there were still more wells being drilled than fracked. From the March Director’s Cut
Dec rig count 181
Jan rig count 160
Feb rig count 133
Today’s rig count is 111 (lowest since April 2010)(all-time high was 218 on 5/29/2012)
At the end of January there were an estimated 825 wells waiting on completion services,
an increase of 75. Comparing December completions and production increase to January
completions and production decrease results in a requirement of 115 completions per
month to maintain 1.2 million barrels per day.
North Dakota production was down 37,000 barrels per day in January as a result of so few wells being fracked.
So your question was: 1. with so many rigs down how are they keeping production up so much?
The answer is… They ain’t. Production is down. According to the EIA’s Monthly Energy Report US production was down 34,000 barrels per day in January. I believe it will be down even more when the final numbers come in. And no numbers are really in for February except those that the EIA estimates in their Weekly Petroleum Status Report. Those numbers are off by a country mile.
As to your second question, each exporting nation is different. Jeffrey Brown has been working on that problem for several years now with his Export Land Model. But you can find the numbers for each country at the Energy Export Databrowser An example below.
Ron:
June is the month that is expected to show an increase in production since the extraction tax will not be collected due to the price of oil lower than 55 dollars, maybe fifty cents more.
The wells will be frac’ed some time in the future for sure. Have to complete the wells, mandated. Banks may be forced to loan money for completion.
Surge of oil production possible:
http://blogs.platts.com/2015/03/20/tax-time-bakken-oil-summer/
“This is mainly due to a backlog of between 800 to 1,000 uncompleted wells statewide, about 125 of which need to be completed by the end of June in order to comply with state requirements to complete drilling within a year.”
The drop in Argentina’s oil production coincides with Nestor Kirchner’s election for president in early 2003. The man was a leftist/populist and introduced their typical economic policies. He was replaced by his wife, who is worse. They also killed the meat industry.
I was just Fly Fishing down in Argentina.
Large country with a small well educated population, politically literate, massive water and ag land, resource rich, beautiful women, good food and wine.
This has not gone unnoticed by the Global Elite.
It is geographically isolated also.
In the big picture, Argentina would be way down the list.
cytochrome, I spent time as a Ph.D. student in eCONomics in South America, practicing my Spanish, and working as a recipient of the largess of the rentier-financier Power Elite’s Rockefeller-Rothschild banksters’ int’l syndicate as an “economic hit man” thereafter. The situation is working out just as planned, even better in some respects.
If it were known by Argentines who now owns claims on most of their natural resources, including water, timber, arable land, and fossil fuels, they would turn the country upside down and banish western banksters, western supranational firms, and shoot Americans, Dutch, Brits, French, Milanese, and Chinese on sight.
My, that’s a violent outlook.
The crony-capitalist plutarchy is violence-based, so no surprise there.
Most know that.
The IMF will not be back soon.
I have a advanced degree in Third World Politics (Africa nd Latin America), and find your analysis spot on.
Hi Ron,
34 kb/d is a very small decrease. If we round to 2 digits we have Dec 9.2 Mb/d and Jan 9.2 Mb/d and Feb 9.3 Mb/d, the February number will probably be revised, but I think the Jan number will remain 9.2 Mb/d. The 34 kb/d decrease is about 0.4%, pretty much a rounding error, output was basically flat from Dec 2014 to Jan 2015.
Dennis, the 34 kb/d is just an estimate. I believe the decrease will actually be greater than that. However you are trying to make any decrease insignificant by lumping three months together. Hell, while you are lumping, just lump in all of 2014 and you get a huge gain in January.
The fact is Dennis, the average monthly increase in 2014 was 114 kb/d. A decrease of 34 kb/d was a decrease of 148,000 barrels per day from the average of 2014.
But all this is arguing over nothing. I am saying that this decrease in price is already having a significant impact on production. All those news articles that say US production continues to surge in spite of the dramatic drop in price and in spite of the dramatic cut in drilling rigs are simply wrong.
As best as I can make out from your post is you are implying that this is not the case. If that is the point you are trying to express then please explain why you think this is the case.
Hi Ron,
I am saying 34 kb/d is not a big decrease. I am comparing output in Dec to Output in Jan, when we round to two significant digits (because the data is usually not that accurate anyway) we get 9200 kb/d for Dec and 9200 kb/d for Jan. I agree output is not increasing, my point is that the decrease in output is small enough to ignore.
Output may continue to decrease, but the preliminary estimate is a slight increase in Feb, I agree this may be revised down, maybe to continued flat output at 9200 kb/d.
Ron, just read story that on 3/26/15 XTO had a hearing before NDIC seeking an exemption from flaring rules on 140 of its wells. Story says XTO reduced production in February and March to come into compliance plus has slowed completion of wells for this purpose. Story doesn’t say by how much production was reduced. Apparently cannot get a pipeline easement over some Federal and/or tribal lands.
Shallow ,
Here is a link,
http://bismarcktribune.com/news/oil-company-requests-to-flare-wells/article_2d91a457-0f21-599f-b978-9385d9d29fc3.html
The request was heard Thursday by the Oil and Gas Division and will be forwarded to the State Industrial Commission for action. Earlier this week, the three-man board more clearly defined gas-capture rules, imposing penalties for noncompliance and establishing flexibility to cover extenuating circumstances.
The pipeline would have moved 40 million cubic feet per day to the company’s Garden Creek gas plant in McKenzie County, according to OneOK.
The gas company expects the situation to continue until late 2016 when a proposed Bear Creek gas-processing plant in Dunn County goes into service. XTO wants the exception until then.
snip
As of January, XTO was flaring 38 percent of its gas and selling the rest to OneOK and other gas plants, according to company paperwork. That’s 15 percent more gas flared than permitted by the state.
The company reduced oil and gas production in February and March to reach compliance, according to XTO, which maintains it is also deferring bringing new wells on line and deploying gas-capture units.
edit: I left out a very important line.
Jan Swenson, executive director of the Badlands Conservation Alliance, said her group opposes XTO exceptions for any of the wells drilled or permitted starting in 2014, when the company would have known the proposed pipeline expansion was in trouble.
So it appears XTO has continued to drill flat out with no real plan to use or capture the natural gas since the new regulations came into effect.
I wonder if a smaller company would go so far down a blind ally, and expect the regulatory authorities to give exemption due to their bad planning?
If they exempt XTO, the precedent will have been set for everybody else to jump in the queue!
North Dakota’s regulatory authorities are disgraceful. They shouldn’t allow flaring beyond say 1 %. Any flaring beyond that fraction should be subject to fines.
Hi Fernando,
I disagree with your views on climate change, so I find it ironic reading your posts that If we all followed your common sense frugality, climate change would be less of a problem than it is.
Thanks Ron I see what your saying.. Like we say here in Colorado your on this sh^&*. So the drop is coming its just a time gap from reporting. what is crazy is there still pumping like crazy and my hats of to all those ruff necks they get it done.. Its obvious the suits are trying to cut cost but why did they not cut cost last year. These suits like Hamm keep bragging they they will raise production even while they stack more and more rigs.. So this in the next 3 months the fat is in the FIRE If CLR is able to raise production in this environment of stacking and racking.. My hat will be off to him.. But if they start to lose production The share holders will be looking for some butt..
Wow watcher,, that means since the USA eats up about 19 mil a day and china 11 mil a day. just those two Country’s use 1 third of oil produced everyday. so that leaves about 60 million barrels for 200 other country’s to chop up between them
Now compute the per capita consumption for the US, and China, and realize what global consumption will be when China reaches US levels, as they must to achieve US lifestyle and/or social benefits program levels (like Social Security, of which there is essentially none in China).
For just China (toss in India) . . . at US levels of per capita consumption, we’ll be way past what the entire planet can produce.
And thus, they must take the first 4 mbpd they’ll need from the ships headed north along their coast to Japan.
It would be easier for China to secure a larger portion of Russian exports than to seize by force ships bound for Japan. On another note when Japan implodes which it will before any other major first world country due to it’s massive debt, lack of resources, and demographic issues. It’s going to take the global economy with it. Japan has the second largest bond market in the world. Yen carry trade is the basis for global risk assets and has been for decades due to it’s low yields. 99% of people are on the wrong side of this trade so to speak. Everyone is short Yen. Before Yen implodes into hyperinflation. It’s going to strengthen on a truly massive scale. Yen carry trade will unwind first sending Yen to a new all time high against the dollar and every other currency sucking trillions out of every market imaginable collapsing global economy, then it will hyperinflate. If this doesn’t take place in the near future, peak oil will absolutely assure it happens in the not too distant future.
On another note when Japan implodes which it will before any other country due to it’s massive debt, lack of resources, and demographic issues.
While Japan has those issues, there are other countries already falling apart, so I don’t see Japan being the first to implode.
Note i said major first world country. Not Ukraine or Greece. I’m talking G-5 countries.
You must have edited it. The version of your comment I got in my email didn’t say major country.
Watcher, Dollar carry trade will unwind at the same time Yen carry trade unwinds. This has major, major implications. It’s doesn’t matter what other countries do. Like China or Russia, or who ever. Their economies will collapse along with their currencies. It’s don’t matter how much gold they’ve imported in the last few years or how big of a manufacturing base they have, or how much oil they have. Or how many nukes they have. None of that stuff trumps capital outflows and capital controls won’t stop it they will actual just make it worse cause if you can’t get capital out of a country to pay a debt then you default. Capital flows are the only thing that really matters in the global game of risk.
Pocamp,
Just to explain a little magic with oil numbers.
The refineries use around 16 million barrels of oil per day, and produce about 19 million barrels of refined product per day. The difference is called refinery gain. It comes from converting heavy long carbon chain molecules, into light short chain molecules. These light refined products, have a greater volume than the original heavy crude oil.
Some cheeky commentators count this refinery gain, as US production, even though most of this refinery gain is mostly from imported heavy crude oil.
Part of the difference between C+C inputs into US refineries and total petroleum products supplied consists of Natural Gas Liquids (NGL), plus biofuels. The EIA puts the refinery gains component at about a million barrels per day. Here is a link to annual and recent monthly data:
http://www.eia.gov/totalenergy/data/monthly/pdf/sec3_3.pdf
I exclude refinery gains from net export production numbers for two reasons: (1) In many cases, as you noted, the input is imported and (2) Refining is a necessary process, but it’s a net energy loss, since the energy output is less than the energy input.
I define Global Net Exports of oil (GNE) as the combined net exports from the (2005) Top 33 net oil exporters (total petroleum liquids + other liquids, EIA data). Available Net Exports (ANE) = GNE less Chindia’s Net Imports (CNI).
There are roughly 155 net oil importing countries, including China & India.
At the 2005 to 2013 rate of decline in the ratio of GNE to CNI, in about 17 years China & India alone would theoretically consume 100% of GNE, which of course won’t happen, but that is the direction in which we were headed, up to and including 2013, as ANE fell from 41 mbpd in 2005 to 34 mbpd in 2013 (GNE fell from 46 mbpd in 2005 to 43 mbpd in 2013).
2002 to 2012 GNE/CNI Ratio Chart:
http://i1095.photobucket.com/albums/i475/westexas/Slide20_zps26112103.jpg
Well Jeff I guess my question was not original you have already thought of this.. You get all up into these numbers. so to make this easy so a dirt bag like myself can understand this.. The real pain comes not just from peak oil but way before that when county’s go from exporters to importers.. So now that I know how to look up this info I will make a attempt to see what each country needs domestically and total that up and then subtract that from the 90 mil that the world produces each day..
And Ya I know they count every thing as oil even if its SK8board attached to a generator
Whiting had shares outstanding at 167 million one day last week, at Google Finance yesterday the shares outstanding is at 204 million. An increase of some 37 million shares. A twenty percent increase, the share price will probably end up at 24 or less, at least a twenty percent drop, imo. The experience I had with that kind of problem, too many shares issued, is a share price drop of fifty percent, so Whiting could end up with a share price of 15 dollars. Probably will.
Ya Bro they just add more shares to pay of debt and the crazy thing is people still buy those shares the search for yield is so great it blinds people from minor details like the company is a cock roach and makes no money..
and check this out the Banks loans these sub prime roaches even more money then turn around and sell that paper as AAA to the some California pension fund who are even more desperate for yield to meet there obligations.. Can you believe this stuff
I hope taxpayers aren’t stuck with the bill.
No they would never do that,, The Fed will just buy up that paper since its not marked to market Its marked to what ever the TBTF says its worth.. Then it sits on the feds balance sheet… The company looks good the fed looks good and tax payers never know any difference.. Then when this takes place Watcher says I told you so..
NOTE—This thread is taking place in the last comments section. I don’t think that is visible enough. I feel it should be moved here, in the light of day, so everyone has a chance to get that Futilitist guy!:
shallow sand says:
MARCH 25, 2015 AT 10:00 AM
Toolpush: The shale economics at under $100 WTI have never made sense to me. I have displayed above how I look at the numbers. Seems pretty simple to me. Maybe I am looking at them the wrong way?
Whiting seems to be a good proxy for what it takes to continue to grow or maintain US production. It looks like we need $100+ over the long haul. Many on here argue our economy cannot afford that, so here we are.
I guess the way around the problem is to keep interest rates near zero and keep loaning more money to shale producers to drill more wells? I cannot understand how Whiting is able to float more bonds. Will be interesting to see what the pricing is.
If I can find time, will look up CLR, OAS and maybe some more, does not take too long to figure.
For all: I am sorry I said I was through here and then almost immediately came back. I am finding maybe a half hour or so here a day is probably not a bad thing for me, my family and the collective sanity of that group.
shallow sand says:
MARCH 25, 2015 AT 11:31 AM
Sanity being descriptive, not actual. Doing fine, just still wondering if and when oil price will turnaround.
Dennis Coyne says:
MARCH 26, 2015 AT 7:21 AM
Hi Shallow Sand,
I am glad you are back, I wish Old Farmer Mac would come back as well, but the fact that he was being called a Nazi by Futilitist and nobody (including me) called Futilitist out on this.
Hopefully trying to shut down conversation through grossly impolite behavior will not be the way this blog continues to operate, some behavior should not be tolerated.
Keep up the good work and I hope oil prices turn around, my WAG is that we should see them start to move in May or June and hopefully we will be at $75/b by the end of August and possibly $80/b before fall refinery maintenance begins (mid October ?).
I also think that the economy can handle $100/b, it did from 2011 until mid-2014 with the World economy growing at 3% per year, output just rose faster than demand at that price, $80 to $90 per barrel might reduce the ups and downs a bit.
Ron Patterson says:
MARCH 26, 2015 AT 8:00 AM
I have called Futilitist out a couple of times on his insulting language. But I am not a den mother here. But I can put up with only so much. If things get out of hand I will simply go away myself and take this blog with me.
I don’t need this hassle.
shallow sand says:
MARCH 26, 2015 AT 9:27 AM
Ron, I can understand your feelings about the bad behavior. I do not like it either. When I see a post headed the wrong way, I just skip over it. Do not have a ton of time anyway, so I try to focus on the posts that I find useful. Those with information as opposed to back and forth arguments are what I read. So, Dennis, I do feel bad that I have not responded to attacks on others, but in my case I usually scroll down once I see that coming on. Probably not a good excuse.
Hope we can all keep it civil to where you keep this blog going. I cannot find another with oil information and informed posters that comes close.
Thanks.
Futilitist says:
MARCH 28, 2015 AT 9:24 AM
Hi shallow sand.
My behavior is not bad. I was simply responding to Dennis’ bad behavior, and you know it.
This is what scapegoating looks like, folks.
People here just don’t want to admit that oil prices are never again going to rise above the total cost of oil production, resulting in the extreme downsizing of the oil industry.
Well, it isn’t my fault. Stop trying to kill the messenger.
robert wilson says:
MARCH 26, 2015 AT 10:43 AM
I called him out by invoking Godwin’s Law
Futilitist says:
MARCH 28, 2015 AT 9:27 AM
What is the penalty for a breach of Godwin’s law? Death?
I plead not guilty.
Will there be a proper trial, or just a summary execution?
Dennis Coyne says:
MARCH 26, 2015 AT 11:39 AM
Hi Ron,
Sorry. My comment was uncalled for.
I just find Futilitist frustrating.
I guess I should just remember that resistance is futile…. and join the Borg collective
Futilitist says:
MARCH 28, 2015 AT 9:17 AM
Shame on you, Dennis.
Futilitist says:
MARCH 28, 2015 AT 9:16 AM
Hi Ron.
Dennis organizes a little scapegoating meeting about my behavior with respect to his horrific behavior during our debate about the validity of the Etp model. You see fit to immediately (40 minutes) jump in and endorse his position about me, and threaten to shut the site down. This is likely to result in my being shunned and attacked by everyone here. Nice job.
MEANWHILE YOU REFUSE TO WEIGH IN ON THE IMPORTANT DEBATE ABOUT THE ETP MODEL, AND THE FUTILITIST COLLAPSE CHALLENGE, EVEN THOUGH I HAVE ASKED YOU NICELY FOR YOUR OPINION AT LEAST 15 SEPARATE TIMES, OVER THREE OR FOUR COMMENTS SECTIONS. YOU ARE STONEWALLING AND IT IS OBVIOUS.
I SUPPOSE NOW I WILL BE BANNED FOR POINTING THIS OUT.
WHY DO YOU RUN THIS SITE THIS WAY?
WHY DO YOU REFUSE TO TAKE A FAIR LOOK AT THE ETP MODEL?
WHY DID YOU REFUSE TO TAKE THE FUTILITIST COLLAPSE CHALLENGE?
It is hard not to notice that this little meeting is taking place where no one is watching, since there is a new Ronpost up and most everyone is there. Nice.
What the hell is going on here?
Hi Futilitist,
I am aware that you do not agree with me. You claim that I attempt to deceive, which is not the case, though perhaps what I say can be misconstrued, I apologize for not always being clear.
I tend not to insult people and call them names, accuse them of being Nazis and the like.
The bad behavior is mostly by you, I have simply disagreed with your position and then been insulted in return. You asked me to look at the ETP model, I did and found it inadequate and pointed out why I thought this was the case. You have never refuted any of my arguments, you have simply played word games with my responses and accused me of being deceitful when you could not counter the actual arguments.
Do you think that energy determines the value of a good? Note that this is not the same as saying that no energy is needed for an economy to function, that would be a truly absurd argument. The main point is that there is no correspondence between the energy embodied in a good and its price (or value).
One can’t help but wonder if a principal goal of some bloggers is to eliminate, as much as possible, forums for rational quantitative analysis of production, by making the experience as unpleasant as possible.
In any case, as time goes on, I suspect that Ron sympathizes more and more with Leanan, on The Oil Drum.
What they never figured out was that any system involving human psychology can be gamed. The only thing that can’t be gamed is mother nature and the scientific method.
Within everything, there are outliers. Futilitist appears to some as a kind of outlier, perhaps a few kinds embodied in one. There’s a certain beauty in that, such as in terms of mathematics, etc..
Although there’s also something to be said about outlying for it’s own sake.
At any rate, Futilitist, I have been looking at the times you post; when do you sleep and for how long, and is it enough?
“It is no measure of health to be well adjusted to a profoundly sick society.” ~ Jiddu Krishnamurti
Hi Caelan.
Thanks for your support.
I am a polymath. I excel in art, science, and music. I find that, when particularly motivated, I don’t necessarily need to maintain the neurotypical sleep schedule that most people do.
I know I can be a bit trying at times. Or, more properly speaking, Futilitist sure as hell can be. But please, don’t blame me. I am as shocked as everyone else is. He seems very upset to me, too. But he is also very earnest. I designed him to be that way.
The whole Futilitist experiment is really an extension of my ongoing studies in mimetics and social theory. Futilitist is only loosely based on my actual personality.
When I created Futilitist several years ago, I gave him complete autonomy to grow and evolve on his own, through his interactions with other characters online. He has developed quite a personality, hasn’t he? He keeps surprising me, too. In the end, I see him as a character in a story, just like I see every one else here.
The story seems to be building up to something.
I wonder how this chapter will end. 😉
What would be interesting to read, would be a conversation between Loren Soman, and Futilitist.
You will have to wait for the book. We will both autograph it for you.
It will be a big help for Psychiatrists in the treatment of “Paranoid Schizophrenia”.
Intriguing and good stuff.
Myself, I excel in just hanging out. I am a Lumpen Pro. Maybe that can be my nickname somewhere. ‘u^
But where does the ominous-looking guy with the hood (and maybe cape) come from? I’ve seen it before with you over at Doomstead. Also, what happened there after I left where you were put in some kind of confinement force-field? LOL
To maintain some on-topic semblance to this comment, allow me to say that, tonight, it just snowed quite a lot yet again. Maybe a foot/30cm. I have never before seen so much snow as this, and apparently even by the last storm, it blew the city’s or province’s snow-removal budget. Around this time 3 years ago, it was like summer.
To the anti-climate-change guys who might be reading this; Yes! it is yet another sign of climate change and probably the polar vortex is cascading cold here so that more heat can be cascaded elsewhere! Which balances-out to more warming! So we have to stop crony-capitalism and the American way of life before it’s too late!
(This fine comment crafted on-the-fly with the Patterson Press™ Comment Editor)
Hi Caelan.
*(This a scapegoating thread, not a climate change thread. Climate change is off topic.)
I was the Jew in RE’s dungeon. Here is the story of how I escaped.
Picturing Ashvin’s Redemption – Fairwell DD
http://futilitist.blogspot.com/2012/10/picturing-ashvins-redemption.html
My Flight2Quality eventually led me here.
The ominous guy in the hood is Giordano Bruno. He is my hero.
http://en.wikipedia.org/wiki/Giordano_Bruno
“Giordano Bruno (Italian: [dʒorˈdano ˈbruno]; Latin: Iordanus Brunus Nolanus; 1548 – 17 February 1600), born Filippo Bruno, was an Italian Dominican friar, philosopher, mathematician, poet, and astrologer. He is celebrated for his cosmological theories, which went even further than the then-novel Copernican model. He proposed that the stars were just distant suns surrounded by their own exoplanets and raised the possibility that these planets could even foster life of their own (a philosophical position known as cosmic pluralism). He also insisted that the universe is in fact infinite and could have no celestial body at its “center”.
Beginning in 1593, Bruno was tried for heresy by the Roman Inquisition on charges including denial of several core Catholic doctrines (including the Trinity, the divinity of Christ, the virginity of Mary, and Transubstantiation). Bruno’s pantheism was also a matter of grave concern. The Inquisition found him guilty, and in 1600 he was burned at the stake in Rome’s Campo de’ Fiori. After his death he gained considerable fame, being particularly celebrated by 19th- and early 20th-century commentators who regarded him as a martyr for science, though scholars emphasize that Bruno’s astronomical views were at most a small part of the theological and philosophical beliefs that led to his trial. Bruno’s case is still considered a landmark in the history of free thought and the future of the emerging sciences.”
Ohh, ok I get it about Bruno, cool and thanks for sharing, but what is supposed to be read on the blog? I listened to ‘Somewhere Over The Rainbow’ in any case… Sounds climate-related, yes? Somewhere over the rainbow?
Speaking of heroes and dungeons, I have 3 current heroes, among others. These 3 are arranged like matryoshka dolls within different, incremental prison sizes: The first is the smallest; Chelsea Manning- US Prison. The second is the middle; Julian Assange- Ecuadorian embassy. And the outer and largest one is of course Edward Snowden- Russia.
I am almost certain, by the way, that Chelsea was attracted to Julian. So in a sense, Chelsea did it for love. And it is love that is the engine of survival, as Leonard Cohen sings about in the song, ‘The Future’, speaking of Jewish and future. The state, on the other hand, is about hate. Hate the state…
“Give me back the Berlin wall
Give me Stalin and St Paul
I’ve seen the future, brother:
It is murder.
Things are going to slide, slide in all directions
Won’t be nothing
Nothing you can measure anymore
The blizzard, the blizzard of the world
Has crossed the threshold
And it has overturned
The order of the soul
When they said Repent Repent
I wonder what they meant…”
~ Leonard Cohen, ‘The Future’
Hi Caelan.
Great post.
Your heros, like mine, are all dominant paradigm subverters. Futility creates them. It is a very old concept:
“For the creation was subjected to futility, not willingly, but because of him who subjected it, in hope that the creation itself also will be set free from its slavery to corruption.…”
~Romans 8:20, 21
Corruption has a self correction mechanism. When the coercion and violence becomes too great, certain people will become catalyzed and rise up to defy the system. They can catalyze each other, as in the example you gave.
In the end we all do it for love. The love of humanity.
And, of course, Leonard Cohen totally rocks. The future is one of my favorite songs.
Did you listen to Klaatu, up the thread?
Hi Jeffrey Brown.
I was wondering what you thought of the Etp model.
So, what do you think of the Etp model? It seems pretty accurate. Do you think the model is valid?
Also, concerning future oil prices:
I think we are going to see a lower and lower price for oil in the future. I think this will cause the oil industry to shrink pretty rapidly.
Do you disagree?
Do you think that the price of oil will rise to a level sufficient to sustain the oil industry going forward? How?
There’s a pretty exhaustive discussion about the ETP model in a thread over at peakoil.com, there’s really no need to spam this forum with it.
Thanks, I was aware of that. But we were having a discussion here anyway.
There was no need to spam this thread.
Futilitist said:
MEANWHILE YOU REFUSE TO WEIGH IN ON THE IMPORTANT DEBATE ABOUT THE ETP MODEL, AND THE FUTILITIST COLLAPSE CHALLENGE, EVEN THOUGH I HAVE ASKED YOU NICELY FOR YOUR OPINION AT LEAST 15 SEPARATE TIMES, OVER THREE OR FOUR COMMENTS SECTIONS. YOU ARE STONEWALLING AND IT IS OBVIOUS.
The Etp Model is based on one of the most common analytical techniques use in engineering; entropy analysis. It is hardly rocket science, or as some here have suggested some form of voodoo. It has been used extensively for solving intractable problems in the physical domain for almost a century. The Etp Model is merely an extension of that methodology as applied to petroleum production; by facilitating custom software, and a lot of computer power. We have merely applied an age old technique to an area where it had not previously been adapted.
In spite of its simplicity, and board based application in many other areas, through this entire thread not one person has identified it. I even went so far as to give a detailed application of it in the post to Sam Taylor above. Still, no one caught on to the implications. Instead you have been bombarded by ad hoc arguments ranging from the trivial to the nonsensical. There has been absolutely no investigation into the application of the model; which would logically be its weak point if one had any understanding of what it was to begin with.
In essence you are not being stonewalled. What you are appealing to is analogous to an attempt at trying to explain Quantum Mechanics to a gold fish. First, you will find that it is very difficult to get his attention. The scope of his reality is limited to fish food, fertilizing fish eggs, and not being eaten by some other fish!
Maybe if you tempted them with a six pack of beer, and a box of cookies you would have better luck?
BW Hill, Futilitist is a shill who enjoys insulting people and calling them names. Most people, including myself, do not respond to him because he is behaving like a schoolyard bully. People like that are best left along.
You are not being served well by his advocacy. And for what it’s worth, I find your post rather insulting also.
As long as you dropped by, Ron, what do you think of the Etp model? Please direct your questions to bwHill. I’ll just watch. Thanks.
As Rune would say, Tick tock, tick tock. 🙂 🙁
tick, tock, tick, tock, tick, tock, tick, tock, tick, tock, tick, tock, tick, tock, tick, tock…..
We should be grateful towards Lorens Soman (futilitist) for bringing the etp model to our attention. I had a brief look at their web site,
From,
http://www.thehillsgroup.org/depletion2_022.htm
”The Maximum Consumer Price curve is curtailed at 2020 at $11.76/ barrel.”
How about predicitng the oil price some years down the road with the accuracy of 2 decimals?
and
”At this point petroleum will no longer be acting as a significant energy source for the economy.
…and
”Its only function will be as an energy carrier for other sources.”
I leave it to the readers to form their own thoughts and opinions. Screenshot below from their webpage earlier today.
Interesting. The guy believes no new oil fields will be produced after 2020?
Does that sound hard to believe?
Yes it does.
Some people will believe anything.
Hi Rune.
I would appreciate you showing your gratitude to me by calling me Futilitist. I have asked you twice before to stop using my real name.
Please cease and desist from repeating my real name over and over on the internet. You have done this shit 10 separate times! Whipping people into a frenzy using my real name is amazingly reckless and dangerous. You asked me for my real name and a gave it to you. How dare you use it to endanger my family. Shame on you, sir.
Haha, you’ve got more names than Adramalech.
Fuck you, John B.
Rune is threatening my life. Go ahead and make fun. You are disgusting.
Hey Ron,
Go ahead and ban me for saying fuck you to John B. That would be perfect. I am going to talk to my lawyer. I am serious. You are not going to get away with this shit. You had better hurry up and shut your fraudulent website down.
hey drama queen. here’s a thought…stop posting to this blog. problem solved.
There’s other stuff on there that’s way out in left field.
E.g.
Every barrel of oil produced after 2012 takes $200.00 OUT of the economy.
URR is actually 1.75 Trillion barrels.
There will be NO oil production past 2030.
Rune Likvern, said
“You base all your expectations around some model and if this is the “holy grail” of all oil models I take it you have studied it and have such insights into it that it would be easy for you to convince others about the etp model’s powers.
“Most models I have seen is nothing else but simple curve fitting after the fact, which does not translate into predictive powers.”
“I never studied the etp model and I do not intend to either.”
One of the many comments that we have received from our clients:
“I have over 30 years experience in the oilsands, principally surface mining/upgrading. Operations with which I am familiar (mine plus integrated upgrader) achieve an ERoEI in the order of 5 to 6:1. This does not include refining or final distribution. I am happy to discuss further and I appreciate your offer of a copy of the upcoming updated report. This Etp analysis is the clearest portrayal of our challenge.“
Apparently, people who have seriously studied the Model have a much different option of it than people who have not!
http://www.thehillsgroup.org
I think I would trust the guy who ran the whole operation, over the guy who ran the loader. Clive Mather says the oil sands could contain 2 trillion barrels. That’s more than you entire estimate of URR!
http://www.cbsnews.com/news/the-oil-sands-of-alberta/
bwhill,
I visited one of your pages, would you please elaborate a little more on the following quotes from your web site;
From,
http://www.thehillsgroup.org/depletion2_022.htm
”The Maximum Consumer Price curve is curtailed at 2020 at $11.76/ barrel.”
How about predicitng the oil price some years down the road with the accuracy of 2 decimals?
and
”At this point petroleum will no longer be acting as a significant energy source for the economy.
…and
”Its only function will be as an energy carrier for other sources.”
and while you are at it;
I understand there was put a lot of good work into the equations of state and differential equations that describes the etp model.
What I would like to learn a little more about for a starter is (in short, generic terms) how pricing of oil was fed into the etp model.
For the model to have predictive powers for prices/costs it will need some feedback from the global financial system like money stock/total global debts, changes to the global money stock (credit growth/deleveraging) and interest rates.
Does the model differentiate between prices and costs?
Dear bw hill
On a different site you say:
The US is now producing 3.5 mb/d of high test camel pea, and paint thinner. All at the unbelievably low, low price of $1 trillion in debt that can never be repaid. Using the miracle of technology this was accomplished at the insignificant cost of $286,000 per barrel.
Can you enlighten me on the calculation of the 286K per barrel?
Thanks…Don Stewart
Hi BW Hill,
As I have said many times, the thermodynamic principles need to be applied to the entire system, that is the entire economy. There is no reason that oil or any other good that is used in the economy must be net energy positive.
Your basic assumption is that the net energy of any good that is used as an energy input into the economic system must be positive.
You cite Hubbert as your source.
Hubbert was wrong in this case.
If oil can be produced and sold profitably, it will be, it is very simple.
The net energy of all energy inputs into the economy must be positive, for individual energy products (such as oil) net energy can be negative.
“As I have said many times…”
And believe me, everyone heard you, Dennis. Over and over and over and over and over. Your objections have been answered multiple times by both bwHill and me. What is the point of repeating yourself yet again. Please give it a rest. You are taking up more oxygen than Old farmer mac did.
Jav – You can ignore this as it doesn’t fit in with your belief system.
Abstract;
“Every year, an estimated 12 million hectares of agricultural land are lost to soil degradation, adding to the billions of hectares that are already degraded. It is estimated that soil degradation leads to a potential loss of 20 million tonnes of grain per annum, but this is likely to be an underestimate, because the evidence base is limited in identifying direct impacts of soil degradation on food production.”
http://link.springer.com/article/10.1007%2Fs12571-015-0437-x#page-1
Jef, you just proved that you have absolutely no clue about my belief system.
Soil degradation is one of the many negative factors that are acting on our carrying capacity. So far this has not catch up with us because we are increasingly using oil and gas to enhance productivity through irrigation, fertilisers, pesticides and herbicides. Productivity is increasing, not decreasing.
The day oil availability starts declining significantly all the negative factors will dominate the system and we will go from Mode I to Mode II in figure 7.
Productivity is not increasing by any means. In fact “new technology” ag such as GMO is being proven less productive all the time. Not to mention the fact that what is grown by big ag is of far inferior nutritional value.
We are unable to feed/nourish the existing population of the plane now never mind when the constraints start to really squeeze.
Of course productivity is increasing.
What is not increasing is total cultivated land area, and therefore cultivated land area per person is going down and has been going down for decades. Has productivity not being raising by now we would be facing widespread starvation. As things are we only have 10% of malnourishment, which is probably the lowest percentage ever for mankind.
Do you ever check anything of what you write?
Hummm- lets see what UC Davis has to say:
Rising CO2 levels threaten crops and food quality
http://news.ucdavis.edu/search/news_detail.lasso?id=9479
Of course, being the leading agricultural University on Earth, they are not worthy.
I bothered checking the article. You can do that too.
The results are clear. The extrapolation is not.
First, they expose the plants to very high CO2 concentrations to be able to significantly raise internal CO2 levels (Ci) to the point of seeing an effect.
The effect is seeing only after raising internal concentration of CO2 4 to 5 times!!!.
You can worry about that if you want, but the effect that they see depends on two conditions being met:
1. A several fold increase in atmospheric CO2.
2. A lack of plant adaptation to the CO2 increase. Simply by reducing their stomata plants can control their internal CO2 levels.
Those conditions are only met in a laboratory.
Do you see that you are raising issues that you don’t understand and therefore you are involved in a dialectic acting as a proxy based on belief?
I’ll go with UC Davis.
research has shown that when atmospheric carbon dioxide concentrations increase by 50 percent, the nitrogen status of plants declines significantly.
More specifically, findings from previous research by Bloom and colleagues suggested that elevated levels of carbon dioxide decreased photorespiration and inhibited nitrate assimilation in plant shoots.
That’s 50% (something wee accomplished recently), not 500%.
Your images originate from a social form in Brazil in 2007..
Maybe some more chewy data?
Hi cytochrome C.
Javier is obviously not a real scientist. I have asked him repeatedly to post his CV. Ron removed my requests. So, I made several more for him to throw in the trash. This is what clumsy oil industry propaganda looks like. What do you think of all of this?
Perhaps you could also request Javier’s CV next time he tries to take you down the rabbit hole. Hopefully Ron will let your comment stand. It would make an interesting test.
A fascinating essay, thank you.
While I take huge exception to your understanding of climate science (models are, if anything, grotesquely underestimating warming and the acceleration of amplifying feedbacks; and, WattsUpWithThat is not a credible source of information) – I will leave to others more substantitive critiques of that part of your post.
I question the interpretation of the study you cite in Fig. 14 Donohue et al. 2013. I notice the work was sponsored by CSIRO, a vast Australian agency self-described as “…working hand in hand with industry [to] build partnerships and engage with industry to generate impact”. This is not an impartial group, by any means and if you look at that map, you will see that even if, charitably, you grant “greening” in certain areas AND attribute it to excess CO2 fertilization, two issues are prominently lacking in the analysis.
One is, that faster growth from CO2 is more analogous to a human putting on excess weight by increasing caloric intake than a healthy outcome. In the human case, diabetes and heart disease are the result of obesity – the plant version is overall weakness and loss of nutritive value for ruminants.
The second and more important issue is the red areas that indicate a loss of plant cover. These are the forests that are in rapid dieback, which are now detected all over the world, and is part of what is more generally a hole in the analysis of human carrying capacity. Namely, the impact of pollution is hugely underestimate, whether it is plastic in the seas, acidification of soils, or less well known but far more significant, air pollution.
The background level of tropospheric ozone, while invisible, is inexorably rising. Precursors travel across continents and oceans meaning no place, regardless of how remote, is unaffected. Ozone is highly toxic to plantlife, decreasing annual crop yield and quality, while damage to trees is cumulative. The most pernicious effects are secondary – first, vegetation injured from absorbing pollution first loses root mass even before foliar symptoms are visible, increasing vulnerability to windthrow and drought; second, increasing susceptibility to biotic pathogens has led to worldwide epidemics of insects, disease and fungus.
The ultimate outcome of forest dieback cannot be overestimated. As you noted, deforestation is devastating, leading to altered precipitation patterns and loss of soil. The reduction of a major CO2 sink will accelerating global warming considerability, to say nothing of depauperating the world of wildlife habitat, shade, lumber and all its products, fruits and nuts.
https://www.youtube.com/watch?v=sn1Xy_j48k0 (a short film on the topic)
Well said Gail. I would add, the analysis of human carrying capacity is, too often, a disservice to our planet. Human carrying capacity is just a number, one that needs to be viewed in conjunction with carrying capacity for all living species. How many plants and animals will disappear forever with the inevitable arrival of a couple billion more people? The decimation of large fish species is an example but unfortunately, only one example.
Hi Doug,
a few post back I replied to one of your comments as:
“….cash out that 401K; drink that ’89 Chateau Margaux; smoke that Cuban you been hiding; go and see Europe and/or a Saffari and/or Coral Reef;… etc.
The next 5-10-20-30 years are going to be anything like the past 10-30 years….”
-I hope your “scarcity” in commenting and the darkening mood of the comments is the result of you actually doing some/all of the thing I suggested (or is it as the result of the flood of “intelligent” and “knowledgeable” commentators we had the pleasure to hear from as of late?!)…joking.
Good to hear from you.
Be well,
Petro
Hi Petro,
We have been in Italy visiting a Daughter, who lives here, and attending a High Energy Physics Conference at La Thuile, in Aosta Valley. And, yes, respecting the darkening mood, it`s affecting me: I`m beginning to focus on different stuff, for awhile anyway. But, I generally skim through Ron`s Blog once or twice a day so perhaps I now fit more into the lurker category. Cheers, Doug
Beautiful area.
Enjoy the time, friend!
Plenty of wine and food help brighten the mood ( I personally lean on the wine side of “brightening”….).
Be well,
Petro
Enjoy!
Good afternoon,
Global Temperatures are actually on a 2000 year cooling trend. The CO2 and temperature have been correlated for last 350,000 years and we broke that correlation with the Industrial revolution. I do agree with you though that pollution and deforestation are terrible things and something needs to change, but as for CO2, now that CO2 is over 400 ppm yet temperature has not closely followed what any of the IPCC models predicted. The global temperature hasn’t been increasing for 17 years, since 1998, with the reason why is because the Sun is the biggest thing in our solar system and has the biggest influence on everything in our solar system. It is at a solar maxium where sunspots are at its peak but yet we have seen a solar shutdown. Solar Irradiance plays a big part in our climates. There seems to be an obvious agenda coming from somewhere to obscure these facts. IPCC and the NASA has been caught manipulating historical temperature data in different places around the world perhaps due to pressure from politicans. Antartica has shown record ice gain over and over again. There’s been studies in the news that shows the Earth has a way to mitigate CO2 increase. The Maunder Minimum was between 1650-1850, it was a mini-Ice age then. There have been studies shown that this happens about every 400 years or so. Which means we are probably over due for a Glacier Ice Age. In short, the climate always changes in cycles, just wait around long enough and eventually the cycle will change.
While I agree with some of the things you say, James, others are theories based on even less evidence than those from IPCC.
The problem with the Solar spot theory is that is based on a single coincidence of the Maunder Minimum with the Little Ice Age. You yourself probably realize that basing a theory on a single point is a no-no. The solar spot activity has been reconstructed back based on a couple of proxies, 14C and 10Be, whose production is related to solar magnetic activity, and there is no coincidence with past cold events, like Bond events.
It is known that there are climatic cycles, we just don’t know very well what is their cause and how they act. IPCC does not take them into account and that is a huge mistake. The 60 year AMO cycle did predict the current plateau in warming that the models could not.
There simply is no plateau or pause so please stop repeating this bunk.
Oceans have been heating up significantly and at greater depth. Even with that several all time heat records have been recorded for land temps.
http://www.skepticalscience.com/global-warming-stopped-in-1998.htm
Warm ocean currents are what is undercutting the west antarctic.
“Antarctic ice shelves melting 70% faster, study shows”
http://www.latimes.com/science/sciencenow/la-sci-sn-antarctic-ice-shelves-melting-faster-20150326-story.html
Data don’t support the claim of “there simply is no plateau or pause so please stop repeating this bunk”.
I ask you to observe http://woodfortrees.org/plot/rss/last:224/plot/rss/last:224/trend
little warming in the dataset for the past 17 years 1 month 1 week 3 days, and so on. Looks kindof like a plateau to me? But regardless if c.o.2. levels have shot up since then why is the temperature not also shooting up likewise?
The obvious answer is that CO2 forcing is overstated in the various climate models.
Hi John B,
The obvious answer is often incorrect. Have you heard that the Earth is not flat, though clearly it appears to be.
If the climate sensitivity is not roughly 3C for a doubling of CO2 levels for fast (1000 year) equilibrium reponses, then physics cannot explain current earth average temperatures.
For a better understanding try:
https://chriscolose.wordpress.com/2010/02/18/greenhouse-effect-revisited/
Really?
10 warmest years on record (°C anomaly from 1901–2000 mean)
Year Global[66] Land[66] Ocean[66]
2014 0.69 1.00 0.57
2010 0.66 1.06 0.50
2005 0.65 1.05 0.50
1998 0.64 0.94 0.52
2013 0.62 0.99 0.48
2003 0.62 0.88 0.52
2002 0.61 0.93 0.49
2006 0.60 0.90 0.48
2009 0.59 0.85 0.50
2007 0.59
Sure, the last decade is the warmest on record. The point is, it hasn’t been getting any warmer since then, as the models have predicted.
What are you talking about?
2014?
Come now—-
I’m talking about 17 years of CO2 increases, with no statistical increase in temperatures.
The ocean continues to accumulate heat over that period. Heat is a stronger measure than surface temperature, as it characterizes the thermal energy of the entire volume.
Sloop John B, you have to be a real student of climate science and not simply regurgitate the talking points of whatever skeptic that you seem to be reading.
Call for the Captain ashore –
No heat hiding in the ocean:
http://www.scientificamerican.com/article/mystery-of-ocean-heat-deepens-as-climate-changes/
The “missing” heat is “still” a “mystery”.
Let’s just say there’s an eerie slow down in the surface warming rate, which thus far seems to take the wind out of Al Gore’s sails?
The way I see it we do have some really weird changes in the mixing layer’s energy uptake. It’s really slowed down.
I’m also very encouraged to see so much ice around Antarctica, it has hit a record winter max in recent times. This should increase albedo.
Antartica is losing ice mass big time.
http://www.wunderground.com/climate/facts/antarctica_is_losing_ice_sheet.asp
Estimates of recent changes in Antarctic land ice (see above) range from losing 100 gigatons/year to over 300 gigatons/year. Because 360 gigatons/year represents an annual sea level rise of 1 mm/year, recent estimates indicate a contribution of between 0.27 mm/year and 0.83 mm/year coming from Antarctica. There is of course uncertainty in the estimations methods but multiple different types of measurement techniques (explained here) all show the same thing, Antarctica is losing land ice as a whole, and these losses are accelerating quickly.
I wrote “ice around Antartica”. That’s growing, which is really great news. According to my rough estimate if the trend continues we should see the energy balanced in about 20 years.
?
“The frozen fringes of western Antarctica have been melting 70% faster in the last decade, raising concern that an important buttress keeping land-based ice sheets from flowing to the sea could collapse or vanish in coming decades, a new study shows.”
http://www.latimes.com/science/sciencenow/la-sci-sn-antarctic-ice-shelves-melting-faster-20150326-story.html
The PIG is going fast.
10% of West Antartica Ice mass.
Hi Fernando,
Total world sea ice is at about the 1979 to 2008 mean.
http://arctic.atmos.uiuc.edu/cryosphere/IMAGES/global.daily.ice.area.withtrend.jpg
That’s right. Isn’t that excellent news? The ice gain around Antarctica is a powerful climate cooling agent. I’m very encouraged to see how it’s building up.
There’s been an eerie acceleration in the rate of polar ice melt.
Define significantly in this case and compare it with measurement error.
Because if you multiply a very very large very precisely known number times a very very small very imprecisely known number, you get an impressive figure to show, but the measurement error goes through the roof.
These are accountants tricks. Hardly what I would call science. Believe me, I know the difference. Whoever thinks that the heat is suddenly hiding in the deep oceans when it was at the land surface before and has moved without warming sea’s subsurface is really credulous.
Come now Javier, the Pig has not gone the point of no return because of ocean equilibrium?
A peer reviewed paper to prove your point?
Hi Dave Ranning.
Does Javier sound like a real scientist to you?
You should ask him to post his CV.
There are a couple of graphs posted here on cosmic rays vs. temperature. They correlate well over the past 500 million years – Shaviv & Veizer graph.
http://infoalternativas.blogspot.com/2013/04/climate-change-is-not-caused-by-man.html
Sorry Charlie:
cosmic-rays-not-causing-climate-change
http://www.scientificamerican.com/article/cosmic-rays-not-causing-climate-change/
IPCC and the NASA has been caught manipulating historical temperature data in different places around the world perhaps due to pressure from politicans.
You can just make such statements but such accusations really require proof. I don’t believe that crap for one minute. But if you can post proof of this you will receive my full apology.
Good afternoon,
Sure, here are some of the most recent articles talking about what NASA and IPCC is doing to the temperature record and why they might be doing it, and why isn’t the mainstream media doing anything to expose the truth.
—
‘Breathtaking’ adjustments to Arctic temperature record. Is there any ‘global warming’ we can trust?
In nearly every Arctic station from Greenland in the West to Siberia in the East, the data has been adjusted to make the warm period in the 1930s look cooler than it actually was. This, of course, has the effect of making the Twentieth Century warming look much more dramatic than the raw data would suggest.
—
Inside the Global Warming Scandal
These warmists have systematically altered historic temperature records, so that the temperatures they report today for past eras are not the same as what were measured, say, 70 or 80 years ago. The effect of these adjustments is strikingly consistent: they almost always make the past look cooler than it was measured at the time, so that the present looks warmer by comparison. The opposite–an adjustment that results in reporting a historic temperature higher than what was published contemporaneously–never, or almost never, happens. These adjustments may or may not be explained; sometimes, they are kept quiet until someone stumbles across the original data and points out a discrepancy.
—
Report: Temperature Data Being Faked to Show Global Warming
“Again, in nearly every case, the same one-way adjustments have been made, to show warming up to 1 degree C or more higher than was indicated by the data that was actually recorded,”
—
U.N. Official Admits Belief In Global Warming Is Religious
Alarmists started to come clean at a news conference in Brussels in early February when Christiana Figueres, executive secretary of the U.N.’s Framework Convention on Climate Change, owned up to their agenda.
She made clear what so many already know: The goal of environmental activists is not to save the world from ecological ruin but to extinguish capitalism.
And some older articles detailing more about the IPCC.
After Missing 5 Predictions, IPCC Cuts Global Warming Forecast
But policy makers don’t want to wait for more research — they want to take action immediately, and spend big on schemes that are claimed to “fight warming”.
While some skeptics aren’t happy with the IPCC for not making bigger cuts to temperature predictions over the next decade, some global warming proponents are equally outraged at the IPCC for cutting predictions at all. Reportedly some politicians tried to pressure the IPCC to leave data acknowledging the warming stall out of the report.
Indeed it’s much harder to justify trillions in spending on “fighting warming” with tactics we don’t even know will work if the temperature increase over the next century is only going to be 1/2 a degree Celsius.
—
GLOBAL CLIMATE SCIENCE, UNCERTAINTY AND POLITICS: Data-laden Models, Model-filtered Data
—
What the New IPCC Global Warming Projections Should Have Looked Like
Since virtually all climate impacts are related to the change in the earth’s temperature, the smaller the future temperature increase, the smaller the resulting impacts. Another degree of so of temperature rise during the next 87 years is not going to lead to climate catastrophe.
Had the IPCC been more interested in reflecting the actual science rather than in preserving a quickly crumbling consensus (that human greenhouse gas emissions are leading to dangerous climate change that requires urgent action), its Fifth Assessment Report would have been a much kindler and gentler document—as it well should have been.
—
49 Former NASA Scientists Send A Letter Disputing Climate Change
That must be why models are predicting a lot more warming than what we are observing at current CO2 atmospheric levels (see figure). Lets throw the data away because models have to be right.
Fine with me, I did not perform that study. I do not care about the affiliation of the authors, If the data or the conclusions are wrong, certainly somebody will refute them with another study. That’s the way science deals with this. No witch hunting thank you.
But the data on that study appears solid, in agreement with accepted theory and in agreement with the results of others. See for example the article that we cited above:
Ballantyne, A. P., Alden, C. B., Miller, J. B., Tans, P. P. & White, J. W. C. Increase in observed net carbon dioxide uptake by land and oceans during the past 50 years. Nature 488, 70–72 (2012)
Your analogy of human weight excess with plant CO2 uptake shows lack of understanding on plant physiology.
I fail to see how pollution can question an article that has nothing to do with pollution.
Ok so we are going from lack of ozone is going to kill us all to excess of ozone is going to kill us all. Pardon me for remaining skeptic.
On this I wholeheartedly agree. We should stop cutting natural forests and increase tree planting by orders of magnitude. CO2 will help us grow them.
The figure mentioned.
Climate forcing extra energy is going into global polar ice melt (Antarctica, Greenland, northern sea ice) more than anticipated. Increasing seasonal sea ice in Antarctica is an indicator of the dramatic land ice melt. Northern sea ice melt is much more rapid than expected, while global air temperature increases are somewhat less than expected. Somewhere in there I see an energy balance, and an indication that the global air temperature increases will catch back up to the model predictions after northern sea ice is more depleted.
Earth is going thru a climate “phase change”. Move along, nothing to see here…
Earth is going through a warming phase after a Bond event. It has happened before but not when lots of scientists were looking, so even it is not new for mankind, it is new for science. These warming phases last while they last and in a few centuries they pass. Some scientists are confused because they were extrapolating and extrapolation rarely works for long in the real world.
Being in a warming bout during and interglacial you would expect CO2 levels to go up, you would expect temperatures to go up and you would expect ice to melt and sea to raise. That is what we see.
The fact that the related phenomena appear to follow a 60 year periodic pattern that cannot have a human origin and that is thought to be related mainly to the Atlantic Multidecadal Oscillation, further reinforces this interpretation.
Reality is described by highlighting the very two coolest records? Do you have something better that isn’t such a blatant cherry pick?
Do you have a way to reconcile measured land surface temperatures with model predictions for those temperatures over the last 18 years? I bet you would make very happy a lot of climatologists that are scratching their heads
Gail, over the past five years I have noticed the mortality rate of trees going up on my woodlot in south central Illinois. It is disturbing to see long lived deep rooted trees such as white oaks and hickories fail and die in their prime. As the trees weaken beetles and borers attack them. Yesterday I cut down a hickory that only 2 years ago appeared to be thriving. I am especially worried about my largest white oak which is 40 inches in diameter as it is starting to show signs of decline such as early leaf drop in the fall. And I’m not including trees such as white ash which are probably doomed from the emerald ash borer.
After Lake Agassiz drained, the Atlantic Multidecadal Oscillation was permanently shifted, the gulf stream changed permanently too. 11,000 – 13,500 years ago, the climate was experiencing some changes.
The development of vaccines for immunizations for diphtheria, measles, mumps, polio, smallpox, treatments for syphilis, malaria, the development of flu vaccines, (when Japanese children were immunized with flu vaccine, the incidence of flu in the adult population was suppressed), all included, the decreased cases of those diseases have had a direct effect on the growth of the human population, fewer deaths from those diseases will have more survivors. You won’t go stark raving mad if you are cured of your syphilis, you’ll live another day. If you look in Odum’s Fundamentals of Ecology, in the appendices, you’ll see the graph which shows a steep decline in those diseases as well as a steep increase in malignant neoplasms.
Human population increase and treatment for diseases, increased survival rate is a direct correlation. Oil is a secondary to the advances of medicine and the treatment of diseases. We’re tertiary producers, not solely dependent on oil, it is the most convenient resource, that’s why it is used in copious amounts. Humans have managed despite and against all odds, so far, so good, sometimes bad, so somebody says ‘you can’t do that’.
Malignant neoplasms increase because there are more humans.
The last year that recorded the highest summertime temp was 1988, the temperature was 108 in the shade in the middle of August. The heartland of America was troubled by drought that year. “Never seen it so dry” are words I heard on a television newscast.
Last summer, the summer temp never reached 100 degrees Fahrenheit.
The last summer that was warm and hot as usual was 2012. 2007’s summer was normal with August temps reaching 102 for several days.
The winter of 1997 was the coldest I’d ever seen.
The last 27 years of weather has been a general cooling trend with an increase of surface water and a recharging of aquifers. It is not the same climate as it was in 1988. The 60’s and seventies were warmer too. I do remember very dry conditions ca. 1959-60.
In fact, the times were kind of tough and recall an auction that I attended when I was a kid during that time. I’ll never forget what the auctioneer had to say. “Never saw stuff go so cheap in all my life,” he said.
Winter of 1949.
Lots of good information, Ronald. Thank you.
I would not say that currents were permanently changed ≈12 Kya, as permanent implies knowledge of the future, and oceanic currents are notoriously inconstant. The raise of Panama 5 Mya could very well have changed the TH current and determined Northern Hemisphere climate since.
The advances of medicine have done wonders to help population growth, that is undeniable, but first you have to had enough food to feed all the persons saved by medicine. The 70’s were a time of great famines in the world due to cold related drought conditions and glaring problems with food distribution. Perhaps vaccination played its part.
Now we have to consider that mortality did raise after the soviet collapse and between the factors mentioned is a decline in healthcare. That decline took place despite the knowledge being there. Knowledge by itself has little power without the economy and the energy to make it work.
Going up the Hubbert peak is all party. Going down will be a very different story, and despite being a scientist I do not have much faith on what science is going to be able to do for us without economy and with less energy. It is funny that most people have more faith in science that I do. Must be because science has little to do with faith.
I am trying to remember what year it was I think 1979 when I was in the National Guards. We left for our 2 week summer camp the last week of July thru the first week of August. Easton Md. the week before we left was in the mid to upper 90’s Went to Camp Drum New York. Those two weeks I don’t think one day reached even 60 degrees. One night it even went below freezing. Of course at that time in the 70’s the media was all about was global cooling. 30 years later now its global warming. I don’t know what they will say next maybe global shrinking?
All I know weather changes every day and you never really know what to expect.
The only constant is that whatever they try to scare us with, is not what is going to happen. Scaring the populace is a very well developed technique.
That’s why I am so worried about peak oil. They don’t say a word about it. That’s a very ominous sign.
Perhaps not in your neck of the woods, but in the US, people have been calling for the end of the oil since the 19th Century. Even some US Presidents have weighed in.
I like your rule though.
https://www.youtube.com/watch?v=iXHTmEUGR7c
Inquiring minds may want to take a look:
http://www.realclimate.org/index.php/archives/2015/03/whats-going-on-in-the-north-atlantic/
(It is peer reviewed science, so may be suspicious to “What is my head doing up my azz?” followers.
It’s peer reviewed but it happens to be a bit goofy. I’ve read a really funny Twitter exchange between Mann and a young researcher who was bitching at him for ignoring his data. Eventually Mann got upset and wiped the whole exchange, but the other guy captured screen prints and passed them out. I think you picked the wrong kind of peer reviewed topic.
Don’t feed the troll, my friends. You must ignore the trolls that they cut interest conversations.
If I had to pick one factor which will cause the world population the greatest problem, it has to be fresh water. In a variety of countries as diverse as Australia, the United States, India and China ground water depletion has already rendered agricultural land useless.
Once ground water has become too saline to use no amount of oil or fertilizer can save the farm.
http://www.arlingtoninstitute.org/wbp/global-water-crisis/441
While so many have fretted about peak oil, many countries are already past peak water.
If I had to pick one factor which will be main cause the world population the greatest problem, it has to be fresh water. In a variety of countries as diverse as Australia, the United States, India and China ground water depletion has already rendered agricultural land useless.
With the lack of sufficient water happening now in a variety of places, there’s no need to debate the future.
Where it is going to get interesting is in places where cities, agriculture, and fracking are all competing for limited water.
As long as we have plenty of cheap energy many problems have a workaround. Water can be transported or desalinated in many places. As soon as we have less energy or too expensive, suddenly all the problems are going to come home to roost. If peak oil was in the distant future, I will agree that hitting other limits could be a problem, but since peak oil is taking place right now, soon we are not going to have one problem but hundreds.
As long as we have plenty of cheap energy many problems have a workaround. Water can be transported or desalinated in many places.
While there are places in the US where we are trucking in drinking water when the local area runs out, we don’t have any plans to supply agricultural areas with sufficient water if their current water sources run dry. So I guess we have already hit the limit of cheap energy.
That’s because the workaround for agricultural loses due to a drought condition is to buy food from other places and economically help the farmers until the situation alleviates.
But if you want to irrigate the desert because you have plenty of cheap energy, you can do that. It is done in many places. I was surprised by how many golf courses are in arid areas in the US, and the Arab Peninsula irrigates most of its agriculture, and a lot also in Israel.
It is done in many places. I was surprised by how many golf courses are in arid areas in the US, and the Arab Peninsula irrigates most of its agriculture, and a lot also in Israel.
What places are using desalinated water to irrigate golf courses? Or agriculture, for that matter?
Sure, there are lots of golf courses in arid areas in the US, but they are not desalinating water with cheap energy that I know about.
There are many places in the US using irrigation, but they are pumping the water out of the ground or they are getting it from rivers. I’m not aware of any of them using cheap energy to convert seawater to irrigation water, but maybe I’ve missed that.
Spain for example uses desalination for agriculture.
If you google agriculture+desalination you get half a million hits. It cannot be that far fetched.
And pumping out water from aquifers also requires energy. Cheap energy is everywhere unnoticed, until it is no longer cheap or abundant. Then we will notice.
I’m not exactly sure what you think is going on in California, but cheap energy isn’t giving them water for agriculture. There have been many articles about drought conditions there.
If you believe that as long as we have cheap energy we will have water, then we should conclude that we’ve already hit that peak cheap energy wall.
The Economics of California’s Drought — The Atlantic
I’ll write it again.
As long as we have plenty of cheap energy many problems have a workaround.
The workaround will be different for each problem. In the case of California’s drought I don’t see anybody suffering starvation as I saw during South Sudan’s drought. So cheap energy is still doing its magic. Food is being brought from far away places, water is provided to citizens, and farmers will be compensated for loses and most will remain in business when the rains return.
In the case of California’s drought I don’t see anybody suffering starvation as I saw during South Sudan’s drought. So cheap energy is still doing its magic. Food is being brought from far away places, water is provided to citizens, and farmers will be compensated for loses and most will remain in business when the rains return.
California is the place where food is grown to send to other parts of the country. So if California goes down, it will affect food prices across the country.
Now you are suggesting that as long as people aren’t starving, that indicates that there is sufficient energy and water. And I suppose so, if you want to look at it that way. At one end of the future spectrum, we have people saying that we’re in collapse if the financial system goes down. On the other hand, you’re saying things are fine as long as people aren’t starving.
Of course people are starving in some countries, so whatever cheap energy there is isn’t helping them out much.
Dear Javier
I suppose where cheap energy is available and where plenty of water is available, then that water can be treated. However the are many places where one or the other are not present. Pumping clean water from an aquifer 20 feet underground is actually very easy and cheap. Desalinating water and building pipelines and pumping water hundreds of miles is ludicrously expensive.
From this article.
Read more at: http://phys.org/news/2015-03-heavy-toll-australian-farmers-struggle.html#jCp
“Just over a decade ago, the area had 1.2 million sheep and 89,000 cattle. Now there are 200,700 sheep and 23,000 cattle, Clemson said.”
Australia has no lack of cheap coal yet they cannot afford to irrigate these huge areas. Any idea how much it would cost?
The same is happening in India, china, Africa. Importing food for poor countries is not an option. When it comes to moving billions of tonnes of water no solution will be cheap.
That is interesting, Aurelio. Reduction of livestock is one of my predictions as a response to try to maintain carrying capacity. You can see the graph that I posted way above on the collapse of Rome.
Droughts have happened before, even megadroughts in some areas. What is the point? That this time is different? It will not be different until our capability to respond to them is clearly compromised. We have not reached that state yet. That is my point, not that the deserts can be irrigated.
Droughts have happened before, even megadroughts in some areas. What is the point? That this time is different? It will not be different until our capability to respond to them is clearly compromised. We have not reached that state yet.
We have gotten to the point where we cannot respond to them in some areas.
Now, you are right. Eliminating water-intensive agriculture, eliminating lawns and golf courses, and so on would allow us to better use the water we have and to perhaps shift populations to those areas where clean water is more plentiful. We should be doing this.
What I have been suggesting is that while we are still discussing global problems that might happen in the future, water issues are happening now and are requiring a response in some areas, now. So even if we can’t get our act together for future threats, maybe we can get our act together for current problems, of which water is one of them: too much in some places, not enough in others.
Javier
The human response in the past to soil degradation or lack of water was to simply move somewhere else.
Invade another country kill the people and take the land. The population of Native Americans was only 10 million in 1600, so that was not too difficult.
Today with 7 billion and rising that is not an option.
http://timesofindia.indiatimes.com/india/2014-could-be-heading-for-all-India-drought-year/articleshow/41126409.cms
Where would several hundred millions of Indians move to?
http://www.detroitnews.com/story/news/world/2014/09/25/china-drought/16194867/
or Chinese.
That’s the entire point of the article, that when we don’t get enough of some important resources our carrying capacity will diminish and we will be in overshoot (Fig. 7). We will be like the Finch in the island, nowhere to go.
Wether we don’t get enough oil first or it is water it makes little difference, except that water is a more localized problem, while oil is global.
Are Californians growing rice like they used to?
Hi Ron,
Interesting article :
http://www.cbc.ca/radio/thecurrent/the-current-for-march-24-2015-1.3006711/switching-to-an-electric-car-isn-t-always-good-for-the-environment-1.3006734
…especially for the Tesla crowd.
Be well,
Petro
P’S: Article presented for info and informative discussion only.
I do not have an opinion to state at the moment regarding the info/view presented in the clip (i.e.: neither “agree”, nor disagree” ).
It really all depends on what is being used to generate electricity. If the electricity is coming from a coal fired power plant, production of coal itself then burning it to produce electricity would probably negate any co2 reductions of it being a EV. If the electricity being used is generated at a hydroelectric power plant well the only co2 emissions are from building the actual dam itself an any co2 emissions produce during manufacturing of the car itself.
Right!
-So, what happens to the people displaced by the construction of the hydroelectric plant?
-How much energy and other resources is spent for that reason?
-What about the land , trees, animals, etc destroyed by the reservoir of water?
I can go on, on on….
-Contrary to what a lot believe (lack of knowledge the main reason for that!), hydroelectric projects are some of the most ecologically devastating energy projects and, in the long run, absolutely not with such a nice EROI/ROI and clean as one might think!!!
Be well,
Petro
I wasn’t claiming hydroelectric isn’t destructive. Three Gorges in China was all that you said above. But it’s long-term co2 emissions aren’t at the level of what a coal fired power plant of equivalent size of energy production would be. When it comes to pure carbon emissions.
We need to start removing Dams as soon as possible.
Evaporation tanks, and ecosystem killers.
I’ll buy you a jackhammer and you can go with your buddies to off a small dam somewhere in the Peoples’ Republic of California. But I want all the video rights to the event and an interview after they release you from the slammer.
While you’re giving away tools, I could use an extra hammer…
some may find this site useful….
“The Center for Climate and Energy Solutions is a source of reliable information about the causes and potential consequences of climate change. Here we provide an overview of fundamental facts and data and answers to frequently asked questions.”
http://www.c2es.org/science-impacts/basics
but if you find yourself in Florida, mums the word…
https://www.youtube.com/watch?v=5hMCevgPGjY
Found this a while ago. Not new but new to me.
PETM Shocker: When CO2 Levels Doubled 55 Million Years Ago, Earth May Have Warmed 9°F In 13 Years
… following a doubling in carbon dioxide levels, the surface of the ocean turned acidic over a period of weeks or months and global temperatures rose by 5 degrees centigrade – all in the space of about 13 years. Scientists previously thought this process happened over 10,000 years.
“We’ve shown unequivocally what happens when CO2 increases dramatically — as it is now, and as it did 55 million years ago,” Wright said. “The oceans become acidic and the world warms up dramatically.
Also found on a graph, below. It is known as the Paleocene Thermal Extinction.
Page of the graph; Mass Extinctions and CO2 levels
The chart below is adapted from a similar graph in Dr. Peter Ward’s book, “Under a Green Sky.” It plots all the mass extinction events of the last 500 million years against the best estimate of carbon dioxide levels (CO2) at the time. According to his analysis, all major extinctions occured when CO2 levels exceeded a thousand parts per million (ppm).
There is an error in that text. The K/T Extinction happened 65 million years ago and was caused by a meteor strike. It is not on the chart below. The Paleocene Thermal Extinction happened 10 million years later, or 55 million years ago.
Ron, that is so wrong on so many levels.
For a start, Paleocene-Eocene Thermal Maximum (PETM) event is not considered a mass extinction. You can check the rather extensive list of 25 “Extinction events” in Wikipedia and you won’t see any listed at 55 Mya. A climatic event does not qualify as a mass extinction just because some organisms went extinct just as well as killing a few people doesn’t make you a mass murderer.
To continue, we have absolutely no idea what caused the PETM, and as it was a warming, CO2 levels had to necessarily raise. ∆T and CO2 are coupled, that much we know. Saying that CO2 caused PETM is not supported by any evidence.
What is worst, that graphic is a big blatant lie perpetrated by the author. Here you have a graph of temperatures during Phanerozoic Era with Mass Extinctions labelled. You immediately see that all the main extinctions are associated to rapid and profound coolings wether inside or outside ice ages. As CO2 is coupled with temperatures, those were events that experienced rapid drop in CO2 levels.
We have absolutely no evidence that CO2 ever caused any extinction. On the contrary we have evidence that indicates pretty strongly that cold is the biggest species killer in the history of Earth.
Hey I just posted what I found and thought it would be interesting. I did not vouch for its accuracy. But I thought there was something fishy when it talked about all mass extinctions but did not mention the K-T Extinction. The K-T Extinction was second only to the Permian Extinction.
I think the gradual temperature decrease after the Eocene Max was caused by the gradual disappearance of the Central Asia/Siberian sea and seaway. I did some estimates using a calculator and that caused a fairly large change in humidity and albedo. But that’s my theory as far as I know. Maybe I need to write it up in my blog?
Javier, Ron,
What all three–the end-Permian, the end-Triassic and the end-Cretaceous–extinctions had in common was that they occurred during the eruption on a very large scale, over hundreds or thousands of years, of basaltic lavas. The largest was eruption of the Siberian traps, associated with the initial breakup of Pangaea; the initial opening of the Central Atlantic saw the end-Triassic extinctions; and the Deccan Traps now exposed in India span the time of the end-Cretaceous extinctions. The asteroid strike that formed the Chicxulub structure occurred during the latter eruptions; no evidence of impacts during the first two has been found.
There are large carbon-isotope excursions, recorded in the sedimentary-rock record, dating to the first two, and periods of oceanic anoxia as well. It’s clear that global cycling of carbon underwent significant changes and that would include swings in concentration of atmospheric CO2; strong variation in temperature would be one result and that would lead to both warming and cooling over time. Low temperatures are not the cause of the extinctions; low temperatures and many other changes are results of the ongoing eruptions.
If we know something about eruptions is the strong effect that they have over temperatures. We can perfectly see the 1991 Pinatubo eruption as a downward spike in temperature records. A massive eruption like the ones you talk about would in the course of days to weeks cause a huge drop in temperatures, and temperatures would be depressed for as long as eruptions would be taking place. The effect of the temperature drop on plant productivity is immediate and could be enhanced by reduced insolation effect on photosynthesis. Oceanic extinctions would probably be due to chemical changes in the water from sulphuric or acidic rains.
That is climatic change on steroids, but… to the cold side.
Javier,
The cooling from the Pinatubo eruption was the result of sulfate aerosols injected into the stratosphere and able to spread because the volcano is located fairly close to the Equator. Those aerosols don’t remain in the atmosphere for long after the eruption subsides–that’s why the cooling was so short.
Large flood-basalt eruptions go on for much longer (months to years) than do those of single subduction-related volcanoes such as Pinatubo, and they’re releasing great volumes of CO2 the whole time. CO2 has a residence time in the atmosphere measured in decades but sulfate aerosols are rained out on much shorter time scales (Pinatubo again). The CO2 content of the atmosphere is estimated (from stomatal evidence, I believe) to have tripled during the eruptions of the Siberian traps. The overall result is warming, not cooling. Too, the Siberian volcanism was at high latitude even back then, which hinders the latitudinal spread of aerosols.
Then why if significant warming is predicted, temperature records based on d18O (Vezier et al.) show such a profound cooling at the time of extinctions? We have another case of evidence not supporting predictions from theory. I always go with evidence in those cases.
Javier,
Is that Veizer? If so, which paper?
Yes, Veizer. They constructed probably the most thorough database of some 24,000 δ18O measurements from low-Mg calcitic fossils that is widely used to represent temperatures through Earth history.
Prokoph A., Shields G. A. & Veizer J. Compilation and time-series analysis of a marine carbonate δ18O, δ13C, 87Sr/86Sr and δ34S database through Earth history. Earth-Sci. Rev. 87, 113–133 (2008).
The figure that I put is from their data, and if you place mass extinctions over that record, you get a very good match with periods of profound cooling.
You would probably be interested in
Is the solar system’s galactic motion imprinted in the Phanerozoic climate?
Shaviv NJ, Prokoph A, Veizer J. Sci Rep. 2014 Aug 21;4:6150. doi: 10.1038/srep06150.
Its fascinating. They propose a 32 Ma oscillation in Earth’s climate consistent with the vertical motion of the solar system across the galactic plane. That the 32 Ma is a multiple of several extinction events is left to Rampino in the bibliography, but they do discuss periodic Mantle convections as an alternative.
Javier,
Thanks for the reference; the paper is new to me and represents a staggering amount of work (that’s what grad students are for) and I expect it stands beside Berner’s work on Phanerozoic oxygen and CO2 levels.
The difficulty with linking their figures to something like the K/T extinctions is incommensurability of time scale. They’re talking about cyclicity (more on that term later) in various isotope records with plus or minus values of a couple of million years, while the whole time span of extrusion of the Deccan flood basalts occupied about three quarters of one million years, and within that span the extinction interval was geologically instantaneous.
I could only find the abstract to the paper, though I did see that in several places, but as an example of the time-factor difficulty I mentioned above I’ll use this:
“All oxygen-isotope habitat records exhibit a strong, coherent 30-45 Ma [million-year] (about 38 Ma) cyclicity throughout the Cretaceous and Cenozoic.” We see that the 38-Ma cyclicity they present has plus and minus values of about 8 million years, or a little over 20%; we can’t apply those figures to phenomena measured in hundreds of thousands of years. The paper is a very valuable one but it applies to other kinds of data.
I question their use of “cyclicity”. A cycle in the natural world is something that has a cause, but statistical analysis of a great deal of data can bring up patterns with, perhaps, statistical meaning but not necessarily reflecting anything going on in the actual world. Economists do this all the time. I’d suggest “periodicity”, and even then I wouldn’t put much faith in the suggested periods because of those relatively large plus and minus time ranges. Just a thought.
I saw Rampino’s remarks several weeks back, on whether extinctions could somehow be related to the Sun’s passing through the galactic plane, but I’m in no position to critique them. I’m skeptical because the galactic plane has significant thickness with no sharp boundaries, and passing through it takes some number of years in the millions. The idea comes up every once in a while, in various contexts, but I’ve not seen any exhaustive analysis in physical terms of its likelihood.
Thanks again for pointing me to Prokoph et al.
Javier,
The evidence is right in front of our noses. We are in the midst of a major extinction event right now, caused by humans. This is a unique event in the history of the earth, with no adequate analogies from the past. It’s hard to see how a rational person would think AGW will not at the very least exacerbate the current mass extinction, but if you want to dream about the cool breeze that is human wisdom, who am I to slow you down…
I am a rational and knowledgeable person and I do not dispute solid evidence. The facts are simple enough:
1. There is a rate of species lost congruent with a mass extinction since about 50.000 years ago and man is the indisputable cause.
2. Earth has been warming not uniformly for the last 200 years.
3. CO2 levels have been raising for at least 200 years.
4. Mankind has been producing about 5% of the global yearly CO2 flux into the atmosphere for the last 60 years.
5. There is a periodic warming and cooling during the Holocene in the Earth on a millennial scale. The cold phases are named Bond events. Earth just finished a Bond event about 200 years ago.
There are two favored explanations for those facts:
A) Man contribution to CO2 flux into the atmosphere for the last 60 years is totally responsible for 2 and 3 and makes 1 worse. This is called AGW.
B) Man contribution to CO2 flux into the atmosphere is taking place within the context of a natural climatic periodicity that is of bigger magnitude and dominates the effects.
You are welcomed to chose A. I believe B fits better the available evidence. For example B is the simplest explanation to the warming plateau.
Why would you think that not supporting AGW is irrational? Rationality has nothing to do with choosing between conflicting theories. Scientists are always choosing between conflicting theories and since the great majority of theories end up in the dustbin it follows that scientists are wrong most of the time. Good scientists accept that. I might be wrong but I won’t know until more evidence is produced that is incompatible with hypothesis B. Alternatively I could be right and the evidence produced continues being more favorable to B than to A.
If you are not a scientist you probably don’t want to be exposed to evidence that contradicts your belief system. That is understandable. Most people react badly to that and it shows in forums like this one.
For your information, people as gifted as Prof. Freeman Dyson also favor hypothesis B. Thinking that Freeman Dyson is irrational is at the least preposterous.
Cray cray is all I can say…
Synapsid, yes, I know about that. And am firmly convinced that volcanism caused those extinctions. The Siberian Traps, the greatest volcanism of all time caused the greatest extinction of all time. And likely the K-T Extinction was caused by volanism, which the meteor caused. India, 65 million years ago, was on the exact opposite side of the earth from the meteor strike. The theory is that shock waves coming from every direction, converged at that point and this is the origin of the Deccan Traps.
Both the meteor and the traps had a hand in the extinction. But the effect of the meteor strike would have been over in just a few years where the Deccan Traps erupted for hundreds of thousands of years. Those effects would likely have been more devastating.
Ron,
The Deccan Traps were erupting long before the Chicxulub impact and the rifting associated with them is still going on; the hotspot is located at Reunion in the Indian ocean. The impact (there’s some evidence that it was a multiple one) was just awful luck in times of tremendous environmental stresses.
Walter Alvarez, who proposed the K/T impact idea, said “Sometimes you get a really bad day.”
I haven’t heard the statement about the Deccan source being directly opposite the Chicxulub site for a couple of decades. I believe the idea was shown not to hold up.
The Deccan Traps were erupting long before the Chicxulub impact and the rifting associated with them is still going on;
I have heard this argued both ways. I believe the jury is still out on this account. And India was below the equator at this time and in the vicinity of the exact opposite point on earth as the meteor strike. As you say, this may be in dispute, but I haven’t seen that argument. But then again I do not read a lot of scientific papers on this subject and could have missed it.
Ron,
We’re long past the jury still being out on the dating of the Deccan traps. They span a good part of a million years, begin before the K/T extinctions, and continue past the end of the Cretaceous.
There’s a good paper in Science for 9 January this year, for an update.
I haven’t seen anything on India being at the exact opposite side of the Earth from Chicxulub since Scotese’s work long ago but he has been the main source of plate reconstructions and didn’t find it to be so. Not an important point anyway, with the eruptions having begun before the impact.
Synapsid, yes I had read that the Deccan Traps lasted between, 600,000 and 800,000 years if my memory serves me correct, but I did not know that they had been dated that closely as related to the Chicxulub strike.
And I have fallen behind in my “keeping up” with my science on the subject. What is the latest scientific opinion on what caused the K-T Extinction? I can remember a few years ago there was still a fierce debate on the subject and the meteor people seemed to be winning.
METEORITE people please. A meteor is an asteroid, or other object, that vaporizes on entry into the atmosphere; think “shooting stars” if you wish. If a meteor survives the big plunge and lands it`s then known as a meteorite. Sorry but I had to say it Ron.
Doug, I thought about that and a “meteorite strike” just didn’t sound right. Before it strikes it is a meteor, and only after it strikes is it a meteorite.
Or a meteor is something in motion, a meteorite is something at rest.
Meteor Slams Moon, Creates 59-Foot-Wide Crater: Before and After Video
So Doug, you should write those fools and tell them it was a meteorite that slammed the moon, not a meteor. 😉
Ron,
Mass extinctions are recorded in the fossil record and that is found in sedimentary rocks. The Deccan traps, like those at the end of the Permian and of the Triassic, and like the Columbia River basalts in the Miocene, are a stack of flows each of which records a major eruption. The time between eruptions could be years, decades, centuries, millennia–long enough for landscape development with whole ecosystems sometimes, and these leave interbeds (sedimentary units) which contain fossils. Some of the interbeds within the Deccan traps contain fossil evidence of the K/T extinction; this tells us that the lower basalt flows predate the extinction and the overlying flows formed afterward. Even without the radiometric dating (and that’s pretty precise now, for all three of the mass extinctions I referred to) we can tell that the eruptions began before the Chicxulub impact.
As to terminology, in the interest of alleviating Doug L’s anguish, the impactor was about ten kilometers across and we call those critters asteroids, usually. Think of Mont Blanc or Mt Rainier coming in at 50 000 miles and hour, to get the picture.
What caused the extinction is the big question and the answer is going to have lots of parts. A mass extinction, especially one the scale of the end-Permian one, represents a shock to the whole biosphere, terrestrial and marine; there will be no single cause. The giant basalt outflows set the stage. The gases released (CO2, H2O, HCl, CH4, SO2 and others) are going to interact with the atmosphere, the oceans, land and marine plants and animals; and they’re going to do it in multiple ways. We see that just with current CO2 release: it’s a greenhouse gas and affects the biosphere and the hydrosphere that way, and it acts to acidify oceans and other bodies of water when it dissolves in them. Add in any other interactions, and interactions between them, and then play the changes on the other gases too, and you can begin to see that the effects are many and complex. And that’s just the gases. Those basalt flows modify the landscape directly, removing vegetation (and curtailing its activities as source and sink of gases, as source of oxygen, as habitat) and changing patterns of streamflow and drainage…
Well, you get the picture. If the solution to the question were simple we’d have arrived at it by now. The Chicxulub impact happened during the biotic crisis at the end of the Cretaceous and no doubt added its two cents worth, but there was not an impact that we’ve evidence of during the other two mass extinctions I’ve mentioned, and one of those was the biggest of all.
A huge explosive blow from space which could obliterate dinosaurs–that’s sexy to the media and it’s what we’ve heard about ever since Walter Alvarez and his colleagues proposed it. It certainly occurred and has been taken seriously by the research community, and we’ve learned a lot from the large number of studies in lots of fields that have been devoted to it, including investigation of other episodes of mass extinction, and that’s allowed us to supply context and scale and to see that the K/T extinction would have occurred without any impact at all. That’s a big step.
All of which isn’t to say that there’s complete agreement, of course, but the case for the large basalt flows being the framework is pretty widely accepted and, if anything, gaining in acceptance.
Ron,
Make that “50 000 miles an hour”.
blasted computer–does what you tell it to instead of what it’s supposed to do
That was a fun read, Synapsid.
That’s going to spoil a picnic.
For extinctions we need a killer, a gun, and a bullet.
The killer is unknown. It is the ultimate cause. It has been proposed from Galactic causes, Solar System causes, to internal Earth mantle dynamics.
The gun (the general mechanism) is likely to be large scale flood-basalt eruptions (as we all three agree), although others propose different guns like meteorites.
The bullet (the actual cause of death) for marine life is thought to be ocean acidification from sulphur acidic rains. For land life a favored theory is a volcanic winter with reduced surface insolation, cold, and acid rain exacting a huge toll on vegetation with collapse of the trophic chain. Since CO2 became a usual suspect an alternative explanation is an abrupt raise in CO2 leading a global warming. This explanation has little support from available evidence.
Make that “hundreds of thousands”.
We have absolutely no evidence that CO2 ever caused any extinction.
Au contraire!
http://theconversation.com/another-link-between-co2-and-mass-extinctions-of-species-12906
And the Medieval Warm Period being warmer than now doesn’t stand up to data:
http://www.skepticalscience.com/print.php?r=31
Do I detect the smell of a denier?
That doesn’t hold up to scrutiny. I can show you the effect of Mt. Pinatubo on 1991 temperature records. Can you show me the effect of Mt. Pinatubo on 1991 CO2 records?
Then, mine is bigger than yours.
I detect the smell of a cultist and a not very adept one.
Data from a peer reviewed paper?
If not, we are in What’s land.
Stratospheric sulfate aerosols in high altitudes cooled the planet slightly, but CO2 made its steady rise, with the observable results in temperature..
Is that clear?
The 95% of GCMs that failed were likely “peer reviewed”. Didn’t help much did it?
They did underestimate the rate of change.
It is faster than most realized.
So you do have a point, even if is counter to your view.
I shall be kind this time, but you are asking what you are not giving.
The Impact of Mount Pinatubo on World-Wide Temperatures
D. E. Parker et al. 1996. Int. J. of Climat. 16 487.
Global Cooling After the Eruption of Mount Pinatubo: A Test of Climate Feedback by Water Vapor.
B.J. Soden et al. 2002 Science 296 727.
Come now my challenged friend, we got cooling from the sulfur dioxide:
The 1991 eruption of Mount Pinatubo has received considerable attention by Earth scientists due to the enormous amount of sulfur dioxide that was injected into the stratosphere by this volcano. Satellite data suggest that at least 1.7 x 10⁷ tons of SO2 were released. Interestingly, this is much more that one would expect based on the measured sulfur content of the melt prior to and after the eruption, as seen in melt inclusions and in samples of degassed magma. Similar observations during a number of recent volcanic eruptions have led to the suggestion that prior to eruption most of the sulfur was present in a hydrous fluid phase inside the magma chamber. This would imply that hydrous fluids are very efficient in extracting sulfur from a melt; moreover, the distribution of sulfur between fluid and melt at high pressure inside the magma chamber would ultimately determine the sulfur release during eruption. Since SO2 is readily oxidized to sulphate aerosoles in the stratosphere, which are very efficient in blocking solar radiation and inducing global cooling, it would be interesting to study the distribution of sulfur between silicate melts and fluids at the conditions prevailing in magma chambers, i.e. up to several kbar and about 900°C.
What are babbling about water vapor? (on a almost 20 year old paper)
Hint: It might be time to lay down your cards, and show us what you have, as most of us don’t have copies of a 1996 Paper in Geo Science.
And why is a paper on a 1991 Volcano so overwhelmingly important in its data to override 100+ years of physics and climatology.
(If you don’t want to embarrass yourself, I understand)
To be fair I did a search on google scholar and easily found and downloaded the paper, haven’t read it in its entirety as of yet.
It is time for Javier to lay down his cards and post his CV to prove he is an actual scientist. This whole thing looks like a fraud to me.
You seem to lose track of your own reasonings. Let me refresh:
1. I say we have absolutely no evidence that CO2 ever caused any extinction.
2. You bring one press link that supposedly is evidence of a CO2 link with mass-extinctions through volcanoes.
3. I tell you that a volcano produces a noticeable global cooling effect while is not detected in the CO2 very sensitive measures. I bring a temperature record figure and two scientific papers to prove it.
4. You not only fail to produce any evidence supporting your supposed link between CO2 and extinctions, and fail to produce any evidence of the effect of Pinatubo on CO2 records, but declare that the cooling was due to sulfur oxide and claim victory.
I stand on what I say.
– There is no evidence that CO2 has ever caused any extinction.
– Volcanos (Pinatubo as example) produce measurable global cooling while they do not produce measurable global CO2 increase, supporting that the possible impact of volcanos through global temperature cooling is much larger than through global CO2 levels.
You have brought nothing of value to this discussion and are not able to even keep track of your own reasoning. I hate to waste my time and you are a waste of time. You are the one that is challenged. You won’t get anymore of my time.
I am going to agree with Javier on this one.
Year Without a Summer
The year 1816 is known as the Year Without a Summer (also the Poverty Year, the Summer that Never Was, Year There Was No Summer, and Eighteen Hundred and Froze to Death[1]), because of severe climate abnormalities that caused average global temperatures to decrease by 0.4–0.7 °C (0.7–1.3 °F).[2] This resulted in major food shortages across the Northern Hemisphere.[3] Evidence suggests the anomaly was predominantly a volcanic winter event caused by the massive 1815 eruption of Mount Tambora in the Dutch East Indies (Indonesia), the largest eruption in at least 1,300 years.
I think you are delusional, and are ignoring evidence.
Of course volcanos produce cooling- by sulfur and particulates that block sunlight.
Basic science.
You did not refute one example in the link. I gave the evidence.
You ar a hopeless denier, out of touch with 99% of climate scientists.
Of course the 1816 even produced cooling– massive particulates in the atmosphere.
(The Toba Event 70 thousand years ago almost led to our extinction, we can see it in the genetic record)
http://en.wikipedia.org/wiki/Toba_catastrophe_theory
And I still don’t see any cards.
Where is the beef, as Sir Ronnie The Lessor mumbled during a Electronic Nuremberg Rally.
(Mann 2009)
https://www.youtube.com/watch?v=WMqc7PCJ-nc
I guess the Skeptical science blogger didn’t hear about the Greenland colony’s demise after the medieval warm turned into an ice age.
Dear Astute Readers
This from Joel M. by way of Charles High Smith:
‘Karl Popper observed that there are clock problems and cloud problems. Clock problems can be divided into parts, but cloud problems are indivisible emergent systems. A culture problem is a cloud, so is a personality, an era and a social environment.
Since it is easier to think deductively, most people try to turn cloud problems into clock problems, but a few people are able to look at a complex situation, grasp the gist and clarify it by naming what is going on.’
I think this is similar to something I said previously…get the big picture and then do the dissection.
Don Stewart
PS Also explains why it is so difficult to do something like lose weight, or become more friendly, or stop doing stupid things which waste one’s time.
As I see what my various Facebook friends post in terms of news items that interest them, I see that even though they tend to be similar politically, they differ on what’s the most important cause to them. Some care most about LGBT issues. Some care most about environmental issues. Some care most about health care. Some care most about income inequality.
I can’t think of a time since WWII where the country had a single focus. So getting everyone to agree on the country or world’s most pressing problem, and then getting them to agree on possible solutions, probably isn’t going to happen until they can easily link a specific threat to their personal survival.
On the other hand, there are lifestyle changing activities that happen bit by bit and at some point reach a tipping point where the entire economy has shifted. Personal computers, the Internet and mobile phones were just such things. Solar power could be another.
Being dependent on solar power could make people use a tablet after dusk for a couple of hours, then go to bed around 10, and get up just before dawn to dust off their solar panels. It’s definitely a different lifestyle.
Being dependent on solar power could make people use a tablet after dusk for a couple of hours, then go to bed around 10, and get up just before dawn to dust off their solar panels. It’s definitely a different lifestyle.
It is a different lifestyle. But going off-grid is catching on. Tiny houses. Fewer appliances and using solar and batteries to power the electrical ones. Some do it to save money. Some do it for environmental reasons. Some do it for the challenge. There’s a growing group of people finding freedom in owning less stuff.
I’m pretty sure about 50 % of the world’s population will love getting a free solar panel and a large battery for their shack. Hell, I’ll take one and use it to sell a cell phone charging service at the beach.
Hell, I’ll take one and use it to sell a cell phone charging service at the beach.
Hey, I say go for it! I actually know a couple of kids who did exactly that. It’s like the modern day version of the old lemonade stand.
It really doesn’t take a whole lot of power to charge batteries that will keep your tablet, cell phone, Leds, mp3 player, and a small fridge for cold beer… going all night long and then some if you should so desire. I know because I have done it with only a couple of hundred Watts of PV, a cheap solar charger, a couple of deep cycle 12 volt marine batteries and a 1000 Watt pure sine inverter! Total cost under $800.00. Don’t remember ever having had to dust off my panels either.
So you can still read, study, write, listen to music and dance, or just sit outside by a nice campfire on the beach looking at the stars while strumming your guitar and singing with your friends. The lifestyles that most of us are living now aren’t necessarily all that great, at least as far as I’m concerned.
Dear Caelan Macintyre
I do not know if humans have the sapience to handle all the energy that cheap fusion would give us. I rather doubt it. We might just use all the energy to destroy all the things which make life on this planet possible.
Don Stewart
Yes, Don, more of the same. That’s what we spoke about.
I very much doubt the Dyson Sphere is within our capacities as a species. Fun to fantasize about for some, though. But fusion is a close second to the sphere. Ain’t gonna happen.
Like the Speed of Light, it is a constant:
Always 20 years away.
To be more clear; I am not saying we won’t necessarily come up with it, just that if we do, we are going to break the planet. With fossil fuels, we are just wrecking it. No biggie.
I’m just pointing out, on a matter of scale, we have major barriers to cross, that are quite challenging.
Probably a moot point.
It’s is rather humorous we have a climate science skeptic as a population commentator.
Who said late stage capitalism wouldn’t be surreal, if not tragic?
And the climate science
skepticDENIER, moonlighting as a population expert, just got a great big, juicy, guest posting at the top of one of the most visible peak oil websites on the internet. Cat’s and dogs living together. Oh my.What the hell is going on?
This epic comedy/tragedy constitutes prima fascia evidence that we are already in collapse, folks. 🙂 🙁
What the hell is going on?
Maybe the human species has finally stopped taking itself seriously?
It is quite disturbing, and I guess, as sign of how far we have fallen.
Orwell would be blushing.
Speaking of Orwell.
MEMORY HOLE
http://peakoilbarrel.com/the-problem-of-the-human-population/comment-page-1/#comment-508376
Yep! But to be fair to the skeptics the evidence for anthropogenic climate change is still very sketchy…
http://www.scientificamerican.com/article/earth-will-cross-the-climate-danger-threshold-by-2036/
Fred–
The article is not questioning climate change, it questioning when we will cross the point of no return.
And it is from 2008, as I remember.
From the article:
Global warming continues unabated, and it remains an urgent problem.
And it is from 2008, as I remember.
Nope! That article is about a year old!
Earth Will Cross the Climate Danger Threshold by 2036
The rate of global temperature rise may have hit a plateau, but a climate crisis still looms in the near future
Mar 18, 2014 |By Michael E. Mann
And I seriously doubt anthropogenic climate change has become any less of an urgent issue within the last year and that, despite the concerted and incessant campaign of outright denialism by so called free market think tanks, the media and corporations with vested interests in BAU, mostly from the fossil fuel industries but certainly not exclusively from them.
Which BTW makes this particular post on the ‘Problem of Human Population’ by Javier here on POB all the more ironic. Quite frankly I’m not quite sure what to make of it but I do have a sense of humor and I’m aware that ironic humor is a most difficult feat to pull off well. Perhaps Javier is just an excellent jester and he is hell bent on pulling our collective legs.
IRONIC HUMOUR: HOW TO LOSE PEOPLE AND ALIENATE CATS
https://rudhro.wordpress.com/2011/08/07/irony-as-humour/
An ironic statement must appear as if you are sincere, there must be no hint of sarcasm, and you must not be self-consciously droll. The line must be delivered straight, so that the recipient misses the hidden message but onlookers get it loud and clear.
For example:
CO2 is good for plants! Yep! And H2O is good for people…
but if you get too much of it you can fucking drown.
Anyways, have a nice Sunday folks!
Come now Fred, it supports global warming.
Lets be a bit more honest!
Javier is hardly a jester, more like a Merchant of Doubt.
But humans discount the future, live by story and myth, think heuristically rather than critically , and, while these traits brought genetic fitness in he past, they are now liabilities.
Come now Fred, it supports global warming.
Yes, my friend, I actually know that, and that is precisely what makes it so ironic and funny >;-)
Think about it, a guy with a PhD in microbiology and molecular biology who is concerned about human population, telling the readers of a Peak Oil blog that CO2 is good for plants, and that climate change isn’t something any of us should be worried about and he has the support of a self proclaimed genius petroleum engineer. Come now, cytochrome C, do you fail to see the irony here?!
Perhaps we could ask him to help elucidate for us the function of cytochrome C in the cellular respiration of Cyanobacteria, eh?
Hi Fred.
“Come now, cytochrome C, do you fail to see the irony here?!”
What I have failed to see is Javier’s CV.
Javier holds a PhD in Biochemistry and Molecular Biology and has been a scientist for 30 years in molecular genetics and neurobiology.
This is very hard for me to believe. I have never heard a real scientist ‘reason’ the way Javier does. I’m not saying for sure he is lying. Maybe he is a real scientist. If so, he should step up and prove it now.
As Rune Livkern would say: Tick tock, tick tock.
“Which BTW makes this particular post on the ‘Problem of Human Population’ by Javier here on POB all the more ironic. Quite frankly I’m not quite sure what to make of it…”
I keep kicking his butt,and my foot is getting sore, and he keeps coming back.
Perhaps a Jackass?
I asked Javier for his CV and Ron threw my request in the trash. This whole site is a fraud.
I update a graph Mann used at Bristol a while back
http://21stcenturysocialcritic.blogspot.com.es/p/screen-shot-mann-at-cabot-with.html
I think he’s a really interesting character.
I think he’s a really interesting character.
I agree, but not nearly as interesting as you! I drew a red line through the data and as hard as I try I can’t see anything but a continued increase in global temperatures. Granted at a somewhat slower rate than originally predicted but increasing nonetheless.
Furthermore it looks like the data confirm an increase of approximately 0.8 deg C which by coincidence happens to be what the current consensus amongst reputable climate scientists is, with most of that warming showing up in the latter part of the 20th century and early 21st century.
Don’t see any cooling trend in that graph, does anyone else?
Hi Fred:
I see exactly the same trend as you. Moreover, as you know, this is well established. Perhaps the key here is “Reputable Climate Scientists” because I’ve yet to see a CREDITABLE claim to the contrary — on Ron’s Blog or anywhere else.
Why are you guys talking about Mann?
Would anybody else here like to see Javier’s CV?
Hey Fernando, Fred, and Doug.
Why are you guys trying to help cover up the fact that Javier is not a real scientist?
Fred M., I saw Mann’s Bristol lecture and I thought it was rather odd to see a set of slides, prepared for a lecture in 2014, missing the temperature data after 2005.
So I grabbed the screen print, gridded his graph, and put in the NOAA data set. When I did it I saw the reason why he didn’t show data beyond 2005…it weakens his case.
He wanted the audience to have confidence in climate models, which he uses almost exclusively in the work he does nowadays.
I also wrote a critique of his Sci American article, False Hope, in which he used a pretty slick set of figures to confuse the readership and raise what I call climate hysteria. I think a lot of what he writes has to be parsed, and looked at extremely careful because it’s loaded with propaganda, and it uses the visual techniques we see in that Bristol lecture.
In other words, I don’t trust what the guy writes, and I read it mostly as an exercise to teach myself how to discern bullshit from reality.
In other words, I don’t trust what the guy writes, and I read it mostly as an exercise to teach myself how to discern bullshit from reality.
Fair enough, you are certainly entitled to your opinion!
Then just for shits and giggles why don’t you go discuss your theory here:
http://www.realclimate.org/index.php/archives/2015/02/climate-oscillations-and-the-global-warming-faux-pause/
Nothing can go wrong…..go wrong……go wrong……….
If civilization is a big red ball and the flat plane of which it rolls upon is fossil fuel .
So as the ball starts to travel the slope of the plane becomes more of a upward angle .
Eventually the ball will stop [cost is even stephen ]
That is where we could be at, with our time in fossil fuel history..FFH…
When the big red ball starts to roll backdown the slope. it will start to pickup speed….
My simple analogie…Bill
Dutch Blackout
http://www.wsj.com/articles/major-power-outage-in-amsterdam-halts-trains-hits-flights-1427452085
Power Outage Halts Trains, Planes and Trams in Amsterdam
Large part of North Holland province was also hit by blackout
AMSTERDAM—Trains, trams and planes ground to a temporary halt Friday in and around Amsterdam as a huge power outage hit the Dutch capital and surrounding towns.
Dutch electricity network administrator TenneT Holding B.V. said that a large part of North Holland province, which is home to some 2.7 million people, was hit by the outage. TenneT said the cause was an outage at a high-voltage power station in the town of Diemen, just outside Amsterdam.
Cause by a sub-station? This sounds like a cascading failure, would require more than a single point failure along with just one backup failure.
It raises the question how wind and solar comes into play. Anybody have any more in depth information.
It also raises the problems with relying too much on one form of energy supply, and the need of more back up systems.
Cause was a grid overload. It was probably a coal plant refusing to shut down when it was ordered to do it by the grid management.
Is it too late to cope with Peak Oil?
Well, personal transportation accounts for the majority of oil consumption.
Personal transportation is easily done with EVs – a Chevy Volt costs less to own and operate than the average US passenger vehicle, and gets 200MPG. A Nissan Leaf is the lowest cost vehicle on the road.
EVs can be ramped up pretty quickly – They’re 3-4% of sales right now (including hybrids). Production volume could be doubled essentially overnight, and doubled every two years thereafter. In 8 years you could be at 80% of new vehicles, and in another 5 years they’d account for 50% of vehicle miles driven. In another 6 years they’d account for 75% (vehicles less than 6 years old account for 50% of VMT). Ethanol accounts for about 10% of passenger transportation fuel, so a fleet of Chevy Volts could be powered with no oil at all.
There’s a pretty straightforward path forward, if we needed a short term fix to get us through a period of fast depletion, or another oil shock while we were transitioning to EVs. The US could reduce passenger fuel consumption by 50% essentially overnight by raising the average passengers per vehicle from 1.2 to 2.4. Look at Uber, look at smartphones for connecting with people. There are very, very few destinations in the US that no one else is going to. On almost any road, look around: there are other people on the road, going in the same direction.
With an ad hoc smartphone based system, you could find someone going in your direction almost anywhere. And, even with old-fashioned employer-based systems, about 10% of Americans carpool to work right now.
Carpooling – the horror.
Oil is dirty, expensive and as we see from this Post, very, very risky to depend on. We should kick the habit ASAP.
If we convert to 80% EV’s in 8 years. Wouldn’t that blow up any model used for peak coal and peak natural gas since it would take a whole lot of both to replace the energy oil use to provide. Most power plants around the world are currently burning coal or natural gas. I’m not seeing how EV’s are going to save us from peak oil. I’m not seeing how anything will save us from peak oil. From what i understand it would take 500 more nuclear power plants than the 100 or so the entire world has in operations just to replace the oil the US is currently importing not replacing any of our current oil production just what we currently import. Just think how many nuclear power plants it would take to replace the whole worlds oil needs with EV’s.
BAU is going over the Seneca Cliff. It’s hard to except that but it is what it is.
EVs don’t need that much power. They use about 20% as many BTUs as the average US car.
2.9 trillion vehicle miles travelled per year in the US. 3 miles per kWh. it adds up to about 25% more kWhs than the average US grid output (450GW). Not a big deal, in the bigger picture.
Is there even enough rare earth minerals to make 80% of personal vehicles EV’s worldwide? Is there enough to just make 80% of US personal vehicles EV’s?
Rare earth minerals will become quite expensive to mine in a post peak oil world.
Is there even enough rare earth minerals to make 80% of personal vehicles EV’s worldwide?
And in the meantime I’m heading to the beach on my human powered bamboo bike >;-)
Fred, Don’t Nissan Leafs and other EV batteries only last so long then have to be replaced? Even if they can be recycled. I’d assume it’s not 100% and how many times can a EV battery be recycled would be a good question. I think the reason EV aren’t wide spread is because they know there is a very limited amount of them that can be produced an just as in oil there will be peakEV’s due to limited resources.
This was a recent comment on peakoilbarrel:
“Despite the fact that Bolivia alone has enough lithium reserves for 4.8 billion electric cars and that lithium can be recycled from old batteries (it doesn’t disappear after use like oil), some people are concerned about our civilization’s increased dependence on the soft silver-white metal.” Bolivia might have the largest known reserves but they are not the only game in town and in fact, it is believed that there are deposits in Afghanistan that may be even larger than those in Bolivia.
http://www.treehugger.com/cars/vast-reserves-lithium-found-wyoming-could-meet-all-us-demand.html
This web page shows the countries with the largest lithium reserves worldwide as estimated in 2014
http://www.statista.com/statistics/268790/countries-with-the-largest-lithium-reserves-worldwide/
and another page depicts the countries with the largest mine production of lithium worldwide from 2010 to 2014.
http://www.statista.com/statistics/268789/countries-with-the-largest-production-output-of-lithium/
Bolivia and Afghanistan aren’t on either page.
As far as rare earths go, they are not necessary for making EVs, despite the fact that many do use them. The Tesla Model S uses plain old induction motors in it’s drive train, not a rare earth to be found in those motors.”
Green Capitalism: The God That Failed
“Green capitalism proponents often take it as an article of faith that technological breakthroughs will enable us to sharply cut resource use, to ‘dematerialize’ production and, in the words of the Stern Review, to ‘decouple growth from greenhouse gas emissions’ such that production can grow forever while resource consumption declines. While no doubt there are many green technological miracles on the horizon, they cannot save us so long as we live in a capitalist economy. That’s because under capitalism… there is no assurance that greater energy efficiency or materialist conservation would mean less consumption or less pollution so long as there is no extra market limit set to the growth of overall production. Efficiency gains could just as easily enable producers to use saved resources to expand production even more instead of ‘saving’ resources. And, given capitalism, there is every incentive to do just that and every penalty for failing to do so. Secondly, the prospects for ‘dematerialization’ are extremely limited, often completely impossible, outside of a very few industries. Thirdly, in many instances where companies actually adopt clean production technologies or waste minimization, such ‘green practices’ are beside the point because the main causes of pollution are the products the company produces, such as toxic pesticides, not the process of producing them. And fourthly, ‘green’ industries often just create new problems in the place of old…
To make matters worse, vehicle pollution is not confined to what comes out of the tailpipe. A life cycle study of the automobile done by the Umwelt-und Prognose-Institut of Heidelberg, Germany, in 1993 found that only 40 percent of an average car’s pollution is emitted during the car’s ‘driving’ life stage. The other 60 percent results from other life stages: the extraction of raw materials, the transport of raw materials, the manufacturing of the car and the disposal of the car. Most of the pollution any car will ever produce, 56 percent, is generated in the manufacturing process, before the car even arrives at the showroom – in the production of all the steel, aluminum, copper and other metals, glass, rubber, plastic, paint and other resources that go into every automobile, and in the manufacturing process itself. Cars produce 56 percent of all the pollution they will ever produce before they ever hit the road, and 4 percent after they are retired and junked. So even if automakers could produce dramatically lighter and more fuel-efficient cars, so long as they are free to produce automobiles without limit, more cars will just mean more pollution, even if they are hybrids or plug-in electric cars…
To further confound green hopes for an electric-car tech fix, it turns out that electric cars could be even be more polluting than the current generation of gasoline-powered cars. That’s because electric cars are only as clean as the fuel used to produce the electricity they run on. And in the real world, plug-in electric cars are in most countries largely coal-powered cars and likely to become increasingly so. Thus, paradoxically, in the real world of today, gasoline-powered cars produce fewer emissions than electric cars. Scientists at Oxford University recently modeled projected emissions from battery electric vehicles given different power generation mixes and concluded that if countries like India and China powered their automobilization booms with battery electric vehicles, this would be actually produce more CO2 emissions than if they did so with conventional petroleum-powered vehicles. That’s because coal is the dirtiest of fossil fuels, far dirtier than gasoline. But, according to the International Energy Agency (IEA), the share of coal used for global electricity generation is likely to grow. According to the IEA, in 2006, coal accounted for 41 percent of electricity generation fuel, natural gas 20 percent, hydropower 16 percent, nuclear 15 percent and ‘other’ (including renewables) 2 percent. By 2030, the IEA predicts that coal’s share will rise to 44 percent of electricity generation, gas will account for 20 percent, hydropower 14 percent, nuclear 10 percent, with ‘other’ rising only to 9 percent. And because oil is slated to run out long before coal, coal’s share could rise further. So electricity generation is likely to remain a dirty business for a long time, and, indeed, the share of electricity generated by the dirtiest fuel, coal, is likely to increase.
Finally, if we turn to the actual production of electric vehicles, it turns out that this process is heavily polluting as well. That’s because producing those nickel and lithium batteries, mining the iron and copper and rare earths that go into the motors and controls, not to mention the barely discussed problem of what to do with all the millions and eventually billions of large, toxic, worn-out batteries that have to end up somewhere, creates somewhat different resource consumption and pollution problems from those of gasoline and diesel engines, but by no means fewer problems. For example, each of the 1 million Priuses that Toyota sells in the United States has a battery that contains 32 pounds of nickel. Just the production of that one car, at current rates, is said to consume fully 1 percent of all the world’s annually produced nickel. And the mining and smelting of nickel is one of the most polluting of all industrial operations. Norilsk Nickel, a Russian company in northern Siberia, is the world’s largest producer of nickel and largest smelter of heavy metals. According to WorstPolluted.org, Norilsk is the seventh-most-polluted industrial site on the planet. The city (founded as a slave labor camp under Stalin), where the snow is black, the air tastes of sulphur and the life expectancy of workers is 10 years less than the Russian average, is one of the most unhealthy places in an unhealthy country. Production at that plant has poisoned the soil for 60 kilometers around the plant. Local adults and children suffer from numerous respiratory diseases, cancer, etc. A Norwegian government study reports that Norilsk’s sulfur dioxide emissions (2 million tons a year) produce acid rain around the Arctic circle. The company also discharges large amounts of copper and nickel – as well as cobalt, vanadium and other metals – into freshwater lakes and streams. And much ends up in the Arctic Ocean. And that’s just the nickel. Lithium mining is another nightmare. And then there’s the ‘rare earths’ nightmare.
In short, efforts to decrease air pollution by getting ‘old, polluting’ cars off the road only to replace them with new, ‘cleaner’ cars can be misguided because such efforts have typically focused on pollution emitted solely during the driving stage and thus have missed 60 percent of the problem. Also they have tended to overlook the pollution resulting from electricity generation. Seen in this light, I would not be surprised if the most ecological and efficient cars on the planet today are not those Toyota Priuses or Chevy Volts with their estimated 10-year lifespans but those ancient Chevrolets, Oldsmobiles and Fords cruising around the streets of Havana. For even if their gas mileage is lower than auto producer fleet averages today (which is by no means certain), they were still only produced once, whereas American ‘consumers’ have gone through an average of seven generations of cars since then, with all the manufacturing and disposal pollution that entailed. Surely an ecological society has to come up with cars, gas or electric or whatever, that that can be rebuilt, reused, upgraded and completely recycled when it’s most rational to do so instead of just crushed every few years so new ones can be sold.” ~ Richard Smith
Interesting article on oil by rail.
http://www.bloomberg.com/news/articles/2015-03-27/north-american-railroads-caught-by-speed-of-crude-oil-collapse
North American Railroads Caught by Speed of Crude-Oil Collapse
Demand for Bakken crude from U.S. East Coast refineries may decline as the price premium for imported Brent crude narrows. It costs about $2 to $3 a barrel to ship Brent by boat while hauling Bakken crude by train adds as much as $14 a barrel, PLG’s Robinson said. About 70 percent of Bakken crude now goes to East Coast refineries, he said.
“My suspicion is that the East Coast is going to get hit with more imports,” Robinson said.
snip
Union Pacific’s carloads of stone, sand and gravel, which includes frac sand, fell 6.3 percent in the last four weeks after jumping 22 percent last year. BNSF saw those types of carloads drop 3 percent after increasing 18 percent last year.
Is a Grid Dominated by Renewable Energy Achievable ‘in Our Lifetime’?
Julia Pyper, March 26, 2015, GreenTechMedia
Yes, it’s a political question.
Sure it’s ridiculous, but on another level, it’s not far from the truth.
This is the important point for those who think “watermelons” support renewable energy.
“The new energy world is not centered on the system but on the consumer,” said Utermöhlen.
The current, centrally owned and operated energy grid is more “communistic” than what Silicon Valley wants to do. Those Silicon Valley folks are more like Ayn Rands. They want to create a system that is quick to adapt, flexible, individually controlled, and makes them money.
Yes, it can be done by spending $72 trillion on storage batteries.
No, that’s highly unrealistic. There are several very distinct and different markets for storage. It confuses things enormously to mix them together.
There’s the need for extended seasonal storage, when both wind and sun are low for several weeks. That requires very low capital costs to provide a large capacity, but efficiency isn’t very important, as it would only provide 5% or less of the annual kWhs supplied. Batteries are a non-starter here due to their high capital costs – no sensible grid system operator would consider them for this application. Hydrogen is perfect for this, either mixed with methane, or stored underground, and burned in cheap engines (not high cost fuel cells). These are well proven technologies. On the other hand, we may need much less of it than one might think, as other cheaper strategies may solve most of the problem, including Demand Response (aka Demand Side Management), weather forecasting, long distance averaging, V2G, etc, etc.
There’s the need for daily storage, to deal with daily variation. That needs high efficiency, as the percent of power that is cycled through it will be higher. On the other hand, it’s maximum capacity will be much, much lower, so it can accept higher capital costs. Batteries will work well for this, particularly those already sold as part of EVs. Pumped storage is an obvious solution for this, and hydrogen (despite lower efficiency) might work as well. This area will be very dynamic in years to come.
Finally, there’s personal transportation, which needs high energy and power density, and can accept high capital costs. Here batteries will do well, and hydrogen is a non-starter.
I take it you don’t know the cost of hydrogen generation and storage. The oil industry uses hydrogen generated using methane feedstock. The hydrogen plant and storage cells are extremely dangerous, so they have to be placed at a fair distance from the other plant areas.
In venezuela we figured out the hydrogen plant should be two km away to make sure a hydrogen explosion wouldn’t wreck the full plant. The hydrogen molecule is extremely small, it escapes containment, and it requires specialty steels and seals. Your proposed solution sure sounds more like science fiction.
Japan already has 100,000 home fuel cell installations in place, and is selling Hydrogen vehicles to the public. Fact not fiction.
http://www.bloomberg.com/news/articles/2014-12-09/japan-promotes-home-fuel-cell-on-path-to-hydrogen-society
http://www.autonews.com/article/20150302/OEM01/303029976/futuristic-handmade-mirai-represents-toyotas-rebirth
Correct,
It started during Expo 2005 in the Seto area and is fairly well established now. The Government plans to add 100 hydrogen stations under a new budget covering half of the installation costs all of which will be operational in 2015. I think all the major car companies (Japanese ones) are participating in this.
Fernando,
I can understand that after a long, hard career you don’t want to work hard in your retirement. But, why not actually read the comments you’re responding to, thinking about them, and replying with something relevant?
In this case – you’re talking about on-site, above ground hydrogen storage. I was talking about underground storage.
http://en.wikipedia.org/wiki/Underground_hydrogen_storage
And, if you put in a little effort, and used your engineering skills, you’d see that there are a lot of viable forms of synthetic fuel storage, such as methane, ammonia, etc. At the moment Germany is planning to inject H2 into their NG storage, which will work for relatively low concentrations of H2. Eventually they plan to use synthetic methane, but many other things would work as well.
European and Japanese technicians are also cooperating to develop new metal-hydride materials that can store hydrogen. A Norwegian friend of mine is participating in this research. I have zero (almost) knowledge about this but was roped into translating some applicable material from Japanese to English for the dude involved.
Ron and everybody:
Perhaps devoting LESS attention to what Futilistit (and/or the other name(s) he/she goes with) might help everyone see things calmer and clearer…
All know, irritating, attention seeking, egocentric individuals (there is a better term to describe than “individuals: regarding this specific case, but I am not going to use it this time…) function on exactly that: Attention.
Less of it – better for everybody and for this respectable forum!!!
Just a thought…just a thought.
Be well,
Petro
Whatever.
Ron, please get rid of futiliist. Who needs a psychotic blog?
I find him a refreshing beacon of reason.
But it is up to you——
I second cytochrome C’s contention, along with the idea of diversity versus monoculture. This is nevertheless with the qualification that Futilitist is not somehow working toward an answer as to how far the blog atmosphere can be ‘tweaked’, for example, before it gives (up Futilitist), (in which case it may then not matter either way would it?).
I find him a refreshing beacon of bacon. Kosher bacon.
Everyone is afraid of me. ha ha.
If i’m not mistaking Futilitist resides somewhere in the UK. North Sea produces about half of Britain’s energy and it’s in steep decline. All that expensive real estate is going to be hard to maintain. London’s banking an financial sectors are leveraged to the hilt. I imagine Futilitist doesn’t have to look to far to get high anxiety over where things are headed.
I note the crazy talk about Bakken and EFS being profitable at $42 and $30 WTI respectively has surfaced. Just when we thought the price had dropped low enough for this kind of nonsense to stop.
I ran a well over 60 months at 300,000 barrels of oil and 300,000 of gas at $42 WTI, $12 discount to NYMEX, and assumed cost of well borrowed at 6%. Assume 20% RI. After 60 months said well has netted UNDER $2 million. I used OPEX (LOE) and G&A from WLL and OAS 10K, 5.5% severance tax and assumed $8 million cost to drill and complete, which is a 20% discount from 2014 10K well costs.
Dennis, maybe you have some updated numbers on well productivity, now that we have final ND for 2014? I assume 300,000 barrels of oil in five years is still on the high side in ND Bakken.
Also, if anyone has any 2014 or prior years well by well data on EFS, would appreciate it.
I also note that ConocoPhillips showed a net loss from operations in North America in 2014. Found that interesting.
My recommendation is to ignore the crazy talk.
I think you are aware that even the numbers used in your example are still very optimistic. As a bit of an extreme case, consider for example Emerald Oil (a pure Bakken player), where, according to yahoo, the CEO is 36 and paying himself more than $2.6 million / year, or more than $2/BOE (2014 production) for just his own salary.
The average Three Forks well is doing less than 200 k bbls after 5 years, while the average Middle Bakken well is doing less than 250 k bbls for the same period.
the CEO is 36 and paying himself more than $2.6 million / year, or more than $2/BOE (2014 production) for just his own salary.
hahahah that’s hilarious
That’s the sort of thing that tempts the eventual lawsuits to say FRAUD.
Fraud is an important word. Lesser lawsuits than fraud can go after company assets. Fraud opens the door to “clawbacks”. Going after previous assets.
This guy needs some offshore accounts. Fast.
Watcher, this is not uncommon when it comes to small E&P’s. Pretty easy to find this stuff, really. I know I need to just give it a rest, but I just wish the pundits would read a 10K or two. They like to make fun of P.O., when the facts (numbers) are clearly showing how unsustainable things are.
Watcher. If you get the time, go look at what upper management teams in these shale companies are pulling down. Rare to find anyone in the top four not pulling down at least 500K. WLL top guy at $5.5 million and next three each are over $2 million.
Up thread Strummer said, hey, that’s the name of the game, and he is right.
Enno. Thanks.
What’s RI?
Royalty Interest.
Hi Shallow sands,
For the average 2010- 2012 Bakken/ Three Forks well I get about 200 kbo (oil only) for first 5 years. The average 2014 well was about 15% higher cumulative for the first 13 months. If we assume over 5 years it remains 15% higher (optimistic in my opinion), then for the 2014 average well we would have 230 kbo.
The 300 kbo estimate , might be correct over 11 years, but not 5 years.
The battle for the Middle East’s future begins in Yemen as Saudi Arabia jumps into the abyss
http://www.independent.co.uk/news/world/middle-east/the-battle-for-the-middle-easts-future-begins-in-yemen-as-saudi-arabia-jumps-into-the-abyss-10140145.html
A reminder that oil supplies are very unreliable.
We should kick the oil habit ASAP.
I guess Solar and Wind are looking better and better all the time. It might be time to begin making funeral arrangements for old man BAU who has been on life support for a while now and could pass away at any time. Hopefully, peacefully in his sleep. RIP!
Looked at Marathon Oil Corporation 2014 10K. Marathon has been around a long time, one of the largest independents. In my opinion a very strong company, better than the WLL of the world. They have 4 times the production than WLL but almost a billion less long term debt than WLL.
They have operations onshore and offshore worldwide. I have noticed that they have focused primarily on developing US shale in EFS, Bakken and OK resource plays. The 10K bears this out, that is where the CAPEX and production growth has been.
Although we all slam shale, me included, it appears that it has been and will continue to be favored by US oil companies given the possible returns and political risks in the rest of the world. For example, MRO has a big investment in Libya.
Marathon’s US production grew from 201,000 BOEPD to 238,000 BOEPD from 2013 to 2014. However, company wide fell from 486,000 BOEPD to 459,000 BOEPD from 2013 to 2014, as a result of divestment in Angola and Norway, as well as reduced international CAPEX.
Marathon also is involved in Canadian bitumen mining, which cost them $44.53 per barrel OPEX and $12.07 per barrel CAPEX in 2014. I assume when other costs are added, this means they are operating at a loss in this segment.
I looked at US realized prices for oil, ngl and natural gas in 2014 for Marathon. I then plugged in Friday’s prices and came up with a per BOE of $33.30. OPEX in 2014 was $10.25 in US. Production taxes $4.67. D,D &A $26.95. Could not find G & A, but given size of company I will estimate low side at $1.00. All of this is per BOE. So Friday close of business MRO looking at a loss of $7.23 per BOE if I cut production taxes in half to adjust for price plummeting.
The reality is, things are worse, as best I could tell actual CAPEX spent in 2014 in US was closer to $35 per BOE. I couldn’t find actual, so if someone does and I am wrong, please correct me.
Bottom line. A big independent like MRO, who has been all over the world for decades, has determined the best place for it to deploy capital is in US shale. Unfortunately right now that is unprofitable to the tune of over $7.00 per BOE at present. Keep in mind this ignores completely MRO entry costs, which were substantial.
Just some thoughts, now time to get to more productive stuff.
One would think Marathon understands the ups and downs and does not have an annual growth imperative. Simply that. They aren’t going to maneuver every day to make more money this year than last.
They will hunker down, and then expand, neither fast. Won’t be no dice rolling from these guys.
Watcher, if you are right their Cash flow is $20 per barrel. All they have to do is cut CAPEX spend to a small amount, pay dividends and shrink.
Well, they all face scarcity. They all cut CAPEX about 15 months ago, before the price fell.
Cutting divvies has its own obstacles, and as for “shrinking”, no one ever asks what share buybacks mean. There is lots of precedent for “shrink”.
They cut 8 rigs in EFS as well as a lesser number in Bakken and OK. They also let go 350-400 employees, all per 10K.
I agree, Fernando, they could eliminate CAPEX and have positive cash flow but I bet they would lose 20% of BOE in one year.
I assume they think this downturn will be over in less than a year?
We shall see.
Fernando,
But isn’t the problem the Shales plays face, is that such a large proportion of their CAPEX is tied up in drilling new wells that give most of their return in the first year or two, and then decline into oblivion.
So if a company cuts back severely on CAPEX, then their cash flow quickly declines. This may work for someone like Marathon with other assets, but the pure shale plays are very much caught in a catch 22. So they need to borrow more or disappear out the back door.
The thing I was getting at is that its appears MRO is heading down the shale play route. 238 of 459 thousand BOE per day in 2014. I suppose some could be legacy conventional, but I think they sold the majority of US lower 48 onshore several years ago.
My point is both MRO and COP have worldwide production in many different places. It appears the emphasis of both is US shale.
We know how challenging it is to make a profit in US shale. Yet these two companies
are headed that route. My take is that for various reasons, there are apparently few better places to deploy capital.
Seems like the futures players would be paying attention, instead of trying to drive WTI to $20.
Question is how long will investors, and to a lesser extent banks, continue to subsidize low oil and natural gas prices?
Did you see the following article from 3 months ago:
The Dangerous Economics of Shale Oil
http://www.istockanalyst.com/finance/story/7133444/the-dangerous-economics-of-shale-oil
I just saw it, and thought it was pretty good. I completely agree with the author that the game in shale is to depreciate less than the decline rates of the wells.
Enno. Thanks for the link. The link article is exactly what I have been harping on here since I first did the math myself.
The earnings per share data are greatly distorted, as I assume D, D & A is on a 7-10 year schedule. That is why I remove D, D & A and replace it with CAPEX per BOE. I think if one does this for the last five years, one finds that EOG, MRO, COP and the like need $50+ per boe to break even, with the oil heavy Bakken players needing $90+ per boe to break even. This, of course, does not include the steep land acquisition costs, nor the effect of income taxes paid when the distorted earnings cause income taxes to be generated. Keep in mind this is BOE, not barrels of oil. I think a lot of folks miss this when looking at company data. NGL’s are in the low $20’s and natural gas converted to BOE equivalent is now around $16. I computed current BOE for MRO to be $33 and change at current pricing.
Ron, maybe the author would update his article given that oil has dropped another $10 +/- and would let you post it?
I really cannot figure out why these companies, including one’s that have been around forever, such as COP and MRO (and XOM for that matter, through XTO) are going great guns on US shale, unless that is the best option. Assuming it is the best option, I see a violent reversal over $100 when the tipping point is passed. The longer it takes to get there, and is extended by more debt and equity issuance, the worse it will be.
Shallow, their focus on shale may be caused by the lack of suitable opportunities outside the USA.
A few years ago I was asked to consult for some Arabs with a pile of cash, they wanted to get into the “oil business”. I thought the future opportunities were pretty slim, even if they had connections. The only thing I could dream up was to get into the onshore heavy lift business. Other than that I can’t really suggest anything.
The latest Greek fling is underway. Their latest array of “reform” proposals were rejected by the EU. Greece FM has a meeting in Moscow upcoming.
There is a very dangerous moral issue that is getting more and more attention.
A lender has a moral responsibility not to lend to a borrower who cannot repay.
The obvious rebuttal point of the lender losing money if he does this is destroyed when you realize the lender printed that money from thin air and doesn’t have to care if he is not repaid, but he DOES impose a repayment requirement on the borrower and floats more and more debt to service that repayment requirement.
Greece dug their own hole and created their own nightmare, but . . . pretty much all bankruptcy filings in history will say that. The business or person ran up spending and didn’t have income and created their own nightmare.
And thus, bankruptcy. The business or individual starts over. The lenders are screwed, and amortize that screwing across all of their future loan portfolio terms.
There is no bankruptcy court for countries. A declaration of “bankruptcy” need not be recognized by anyone. Russia may get involved in this one in order to lease that little chunk of territory in Greece’s far north, to secure Southstream 2.0.
And so, this can’t strengthen the Euro, and thus biases the dollar upwards. Should be heavy on oil.
This is a RISK OFF event in the making. While i agree it’s is very Euro negative. It would also take interest rate hikes by the FED off the table. Dollar is a risk on trade now. Things would need to get really bad for dollar to take it’s traditional role as a safe haven. Look for Yen strength, gold strength cause gold weakness is the other side of the short Yen trade. Bonds would be well bid even if they are negative yielding. Stocks would crater, further Yen strength. Oil holds steady or is up! EUR/USD would move more on Euro weakness than dollar strength. You’d see the biggest move in EUR/JPY.
Watcher, If Greece calls for a referendum and they vote to leave the Euro that might just trigger the implosion of Japan. It would send the entire JGB’s curve deeply negative. BOJ would either have to end QE or buy bonds, $85 billion a month that are deeply in negative territory that couldn’t ever be allowed to leave negative territory. BOJ would face credibility issue. Causing Yen carry trade to unwind then Yen hyperinflation.
Not trading focused.
A Greece departure followed by stories and videos of Russian work up north and how no one is starving in Athens would be followed by Italy and Spain looking for haircuts on their accumulated debt.
This is why the moral issue has become so prominent. It ain’t just Greece.
Watcher,
The trokia is screwed either way. They give in, Italy and Spain will want better deals. If they don’t give in Greece is likely to call a referendum and leave eurozone. I see Greece leaving it’s just how long between now and then. Greece can’t repay and Germany, ECB, and IMF can’t really give in. This is going to happen. I follow trading to better understand where the wheels are going to fall off BAU first.
We’ve discussed what will happen when workers are laid off in ND. Here’s this article.
Fracking Town’s Desperate Laid-off Workers: ‘They Don’t Tell You It’s All a Lie’ | Alternet
“They don’t tell you it’s all a lie,” he said, sipping coffee in the Salvation Army on a frigid day in early March. “Places advertise jobs and then tell you they’re not hiring.”
Boomer,
Yep, it is a boom town gone bust. I find it interesting that people who are not directly involved in the oil industry would want to stay around ND. With the scale of the oilfield down turn, it is going to be very hard for everyone, but especially those with no skills or contacts.
When the 1986 bust hit, I was in Britain, I didn’t even bother looking for work, as there just wasn’t any. I just sold up and headed home. Of course it took me 12 months to get home, but it gave the industry time to recover and was lucky enough to break into the Aussie oilfield shortly after I got here.
The oilfield is boom, bust, but your first bust is always the hardest. Need to decide whether to stick it out, or mark it down to a life experience?
Warmers, watch this at your peril:
https://www.youtube.com/watch?v=JX6nDrqUKKA
It could cause your heads to explode. If Cruz becomes president, funding for climate science will come to a stop. Then it will all be over.
CO2 doesn’t care who is in office.
“Then it will all be over.” You got a half chuckle out of me on that one!
If Cruz becomes president, funding for climate science will come to a stop. Then it will all be over.
You do realize that there are other countries in the world where not everyone is a complete idiot, right?
Peddling this kind of political BS is only possible in a country where the general populace is mathematically and scientifically illiterate and critical thinking skills are virtually non existent, welcome to America! Might explain why The Solar Impulse project was born in Switzerland and not the US.
Fred,
Archibald is an Aussie commenting on presidential politics. Look up Larrikin.
Futilitist is gone. He won’t be back.
Thanks much Ron. I was starting to despair.
Thanks Ron. He who shall not be named’s badgering was making the blog unreadable. While we agreed on some points, the BWHill stuff and trying to force people to comment on it was truly irritating.
-Lloyd
Thanks Ron, that was really due.
I wanted to say something, but I was afraid I, too, would become the subject of harassment. So I ignored him.
However, when he started to get so insistent wanting feedback about his oil theories, I thought he might be having some sort of manic episode. He sounded like people not quite right in the head who think they have figured out the world.
Then when it was suggested that he was working on a Ph.D., I wondered if we were being subjected to some sort of ill-conceived social experiment.
At any rate, the guy was out of control and I am glad he is gone.
People, the comments are now all screwed up. I was deleting a bunch of Futilitist’s posts and apparently I deleted one that had a reply to it without being aware of the reply. When that happens that screws up the all comments and makes them appear as if it was an original comment instead of a reply.
That’s the bad news. The good news is Futilitist is gone forever. I just got tired of his shit and banned him.
I will have another post later today. It will be a short post because there is not much data to post about. But that will fix the comments problem.
Hi Ron,
EIA data is out for January showing large drop in North Slope: 524,000 down to 486,000 bbl/day YOY. Clearly, only one month but possibly significant. I’m now willing to bet (almost) the North Slope never sees 500,000 bbl/day produced again, ever.
2014 annual production was down to 479,000 bpd:
http://www.eia.gov/dnav/pet/hist/LeafHandler.ashx?n=pet&s=manfpak2&f=a
The 1988 to 2014 rate of decline was 5.4%/year.
I can think of all sorts of thoughts to write into words, but, for the most part, they pertain to the subject matter of oil, its supply, where it comes from, where it goes and the reasons to use it. I raise a raucous now and then to attempt some humor, not to interrupt anything, just for humorous aspects. If you can’t laugh, it’s a sad sitseeation. And, sometimes, it is peakbullshit, but not too much hyperbole. Sorry if it is too much at times.
The number one reason to use oil is agriculture, farmers prefer oil to fuel tractors than they prefer to breed workhorses that consume land to remain alive to do the work of a horse. 400 horsepower is better than two or a twenty mule team, takes much less manpower and work, believe it.
Whether or not humans should farm is downright insane, if you don’t have anything to eat and there is no immediate means to fill your stomach, you’ll go hunting for something that will fill the void, it’ll be a true gut feeling. You’ll make a bee line for the nearest farm, no other reason than to find something to eat.
The manufacturing industries will meet the demands of farmers, they’ll have tractors, combines, implements, everything.
The second reason is for transportation, some for leisure, most for economic reasons, move those goods, which includes a defense, the military.
Redacting is part of editing, censorship, it is Ron Patterson’s blog, not yours.
If the choice is to censor some content, there is probably good reason for such action.
Which, from time to time, is necessary, not all may agree, but that’s just too bad.
It’s pealoilbarrel.com, not peakfullofshituptoyourears.com.
🙂
Dear Folks
I would like to tie a few things together, if I can. I will try to explain why it is conceivable that oil, and fossil fuels, will essentially disappear from our economy.
I will begin with Nicole Foss’ 10 minute speech at the conference of Greens in Australia. That conference was billed as a debate between those who supported David Holmgren’s call for concerted action by a few people to bring the current system down. The vote of the crowd at the end of the debate favored a Green Tech strategy by quite a substantial margin. Nicole’s message was that collapse is going to happen, there is nothing you can do to prevent it, and it’s going to happen in the not too distant future, so there is no point in trying to accelerate it.
The pivot point for my explanation is Nicole’s forceful image that we are engaged in a game of financial musical chairs, but there is only one chair for every hundred players. And the insiders will get all the chairs when the music stops. Nicole says that we have 6 inches of actual collateral, but yards of debt. She also says that financial assets will collapse first, followed very shortly by physical assets.
You can read a variety of opinions to the effect that ‘the Central Banks are out of tricks’, and can’t keep the financial Ponzi going much longer. Gail Tverberg likens our situation to a dome made of sticks, each one supporting the other…pull out one and the whole structure collapses. Suspend your disbelief and assume that the jig really is up for the Debt Orgy. As Ron said, ‘if the financial system fails, everything stops’.
What would collateral look like where ‘everything has stopped’. We can think of the usual suspects such as the hideaway where we can grow food and wood for fuel and building and good soil so that the water is cleaned and we can drink. These are all pretty low tech. Living that way requires skills that most of us don’t have, but the technology is very basic. Would a piece of land in North Dakota or Texas which contained shale formations with some oil or gas in it have any value in that sort of world?
The problem is that, since everything has stopped, there would be no way to get the oil and gas out of the rocks. Even if we could get it out, there would be no practical use for it. A piece of salvaged tinfoil to make a solar oven for cooking would be more valuable.
What is the underlying reason why we might be approaching the end of the Debt Orgy? As usual, there are multiple factors. But, I suggest, the underlying reason is that, on multiple fronts, we are approaching Limits To Growth. The Daniel Lieberman article I referenced in an earlier post gives many examples why our use of fossil energy to make the world a more pleasant place for ourselves has created a world that is dangerous to us. He explains that the more comfortable our chair, the more damaging it is to our physiology. The more high-tech the running shoe, the more harm it does.
We use fossil energy to make and pull plows which create plow pans and anaerobic conditions in the soil which generate weeds, diseases, inadequate root depth, and a host of other problems. See Elaine Ingham for more details on all that. Elaine says that the only time that the Green Revolution increases yields is when one starts with ‘dead soil’, compacted and anaerobic with a poverty of the living critters and carbon which make up the soil food web.
Nate Hagens says that we modern North Americans use fossil energy to make devices with which we try to manipulate neurotransmitters and hormones which will make us feel good. The ancients were able to feel good without all the drama in the middle. We moderns, as Lieberman points out, have virtually invented the diseases of cancer, depression, ADHD, and autoimmune diseases. Maybe something is not working out very well? The US is approaching 21 percent of our GDP spend on health care, the overwhelming majority for the diseases of modernity.
If the Debt Orgy ends badly, and there is only one chair for every hundred people, and if ‘everything stops’, then all our complex gadgets will simply stop working…including oil wells and refining and distribution and the engines which use the oil and the roads we use for transport.
As I said before, I’m not here to defend BW Hill’s model, but the notion that society’s ability to pay for oil is now the limiting factor should not be dismissed as ‘irrational’ or ‘violates the laws of economics’. In my opinion, the best way to think about the situation is to use Mobus and Kalton’s explanation that energy makes possible the organization of components to get work done. The more energy, the more complex the organization can become over time as it evolves. If energy is subtracted, then the organization MUST become simpler.
A small drop in energy may mean that I hang onto the old car longer. It may mean that I begin to carpool. A big drop in energy (‘everything stops’) requires that drastic reorganization take place. It is quite possible that in that drastic reorganization there is no place for shale or Arctic or very deep water oil and gas…and thus no real future for petroleum.
Don Stewart
Link to Nicole Foss
http://holmgren.com.au/great-debate-the-video/
At the 35 minute point in the bottom video on the page
Link to Nate Hagens
https://www.youtube.com/watch?v=U1_dsU1Dx0A
Thanks for posting that, Don. I am well aware of both PRI article essays of David Holmgren and Nicole Foss, (Crash On Demand) and have just started the entire video debate as I type.
Debt goes unpaid all the time. It’s called bankruptcy, and it doesn’t end the world. The only people who get “burned” are the 1% who have the money to lend.
Before suggesting that the 1 % will stop lending money altogether, stop and think about what else they would do with their money.
John B, you are grossly underestimating debt. Of course a few debts go unpaid, just not very many of them. It was unpaid mortgage debt that almost sunk the economy in 2008. And the total sub-prime mortgage dept, the debt that almost sank the world economy, was only a small fraction of total debt.
And it is not the 1% that loans the money, it is retirement funds, publically held bonds, government bonds, corporate bonds, municipal bonds, and public deposits in the banks. That is the money you put in the bank, the bank then loans back out. So you, John B, are one of the lenders if you have money in the bank.
Oh if it were so simple as the top 1% loaning out their money then we could just tell them to fuck off and that would be the end of it. But no, almost everyone owns a piece of the total debt.
Oh if it were so simple as the top 1% loaning out their money then we could just tell them to fuck off and that would be the end of it.
To some extent, that is what the Federal Government does when it creates money out of thin air.
Personally, I try to get rid of cash, and keep all investments in stocks and real estate. As the Government creates more money, real assets increase in value.
Of course, defaulting on personal debt has real consequences. I wouldn’t recommend it.
Debt Clock: http://www.usdebtclock.org/
Ronald Reagan on US Debt (this was before he increased it substantially).
https://www.youtube.com/watch?v=qXBswFfh6AY
Debt goes unpaid all the time. It’s called bankruptcy, and it doesn’t end the world. The only people who get “burned” are the 1% who have the money to lend.
Before suggesting that the 1 % will stop lending money altogether, stop and think about what else they would do with their money.
Exactly.
And the world won’t stop if debt crashes because what else is the world going to do?
Sure, it will get disruptive, but it is the already wealthy won’t won’t get their money back, so it means they won’t be quite as wealthy.
The average person isn’t a saver anymore. And if he/she isn’t saving, he/she isn’t lending. If debt collapses, the average person isn’t going to lose any assets.
The more income inequality there is in the world, the more debt is concentrated in fewer hands. So the more the risk is concentrated into fewer hands, unless a government decides to absorb that risk and charge it to taxpayers, who may not have the money to cover the debt. But again, if the bottom falls out and the lenders get stuck with it, it is the rich who lose money, not the people who have no money to lose.
In the past, when there were runs on the banks, it’s because people had deposits in the banks. These days I’d say many people don’t have any savings. They use banks, but it is to transfer this month’s paycheck into this month’s bills. They probably don’t park their money in a bank long enough to try to take it out in a panic.
Now if the US government stops paying transfer payments because it decides it can’t, then the country comes to a halt. But I don’t think you’ll find a politician who would support that, even if they talk about it. The government will keep issuing checks. The system breaks down only if everyone stops taking money. But why would they suddenly do that? What event would suddenly make all money worthless?
All right !! All right !! I been reading about peakoil , before it was called peakoil .
Why so gloomy this morning ?
From my window i can see three buildings of differnt kinds going up.
Japan just launched a brand spanking new aircraft carrier 1000 feet or more long .
Some country said thier starting to make the largest container ship ever built and would carry 20,000 thousand containers..
Peak oil ..we dont need know stinking peakoil
Ill keep reading but its hard to believe all the downer stuff ..man ..
Thanks Ron..keep up the good work ..
Bill
There’s no global warming, because it was cold today.
Right on !!! Right on !!….no soup for you …
What time does the EIA monthly report come out? Ron, what are you expecting to see as far as growth/decline?
It should be out any minute now.
http://www.eia.gov/petroleum/supply/monthly
But I am getting a “This webpage is not available” error. Is anyone else having that problem?
Worked fine for me.
What doe the report say???? !!!
Doug, would it be possible for you to send me the Excel spreadsheet with the data. Just send it as an attachment. Please, that apparently is the only way I am going to get it.
Never mind. It was my DNS Server. I found a fix on the net.
Sent
Ditto but apparently all has been resolved.
Never mind, it was my DNS server.I found a fix on the net.
I still can’t see it. Can anyone tell me the headlines? Does not seem to have moved the market at all. Does that mean no production decline?
Looks like significant decline. Wait for Ron’s post to comment further, other than if I’m reading it right, Ron will be entitled to brag a little.
Ironically, EIA also hitting the airwaves with highest production growth in 100 years in 2014 meme. Will 2015 be the highest production decrease in 100 years?
Thanks. Still cannot access it for some reason. How much decline please? Looks like market didnt get the memo earlier with all the talk about 2014 increases….
I’m seeing 135,000+ bopd 12/14 to 1/15. I hope that is right, because no media coverage and WTI is down.
What I see per day is 12/14 – 9.320 million bopd
1/15 – 9.185 million bopd
Nick,
We have never ‘transitioned’ from one fuel to another. We’ve instead added not more fuels. Today we burn more wood than we did 200 years ago, and more coal than we did 100 years ago, despite having ‘transitioned’ from these fuels.
Which is why the actual transition away from fossil fuels will be entirely unlike any of the earlier changes, because we will actually be using less of certain energy sources, instead of just adding more to the mix. Despite your protestations, it is not yet evident that our current civilisation can be sustained without large scale use of fossil fuels.
ANYBODY INTERESTED is welcome to drop me an emial at old [email protected]. including their handle here. I am in the process now of starting an email round robin devoted to particular aspects of the sustainability question.
Post your blog address here when you get it up and running. I haven’t decided yet whether to share my email address, but perhaps I will send that to you.
I not sure how many people here keep close eye on what’s happening in China but their stock market is blasting off into orbit. Much speculation of more interest rate cuts on the way to prevent slow down in their economy and housing bust. Big problem with this is 75% of Chinese wealth is in real estate (75% of US wealth is in stocks and bonds by comparison). I’m sure everybody knows of all the Ghost cities that have been built. China needs money going into real estate instead of the stock market to prevent a housing bust. I’ll let you make your on conclusions what will happen if China continues to cut interest rates pushing money out of real estate into their stock market. Interest rate cuts just aren’t having the intended effect but they have little choice but to do them as their facing massive deflation due to over capacity from the money printing madness that followed 2008. I’ll also let you make your on conclusions of what a housing bust in China would do to commodity demand.
SAWDUST:
“I not sure how many people here keep close eye on what’s happening in China but…..”
I don’t pretend to be a China expert but I did live/work there seven years and still go back once or twice a year to visit old friends. Two things I suggest are that generalizations are dangerous and the housing bubble is an overblown issue. Moreover, I would be the last to say that there weren’t many large problems, I’ve seen them all, especially the corruption, but please be careful about sweeping statements. And, you might want to take the following into consideration:
1) The second biggest investment in China is education for children,
2) For every Engineer that graduates in the US, 20 graduate in China,
3) The average family in China will make almost any sacrifice for the sake of future generations,
4) The Middle Class in China is bigger than the US population and it is growing very rapidly,
5) Virtually every citizen is (far) better off than he/she was ten years ago and is positive about his/her future,
6) Most people in positions of authority have good educations (they’re not lawyers),
7) Infrastructure is expanding at an exponential rate (especially rail and subway systems),
I could go on .
You could also add that China is using 60% of world cement production. There’s no construction bubble!
Doug,
All i’m saying is it can’t go on forever. They can do things like 100 year mortgages, where it takes three generations to pay off a mortgage to help delay the day of reckoning. But all this exponential growth and bubble this and that are coming to an end. There are no means by which you can avoid financial collapse brought on by excessive credit creation they can only delay it and they can only delay it for so long. It’s going to happen. Their in a situation now where credit creation can no longer drive their economy forward.
There are no means by which you can avoid financial collapse brought on by excessive credit creation they can only delay it and they can only delay it for so long. It’s going to happen.
We will have bubbles that pop. We are due for one now. It could lead to another recession or even a depression.
But over the centuries, the economic system rebounds. So there is a difference between a recession or depression (which could take 10-20 years to play out) and a permanent financial collapse that ends all world economic activities. Now food, water, and energy scarcities could, and will likely, result in a permanent end to BAU. But I don’t think debt itself will be the cause.
The debt can’t be serviced not enough resources, i think that applies to every country. All debt is, is a claim on future resource energy in particular. So in reality debt is mostly a claim on the future use of oil.
All debt is, is a claim on future resource energy in particular. So in reality debt is mostly a claim on the future use of oil.
The creditors will lose money. And maybe they will stop lending money. But if most of the world is broke and is shut out of getting loans, then lack of credit won’t change their day-to-day existence.
Again, I am not saying that loss of oil won’t have an impact. I think it will have a huge impact.
But I don’t think civilization is doomed because of debt. Debt is a social construct. It isn’t a biological necessity.
Even though I read the arguments about how we are on the road to utter collapse, I am still interested in alternative energy technologies. I don’t care if they can’t support BAU.
I think it’s smart to be experimenting with solar and wind can do because I think we’ll need them. I am also very open to downsizing total energy consumption. We are powering a lot of stuff we really don’t need.
As for nuclear, I’m keeping an open mind. I was anti-nuclear, but if we need to reduce CO2 emissions, nuclear might be necessary. Aside from whatever safety and terrorism issues there might be, my main concern with it is that it continues the model of centralized energy generation and distribution. I think the grid needs to be reinvented, and nuclear isn’t likely to do that.
I think the world is changing even if we discount energy. Income inequality and automation mean the wealth is going to a small group of people and those people don’t need to hire the masses to do work. Therefore we have excess people in the world from a labor/wage standpoint (not even addressing resource-related carrying capacity).
In summary, I’m not focused on the hows and whys of the end of BAU. I accept that. So I am interested in what the alternative options will be. I see no particular value to me in focusing on the negative. I will focus on the positive.
Also, another big concern of mine is the fear that we’ll keep pursuing oil for short-term gain, causing additional environmental damage that will hurt us in the long-run.
If we have established that oil is running out, and that BAU will come to an end as a result, then I would like to slow down the consumption of oil now. If all we accomplish by using it up quickly is to drag out BAU, to deplete our oil supplies, and to degrade more land and ocean, then I’d like to downsize now. Not later.
Will it happen across the board? No. But for financial reasons, or for environmental reasons, or for lifestyle reasons, more people are downsizing.
Now for those of you who want the market to determine everything, economics alone will likely reduce consumption. That’s a good thing. If people are too broke to keep buying oil, maybe some oil is left in the ground because it isn’t worth getting out. Income inequality will do its part to slow consumption.
I find it ironic that some people attribute discussions about climate to left-wingers who want to take things away from the middle class and stop their current lifestyles. Yet, right-wing policies that favor the wealthy and reduce income to the masses are accomplishing that very same thing. It’s not an approach I like, but it may be good for the environment. One way or the other, its about downsizing: by choice, by law, or by economics.
Dear All
Just to add to all the noise about climate change and cherry picking and so forth…Don Stewart
The coldest place on Earth just got warmer than has ever been recorded. According to the weather blog Weather Underground, on Tuesday, March 24, the temperature in Antarctica rose to 63.5°F (17.5C) – a record for the polar continent. Part of a longer heat wave, the record high came just a day after the previous record was set at 63.3°F. Tuesday’s temperature was taken at the Argentina’s Esperanza Base, located near the northern tip of the Antarctic Peninsula. The Monday record was from Marambio Base, about 60 miles southeast of Esperanza. Both are records for the locations
Dear Ron and All Concerned About Peak Oil or Financial Collapse
Peak Oil and Financial Collapse have in common with cancer that both tend to be chronic. One can worry for years about the coming disaster, and then suffer through the disaster for decades. Here is a recent summary of research on cancer and environmental factors.
The first quote I call to your attention:
‘In summary, there is strong and growing evidence to suggest that altered biobehavioral states can promote tumor growth and progression, whereas data supporting their role in cancer initiation remain weak.’
This first finding should not surprise anyone. Decades ago autopsies were performed on Americans in Viet-Nam and on native Vietnamese. Both the Americans and the Vietnamese had about the same incidence of micro-tumors in their prostates, but very few Vietnamese showed signs that the tumors were capable of growing. In the Americans, most of the tumors were growing. This told us that micro-tumors happen, but environment creates the conditions for micro-tumors to turn into invasive tumors. The Psycho-Social effects of Peak Oil and Financial Collapse are strong factors in the prospects for most of the people reading this, and are likely to be important for decades. Perhaps a little knowledge about coping might serve you well.
The studies do not cover stressors such as the chemical load in our air and water and food. Studies have shown that wild animals and those in zoos being fed rigid diets are all getting fat. It’s hard not to suspect that the chemical load is involved.
Therefore, even though you may not be a medical scientist, you might like to take a look at how factors such as stress and poor sleep and low social status affect cancer victims.
Many of these factors are products of Industrialization, which accounts for the widespread incidence of cancer in modern Americans as compared to the remaining hunter gatherers or our pre-industrial ancestors.
Don Stewart
http://cancercontrol.cancer.gov/brp/bbpsb/docs/Advances-in-Cancer-and-Brain-Behavior-and-Immunity.pdf
‘Social disruption (SDR) stress, a murine model of psychosocial stress and repeated social defeat, provides a novel and powerful tool to probe the mechanisms leading to stress-induced alterations in inflammation, tumor growth, progression, and metastasis. In this review, we will focus on SDR as an important model of psychosocial stress in understanding neural-immune mechanisms in cancer.’
‘the hypothesis that sleep disturbance drives inflammation, which together contribute to depression’
‘In other words, exercise may be a critical strategy to modulate the host–tumor’
‘The present study demonstrated significantly reduced left hippocampal volume and reduced memory performance as well as significantly elevated IL-6 and TNFa in chemotherapy-treated breast cancer survivors compared to healthy female controls. Cytokine levels were associated with left hippocampal volume in the breast cancer group. Verbal memory performance was associated with cytokine levels and hippocampal volume in both groups. These findings provide novel information regarding the mechanisms underlying memory impairment following breast cancer chemotherapy.’
[My note. You see how living in an Industrial world creates breast cancer. But the Industrial surplus lets us do fancy research which reveals some of the pathways by which the effects we don’t want are operating. Which leads to more research on finding a drug to counteract the pathways. Which leads to side-effects from the drug, which leads to…. And that is how we get to spend 21 percent of our GDP on medicine.]
‘Childhood adversity increases vulnerability for behavioral symptoms and immune dysregulation in women with breast cancer’
[My note. A huge percentage of children are growing up in poverty with parents and environments who stressed them in the womb and stress them as children. A friend of mine at Duke predicts yet more disasters for us as we reap what we have sown.]
[…] The Problem of Human Population Javier, Peak Oil Barrel Since the growth rate is declining naturally, if not intervene any new factor human population on Earth would peak slightly above the 10 billion people by 2062 according to the United Nations. This is the problem size. Political campaigns to reduce the growth of the human population are decreasing, not increasing. The question therefore is not to analyze whether the Earth is able to support 10 billion people, as it most likely can, but if it can do it indefinitely. (Note: Translated from Spanish by computer and contains grammatical errors.) […]
An issue is not only the quantity of food that can be produced to sustain a large population, but the quality of that food. Agriculture itself was an invention that preceded the fossil fuel age with a similar effect to fossil fuels on supporting population levels far beyond what would have occurred had we remained in a hunter gatherer existence. A feedback loop developed between agriculture and civilization which supported greater population numbers and eventually led to the industrial age, heavily dependent on exogenous energy.
One consequence of agriculture and then industrialization was not only destruction of habitat, but an eventual decline in the quality of food, so that today we have many chronic diseases resulting from inadequate nutrition. Particularly since mechanization of agriculture we have been able to exponentially increase food production; you might say we are eating fossil fuels since the energy in these is converted into increased food production on present day factory farms. Indigenous populations when they abandon their traditional diets in favor of diets from advanced nations experience diseases that were unheard of.
The question is whether or not we could produce quality foods for an increased population when we can’t seem to produce sufficient quality foods today. We now rely on calories that are devoid of adequate nutrition and while some people who can afford to eat a healthy diet, it seems that the majority either do not out of ignorance or cannot because a quality diet is expensive compared to cheaper, empty calories.
We refine the life out of foods in order to give them extended shelf life. We similarly use toxic substances all the way from the field to the market on “fresh” foods to extend shelf life. We have abandoned good quality saturated fats in favor of cheaper, disease producing seed oils. We rely on lower quality proteins from plants because we can’t produce sufficient high quality animal protein. We have substituted carbohydrates for quality fats and proteins. Cardiovascular disease, type II diabetes, cancer, osteoporosis, osteoarthritis, tooth decay, obesity, Alzheimer’s, MS, ALS, Parkinson’s and hypothyroid, to name a few, are avoidable diseases related to either what is missing in our diets or what shouldn’t be there.
I question whether we are capable of even supporting a healthy population today at 7.3 billion, and suggest that we only do so at the cost of disease. It looks to me that we are a disease ridden population, relying on poor quality food, in many cases because we must, and then gloss over the results with a medical system that only treats the symptoms with oil derived drugs and barbaric medical procedures. Perhaps we are deluding ourselves when we go through mental gymnastics to justify adding to our numbers when it should be obvious that we are not able to adequately maintain our own lives. Infrastructure decay is not limited to the assets we have developed outside of ourselves.
[…] The Problem of Human Population Javier, Peak Oil Barrel Since the growth rate is declining naturally, if not intervene any new factor human population on Earth would peak slightly above the 10 billion people by 2062 according to the United Nations. This is the problem size. Political campaigns to reduce the growth of the human population are decreasing, not increasing. The question therefore is not to analyze whether the Earth is able to support 10 billion people, as it most likely can, but if it can do it indefinitely. (Note: Translated from Spanish by computer and contains grammatical errors.) […]