The katest OPEC Monthly Oil Market Report is out with OPEC crude only production numbers for February. All data in the OPEC charts below is in thousand barrels per day and the last data point is February 2015.
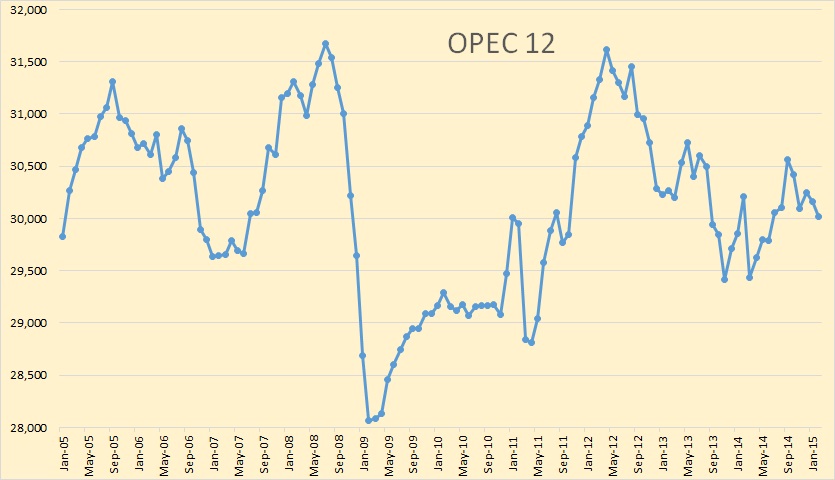
Total OPEC crude only production was down 137,600 barrels per day in February.
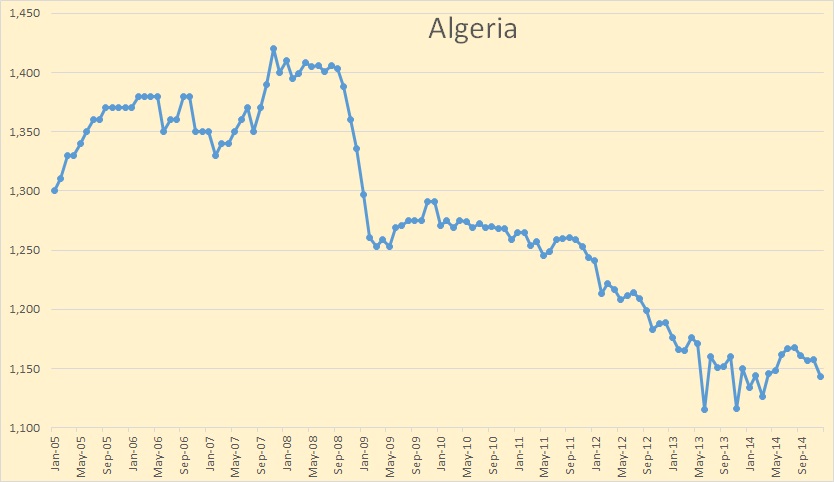
Algeria seems to have stabilized their decline.
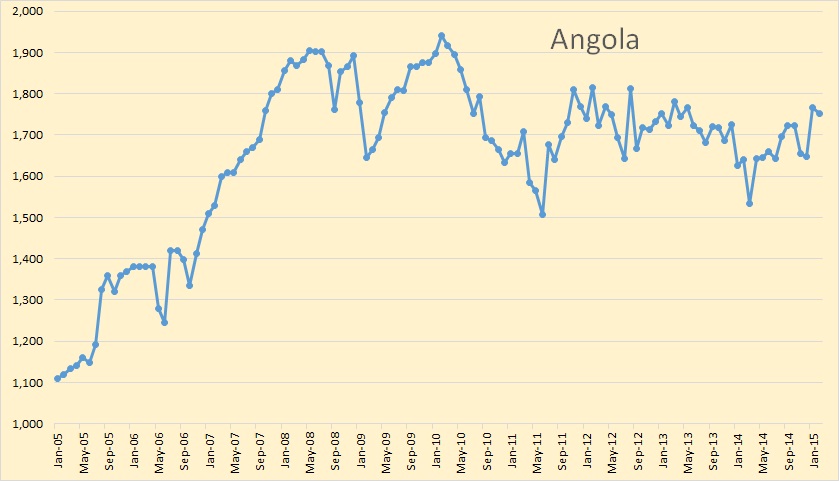
Angola is holding steady.
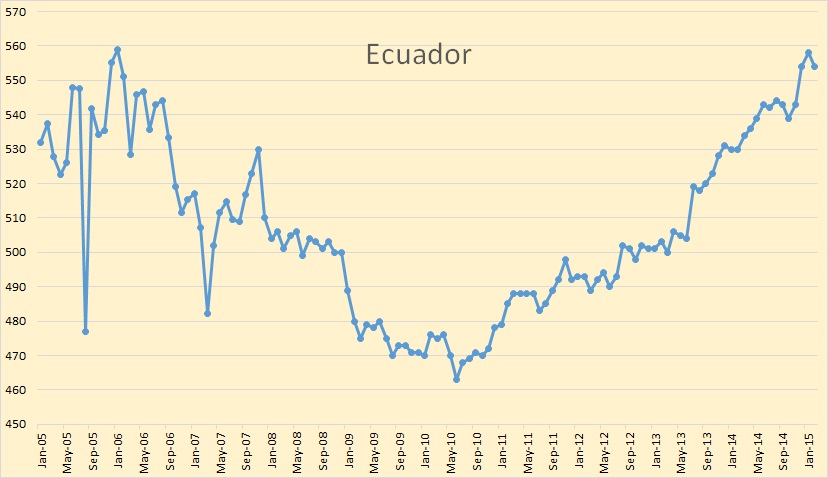
Ecuador has been slowly increasing production at a rate of about 25,000 barrels per day per year. I don’t think they can hold that for another year however.
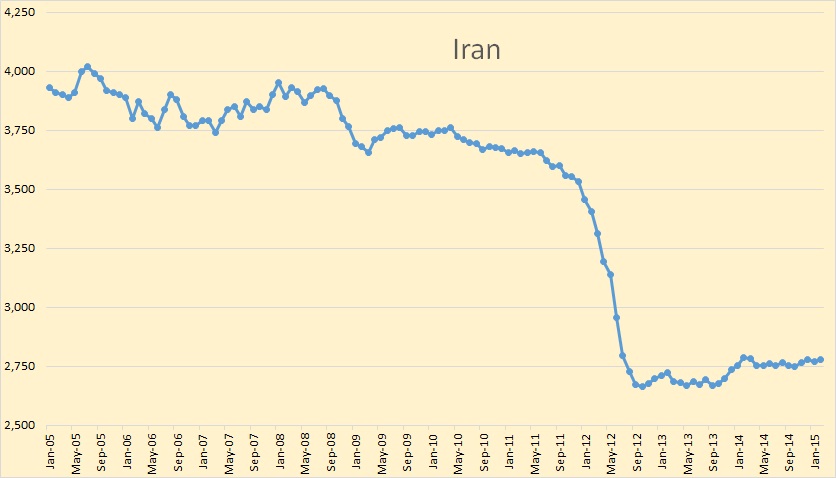
Iran production has been remarkably flat for about two and one half years. It is a question as to how much their production could increase if sanctions were removed.
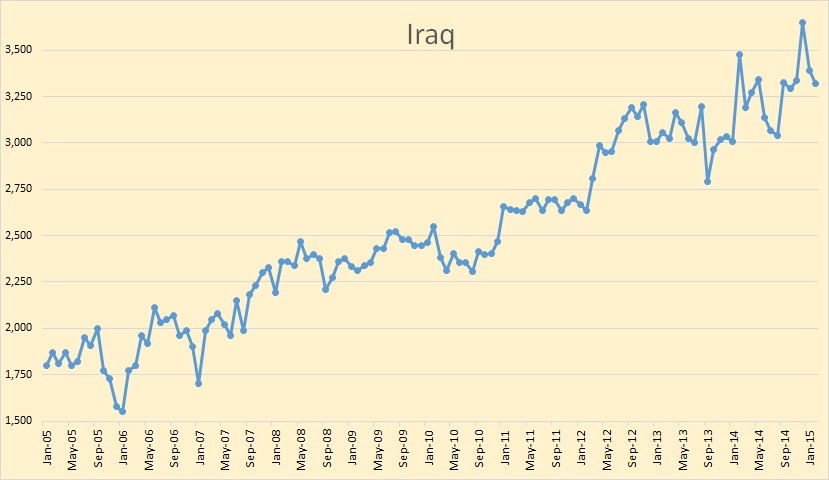 It is remarkable that Iraq has been able to keep production as high as it is with all the ISIS problems they are having.
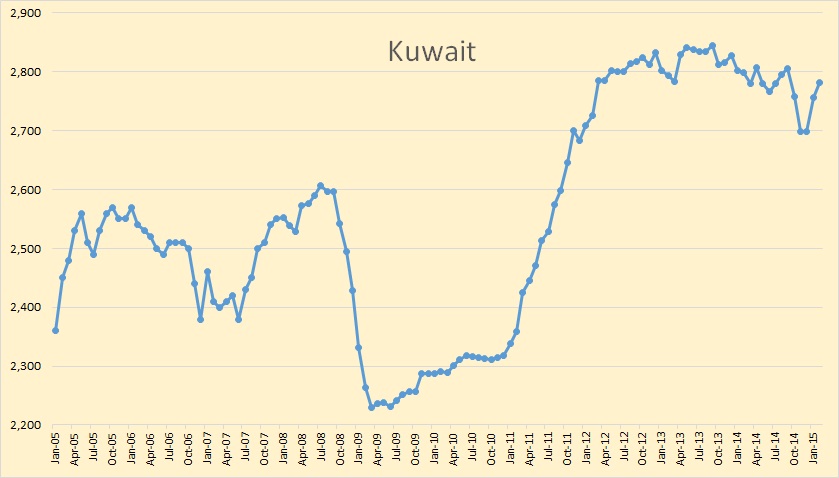
Kuwait was producing flat out in 2008 at 2,600,000 bpd. But when quotas were lifted in early 2011 due to the Libyan civil conflict, they began a huge infill drilling program and have managed increase production by around 200,000 bpd above their peak in 2008. production pretty much maxed out about two years ago.
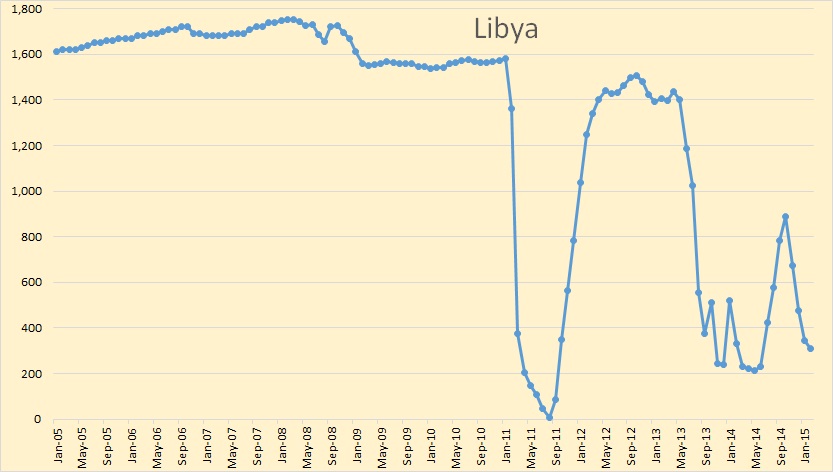
The Libyan conflict continues to impede production. They are now barely above 300,000 bpd.
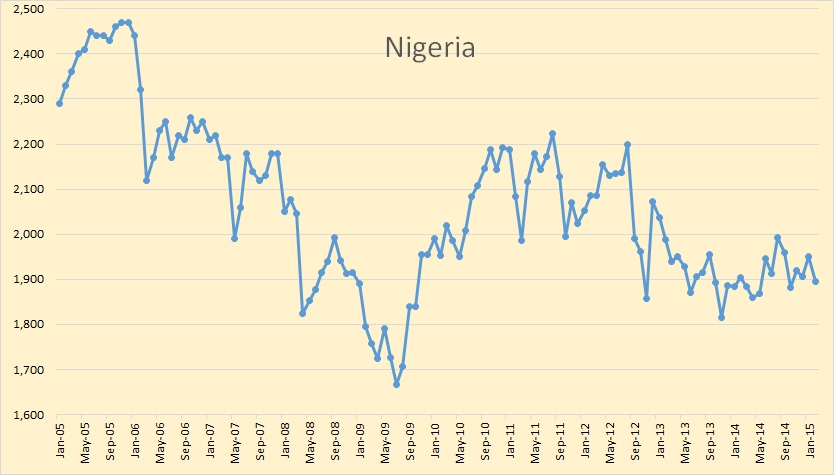
Nigeria is holding steady at around 1,900,000 bpd.
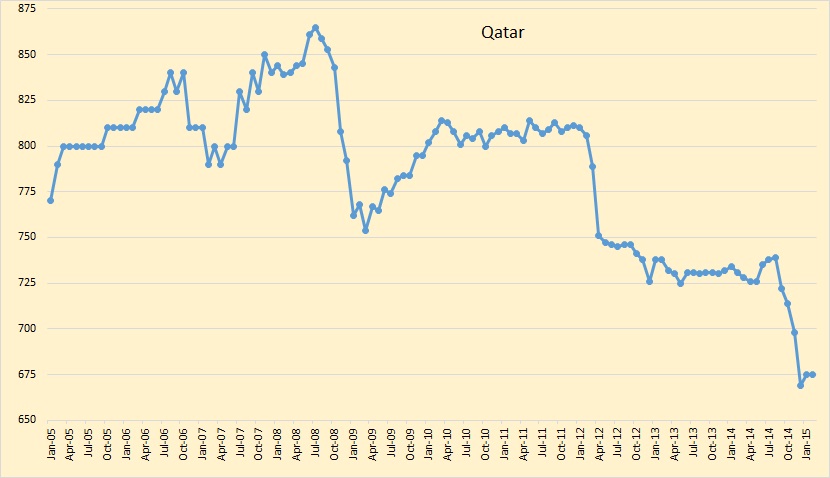
Qatar has stopped their decline, at least for now.
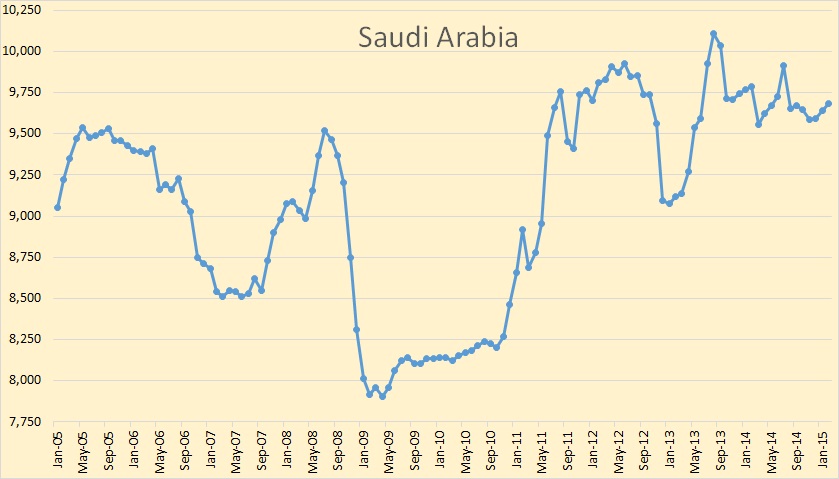
Saudi production has been holding relatively steady for about a year and a half now. They show no sign of either increasing or cutting production.
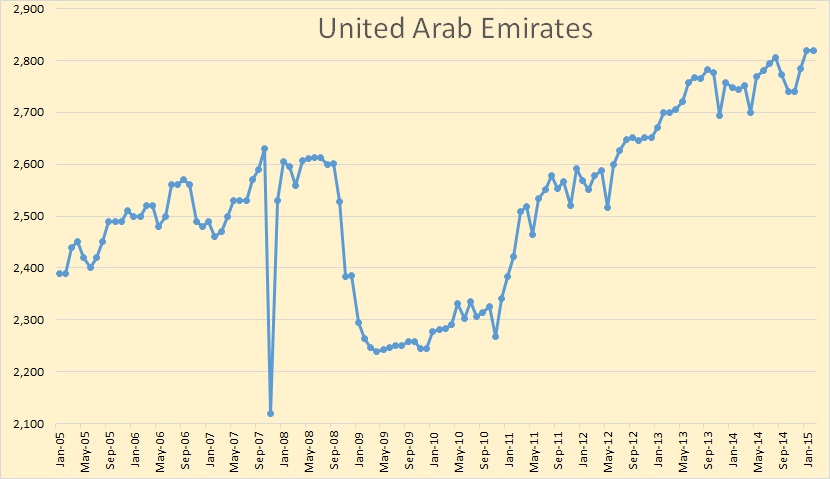
UAE, like Kuwait, began a huge infill drilling program in 2011. I think it has pretty much maxed out now.
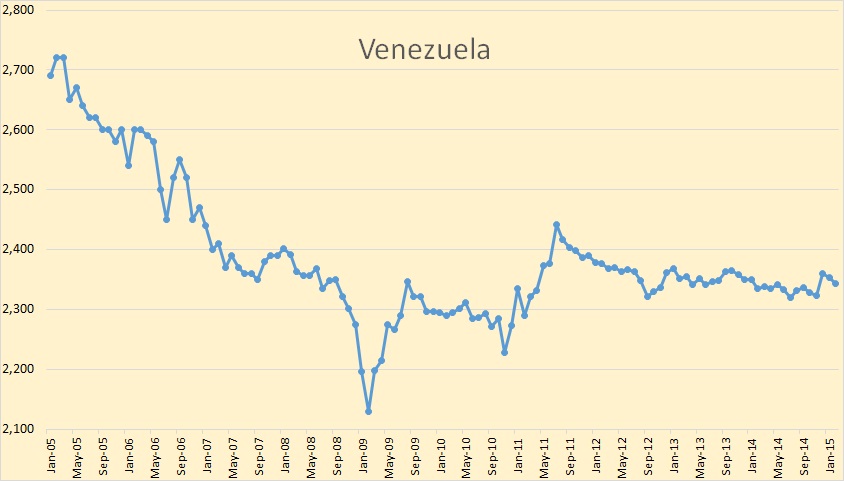
I keep waiting for something to happen in Venezuela… but nothing.
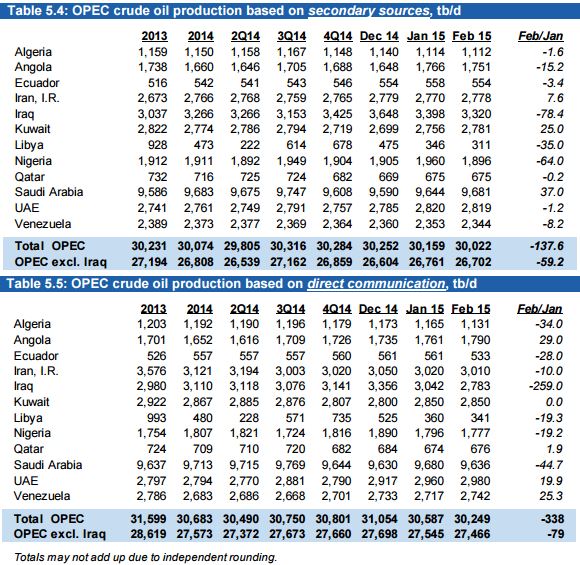
Here are the actual production numbers produced by the OPEC MOMR. The top chart, “secondary sources” is the one used for all my charts. The bottom chart, “direct communication” is what the countries reported when they were called by the MOMR. Notice that Iraq reported a decline of 259,000 bpd while the “secondary sources” had them down only 78,400 bpd.
In Other News: The Motley Fool says any decline in US oil production could be far in the future.
American Oil Production Is Still Skyrocketing: Will Oil Prices Tumble?
With oil prices having dropped by roughly 50% since last summer, U.S. oil companies have quickly reduced their investment plans and idled drilling rigs. Many pundits have assumed these actions would quickly be followed by falling production numbers.
While that might seem intuitive, it did not prove true. At some point, reduced drilling activity will inevitably lead to a fall in crude oil output — but that point could be far in the future. For the moment, domestic oil production is still rising steadily.
Output on the rise
Last week, U.S. crude oil production rose by 42,000 barrels per day compared to the previous week, reaching 9.37 million bpd.
The EIA said Wednesday that US C+C production reached 9.366 million barrels per day the week ending March 3rd. And because most people believe that was an actual measured number, oil prices have dropped steeply every day since. I have tried to explain to people that this number really has no hard foundation, it is an estimate.
I am sure the EIA uses some kind of algorithm to arrive at their estimate. It is likely based on the storage numbers, imports and refinery inputs. But all this depends on many reports from oil companies, pipeline officials and refinery officials and the truthfulness of those doing the reporting.
As an indication of the EIA past production estimating skills, I showed in my last post, how their estimate of production of six weeks ago, was off by a country mile. They estimated, on March 10th, that Bakken January production would be up by 27,300 barrels per day over December. But when the actual data came in from North Dakota, production was down by 37,000 barrels per day. Of course total Bakken production is somewhat different from total North Dakota production but the numbers give us a pretty good indication of the accuracy of their estimate. The total Bakken was likely down by pretty much the same number as was North Dakota.
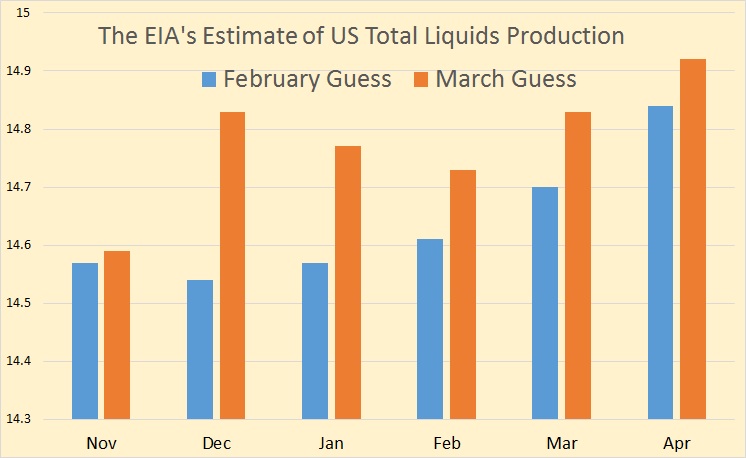
The data for the above chart was taken from the February and the March Short Term Energy Outlook. The data is in 1,000 barrels per day of Total Liquids. They decided in March that their February guess of what December production was, was 290,000 barrels per day too low. In other words, when the production they were trying to estimate was only 6 weeks in the past, they thought it was one figure, but after the data was 10 weeks in the past they had a better view so they jacked it up by 290,000 bpd.
But last Wednesday, they looked 5 days in the past and told us what the total US production of C+C was.
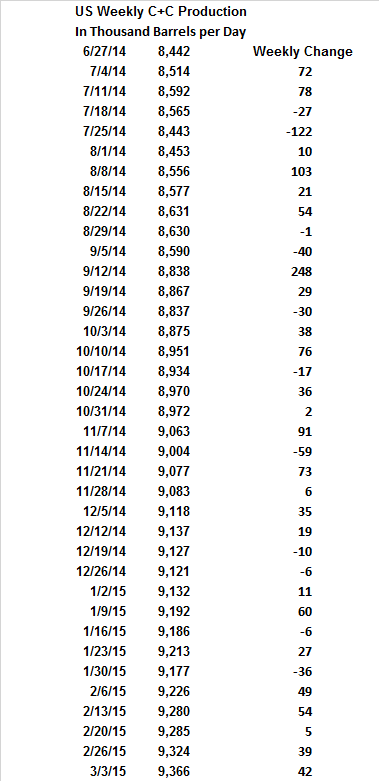
The above is the EIA’s estimate of US Weekly C+C production from the Weekly Petroleum Status Report. Notice the week ending 9/5/14 US production was down 40,000 barrels per day. But the next week it was up 248,000 barrels per day. Now it is highly unlikely that US production was actually down 40,000 barrels per day that week since the general trend was up. But it is a near impossibility that production was up a quarter of a million barrels per day in one week.
The EIA never revises the weekly numbers, they just adjust each weeks numbers to make up for any previous over or under errors in the data. So I am looking for another huge adjustment in the weekly production numbers soon.
Note: If you would like to receive an email notice when I publish a new post, then email me at [email protected]
684 responses to “OPEC Crude plus More on EIA Estimates”
Re: Revisions
FreddyW posts graphs after each Bakken Directors Cut and my recall is that at least one of those does wait a period of time to record data. But on the other hand I don’t recall seeing much in the way of Bakken revisions after the initial release, other than for well completions. Hmmm. Surprising the EIA doesn’t just use that.
Editing here, 13 minutes to go!!
Just revisited FreddyW’s stuff last Ronpost. I think the whole matter leans on the fact the data comes out for 2 months prior. This may serve to reduce revisions.
One of the more powerful items in Freddy’s stuff was a fairly focused examination of the concept of sweet spots, and failure to find evidence of them (being drilled first).
I think companies in North Dakota are forced by regulations to report production within 2 month. In for example Texas it can take years until all the data has been collected.
ooo, very interesting.
I’m an amateur, but there *did* seem to be internal consistency with ND going down 37K in January vis-à-vis the reported increase in wells awaiting completion, rigs operating, and the decline rates that one usually encounters on the web (6% month-over-month in the first 3 years).
What puzzles me is this: Is this not what one *usually* expects for ND in January? Wells don’t get completed right away in winter, so production dips? What was surprising was that the EIA reported an increase. Perhaps I’m too new to statistic chasing…
It is often a seasonal thing, but Helms said this was not a harsh January.
http://headlines.ransquawk.com/headlines/iranian-oil-minster-zanganeh-says-the-country-could-boost-its-oil-exports-by-1mln-bpd-if-a-nuclear-deal-leads-to-sanctions-being-removed-16-03-2015
Anybody else noticing Nigeria is down 25% in 10 yrs?
Watcher,
Anybody notice they shot at people over there and kidnap people.
Not a nice place to work at all. I have personally spoken to half a dozen people that have been kidnapped at some stage in Nigeria.
I have been told Bongo, a large deep water FPSO along way off the coast, has numerous bullet holes in it.
I doubt very much oil at all is coming from swamp country these days?
Many years ago I was in Congo and we lost track of an accountant. The guy was flying in from Paris to Braza with a layover in Lagos. He was a cherry, so when the plane landed in Lagos he picked up his carry on and went to find his “facilitator”. He wandered around looking for the woman, couldn’t find her, and decided to go to the inmigration line. Eventually he got to the booth, handed over his passport, and was told in Nigerian accented English he didn’t have a visa.
He argued for a while with the official, didn’t realize Congolese speak French, and by the time he figured out he was in the wrong country the plane was gone.
Eventually he made it to Braza in one piece, but we heard he spent a few days going in his pants. To celebrate his reappearance we had a local woman prepare him a shirt which read “I went to Nigeria and all I got was this shirt”.
Ron:
The EIA lies. Your posts comparing Texas oil production vs. the EIA’s report of Texas oil production highlights the growing lies from the EIA. Each month the EIA adds roughly 50k/b/d for at least the last 12 months. How can that be? Texas has been dropping rigs almost as fast as North Dakota. Their production has surely been dropping now and quite probably since January.
The EIA and IEA work for banksters trying to destroy the oil industry so they can buy it up cheap. Next month, Goldman Sacks is starting a distressed energy bond fund. How convenient that they and the media and the EIA and IEA paint a bearish picture of oil fundamentals now.
“Next month, Goldman Sacks is starting a distressed energy bond fund. ”
Where did you get this?
http://www.nytimes.com/2015/02/25/business/dealbook/goldman-seeks-to-raise-fund-to-buy-energy-sector-debt.html?_r=0
That’s a good find. It looks like it adds up (among Goldman, Blackstone and others) to about $25 Billion and the word is energy, not shale. The Goldman offering is not all junk bonds, either.
This doesn’t look like the required bailout, but it’s definitely money risked — maybe with people like Transocean.
EVERYONE,
A Bit off topic, but thought I would share the newest interview on the Russia-Ukraine-USA-Europe situation by John Bachelor and Prof. Stephen Cohen. Normally, Prof. Cohen does a weekly interview, but was off for 10 days as he and another U.S. Professor, experts on Russia, spoke to a large group of German Bankers last week on the subject of Russia & the Ukraine.
http://www.tfmetalsreport.com/podcast/6679/batchelor-cohen-return
I am simply amazed at the WAR PARTY in the US and NATO who are pushing for war. Germany, France and nearly a dozen other countries want no PART of the U.S. War policy against Russia.
Things are about the get very interesting going forward.
steve
…indeed Steve,
sadly!
Listen to what a former joint chiefs of staff member, a major general- a true and utter moron, really and actually- said a few days ago:
https://www.youtube.com/watch?v=b6Nnn8S1XbE
Sadly, he and people akin to him lead this country now…
That is the real reason I commented (in response to Dennis and Mac) in an earlier post that there will be no market for oil or anything in 2030-2050.
Oil is falling again and when, this time, what was drilled and put on line BEFORE oil reached $50-$60 peaks and starts the 40%-80% per year decline rate shale oil well “army”, the morons like the general in the video will gain ground…and then power….and then russians (or chinesse, or anybody) and Putin shall be the “devil” that crushed our economy….and the false flag type of events whe marines are floating drowned in blood killed by the “evil Putin” soldiers are going to make the fat moronic masses “patriotic”…and then, the 99.99% brainwashed, fat moronic herd who think that our soldiers are fighting for our freedom will “volunteer” to go to war and defeat the ennemy.
As alwayz, they shall be blissfully ignorant of the fact that “the ennemy” this time has more nucelarweapons than us and we all shall lose.
It is an unwineable war!
And us few who say otherwise shall be the unpatriotic “spies” who must be eleminated…because “generals” like the one in the video and crowds who dump vodka on the streets (like they did with french wine in 2003 when french refused to join bush-chenney in irak) will take over.
The everlasting historic lesson:
“when all fails, govt takes you to war!”
Even your beloved gold and silver shall not save us this time….pray.
The next few yoars seem to be very “interesting”
Be well and hedge accordingly!
Petro
P.S.: great article Ron! Thank you for updating us.
Steve,
US real after-tax income less debt service (“rentier taxes”) and “illth” care (a.k.a. as “dis-ease” or “health” care) spending peaked YoY in Q1-Q2 ’14 and rapidly decelerated and contracted YoY in Q3-Q4 ’14.
Moreover, the oil and gas extraction and energy-related transport sectors have heavily skewed higher capital goods orders, business sales, and industrial production (IP) since 2011-12 to an unsustainable cyclical rate.
It’s not surprising, therefore, that retail sales, business sales, orders, nominal real hourly earnings, and IP/IP mfg. have been falling since last summer-fall, the point at which the price of oil began crashing. This is the stuff of cyclical business cycle contractions.
And the point, Mr. BC, one might ask? The powers that be (TPTB) are keenly aware of the foregoing and know that the US economy is decelerating rapidly in response to the deflating of the shale bubble, weather and port and refinery labor strikes notwithstanding, along with the rest of the world economy. The current cyclical trajectory is not unlike that which occurred in summer 2001 (prior to 9/11) and winter-spring 2008, both instances coinciding with the US economy having already rolled over into recession.
Thus, the US is due yet another imperial war cycle in order to goose the goods-producing sector (especially the “defense” sector) in response to recession, which in turn will justify increasing fiscal deficits, maintenance of ZIRP/NIRP, and a resumption of the Fed’s QEternity/QEn+1 later in the year.
IOW, economics is politics. Politics is war by other means. The business of empire is war. War is good business for imperialists. Ergo, economics is politics is war is the business of empire, and the owners and financial facilitators, i.e., Wall St. and The City, of Anglo-American-Zionist empire need another regional (or eventual world) war for business, geopolitical (say again imperial business), and domestic social control purposes.
Wall St., DC, the Saudi royals, Bibi and his thugs, and the US-UK war profiteers are maneuvering to release yet again the ravenous hounds of war for profits and power against “Radical Islam”, Putin’s Russia, and, if history and human nature are a guide, eventually a regional war (or Cold War- or cyberwar) in the Pacific against China.
This begs the question of what kind of “Pearl Harbor-like” event will be required this time to compel the unsuspecting American and western public to support (tacitly acquiesce to) the next phase of the never-ending war for Anglo-American-Zionist, rentier oil empire (in the post-growth, LTG era)?
Same as it ever was . . .
Parable of The Violent Tribe…
This is a 46 second-long video worth watching and/as it seems to put a cherry on top of BC’s good comment.
Same program from JB podcast 3/10/15
http://johnbatchelorshow.com/podcasts/tues-31015-hr-2-jbs-stephen-f-cohen-nyu-princeton-professor-emeritus-author-soviet-fates
Don’t hear about American misinformation or complete loss of confidence of american foreign policy in the MSM. West drives Putin into a corner, extremely dangerous situation.
Along these lines, I found these words from Malcolm Fraser Ozzie PM ’75-’83 interesting:
here’s one paragraph snip:
As painful as a reassessment of relations may be for intellectual and policy elites, there are four principal reasons why one is long overdue. First, despite much blather about a supposed unanimity of national purpose, the truth is that the United States and Australia have substantially different values systems. The idea of American exceptionalism is contrary to Australia’s sense of egalitarianism. Second, we have seen the United States act in an arbitrary, imprudent and capricious fashion. It has made a number of ill-advised and ill-informed decisions concerning Eastern Europe, Russia and the Middle East. Third, at the moment, because of U.S. military installations in Australia, if America goes to war in the Pacific, it will take us to war as well—without an independent decision by Australia. Finally, under current circumstances, in any major contest in the Pacific, our relationship with America would make us a strategic target for America’s enemies. It is not in Australia’s interest to be in that position.
http://nationalinterest.org/feature/america-australias-dangerous-ally-11858
EIA production numbers include NGLs, Texas RRC numbers do not. Texas RRC acknowledges as much on their website:
The production data in PDQ doesn’t match the data I get from the federal Energy Information Administration. Can you explain the difference?
The Railroad Commission of Texas’ crude oil production data reflects only crude oil produced from oil leases as reported by operators. The Commission’s data does not include condensate, which are liquid hydrocarbons produced from a gas well. Our data comes directly from production reports filed by operators.
Who is “our”?
Texas RRC.
There are other issues as well. (Producers not reporting, Reporting late, etc.
The website is very helpful.
PeakOil NOT does this mean you represent or are somehow affiliated to the Texas RRC?
Hi PeakOil NOT.
Nice screen name. What made you choose it?
Peak Oil NOT,
I agree that this web site reports only C+C unless otherwise noted. It is Ron’s site and that is what he wants to report. I appreciate the effort he puts in especially the graphs.
But total liquids would seem to give a better picture of supply and production changes. After all NGLs, refinery gain, and the other differences are part of mix which make the economy produce.
Hi Danlxyz,
One problem with total liquids is that it is not adjusted for energy content. The typical barrel of NGL contains only 65% of the energy of crude, same is true of ethanol. So total liquids adjusted to barrels of oil equivalent is useful, also some NGL is not really used for energy (ethane is used mostly as an industrial input in plastic and cryogenic processes, rather than burned for energy). This is more work than just using C+C data. Also we can use BP data in tonnes of oil to estimate barrels f oil equivalent.
a carryover thank you…
It read as a sort of age-targeted unemployed-wage-slave flyer/ad for the unsustainable North Dakota shale/fracking industry, complete with age, income, corrupted values, etc..
And much more in the crony-capitalist plutarchy global industrial uneconomic monster– which farts in our general direction, Gerd– and that we just can’t help feeding… with our children, alive (like those two in question if they are real or part of the monster, or both), as well as with our values, future, and planet.
Pushpush, toolpusher. Make ‘er scream. We know abuse when we see it.
Hey Ron,
Any chance of an ignore button?
That way it would avoid a lot of knee replies one is temped to write.
“I mix with professional people and and I know i have earnt up to double their pay scale…” ~ toolpusher
I believe we have a Chameleon, in our midst?
Better a chameleon than a car.
I think the rooster’s a ridiculous riot, along with the name, like much of life, but anyway, yes, hugz, ’tis I.
Now, let’s get on with appropriate blog business/topics…
…The rooster can be eaten of course, we don’t have to dress it up, except maybe in a nice gravy with the usual trimmings, and it is probably a good idea to consider/look into local home resilience like that– backyard chicken coops, etc.– as things wind down in the oil fields.
I look forward to your writing, even if ridiculous, like the double pay scale professional mix nonsense. I might have a hard time understanding some of it, but do try sometimes, such as when my head is clear of climate change denialism and corporate, etc. crap.
*bwokbwokbwok*
Yes, the ignore button would be really nice.
Just use your head and stop being silly by asking for it. Or don’t. S’up to you. *bwokbwok*?
Say, incidentally, was it you who took the snap of the dockside shipping containers that were ostensibly being used as housing for foreign wage-slave labor-power?
It begs the wonder of how meat-machine wage-slave labor is all going to shake out when the planet runs slowly lower of the metal-machine energy-slave kinds.
I’ll close this comment with some graffiti text once seen in Ottawa some years ago: ‘You are not your job’
ignored
So you’re telling me that you have ignored me?! lol You’re too cute! …I think I love you. ^u’
Hi Toolpush, Caelan, and everybody.
Just a little talk here about confirmation bias and finding one’s people.
These little rants from Caelan and Futilitist, and the backlash from Mike and Toolpush make me wonder about the site’s purpose and audience.
It is, on the surface, what Ron wants it to be- a place to discuss a specific type of data, the implications of that data, and the outside noise that affects the data (though he does leave it open to other things.) A place where we disagree on what the data means, but where there is a central agreement: that the data means something. And that the analysis of that data is not something that has to be confined to “experts”: that scientific inquiry can be carried out, in limited ways (like me) or with intense devotion and expenditures of time (like Ron and Rune and Dennis and Jeff.)
What I found irritating about the young lady’s post yesterday was her sense that she was better than her contemporaries- that this was the obvious answer, and she couldn’t see why everyone wasn’t in the Bakken, ignoring the fact that there aren’t enough jobs or accommodation for all of her friends (or people in similar financial positions) to go there, and that there are lots of reasons not to work on an oil rig.
I have a nephew in Fort McMurray. A Motor Operator, if I have the terminology right. He has told his mother that he feels like an outsider on his Gas Rig, at least among the other roughnecks, partly because he has a degree.
A business degree.
He has been embraced by the Toolpush and one of the other managers, probably because he is trainable. Though it is on the down-low.
So we have a culture that is anti-education and anti-knowledge, and somewhat narcissistic. One that for those starting out, requires a big gamble: can I get in before the downturn? Can I stay in for the long haul? Can I outlast my contemporaries through the layoffs?
An emotional argument, not a fact-based one.
I am not surprised that Mike was so incensed yesterday. The question of “Who are my people?” comes up here. I am sure the young lady and her husband remind Mike of people he works with, and whom he may have had to lay off recently.
His people.
And they probably remind him of himself.
Now it’s tempting to psychoanalyze Mike from a distance, and I will admit that he fascinates me. He seems to be a man between two worlds: on the one hand, a man who admires the graphs and thought, and on the other, the guy who lays everything on big bets, and has done since he was nobody 40 years ago.
On the other side we have Caelan and Futilitist (and to a lesser extent me), who see in dn_girl’s rant the undercurrent of Right-wing populism, which blames the victim (all her friends who were going to go on welfare: the lack of good jobs and wealth inequity was not something she concerned herself with) and the anti-intellectualism involved in her embrace of the company’s figures (My husband’s company has it’s own studies saying to expect 2 million barrels a day from this state in 2019 and staying at that level until around 2030.) She is not, to my mind, engaging with the data in the way I would prefer her to (and yes, that’s my problem.)
I see this post, and most posts denying global warming (those that see it as a left-wing conspiracy,etc.) as anti-fact. The spewing of doubt, of choosing to believe the less-likely thing, or to base a stance on ideology, are problematic for me, and disagree with my personal narrative. A narrative that in many ways is reinforced by this site. I see most of the usual posters as people involved in the same type of inquiry that I am: people engaged with the data.
Why is dn_girl here? Her post supports her personal narrative, that much is certain. It reads like unalloyed boosterism to me, someone trying to convince herself more than us. Her post adds few useful facts, and adds political noise that pisses some of us off.
Would the comment have generated the same protective response from the oilfield types if it had been written by a man?
Geeze, I’m starting to ramble, and this post is reaching OFM length…should make some kind of point and get back to work.
We all have personal narratives. Some of us have our narratives supported here, some feel that the hive mind spits on theirs. Posting here means exposing your ideas and your narrative to scrutiny. Sometimes withering scrutiny. If you challenge facts without sources, you get called on it. If you present your personal narrative as the subject of discussion, it will be challenged.
Did dn_girl realize she was trying to change the culture here (as we all do, with every post we write?) Does she deserve special treatment because she’s:
-young?
-uneducated? (assumption.)
-unsophisticated (or extremely sophisticated and disingenuous…who can say?)
-female?
On this kind of forum, the community aspect and “my kind of person” aspect seem to be the hardest things to manage. With dozens of posters and hundreds of comments, we break down into cabals and look for reasons to present our bona fides to our supporters, and to make the community more like us.
I don’t have any good answers, and a call of “why can’t we all just get along?” beggars the purpose of the site.
My ignore button is in my head. I could name the people I use it on, but in the interest of getting along…
-Lloyd
Hi Lloyd,
Thanks for this. I can see why some people may not have liked the comment from the young woman (which I did not read carefully). I don’t think that is a reason to be rude (though sometimes I am), and I can see why some would have been turned off by the responses to her comment which struck me as unkind.
It would be nice if people typed comments that they would say to someone’s face. Some are quite harsh and lack basic politeness.
I like the range of views that Ron allows and think it best that conversation not be shut down due to name calling. A blog where everyone agreed on everything would not be very interesting.
Hi Dennis.
“It would be nice if people typed comments that they would say to someone’s face. Some are quite harsh and lack basic politeness.”
I think if people were more straight forward, direct, clear, honest, and non-deceptive, that genuine politeness would be the natural outcome.
And I would say that to your face if we were in the same room, pal. I hope you aren’t offended by that. 😉
A group of us are at a cafe around a big table and some young woman sits down with us– say, she knows someone at the table– and starts talking, point-blank, like that, ‘My husband earns 6 figures, bad winters, nothing to do but drink and drugs, friends back home want babies and to governmooch, we will go back home, the work-ethic-for-the-brainwashed rocks, so come to ND, fun to be had by all, bla bla…
Well, for awhile, as I’m listening and getting to know the person, I’d likely sort of nod and say, ‘Oh ya?’ and ‘I see.’, etc., but maybe would want to start to respond/engage more meaningfully to what she was talking about. You can’t plop yourself down somewhere with people, start talking and expect no one will respond beyond the superficial.
Of course it is important to bear in mind, too, that this kind of communication is text-based. There is a lot of body language and paralanguage, that is missed and just impossible in this mode of communication.
dn_girl was/is most likely a thinly-veiled guerrilla marketing tool for the failing industry/region that is North Dakota.
So I decided to approach it somewhat as such, where she could be that, or not. (It can instructive what/who can come out of the woodwork in some occasions sometimes…)
It doesn’t look at all like a typical 19 year old chick’s comment or approach would; it covers, right off the bat, practically all corporate angles/agendas for that context; and if you go back and take a look, and compare it to the rest of our comments, there are no line breaks. This is relevant because it both looks like a cut-and-paste job, such as for multiple uses elsewhere, and young women, of all people, can be pretty particular with appearance(/interaction/preoccupations).
And you know? This is highly relevant to this blog, such as where industry ‘microeconomic’ dynamics are concerned, and where the difficult/costly oil industries seem to be going down the crapper in realtime. This is interspersed– quel surprise– with the likes of none other than (*face-down-at-the-bottom-of-a-pit-)Mike and his industry-layoff sob stories. (If you listen closely, you can almost hear a violin or two playing in the background.) (I appreciated his comments for the most part, though, and would be fine with his return.)
Futilitist, like many, including myself, is likely not a happy camper, and seems to want this outrageous fraud we call civilization to crash and burn spectacularly and without further ado, so he and the rest of us can get on with real, meaningful lives.
Now, Lloyd, I have yet to read your entire comment, believe it or not, but I’ll get to it later, maybe before the edit function timer stops.
* Was that his comment?
Hi Caelan and Lloyd.
We all have a tendency to project a bit in our individual quests for tribe.
“These little rants from Caelan and Futilitist, and the backlash from Mike and Toolpush make me wonder about the site’s purpose and audience.”
~Lloyd
First off, it is not correct to see Caelan and Futilitist as some sort of team. Like everyone else here, we often agree on some things, but certainly not all things.
Caelan and Futilitist have very different approaches to debate here. Caelan is more concerned with politics and social justice than Futilitist. Futilitist is relentlessly focused on collapse, and it’s near universal denial.
Both Caelan and Futilitist are iconoclasts, who bring a breath of fresh air to discussions that can sometimes be a little stuffy. This is a necessary function within a tribe. It can help keep Groupthink from running rampant.
And while both Caelan and Futilitist may seem to share a similar flamboyance, our styles are really quite different.
I don’t know what set Mike off, but prior to that, I hadn’t had much interaction with him. I have never had any conflict Toolpush, that I know of. It feels like Caelan may have had some tension with both in the past. I am not part of that. And I don’t know what the current problem is between Caelan and Toolpush. I personally think the chicken thing was *WAY* over the top, though.
And, Lloyd, I share your curiosity concerning the site’s purpose and audience.
“On the other side we have Caelan and Futilitist (and to a lesser extent me), who see in dn_girl’s rant the undercurrent of Right-wing populism, which blames the victim (all her friends who were going to go on welfare: the lack of good jobs and wealth inequity was not something she concerned herself with) and the anti-intellectualism involved in her embrace of the company’s figures…”
~Lloyd
I would not group the three of us the way you do.
I was not involved at all in the discussion with dn_girl. Any opinion you may think I have of that discussion can only be your assumption. I didn’t even read her comments, I just skimmed them. I thought her comments were quite trivial (an opinion that I think we share), and I would not have said anything to her at all. Here, once again, I found Caelan’s comment significantly over the top. I see why it has created a fuss. But I still support Caelan’s right to self expression. While not the kind of approach I would have used, I still think it may have opened the door for some needed dialog.
“dn_girl was/is most likely a thinly-veiled guerrilla marketing tool for the failing industry/region that is North Dakota.”
~Caelan MacIntyre
I would not necessarily draw that conclusion. But I tend to skim comments like those of dn_girl, and I am not as familiar this meme family and it’s particular modes of deception. Caelan may have some expertise here.
“Futilitist, like many, including myself, is likely not a happy camper, and seems to want this outrageous fraud we call civilization to crash and burn spectacularly and without further ado, so he and the rest of us can get on with real, meaningful lives.”
~Caelan MacIntyre
Okay, this one really is mostly projection. While I am not super happy with industrial civilization, I am not really looking forward to it’s spectacular destruction, either. I sure don’t think the demise of civilization will result in us living “real, meaningful lives”. It is far too late for such dreams. The collapse of civilization will not be a good thing for us.
Hi Futilitist.
I would not group the three of us the way you do.
You are correct. It was an over-generalization, probably a result of Mike mentioning you specifically on his way out, and the fact that the three of us frequently end up on similar sides of things, though with differing levels of vehemence, different reasoning, and, as you say, different styles. And like you, I think that Caelan has gone over the top recently.
The collapse of civilization will not be a good thing for us.
You and I are in agreement here.
-Lloyd
Along with the rest of my fellow species– collapse, climate change and peak oil, etc., being ‘over the top’– I also happen to believe that you both can be a little ‘over the top’ too, but I’m willing to pretend otherwise and to shift my baseline a little (for example as ‘Planet Suction Cup’ to one of Lloyd’s wacky comments) to help make you feel comfortable. ^u^
Futilitist, your top-notch wince-worthiness with OFM nothwithstanding, the chicken was over the top, lol, even to me, but it’s friends with Fernando’s pigeon, you see, and at least it, and its other feathered friends, don’t create the kinds over the top issues we humans do, yes?
I mean, come on.
Hi Caelan and Lloyd. (aka my tribe)
It is always difficult to form a tribe composed of independent thinkers.
We may have done it, though. 🙂
And speaking of pigeons…
“We will eat the songbirds out of the trees.”
~Ron Patterson (aka Darwinian)
“The collapse of civilization will not be a good thing for us.”
Why not? It will stop the hated BAU. But more important, and perhaps it is just wishful thinking, it will relieve the incessant attacks on the fauna and flora. Yet, I believe, this can only be achieved by enormous reduction in world population.
I was just casualy taking a stab, Fut’, but do think that if we, as a species, survive the collapse (Guy McPherson and perhaps a few others don’t think we will), whatever it entails, our future may be meaningful at least in the sense of being closer to what’s left of nature and to the relatively-small scale and relatively-lateral hierarchies, and stuff like that, that we seem wired/evolved for. This is old TOD hat.
I think we will all have a meaningful future much closer to nature. Pushing up daisies.
It does seem like a very real possibility.
As Keynes put it, in the long term we’ll all be dead.
Hi Ilambiquated.
Keynes wasn’t talking about social collapse. So, not really relevant.
I got thick skin and all but don’t understand the comments coming toward me here. I already told how I found this sight, living in the Dickinson ND area for the last 3 and a half years, I here lots of rumors all the time about this Tyler activity picking up any time now, and the area just to the south of us booming with many thousands of the new Tyler wells. My husband works in the production of bakken wells but most of his work is like at least 60 miles away from where we live, sometimes he has to go 100-150 miles away one way each day to work. yes this is why we paid cash last Summer for a 2004 Dodge ram so he can be taking that to/from the fields instead of his newer 2010 f150 which is for city driving only, but if the Tyler activity really did hit it off big in the Stark county area right to the south of us he wouldn’t need to drive so far every day since it would be right to the south of us. I searched a Comment leading me here about the Tyler and lodgepole and other wells going on in the Dickinson area so that’s what got me here, but theres soooo many other discussions about the bakken I thought you guys would appreciate some opinions of what life is actually like here because with all the bakken talk I thought there are people here reading that are thinking of making a move to ND to work in the oil fields for themselves. Maybe I get to beside myself with excitement about the opportunities out here but to pastime and not think about the family & friends I left behind in Cali I try to blog about living in the bakken for others to realize what they can achieve if they are willing to pull up sleeves, move across the country and get set up in western north Dakota. I can’t even explain how much respect I got for all the other people & families I met up here. So many had to leave home or completely uproot families just so they could make a living by moving here. they work extremely long and difficult hours in tough jobs in some of the worst weather in the country but they do it because they want to make something better for themselves & their families. Sure half of the people who came here could sit back where they originally came from and collect a government check for doing nothing but they didn’t want to so I guess go ahead and say something about how much we make up here and how we’re not smart enough for you if you want but please don’t disrespect all the people trying to make a better life for themselves and families without government assistance.
Hi dn_girl.
Don’t worry so much about the politics.
Please try the Futilitist Collapse Challenge to better understand the future of your industry.
http://peakoilbarrel.com/eia-confusion/comment-page-1/#comment-504528
I respect the fact that people in the oil industry work very hard to provide an essential product that most people simply take for granted. But you aren’t doing anyone any favors by encouraging them to enthusiastically join your dying industry.
DN Girl,
Good on you. Most people can’t be bother to get off their arse’s and do something for themselves. There is good money in the oilfield, but it has its is ups and down. The production side is more stable than drilling, but they still have them. The money is in your bank account, not the naysayers, so sit back and enjoy your hard work and rewards.
I hope all works out well for you, but it is a matter of surviving the hard times, and making gravy during the good time.
All the best to you and your husband.
Hi toolpush.
It is not a good time to plan a career in the oil industry because the oil industry is set to shrink drastically from here on out. Check out the Futilitist Collapse Challenge to see why:
http://peakoilbarrel.com/eia-confusion/comment-page-1/#comment-504528
Or, you could be wrong.
How?
dn girl. I enjoy reading your posts. Please use paragraphs to make it easier to read. I get lost because it’s all bunched up.
Ok, fair enough, then kindly respect people who want to stay where they are, such as with their communities, neighbors and loved ones; take back the government money that is really just stolen money; and do little in the way of helping to wreck the planet, and promoting that kind of lifestyle, like you and/or your husband seem to be doing in North Dakota.
By the way, I did a writeup for you, (or perhaps more for others reading posts like yours), based on the good legacy work of our recently-departed Mike.
I second Fernando’s suggestion.
Really?!! Driving a 2004 Dodge Ram 100-150 miles each way to work so you can park your 2010 F-150 which is for city driving only…
ROFLMAO!
The comment you read about the Tyler and Lodgepole formations around the Dickinson area sounds like something I might have written, many months ago. Both of those formations have been known about in that area for some time, but, of the two, the Tyler has gotten more of the attention lately as potentially being a good source rock for unconventional wells.
Unfortunately from your perspective, very little about that notion has actually panned out at this time. Marathon drilled and completed a couple of Bakken-like horizontal wells in the Tyler of eastern Slope County from late 2013 to the middle of 2014. As of January, one was producing 6 bpd, while the other was doing 2 bpd. They have consistently produced quite a bit more water than oil. For expensive horizontal wells that have been active for less than a year, these are not good numbers.
Aside from the two Marathon wells, Armstrong drilled a vertical Tyler well in the Amidon area of Slope County last year, but came up dry. MBI also drilled a few vertical wells last year in the general area of the others. However, I don’t believe any actually began producing. On the other hand, I have also read MBI was more interested in obtaining cores of the Tyler and wasn’t expecting to complete the wells in the first place.
Anyway, long story short, the Tyler formation could still turn out to be on a level with the Bakken and lead to a few thousand drilling locations. But, for the time being, don’t expect activity to start picking up in the way you would like.
Wes, what is the Tyler oil specific gravity and gas to oil ratio? I looked up the geology and source rock potential here
https://www.dmr.nd.gov/ndgs/Publication_List/pdf/RI%20SERIES/RI_111.pdf
But it doesn’t have the oil properties. I’m teased by the Upper Tyler, mostly because I like wild cards. But it’s not worth pursuing if the oil is too viscous or is too undersaturated.
Stick around and you will soon learn who is who around here 😉 . Who is in the oil business and who just like to play. We’ve had a large helping of trolls, recently, and I think you set off a few alarm bells.I hope your optimism plays out with the falling oil prices, see Wes’s comment too. Interesting to get your side of the business too. I can understand the ripping up of roots and moving as that is what I have done myself.
NAOM
Hello notanoilman,
It feels like you guys are circling the wagons and searching for a common enemy. This is the wrong thing to do. We all need to listen to each other. Especially now.
I don’t think the oil industry is “evil”, like you seem to think I do. I admire what you do, and I am very grateful for it. You are under appreciated and that isn’t fair. None of us ungrateful, selfish, assholes could ever enjoy the lazy assed, couch potato, comfortable, profligate lifestyle we have all become accustomed to if it weren’t for what you guys and gals do.
I think we are all stuck in a farcical tragedy driven by human nature and physics.
You guys and gals out in the oil patch are already experiencing some of the pain that all of us are about to feel. It is going to get almost unimaginably worse. I am so sorry for you, and all of us, that I cannot keep from weeping as I type this…
Okay, I’m back. Enough of that shit. It is time for all of us to stop acting like spoiled children and grow up and face some very hard reality. Reality driven mostly by physics and made worse by human nature. And we are running out of time to understand it.
Please read all 5 pages to understand the inescapable dilemma we all face:
http://www.thehillsgroup.org/depletion2_022.htm
The production of oil, and the economy it drives, is ruled by the laws of physics. The second law of thermodynamics is about entropy. Entropy is inescapable. The production life of oil, like all processes in the universe, is subject to entropy over time.
When the price of oil dropped below the cost of production, in June of 2014, it marked the end of the growth of your industry, and it’s very rapid unwinding. And with that, the rapid, total collapse of industrial civilization.
We all face a common enemy. That enemy is collapse. The great human die-off is about to begin. The FED can’t fix it. The President can’t fix it. World War III won’t fix it (not that we won’t probably try it anyway). Basically we’re FUCKED. Now that this process has begun, it simply cannot be stopped. Period. Laws of physics. We are about to ride an unstoppable energy gradient straight into the ground in a gigantic, non-linear, brutal, social collapse and die-off.
Hoping for the best is a waste of time.
Please just remember, I am only the messenger. 🙂
I would suggest that you bother to read my nym before hurling a whole torrent of rubbish and allegations at me.
NAOM
notanoilman,
Dude, I am so sorry, I messed that up. I was just skimming comments and I misunderstood. Sometimes it is hard to tell from an individual comment who is saying what. I am new here. Forgive me. My message was meant for
someone elseeveryone.
Who are the trolls in your mind?
What do you think of my message?
—EDIT—
Wait, what torrent of rubbish and allegations? I am trying to tell a very difficult truth, and I never made any allegations that don’t apply to all humans. My post was very heartfelt and sincere. I must admit your reaction baffles me. Please explain why you reacted that way. Thank you.
Hello? Anybody out there?
Am I being shunned?
What the fuck for?
For trying to say the truth?
Wow. This place sucks.
I’m sorry, this page from the hillsgroup is a bunch of nonsense.
The increase in the cost to produce oil I can easily believe.
The other curve, though, the maximum amount consumers can pay and the economic value of oil (which goes to zero, and apparently even negative, shortly after 2020), is nonsense. No real support is given for this curve, except to say that it is derived from some model (not presented) that is claimed to be very accurate.
No, this is not physics nor thermodynamics.
I am inherently skeptical of any argument about “the maximum amount that consumers can pay”. There is no such animal. If gas is cheap, people will use more; if gas is expensive, they will use less. Supply and demand will come into balance; this is economics 101.
If you want to claim there is a maximum amount consumers can pay, I want to see real support for that, not just references to some magical formula or obscure (but unstated) references to physics. If you want to claim physics or thermodynamics, let’s see your formulas and calculations.
Techsan,
“I’m sorry, this page from the hillsgroup is a bunch of nonsense.”
So you didn’t read all 5 pages, but you are sure it is wrong. Okay.
“Supply and demand will come into balance; this is economics 101.”
The rules have changed.
Supply and demand are in balance right now, but at a price that will not pay the cost of current oil production plus investment in future oil production. The current cost of oil production is north of $100/barrel. But the world cannot afford $100 oil now. As the oil industry shrinks, so will the economy. That means we will never be able to pay the full cost of oil production ever again. The economy will shrink until it collapses. How could it be otherwise?
“No real support is given for this curve, except to say that it is derived from some model (not presented) that is claimed to be very accurate.”
I think the model is well described in the link. But I have a very strong physics background. I am not making the argument from authority here, more like the argument from astonishment that it isn’t intuitive to everyone.
“No, this is not physics nor thermodynamics.”
Yes, actually it is.
“I am inherently skeptical of any argument about “the maximum amount that consumers can pay”.”
I can tell. But the consumers of oil have to bear the full cost of that oil’s current and continued future production. And the oil consumer’s income depends on getting enough economic activity from the use of that oil to feed, clothe, shelter, and entertain himself, plus have enough left over to pay for more oil. If we can’t even do that now, how can you possibly think we can ever do it again?
Catch-22.
I can see that it is hard for you to believe the implications to society derived from the model. But you are not actually making an informed argument. You are making an argument from astonishment.
“If you want to claim physics or thermodynamics, let’s see your formulas and calculations.”
If you don’t understand the physics being described, how would the exact formulas derived from the second law of thermodynamics used in the model help you in any way?
I’ve had lots of physics, and made an A in statistical thermodynamics. Bring it on.
Lloyd,
Interesting you comment about education being looked down upon. It was along time before I put my qualifications on my CV. I was also very careful of what I said, because as a roughneck, you are not suppose to know anything. I was not until I got a few steps up the ladder that I could relax a bit and be taken seriously.
The oilfield usually works in small remote groups and places. We are geographically spread but a close community. So anybody that is willing to get out, work and hold their own, deserves support, but you do need to work as a team and fit in, which can be difficult sometime due to different backgrounds.
As for DN Girl. Somehow she is seen as a threat for the couch potatoes, who are more interested in conspiracy theories, than someone doing a real job, earning real money.
I say good luck to her and her hubby. They have made decisions, taken chances and doing well. As long as they watch for the pit falls, they can do well.
The key to being a good rookie is to work hard, listen and ask good questions. I found that letting people know what was going on, what we were expected to get accomplished over the next 24 hours, and feeding the tool pusher croissants with Swiss cheese and mushrooms was the key to a successful well.
Oil’s price is a whirling dervish in a whirlpool swirling ten thousand feet deep into the ocean’s depths driving its way thirty feet into the fifty feet of ocean mud then yo-yo-ing back up to a water spout forming a hurricane then somehow spawning a spectacular display of aurora borealis and australis, then whirling to a swirling chaotic ten thousand times Texas-sized twister, crazy cyclone, twirling its way around the world only to be crushed by a crashing smash into the ground of reality.
Tomorrow’s whiplash will be just as exciting. Heckle and Jeckle taunting and tormenting oil’s price to a humbled fool, a dunce.
The present zeitgiest using some hyperbole, the cognitive dissonance reeling the brain dizzy. How can it be that the price of oil is where it is? It makes no sense. Could just as well pump it back to where it came from, it’ll cost less, or don’t drill for it at all, it will be useless, you won’t make a dime.
With my discounts, the price of gas today is under a dollar per gallon, might as well say it’s free. It don’t make no sense. No, it is not ‘It doesn’t make any sense’, it’s ‘it don’t make no sense’.
In the old days of oil, one had to change the engine oil every 1500 miles, the old wear and tear, heat damage to the oil, etc., shortens the life of engine oil, the good ol’ Oklahoma crude would break down and cause engine damage if you didn’t change the engine oil. The Purol from yesteryear did the job for only so long.
The new world of synthetic oils is here, it is not a problem to operate a passenger vehicle up to 15,000 miles between oil changes thereby reducing the cost of engine maintenance by nine times and a ninety percent reduction in oil consumption for oils used for engine lubrication. Synthetic oil saved the day for engine life, saves oil for other purposes. In other words, for every ten quarts of oil used, nine are free of charge, you will never use them, therefore, they’re free and free to use for some other purpose.
What was once a gallon tank for fuel is now a one quart tank for greater efficiency and the engine oil is topnotch there too, so engine life is much greater, for some engines and specific applications, it can’t get much better. With much less consumption of fuel to do the job better, new engines are far superior. Specifically, Honda small engines.
The ICE is at the top of its game these days, nothing better and can’t be beat, for now anyhow. Honda small engines are the finest money can buy. Can’t hurt to plug capitalism, Honda engines perform flawlessly.
Stihl chainsaws will be in the same category, the best. If you are considering a chainsaw purchase, the Stihl dealer will tell you not to purchase any other brand, ‘don’t do it’ are words you will hear from a Stihl chainsaw owner if the buyer is considering purchasing a different brand of chainsaw. Have a double-bladed axe too, along with a limb saw and a bow saw. Work with those for a couple of hours and then switch to the chainsaw, see which does the better job with greater ease and efficiency.
Those two name-brand businesses are in it to make products that definitely reduce the effort to get something done. It will be with effortless ease, if you think about it. Sorry for the digression.
Without oil, they wouldn’t be in business.
43 dollar oil helps defray costs for eight dollar per pound brisket, six dollar per pound bacon, eight dollar per pound cheddar cheese and fourteen dollar per pound steak. Dirt cheap foodstuffs.
Groceries are at some of the lowest prices in many years, absolute bargain basement prices.
The madness continues.
The junkyard owner and mechanic will always advise you to use your seat belt and obey all traffic rules and signs.
Ron, i agree with you about Venezuela. I suspect those third party numbers opec uses may be getting confused because venezuela is importing diluent crude, the venezuelan refineries are having trouble, and there are internal stock changes nobody is tracking. I’m aware of gasoline sales from the USA and now Trinidad towards Venezuela. Their production is “measured” to a large extent by counting tanker loads. But even though crude production is down they may be just shipping crude they can’t refine in the three refineries we know are having serious problems.
In other news w have a scandal breaking out as the police in Madrid investigate a bank which was laundering money for venezuelan officials including several viceministers. I think the eventual outcome will be the indictment of both venezuelans as well as Spaniards cooperating in the laundering operations. Some of this money seems to have been routed to pay for hard left political campaigns in several countries, and to buy politicians. It’s a huge can of worms. They report anything between $2 usd billion to $4.2 usd billion laundered over about a 10 year period. And some of the money appears to have been routed to usa policians?
I did some napkin arithmetic.
Likely world oil consumption increase by 2020: 5 to 7 million bpd.
Likely OPEC oil production increase, under the rosiest of scenarios by 2020 (Iranian sanctions lifted, end of Libyan Civil War, continued Iraqi and Kuwaiti production increases, rest of OPEC held steady): 2.5 to 3.5 million bpd.
Now, if the rest of the world outside of OPEC is in decline, and U.S. shale production has peaked, you’re still looking at a 1.5 to 4.5 million gap that needs to be made up for. A deficit of 500,000 to 1 million put us at $100+ oil.
We’re in trouble.
Of course, if China goes into a Japan-like slump and Indian growth never takes off, we’ll have nothing to worry about.
Where did you get the increase in demand?
Total consumption went from 88 million bpd in 2010 to what is likely to be 93 million bpd in 2015 during a period in which growth in the developed countries was sluggish and oil was priced pretty high.
Basically, I am assuming that the world adds 1 million bpd of consumption per year for at least the next 5 years.
This only happens of course if:
1) U.S. consumption stays flat or slightly increases YOY
2) China doesn’t spiral down into a recession and keeps growth at 7%, on average, for the next 5 years.
3) E.U. stays out of recession and perhaps recovers a bit.
5 million in increased demand is a much safer bet than 7, which I think would require a major takeoff in India.
I suggest you segregate products. The figures you use include NGL and biofuels. Ron focuses on crude and condensate, which is the proper approach. Try again the crude and condensate, remember some condensate components don’t yield the desired refinery products.
Then account for potential increases in refinery gain as refineries try to increase hydrogen addition and swell the output. I think we may see a diesel price increase which in turn drives more gasoline driven vehicles, and the plug in hybrid fleet should take up a little slack.
When you go through these gyrations you may end up making a peak oil projection within the next five years. But it will be driven in part with market share gains by other sources.
Consumption will go up by exactly the amount production goes up. If production goes down then consumption will go down.
It is my opinion that C+C is at peak right now. Therefore, if I am correct, then consumption will go down by 2020. It will go down by the exact amount that production goes down.
I have no idea what NGLs, (bottled gas), will do.
I suspect NGLs will depend on gas production. Ethane is an interesting NGL. It’s mostly used as a chemical feedstock. it’s also the most abundant of the light components after methane.
If, as the IEA believes, oil prices average about $55/bbl in 2015 and not reach $73 until 2020, a lot of assumptions will have to be modified: Because, these prices are clearly well below those needed to justify investment in and exploitation of expensive-oil options like tar sands and Arctic oil.
It seems to me as if a new reality is being signaled by the many recently stalled or cancelled mega-projects. For example, Shell has abandoned plans for a huge petrochemical plant in Qatar; Chevron shelved its plan to drill in the Beaufort; and, Statoil has turned its back on Greenland. If Majors are moving away from expensive future projects it’s probably because they doubt their viability, not because they can’t raise the cash.
And committing to mega-projects is committing to a predictable future. Could it be that Big Oil has decided the next decade contains too many unknowns: AGW issues, upsurge in renewables, a mega recession, you name it? Or, maybe they’ve just discovered Ron’s Blog?
Hi Doug,
Great comment. Thanks!
I hear they communicate with Ron by e-mail. All those Big Oil CEOs report to Mr. Patterson:)
Thanks Dennis. I thought you might be mad at me. But of course, maybe you are? 🙁
At some points, I thought quite a few were mad at Dennis, including Rune. At first, I thought it was my astigmatism acting up again with multiple apologies here and there.
But then, maybe the sun shines out of his behind as the saying goes with regard to certain questionable forms of optimism perhaps, which is probably less of a convenient place for the sun to shine from, such as if for a PV setup for a large town.
You want PV or not? Well then give us our sun back.
In any case, perhaps minimum sunspot cycles reduce swelling.
This post dedicated to our beloved Ronald Walter.
(Throwing my remaining edit time over to Watcher)
“At some points, I thought quite a few were mad at Dennis, including Rune.”
Hey Caelan, we may have a memory hole at peakoilbarrel. Check out:
http://peakoilbarrel.com/eia-confusion/comment-page-1/#comment-504975
Something seems, I don’t know, somehow different. Scroll up a little to see if you notice anything.
Comment was really not placed appropriately by me I was answering a comment further down the thread. My bad.
Hi Doug,
Why would I be mad?
I need you to keep me in line when I say particularly stupid things. 🙂
Or even to question my usual BS.
“I need you to keep me in line when I say particularly stupid things.”
I can help, too, when Doug needs to rest. 😉
Hi Doug,
That was supposed to be a 🙂 at the end, I forgot the space.
And many major were already cutting upstream capex, even before the decline in oil prices.
A reality that has managed to capture more or less no attention.
BTW given China’s appetite for new cars, pretty easy to find 400K bpd just from them in additional consumption. The other 600K can’t be too hard. Let’s start with India. mazamascience’s gizmo shows a delightful upslope on their black consumption line. Ditto KSA.
Now, of course, if the production is not there, then we’ll have growing demand, but lower consumption.
Now, of course, if the production is not there, then we’ll have growing demand, but lower consumption.
The EIA measures demand by what is delivered to refineries. Consumption is products delivered. They are basically the same thing with a refinery in between.
You are thinking of demand as what people want. I don’t know how you would measure that.
You could measure it in feet.
How long the line is at a gas station that will sell only 5 gallons per person.
“I literally can’t stand being on the American highway. To me it is almost like being in a prison of madness. I can stand the background; but I can’t stand the highways in Canada or here. Driving like crazy people. Where are they going? And why are so many of them going in that direction? They are all fleeing something. I would like to inquire what is in those trucks that are tearing down the road. Is it something of no use at all? Or something which is present where it is going? And often I have seen trucks, apparently carrying identical cargo, going in opposite directions, carting it here and there.” ~ Bill Mollison
Watcher,
Are the car sales in China dominantly diesel, or gasoline, or what?
From a line of text read somewhere a year ago it was said China mostly diesel. And from a radio blurb heard a month ago someone said Europe burns diesel vs the US gasoline.
It’s a working hypothesis.
Europe is about 50-60% diesel, 59% according to this note, table 8. I have seen 50% as well. That would probably be sales not fleet but diesel has been high for a long time
http://www.rff.org/RFF/Documents/RFF-DP-14-08.pdf
China is gasoline according to this below and so a blurb from Bosch
Bosch overview of global diesel markets; optimistic about US, China
7 August 2013
China. China currently represents only 1% of the global market for diesel passenger cars. The introduction of the China 4 emission standards on 1 July 2013 imposes even more stringent requirements for commercial vehicles.
https://www.google.com/search?q=china+diesel+mix+passenger+car&rlz=1C1GGGE_enUS466&espv=2&biw=1777&bih=1265&tbm=isch&imgil=DaEqeMIjOXDdiM%253A%253BFdKKMGRLcsaIbM%253Bhttp%25253A%25252F%25252Finfocusrevue.com%25252F2013%25252F03%25252F04%25252Fshould-we-ban-diesel-engines%25252F&source=iu&pf=m&fir=DaEqeMIjOXDdiM%253A%252CFdKKMGRLcsaIbM%252C_&usg=__1zZBDyCcg_0kEpy2fChYa-zSfs4%3D&dpr=0.9&ved=0CEQQyjc&ei=Ix4IVdDYA8uVyATe7oLQBA#imgrc=DaEqeMIjOXDdiM%253A%3BFdKKMGRLcsaIbM%3Bhttp%253A%252F%252Finfocusrevue.files.wordpress.com%252F2013%252F03%252Fscreen-shot-2013-03-04-at-3-14-50-pm.png%3Bhttp%253A%252F%252Finfocusrevue.com%252F2013%252F03%252F04%252Fshould-we-ban-diesel-engines%252F%3B1119%3B557
Synapsid,
UK diesel sales account for more than half of all cars sold and Britain lags Europe which has long preferred diesel to gas. Don’t know about China but since VW is so big there I expect diesel car sales are as well established as in Europe. You’d think that would be an easy number to come up with but not for me apparently!
Compelling stuff for diesel light shale.
The preference for diesel and – to some degree LNG – as fuels is largely shaped by the tax regime on transportation fuels in the EU.
To what extend that’s a function of giving preferential treatment to the hauling sector (re diesel of course) vs. resource based planning I don’t know.
rgds
WP
I occasionally post to a motorcycle user blog site for a new model I now ride, a Honda cb500X. I am absolutely amazed at the number of people who commute on them in England, year round. One fellow has a 2 hour commute (each way) into London. Housing unaffordable, plus…apparently rail service for commuters now privatized and cost is prohibitive.
Yesterday, I had some errands to do in town and rode in the 75 km at 10:00am with frost on the side of the road. It was frigging colddddbrr. I would hate to commute this distance on a bike, in fact it is downright dangerous in icy conditions.
These commuters are really suited up, use carrying boxes for lunch and suits, heated grips, windscreens, good gear all around.
regards
Doug L and all Y’all,
Thanks. The US has been exporting diesel to Europe and Europe has been supplying the US with gasoline for some time, though I don’t know if that is currently the case.
For All: There’s an article on Bloomberg today about Saudi Aramco’s focused recruiting efforts–they are looking specifically for expertise in shale and aiming at (surprise!) laid-off US oil workers. Makes sense.
I am in China. Basically all the passenger cars sold in China are gasoline-powered, except a small number of SUV models.
Ya my phrasing shaky. What I read from somewhere forgotten was the bulk of new Chinese overall oil consumption was diesel. I should have been more explicit following a question about car sales.
Thanks Skywalker. Stick with this site, please; you are just what it needs.
Good points, Doug…
Oh, those impending fractally knock-on effects…
But it does seem reasonable to expect that, yes, increasingly, those who have more leisure, even desperate, time on their hands will discover Ron’s blog, and maybe even run a few camouflaged ads on it. ‘u^
Well, maybe Ron could start charging sliding rates relative to topic deviation, via Paypal, with vile name, etc., surcharges and discounts for highly-rated comments.
Hi Doug.
“It seems to me as if a new reality is being signaled by the many recently stalled or cancelled mega-projects. For example…”
Yes. The oil industry is beginning to wind down, as should be expected. Conditions fundamentally changed when the cost of production exceeded the ability of consumers to support that production, around June of 2014. So it’s all down hill from here. How could it be otherwise?
Oil breaks $43.00 and bounces of new low of $42.64
current WTIC spot $42.87
WTIC spot $42.51
I don’t know about worldwide, but here in Europe we pay a huge fuel tax. The overall cost of energy is inflated by taxes and mandates. I suspect it’s similar in the USA to some extent. Can’t tell about China, maybe PE can help.
Conclusion: we ain’t there yet. What we are seeing is a strong effort to cut fossil fuel use (mostly because of energy security concerns).
Hi Fernando,
There is a bit of this effect in the electricity market in the US, but in many markets (Midwest mostly, and parts of the south) electricity prices are quite low.
On a federal level taxes on liquid fuels are very low, a few states (New York, and California and a few others) have somewhat higher fuel taxes, but they are still very low by European standards. The US can easily afford European levels of energy taxation, it is the smart way to transition away from fossil fuels, which must be done eventually.
In Canada it varies widely. However, it is pretty much standard that our costs are 2X what US pump prices are. $1.219/litre, yesterday….more in Vancouver where the transit taxes are imposed.
Gas price in China right now is about US$1.0/liter, which translates into roughly US$3.785/gallon. Roughly 44% of that price is tax. Chinese government quickly raised gasoline related consumption taxes after recent drop in oil price because it wants to continue to push the consumers to use less gasoline.
Hi Futilitist,
Can you explain why consumers could no longer afford oil in June 2014? The better explanation is that more supply was introduced to the market (Libya has a big increase around that time) and that excess supply drove down prices, a little.
Prices moved down more quickly when OPEC claimed they they would not decrease output (around early Novenmber this was being reported). Many people (myself included) thought this was political posturing, but when OPEC met and did not decrease output quotas as many had expected around the end of November, then oil prices really dove.
The story is much more of a supply story than a demand story.
For many years OPEC acted a stabilizing force in the Oil Market, they have relinquished this role for now an it will take time for the market to adjust. Currently there is plently of oil supply so prices are low, and despite what you believe, the World economy is doing pretty well at present, low oil prices with adequate oil supply will only improve the economy.
As the oil supplies become tighter as demand increases due to higher economic growth, oil prices will eventually increase.
Your premise that the economy cannot afford $50/b or even $80/b oil is false.
Hi Futilitist,
Eventually the oil industry will wind down, but it will be high prices that will accomplish this, low prices only cause people to think that there is plenty of oil so they go buy an F150 for buying groceries in the city or suburbs. When oil prices are high, then consumers will not be able to afford oil, oil companies will produce all they can at the high prices and if prices remain high, or increase even more as oil depletes, then consumers make different choices.
The drop off in oil supply may be less rapid than you believe. Without action by OPEC or some entity to control oil output, we could see a lot of volatility in oil prices because it takes some time to adjust oil supply in a free market situation. This is the reason that the RRC controlled oil output, and when Texas peaked and could no longer serve as the swing producer, OPEC took over that role, which allowed relative market stability.
It would be great if the NDIC and RRC of Texas acted to limit output in order to stabilize the oil market. The RRC already has the power to do this (unless the laws have been changed in Texas). The NDIC would need to be given this authority by the ND legislature.
Hi Dennis.
“The drop off in oil supply may be less rapid than you believe.”
I do not believe the drop off in oil supply will be rapid. Up until the very moment of catastrophic social collapse, I believe oil supply will be abundant relative to the diminishing needs of an increasingly impoverished population. The price will remain depressed, below the aggregate cost of production. This will positively feed back and wind down the oil industry, just as it is doing today.
Consumers have to bear the entire cost of oil production for civilization. The cost of production is currently too high for consumers to do this because they have been having their purchasing power continuously eroded since the start of the Great Recession. $100+ oil finally became too much.
Oil no longer provides enough benefit to society to pay for it’s own continuing production. Catch-22.
This new economic paradigm began in june of 2014. There is no way to stop the positive feedback cycle that will shrink the oil industry and, thus, civilization itself, until complete social collapse finally overtakes and dissolves the system.
How could it be otherwise?
Hi Futilitist,
On oil not providing benefit to society. If it did not, it would not be used. Your argument that oil collapse leads to social collapse depends on the notion that oil provides many benefits to society. You are confusing a short term drop in oil prices (which has happened repeatedly in the past), with the signal that the collapse has begun.
“This time is different! “, you claim. Probably not, this has been seen before. When the peak has arrived and it is clear to everyone, not just those of us who believe that peak oil is either here or will arrive within 5 years, then things will be different and perhaps there will be societal collapse, there will be a recession or even a depression, but collapse is not a given.
The peak is not likely to be recognized until 4 or 5 years after it occurs by average person, they will see rising oil prices, followed by recession and the peak in oil output will be blamed on the poor economy and lack of demand for oil, it is only if (or when) the economy begins to recover and oil output never rises to previous levels that people will realize that those peak oil guys had it right. Maybe something will be done by society once a crisis arrives, there is much that could be done. it is unknown what will be done.
Oil provides plenty of benefits to society at $50, $80/b, or even $100b. If not why was the World economy functioning pretty well from 2011 to the present with Oil between $90/b and $120/b over most of that period? The IMF data suggests World real GDP growth was steady at about 3.2 to 3.3% from 2012 to 2014. Chart below using data from EIA real prices viewer and IMF World Outlook.
Hi Dennis.
One more time.
Oil consumers have to bear the entire cost of oil production for civilization. Oil no longer provides enough benefit to consumers to pay for their own needs, plus the cost of continuing oil production. Future production is being curtailed as we speak, while oil companies concentrate on current production just to meet cash flow requirements. This is a paradigm shift. Oil’s overall utility to civilization has turned negative. This cannot be ‘fixed’ and will, very soon, result in the total collapse of industrial civilization.
“Oil provides plenty of benefits to society at $50, $80/b, or even $100b. If not why was the World economy functioning pretty well from 2011 to the present with Oil between $90/b and $120/b over most of that period?”
Oil used to provide those benefits to society when we could still afford to pay for it’s continuing production. We can no longer afford to do this.
As I said, oil consumer’s aggregate ability to afford oil (oil affordability), has been dropping steadily, since the Great Recession. At the same time, the cost of oil production has been steadily rising. In june of 2014, the cost of oil production exceeded the ability of oil consumers to meet their own needs, as well as pay for future oil production.
The cost of oil production overtook oil affordability in June of 2014. Since then, lower prices have resulted in more production, which keeps lowering the price.
This is simply a fact. It is an observation of actual reality. All I am saying is that this new condition, which has existed since june of 2014, and continues to exist today, is now a permanent condition. There is no way to stop this feedback loop.
Oil no longer provides enough benefit to society to pay for it’s own continuing production. Catch-22.
This time really is different.
Please take the Futilitist Collapse Challenge at:
http://peakoilbarrel.com/eia-confusion/comment-page-1/#comment-504528
If you can’t come up with a logical way to somehow get the green line (oil affordability) back above the black line (oil production cost), and get oil to trade in between the two lines, then you will not win the challenge. Sorry.
But perhaps, then, you will finally comprehend the true nature of our current dilemma. Good luck with all that.
Hi Futilitist,
For the World economy, real income was increasing by an average of 3.9 % from 2010 to 2014, oil prices were relatively flat or decreasing in real terms over this period, so oil affordability was increasing.
Your charts cherry pick data points on the oil price chart, not a very viable measure of oil affordability. Not an an impressive theory at minimum you should use the running 12 month average price. Nor it is a given that less oil availability leads to collapse, it will lead to changes which you assume cannot prevent collapse, I think it will lead to slow growth at minimum and likely a depression, the crisis may lead to positive changes or negative changes.
Just as it is silly to assume only positive changes can occur, it is equally silly to assume that only negative social changes are possible during a crisis.
Dennis,
“For the World economy, real income was increasing by an average of 3.9 % from 2010 to 2014, oil prices were relatively flat or decreasing in real terms over this period, so oil affordability was increasing.
Your charts cherry pick data points on the oil price chart, not a very viable measure of oil affordability. Not an an impressive theory at minimum you should use the running 12 month average price. Not an an impressive theory at minimum you should use the running 12 month average price.”
Bullshit! That is fallacious averaging. It is like erasing good data. Doing what you suggest would only serve to obscure any useful pattern. (Like this current dialog between us).
“Nor it is a given that less oil availability leads to collapse, it will lead to changes which you assume cannot prevent collapse, I think it will lead to slow growth at minimum and likely a depression, the crisis may lead to positive changes or negative changes.”
Okay, this part is getting close to collapse denial. You are saying if we just try hard enough we can do practically anything. Yes we can! This is not just unrealistic, it is also very unscientific, so not really worth discussing further.
“Just as it is silly to assume only positive changes can occur, it is equally silly to assume that only negative social changes are possible during a crisis.”
What is really silly is this argument.
Clearly you cannot find a way to defeat the Futilitist Collapse Challenge. Thanks for playing the game.
One more thing to think about, Dennis.
Are you suggesting that the price of oil will rise to over $100 anytime soon? If not, then whatever price oil settles at will not be able to fully pay for the ongoing cost of oil production. Period. And if we can’t do that, the oil industry will shrink won’t it? Catch-22.
And here is something else:
http://peakoilbarrel.com/eia-confusion/comment-page-1/#comment-504784
In this post I show exactly how and why the FED has been manipulating oil prices with QE and twist to fine tune the oil price and affordability.
My theory is highly explanatory of current market behavior, and, so far at least, highly predictive as well. We will have to wait to see if it holds up.
In the meantime, you clearly did not refute my very robust theory. I’m not sure if you even understand it, or perhaps you are just pretending not to. I don’t care.
I invite everyone here to take the Futilitist Collapse Challenge soon. Hurry, before (oil) supplies run out! Operators are standing by.
http://peakoilbarrel.com/eia-confusion/comment-page-1/#comment-504528
Whoever said science wasn’t fun? 🙂
A challenge? hmmmm.
Well, let’s start with asking where’s the data for the green line? Car sales are rising, incomes are rising, and buyers of both new and used cars are buying vehicles twice as expensive and half as fuel efficient as they could. There’s no sign of people unable to afford fuel.There no sign of falling “affordability”.
2nd: if the price of oil rises, people will move to more efficient vehicles and EVs. EVs are already much cheaper than oil-powered vehicles. So, it’s not affordability that’s in question, it’s competitiveness: expensive oil just can’t compete with the alternatives.
Hi Nick G,
You are wasting your time.
His method of arguing is to quote you, then say that was a silly argument.
Clearly this proves that he is correct, at least in his mind.
Hi NickG.
“Well, let’s start with asking where’s the data for the green line?”
All the data is contained in the oil price. Green line through the tops, black line through the bottoms. Simple.
http://www.thehillsgroup.org/depletion2_022.htm
The price of petroleum is controlled by two factors:
1) The cost of production.
2) The $ amount that the end consumer (the NEGs) can afford to pay for it.
What the end consumer pays must be sufficient to cover the cost of production. All production cost must be borne by the end consumer, who includes the end buyer, and the societal cost required to produce petroleum, and its products.
“…if the price of oil rises, people will move to more efficient vehicles and EVs.”
There’s the rub, Nick. From now on, the price of oil can never rise enough to pay the total cost of oil production. This will shrink both the oil industry and civilization itself, until the whole system falls apart.
Consumers have to pay for a lot of things besides energy. They are already stretched thin. And since the economy will start shrinking, consumers will get poorer and poorer. Under these conditions going forward, how could consumers ever afford to pay the EXTRA cost of developing EV’s on top of everything else?
Bad news for EV’s. Sorry.
All the data is contained in the oil price. Green line through the tops, black line through the bottoms. Simple.
That’s not what’s shown in the chart.
The green line doesn’t go through all of the tops, just two (or possibly 3). And, it doesn’t include tops from before roughly 8 years ago. Is there an objective process to choosing *which* tops to use, or is it entirely subjective?
The chart shows that the most recent bottom is around $47. If the black line went through the bottoms, it would be almost flat. So, why exclude the most recent bottom?
The price of petroleum is controlled by two factors:
1) The cost of production.
And, which cost of production are you using – average, or marginal? US, KSA, Russia, Canada, or the whole world? And, how do you know what that cost level actually is?
In fact, the cost of production rose sharply in the US in the last several years because of sharply higher demand for supplies, labor, contractors, rigs, etc., etc. In the last several months those costs have been falling again. Where is that shown in the chart?
2) The $ amount that the end consumer (the NEGs) can afford to pay for it.
No. It’s what consumers are willing to pay. EVs are cheaper than oil-cars. Heck, the average car buyer pays 2.5x more than they have to get basic transportation. It’s quite clear that people’s mobility is *not* controlled by they can afford. If it was, why would the average car price be around $32k, when there are basic cars available for $12k???
More to the point, why are people buying, on average, cars with MPG of about 25, when they could get cars with 50MPG?? It’s quite clear that people’s mobility is not being limited by what they can afford. They’re paying far more than the minimum!
how could consumers ever afford to pay the EXTRA cost of developing EV’s on top of everything else?
Ok, are we clear that EVs are *cheaper* than oil-cars????
In fact, they’re the cheapest cars on the road even without tax credits. With tax credits, they’re insanely cheap. Let’s see. The average car costs about 58 cents per mile to drive.
IRS Average New Car Cost per mile: 57.5 cents per mile.
The Leaf, without tax credit, is the cheapest car you can find to own and operate:
Total Cash Price $25,327
5 Year True Cost to Own: 28,079
Cost per mile: 37.4 cents per mile.
A typical small car like the Honda Civic Sedan is more expensive:
Total Cash Price $21,644
5 Year True Cost to Own: 36,154
Cost per mile: 48.2 cents per mile.
And a Chevy Volt, a car without any compromise because it can run on gas, is less expensive than the average car even without the tax credit:
Total Cash Price $31,500
5 Year True Cost to Own: 40,129
Cost per mile: 53.5 cents per mile.
http://www.edmunds.com/tco.html 1/27/15
If we subtract just the Federal credit of $7,500 (and several states have credits as well), that subtracts 10 cents per mile. The Leaf costs less than half of the average car, and the Volt is substantially less expensive than the Civic.
And, you very rarely go to the gas station, and it’s much more fun to drive!
Hi Nick.
Gosh, that’s a lot to respond to in such a thin column. You are having some conceptual problems that are causing unnecessary questions. Maybe this will help:
The graph that I presented actually spans three distinct economic paradigms.
1) The paradigm of growth.
(from the left border to the top of the great oil spike of 2008)
2) The paradigm of stagnation.
(from the 2008 spike to June, 2014)
3) The paradigm of collapse.
(June, 2014 until now. There will be no other paradigms from now on)
So it makes sense to draw the green affordability line after the spike/crash of 2008, because that reset fundamentally transformed the economy.
The black line is not the exact cost of production. It just represents where the price turns due to the rising cost of production. The exact cost of production has to include a profit and must also cover investment in future production. A healthy price for oil is now $100+. We are now far below that price. We will never reach it again. It is physically impossible.
Please read this:
http://www.thehillsgroup.org/depletion2_022.htm
There are 5 pages. Read them all.
If you have any understanding of physics, you will realize what this means for civilization. If you don’t, then carry on with your EV dreams. You will die in your sleep.
Well, I see several problems – here’s the first:
The start and stop points of the periods covered by the 3 paradigms are arbitrary. How do you know when growth ended? GDP is still growing, and is larger than it was at “the top of the great oil spike of 2008”. Both US and world GDP are larger than they were in June 2014.
So, how do we know growth is over, when the economy is still growing?
Dammit Nick,
At 3:40 PM, I gave you a link to five pages explaining the basis for my simple graph. This link explains a model of oil and the economy that is based on the second law of thermodynamics. The equations that drive the model are derived from this law. So the model is a physical model.
I also suggested that you read and understand the whole thing so as to clear up your misconceptions and help you understand my simple graph.
Posting all of this takes time. My time. I don’t get paid to do this like you do.
At 3:53 PM, you answered back.
That is 13 minutes to read and understand 5 pages explaining how a physics based model of oil and the economy works, comprehend the implications and the relationship to my much simpler graph (which you currently do not understand), and then type another question at me!!!
I find it hard to believe that you are both a speed reader and a physics wiz.
So please go back, relax, take some time to read and actually understand the material I gave you before you ask another ignorant question. Otherwise you are being both disingenuous and disrespectful. Stop wasting my time. Thank you.
“So, how do we know growth is over, when the economy is still growing?”
The world growth numbers are not up to date. It is likely that growth has already ceased, but we didn’t get the update yet. We will know for sure when the oil patch defaults begin in earnest very soon.
On oil not providing benefit to society. If it did not, it would not be used.
Kinda like heroin.
Or lead in paint and gasoline.
Or kerosene for lighting.
Hey Doug.
“It seems to me as if a new reality is being signaled…”
That is what I have been saying. Hardly anyone is listening.
I’ve been trying to tell people here that there was a major paradigm shift that happened in June of 2014. The cost of oil production exceeded the ability of consumers to afford to pay for the continuing production of oil. The cost of oil production will continue to rise, and oil affordability will continue to fall. So, the price of oil can no longer ever meet the cost of production. This means that the oil industry will shrink from now on.
People here are starting to try to blame the EIA and IEA for making bad projections on purpose to help banksters steal their oil jobs! Ridiculous. No one seems to want to face the truth. Big surprise.
Please take a look at my Futilitist Collapse Challenge:
http://peakoilbarrel.com/eia-confusion/comment-page-1/#comment-504528
I made the challenge as a fun way for people to try to get their heads around the new ‘normal’. I would really love your opinion on it and the theory that the oil industry must now shrink due to the cost of oil production not being able to be met going forward.
This is the simple, yet highly unwelcome answer. It is so unwelcome that even Ron refuses to believe it.
People here respect what you say, Doug. I could sure use your help convincing some of them. Thanks.
Hi Futilitist:
I’m shepherding my wife to a high energy physics conference in La Thuile, Italy for a few days so will be out-of-the-loop here for a wee bit. Meanwhile, I look forward to reading your “Collapse Challenge” stuff. And, I WILL get back to you. Doug.
Thanks Doug.
Hi Doug,
To my eye, Futilitist’s “science” looks like random lines drawn on an oil price chart to tell the story he wants, far from scientific. Someone could take a price chart and draw different lines to tell any story they want. Then the two can shout at each other in bold letters with each calling the other a denier of truth.
Whatever.
Hey Dennis,
The lines are not random.
The price of petroleum is controlled by two factors:
1) The cost of production.
2) The $ amount that the end consumer (the NEGs) can afford to pay for it.
What the end consumer pays must be sufficient to cover the cost of production. All production cost must be borne by the end consumer, who includes the end buyer, and the societal cost required to produce petroleum, and its products.
This has already been explained to you, Dennis. You keep ignoring it and bringing up again. This not legitimate in a debate (it is cheating).
And I think Doug can figure it out for himself.
It is the quality of the argument that counts, not how many are making it. Logic is the arbiter.
Wow! You really have some very screwy ideas. The price of petroleum is controlled by two factors, just not the two you named. The price of oil is controlled by:
1) Supply
2) Demand
The cost of production has very little to do with the selling price. Saudi produces oil for perhaps $5 a barrel or less where some Bakken or Oil Sands oil cost upwards o $70 to $80 a barrel. Which one of them controls the selling price? Obviously neither does.
Of course affordability does have some input into the demand equation. But the state of the economy has more to do with demand than anything else.
Hi Ron.
My ideas are not screwy. Saying they are screwy does not make it so.
Supply and demand do control the price, but only within a system that operates exactly like I said. The aggregate cost of oil production cannot rise above what the average consumer can afford. Period.
http://www.thehillsgroup.org/depletion2_022.htm
The price of petroleum is controlled by two factors:
1) The cost of production.
2) The $ amount that the end consumer (the NEGs) can afford to pay for it.
What the end consumer pays must be sufficient to cover the cost of production. All production cost must be borne by the end consumer, who includes the end buyer, and the societal cost required to produce petroleum, and its products.
The statement above is TRUE. It has to be.
Are you saying it is false? Prove it.
Please read through the entire link above before you answer.
No, first you tell me “Who’s cost of production determins the price of oil”.
Is it OPEC’s cost, Canadian Tar Sands cost, Bakken cost, Permian cost, Venezuela’s cost or who’s?
Ron,
It is the world aggregate average cost of oil production that determines supply vs. the world average oil affordability that determines demand. Together they determine the price. The price must be above the cost of production and below the maximum affordability, or the system will self destruct.
That self destruct process has begun since oil is now cheaper than the cost to produce the oil. And it won’t just fix itself like it always has in the past. That is because economic activity will shrink, meaning consumers will have less and less money from now on.
Oil can no longer provide civilization the bang for the buck necessary to support sufficient economic activity plus current and future oil production at the same time. Catch-22.
You really should read through the link I gave you. The model is based on the second law of thermodynamics. The concept is very sound.
I think futilist’s parameters determine the minimum maximum “theoretical” prices, assuming all players remain in the market.
But those prices aren’t very realistic. As Ron points out, supply and demand more strongly drive the real price.
Furthermore high or low prices can eliminate marginal players, thereby changing the theoretical limits. This is what is happening to LTO drillers right now. Higher prices would also drive out marginal consumption scenarios like driving SUV’s to the shopping mall, raising the theoretical maximum.
But supply and demand only determine the price in the long run — and in the long run we’ll all be dead anyway. In the real world, prices are “sticky”. For example, wages don’t fall smoothly when unemployment goes up because labor contracts cannot be renegotiated so quickly. Another example is the inability of a country to adapt transportation infrastructure quickly to changing energy prices.
Traditionally, prices were heavily influenced by shocks caused by too much or too little goods on stock. This is usually identified as the cause of the business cycle, and just in time manufacturing is said to have reduced the problem significantly.
There is a lot of “rent taking” in commodity markets. This is when producers take huge profits, as illustrated by the megacities being built in the Persian Gulf. This represents a major disconnect between price and cost.
I firmly believe, BTW, that the recent fall in oil prices is related to traders’ newfound thick skin about political problems in the MidEast. Panic fatigue, if you wish, has decreased rent taking.
Ilambiquated,
“I think futilist’s parameters determine the minimum maximum “theoretical” prices, assuming all players remain in the market.
But those prices aren’t very realistic. As Ron points out, supply and demand more strongly drive the real price.
Furthermore high or low prices can eliminate marginal players, thereby changing the theoretical limits.”
The problem with your perspective is that a low price for oil forces all producers to pump as hard as they can to stay in business and maintain market share. This keeps the oil supply high and the price low. That is the current situation. When the most marginal players begin to default, less marginal producers with better cash flow will buy up the best producing wells from the failing producers. This will keep the oil supply too high, which will, in turn, keep the price from rising enough to stop the shrinkage of the entire oil industry going forward.
The overall economy will shrink with the oil industry that supports it. That means that oil affordability, which is dependent on the economic activity generated by oil, must continue to decline, while the cost of oil production must continue to increase.
Catch-22.
Supply and demand are working just fine, but the price that gets set will, from now on, never be high enough to fully support the entire cost of oil production. There is simply no physical way that the price of oil can ever rise enough to pay for the entire cost of oil production ever again.
Here is the physics reason why:
http://www.thehillsgroup.org/index.html
Please read the whole thing.
The model is very accurate because it is derived from the laws of thermodynamics. The life cycle of oil production is a process that is subject to the second law of thermodynamics (entropy). All the oil that will be produced is dependent on all the oil that has already been produced.
Doug, those hotels al La Thuile don’t have good wifi in the room. And take a can of coffee. Theirs isn’t that good.
Hi Anonymous,
This response is to the post by Anonymous on March 16 at 4:28 PM and Ron and Fernando’s comments just below it. Link below
http://peakoilbarrel.com/opec-crude-plus-more-on-eia-estimates/comment-page-1/#comment-504887
Along with Fernando’s suggestion, you could separate out ethanol and NGL barrels and multiply those barrels by 0.7, because they only contain about 70% of the energy of C+C (crude plus condensate). I would also ignore refinery gains.
The best approach is Ron’s approach which just uses C+C.
If we look at only liquid fuels (ignore LPG and other products), for 2004 to 2012 output increased by about 475 kb/d, we will call it 500 kb/d to make the math(s) easier. C+C output increases have been similar to this over the 2004 to 2012 period, so we would need to get to 79 Mb/d by 2018 to meet that level of demand increase. I agree with Ron that demand (where demand equals consumption) will be equal to supply and it is not likely that supply will reach 79 Mb/d by 2018, 78 is a possibility, but I think output is more likely to be flat from 2014 to 2018 or down slightly.
That should be that liquid fuels increased 500 kb/d each year from 2004 to 2012, 2011 and 2012 were estimated by using the % of liquid fuels to total petroleum in 2010 and assuming it was the 2010 level in 2011 and 2012, no EIA consumption data for the World is available after 2012.
Anonymous Wrote:
“Of course, if China goes into a Japan-like slump and Indian growth never takes off, we’ll have nothing to worry about.”
Sure we do! War! When the Chinese economy slips unemployment will soar. Lots of restless men (and too few women) will become agitated, lead to very large protests, and later large riots. A Centralize Chinese gov’t will need to solve the problem of under-employment and over-populated cities. The old book says, when your regime is doubt because of a poor domestic economy, send idle men to War!
China should be able to manage 6-7% growth for a few more years (longer term growth outlook is uncertain) with its massive dometsic market being the main growth driver. Unlike Greece, China has its own currency and can print money to help deleveraging its banks and corporate sectors. Moreover, people usually look at the huge debts incurred by the Chinese companies and local governments but they forget that unlike Greece, Chinese government has tons of assets along with tons of debts. It can easily sell the assets to raise the cash if needed. And Chinese families are very under-levered. One last thing – China’s total labor force peaked in 2011 and started its first decline in 2012. So unemployment shouldn’t be too much an issue.
In short, with 20 millions of new cars being sold each year and a 6-7% GDP growth a year in China, we don’t need to worry about Chinese oil demand too much in next 5 years.
Calling Jeffrey Brown, calling Jeffrey Brown:
“Saudi Arabia Will Need More Oil to Feed Local Refinery Expansion
http://www.bloomberg.com/news/articles/2015-03-16/saudi-arabia-will-need-more-oil-to-feed-local-refinery-expansion
BB’s interpretation / spin is that they will be capturing margins they are now foregoing. However, although they most likely will export part of the refined product it is the perfect setup for increased domestic consumption.
rgds
WP
WP,
When Ron started the blog, or early on, there was a paper listed at the top on joint ventures between Saudi Aramco and various Western and non-Western companies. The Saudis have been quite active in JVs for refining and for petrochemical production. It’s about time.
It certainly will mean less crude available for export, but more products on the global market.
From what I understand KSA right now exports a large part of it’s production but then reimports product so the gross export number in effect overstates what they (net) contribute to the global balance. What it will do is clarify the picture on actual net exports / domestic consumption in KSA which is a good thing. My guess is that it will make the “wedge” situation (flattish production, increasing domestic consumption) —> less available for exports, that Jeff always talks about less deniable – over time that is.
rgds
WP
I’ve used the following example to illustrate the differences between gross and net exports:
Production Land (P) has 2.0 mbpd of production, but no refining capacity. Refinery Land (R) has 2.0 mbpd of refining capacity, but no production.
Ignoring refinery gains and other minor issues, P has consumption of 1.0 mbpd, and R has consumption of 1.0 mbpd.
P’s gross exports to R are 2.0 mbpd. R’s gross imports from P are 2.0 mbpd.
R refines 2.0 mbpd, consumes 1.0 mbpd, and exports 1.0 mbpd of refined product to P.
P’s net exports are production (2.0) less consumption (1.0) = +1.0 mbpd.
R’s net exports (actually net imports) are production (zero) less consumption (1.0) = -1.0 mbpd.
Alternatively, you get the same answer if you define net exports as gross exports less gross imports.
Interesting – in the column beside that bloomberg article was this:
http://www.bloomberg.com/news/articles/2015-03-17/saudi-arabia-wooing-fired-u-s-shale-workers-to-join-our-team-
“In February, Saudi Aramco posted several new ads on websites including Rigzone and LinkedIn that focused on shale expertise. One recent LinkedIn listing for a petroleum engineer with shale experience drew 160 applicants in a month, according to data from the professional networking website.
“Consider the opportunity to join our team and help shape the future of key global unconventional resource development,” the ads say, referring to shale-rock exploration that’s led to a renaissance in U.S. oil and natural gas production.
Additionally, since the start of the year, Saudi Aramco has added an “unconventionals” category to its recruiting website, where 35 job listings require specific experience in shale. A recruiting company, Whitney Human Resources, has also written directly to prospective employees on Saudi Aramco’s behalf.
A February letter from Whitney obtained by Bloomberg News said there are three areas of the country where Saudi Aramco has an “active exploration program” for unconventional gas resources. ”
Hmmm – how do you say “Marcellus” in Arabic?
http://www.reuters.com/article/2015/02/22/aramcosaudi-arbn-oil-gas-idUSL5N0VS15320150222
There has been some discussion about the consistency and quality of the production data presented by various government agencies. I found a paper concerned with just that subject.
“Data inconsistencies from states with unconventional oil
and gas activity”
http://www.tandfonline.com/doi/pdf/10.1080/10934529.2015.992678
China’s coal production decline accelerated. In January and February, China produced 530 million tons of coal, a 4.05% decline from the same period last year.
China’s coal sale during the two months was 508 million tons, a 4.3% decline from the same period last year.
On the other hand, as of the end of February, China’ coal inventories reached 88 million tons, 3.19% higher than the same period last year.
These are data for businesses covered by China’s Coal Industry Association only. Last year, the total produciton of coal mines covered by China’s Coal Industry Association was about 10% (about 350 million tons) lower than the national coal production
So China’s coal production is about 0.4 million tons per day lower than in 2014. That’s energy equivalent of about 1.4 million barrels of oil per day – more than the Bakken!
A major factor appears to the massive decline in Inner Mongolia, where production fell by 41% in January from the same month last year.
Inner Mongolia has become a major new producer in China in recent years. In 2013, it alone produced almost 1 billion tons, higher than the US annual production.
In other parts of China, coal production appears to be holding up
The easiest way to reduce coal production in China is to gradually eliminate recording of individual producers production.
Much like the US does to show lower unemployment by gradually counting less and less people as employable.
P.S. This is also the manipulated numbers used by the EIA to calculate lower Global emissions. NOT!
The atmospheric concentration of CO2 will not cheat though
Are they importing cheaper coal from abroad?
China’s is closing some of it’s steel mills from what i understand. They wont need as much coal with less steel making capacity.
In January and February, China imported 32 million tons of coal, a decline by 45% from the same period last year.
In recent months, China’s domestic coal price has fallen but the international price has risen (partly due to coal production reduction plans in Australia and South Africa) so that China’s domestic coal price is converging towards international price
PE,
I recall reading somewhere that an exceptionally wet year last year had given a boost to China’s hydro electric output, which would then have served to displace coal fired electricity. Do you know if there’s much to this?
Yes, hydro electricity generation surged by 20% last year. Hydro is about 20% of China’s electricity generation and China’s electricity generation grew by less than 4% last year. So hydro alone accounted for more than 100% of the electricity growth. Adding to it the growth of nuclear, wind, and solar. Coal was crowded out.
The hydro electricity surge continues. For January and February, hydro electricity generation grew by 12% from the same period last year while the overall electricity growht rate is about 2%. So electricity generation from fossil fuels plants declined
The services sector electricity use grew by 8%; consumer goods industry electricity use grew by 10%. But producer goods industry electricity use declined (which accounts for more than half of the total electricity use)
PE, is precipitation increasing to allow more water flow through the water turbines? Or is this new power plants? Or both?
Hi Political economist,
Do you have China’s coal output data for 2014? That Jan Feb rate is only 3281 million tons per year, quite low compared to 2013. Maybe they are past peak?
With coal production down this much y/y along with housing prices down this much y/y, I’d be very surprised if Chinese coal output in 2015 isn’t down from 2014. I do expect to see it hit new highs in later years on electric power demand, but at a much slower growth rate than it has had in recent years.
The New Year numbers are always very volatile, but the decline is big enough and supported by enough other data that it clearly isn’t just the holiday.
Also, with prices down and Shaanxi production up 11% y/y, it’s pretty clearly mostly a demand-driven and not a supply-driven decline. Inner Mongolia has high fixed transportation costs, so it’s natural that they get squeezed out by price first. The provinces closer to the coast don’t have a lot of reserves, but with them also being squeezed by price and politically driven mine shutdowns, it’s hard to evaluate how much of the decline is mine exhaustion.
From folks who do their homework…
LNG’s threat to water sustainability
Authors: Ben Parfitt, David Hughes; Canadian Centre for Policy Alternatives, February 27, 2014
Meanwhile, BC farmers use 234 billion litres every year, and pollute it with pesticide and excess N2 and P, and dump in the river?
Just to give it some perspective.
http://www.statcan.gc.ca/pub/16-402-x/2013001/t030-eng.htm
PS: I do like how when someone wants something to sound big, they use small units (litres). When they want it to sound small, they use large units, (thousands of Cubic Metres).
Just for the record 1,000 cubes metres = 1,000,000 litres
That fresh water use argument is a bit silly. Wells can be fractured with brackish water. And if necessary the flow back water can be reused. That water argument just shows a bit of desperation. I would stick to the earthquakes or other sound arguments.
Fracking supply water in BC not a problem. It is all swamp and lakes up there…plus some very good sized rivers. Yes, I have worked there.
Maybe 1 or two LNG plants will get built, someday. Not likely, though. It is a Provincial obsession because everything else is in terminal decline. I have lived and worked in BC for 50 years, with rotations north for flying jobs. This place was absolutely booming until ’81. Since that time Fishing has totally declined with terminal salmon harvests reverting to Natives as a cheap and dirty land-claims add on . Forestry, once accounting for 2/3 of the Provincial economy in the wealthy ’70s is less than 25%, today. But people demand more services than ever before, including good roads and bridges, decent health care (single payer system), and a good education system. For the last 20 years Govt. has made cut after cut to services whenever they can to keep costs in line, as resource base has been drying up. Tourism was supposed to be the first big saviour and resource industries were really neglected by Govt focus for decades. And you know what a tourist economy looks like. Lodge owners make money and their employees wortk at minimum wage for 6 months of the year. I used to call it, ‘Mexico North’. They, (the Govt.) are now desperate and looking for a way to prosperity…the way it used to be and what people expect. Thus, LNG is the newest Saviour.
It it isn’t and never will be.
Having said this, our Provincial budget is balanced, municipal budgets are balanced by law as well as are school districts. But unless revenues increase, there will have to be more and more cuts over time and that is more than difficult for politicians.
Sunday, my wife and I took a run up to Port McNeil on Vancouver Island. (I hadn’t been there for years). It was dead. The valley where I live used to have a thriving logging industry. There was a store, liquor store, 2 banks and a credit union. There was even a bowling alley and rec centre. Every other house had a company truck in the driveway. Now? Company replaced with a mechanized juggernaut called Western Forest Products that replaced Weyerhauser when they were run out of here for destroying our industry. (I won’t get into it). The ‘Store’ is a convenience store at the highway junction. It is like everywhere in NA…secondary manufacturing now done overseas. We simply supply raw resources.
My wife and I are retired as are most of our friends. We live here because we can afford to live somewhere where there is no work. My son flies out today to northern Alberta where he has another construction project for 2 months.
Not everyone works for ‘think tanks’. Some folks actually have to produce a product in order to eat and feed their families. Mr. Hughes needs to understand that resource projects supplying sustenance provides him with his work as well. What else would he write about??
Affect Canada’s water resources? Really?
By selecting the right units, one can make any statistic look really scary. My back-of-the-envelope calculation converts 582 billion liters to about 500,000 acre-feet of water. That sure sounds like a lot of water, but even here in drought-stricken CA, that is less than 5% of the state’s annual surface-water-production last year – we lose more water than that each year just in reservoir surface evaporation and ground absorption. I’d think up in BC, what with the jet stream pounding it each winter with storm fronts through the Cascades and Rockies, they’d have an order of magnitude more water, both surface and ground – available each year. US Bureau of Reclamation data suggests that much of the 100+ million acre-feet of water flowing down the Columbia each year is sourced in BC’s Rocky mountains. Fracking or LNG development may have lots of valid problems, but drying up BC is probably not one of them.
HVAC
You nailed it. Everybody is on the anti-fracking bandwagon these days as if it is a new issue. Even the company that drilled my water well last year advertises fracking and has done so for as long as I remember.
regards
As I wrote before, there’s no need to use fresh water to make hydraulic fractures. And in most places when we drill down we find brackish and salty water.
But is that water actually being used or are they still trucking in fresh water? Does it cost more to frack with salty water, more or different additives?
NAOM
Nota oilman, my impression is that fresh water is used because it’s convenient. The chemicals usually work better in fresh water. But they also work in brackish non potable water (say water with 1 % to 2 % salt).
This is mostly a cost and comfort issue. And in the oil industry there’s a tendency to use what worked before. Based on lab experiment results I have seen, and comments by George King, I am very confident the brackish water sources can be used (or brackish water can be made by mixing).
The water chemistry does require careful analysis to avoid scales, but that’s mostly a housekeeping issue.
Stranded Assets in Oil and Gas a Reality
by Deborah Lawrence, Energy Policy Forum | Mar 4, 2015
Wind and solar aren’t competitive. This is the reason why we do need to worry.
On-shore wind is cheaper than new coal, in the US.
Solar is cheaper than oil-fired generation, which accounts for a lot of generation. Places like Japan, Hawaii, Chile, as well as a lot of residential & industrial/commercial consumers that have inadequate grids.
There’s a lot of oil to displace, and that can support a lot of growth for solar…which will drive down costs and make solar competitive in more places, which will drive more growth…in a virtuous cycle.
When you find a cost effective battery please let me know.
Batteries won’t be needed until wind and solar market shares are much higher than they are now.
Batteries are already cheap enough –when batteries are needed, they’ll be just one small part of a complex set of strategies for matching supply and demand.
Which is the way it is now.
Also tiered electricity pricing that encourages people to use juice when it is abundant would dramatically curtail the need for batteries. People will react to price signals, they always do. It will be easy to program big energy users like water heaters and electric cars to stop or slow charging when supply drops and even out a lot of the intermittency.
Absolutely!
Demand-side management a.k.a. demand response, is a very important part of “load following”. It’s cheap, it’s effective, it’s old and proven.
Time of day pricing, surge pricing, etc., would make a big difference. Communications can go through smart meters, or be as simple as a response to changes of frequency and voltage in the grid.
In Spain we have peak loads when the sun isn’t shining. The wind doesn’t match peak very well either. This was partially solved by using hydro to make up for the other renewable deficiencies.
But the renewables are limited by the hydro and natural gas ability to fill in their intermittency. The solar and wind subsidies drive up the cost of electricity, and gas is expensive. This means the government is reluctant to provide incentives for natural gas turbines.
We also have a green lobby fighting against hydro (although the additional resource is limited). The greens are also fighting natural gas. This drives the system to use coal.
The government is reluctant to rock the boat because the greens are watermelons, they are closely linked with the left, and there are elections this year. So the government is more focused on increasing employment.
Thus these arguments about cheap batteries and other solutions daren’t very viable here at this point in time. And if they don’t work here, then I doubt they work in poorer nations.
I see too much focus on usa conditions here (I guess most of you live in the USA). I usually think of countries like Peru, Thailand and Pakistan.
Really? What percentage of electricity use do you think will be discretionary? Will people defer cooking a meal until the wind is blowing and power is cheap? Will industry switch processes on and off to match weather patterns? I think you’re grossly overestimating how quickly people would react to price signals. You’re also effectively proposing a highly volatile electricity market, which seems to me far from a good idea.
Besides which, most electricity is now used for home computing and consumer electronics (see chart 6 here: https://www.gov.uk/government/uploads/system/uploads/attachment_data/file/338662/ecuk_chapter_3_domestic_factsheet.pdf ), neither of which is something people are likely to defer. Plus you’re also going to add in a big extra chunk of power running more computers managing everyone’s home usage, managing the all the extra grid and IT infrastructure that such a hyper-complex system would need to support it. Plus, every single heater, electric car and fridge turning on at the same time as there’s more wind would probably negate any price drop from increased supply anyway, because oh look suddenly you’ve added a ton more demand.
The 100% renewable smart grid is as yet vaporware, with a whole host of additional problems that I probably haven’t thought of. Let’s not pretend that it’s already solved our electricity supply issues shall we?
Hi Sam,
You could defer drying laundry in an electric dryer, you could turn down the temperature on your thermostat during cold weather when using a heat pump, if you have an EV you could charge it during non-peak periods. Some people would make these choices, others would not.
Over time people might buy more efficient appliances as well.
You are correct, that 100% renewables will be difficult to achieve, but we have time, fossil fuels will not disappear overnight, they will become more expensive and make wind and solar more competitive.
Have you ever looked at the U Delaware renewable study? Link below:
http://www.sciencedirect.com/science/article/pii/S0378775312014759
Highlights
We modeled wind, solar, and storage to meet demand for 1/5 of the USA electric grid.
► 28 billion combinations of wind, solar and storage were run, seeking least-cost.
► Least-cost combinations have excess generation (3× load), thus require less storage.
► 99.9% of hours of load can be met by renewables with only 9–72 h of storage.
► At 2030 technology costs, 90% of load hours are met at electric costs below today’s.
I will put a chart in a wider area so it is readable.
In countries like the Netherlands they already have different electricity prices for different times of day. When sign up for it you pay a very modest amount (3 euros or something like that) and then you get a discount on power you use between 9pm and 7am. (exact times depend on the specific provider and plan). This setup has been around for decades. it is available to residential as well as light industrial users.
rgds
WP
Dennis,
I’ve read the U delaware study and don’t think it’s particularly strong, for a few reasons. Firstly, their results essentially rely on an a priori knowledge of what future weather would be like. It’s all well and good testing billions of combinations of deployments and then picking the ones which work best for a certain period, but they really need to then take these best models and test them on a few more years weather data, to check whether or not they’re still able to stable generate electricity. I suspect that they wouldn’t. It’s likely that there’s a few rare but significant weather events in the period would account for most of the blackout risks, and that most of the workable solutions would end up helping get through such a patch, but the next time around it might be of a different character, and so you end up with a system optimised to get through a few extreme events, and then which will likely fail during others.
Secondly the energy cost of the system is never discussed, which would be pretty big.
Thirdly, they gloss very quickly over the economics of keeping massive storage and fairly significant amounts of ff generation on standby for very, very rare occasions when things don’t work.
Fourthly, the amount of land area which would need to be devoted to their hugely overbuilt proposal is extremely large, and would likely run into objections.
Fifthly, the problem isn’t so much the end state, as actually getting there. If you’re going to overbuild renewables then at some point you’ll run into serious grid instability issues (when you haven’t got quite enough capacity overbuilt), so you’ll have to keep massive ff generation on standby. Frequency stability would also be an issue. And the renwables will start cannibalising their own market at some point, potentially making thing uneconomic.
By starting at the end they’re missing out a lot of the more interesting, and difficult, questions. Key among them, how feasible is it for us to transition from a centralised stock based grid to a decentralised flow based grid archetecture, without collapsing the grid in the process?
Hi Sam,
Thanks. A four year span of weather data covers a fair amount of variability, you suggestion that the “optimal” solutions should be tested over longer period makes good sense, though there may be data limitations (I am not sure how far back in time the wind data goes). The point of the paper was to show that the intermittency problem can be overcome. Note that the capacity at 3 times load is pretty similar to the fossil fuel power plants, which in the US are also roughly 3X load. Costs are addressed in the paper, they are less than fossil fuel cost when externalities are added to the analysis. Energy costs are not really relevant, these projects are done in dollars and cents, not sure going down the rabbit hole of EROEI is really worth the trouble, where is the proper place to draw the boundry around the analysis.
Extra natural gas, or battery or fuel cell backup can be used to add a margin or safety, or simply adding extra capacity into the system (whichever is cheaper in a risk benefit analysis).
The system might require government regulation to keep prices from going too low so that there will be adequate investment, a problem easily solved. There could be some natural gas spinning reserve kept running (while there is still natural gas) to provide some backup, the cost would be borne by the entire grid. Nuclear could also be used (not really my preference) if there were no other alternatives.
No the study is not perfect and does not answer all questions, but it is not as if we will transition from the current system to something different over a short period, it will take 30 to 50 years, plenty of time to work on grid stability issues and better grid connectivity and foe costs of wind and solar and backup solutions such as batteries and fuel cells to improve.
There are also lots of energy efficiency improvements which can be made and strategies for allowing more energy use when energy availability is higher and less when it is lower. Heating water in well insulated tanks and/or making ice when the wind is blowing and then using these sources of heat or cold when the wind is not blowing would help to reduce the energy demand variability.
I think that imaginative engineers could come up with many solutions.
Dennis
In the graph which you posted there really aren’t that many significant events where the power drops out for a long period of time, as can be seen from counting the big pink spikes. They represent a fairly small % of the total time, but they make up a big chunk of the variability. A system like this is probably going to be more vulnerable to things like tail events. I realise that it’s not quite the point of their study, but useful further work would have involved testing their final models with perhaps some realistic synthetic data, or a few extra years data (which is presumably available now) to see just how robust these models were.
EROI is indeed a complex rabbit hole to go down, but it’s an important one too. If charlie hall is right about the dire EROI of solar in Spain, then that has significant consequences. Similar to the EROI work on buffered wind.
Frankly I think the study ignores too many whole system effects, and is likely ignorant (as we all are) of many more which will arise as we learn more about renewable power sources. I think it’s an interesting result, but one which should be treated with a fair bit of skepticism. I think that many of the 100% renewables is easy brigade are guilty of telling people what they want to hear, and ignoring all the hard stuff. I don’t think that helps.
Actually, long tail events are relatively easy to handle. You see, if something doesn’t happen very often you can apply inefficient and/or expensive solutions. That works because… you don’t need it very often.
Two important examples: demand-side management, and inexpensive generation.
DSM: an old and effective practice is to have large industrial customers get a slightly lower rate for being interruptible (very occasionally).
Inexpensive generation: this can include cheap ICE/diesel generation, some of which can be on the sites of industrial/commercial customers, like refineries and hospitals. And yes, in the very long term we’ll get rid of diesel – we can substitute synthetic liquid fuel or other synthetic fuels like electrolyzed H2. Such fuel will, of course, be more expensive, but it won’t matter because it won’t be used very much.
Hi Sam Taylor,
Thanks for the thoughtful reply.
I agree that further research is needed.
I believe the study is a good starting point for further research, analyzing more years of weather data would be good.
Many times it is claimed that renewables are too expensive, I think this study shows a different path forward to minimizing costs. Many previous studies tried to match output to load and wind up with huge cost for backup. Using better weather forecasts and computer processing power (as in the MIT Tech Review article which Nick G linked) and a properly designed minimum cost system, many of the problems can be solved.
More research as renewables increase will be needed.
My guess is that when Kennedy suggested we would land a man on the moon, my Dad (an electrical engineer) probably said to himself, “yeah that’s not gonna happen”.
Though maybe not, cause he was pretty young at the time, us old guys become a little more skeptical as we age.
Nick
That’s complete rubbish, and spoken like someone who has no idea of systems engineering or safety. Many of the most expensive components in things like aircraft or nuclear reactors are there for the very, very rare occasions when things might go wrong. I’ve heard it said that aircraft would be a fraction of the cost and almost as safe if they didn’t have many of these systems, but the last little bit is deemed necesarry.
Similarly, London’s flooding defenses. Very very expensive, rarely used, but needed for the rare tail events.
Tail events are where much of the variance in a system comes from, and with fait-tailed distributions they can often be where system-changing events happen.
Do you ever think before rolling out your tired old “dsm will solve everything, it’s all going to be cheap any easy” nonsense, or is it just a mantra that you blindy repeat now?
Hi Sam,
For those scenarios when there is a power outage, couldn’t we use backup gererators the way we do today for those systems that are critical (communication, hospitals, and public safety.)
I believe safeguards that are currently used to shut down portions of the grid when instability reaches critical levels can continue to be used, demand side management will help to some degree, as will better forecasting like Xcel is using in Colorado.
It will not be easy and will probably not be cheap, but fossil fuels will not be cheap either. I have more faith in engineers than you do I guess, perhaps you know many more engineers than I do and find that they are less skilled and imaginative than I believe. Certainly you and Fernando seem to be highly intelligent, hopefully there are many others.
Sam,
The grid is not a plane, or a nuclear reactor: it’s a very different system; it’s operating *and* failure modes are different; and the methods for mitigating those failures are different.
So, it doesn’t help to to use those as abstract analogies. It just doesn’t. You have to look specifically at how the grid works, and how grid system operators have been dealing with variance, sub-system failure and overall system failure for decades.
The fact is that DSM *is* how the grid deals with fat tail events right now, both in the US and in other countries. It’s also how other similar systems cope with shortages: when both electrical and natural gas distribution systems fail, they curtail I/C customers who’ve signed up for it. The fact is that curtailment, a kind of failure, is just not that big a deal if it happens rarely – the definition of a black swan, fat tail event.
Regarding backup: grid SysOps have dealt with load following problems since the beginning of the grid – it’s a complex problem, with many partial solutions for optimization. That’s why simplistic ideas about “renewables needing backup” don’t really make sense. But…the fact is that it’s easy to build cheap 100% backup, if you really want to.
The inefficiency wouldn’t matter if it was only used for a few weeks every several years: it’s the cost per watt of peak power generating capacity you care about, not the cost per kWh. Inefficient ICE generation (burning diesel or hydrogen) costs in the range of 10-50 cents per watt. They don’t have to be efficient, so individual units can be small – that means economy of scale reduces costs, and a large number of small units mean reliability is much easier to ensure. They won’t be used very often so you don’t have to design for extended operating cycles. Finally, underground methane or hydrogen storage is very, very cheap to build and maintain.
So, to back up wind or nuclear power, which costs roughly $6 per watt (average, not peak) or solar at roughly $15 per watt, would very roughly incur a 5% capital cost premium. It’s not the way a professional SysOp would approach the problem, but in the limit, this demonstrates that the “fat tail” problem is just not that big a deal.
The folks who have been focusing on keeping the Internet up and running have been developing their own systems of networks and energy backups. They see what has worked for them, and some of the bigger companies are looking for ways to get off the grid entirely and go it alone, with their own power generation and their own backup systems.
That’s what the utility companies really have to contend with: a group of individuals and companies with enough money and experience to create new forms of energy generation and distribution.
We’ve been living off solar electricity (for the most part, with a gas car) for almost a decade now. The fact is that it’s just not that difficult to do, and is already affordable for a middle class family. I’m a writer/builder with an income around $40K and went solar in 2007. The car is still gas but I’m working to fix that soon: two year old used Leafs are for sale around here (NC) for $12-14K.
The fact is that there is SO much discretionary unnecessary energy use, oil use can be easily halved in America in a decade if we chose to with no direful economic effects: meat-eating and gas cars would wipe out about 50% right off the bat. Vegetarian alternatives to meat have improved dramatically over the last decade. When I cook a dish for friends with “beef” or “chicken” they are almost always surprised that our family has started to eat meat again.
Solar has come down four times and batteries two times since my home went solar, btw.
Ron: thanks so much for the blog! One note: as only an infrequent commenter it can often be very difficult and time-consuming to find my previous comment to see if it requires a follow-up. Is there any way to search for my name or go directly to my comments so they can be more easily managed? Thanks!
Hi Stephen,
Depending on what system you have, you can press your keyboard’s ‘ctrl’ and ‘f’ keys at the same time for the find function search field to pop up, and then just input your name or even the specific date of your post.
The Find function is also in the Menu under Edit.
Chart for U Delaware Study, Link to PDF in upper left corner.
http://www.sciencedirect.com/science/article/pii/S0378775312014759
Hi Sam,
There should probably be another 10 years of data available from 2003 to 2013 for further testing.
It is too bad nobody has taken this study any further.
“forecasts are helping power companies deal with one of the biggest challenges of wind power: its intermittency. Using small amounts of wind power is no problem for utilities. They are accustomed to dealing with variability—after all, demand for electricity changes from season to season, even from minute to minute. However, a utility that wants to use a lot of wind power needs backup power to protect against a sudden loss of wind. These backup plants, which typically burn fossil fuels, are expensive and dirty. But with more accurate forecasts, utilities can cut the amount of power that needs to be held in reserve, minimizing their role.
Before the forecasts were developed, Xcel Energy, which supplies much of Colorado’s power, ran ads opposing a proposal that it use renewable sources for a modest 10 percent of its power. It mailed flyers to its customers claiming that such a mandate would increase electricity costs by as much as $1.5 billion over 20 years.
But thanks in large part to the improved forecasts, Xcel, one of the country’s largest utilities, has made an about-face.
It has installed more wind power than any other U.S. utility and supports a mandate for utilities to get 30 percent of their energy from renewable sources, saying it can easily handle much more than that.
..forecasts from NCAR are already having a big effect. Last year, on a windy weekend when power demand was low, Xcel set a record: during one hour, 60 percent of its electricity for Colorado was coming from the wind. “That kind of wind penetration would have given dispatchers a heart attack a few years ago,” says Drake Bartlett, who heads renewable-energy integration for Xcel. Back then, he notes, they wouldn’t have known whether they might suddenly lose all that power. “Now we’re taking it in stride,” he says. “And that record is going to fall.””
http://www.technologyreview.com/featuredstory/526541/smart-wind-and-solar-power/
I had two power cuts here this morning. Apparently caused by excess wind forcing the wind turbines to shut down. The local grid went unstable and we got cut off for a while. But this is quite rare.
Well, mister genius engineer, do you have any evidence of excess wind?
I don’t see “excessive winds” on AccuWeather – but they might be watermelons…
https://demanda.ree.es/demandaEng.html
says wind production was loafing along “this morning” at a mere 6 to 5 GW, far less than the installed power of 22.8 GW.
n.b. to see each technology in the graph in the lower right, click on the relevant pie in the pie chart.
Nice ramp on hydro this morning, from 737 MW at 4:40 to 8 GW at 8:40.
The preliminary report for 2013 from Red Electrica (the grid operator):
http://www.ree.es/sites/default/files/downloadable/preliminary_report_2014.pdf
Good going Spain – 42.8% of total electricity production from renewables in 2014.
And not shutting down their nukes in a panic.
When we had the power cut I called the condo’s concierge. He had called the electric company and they told him they had a glitch when the wind blew too hard. I assume you realize sometimes the turbines shut down due to strong wind gusts? Today the weather has been very unsettled, we have some sort of cyclone and the waves are huge.
Hi Nick,
Nice article, thanks.
Cost effective batteries have been on the market for years. And just like the panels, and other components, they keep getting cheaper.
http://www.wholesalesolar.com/grid-tie-battery-backup.html
A nice article for people that believe the false accounting meme that has been so avidly and greedily internalized by so many. Let’s face it, the mainstream has been hoodwinked and is now part of the big lie.
Any real accounting of fossil fuels (FF) would include their external costs to the world of people and the ecosystem in general. The false meme ignores the current external costs and the huge costs to the future for burning FFs. That means that any comparisons you see are one giant lie. Even a half-assed accounting of the true costs would make FF’s an order of magnitude more expensive than solar and wind. In reality it is more likely closer to two orders of magnitude over the long term.
Generally when I hear that something is “economically comparable or economically better” I think immediately about what is not being told and what is being covered up. It’s not a conspiracy, it’s a false meme. A worldwide religion of greed that forces us to keep lying to each other or face reality. Reality is scary, reality is hard and someone else is living it, until you do or your descendants.
Hi AllenH,
If the analysis is done properly the external costs are included. You are correct that many analyses ignore the external costs of fossil fuel burning, though when including climate change, main stream estimates should be used, if the analysis is to be credible.
Mainstream estimates? That is a good one, thanks for the laugh Dennis. Credibility implies that the masses or their authorities believe something, which immediately implies the false meme is being applied, thus eliminating honest results.
I really don’t expect much honesty or reality here in western dreamland. A place where we spend huge amounts of time and effort just so we don’t have to do other things or they get done for us. Civilization is really mimicking Red Green. Endless effort to avoid doing some work and the result are often tragically hilarious.
Well, I am going to go document some salt marshes and bays for future comparisons. Hope all of you are doing interesting things too.
Hi Allen,
I mean using IPCC estimates for climate sensitivity such as a transient climate response (TCR) of 2 C, and equilibrium climate sensitivity (ECS) of 3 C, when I say mainstream. Basically our goal should be to limit total anthropogenic carbon emissions to less than One trillion tons, including all sources, fossil fuels, cement production, and land use change. This is not easily accomplished and if higher estimates of ECS such as 4.5 C are correct, this may not be enough to limit temperatures to 2C above the long term Holocene temperature before 1750 AD (pre-industrial temperatures). Enjoy the birds.
Dennis: I can’t find a decent estimate of the cost of carbon. Nor do I see a decent estimate of what it costs not to burn fossil fuels. I can’t even find a reason to believe the IPCC TCR figures. I have seen a paper which derived the TCR built into the IPCC climate ensembles, set it at 1.3 to 1.6. And if you look carefully at the IPCC report you will see their expert judgement sets temperature increase lower than the climate models predict. This is what I call an inconvenient truth. Which is why I wrote the science isn’t settled.
Hi Fernando,
The scientific understanding is not perfect, there is more to it than just the models, which essentially are trying to predict a chaotic system over 100s of years in great detail.
The expert judgment of the climate scientists is an ECS of 3 C and a TCR of about 1.8 C. It is the ECS which is of greater significance as the carbon remains in the atmosphere for many millennia. You don’t really want to hang your hat on one paper.
Hello Dennis. We just went thru the coldest month in recorded history last month in February (Knoxville). The Gulf and with it the Gulf Stream has dropped 4 degrees in the last 5 years…so it really does seem these scientists are failing to see the reality outside of their models and consensus-building efforts. I guess I really can understand your point that the scientific understanding is not perfect.
Seth,
The US is, in fact, having a warmer than average winter. And, in fact, the most recent 12 month period (feb 2014-feb2015) was the warmest 12 month period on record. What you are doing is confusing the noise from a highly variable natural system with a clear long term signal. A common mistake!
Hi Seth,
Weather and climate are not the same thing. Climate is the long term trend, weather is what happens hour by hour or day by day.
Where I live it gets very cold in the winter, sometimes as low as -20 F (on occasion for overnight lows). This does not mean there will be an ice age in the near future.
Also there can be temporary local changes, but we are interested in global climate change.
The problem I see is that expert knowledge seems to be intuitive and lacks a solid basis. The models don’t support it. Therefore I tend to believe what they have evolved is closer to rote and dogma. By now this thing is so loaded with politics it is like a garbage fight.
The TCR probably isn’t constant, you know.
I suppose in everybody’s mind it’s referenced to a concentration change from 280 to 560 ppm.
Hi Fernando,
The link to the source for this chart would be nice, just because someone draws a cute red trapezoid on a chart does not make it correct.
Hi Dennis, back from my trip a little early due to snow storm, responding to March 17 comment 12;45 PM.
Was very disturbed by the low numbers of migratory waterfowl in the salt marshes. Other than that has a good trip.
As far as the IPCC, they are about 6 years behind the research and are on the conservative side. Doesn’t really work in an accelerating situation.
I do agree with you in that we need to reduce carbon emissions rapidly. I will add that we must also find ways to remove carbon from the atmosphere on a large scale.
Hi Allen H,
Glad you had a good trip. The IPCC is a little behind, not really 6 years though, probably more like 4. Science needs a little time to look through the existing literature and filter out the best ideas. By mainstream, I am talking about the latest research published in the mainstream tier 1 peer reviewed journals in conjunction with the most recent IPCC assessment.
IPCC 2013 technical summary appears to not include increasing atmospheric water vapor, albedo changes due to ice and snow cover changes, and methane from natural sources in their radiative forcing calculations. That is a lot of territory to not cover.
Still they come up with over 2 watts per m2 positive forcing. That means it is probably over 3 in reality and increasing. If the Asians slow down their burning of high sulfur coal, we are going to cook much faster.
Just as an aside, a power plant near me that got shut down because it was burning high sulfur coal (the owners didn’t want to upgrade the plant, it is old) has switched to Bakken oil the last I heard, as a surge supplier. Considering the cost of Bakken oil is just over a dollar a gallon, that is quite economical. Those generators can burn natural gas or oil, they chose oil.
I wonder if other plants will switch to cheap oil (it’s low sulfur). The price is right now.
Dennis, you may want to clarify a few things. By limiting our emissions to one trillion tons, do you mean Carbon or Carbon Dioxide? And are you talking about cumulative emissions over 21st century, or over 2012-2100, or since 1750?
Both official institutions and journalist reports have caused a lot confusions.
Based on AR5, one trillion tons of CO2 emissions from 2012 to 2100 basically correspond to RCP 2.6 (1.5C higher than pre-industrial time by 2100) and three trillion tons of CO2 emissions from 2012 to 2100 basically correspond to RCP 4.5 (2.4C higher than pre-industrial time by 2100, but more than 3C in the long run).
I think for all practical purposes, RCP 2.6 is out of question. If we stay on the current growth path, we will end up with RCP 6.0 or RCP 8.5, hell on earth (not for our generation, but several generations down the road). If there is going to be peak oil, gas, coal etc before the mid-21st century, we’ll basically end up with RCP 4.5, which probably means a 50-50 chance to avoid run away global warming, depending on how Amazon rainforest and greenland ice sheets will respond.
We can let Dennis respond as he wishes, but as a weather observer out my backyard my entire life, I’ll just point out the biggest force for climate change on Earth is Sun’s activity which depends on inner solar and outer galactic circumstances.
Our solar system past the galactic plane about 2 Million years ago and is now heading towards the Northern region of our galaxy. It is entering a galactic Gamma-ray field that is having profound effects on the Sun’s radiation and solar wind activity. This change in Sun’s activity is likely causing profound influence on Earth’s geological and climate stability. The ionization rate of Earth’s upper atmospheric layers will increase in all probability very sharply very soon, resulting in more warming for the foreseeable future.
The idea that only carbon dioxide is responsible for climate change has been collapsing among the scientific literature for long time now. As the American Right now points out, the elitist money creators in Washington wanted a global carbon trading scheme to make huge profits with pollution rights, financial derivatives and global carbon taxation. But the business model isn’t working, and never did work, because the elitists couldn’t get a big enough amount of humanity to buy into the story of man-made climate change. And thus the cycle began anew, with the money creators fighting ever harder to implement their economic beliefs over the rest of us in spite of the true science pointing in another direction.
-(Ralph)-
Cass Tech, ’64
Bravo! This is great propaganda. I really have to hand it to the fossil fuel companies, they are certainly going all in to sow the seeds of doubt and continue their profit making.
Tobacco industry take note!!
Do you want to hear another story?!
Well, I think the elites are benefiting directly from fossil fuel extraction. In reality they see that the science of climate change is threatening their industry (the richest industry in the world coincidently). If they can create doubt and keep people misinformed then they can continue to profit from the status quo. Their mission is to paint a giant global conspiracy by scientists – who are supposedly benefiting from millions of dollars worth of ‘grant money’.
In their story the scientists all live in mansions and drive Ferrari’s purchased of course from ‘grant money’. Yes, those high-rolling scientists always flaunting their Rolex watches and flashy cars / mansions! Of course, scientists have been planning this scam since the 1820’s which is when they first started making claims of an apparent ‘greenhouse effect’ (in what was their first ever attempt at earning billions from research grants). Similar scientific conspiracies (for grant money) include ‘Germ theory’, ‘Evolution by natural selection’, ‘Theory of gravity’ and ‘Plate tectonics’.
Come to think of it… When I was on holiday and visited Rodeo drive last year I couldn’t help but notice all of the shoppers were wearing lab coats… Damn scientists and trillions of dollars of ‘grant money’! Wall street has nothing on the earning potential of a science PhD!! (/EXTREME SARC!!!)
Unfortunately the fossil fuel company propaganda appeals to people with a ideological bias towards ‘free-markets’ ‘ anti-science’ and general ‘conservatism’.
On a side note, I think Doug has may have done a bit of scientific research in his time! Ergo he’s probably rich from scientific ‘grant money’ too!! I’m guessing he owns a Lamborghini and lives on his own private estate with personal servants (sorry Doug, tongue in cheek).
Poor fossil fuel companies, how can little-guys like them compete?
Hi Political Economist,
By Carbon I mean Carbon, not CO2 (for CO2 multiply by 3.67). One trillion tons is total since 1750 see
http://www.trillionthtonne.org/
We have already emitted about 589 billion tons of carbon,
only 411 Gt left to reach 1000 Gt.
I agree it will be difficult to achieve this, the 1000 Gt of Carbon is basically the RCP4.5 (3667 Gt of CO2 from pre-industrial), if ECS is 3 C, then this will keep us close to the 2C limit. The earth system effects such as 6C for a doubling of CO2 are disputed by many mainstream climate scientists.
A problem with some of the earth system estimates is they depend on a large albedo change due to smaller ice sheets moving from glacial to interglacial, currently the earth’s ice sheet area is small relative to the last glacial maximum so these very high estimates such as 6 C by Hansen are an overstatement.
In addition they will happen over thousands of years and carbon levels in the atmosphere will come down over time. The runaway warming scenarios at 1000 Gt (3700 Gt CO2) of carbon are not very realistic based on the opinion of the Real Climate contributors.
Here’s one:
“The United States’ reliance on coal to generate almost half of its electricity, costs the economy about $345 billion a year in hidden expenses not borne by miners or utilities, including health problems in mining communities and pollution around power plants, a study found.
Those costs would effectively triple the price of electricity produced by coal-fired plants, which are prevalent in part due to the their low cost of operation, the study led by a Harvard University researcher found.
“This is not borne by the coal industry, this is borne by us, in our taxes,” said Paul Epstein, a Harvard Medical School instructor and the associate director of its Center for Health and the Global Environment, the study’s lead author.
“The public cost is far greater than the cost of the coal itself. The impacts of this industry go way beyond just lighting our lights.”
Coal-fired plants currently supply about 45 percent of the nation’s electricity, according to U.S. Energy Department data. Accounting for all the ancillary costs associated with burning coal would add about 18 cents per kilowatt hour to the cost of electricity from coal-fired plants, shifting it from one of the cheapest sources of electricity to one of the most expensive.”
“…The estimate of hidden costs takes into account a variety of side-effects of coal production and use. Among them are the cost of treading elevated rates of cancer and other illnesses in coal-mining areas, environmental damage and lost tourism opportunities in coal regions where mountaintop removal is practiced and climate change resulting from elevated emissions of carbon dioxide from burning the coal.
Coal releases more carbon dioxide when burned than does natural gas or oil.
The $345 billion annual cost figure was the study’s best estimate of the costs associated with burning coal. The study said the costs could be as low as $175 billion or as high as $523 billion.
“This is effectively a subsidy borne by asthmatic children and rain-polluted lakes and the climate is another way of looking at it,” said Kert Davies, research director with the environmental activist group Greenpeace. “It’s a tax by the industry on us that we are not seeing in our bills but we are bearing the costs.”
The estimates came in the paper “Full cost accounting for the life cycle of coal,” to be published in the Annals of the New York Academy of Sciences.”
http://uk.reuters.com/article/2011/02/16/us-usa-coal-study-idUKTRE71F4X820110216?rpc=401&feedType=RSS&feedName=environmentNews&rpc=401
SO your argument is that so called “Renewable” energy can be just as cost inefficient as FF’s if only they were subsidized the same?
I don’t think it’s possible for solar and wind energy to subsidize the same levels of acid rain and asthmatic children and global warming as coal.
No, subsidies are very inefficient.
It would be far better to simply tax fossil fuels in order to properly account for their real costs. That would clarify that renewables are in fact much, much cheaper.
Hi Nick,
In the US tax has become a four letter word, the name would need to be changed to a pollution fee or something. Nobody would be fooled. The best we might accomplish would be to reduce subsidies on fossil fuels out of fairness.
Another strategy would be to eliminate all corporate taxes which is a favorite of conservatives, in exchange for pollution fees and/or normal income tax rates for dividends and capital gains (which would hit the wealthy mostly) and eliminating all loopholes used in trusts, etc to avoid estate taxes.
Which fossil fuel subsidies exist in the USA?
http://peakoilbarrel.com/opec-crude-plus-more-on-eia-estimates/comment-page-1/#comment-505103
I see. Your link took me to a link which stated the following:
“The estimates came in the paper “Full cost accounting for the life cycle of coal,” to be published in the Annals of the New York Academy of Sciences. Epstein discussed his findings on the Arctic Sunrise, a 164-foot-long (50 meter long) icebreaker operated by Greenpeace, and moored in Boston Harbor.”
So this guy gives a talk on the Greenpeace de luxe Yatch with twin 2000 hp Wartsila engines and I’m supposed to swallow the statement….
One has nothing to do with the other.
Your delusions blind you.
Not a delusion. It’s evident I know a lot more about the oil and gas industry’s inner processes and economics. I spent years putting together spreadsheets, or supervising people who did it, to understand the economic return of individual wells, new projects, company purchases, and to prepare proposals to governments asking for tax changes.
This makes me quite familiar with the tax loads imposed on the industry, as well as what governments will consider the minimum acceptable tax load.
I find the argument about general subsidies to be incredibly funny, to be kind. The meaningful subsidies are used by opec and a few other nations to reduce energy costs to the general population. In some cases they use a targeted subsidy for a specific industry. Such “subsidies” are usually limited to reduced taxes, rather than being outright subsidies.
Using your logic I could argue the video game industry is heavily subsidized because it doesn’t get charged for the lower grades it induces in teenage males. Funny.
Hi Fernando,
When a business is given a tax break this is called a tax subsidy. There are a number of special tax credits given to the oil and gas industry in the US, also the roads and bridges in the US are not fully funded by fuel taxes and that is another subsidy to the oil industry, there are free parking lots in many small towns and cities, another subsidy to the oil industry.
There are also the future costs of climate change caused by carbon dioxide emissions, but we will assume as you do that warm weather is nice and put these costs at zero, though droughts and flash flooding, which are likely to increase with climate change, do have negative economic consequences.
Dennis, that’s baloney. Those parking lots are available for electric vehicles and horse drawn carts.
I know a lot more about the oil and gas industry’s inner processes and economics.
I’m willing to believe that you have good knowledge of oil & gas.
But, this is the specialist’s curse: because one knows a great deal about one area, one is tempted to think that they know things about other areas.
But, people lose credibility when they make aggressive statements which contain unrealistic assumptions, inadeqate information and misinformation.
In this case, free parking is indeed a subsidy to automobile drivers. And, public health and safety impacts can indeed create external costs. Video games do have physical and mental health impacts – to the extent that they affect children, or people other than the person choosing to play the game (who we presume can choose to suffer harm, if they wish), it’s a real cost to society.
No matter how many times you say otherwise, and no matter how many times you try to ridicule it, external costs like pollution and oil wars will still be real costs for which we need to account.
If it is necessary for you to buy your groceries at a grocery store, A&P, Safeway, the local food store, then you are still wholly dependent on fossil fuels.
It could have been transported by rail, which is mostly powered by electric motors.
Now, the electricity for those motors mostly comes from onboard diesel generators, but
1) that requires about 1/3 as much fuel as trucks, and
2) the power can easily come from the grid, should the railroads be incentivized to convert to using the grid (by charging them the true cost of diesel, or just not charging them property taxes on the improvements!).
Can solar transform the energy market ?
Nick Butler, blog, FT.com | Mar 08 12:08
About Nick…
Nick Butler is Visiting Professor and Chair of the Kings Policy Institute at Kings College London.
He spent 29 years with BP, including five years as Group Vice President for Policy and Strategy Development at BP from 2002 to 2006. He has also served as Senior Policy Adviser at No 10, Chairman of the Centre for European Reform and Treasurer of the Fabian Society.
Nick Butler is an investor in, and an adviser to a number of companies and institutions in the energy business
I have used Wood McKenzie’s services, they are good in the banking and financial analysis side. But I’m not too impressed with their grasp of technology. You are aware they are more of a financial consultancy?
So who we gonna believe on the FINANCIAL competitiveness of solar- the finance guy or the oil guy?
Hi Wimbi,
I would tend to believe the finance guy. I like Fernando’s input on energy because he is trying to look at the big picture. All solar everywhere would require quite a bit of grid upgrades (HVDC) to move energy around or storage solutions, that is his main point along with solar being relatively expensive at present (especially in areas where insolation is low).
These problems are not unsolvable, especially with a combination of wind and solar, battery, fuel cell, and vehicle to grid backup and an overbuilding of capacity over a wide area that is well connected through the grid. Further research should be done in this area.
Sometimes the best analysis is done by a team of economists and engineers, so the engineers can point out unrealistic assumptions to the finance guys.
Dennis. I should note more often that my own perspective is highly myopic- right here and right now in my own back yard. I don’t try to make any big picture remarks.
Right here and right now, for me, solar is a great bargain. For what turned out to be less than the normal expense for a summer of BAU in my neighborhood, I invested in an “excess” of PV, and a Leaf, and am now home free of electric and gas bills for the rest of my life, almost.
So, for the home owner, I say that’s the way to go, for sure, and getting more so by the minute.
Yesterday a guy came by with a PV panel that was more powerful, more efficient, and a good deal CHEAPER than the bargain ones I got 2 yrs ago.
Wimbi, I’m a highly educated engineer with a genius IQ. In the past I’ve been asked by Wood Mac to review their reports (we had a deal, I reviewed their figures for free, but this allowed me to see the material for free as well). In this case you can trust me.
Hi Fernando.
“…I’m a highly educated engineer with a genius IQ.”
Then maybe you could understand my theory.
http://peakoilbarrel.com/eia-confusion/comment-page-1/#comment-504528
Please try the Futilitist Collapse Challenge. I would like to hear your expert opinion on it. Thank you.
Hi Fernando,
….and you are very humble as well 🙂
Dennis, I suppose you have noticed I don’t usually respond to put downs. But I had to grow up in the Texas and Louisiana oilfields with a Hispanic looking face and name. It helped to be fairly tall and to have a certain attitude, and I got into the habit of reminding the white folk who rubbed me the wrong way that I was smarter, meaner and tougher than they were. In that environment it worked.
Hi Fernando,
I think you are very knowledgeable about some things, in other areas you may know more than some.
Does your sister know as much as you about petroleum engineering? You claimed some expertise in biology that seems to have rubbed off on you so that you know that 3C or maybe even 4C of climate change would be very nice, we will just go to the beach (and it will be closer).
If your wife was a physician, you would be giving us medical advice, and some might be foolish enough to listen.
Dennis, please find my comment about 4 degrees C and health? I usually quote my sister when I discuss shenanigans at research labs because she was a whistle blower. She also gave me a lot of material to read, etc. I wish to repeat the point that I’m quite used to being patronized.
The problem I see here is a rather silly technique to try to confine individuals according to some sort of tribal/elitist pigeonholing, linked to the inability to discuss the subject if it involves discussion of alternate points of view.
Hi Fernando,
Can you explain why we should not be concerned with global average land ocean temperatures rising to 2.4 C above preindustrial temperatures over a relatively short 200 to 300 year time frame? (If we assume ECS is 3 C and atmospheric CO2 rises to 630 ppm we get a 2.4 C temperature change.) You had claimed your sisters expertise in biological sciences has conferred the expertise to make such judgments, which are better than the actual experts in biology and ecology. You said nothing specifically about health, though perhaps you have children or siblings who are physicians and so you could also be a physician. 🙂
“Trust me” said the spider to the fly…
Wrong. No spider, no fly. I am being completely ernest.
Fernando might not know much about climate change, but he does seem to have a pretty decent level of knowledge about the oil industry. I really do want to hear his opinion on this.
I was referring to Fernando’s “Trust me” statement above, not to anything you said. I do not trust anything he says about renewable energy or climate change. That does not make me wrong, it’s a gut feeling I have.
I think you have good instincts, not clever.
I suggest using your brain rather than your gut.
Do you have me on ignore?
No. Why would I? Are your feelings hurt because I didn’t take your test?
Hi Fernando,
You have proven you are smarter than me in this case (and perhaps in every case) because you have not wasted your time on the “collapse challenge”.
“No. Why would I? Are your feelings hurt because I didn’t take your test?”
~Fernando
I don’t really care. You have to play to win. When you don’t, it looks like you are scared.
I notice you seem pretty comfortable doing your climate change denial bullshit since I have been busy focusing on Dennis’ bullshit more than yours of late.
It is hard for one honest, unpaid, and unaffiliated individual to keep up with so many well financed, shapeshifting merchants of doubt, but I do the best I can.
“You have proven you are smarter than me in this case (and perhaps in every case) because you have not wasted your time on the “collapse challenge”.”
~Dennis
No one needs any further proof to know that everyone is smarter than you, Dennis. 🙂
Futilist, I probably know more about climate change than most of you. One reason why I write about it is my background working on the subject.
As it turns out I was asked to coordinate a study, which took several years, to understand the feasibility of developing Arctic oil and gas fields offshore Russia. One reason why I was given this assignment was my interest in oceanography and the fact that I worked for NOAA during my college years.
So you see, I approach this with both the educational background as well as the ability to refer questions to former team mates. What I find is a lot of political baloney mixed in with a serious issue which involves an extensive field of knowledge. I’m afraid most of you are limited to faith and dogma. You like to assume “the science is settled”:
http://21stcenturysocialcritic.blogspot.com.es/2015/03/the-science-is-settled.html#more
Hey Fernando,
It’s FUTILITIST.
And I was making an innocent little joke about climate change as a segue to ask you an important question, which you have totally dodged!
Okay. I’ll give you the benefit of the doubt. Maybe this is temporary and you are giving my theory some deep, super high IQ thought, and you will post about it later.
I sure hope so, because if not, I am going to get very justifiably angry at you for your disingenuous and highly evasive response. I will not be using good manners at that point, sir.
Fair warning to you and everyone else.
We are colleagues here on this site. When one colleague politely asks another for an opinion on his work, it is considered quite rude to turn him down flat or dodge the question.
I await your answer. Tick tock.
Hi Fernando,
Wait…
I thought you knew more about climate science than everyone 🙂
I mean everyone posting IPCC dogma, dude. I was mentored on this subject because we had to decide what to do about the changing climate.
And I imagine I was biased by what I was taught. The people I worked with couldn’t give me any assurances about the Arctic temperature and ice coverage trends. The models just couldn’t be trusted to project 30 to 40 years, and that’s what we needed.
I think Shell and Exxon got involved in the hard core Arctic areas based on some sort of model work.
But what really impressed me was the way Shell blundered by trusting both the ice trends and using a really stupid strategy to avoid the Alaskan taxes. I could get personal because I used to know a couple of the people involved, let’s just say they trusted their climatologists a bit too much.
Hi Fernando,
So because we are not sure what the temperature will be, we should assume it is on the low side, why not the high side?
If you were analyzing a petroleum reservoir and there was a range of estimates would you always pick the high end? Picking the low end of expert ECS estimates is a little like assuming higher EUR estimates are correct.
When faced with uncertainty the central estimate makes the most sense, and if you want to be safe you leave a margin of safety.
Pretty basic stuff, especially for an engineer.
Okay Fernando.
Go ahead, genius, ignore me. I will take your non response as anyone would. You are afraid you will look silly trying to refute something that is obviously true.
If you don’t try to refute my theory, then you haven’t refuted my theory, so my theory must be assumed to be true.
Personally, I find all of this squirming very weird. Why is everyone so afraid of my little theory?
I don’t think this is how scientists do it.
Dennis, the central estimate of a poorly unsupported range is not worth much. As I mentioned before, I’m seeing too many holes in the IPCC work. Don’t forget that, as I aged, my expertise evolved to become a generalist assurance expert. I read the IPCC report and it doesn’t pass the smell test.
If you want to understand the issue I refer you to the little figure I posted. It’s an update from the AR5 done at Climate Lab Book. Pay close attention to the little red gizmo. And see if you understand the implications.
Fernando. Glad to hear it, good for you.
Releves me of any feel of need to temper my normally impolite behavior.
Hi Wimbi,
You are far from impolite.
I agree that what you are doing is important and more of us should follow your example.
I think that Fernando’s concern is this:
How do we solve the intermittency problem of renewables, as the percentage of electric power provided by renewables increases?
Perhaps you have an answer. My answer is to overbuild wind and solar capacity over a widely dispersed area connected by a modern power grid (perhaps upgraded with more HVDC transmission). This allows up to 90% of load hours to be provided at low cost with very little backup. See
http://www.sciencedirect.com/science/article/pii/S0378775312014759
Hi Dennis.
Please read this:
http://www.thehillsgroup.org/depletion2_022.htm
I’d love to get your thoughts. Thanks.
Hi Futilitist,
I don’t think the analysis is valid. Value cannot be measured in units of energy any more than it can be measured in labor (as it was done in classical economics by David Ricardo). From this basic error made by the Hills Group, a poor analysis flows.
When I buy a gallon of fuel for my car, it is because the car will not travel very far without it, it has little to do with the energy available per gallon of fuel. As long as we do not have better or cheaper methods of transportation oil will be produced and customers will consume oil.
The value of the economic activity supported by the consumption of a barrel of oil changes as oil is used more efficiently and it varies widely. A better measure of oil “affordability” is the GDP generated per barrel of petroleum consumed for individual nations or the World. You need to look at the entire economic system rather than the individual consumer.
Using EIA Total Petroleum Consumption data and IMF GDP data from 2013, I calculated the GDP per barrel of petroleum consumed for the top 11 countries in terms of GDP. These countries produced 67% of World GDP in 2013, I also calculated this number for the World.
World level is 819 billion dollars of GDP per barrel of petroleum consumed. The top 11 nations vary from $1673 B per barrel to $534B per barrel. More efficient nations will be able to afford to pay higher prices per barrel than less efficient nations.
“Using EIA Total Petroleum Consumption data and IMF GDP data from 2013, I calculated the GDP per barrel of petroleum consumed for the top 11 countries in terms of GDP.”
Really? That is impressive. And unnecessary.
“More efficient nations will be able to afford to pay higher prices per barrel than less efficient nations.”
That is not at all relevant. The world aggregate is all you need. Why do you always have to try to over complicate things, Dennis. It is like you are trying not to know stuff. Weird.
Hi Futilitist,
Those 11 countries are responsible for the bulk of the World’s oil demand. The GDP is the same as income, if a barrel of oil consumed results in 1600 billion dollars of income, in the UK, then the country will be able to afford higher priced oil than India where only 534 billion dollars of income results from the consumption of a barrel of petroleum. The point is simply that oil is used more efficiently to generate more income in some places, over time the World will also become more efficient in its use of oil and will be able to afford higher oil prices.
“The point is simply that oil is used more efficiently to generate more income in some places, over time the World will also become more efficient in its use of oil and will be able to afford higher oil prices.”
How much time do you figure it will take, Dennis?
The oil industry has begun shutting down as we type. The whole point of the theory is that we are now out of time. So, to refute it, you suggest we will adapt over an unspecified period of time. Great.
You are making a circular argument, Dennis. It is the same argument every time. I am bored.
You are an unshakable collapse denier. Yes we can! 🙂
I did the numbers above incorrectly. I used total petroleum in barrels per day rather than barrels per year. I also messed up units along the way so I was off by a factor of 365 million. So the units should be thousands of dollars per barrel and
each number needs to be divided by 365.25, in the table above. For the world average it should be $2242 of income per barrel of petroleum liquids consumed and for the UK would be $4580 income per barrel of oil consumed, or a little more than 2 times the World average.
Using Hamilton’s 4% rule and applying it to the world would suggest a price of $89/b if we use all liquids.
If we use C+C instead we get $2683/b for income per barrel C+C produced and 4% of that is $107/b in 2013.
Note that the 4% number from James Hamilton’s research is based on the United States during a time when oil was used very inefficiently. It is possible that this value does not apply to the World.
Jeez, I was getting ready to sell you a box of spanish turron in exchange for one mililiter’s equivalent of crude oil, and use the gdp increase to buy a new coast guard patrol boat for our local police.
“I did the numbers above incorrectly.”
~Dennis Coyne
That figures.
1) There was no logical reason to calculate those numbers in the first place, since it was not really relevant to the argument anyway (just a useless distraction).
2) The numbers you calculated were incorrect anyway. Wow.
Those are two big mistakes that would have to be seen as weakening your argument against my theory.
Sloppy thinking
+ sloppy math does not = a good argument.
Hi Futilitist,
The oil is still very affordable at current GDP levels, $107/b for world averages, if Hamilton’s 4% estimate is correct. For countries that use oil more efficiently, such as many European countries they can afford much higher oil prices, probably $200/b.
This addresses your “affordability” question very directly. And the mistake has been corrected. Some people admit it when they are mistaken, some don’t.
Hi Dennis.
If oil is still very affordable at $107/b, why isn’t that the current price?
This addresses your “affordability” answer very directly.
It is good to admit mistakes, Dennis. But that was just a small one. Your entire argument is a mistake. Please admit that.
And I also admit my mistakes when I make them. But I am a lot more careful than you are not to make them in the first place.
Dennis Coyne says:
I don’t think the analysis is valid. Value cannot be measured in units of energy any more than it can be measured in labor (as it was done in classical economics by David Ricardo). From this basic error made by the Hills Group, a poor analysis flows.
Apparently you feel that the World Bank, and the EIA are wasting their time. To say nothing of the tax payers money! All economic activity requires energy to be performed. This graph was derived directly from their data:
http://www.thehillsgroup.org/depletion2_008.htm
It clearly shows a very strong relationship between energy consumption, and GDP. Common sense would tell you that this has to be the case.
Hi BWHill,
The demand for oil in your model looks like you are trying to equate energy to value. There is no objective measure of value, it is subjective, determined by consumer preferences and the interaction with the cost of production. Physics cannot be used to determine the value of a barrel of oil (or any petroleum product) to a consumer.
I do not think your maximum affordability curve is representative of the maximum consumer demand that is possible at any given point in time. Energy takes many forms and as long as the total input of energy into the economy is adequate for it to function, nobody will pay any attention to the energy content in a specific gallon of oil, so your maximum affordability curve lacks any basis for the way the economy actually functions.
A better way to look at affordability is to use GDP per barrel and then apply James Hamiliton’s 4% rule for a maximum oil price without a risk of recession. For 2013 this was about $107/b if we use C+C output for the “barrels” (this makes sense because we are talking about the “oil” price, other liquids have different (usually lower) prices and have lower energy content (NGL, and ethanol for example).
In fact Hamilton’s estimate (found by analyzing the US) is probably too low because Brent crude (which has become the World benchmark) has been over $107/b many times over the 2010 to 2014 period and the World economy has not been in any recessions since 2009.
Energy is not the only input into the economy so it does not take precedence over everything else. I am not suggesting an economy cannot function without energy, just that it is not the source of all value. You can create an energy theory of value, just as Ricardo and Marx used a labor theory of value. I could create a chicken or copper theory of value as well, it does not make it correct.
Basically using linear algebra you can value all commodities in terms of any other single commodity or basket of commodities you wish.
Clearly there is a relationship between energy and GDP, but the relationship changes over time as the economy uses energy more efficiently and as new types of energy are developed (nuclear, solar, and wind for example). Also other fossil fuels can be substituted for petroleum and eventually electricity (in rail, light rail, and EVs) will substitute for a lot of petroleum use. None of these factors are fixed, people can drive smaller cars with smaller engines, they can drive less, they can car pool, many things can change as fuel becomes more expensive. The UK produces almost twice as much GDP per barrel of oil consumed as the US, so clearly there is some room in the US for greater efficiency.
Hi Dennis,
Wow.
I hope you love the argument you are making yet again. I raised valid objections to all of your points and you have not answered any of them. Not even close. Now you just repeat them again here. Repeating the same objections over and over does not constitute an argument. It is just abject, naked denial. And your credibility declines with every repetition. You are looking more like a paid merchant of doubt to me every day.
A giant bullshit argument like you just made is a hassle for anyone to answer. But that is what you are hoping for, isn’t it? It is a great disingenuous debate technique. It really wears people out, as I can personally attest. Then you can just claim victory. Nice. You are a hack.
Scientists don’t do this, Dennis. I am watching you like a hawk. I will make it my full time job to expose your faulty logic every chance I get. I sure hope you sense by now just how serious I am.
Like I said, I hope you love the argument you are making. If you persist long enough, you will be making it with ever increasing frequency until the day you die as a result of the very social collapse you have so long denied. That is, of course, provided the internet doesn’t go off, or your employer doesn’t go all bloated, slimy belly up, first. Good luck.
And don’t even try to start some Miss manners bullshit over this, Dennis. You are the one with the bad manners here. 😉
Hi Futilitist,
Not talking to you, I was talking to BWHill.
Just ignore my comments. I don’t bother to read yours.
“Not talking to you, I was talking to BWHill.
Just ignore my comments. I don’t bother to read yours.”
Ha ha! I read every one of your ridiculous comments. And people reading this page will read my comments regarding how stupid and useless your comments are. And I am smarter, funnier, and more compelling than you. If you don’t respond you will look even more ridiculous. You cannot get away with your bullshit ever again. So keep ignoring me. It won’t do you any good. You have no idea how stupid you appear.
The arguments that you are making to bwHill are the exact same arguments you made to me. You could not refute my amateur arguments in support of his brilliant work. Now you believe that these same repetitive arguments will somehow win you the debate against the originator of a sophisticated physics model you don’t even understand. Good luck with that one.
I look forward to your debate with bwHill. This should be hilarious. 🙂
Hill, aka shortonoil on peakoil.com, is a speechless buffoon.
ETP is crapola. It can be calculated within 1 percentage point monthly due to data lags. The question you should ask yourself is why the quart shy of oil buffoon is still quoting 2012 annual data of 54% when March 2015 will be ~28%.
I’ll tell you why. The ETP is nothing but a WTI price proxy. The entire narrative falls apart when you understand that. What variable changed dramatically between 2012 and March 2015. The price obviously.
The ETP monthly formula is:
ETP = (a x b x 4.9 x 2.9)/d,
where,
a=petroleum volume (product supplied in the EIA accounts)
b=WTI $price (EIA data)
d=GDP
4.9=constant (thermodynamic)
2.6=nonpetroleum to petroleum energy consumption ratio (EIA data)
Can you figure out GDP?
The b variable (or WTI $price) drives the ETP formula.
Hi marmico.
I think I remember you from theoildrum. You seem very interested in this topic.
“I’ll tell you why. The ETP is nothing but a WTI price proxy. The entire narrative falls apart when you understand that. What variable changed dramatically between 2012 and March 2015. The price obviously.”
Heavy FED intervention (operation twist and QE3) is what brought the oil price up between 2012 and June 2014, when oil affordability was finally overcome by the rising cost of oil production.
“Hill, aka shortonoil on peakoil.com, is a speechless… quart shy of oil buffoon.
ETP is crapola.”
Good argument there. The rest is some math which I am sure no one understands. Not a real compelling refutation.
Dennis Coyne says:
The demand for oil in your model looks like you are trying to equate energy to value. There is no objective measure of value, it is subjective, determined by consumer preferences and the interaction with the cost of production. Physics cannot be used to determine the value of a barrel of oil (or any petroleum product) to a consumer.
The data presented by the World Bank, and the EIA is hardly subjective! It resulted from measured, counted, and computed quantities. Attempting to make completely absurd subjective statements to disprove objective data results in absurd subjective statements: QED. Your conclusions include so many embedded falsies that a child would see their illogical nature.
You made comments about the source presented above, obviously, without having read it. Each of your comments was specifically addressed in that source. Your rebuttals appear to result form either a weak, deranged mind, or someone with an agenda. An agenda directed, perhaps, toward obfuscation.
🙂 🙂 🙂 🙂 🙂 🙂 🙂 🙂 🙂 🙂 🙂 🙂 🙂 🙂 🙂 🙂 🙂 🙂 🙂 🙂 🙂 🙂 🙂 🙂 🙂 🙂 🙂 🙂 🙂 🙂 🙂 🙂 🙂 🙂
Hey Dennis,
Ha ha. It looks like I am not the only person who can see right through you. You are so far out of your league right now it is amazing!
I’ve been doing some calculations. I predict that there is no physical way that you can ever recover your credibility.
Hi five, bwHill. Dennis will probably put you on ignore, too!
I am going to make some popcorn. I can’t wait to see what happens next. 🙂 🙂 🙂 🙂 🙂 🙂 🙂
EVERYBODY ON THIS SITE NEEDS TO PAY VERY CLOSE ATTENTION TO THIS DEBATE!!! THERE IS NO OTHER DISCUSSION ON THIS SITE THAT IS AS IMPORTANT AS THIS ONE!!! ANYONE WHO CARES ABOUT KNOWING THE TRUTH ABOUT THE FUTURE OF OIL NEEDS TO SEE THIS DEBATE!!!
Ron should find a way to bring this important real information to the world! Perhaps this debate could be made more visible to more people by featuring it as a main post at the top of the page! Doesn’t that seem like a great idea? I think I will ask Ron.
🙂 🙂 🙂 🙂 🙂 🙂 🙂 🙂 🙂 🙂 🙂 🙂 🙂 🙂 🙂 🙂 🙂 🙂 🙂 🙂 🙂 🙂 🙂 🙂 🙂 🙂 🙂 🙂 🙂 🙂 🙂 🙂 🙂 🙂
How do we solve the intermittency problem of renewables, as the percentage of electric power provided by renewables increases?
Simple, you change people’s expectations and the way people manage and use their energy.
Some good lessons on energy using solar being taught here right now: LIVE!
http://www.solarimpulse.com/
Simple, you change people’s expectations and the way people manage and use their energy.
I totally agree. Seems like most (perhaps all) people here agree that it will become increasingly hard (and perhaps impossible) to maintain business as usual.
So the goal isn’t to come up with energy plans that can maintain BAU. The goal is to come up with energy plans that function with what we have to work with. That will likely require some massive lifestyle changes. But if the choice is between making those lifestyle changes and not doing anything because we can’t duplicate what we have now, I think making those changes will look more and more acceptable.
spot on
Booner,Few people can grasp this concept. Bravo for wording it so well.
Philip
Booner,Few people can grasp this concept. Bravo for wording it so well.
Thanks.
Dennis, that may work in some areas. It really doesn’t work in Africa. Check the Africa wind field map in my blog.
By the way, today I spent time reading papers and books about Lake Chad. Read the link about lake Chad in “the science is settled” and you may understand why I think a lot of what we read is distorted information.
Today I had a long lunch with a close friend. We were discussing “hacking your brain”, an article at the Economist, but then we drifted to a discussion about soot. She had very good insights, and brought up the fact that soot just isn’t a very well understood topic. So that’s my next study subject.
Dennis, once again speaking from the here, now, in -backyard view, I say again that my PV -all electric house works just fine, but I did draw about 100kW hrs from grid last Jan, exceptionally dark and cold.
I am the control system that manages the demand side, often sloppily.
I am working on a fill-in for those dark days, namely, a wood fired generator. Wood is stored solar energy, real cheap around here.
The pyrolyzer gas generator puts carbon back into the ground, so -carbon negative power.
When we get it photogenic, we will print pictures. Not quite yet.
Oil is doomed.
Hi Wimbi,
Can the stuff you are doing on a small scale (the pyrolyzer gas generator) be scaled up for use in a central plant outside a city? Just thinking on a grander scale here of how we might scale up wind and solar to higher penetration levels (say 90% of energy needs).
A point that is lost on some people is that less energy is needed as we move to higher levels of wind and solar and replace fossil fuel powered vehicles with electric driven transport.
If we assume 62% of energy is lost in thermal power plants and internal combustion engines (and it is probably higher than this) and assume that essentially all energy is currently used in this way (not really true because heating systems may attain 80 to 95% efficiency), then we can cut total primary energy use by 60% by switching to wind and solar, maybe 50% is more realistic because there will still be some need for fossil fuel backup, at least in the medium term (30 to 50 years).
Sorry, Dennis, didn’t see this until just now.
Sure, pyrolyzer works better bigger. Maybe you know European cities burn NYC garbage right inside cities for electricity.
Looking at LLAB Bar energy flow, looks to me that if all electricity generation were PV, totally available, no heat engine conversion, then we could get away with at least 15% less total energy than we use now, just for electricity generation.
And all of the coal.
And as you say, a lot more elsewhere. Especially transport.
A consummation devoutly to be wished.
That’s why I am a solar pusher.
Not to mention, ff’s are a sin (ref, Pope Francis)
How to solve intermittency problem.
First- look around to see what others have thought/done. Lots of examples of beentheredonethat.
Next, apply solar where there’s no problem. Eg- stock water pumping, town water pumping. All should be solar/wind right now.
Keep going up the list of uses, solving lesser storage problems to get the experience to go on to the next step.
Exec. Summary- Use Yer Hed.
How to cure cancer:
First- look around to see what others have thought/done. Lots of examples of beentheredonethat.
Next, apply chemotherapy and radiation where there’s no problem. Eg- get your treatment at the very best clinics in the USA and pay whatever it takes to use the most advanced cures.
Keep going up the list of cures, solving lesser pain and discomfort problems to get the experience to go on to the next step, and don’t worry about poor people in Africa, Asia and South America, most of them will die anyway.
Exec. Summary- Use Yer Hed.
Sounds like a good plan, one slight modification–
All, not most, die anyway. Life is fatal.
My own cancer plan. Do what works and doesn’t cost a lot, then, plastic bag over head and a little bottle of party balloon gas.
Tried it with a chicken already scheduled for execution. Chicken went from up to down real quick and didn’t seem to mind.
don’t worry about poor people in Africa, Asia and South America,
I do not understand your thinking.
In places with no electricity, the electricity that solar can provide is an advancement. Intermittent electricity is better than no electricity.
Boomer all I can say is you are not alone in your misperceptions about life in Africa. Americans in particular are world famous for their Hollywoodesque visions.
Think 200 million urban dwellers. Everybody wants to own a fridge, a TV, a radio, two fans
, three lightbulbs, and chargers for cell phones and computers.
Think 200 million urban dwellers. Everybody wants to own a fridge, a TV, a radio, two fans
, three lightbulbs, and chargers for cell phones and computers.
I follow the developments of entrepreneurs developing products for areas in Africa with minimal access to electricity. They are developing lights, cellphone chargers, solar cookers, human powered washing machines, etc.
And there is cross-over to the US camping market. Kickstarter has featured a number of the products.
This was supposed to appear below the comment with the other articles. But, at any rate, here’s another off-grid solar article about Africa.
Off-Grid Solar Companies Closed $64M in 2014: The Start of a Bigger Trend?
The numbers were boosted by two large deals: $20 million in debt and grants to Kenya’s M-KOPA Solar, and $23 million in venture funding closed by Tanzania-based Off-Grid Electric.
I said I wasn’t going to post more articles, but there are some really good ones. This provides some statistics.
More Believers Join Africa’s Off-Grid Energy Revolution
More than two-thirds of the [African] population is without electricity because they are not grid-connected, including more than 85 percent of those living in rural areas. That is nearly 600 million with no access to an electricity grid, a number expected to reach 700 million by 2030, according to World Energy Outlook.
And according to the International Energy Agency, it would cost more than $300 billion to achieve universal electricity access by 2030 through conventional means.
The World Bank estimates that 34 million Kenyans – 84 percent of the country’s population – have no electricity. In Uganda, the rate of rural electrification is just seven percent, according to the country’s Rural Electrification Agency.
Africa leaping off-grid
Off Grid Electric Raises $16M To Let Africans Pre-Pay For Solar Energy Just Like Phones
Prizes Powering Off-Grid Solutions in Power Africa Countries
Can Africa leapfrog the carbon energy age?
There are many more articles.
Yes boomer, but the African population is urbanizing at high speed. And their lives are quite different from what you visualize.
A while back I was charged with exposing engineers to African conditions to make sure they realized what they were getting into if they accepted a transfer and decided to take their spouse (we didn’t offer transfers to professionals with children in most cases). So I decided to familiarize myself with the local environment. And that local urban environment is very different to the one tourists see in Masai Mara or Kruger.
Yes boomer, but the African population is urbanizing at high speed. And their lives are quite different from what you visualize.
For those who have no electricity whatsoever, a small amount of electricity, even if it is intermittent, is better than no electricity. It can charge cellphones, which they are already using.
Whether or not they are urbanizing has nothing to do with what I am pointing out.
Exec. Summary- Use Yer Hed.
Ya figure some of them genius level engineers out there would be able to do that if they didn’t have their heds stuck in a watermelon…
BTW, Wimbi I really enjoy your humble toned down wisdom, and can do approach, sure beats the heck out of being a know it all arrogant genius…
Hi Fred,
I think both perspectives are very interesting.
It would seem that solutions that have been proven in developed countries can be transferred to the less developed world.
For a place that has little wind, we would use more solar and again if it is widely dispersed and overbuilt, less backup will be needed, there is also demand management and storage using hot water for heating applications and ice for cooling applications when there is extra solar output, along with batteries and fuel cells.
A fossil fuel solution is unlikely to be a long term solution, biofuels are a possibility for backup needs.
A map of solar energy availability in Africa is now included in this reference page
http://21stcenturysocialcritic.blogspot.com.es/p/africa-wind-power-energy-assessment.html
I used to work in West Africa. The area with low wind and solar power potential has dozens of cities with a population in excess of 100,000 inhabitants, and some which are huge, for example the capital of congo Kinshasa has in excess of 7 million.
Hi Fernando,
Solar power costs will come down and wind will as well, in the mean time these problems can be worked on in the developed world where most of the energy is consumed.
Do you have a solution in mind? The fossil fuel will deplete eventually, costs of wind and solar will become cheaper than fossil fuel. Are you thinking nuclear or should we call you Dr No?
The area with low wind and solar power potential has dozens of cities with a population in excess of 100,000 inhabitants, and some which are huge, for example the capital of congo Kinshasa has in excess of 7 million.
Lots of places have no fossil fuels, like…Spain. So, they import what they need.
Wind and solar are far more widely distributed than oil. If you judge a power source by it’s geographic distribution, wind and solar are far better.
Dennis, I don’t have a solution. I’m just pointing out theres a fairly large group of people with delusional ideas. I tend to think the top priority is to craft soap operas with female characters who only have two children. There’s also a serious need to help Africans with corruption and civil wars. It’s complicated. And I think it’s probably hopeless. The bs about solar panels for tiny villages surviving on simbiliki isn’t workable.
That’s funny, I just mentioned delusions in a post I made to you one minute before you posted this.
Two genius minds thinking alike, or is imitation the sincerest form of flattery? 😉
Hi Fernando,
I have not studied the problem as closely as you have, though I have been to Niger, Nigeria, Cameroon and DR Congo (Zaire at the time) and conditions in Kinshasa were not very good at that time.
I imagine things are very different currently though I don’t know if they are better or worse. The problems faced by African nations are not easily solved, probably their best bet is to focus on free birth control and access to education for women.
As the problems with renewable energy are solved in more developed nations and the relative costs of these alternatives compared with fossil fuels improves, the technology can be transferred to Africa.
I do not have any answers either, and there are certainly no easy answers to these problems.
You are a very interesting dichotomy, you hate Marxists (with good reason having grown up in Cuba), but Marx himself was concerned very much with social justice.
What you really dislike are dictators, these exist in both capitalist and socialist systems.
An interesting fact is that China (PRC) has made stunning economic progress in the last 30 years, hopefully they will transition to a more democratic form of government.
I wonder if that kind of progress could have been made without the state power exerted over that time. How much “freedom” would be given up by someone living in the slums of Lagos, if a benevolent dictator was elected that could make economic and social changes leading to rapid economic development?
The problem is that benevolent dictators only exist in the imagination, though dictators can be found all over and few, if any, have been benevolent.
Definitely there are no simple or easy answers to the problems of the world.
Dennis, are you aware that your green friends are using enormous pressure to stop international lending for power plants other than their cockamamie solar panels and wind turbines? Congo is the same. Mobutu was replaced by Kabila pére et fil.
Hey Fernando,
This thread is getting stale. You should try to focus on more a much more important topic.
http://peakoilbarrel.com/opec-crude-plus-more-on-eia-estimates/comment-page-1/#comment-505814
Dennis really needs your help.
Et tu Texas…
Once extravagant, renewable power plans go cheap
By JAMES OSBORNE, Dallas News, Published: 05 March 2015 08:31 PM
100 % renewable in Texas must be highly interruptible.
Kinda like the rain… but at least you know for sure the sun will come out tomorrow you can bet your bottom dollar. That; a lot more than you can say for oil… >;-)
Richard Hastings, macroeconomic strategist at Global Hunter Securities seems to have a view of the current situation with oil that is more in line with what we read at this web site.
US oil production growth is going to zero: Analyst
” But growth could go to zero on a month-over-month basis as soon as May, said Richard Hastings, macroeconomic strategist at Global Hunter Securities.
“I don’t think the market is looking at that,” he said in a “Squawk on the Street” interview. “We’re going to start to flatten out in production some time during the summer, and then the market is going to start to wake up.” snip
” Stockpiles of U.S. commercial crude stood at 448.9 billion barrels in the week ended March 6, 2015, the highest amount on record, according to the U.S. government’s Energy Information Administration.
‘That’s a month. This is a joke. Gasoline is about a month’s supply,’ he said, noting that hypothetical build to 650 million barrels of supply would only provide about 65 days of supply. ‘Some of the idea that the market would be permanently oversupplied is nonsense.’”
Alan from the islands
Alan, the actual peak depends on so many human decisions, it’s just impossible to nail down what’s going to happen. For example, I see very detailed and impressive analysis about the industry’s financial performance posted in this site. But those analyses just can’t factor our “monkey nature”. We tend to do the unexpected, and this behavior is driven by what we anticipate or hope is gong to happen.
This means we could see indebted companies avoid bankrupcy by selling properties to others who believe prices will rebound in x or y months. We also see companies delaying the actual well completion, and I suspect there are quite a few wells going offline and not being repaired until prices increase. All of this tends to be based in part on price expectations. This means we could see a quick peak, a decline period, and a rebound. The big question is whether the rebound will match the ongoing peak, or whether it’ll fall short. And that depends on too many wild cards like Lybia, Iran, and Venezuela.
Hi Ron,
At least since 2012, the EIA’s 4 week average output estimate has mostly been on the low side compared to the monthly data. I used the nearest 4 week average data point to the end of each month (this is not perfect since some weeks end 3 to 4 days away from the end of month date, I did not attempt to interpolate, too much work). On Jan 2, 2015(closest to Dec 31,2014) the 4 week average was 9129 kb/d C+C output vs monthly estimate for December of 9226 kb/d, so the 4 week average was 100 kb/d lower (only a 1% error if the monthly estimate is correct). As long as we use the 4 week averages the estimate is pretty good. Sometimes the 4 week estimate can be bad and they are not revised as you have mentioned in the past.
Hi all,
For Jan 2015 the 4 week avg was 9.2 MMb/d and for Feb 2015 about 9.3 MMb/d for US crude output from the EIA. The December 2014 monthly estimate was 9.2 MMb/d, a bit higher than the 4 week average for the end of December 2014 (9.1 MMb/d). So output was by about 200 kb/d from the end of Dec to the end of February based on the 4 week average data. It will be interesting to see what the monthly data shows when it comes out at the end of March, I expect flat output (+/- 100 kb/d).
http://www.eia.gov/dnav/pet/pet_sum_sndw_dcus_nus_4.htm
Hi all,
The 4 week average crude output continues to rise according to the EIA, the four week average for the week ending 3/13/2015 rose by 35 kb/d from last week’s 4 week average and up 220 kb/d from the end of 2014 and about 125 kb/d from one month ago. Note that the 4 week average at the end of 2014 was 100 kb/d lower than the monthly estimate for Dec 2014, so the current 4 week average is only up 120 kb/d from that more accurate monthly estimate. Actual output is likely flat because the 4 week average may be an overestimate. The current 4 week average crude output is 9349 kb/d. Dec 2014 was 9226 kb/d.
http://www.eia.gov/dnav/pet/hist/LeafHandler.ashx?n=PET&s=WCRFPUS2&f=4
I have always been fond of “The Emperor’s New Clothes” as an allegory for denial and it’s unmasking by exposing the proverbial elephant in the room. But the subject of collapse denial calls for a stronger, more relevant allegory. I think I have the perfect one. Edgar Allen Poe’s “Mask of the Red Death”. It perfectly captures the many elements of the daily masquerade played out here at peakoilbarrel.
http://www.litcharts.com/lit/poe-s-stories/the-masque-of-the-red-death
The Red Death, a bloody disease that kills a man rapidly with a seizure and bleeding from the pores, is terrorizing the country. But Prince Prospero is unaffected. Though his people are dying by the hour, he gathers his friends and his knights and shuts himself away in an ornate abbey, which he designed himself. He has it fitted with everything they need to avoid the disease and the Prince is determined not to think about it – he fills the abbey with entertainments.
Death and life come up against each other in this story. The figure of Prince Prospero is healthy, wealthy and lives beyond threat and vulnerability, and the Red Death is challenging him for the throne. But though the plague kills the masses easily, Prince Prospero’s prosperity (pun intended) is unaffected.
After a few months, the Red Death is at its height. But the Prince holds a fabulous masked ball, throughout the imperial suite, whose seven rooms are unusually laid out (fitting the Prince’s unusual taste) in sharp turns, so that you can’t see further than one room at a time. Each apartment has windows matching the color of the décor, one decorated in orange, another in violet and so on. The seventh apartment is black with scarlet window panes. In the whole suite, there are no lights of any kind, but in the corridors that lay behind the windows of the suite, fires blaze. Shapes dance around the walls from the patterns of the flames.
If Prince Prospero’s lively abbey retreat did not show his willful disregard of the plague that has swept his realm and killed his people, then this extravagant display certainly does. The masked ball is both a kind of celebration but also a place of darkness and disguise, providing a setting perfect for mystery. The numbering and thematic colors of the suite’s rooms adds a sense of strangeness, and of being trapped, to the party.
The black seventh room becomes so fearsome with the illuminations from the fire that none of the guests venture into it. Also in this room is a giant clock, which, every hour, strikes with a deep, clear note of very strange pitch. This sound sends the masked company into a kind of reverie.
The fated seventh room is the odd one out and the story implies, though only vaguely, that something otherworldly is occurring as the time passes. The passing of time, marked by the eerie chimes of the clock, symbolizes the threat of death that the guests and the Prince are trying to ignore.
But besides these things, the ball is a magnificent event. It is all designed with the Prince’s eccentric taste, combining the disgusting and the beautiful, which is so bold that it is almost grotesque. Some think he is mad.
The disgusting and beautiful images are brought together in the Prince’s curation of his Imperial Suite. Like other Poe characters, the prince pulses with life, but with a kind of grotesque self-aggrandizing life.
Through the suite, “dreams” pass through, writhing and following the colors and sounds of the room, freezing with each chime of the clock, and moving again as the chime ends. But to the last chamber with the black drapes, none of these masked dreamers go. Here, the chime of the clock sounds solemn and loud, whereas in the other, brighter rooms it has a merry sound.
The architecture of the scene represents the Prince’s character and the final seventh room foretells a dark fate. The strange behavior of the masked dancers show how in tune they are to the rhythm of the apartment’s music and the uneasy passing of time.
The colorful apartments are full to bursting, and the party goes on feverishly until the strike of midnight, when the music and dancing uneasily comes to a stop and the dancers fall into their strange reverie. Then there are twelve further chimes. Before the chimes die away, the crowd becomes aware somehow of a new presence in the suite. The rumor of this presence travels through the rooms and the company becomes collectively fearful.
Midnight is a well-used hour in Gothic literature – its position between night and day and the magic associated with it makes these twelve chimes a superstitious significance. The revelers are drunk with this mystic atmosphere and the rhythm of the clock keeps them moving in this elaborate show of denial. But when this dream is broken, the sensation that they have been avoiding attacks them all at once.
What kind of figure must this be to cause alarm even in such a strange party? Even in the most reckless person, there is always something that will touch his sensible side, and for Prince Prospero, this figure does that. The figure is completely masked, from head to foot, as if dressed for the grave. Within the crowd, the rumor grows and they become sure that the figure, stained with scarlet, is the Red Death itself.
The Prince has formed an image of himself as an unbeatable, superior creature, above even death. So the deathly figure that now approaches is immediately associated with death itself. The mask is now a sinister object, reminiscent of grave shrouds and bandages.
The figure moves slowly among the waltzers and starts to shake with rage as he sees Prince Prospero. The Prince, also enraged, orders the man to be uncovered and hung from the battlements. His words ring through the seven chambers. The group around him begin to approach the figure, but no one wants to seize him, and so he is able to stalk right up to the Prince, and past him, through each room, to the violet room. Then the Prince, angry at his own cowardice, quickly follows the figure and draws a dagger from behind.
Prince Prospero’s authority and personality are threatened for the first time here and a battle of wills ensues. The unknown masked character is bent on the Prince and the Prince on him, and the Prince’s exuberant party-throwing skills are nothing to the threat of death. Now the layout of the suite comes into play and captures the Prince in a trap of his own design.
Now at the black apartment, the masked figure suddenly turns and the Prince drops to the floor. The revelers rush into the room and the figure in the shadows is now intangible, save for the mask and grave-like robes. The Red Death captures each dancer, one by one, the clock stops and the lights go out, and the Red Death finally rules over the whole realm.
The masked figure is blood-stained and, after stalking ominously, kills the Prince in seconds – the figure is the personification of the plague. His effortless overthrowing of the Prince, who had seemed too big and wild to be vulnerable like an ordinary citizen, shows the power of death over the living.
It’s Green Day!
Today is the day to celebrate green and shamrocks, luck of the Irish, top of the morning, rainbows, pot of gold, and every double ham-fisted drunken Irishman would agree.
Underneath those verdant hills is a pot of black gold, so your life is really worry free at the moment.
Harp lager is the beer of choice today. Brewed by Guinness, so a black and tan works too.
Art Berman just emailed me with this:
The back-peddling begins. EIA today published their latest drilling productivity report and now predicts that the Bakken, Eagle Ford and Niobrara production will decline in March. Of course, their predicted number is quite small–24,000 bopd, less than what has already occurred in the Bakken for January–but this is how things begin, a slow recognition and admission that you cannot continue to produce the same amount of oil with half the drilling in plays where the decline rates are high.
Falling rig counts drive projected near-term oil production decline in 3 key U.S. regions
Be sure to check out Art’s blog, it is perhaps the best on the web: Art Berman Blog
His latest:
Misleading IEA Statement Sends Oil Prices Lower and The U.S. Rig Count
Hi Ron,
I went through the Daily reports for February in the ND Bakken and by my count there will be about 136 new wells for February in the ND Bakken if 95% of completed wells are Bakken wells and if all of the confidential wells “plugged or producing” were producing rather than abandoned.
My model suggests about 1150 kb/d in Feb 2015 if this new well estimate is correct, the model will probably be high, we will see in a month. If new wells added decrease by about 10 each month so that 85 new wells are added in July 2015 and continue to be added at this level until Jan 2017, output will be 1000 Kb/d in Jan 2017. Legacy decline also falls as fewer new wells are added from 70 kb/d in Jan 2015 to 40 kb/d in Jan 2017.
Dennis, it would be a lot easier if you would just deal with North Dakota production instead of estimating that 95% of new wells are in the Bakken. Just use all the wells and use all North Dakota production. Helms does not separate the rigs and stats in his report so I don’t either.
Okay, using the “Daily Activity Report” from the NDIC site is a little deceiving. I think you are counting the “WELLS RELEASED FROM “TIGHT HOLE” STATUS” in your count of 136 new wells. The data from these wells were released in February but many of these wells came on line in December and January.
All that being said, I think you are way too optimistic with your prediction. I expect all North Dakota production to be below 1 million barrels per day by the end of 2015.
Hi Ron,
You can easily count the wells in Enno Peter’s data. The model considers the Bakken, as that is where most of the output comes from. I do not have a model for the non-Bakken part of North Dakota output. I am not using wells released from tight hole status I am using “producing well completed” and “confidential well plugged or producing”. I assume the confidential wells are producing rather than plugged. How many wells do you expect will be completed in 2015? It would have to decrease quite a bit to get to the levels you suggest, I think the field decline with fewer new wells added is lower than your gut tells you.
My gut never tells me anything except when I need to go to the bathroom. Seriously I try to never use intuition for anything though I guess sometimes it cannot be avoided.
If WTI stays below about $60 then I expect 1200 to 1320 to be fracked. That is 100 to 110 wells per month. But it could be a lot less.
Hi Ron,
I believe you are not accounting for the fall in legacy decline as the number of new wells decreases. My model with 85 wells from mid year 2015 adds 1235 wells in 2015, output at the end of 2015 is 1040 kb/d. Chart below with legacy decline in kb/d from 2011 to 2021, where it is assumed 85 new wells per month are added from July 2015 to Jan 2021. This chart matches the 85 well scenario presented at link below
http://peakoilbarrel.com/opec-crude-plus-more-on-eia-estimates/comment-page-1/#comment-505071
Longer range scenario with 85 new wells per month from July 2015 to Aug 2034. Real oil price starts at $45/b and rises to $147/b in Aug 2034 (real oil price in 2015$).
Dennis, I think you are way underestimating legacy decline. Enno’s data has 152 wells coming on line in January yet production was down 37,000 barrels per day. What kind of legacy decline do you have to have to come up with those numbers?
Hi Ron,
The data does not match the model exactly as it is a simplification. A lot of wells that started producing in Dec 2014 had zero output in Jan 2015, other wells may have been down for maintenance, or temporarily shut in due to weather issues, the model usually has a few months in the winter where output is either too low or too high, you are putting much too much emphasis on a single datapoint, not a good idea with noisy output data imo.
Now you should know that all my estimates are never based on a single data point. But we shall just have to wait and see.
Hi all,
Did some reading over at Art Berman’s blog. I agree with Ron that Art’s stuff is definitely worth reading. Thanks Ron.
Art Berman is an industry insider who writes a blog called “The Petroleum Truth Report”.
Arthur E. Berman is a geological consultant with thirty-six years of experience in petroleum exploration and production. He currently is consulting for several E&P companies and capital groups in the energy sector. He frequently gives keynote addresses for investment conferences, boards of directors and professional societies. He is often interviewed about energy topics on television, radio, and national print and web publications including CNBC, CNN, CBC, BNN, OilPrice.com, Bloomberg, Platt’s, Financial Times, and New York Times.
While all that sounds impressive, I think it is good to have a bit of healthy skepticism when listening to industry insiders who purport to tell you the ‘truth’. Think.
Futilitist, I don’t think you have read a goddamn thing Berman has wrote. If you had been following his blog you would know he is a peak oiler who has been one of the harshest critics of the shale oil and gas industry and of the oil industry in general. If you were to take the opposite side of what Berman has to say then you would believe that shale oil is the salvation for the oil industry and will produce fossil fuels forever.
I think you often criticize just because you think it makes you sound smart. But in the case of Berman we get the exact opposite impression.
Just what is your definition of an “oil industry insider” anyway? Jeffrey Brown is an oil insider and so is Mike and toolpush and several others that post here. Should we be skeptical of what they say simply because they are an oil industry insider?
+1
-2
= -1
Oops, sorry for the sloppy luddite math. I should have noted that the -2 points was really -1 for each of the two prior posts, not just Dennis’ alone.
And of course URR absolutely correct, Caelan. Negative points for commentary is simply irrational. It would be like saying the that the laws of supply and demand could actually somehow change.
And We all know how ridiculous that sounds. 😉
Futulist:
Art was fired because he was critical of shale.
http://www.artberman.com/from-perry-fischer-former-world-oil-editor/
You should (at least try) to judge people on what they do rather than on where they work(ed).
With regard to the “we’re screwed because when oil is high it’s bad for consumers, when it’s low it’s bad for producers” comment you keep dragging out I’d be happy to write a proper response if you truly don’t understand why that statement makes no sense – although needing to do that would be a little sad…..
rgds
WP
Lay it on me anyway, WeekendPeak. I’m very curious as to how you will refute me. No one else has been able to.
Looking forward to your proper response.
rgds,
Futilitist
Hi Futilitist,
Actually you have been refuted on several occasions.
You deny it.
Bullshit. Refute this:
http://www.thehillsgroup.org/depletion2_022.htm
The authors of this useful, predictive model, based on physics (second law of thermodynamics), actually specifically agree with my extension of their model!
You asked for it, Dennis.
Hi Futilitist,
The supply curve looks simply like an exponential fit to annual data, not very impressive. It might be a polynomial, but is just a curve fit, I agree that costs will increase, but I doubt it will follow that curve. The oil price that consumers can afford has nothing to do with the energy available in a barrel of crude, it depends on income, the price of substitutes, and consumer preferences. Perhaps you should ask political economist, who I believe as a PhD in economics, maybe he can point out that if there is an objective theory of value, anything can be chosen.
It can be labor as David Ricardo (and Karl Marx) used, it could be energy, it could be copper, iron, cement, or any other input into production.
It is simply a matter of using an input output matrix and linear algebra and any good can be used to value all other goods.
Piero Sraffa wrote about this in 1960 see
http://en.wikipedia.org/wiki/Piero_Sraffa
The analysis is a little interesting, but the main point is that energy is but one input of many in the economic system and has no special place, nor does labor. Value is subjective, there is either no objective theory of value, or there are an infinite number of objective theories of value.
Dennis.
You are suggesting infinite substitutability!!! That is the biggest pile of bullshit in all of economics.
Energy is not just another commodity. Energy is the fundamental driver of all life on earth.
The ETP model is based on the second law of thermodynamics, one of the very foundations of physics and all of science. Do you know anything about physics?
Leave it to you to pick the dismal science over actual science.
If you really think you are refuting anything, you are *WAY* out of your mind, IMHO.
“The supply curve looks simply like an exponential fit to annual data, not very impressive. It might be a polynomial, but is just a curve fit, I agree that costs will increase, but I doubt it will follow that curve.”
From the link:
The ETP derived Cost Curve is constructed from the ETP model, and has mapped the price of petroleum since 1960 with a correlation coefficient of 0.965. It is the most accurate pricing model that has ever been developed.
Your arguments are a joke! This discussion is a giant waste of time. I don’t want to talk to you any more.
Hi Futilitist,
There are many forms of energy besides oil.
I am not talking about infinite substitutability, just that sometimes substitutes are found.
Have you ever ridden a horse or horse drawn carriage? That was a dominant form of transportation at one time, however substitutes replaced the horse to a large degree. Oil is one form of energy, I am not suggesting we will use no energy, we will use other forms of energy, mostly electricity, in the future.
I actually have a degree in Physics so know a thing or two about the subject. I also have a degree in Economics and know a bit about that as well.
Energy is absolutely necessary, so is water, air, nitrogen, carbon, and many other things to life. It cannot be boiled down to energy only.
I agree that there is no point in discussing however. In the future don’t expect any answers to questions you might ask.
You will be ignored.
Thanks for taking the Futilitist Collapse Challenge. I don’t care if you think you won. You very clearly did not.
Hey everybody! Do you think Dennis refuted my theory? I would love to hear from anybody with an opinion.
Hello? Anybody?
Hello?
But I guess everyone will now follow Dennis’ lead and just ignore me. Awesome. That is the way any good team of ethical, curiosity driven scientists would act when presented a theory that seems amazingly predictive. 🙂
What a waste of time. I wonder if anyone even reads this.
What is nihilism?
That graph has no basis in reality.
This is an actual graph of the oil price.
http://www.macrotrends.net/chart/1369/crude-oil-price-history-chart
John,
There is no reason to adjust for inflation. Read the link.
Deniers trotted out inflation adjusted oil price graphs during the oil spike in 2008 to convince people not to worry because, supposedly, $147.50/barrel was not really a high price for oil! Ha ha.
Deniers were *WAY* wrong then, too.
Everything evolves, even denial.
Hi Ron.
“Futilitist, I don’t think you have read a goddamn thing Berman has wrote. If you had been following his blog you would know he is a peak oiler who has been one of the harshest critics of the shale oil and gas industry and of the oil industry in general. If you were to take the opposite side of what Berman has to say then you would believe that shale oil is the salvation for the oil industry and will produce fossil fuels forever.”
I don’t take the opposite side of what Berman has to say. You are painting a false dilemma.
From the wiki:
A false dilemma (also called black-and-white thinking, bifurcation, denying a conjunct, the either–or fallacy, false dichotomy, fallacy of exhaustive hypotheses, the fallacy of false choice, the fallacy of the false alternative, or the fallacy of the excluded middle) is a type of informal fallacy that involves a situation in which only limited alternatives are considered, when in fact there is at least one additional option. The opposite of this fallacy is argument to moderation.
The options may be a position that is between two extremes (such as when there are shades of grey) or may be completely different alternatives. Phrasing that implies two options (dilemma, dichotomy, black-and-white) may be replaced with other number-based nouns, such as a “false trilemma” if something is reduced to only three options.
False dilemma can arise intentionally, when fallacy is used in an attempt to force a choice (such as, in some contexts, the assertion that “if you are not with us, you are against us”). This fallacy also can arise simply by accidental omission of additional options rather than by deliberate deception. Additionally, it can be the result of habitual, patterned, black-and-white and/or intensely political/politicized thinking whereby a model of binary (or polar) opposites is assigned or imposed to whatever regarded object/context, almost automatically–a process that may ignore both complexity and alternatives to more extreme juxtaposed archetypes; binary opposition is explored extensively in critical theory.
“I think you often criticize just because you think it makes you sound smart. But in the case of Berman we get the exact opposite impression.
Everyone is entitled to their own opinion. Who is we?
“Just what is your definition of an “oil industry insider” anyway? Jeffrey Brown is an oil insider and so is Mike and toolpush and several others that post here. Should we be skeptical of what they say simply because they are an oil industry insider?”
Please don’t take this the wrong way, Ron, but the answer is yes.
We are online. We have no way to know if someone is telling us the truth or not. The only way to know is to fairly evaluate the ideas presented.
We should not endorse each other. That is the argument from authority. We should endorse each other’s worthy ideas.
And I did not suggest we should automatically distrust anyone simply because of their tribal affiliation. I certainly don’t. Suggesting that I would somehow endorse such a thing is just another false dilemma.
Again, I don’t think you have read a goddamn thing Berman has wrote.
While all that sounds impressive, I think it is good to have a bit of healthy skepticism when listening to industry insiders who purport to tell you the ‘truth’. Think.
Did you ever hear of anyone purporting to tell a lie? You are suggesting that we be skeptical of anyone who says anything because of the industry they work in. That is about the dumbest goddamn thing I have ever heard anyone suggest.
Ron,
“You are suggesting that we be skeptical of anyone who says anything because of the industry they work in. That is about the dumbest goddamn thing…”
Did you read my post?
Here is what I just said:
“And I did not suggest we should automatically distrust anyone simply because of their tribal affiliation. I certainly don’t. Suggesting that I would somehow endorse such a thing is just another false dilemma.”
~Futilitist
Please stop putting words in my mouth.
You suggested that we should be skeptical of anything Art wrote because he is an industry insider. That is the same damn thing.
Now you are trying to weasel out of what you obviously said. That is even worse. Why don’t you just admit you said something very stupid. We all do that from time to time.
Ron,
I don’t care about Art Berman one way or the other. My comment was in response to Dennis’ comment endorsing Berman’s blog.
I looked at Berman’s blog. I do not agree with him or you about the EIA production forecasts because I have a different theory to explain them. I think Berman’s explanations for his reasoning on this are weak.
I don’t know why Berman makes these arguments. It seems like a false meme to me. It makes me wonder.
It is not a bad thing to be skeptical of what anyone says. To follow your line of reasoning, I should accept what Berman says uncritically.
That is my legitimate opinion, to which I am entitled.
I think you are making a mountain out of a molehill.
I looked at Berman’s blog. I do not agree with him or you about the EIA production forecasts because I have a different theory to explain them.
Rolling in the floor laughing my ass off!
Futilitist, Berman has been doing this for decades. He has studied how the EIA works because he has been following their methods and knows exactly how they arrive at their conclusions. When you imply that you know more about this than he does I find it hilariously funny.
Ron.
I am so glad you find this funny.
I am sure that Berman knows a lot more than I do about how the EIA estimates production. That is not the point. I am obviously suggesting that Berman is missing something important that might be outside of his area of expertise. Or he might, just possibly, have some other motive for saying what he is saying. Or whatever. I don’t really even care why. I just don’t think he is right about his explanation for the discrepancy in the EIA numbers, because I believe my theory explains it better. That is all. It is not impossible for him to be wrong.
Hey Art, if you are out there, I hope you are not actually offended. If so, I sincerely apologize. I meant no disrespect to you.
Futilitist publishes a comment that is more libelous than not, the old ad hominem, shoots yet another messenger, then somehow everybody else becomes the problem, all others are at fault, and all of a sudden he’s a freaking genius.
hilarious
Hi Ronald,
I guess we have two geniuses (Fernando and Futilitist).
🙂
Hi Dennis.
Fernando attributed genius to himself.
I never actually made such a claim, but I guess am flattered that you see me that way. Thanks.
Hi Futilitist,
It was Ronald that claimed you were a genius, I was joking, (that is what the smiley face is intended to indicate.)
Dennis Coyne says:
The supply curve looks simply like an exponential fit to annual data, not very impressive. It might be a polynomial, but is just a curve fit, I agree that costs will increase, but I doubt it will follow that curve.
Your have made three mistakes in the comment above:
1) That curve is not a best fit to the price data set. The curve is generated directly from the Etp Model.
http://www.thehillsgroup.org/depletion2_010.htm
2) The curve is neither an exponential curve, nor is it a polynomial. It is a complex exponential curve of the form: y = exp(5.4*10^-5(1.4*10^5 / (1+ 361.44e^(-0.053x))) + 0.6877): where y = $/barrel, x = year with 1900 taken as year zero.
3) Between 1960 and 2009 the price of oil followed that curve with an average variance of $0.00. We also predicted the present price decline last May, and put up this page in September:
http://www.thehillsgroup.org/depletion2_022.htm
Welcome bwhill,
I am so glad you showed up. This is a major development. Please do stay for a while. I think your model is very convincing. I want to learn everything I can about it. And I really want everyone here to know about it, and understand it. I hope I haven’t made any statements that misrepresent your important work.
I guess you’ve probably noticed the deeply embedded, inherent, knee jerk resistance so prevalent on this site. I expect you might have encountered this kind of thing before, but be aware that this place may surprise you in terms of the intensity. I hope you have some patience.
~Loren Soman (aka Futilitist)
Hi BWHill,
So it is a curve fit to the oil price, which is essentially an exponential of an exponential. What is the theoretical justification for the curve? The price prediction for your curve looks to be very far off for 2015, when using the equation you gave, I get $128/b rather than $44/b.
Your maximum consumer price is the very weak part of the analysis.
Note that if we use real oil prices in 2014$ using BP and EIA and BLS data (BLS is the Bureau of Labor Statistics, they do the consumer price index and I got the data back to 1913). We can compare your price model to a simple polynomial curve fit using excel, to determine what curve is best we need a theory, curve fitting alone is not enough.
Um…Dennis,
“We can compare your price model to a simple polynomial curve fit using excel.”
Your simple excel curve fit projection shows a more severe problem with the oil price (too high to be supported by the economy) than the one accurately forecast by a real physics derived model.
Dennis, you failed to notice that your projection is even more pessimistic than mine!
So, if you were right, which of course you are not, we are even more screwed than I think we are! Ha ha. You are arguing with yourself!
If it gets to be too stressful, I guess you can just put yourself on ignore!!! 🙂
Hi BWHill,
You say,
The value of a hydrocarbon can be determined by the quantity of energy it is capable of supplying.
That is not how the value of anything is determined. You are attempting to create an energy theory of value. Nothing is valued solely on the basis of the energy it is capable of supplying. It may play a role, but it is certainly not the sole determinant.
From that basic mistake at the foundation of your theory, it all falls apart.
There is also this:
A barrel of 35.7° API crude has an energy content of 5.88 million BTU, but not all of that energy is available for use by the general economy. A substantial portion of that energy is needed to extract the crude, and produce its finished products.
Other forms of energy such as coal, natural gas, and electricity produced by nuclear, wind, and solar power can be used to extract and produce the finished petroleum products. Petroleum does not have to be used to supply the energy for all of these processes.
There is also:
Because petroleum must act as an energy source to have value, it must be capable of supplying at least enough energy to support its own production.
Why does petroleum have to supply more energy than is used in its production? Maybe it is valued because of its high energy density, coal or natural gas could be used to supply the energy used to produce the oil as long as the oil can be sold at a price that makes the extraction process profitable.
Energy companies are not in business to extract energy, they are in business to make money.
On an economy wide basis, clearly the energy return on energy invested must be positive, but this does not have to hold true for individual forms of energy.
In fact nobody really keeps track of these net energy flows, so we don’t really know what the net energy of coal, natural gas, or oil actually is for any individual oil well, or coal mine, if you ask most energy companies about EROEI, they will have no idea what it is for their company, nor will they care.
The total energy used in the extraction and processing of petroleum must be less than, or equal to the energy content of the petroleum. If it were greater the energy production from petroleum would stop.
No it would not. Is all the electricity used in the pumps on old wells and in the refineries provided by oil fired power plants? Absolutely not. The bottom line is all that matters, and it is not measured in energy, it is measured in dollars.
When petroleum can no longer provide energy to the general economy it will have little, or no value.
No, if the oil produced cannot be sold at a price that yields a profit for the oil company, and if this continues for a long period, such that the oil company has to go bankrupt, then less oil will be supplied.
The value of the oil will be determined by supply and demand.
If oil were the only form of energy in existence some of the propositions above might be true.
Oil does play an important role in the economy because almost all transportation and many other things (farming) are powered by crude oil and its products. As long as there are other forms of energy that can provide energy to the economic system the only thing that matters is that the energy return on energy invested of the entire economic system is positive.
That is not how the value of anything is determined.
Fine art and the tulip bubble of the 1600s are illustrations of value being determined by what people will pay, not necessarily any intrinsic value that can be calculated.
So,
Oil = tulip bulbs?
Are tulip bulbs as important to the functioning of industrial civilization as oil?
Are we approaching peak tulip bud? Since tulip buds are essential in the making of tulips, this would mean that peak tulip cannot be far in the future! Oh my. As if we didn’t have enough problems already.
Dennis,
Your arguments clearly show that you know nothing about oil, but you sure know a lot about snake oil.
Your giant bullshit argument pisses me off so much that I cannot keep from jumping in here. We covered all this before. Over and over again. I already spent many unpaid hours beating you in this debate. After all that, you offer up the same stupid arguments to bwHill! What an insult.
When you lose an argument, at some point you have to concede, Dennis. Otherwise you become unbelievably annoying. You are a major liability to the truth.
You do not understand physics (or you are pretending not to understand). Your argument is all economics. Economics is not science. It is dismal science.
The economy is a physical system that runs on energy and conforms to the physical laws of the universe.
This bold assertion above must be true. But your entire voluminous argument totally contradicts this statement. Your argument must be false.
But your argument isn’t just false. It is so far from any known scientific reality that it is absolutely stunning. You are so disingenuous, you are radioactive. Farcical. A joke. Any discussion with you devolves into a satire.
If you had any physics understanding, and you were at all sincere, you would not be making these obviously lame arguments. You are so far out of your league in this debate with bwHill that it feels like we have entered the Twilight Zone!
Dennis, you are an insult to everyone’s intelligence.
It is not proper to even have your kind of misleading bullshit propaganda on a serious site about such an important topic. Period. This is beyond ridiculous. I think your behavior reflects very badly on this site. You are a snake oil selling, charlatan pseudoscientist who runs amok here. I have to wonder why Ron sees fit to post your junk at the top of his blog.
I sure hope this doesn’t seem like bad manners to anyone. If anyone thinks I am being out of line here, let me know. 😉
“If anyone thinks I am being out of line here, let me know.” ~ Futilitist
I suspect you already know the answer or you wouldn’t have asked. But the ad homs. You are making the same mistake Old farmer mac made with you. You can do better. Get angry if you must and attack the argument or comment, but not the person. You are smarter than that. Instead of saying ‘You are a joke’, write, ‘Your comment is a joke.’. See the difference?
Suggestion; get off the computer if you get upset, or go elsewhere online. Take a shower, go for a walk, sleep on it. You may find that when you return or wake up the next day, your thoughts and feelings will have changed.
Some of your comments are great and level-headed.
Anyway, while I am here, I’ve been reading some BW Hill and related stuff and it occurred that peak oil will likely throw the economy into chaos or is starting to do so now…
Cornucopian ideas seem to take for granted the relative stability of the system going up/growing (will be the same going down). Also, like any complex system in chaos and/or fundamental change, there will be unpredictable non-linear knock-on/feedback effects, if I describe this correctly.
Given that, it seems near impossible that the relative stability going up will be anywhere near available going down.
This is also why I am hedging my bets by looking into a lifestyle that relies as little as possible on the system. EV’s and PV’s for example are part of that system.
I read Berman’s blog post discussing the IHS report. I tend to agree more with IHS. The light molecule imbalance will be partially fixed if some of the light crude escapes the export ban. Furthermore, if I had the ability to process a medium crude to export to the usa I would strip out the light ends to make a chopped crude complimentary to Bakken and Eagle Ford.
If anybody reads this who knows about lp runs I would appreciate feedback. What I would like to do is cook the oil to make a close fit to say Eagle Ford condensate.
Hi Fernando,
Thanks. In this area you clearly are the expert (relative to me). What did you think about Berman’s recent posts? I don’t agree with everything he writes, but the most recent four posts or so I thought were quite good. Do you disagree with most of what Berman writes or just that specific piece?
I think he’s pretty good. I just disagree on the oil export idea. But I used to be a plant engineer, so I divide the oil streams by components. I have a really nerdy way of thinking, I’m always figuring out how to tinker with the molecules to increase their value.
Fernando,
Thanks. You had me worried that I was totally missing something.
I probably am, but is comforting that you don’t see huge holes in Berman’s thinking which appears solid from my perspective.
Ron, Is it possible the EIA is intentionally trying to push oil prices down for political reasons? But has to do some back-peddling in order to try to save face and retain some credibility. EIA must fully understand how oil prices react to what they are saying. They are also a government agency there for can be used for political purposes. Do you notice a trend of misinformation coming from the EIA? Have you ever in the past noticed a trend of misinformation where maybe the incorrect numbers coming from the EIA actually pushed prices up instead of down over any given period of time?
The effects of the price collapse is beginning to take a serious bite out of Canadian tar sands exploration and extraction activity. Last week’s rig count in Canada dropped by 80, according to the most recent Baker Hughes report. Imports from Canada have declined slightly in the last month, though they are still quite high. And there’s the news brief (Note link to original article is broken).
http://ieefa.org/1000-layoffs-overnight-by-tar-sands-developer
Pretty sure spring thaw is the seasonally normal time for canadian oil rig decline.
Correct. Spring breakup = mud and road restrictions up here. When Western Canada thaws dirt roads/drill sites become soupy messes, drill rigs stop. Affects truck logging and mining exploration as well.
Nevertheless the Canadian rig count during this same week last year stood at 522. It now stands at 220, a drop of 302 rigs, season point last year to same season point this year.
Now that’s more meaningful.
Sawdust, No, I don’t think the EIA is being dishonest for political reasons. Who’s politics would that favor? I think they are honest and looking at their algorithm and just reporting the data is spits out. Art Berman puts it this way:
EIA and IEA ultimately get their U.S. production data from the states. State reporting on oil production is lagged by at least 3 months and it takes another month or two for adjustments to be included. IEA and EIA use sampling methods of certain large producers that are then put into algorithms to approximate recent production. So, what we get from these organizations is a pretty good guess that will be revised later.
Their algorithm just gave them some bum production numbers. That’s really all I think that happened. But when they saw those numbers from North Dakota they realized they had really screwed up and began to backtrack. They may very well be backtracking further however.
Ya pretty much that. If you’ve spent time in DC you’ve spent time on the Metro and it’s filled in the morning with guys who got up, looked in the mirror, shaved, and went to work. They don’t do that every day to make it their job to lie.
Errors can be systemic. They can be using a source that no longer is valid. The measurement itself may no longer matter — like the newly famous sales by refinery affiliated retail outlets. Those outlets were sold off. The number remaining is few. So retail sales of gasoline appears to have crashed. Doesn’t measure the same thing anymore.
This sort of thing is likely underway with Jeffrey’s API focus, and there WAS that article I posted here from the WSJ announcing a redefinition of WTI.
Back when night baseball became prominent in the late 1960s (first night game in the 30s, but prominence took time) to generate ticket sales from people who could not take off work, a recognition of pitched balls being harder to see under lights than natural sunlight led to a lowering of the mound. Baseball’s org watched as pitchers became more and more dominant (1968 was “the year of the pitcher”) and so they made that choice for 1969. All to make the game’s historical stats still comparable (and to keep fans happy, who preferred home runs to shutouts).
The redefinition of WTI will specifically make historical stats NOT comparable, but unlike with baseball, that is going to be desirable. As will be an appearance of steady growth, the home run of oil.
Watcher, you’re being strangely rational today (or, at the moment). Should we be worried?
Making peace with our Maker. We’ll all be dead soon in the die-off.
Figured it would pass; I’m breathing MUCH easier now. 🙂
Oh don’t be too glib. Lowering the mound doesn’t kill people.
Claiming you got BTUs you don’t got will start wars.
Ron,
Just how much influence does a single EIA report actually have on the direction of oil markets? I find it difficult to believe that a single report from them which might be slightly over-optimistic, could start the market in London dropping as well as New York.
Your correct, a single report, that is the Weekly Petroleum Status Report could not have that much influence. However two other EIA monthly reports gave similar bullish assessments. They were thee Short Term Energy Outlook and the Drilling Productivity Report
Then to top those three EIA reports the IEA chimed in with an even more bullish report for oil, (but bearish for prices of course). The IEA Oil Market Report.
Global supply rose by 1.3 mb/d year-on-year to an estimated 94 mb/d in February, led by a 1.4 mb/d gain in non-OPEC. Declines in the US rig count have yet to dent North American output growth. Final December and preliminary 1Q15 data show higher-than-expected US crude supply, raising the 2015 North American outlook.
Got that, non-OPEC up by 1.4 million barrels per day in February and the declining rig count is yet to dent North American output growth. That was enough to drive prices in the dirt.
Hi Ron,
Several people, Art Berman, Steve Kopits, and Jeffrey Brown are expecting that oil prices should rebound by years end at minimum. I agree with that assessment.
Impossible to say with any confidence when prices will rise or by how much, but I still like $75/b or more before Sept 30, 2015.
Looks like my guess that oil had reached a bottom in Jan 2015 was not right, it looked good for a month and a half. It will be interesting to see if it breaks through $40/b, I doubt it, but some experts have mentioned $38/b. If we adjust the Dec 2008 bottom for inflation we get $33.65/b for the lowest price since 2003. There would be some serious resistance to oil prices less than $33/b.
In 2008 the bottom was about $30/b in nominal terms and the oil price closed below $35/b for only 4 trading days, by March 2009 the oil price was back to $45/b and by June it was up to $70/b.
Hard to say what will happen this time, but OPEC is predicting that demand will be robust, so we may see prices behave somewhat like 2009. Even without cuts by OPEC, the World economy is in much better shape in 2015, than it was in 2009, so oil demand should be higher.
For the current oil price decline, the monthly low (so far) for Brent was $48 in January. I don’t think that there’s any real chance that March will average below $48, since the average for the first half of March was in the high 50’s.
Monthly price data for six month after the $40 monthly Brent low during the 2008/2009 decline:
12/08: $40
1/09: $43
2/09: $43
3/09: $47
4/09: $50
5/09: $57
6/09: $69
Ron,
On the Permian page, there seems to be an extremely sharp upturn in the Permian’s productively, Around about 20% increase in a couple of months. Not sure if it because they are saying all the rigs that have shut down, contributed very little to production, or what? Maybe a little fudge factor to catch up on past errors?
Without that upturn, I believe their minor increase in production would be a negative number.
http://www.eia.gov/petroleum/drilling/pdf/dpr-full.pdf
Toolpush, that has to be an error in their chart. If you go here:
Drilling Productivity Report
Then click on: X Report data (aggregated by region)
That will download the Excel spreadsheet for all regions. Then you can go to the Permian page and get the data through April. Of course the last four months is just their guess as to what the Permian will produce but the data they do show shows a very sharp downturn in the last two months.
The data below is their predicted barrels per day. The chart below is the actual increase in barrels per day they are predicting.
Permian
Dec-14 1,845,634
Jan-15 1,888,536
Feb-15 1,929,450
Mar-15 1,960,259
Apr-15 1,981,512
Ron,
This was on productivity per well.
The top left chart. Brown line going from around 400 bpd per well to nearly 500 bpd per well?
http://www.eia.gov/petroleum/drilling/pdf/permian.pdf
Well there is no data to support that. In fact there is no data at all for April because April and in fact there is no data for March. Why they would make such a wild speculation is beyond me. But this is a prediction that is beyond reason. Productivity per well could not possibly change that fast.
Hi Ron,
It may be that if a lot fewer vertical wells are completed that productivity per rig will increase. The horizontal wells in the Permian are far more productive (on a per well basis) than the vertical wells.
The EIA may be accounting for the rising percentage of horizontal rigs which will increase the productivity per rig.
I agree that this change is unlikely to happen as quickly as shown in the DPR, which was your main point.
Hi toolpush,
I think you read the chart wrong, the rig productivity is on the left vertical axis and the rig count is on the right. The increase was from 202 b/d/rig in March to 240 b/d/rig in April.
This could easily be explained by the higher percentage of horizontal rigs now running in the Permian due to a lot of the vertical rigs being stacked there.
Dennis,
I stand corrected, and thanks for checking it out, but the change in slope is the stand out thing. What ever the numbers you are looking at approx 20% increase in productivity in one or two months.
It is either due to a heap of low productive vertical rigs being stacked, or a statistical error.
I believe we will just have to watch out for it next month, to see if there is any change? Though I believe this little uptick conveniently keeps the oil supply estimate in the positive side of the page. smiles
Hi Toolpush,
Yes it is a 20% increase either way, in the Bakken it seems that rig efficiency has been increasing and in the Permian the rigs are being stacked faster so the percentage of horizontal to vertical rigs has increased a lot. Currently about 71% of Permian rigs are horizontal rigs, at the rig high point it was about 62% horizontal rigs, so we have fewer vertical rigs which would tend to increase output per rig and in this price environment they may be focusing on sweet spots so that the wells that are fracked have a better chance at positive cash flow.
Hi Ron,
“Their algorithm just gave them some bum production numbers.”
That is because their algorithms don’t work any more. Not since the aggregate cost of oil production overtook our civilization’s ability to pay the full cost of that production. This occurred around June of 2014. The EIA seems to be as surprised as everyone else (except me). Here is how they put it:
Steep drops in the US rig count have been a key driver of the price rebound. Yet US supply so far shows precious little sign of slowing down. Quite to the contrary, it continues to defy expectations.
Meaning that production is just not falling fast enough to raise oil prices sufficiently enough to ensure continuing oil production. This is not a temporary condition. There is simply no way to fix the problem. We have experienced a paradigm shift.
The oil industry has begun shutting down.
The cost of production continues to rise. And we don’t seem to be getting richer. If the industry needs $100+ oil to maintain current production and bring on future production, then any price lower than $100 will result in the oil industry shrinking.
How could it be otherwise?
Coal industry has also started shutting down. And coal is the second source of energy for world economy. It will be fast now. Party’s over (Heinberg was 12 years early 🙂 ).
Hi Kam.
I did some research on the ETP model you pointed me to. It turns out that I haven’t been the only person to point out what the giant wedge pattern in the price of oil meant:
“Oil prices are plunging. According to my opinion (and it seems that your theory says so), this is because now we cannot afford a functioning economy at 100 USD per barrel of oil. From now on, any price collapse will lead to the destruction of supply; and a price hike will destroy the demand (And I think that as time passes by, the ceiling at which the demand will be destroyed will only go down). It seems that both factors (supply destruction and demand destruction) have met in the graph and we just hit a collision point…”
~ Observerbrb at peakoil.com
He even made a graph just like mine!
And here is the answer to his question from one of the originators of the ETP model:
“You’re right!”
~shortonoil
Wow. So my cute little independently arrived at theory has also occurred to many other people. Well, of course it did! It is so obvious, I think I could explain it to a 6 year old! But for some strange reason, I can’t seem to be able to explain it to anyone here, except for a select few.
I wonder why?
I thought that you were familiar with the ETP model, because you sounded like you are. If you figured it out by yourself, then congratulations! 🙂
Also look at this (link). This chart was first made long time ago (2 years?). This is the updated version. I don’t believe that you didn’t see this earlier 😛
http://www.economic-undertow.com/wp-content/uploads/2015/03/Triangle-of-Doom-030315-1024×689.png
Hi Kam.
I just found that “traingle of doom” chart the other day, when I was looking at the link you gave me to the ETP model, and I wanted to find out more. I looked around and ended up seeing the chart at a discussion at peakoil.com. It looks like charts I was making before 2013.
I have been expecting a collapse for quite a while, so I started watching the wedge form pretty early on. I began to develop the idea that there would be an oil spike when the lines crossed!!! Ha ha. I could probably find where I posted my big prediction for a spike in June 2014!!! Right timing, wrong direction.
I really had had the wrong idea about the cost of production. I thought that would be the impossible line to breach. But that doesn’t factor in heavy finance in the oil industry. The affordability line was the real problem. Of course, as soon as oil plummeted, I began to get a clearer idea of the dynamics. I started to get the idea that the price of oil would keep falling. At Thanksgiving at my moms house, I announced that the collapse of industrial civilization began in June of 2014. It was not a welcome topic. It is not welcome here, either.
The ETP model peaks in 2012. Check out this post:
http://peakoilbarrel.com/eia-confusion/comment-page-1/#comment-504805
When seen relative to interest rates, 2012 is the highest price oil ever reached (higher than 2008)! The chart “squeeled” (non-linear dynamics) at the peak. The whole thing fits together.
And that makes this next post really interesting:
http://peakoilbarrel.com/eia-confusion/comment-page-1/#comment-504784
It shows how the FED used QEx and operation twist to extend the wedge by raising the affordability line. Especially twist in 2012. Stick save.
Anyway, thanks for the link, Kam. It really helped me bring the whole thing into sharper focus in my mind. I understand collapse much better now.
I have been debating certain people on the site, and they really don’t get it, or they are really pretending hard not to get it. I think I am explaining it pretty well, but…
…Anyway, check out the debate or better yet join it. I could sure use some help.
Ron, Is it possible the EIA is intentionally trying to push oil prices down for political reasons?
If there has been any intentional push to be overly optimistic, hasn’t it been from the oil industry itself? The whole “energy independence” thing.
So if the net result would also drive down oil prices, wouldn’t the industry, rather than government, be the one to blame?
A little bit of data reconciliation here:
the mazamascience.com/oilexport link puts it all on one graph by country/region and is based on BP’s data. They also have a button to flip from tonnes to barrels. My personal fave.
This from BP:
Oil production data includes crude oil, tight oil, oil sands and NGLs (the liquid content of natural gas where this is recovered separately). Excludes liquid fuels from other sources such as biomass and derivatives of coal and natural gas.
World oil production tables are in both thousand barrels daily and million tonnes.
There is no mention of condensate in that. It could be called NGL, one supposes. So it’s not a pure crude measure. We can’t be happy about that, but it IS all on one graph (with consumption). Further, three cheers for BP, they adjust for leap years to get the extra day out for annual quotes.
So their graph for China consumption is pointing at 11+ mbpd. That includes all of the above.
This from China’s official org:
China’s implied oil demand will grow 3 percent this year versus last year, the country’s top energy group forecast, little changed from the pace of growth in 2014 as calculated by Reuters.
State-owned China National Petroleum Corporation (CNPC) saw the nation’s oil demand rising to 10.68 million barrels per day (bpd) in 2015, some 310,000 bpd higher than last year.
The forecast, in an annual report released by CNPC’s research institute on Wednesday, also put the country’s net crude imports up 5.4 percent at 6.49 million bpd for this year.
China, the world’s second-largest oil consumer, raised crude imports by nearly 10 percent last year, or an additional 530,000 bpd, largely to boost government and commercial reserves as oil companies took advantage of the more than 50 percent fall in global benchmark prices from mid-June.
The CNPC forecast was higher than a recent report by the International Energy Agency (IEA) that put China’s oil demand growth for 2015 at 2.5 percent, down from 2.7 percent last year.
No sign of reduced Chinese consumption.
I’m looking ahead to tomorrows FOMC announcement at 2:00-2:30pm ish. If Fed comes off hawkish i think we will see oil below $40 very soon if their statement is dovish we get a price rebound though it might be a short lived one. I also think if they come out hawkish the dollar will initially strengthen but when stocks roll over and bonds yields start collapsing towards zero they are going to drag the dollar down with it. Which in itself might support oil prices at least in some small manner.
http://finance.yahoo.com/news/china–carmakers-overcharging–selling-defective-products-175034116.html
This is mostly a vid. The audio content and the text has no value. It’s Yahoo talking heads pretending they know something. Turn the audio off.
Rather watch the video. The imagery. LOOK AT THOSE CHINESE TRAFFIC JAMS, on open highways. About the 2:00 mark.
Beyond cars issues. A lot of the stuff manufactured in China eventually will be replaced by 3D printers. Combine that with China’s move to De-dollarize. Setting up a alternative to SWIFT and selling US bonds. How will they be able to keep their currency pegged to the dollar? Which is what keeps those Chinese factories humming. In the long run how will they continue to keep hundreds of millions of people working?
I don’t think you embrace the theme of this blog.
If the oil isn’t there, people go to war and die. It doesn’t matter who prints what piece of paper, you can’t print oil and you can’t feed 7 billion without oil.
Scarcity begets tanker seizure. Japan can’t survive if the tankers going to Tokyo go to Shanghai, and outbidding doesn’t matter if China HAS to have that oil.
I totally embrace the theme of this blog. But before scarcity sets in and nations start taking other nations oil supply by force. Some economic tremors will be felt which will lead nations to use force to secure oil supplies. Economic hardship is a prerequisite. We will actual need more than economic tremors. We will need some economic earthquakes. Before bombs and bullets start flying. I don’t think nations will attack each other the minute oil starts get scarce. It wont be until their economies can’t function properly anymore and respective governments see no other alternative. It will be when growth ceases to exist and economies can do nothing but contract. Chinese tankers can very well be seized themselves. China doesn’t own the seas.
Pretty much.
Watcher if you thought that one was bad. take a look at this one
http://www.bbc.com/autos/story/20150317-how-smart-traffic-signals-may-ease-your-commute
In 1953 there was one well in the Bakken.
In 1988, there were finally 99 wells.
In 2009, the number of wells in the Bakken Formation then reached 1000 plus wells.
In 2015, there is a Bakken/Three Forks well count of 9052.
Nine thousand times more wells in a 62 years.
It is entirely possible to shut them all down and forget about the oil, but I wouldn’t stand on one leg or hold my breath.
The place where Congress gets the job done.
Re systemic data issues. ZH just splashed one of their strong points, noticing inconsistency. There may be an explanation for it, but whoever is going to make it better start cracking:
http://www.zerohedge.com/news/2015-03-17/something-strange-going-nonfarm-payrolls
Gist is this morning’s Housing Starts number was down sharply for February. But the February Non Farm Payrolls number showed a sharp increase in residential construction employment. Naturally, any time there is bad data this time of year it is attributed to winter. But it’s winter for hiring too, and it didn’t show there.
My opinion is the NFP measurement is taken the 3rd week of months. I suspect things have been done to take advantage of that knowledge.
What’s “soon”?
Best you not know.
Watcher – we had a small back and forth a short time ago, in which I think (do not shoot me if I am wrong) your biggest complaint about today’s economics was lack of transparency. This article seems to show what I believe. Do not look for transparency, because you will never find it. People/institutions can put forth as much data and/or reasoning as anyone could possible want, but in the end it is not transparent. You just have to look at the information and decide for yourself if it is reasonable and what it means.
I am big on analogies (in case no one noticed). Everyone watches a football game and sees what they perceive to be a stupid play call. The sportswriters cannot wait to ask the coach about it. He gives some reasoned answer. Pointless. He went brain dead at the time, but he will never give that as the reason.
So, I look at what the Fed does, and try to figure out why I think that they did what they did. I never accept their reasoning at face value. Same with about most things. I read the WSJ every day for 45 years, not necessarily to gain information, but rather trying to figure out if I agreed or not with whatever point someone was trying to make.
With respect to investing, about the only time you can make a lot of money is when almost everyone else is wrong, but you are right. Generally, pretty hard to do.
With respect to investing, about the only time you can make a lot of money is when almost everyone else is wrong, but you are right.
If oil was the engine of all things (and it was) throughout your investing personal database, then being right was just betting on an index and letting increased BTUs assert themselves and eventually appear in macro economics. This was why “a problem delayed is a problem solved” worked pre 2008. Oil’s derived growth would fix everything if you just could buy time.
That’s all gone away and it’s never coming back.
That sentence cannot be uttered or embraced, so money will be printed to extend and pretend and buy time for the mechanism that no longer works.
How do you guys think about the current meme that the nuclear deal with Iran (maybe even by month end) is going to result in extra 800k to 1M bpd coming to market soon? That is the reason being given for price declines.
That stuff hits the rumor mill every time an Iranian deadline approaches.
Bit off Topic for Hydrocarbons. but, another reason to be prepared.
Of all our infrastructure, the electrical power grid is the most fragile. In the 2013 Infrastructure Report Card, prepared by the American Society of Civil Engineers, Energy received a grade of D.
http://www.survivopedia.com/the-power-grid-could-collapse/
Competition in Li Pak’s are getting interesting.. Capacity and features evolving every few months.
Take any ratings with a grain of salt. There are no test standards. Would love to see reviews.
http://www.amazon.com/600A-Peak-Current-Discharging-Ultra-bright-smartphones-USB-charged/dp/B00QC7EVG4/ref=sr_1_3?s=electronics&ie=UTF8&qid=1426618910&sr=1-3&keywords=LI+jump+starter
http://www.manufacturing.net/news/2015/03/when-oil-prices-are-down-worker-deaths-are-up-in-the-bakken
“Low oil prices and subsequent cutbacks in the field by drilling companies could be contributing to a rash of worker fatalities in North Dakota, according to a report in the Wall Street Journal.
The state saw eight oilfield employee deaths since October, a five-month total than exceeded the number for the previous 12-month span. October also coincided with the beginning of a decline in the number of oil rigs operating in the state.
”
For those with access to WSJ:
http://www.wsj.com/articles/oil-deaths-rise-as-bakken-boom-fades-1426187062
And in the same issue of manufacturing.net:
http://www.manufacturing.net/news/2015/03/dow-signs-on-to-develop-massive-wind-farm
“…The wind farm, to be complete in first quarter 2016, will span nearly 35,000 acres, and will supply Dow’s Freeport Texas Manufacturing facility with 200 MW of wind power …”
Centralized power generation and distribution is going to be replaced as soon as it can be.
You Don't Need An Energy Company When You Can Buy Power From Your Friends
A couple of articles which will affect the oil price
Iran Can Add Million Barrels a Day of Oil If Sanctions Halt
http://www.bloomberg.com/news/articles/2015-03-16/iran-can-add-million-barrels-a-day-of-oil-if-sanctions-are-ended
“If sanctions are lifted, we can raise our exports by one million barrels per day within a few months,” Oil Minister Bijan Namdar Zanganeh said Monday in Assaluyeh, Iran. The Persian Gulf nation shipped 1.2 million barrels a day last month, the International Energy Agency said in a March 13 report.
Oil hit by stockpile fears; dollar offsets some loss
http://www.reuters.com/article/2015/03/17/us-markets-oil-idUSKBN0MC1TC20150317
Industry group American Petroleum Institute (API) said after the market’s settlement that crude stockpiles rose by 10.5 million barrels in the week to March 13, far ahead of the 3.8 million forecast by analysts polled by Reuters. If correct, the API number would lift total U.S. inventories to 450 million barrels.
$42.xx following the report, which is post US close pre Asia open. Some futures trading still goes on.
Of more concern, for the 2nd time this week I have seen “22 Trillion in oil derivatives”. No idea where that’s coming from. That’s a lot of HY paper swaps plus options, one supposes. It spells Apocalypse, actually.
Found this on chron.com, along with a few other stories about the shale slowdown:
http://fuelfix.com/blog/2015/03/17/oil-production-falling-in-three-big-shale-plays-eia-says/
I’m behind on reading the comments on some of the other posts. So I don’t know if this has already been posted.
Watch Four Years of Oil Drilling Collapse in Seconds
Fantastic, You can filter by play. wish you could filter horizontal and they had one for NG. Hope it’s updated for all of 2015.
Okay. What is the rationale here?
I’m seeing talk that at these price levels some number of wells will get fracked that is a lower number than used to get fracked.
Why? Why are these wells going to get fracked at these price levels and who is going to pay for them post March 31 when revaluation occurs? I thought the plan was allegedly to frack nothing until you got a better price. So . . . who is going to pay for it, and why do it if you’re not getting enough price and are oh so very sure you’re going to get better price upcoming aka soon? Is this all about paying your people? Are the lenders interested in paying your people, or getting their money back?
Oh, and the big guys buying the small guys theory . . . how does that work at a wellhead price of $25? The for-sale company has $XXXX in revalued assets and $YYYYYYYYYYYYYYY in debt. Who buys that company? Someone should be paying someone to take that company, not the reverse. So . . . maybe the for-sale company says psssssst, maybe I’ll just sell you the assets so I can have cash to keep the doors open. Well, didn’t the lenders have those assets as collateral? Can we spell fraud?
If the price stays in this ballpark for a while (and note it was around this price for FIVE SOLID YEARS 2000-2005 (which btw was in this century, not last one) all of this is going to disintegrate.
As for who thinks it’s going higher, which expert says this or that, let’s make this a pure experience. Show me that expert taking out extra mortgages on his house and levering up his 401K to make the bet on higher soon. If he ain’t betting, then he’s indulging in fantasy.
hmm never saw that before Ron. “You do not have permission to edit that comment.” The edit button is there. That’s the message that appears. Plenty of time left.
Try it now. I have changed the time to 2 hours. Otherwise I don’t know what the problem is.
It’s not the time.
I clicked edit just now and a window appeared saying “comment loaded successfully”, but it’s empty, there’s nothing there to edit.
Maybe it will fix itself. Give it overnight.
It is a glitch that happens every once in a while. Just hit the X, and then hit the edit button again. That works for me.
New and improved! Now an hour+! ^u’
Who thinks it is going higher?
Well, just looking at the numbers “somebody” does. To my knowledge, importers of oil do not have long term contracts obligating them to buy oil and import it. So in less than a year, oil inventories are up in the US by 100 million barrels, over 9 million more last week per this mornings EIA report. We have consistently been importing over 1 million bbls/day more than we need and putting it into storage. Imported oil is probably closer to Brent in cost. So let’s guess that somebody has put 100 million barrels into storage at an average cost of $55/bbl. That cost somebody $5.5 billion plus monthly storage fees, plus cost of money. I doubt that whoever “somebody” is, is looking for an opportunity to sell it all for $40 and lose close to $2 billion on all in costs. So, if not, then they must think that they will make money at some reasonable time in the future.
This is also somewhat puzzling to me. I know that the majors have access to that kind of money, but after not seeing US oil imports back off one bit since the plunge started, I have concluded that it is above my pay grade to try to figure it out.
Current oil future curve is in contango, which means future price is higher than spot price. If the spread between spot and future prices is large enough to cover the storage costs, many people will try to take advantage of that “free” money by buying the oil at spot price, putting them into storage and then shorting the oil future 3 or 6 months out, which enables them to fix the selling price in the future.
Many people are doing this kind of arbitrage right now. Some are even leasing the whole oil tanker as the storage and that is why the tanker rate has been skyrocketing.
Desperate measures and a product of the optimism bias in all humans.
It has nothing to do with biases but everything to do with making risk-free profits. The arbitragers may not have a view as of where the oil price will be in 3 or 6 months time. They simply make money from the spread.
I would do the same if I have the resources.
that’s exactly what it is.
rgds
WP
Watcher, properties will be purchased by those who have a price forecast high enough to deliver a solid risk weighed return. The evaluation is fairly straightforward. We look at the cash flow from existing wells, perform an estimate for wells being drilled, but consider delaying the completion until prices increase. We also look at undrilled well locations and prepare an estimate for those as well. If it’s an outright company purchase we have to look at other topics, for example environental liabilities, pending lawsuits, and labor issues.
I can’t go beyond this basic outline. But I assume you do realize there are plenty of players who have very large amounts of cash to buy. If the sales don’t go through is because the seller has a really inflated view of what the property is worth. Or is one of those ego driven types who wants to be an oil tycoon and just doesn’t want to sell. I ran into one not too long ago. He didn’t want to discuss business, was mostly interested in discussing politics, so the sale fell through. I bet right now he’s a bit shook up.
Investors in US shale oil junk bonds take yet another bath:
http://www.bloomberg.com/news/articles/2015-03-17/energy-junk-bond-revival-cut-short-as-7-billion-lost-in-10-days
”’Oil prices have fallen more than 15 percent since March 4 to a six-year low of $43.5, wiping out $7 billion of market value of high-yield debt issued by energy companies. Prices on $1.45 billion of notes sold less than two weeks ago by Energy XXI Ltd., an oil producer that was being squeezed by its lenders, have fallen by as much as 10 percent. Comstock Resources Inc.’s $700 million of securities have declined by more than 7 percent since March 6.
The latest slump in crude is rekindling concern that oil companies will struggle to service the $120 billion of high-yield, high-risk debt they took on in the past three years amid the U.S. shale boom. That’s a sharp reversal from February when yield-starved bond investors were loading up on the debt again, pushing down borrowing costs to a two-month low. ”’
Yalza!
“I find it curious that anybody would chose a peak oil blog to tout the merits of shale oil, or shale gas, particularly now, when it has its pants down around its knees, its hands overs its privates, but so be it…
The real oil and gas business… is very difficult at the moment; we are all working 24/7, confused about the direction of prices, and having to watch every penny we spend, right down to washing poka dot gloves every evening to wear them again the next day… I have had 50 good men ask me for work the past 3 weeks, all coming out of the stinking shale business, with little hope for the future…
As you can clearly (lol) tell, I am not a fan of the stinking shale business… I think [it] …has mismanaged my countries limited hydrocarbon resources in a very bad way. It took advantage of cheap money, little risk, absolutely no regard for conservation practices, and drilled itself into a 9 line bind, in my learned opinion. It lied to the American public, misled its work force, borrowed money it cannot pay back and helped drive the price of both oil and natural gas down to levels that will ultimately hurt, not help Americans. Now its all unraveling…
Dickheads in the Bakken and Eagle Ford want to export condensate to stay on their drilling hamster wheels; how does selling American resources, cheap, to buy them back tomorrow, from people that hate our guts and want to kill us, help America? It doesn’t. It is stupid…
I am reminded of numerous times in the history of oil and gas in the United States where an unregulated industry drilled itself literally into oblivion… More recently, the shale gas industry imploded from over drilling and the corresponding collapse of gas prices. My industry cannot seem to keep from making the same mistakes again, over and over. It gets caught up in it own bullshit far too often…
I have to lay off a couple of kids today that have been with me for 5 years, one just got married…
Is shale oil extraction a resounding success story in America, a benchmark for free-market enterprise? Bullshit. The debt those guys has accumulated would choke a big horse; its begged, borrowed and essentially stole money from grandma’s all around the county that bought their stock based on propaganda. It has not made a dime of profit yet. The wealth of retired people who invested in the shale oil business, even people that didn’t, is now being decimated because of the shale oil industry. Every stinking shale well drilled uses sufficient fresh water for 168,000 humans to consume in one day and nearly 400 tons of steel. The crop and ranch land that is lost to shale well pads and roads is heart wrenching. All that for a couple of months of $ 2.00 gasoline?…
The shale oil industry shot itself in the foot. Along the way it shot me, and thousands of other operators in America, in the back. It is helping to facilitate a train wreck around the world, actually. I have been to West Africa, the ME, all over S. America, everywhere in the world there is oil production and I am telling you straight away, there are now lots of very, very afraid people out there in the world. Hungry, thirsty, sick people whose countries cannot help them any longer. Why? In part because of stinkin’ shale oil industry greed. I am mad at them sumbitches this morning…
I gotta go let some good kids go. Damn, I hate that…
The shale oil industry will not survive 50 dollar oil …Now oil prices are low, and getting lower, and the money tree is going to fall over. Anybody promoting the shale oil industry at this point must be getting paid to do so.…”
~ Mike @ The POB
——
“So long story short don’t believe all the negative people saying you should go home now because there are still plenty of jobs around you can get in the Bakken and be making six figures in no time.” ~ dn_girl
“We had a proud young woman post yesterday about her… optimism about… future in the oilfields of North Dakota. It is a powerful message that we should have all embraced…
She probably won’t be back…” ~ Mike“Things are getting tough out here in the oilfield right now, its time for me to get tougher… But this is going to be my last post for awhile.” [January 10, 2015 at 12:41 pm] ~ Mike
“Mike,
I hope my comments didn’t tick you off and that’s the reason your going to cut back on posting… If I did say something that ticked you off, I am sorry.” ~ TechGuy
I said I wasn’t going to post awhile, and am still going to limit my posts because I really need to focus on much more important things than the internet, no offense to Ron’s blog, which I appreciate very much.
Assuming the young lady from ND is real, which we know is always an issue on the net, I do not understand attacking her. It is like attacking the soldiers in Iraq because you don’t like the lies that caused them to be there.
Living in a place like ND is not easy. Working outdoors in the winter there is not easy. Working in the oilfield is not easy. I do not understand why there would be lack of respect for people who have little to nothing, who move up there to bust their butt to make a living.
While I’m here, I know us small producers are upset with shale overproduction. However, I think the real culprit is our unregulated financial system. No good reason for oil to have hit $147 in 2008, which contributed to crashing the economy and putting millions out of work. Now, no good reason for oil to fall below $40, which means $20-30 at the well. It is so far below the cost of developing new production, its almost a joke. It is also below the cost of most US production too, when you figure in all the costs. Add in the bubble financing, and here we are.
If you are going to attack people, at least try to focus on those who are responsible for this shale mess, not people who are trying to avoid the destruction hitting our middle class by going to work a thousand miles from home in the elements to make a buck.
Hi shallow sand,
Good to see you again.
Since you dropped by, I would like to ask you a question, if you have time.
How much do you know about the Petroleum Price Curve and the ETP model?
You’re getting close on the ‘unregulated financial system’ part.
At the heart of it all, there is no financial system, it fell down years ago.
What is there is but a vestige of what it really once was, it is now a shriveled carcass. Probably by design and plan, but that will probably never be known and remains to be seen.
Still, somehow, it all trudges on through the dreaded drudgery.
Not for much longer, I think.
“It is like attacking the soldiers in Iraq because you don’t like the lies that caused them to be there.” ~ shallow sand
Which is precisely why you need to short circuit those lies bloody fast, shallow sand, and sometimes tell the kids what they don’t want to hear. My kid would not be on here like that, singing the praises of ND, etc., nor part of the bombing the tar out of Iraq, that’s for sure.
We don’t like our children very much, nor ourselves, nor our planet, nor the creatures on it.
If you are in this industry– one of the reprehensible attacks on the aforementioned– your shallow sand seems to be turning to quicksand. I hope so. May your work sink hard and fast along with it.
And this is spot on topic too. If low prices hurt the fracking, etc., industries, you have my ‘opinion piece’ right here.
Oh, and ironically, as if you hadn’t noticed, Mike is, in a sense, with me all the way on this and makes many of my points for me. Have you read it?
And if dn_girl is real, save her and girls and boys like her! Risk pissing them off about their attitudes and choices if you don’t agree with them.
If an arm is gangrenous, sometimes you have to hack it off, possibly to the protest of someone you love. I love my planet and some industries need to be hacked off fast.
By the way, Mike may not realize it, may be grappling with it, but he is perched on the precipice of anarchy:
He clearly despises his industry, but it is merely a manifestation of the larger crony-capitalist plutarchy; the violence-based governance structure; the parable of the violent tribe gone large-scale, overcomplex, global, amok.
Push him off!
“…all forms of organization, regardless of how democratic they may be at the start, will eventually and inevitably develop oligarchic tendencies, thus making true democracy practically and theoretically impossible, especially in large groups and complex organizations. The relative structural fluidity in a small-scale democracy succumbs to ‘social viscosity’ in a large-scale organization. [Accordingly] …democracy and large-scale organization are incompatible.” ~ Wikipedia
Nicely said, Shallow. I have always subscribed to the theory that most folks are doing the best that they can with what they have. The villians are the manipulators of finance and people who do so for their own gain, not the workers who have limited opportunities and influence.
regards
“I do not understand attacking her.”
Try thinking in terms of a hopeless misogynistic psychotic.
Then you’ll understand.
Way to go, Father John B.
Show us how it’s done. Give your ‘hopeless misogynistic psychotics’ a few pointers. ‘u^
“The shale oil industry shot itself in the foot. Along the way it shot me, and thousands of other operators in America, in the back. It is helping to facilitate a train wreck around the world, actually…
I gotta go let some good kids go. Damn, I hate that…
Anybody promoting the shale oil industry at this point must be getting paid to do so…”
~ Mike @ The POB
——
“So long story short don’t believe all the negative people saying you should go home now because there are still plenty of jobs around you can get in the Bakken and be making six figures in no time.” ~ dn_girl
“We had a proud young woman post yesterday about her… optimism about… future in the oilfields of North Dakota. It is a powerful message that we should have all embraced…
She probably won’t be back…” ~ Mike“The culture as a whole and most of its members are insane.” ~ Derrick Jensen
People, I call upon you today to embrace that powerful message… Because, well, assuming it is, it is a message that appears like it came from a female… and one must always embrace and never be cheeky or sarcastic with a message that might come from a female. Good god no, because then… then that is just plain attacking… and misogynistic, no if and or buts about it. And will land you in hell. Or you will become blind if you do it too much. ^u^
BTW, John B, I get along very well with women (and men and even those in-between); the willfully-ignorant ones, less so. It’s not about gender, but about deliberate stupidity.
(Another fine on-the-fly comment crafted with the Patterson Press™ Comment Editor)
Maybe it’s about gender identification, and envy?
John B,
“Homosexuals are hardly better than criminals and ought to be severely punished.”
1) Disagree Strongly
2) Disagree Mostly
3) Disagree Somewhat
4) Agree Somewhat
5) Agree Mostly
6) Agree Strongly
Very well said. Those working in the oil industry are not the ones to blame. They are just earning their livings by honest work. The biggest culprit, in my view, is the Fed, whose QEs and ZIRP encourage over risk-taking, which helped fuel the frenzy in the shale business.
If the FED had not done what they did, with ZIRP, NIRP, endless QE’s, and operation twist, we would all be dead already.
So, unfortunately, the FED is not the culprit, either. We all are. The FED was just giving us what we wanted.
And since June of 2014, the FED has pretty much lost all of it’s effectiveness. They are out of ammo. Physics is in charge now.
Hey Caelan.
+100
I didn’t mean to seem harsh on your style earlier (referencing the chicken and the dn_girl). And I obviously spoke *WAY* too soon. Forgive me. Now I think I understand. I had no idea you were building up to this! Your post above is an absolute work of art. The three posts together now form a kind of tryptic masterpiece.
And I do now think you may have uncovered something profoundly important, in terms of elephants in rooms. Bravo.
By the way, what did you make of my “The Mask of the Red Death” allegory post?
http://peakoilbarrel.com/opec-crude-plus-more-on-eia-estimates/comment-page-1/#comment-504992
Who is Prince Prospero? Who is The Red Death? 😉
It’s ‘laughable’ and kind of curious, the hypocrisy and fairly misplaced self-righteous net-nannyism of some.
I think it had less to do with this dn_girl and more that I stepped on Mike’s tail, maybe a few others’; the wish of $110 oil. I mean, what if you lost ~50% of the value of something overnight? Well that’s what happened of course. (Many in certain situations might well come to this blog for insights and answers; some in less than the best of moods and frames of mind– and as time goes on. I think we should reflect on this.. This is the time of peak oil; of the decline of global industrial civilization. A New Era. How often do new eras occur? In the middle of single lifetimes?)
I hear many men, especially, more than women, if we want to talk sex, are prone to greater difficulty when it comes to work issues. Like, work is ‘everything’ to some of them.
The thought did occur that if dn_girl is/was not a ‘writeup’, then maybe she is related to someone on here, even Mike, himself. In which case she might as well be a writeup.
I mean, aside from the vitriol he laid down about his own industry, he did seem desperate in some of his comments. ‘Stabbed me in the back’?…
If your business is literally hemorrhaging, would you want to, somewhat less mindfully even, given your state, attempt to drum up business in any way you can? I would.
In any case, if Mike read some of my comments, he might have got a sense that I am against wage-slavery (‘the jobemployee’) and against certain forms of industry (like Mike’s), against hierarchy (‘boss/employee’) and my comments with the girl, of course, making fun of company-ownership (Mike has one?). So I think it was less about the girl and simply that, over time, Mike’s head was pumped and pumped by his work and my commentary until it exploded.
Everything But The Girl (for Mike)
“By the way, what did you make of my “The Mask of the Red Death” allegory post?” ~ Futilitist
Oh ya, that one. And you think my chicken was over the top?! ‘u^
In these Times of Twitter Texts, it is a long read, but I do like Poe who died way to young for my taste.
I am heading out but will grab a nice warm tea and read it over candlelight later tonight. Maybe prop my laptop half on the closed toilet seat and half on the bathtub edge and read it and its original reference in the bath after Russia Today.
до свидания
For today’s traffic report, I-5 and I-95 will be packed. I-80 will have truck traffic from coast to coast. I-10 will be filled with cars and trucks for hundreds of miles.
I-25 will be plastered with cars and trucks from Fort Collins to Denver all day long, I-35 will have trucks and cars from Minneapolis to Kansas City.
A 100 percent guarantee. No collapse yet.
Some guitar music from way back:
https://www.youtube.com/watch?v=PYlG7qb3iCs
MARCH 11, 2015 AT 6:11 PM —- WTIC $48.37
“I think the price of oil might be reverting back to the long term downtrend”
~Futilitist
MARCH 18, 2015 AT 7:13 AM —- WTIC $42.37
“The price of oil has reverted back to the long term downtrend.”
~Futilitist
Wow. Volatility spikes. Two big ones each lasting only about a minute.
Range: $42.11 – $42.96
Current WTIC spot $42.20
Here is an even bigger move. Two dollars in ten minutes. Good thing it was up, not down.
”Souring sentiment poses a challenge for energy companies still in need of cash because banks may deny them the ability to draw additional funds from their credit lines, according to Kevin Smith, an energy analyst at Raymond James & Associates Inc.
Banks typically gauge a company’s borrowing base by valuing its assets twice a year. The collapse in oil prices since June means these credit limits could be cut by as much as 30 percent in some cases, according to Smith.
Some of those issuers may find themselves without another way to raise money now that the junk-bond market has turned.”
http://www.bloomberg.com/news/articles/2015-03-17/energy-junk-bond-revival-cut-short-as-7-billion-lost-in-10-days
”The oil and gas industry’s $2.5 trillion of debt may compound the drop in crude prices, as companies maximize output to meet their financial obligations, according to the Bank for International Settlements.
Debts owed by energy firms have more than doubled since 2006, the Basel, Switzerland-based institution said in a report on Wednesday, following similar comments last month. The need to repay those loans may keep global markets oversupplied by spurring companies to produce as much oil as possible and sell futures contracts that protect against slumping prices.
—
The price slump has caused a “significant decline” in the value of assets used by energy firms to back this debt, increased financing costs and raised the risk of default, according to the report.”
http://www.bloomberg.com/news/articles/2015-03-18/oil-firms-rising-debts-add-downward-price-pressure-in-bis-view
2.5 Trillion, eh. People just don’t realize what this means.
There are ways to address it, but all the ways destroy any appearance of monetary integrity.
You could do something like this .. . . “the revaluation of these assets to current oil prices is in the best interests of no one, so it will be postponed indefinitely”. (This is what was done March 2009 with US real estate (“assessing the value of these assets on bank balance sheets to be marked-to-market is in the best interests of no one. Therefore banks will not be required to value them at a price that they would bring on the market today. Rather, they will be permitted to value them at a price best judgment says they would be priced in more normal times.”) — sometimes called “marked-to-fantasy”) Incidentally, that rule was never put back to mark-to-market. It’s still like this.
The Fed could announce that it will not permit wide scale defaults of high yield debt. They probably would not even have to ever buy any of it. They could just make that announcement and people would be delighted to lend money to any mom and pop oil company, because they can never lose that money. So drilling and fracking could go on with the knowledge that the wells drilling costs are zero. The price will fall even further, but only KSA and Russia would care.
With respect to loan portfolios, it never was mark-to-market. Ever. Being a retired CPA, I sent them a comment that it never should be mark-to-market. For example, after being turned down by 32 banks a chef finally gets a $2 million loan to open a new restaurant. One year later it is ready to open and he has spent the $2 million. So no sales, no revenue, just high hopes. What is the mark-to-market value of the loan? Probably pretty close to zero if “the market” is the other 32 banks in the area that turned down the loan in the first place. It would take banks 6 months after the end of each quarter to even attempt to find out what the market is for the loans. Even a loan to General Electric – the loan document would be 500 pages long. Any independent person trying to put a market value on it would probably have to spend $10,000 of legal fees just to understand the terms of the agreement and then pass that information on to a knowledgeable appraiser.
The restaurant would have commercially zoned dirt under it. That is not zero value.
The FASB did what they did. There’s no denying the change in Marchish 2009.
Restaurants are usually on a ground lease. FACT: Loan portfolios of banks have NEVER been subject to mark-to-market in the history of accounting.
A number of the prop trading portfolios of banks most certainly are mark to market.
A portfolio can be classified as “held for sale” (mark to market) or “held to maturity” (in which case you don’t have to mark it daily).
Under Volker the prohibition on proprietary trading “does not apply to the purchase or sale by a banking entity of a financial instrument that is:”
(1) An obligation of, or issued or guaranteed by, the United States;
(2) An obligation, participation, or other instrument of, or issued or guaranteed by, an agency of the United States, the Government National Mortgage Association, the Federal National Mortgage Association, the Federal Home Loan Mortgage Corporation, a Federal Home Loan Bank, the Federal Agricultural Mortgage Corporation or a Farm Credit System institution chartered under and subject to the provisions of the Farm Credit Act of 1971 (12 U.S.C. 2001 et seq.);
As de facto all mortgage trading is done through trading in Fannie/Freddie securities they are not subject to HTM.
Rgds
WP
Hmmm. I suspect clueless isn’t clueless. He’s using the right words.
I suspect the issue here is the bank portfolios of MBS were chock full of Fannie and Freddie paper and thus, as you just said, were subject to priced for sale. This might not be where clueless’ experience was. He probably dealt with traditional loans from banks, not ownership of securities backed by mortgages.
clueless? Does this work?
Relevant excerpts from the mark to market wiki. If you want to see it all, scroll to the Effect on subprime crisis and Emergency Economic Stabilization Act of 2008 para:
Former Federal Deposit Insurance Corporation Chair William Isaac placed much of the blame for the subprime mortgage crisis on the Securities and Exchange Commission and its fair-value accounting rules, especially the requirement for banks to mark their assets to market, particularly mortgage-backed securities.[16] A review found little evidence that fair-value accounting had caused or exacerbated the crisis.
The debate occurs because this accounting rule requires companies to adjust the value of marketable securities (such as the mortgage-backed securities (MBS)) to their market value. The intent of the standard is to help investors understand the value of these assets at a specific time, rather than just their historical purchase price.
For some institutions, this also triggered a margin call, such that lenders that had provided the funds using the MBS as collateral had contractual rights to get their money back.[18] This resulted in further forced sales of MBS and emergency efforts to obtain cash (liquidity) to pay off the margin call. Markdowns may also reduce the value of bank regulatory capital, requiring additional capital raising and creating uncertainty regarding the health of the bank.[19]
The key events:
On December 30, 2008, the SEC issued its report under Sec. 133 and decided not to suspend mark-to-market accounting.[24]
On March 16, 2009, FASB proposed allowing companies to use more leeway in valuing their assets under “mark-to-market” accounting. On April 2, 2009, after a 15-day public comment period and a contentious testimony before the U.S. House Financial Services subcommittee, FASB eased the mark-to-market rules through the release of three FASB Staff Positions (FSPs).[25] Financial institutions are still required by the rules to mark transactions to market prices but more so in a steady market and less so when the market is inactive. To proponents of the rules, this eliminates the unnecessary “positive feedback loop” that can result in a weakened economy.[26]
On April 9, 2009, FASB issued an official update to FAS 157[27] that eases the mark-to-market rules when the market is unsteady or inactive. Early adopters were allowed to apply the ruling as of March 15, 2009, and the rest as of June 15, 2009. It was anticipated that these changes could significantly increase banks’ statements of earnings and allow them to defer reporting losses.[28] The changes, however, affected accounting standards applicable to a broad range of derivatives, not just banks holding mortgage-backed securities.
Note the weasel words “when the market is inactive” was all to camouflage the absence of market activity not because of idle disinterest in the instruments, but because of complete opacity as to the content of the MBS entities. The holders dared not reveal the content lest they expose the number of mortgages not being serviced by homeowners. There was no trading, the market was inactive, because buyers were not going to touch that stuff sight unseen, and distrusted the accounting valuation. It was not an “inactive market” because of disinterest.
Re: oil, this is a mechanism that can be revisited for government bailout, somewhat. The SEC determines valuation standards for reserves. Suspend the requirement for balance sheets to reflect current oil price and presto, money from thin air, again.
Correct. I was talking about debt owed to the bank in the form of a loan.
If you deposit $1 million cash in the bank, the bank has a liability of $1 million and an asset of $1 million – cash. If they loan the $1 million to an oil company, they still have a $1 million asset – the loan. If instead, they invest the $ 1 million in marketable securities, they also still have a $1 million asset – the marketable securities. The loan does not have to be marked-to-market. The marketable securities usually are .
All bank loans have a “reserve for bad debts” associated with them. There was an IRS case years ago – maybe in the 1930’s, when a corporations’ reserve for loan losses was tax deductible – I think it might be The Black Motor Car case. At any rate, the court approved a formula for computing a deductible loan loss reserve for tax purposes. The end result was that for the most part it was also used for GAAP. Essentially, and in general, there are specific reserves for known losses, plus a % reserve for loans that are delinquent (based upon prior history) plus a smaller % of all other loans in anticipation of some of them also eventually going bad. The % might be small, but basically if the bank loaned Warren Buffett the $1 million, there would be a small reserve for loss set up (sometimes such reserves are needed and then some. Remember Bernie Madoff and the richest billionaire in Brazil that just went bankrupt.)
Nod, I kinda figured you understood.
It gets bizarre when the marketable securities are packages of loans.
But . . . oil . . . this is a way to do a gov’t bailout. Postpone mark to market of the reserves that are used for collateral. This sends a clear message to lenders that they will not be allowed to lose — just as was done with every bank that got Fed or TARP help.
Interesting development in China. China reports large energy efficiency gains in 2014 (about 5% improvement in GDP per unit of energy use).
But based on the latest survey, energy consumption over the past several years will be revised UP. Coal production in 2013 will be revised up from 3.68 billion tons to 3.97 billion tons. Total energy consumption in 2013 will be revised up from 3.75 billion tons of coal equivalent to 4.17 billion tons of coal equivalent, or from 2.63 billion tons of oil equivalent to 2.92 billion tons of oil equivalent, an upward revision of 11 percent!
Note that 1 ton of oil equivalent = 1.42857 tons of coal equivalent = 2 tons of average Chinese coal
According to the current official data, China’s energy consumption in 2014 was 4.26 billion tons or 2.98 billion tons of oil equivalent
For 2015, the original energy consumption target of 4 billion tons of coal equivalent will be revised up to 4.4 billion tons of coal equivalent or 3.08 billion tons of oil equivalent
BP reports China’s primary energy consumption in 2013 to be 2.85 billion tons of oil equivalent based on China’s old official energy data (BP uses thermal conversion factors that results in higher primary energy consumption from nuclear and renewables than from China)
Hi Political Economist,
I find the data on China very interesting please keep it coming. Thanks. Does the current data (and revisions) match up with your China coal model very well?
Thanks, Dennis. My coal “model” is actually limited to a HL model with an assumption of URR.
You probably know better than I do about the limitation of HL. Before 2013, my “model” tended to underestimate the actual production levels. Now it tends to overestimate. My hope is that over a longer period, it can average out roughly correct.
Hi Political Economist,
Thanks what is the URR for China in your Hubbert model? The peak can occur anywhere from 40% to 60% of the URR, where is the current cumulative relative to your assumed URR on a percentage basis? If the output keeps falling short of the model, perhaps the URR could be revised lower. You could also use David Rutledge’s spreadsheet and update the China Coal data and see what URR pops out. The last time I tried this with the BP data I got a URR of around 230 Gt and I believe this is much lower than your estimate. Using the new 2013 data point I get 235 Gt using Rutledge’s spreadsheet for China’s coal URR, cumulative output is 66 Gt in 2013, I adjust the URR up to 243 Gt to try to get a smooth fit. Chart below.
Hi Political economist,
You gave an energy consumption number for 2014, do you have a number for Coal production in billions of tons? Is the 2013 data point for coal production actual tons rather than tons of coal equivalent? Thanks.
If I have this data I can recalculate the David Rutledge spreadsheet to see what URR pops out for China. I wonder if maybe the URR may end up being about 250 Gt, based on the recent downturn in output.
Dennis, China’s current official coal production in 2014 is 3.87 billion tons.
I think Rutledge’s estimate of China’s coal URR is too low. Right now I use China’s official coal reserves (about 240 billion tons). That gives a URR of about 300 billion tons. I will wait for the BP review in June to update
Here is a graph I am using for a forthcoming book that will go to print this fall.
For now, I am still predicting a theoretical peak of China’s coal production around 2030 with production level more than 5 billion tons.
This, of course, may just be “theoretical”. I think there will be a good chance that China’s coal URR will eventually exceed 300 Gt (bad for climate of course). China’s theoeretical coal resources are 5 trillion tons and identified resources are more than 1 trillion tons.
My guess is that the recent production decline will be followed by some moderate growth, which is then followed by a long, protracted plateau unless the Chinese government considers climate stabilization as their top priority, which does not seem to be the case.
So the peak production level may be significantly lower than the the peak in the theoretcial model and the peak year may be several years before 2030. But the ending year of the high plateau could stretch to the mid-century.
Hi Political Economist.
“So the peak production level may be significantly lower than the the peak in the theoretcial model and the peak year may be several years before 2030. But the ending year of the high plateau could stretch to the mid-century.“
I don’t think so. The oil price problem will affect coal production going forward. Here is why:
http://www.thehillsgroup.org/depletion2_022.htm
Hi Political economist,
Thanks. I know that you think Rutledge’s estimate is too low.
I will use the 2014 data point to see if it changes things much.
If Chinese coal production continues to be below your Hubbert model, perhaps the Chinese reserves are overstated.
Rutledge’s research indicates that coal reserves tend to be over estimated. Perhaps some of the reserves are technically recoverable reserves which will never become economically recoverable. New model in chart below, URR=264 Gt. Peak is 4.1 Gt in 2031.
That’s a nice graph. 264 Gt is not that much different from 300 Gt. I think you model is a good chance to be closer to the actual peak year and peak production. But the decline after the peak may turn out to be less steep than both your and my model.
For now I am just using China cumulative production plus China’s official reserve base as the working hypothesis. I used to apply a 60% recovery factor to the reserve base but now considers that the difference is not worth the potential uncertainty.
Once China’s current production-cumulative production ratios stabilize into a downward trend, I may switch to a conventional HL approach, which, as you often argue, is likely to underpredict the eventual URR.
Hi Political Economist,
The tendency of Hubbert Linearization to underpredict (at least for oil) is an excellent point.
I can send you the output for that chart in a spreadsheet if you think it is useful, just email me or let me know here and I will send it to you.
The “underprediction” of HL may be a good reason to use your original estimate of 300 Gt, or you could split the difference and use 280 Gt.
I just had output decline by 3% per year from 2014 to 2018 where the output level gets close to the Hubbert curve from Dave Rutledge’s spreadsheet (with data through 2014 added and then recalculating the URR, which ends up at around 260 Gt).
Your analysis of the situation in China I find fascinating, thanks.
The large efficiency “gain” in 2014 is mainly due to the unusually weak performance of manufacturing sector – power consumption, a proxy for China’s industrial activities and a number that is one of the most reliable in China statistics, rose only 3.2% YoY yet GDP grew 7%. Hence service sector contributed much more than usual to the GDP growth, which has much higher energy efficiency ratio per GDP unit.
That being said, I do have doubts on 7% GDP growth figure, as the power consumption and GDP growth relationship has been stable for a long time and 7% GDP growth usually needs at least 8-10% power consumption growth. I don’t think service sector & consumption can all of a sudden started to contribute much more than their usual share to the GDP growth. The transformation of an economy from manufacturing & investment driven to an economy that is service & consumption driven takes a long time.
Hi Skywalker,
Over time they can produce more energy with wind, solar, and nuclear and use energy more efficiently so that their fossil fuel use per $ of real GDP produced could decrease over time. I agree that 7% sounds too high, they will probably grow at about 5% per year going forward over the next decade (average annual rate for the next 10 years).
I believe this is a good time to repeat a conversation I had with my nephew, who has definite green leanings.
He said, “to some people I work for the devil, being in the fossil fuel industry.”
My reply, “then you are the devil, as your are the consumer!”
So everybody, stop consuming, put the oil industry out of business, and we can all be happy. Until then, my services will be bought and paid for, but the last time I looked, the F-150 is still the best selling LDV. I can’t do anything about that. That is up to the American vehicle buying public to change. 5% population, 25% oil consumption?
Hi toolpush.
Politics don’t matter anymore. We are all in this together. There are no good guys, there are no bad guys. Just frightened little monkeys who really mean no harm. None of us chose this world.
Hi Toolpush,
Thanks. I put this comment in the wrong place, it was supposed to be below Toolpush’s comment below.
For those worried that we will hit storage limits we only are at 60% of working capacity according to a March 4, 2015 EIA report
http://www.eia.gov/todayinenergy/detail.cfm?id=20212
There is about 200 million barrels of working capacity available, the year over year increase in stocks is about 73 million barrels, so at the recent rates of increase of 4 million barrels per week we have a year until tanks are filled and at the lower year over year rates we have almost 3 years.
The storage increase is due to refineries being down for maintenance, this usually happens in Feb and March and then again in the fall.
Weekly Oil out
http://ir.eia.gov/wpsr/wpsrsummary.pdf
Crude storage up nearly 10 mmb, but imports are up to 7.5 mmbpd, up 703mbopd. or near 5 mmbo.
Usage up gas 2.7% diesel up 5.6% and jet fuel up 7.9%.
If they slowed imports, then no storage problem. The question is why are imports staying so high?
Wrong oil anybody?
Is there anyway to pinpoint which counties will become SOL first? There has got to be away to determine by matching up where current supplies are coming from and going to and current rate of decline and oil available for exports. For example Nigeria oil production has fallen off 25% in ten year if that trend continues and your the country or countries that depend on that supply and are not able to find a replacement supply then your SOL. I think peak oil availability will happen country by country. But if there was a way to pinpoint where and when the first country or countries start to experience peak oil availability thats where the starting point of any global population collapse would occur. Any country not being able to acquire all it’s oil needs would confirm the peak has happened and the downside is all thats left.
That’s a good thought. If tankers are at risk in certain areas, then they can go to other areas. If you get your oil (or more likely diesel) in Africa from the producing African countries who discover they can’t ship it to Asia because China and Japan are threatening to bomb them, and Lloyds cuts off insurance, then you’re going to get your oil. So Togo is sitting prettier than Japan.
The best way to deal with irritants on a web site is to ignore him/her.
Irritants thrive on the reactions they provoke. The more you ignore
them the louder they get until they just get bored.
Why even bother thinking or reacting to someone that you feel makes
no sense.
You can’t, fundamentally. Everything’s connected.
A sea bird can’t ignore the irritant of an oil spill; the so-called 1% can’t ignore the 99%. Not forever. Not without consequences.
And that’s one of our problems as a species. We ignore too much. That’s in part why we’re here, on this blog. We blew our resources, our communities, we ignored the consequences, ignored ethics. And now we map our downward trajectories.
“…The map is a simulacrum that, as a model, loses all reference to reality… reality exists only as rotting shreds that are attached to the map, and this is the state of our age according to Baudrillard; that the model, itself, has primacy for us; the real has become irrelevant…” ~ Frances Flannery-Dailey
“Someone has written a book about the children and their need for their, just simply, emotional and mental development to have contact with the mountains, with the air, the sea, with the dawn, the sunset, the trees, the birds, the song of the birds. Children that don’t have these experiences have no real idea of the world they live in. They live in a house, in a school, in a city that’s all manufactured. And they begin to be progressively isolated from the basic dynamics of what human life is all about.” ~ Thomas Berry (1914-2009)
“…Our relationship with the universe becomes a ‘use’ relationship. Now that’s disastrous… Just like to say to another being– human– ‘you used me’– is about as terrible a thing a person can say. Now the planet Earth is telling us, ‘You used me.’…
…the glory of the human has become the desolation of the Earth, and now the desolation of the Earth is becoming the destiny of the human. From here on, the primary judgement of all human institutions, professions, programs and activities will be determined by the extent to which they inhibit, ignore or foster a mutually-enhancing human-Earth relationship…”
~ Thomas Berry (1914-2009), ‘Evening Thoughts: Reflecting on Earth as Sacred Community’
I see a regular discussion between Dennis and Ron regarding the ND/Bakken overall field decline. I therefore also created a simulation of future production in the whole of ND, based on different # wells added each month.
Assuming that well profiles don’t change much in the future, this is how future production in ND would roughly look like (it may be off by a few %). Dennis may have shown a similar graph before, but I enjoyed the exercise and wanted to share the result.
Probably not valid.
All wells are not created equal. If someone decides to frack 10 stages instead of 30 so they can report a well completion to money people, but don’t have the money to pay for 30 stages, then the new wells produce less and destroy your chart. They can even rationalize it as leaving oil in the ground for better price.
Sorry. Good try, tho.
Hi Watcher,
If that is done the new well EUR will decrease, so far there is no evidence of that, in fact the new well EUR has been increasing since 2012. Also when prices dipped in 2009 there was little evidence of any well productivity decline.
The analysis by Enno is likely to be pretty good except he assumes there is no well productivity decrease from now until 2025, that probably will not be the case. Eventually new well estimated ultimate recovery (EUR) will decrease as the sweet spots get fully drilled and less productive areas at the margins are drilled, in that case the number of frack stages will probably increase in an attempt to maintain the new well EUR at previous levels. This will drive up well costs and reduce profitability and the number of new wells added per month will gradually decrease.
You are correct that the analysis is incomplete, we do not know when new well EUR will decrease in the future, how fast it will decrease when it does, how much well costs will increase, or how many new wells will be added.
No doubt you would say why bother?
My answer is to check the claims thrown around by various analysts by making a reasonable range of assumptions about the future. Create a high and a low scenario using these assumptions and figure the reality may be between the high and low case.
Hi Enno,
Very nice work, thank you.
How did you determine legacy decline? I get about 470 kb/d in Jan 2018 with zero wells. With 100 wells per month and 6% EUR decrease in June 2016 I get about 1050 kb/d in Jan 2017. At 50 wells per month I get 800 kb/d in Jan 2017. At 150 new wells, I need a 12% EUR decrease to keep URR less than 10 Gb and get 1277 kb/d in Jan 2017. That scenario peaks in 2018 at 1286 kb/d because of the decrease in new well EUR, without the EUR decrease it reaches 1800 in Jan 2025, so my well profile seems a little higher than yours.
Did you do an underlying model ramping up wells from 2010 or so?
My model actually uses data going back to 2005, but the first 5 years probably don’t affect things much by 2015. I also did a simulation using data back to 1953 to estimate an underlying decline for the 200 Bakken wells that were already producing at the end of 2004.
I use a lower well profile for the early wells from 2005 to 2007 and then use a fixed profile from 2008 to 2013 (using the average 2008 to 2013 well profile), then the well profile is gradually increased in 2014 because the model was falling behind the data (model output was too low in 2014).
I also assume EUR starts to decrease in 2015 reaching a maximum annual rate of decrease of 4% by 2016 (over 12 months) and then remaining at that rate until 2034 for the case where 85 new wells per month are added.
Hi Dennis,
You should just see it as a rough simulation, nothing too fancy.
The method:
– I group all wells by age in months.
– I apply a single well decline profile, based on the average ND well decline since 2010
– I estimate a falling decline for future months for which no data exists, until a monthly drop of 1% when a well has reached an age of 10 years.
The FOMC spoke today, said nothing all that surprising, with the exception of reducing their 2015 GDP growth forecast to sub 2.5% full year. They released the mtg report, stocks surged, bonds surged (aka yields fell) and oil was somewhat flat at 42.90ish.
Then Yellen’s Q&A started . . . and I did not hear it, but sometime in the middle of it she caused a $1 jump to $44.xx. Something oil relevant must have been said. Bond yields cratered, lost what looks like 14 basis points to the low 1.9s, to the surprise of no one who is aware German yields are sub 1%.
Editing: Aha. She slammed the dollar. The Euro and GBP are both up huge, and that was not so pre Q&A.
And more, holy crap, the Euro jumped 2 full pennies on a day when Grexit is in the news prominently, all because of words from Yellen. Maybe she’ll embrace jawboning the dollar as a shale bailout some day.
Dollar Index fell 500 points before bouncing pretty drastically. USD/YEN looks to be carving out a long-term double top with a target at around 109.00 a little over 1000 points down from where it currently resides. Yen carry trade looks like it’s set up to unwind. Only something major that would effect markets globally has to happen for this to occur. In the face of the massive QE the JOB is doing. Oil is up about $4 off the low. Sometimes you can look at these charts and you know something big is about to happen but maybe not know exacting what and where it’s going to happen.
Asia reversal. $43.94. Dollar re-establishing strength. Euro back under 1.08.
Think my point about financial BS that I posted this morning was made this afternoon. Watcher likes to come up with conspiracy theories, but seems like I am getting more of that mindset myself.
Oil continues to bleed and then Yellen says a few words and in 5 minutes price goes up over $3.
If those in control want $20 it will get there. If they want $100 it will get there.
And with these games going on people are trying to make long term decisions, like keeping people employed or not, drilling a well or not, shutting in a well or not.
Then when you realize the same games are being played with all other commodities, including food, it ticks you off. Then add on the same games are being played with equities and bonds, which make up a huge chunk of people’s retirement, it ticks you off even more.
No wonder there are so many “doomers” out there. I could even join them, but I’m negative enough as it is and many (not all) have that rude/self-righteous streak that is a real turnoff. Haven’t you heard, “you attract more flies with honey?”
If you see doom, the last thing you want is extraneous population, so there’s no merit in attracting with anything.
Scroll up thread a bit. Somewhat viable, avec precedent, methodology for a gov’t bailout. The SEC can suspend mark to market requirements for valuation of reserves (aka collateral). This tells the lenders they won’t be allowed to lose. The loans could rollover, and only Russia and KSA realize it’s bogus.
Honey doesn’t work with some flies, so different approaches are needed.
In a natural primeval tribal setting, if some member started acting up in certain ways, the ways the large scale system is doing right now with the entire planet, they would not be ‘attracted with honey’.
After some consideration, it would then seem apparent that they were motivated by shit. (Hence Fernando’s pigeon’s shit-lit’, incidentally.) Shit (and shit-lovingness) needs a different approach, such as to be promptly thrown out and into the compost or it becomes potentially dangerous, diseased, contaminated, etc.. Sounds familiar?
Fast forward some tens of millennia later, and the problem now is that on a global scale, there predominates flies that are attracted to/motivated by shit instead of honey, which is in part why they continue to drill for oil, for example, despite what they know full and well, and support coercive shit-makin’, shit-lovin’ government-industry structures.
Which is therefore to little surprise that a common expression among them is ‘the shit hits the fan’. But of course it is their shit hitting the fan, to the detriment of everything else, including the nice honey that now has increasing amounts of the brown stuff distributed within.
Oh, what to do about these particular flies, and their larvae…
(Another fine comment crafted on-the-fly with the Patterson Press™ New & Improved Comment Editor.)
shallow sand,
There is no way to “sell” social collapse. You just can’t coat it with sugar or honey.
And we doomers tend to be self righteous because no one ever listens to us.
Catch-22.
Oh well, just tired last night and frustrated. Sorry for the rant. Don’t know that I even believe all about price manipulation. Just tired and frustrated. This too shall pass.
Week 10 of BNSF carload report.
The total is down to 8100 petroleum carloads from the previous week’s 10,250.
Twenty percent decrease is about twenty fewer trains hauling petroleum.
Some Tales of the Crash
Just had a chat with another grizzled Oil Patch survivor. He told me a couple of stories he heard about companies shutting down and selling out, in the Midland, Texas area. One company burned through $300 million in funding; the owners sold the company and the reserves they found for $20 million. Another company shut down after spending $150 million, after finding a total of 15o bpd in production.
If I compute correctly, that looks like 280 million and 150 million in loans defaulted on.
Watcher, the business doesn’t work on 100 % borrowed money. It’s not unusual for investors to put up cash. That’s why its called capitalism. Most of the pain will be inflicted on the people who bought the stock, and the employees and their contractors.
Safe to say ND rigs will be below 100 by the end of March. 107 left with 3 to stack.
Looks like the current El Niño conditions are close to a toss up. I expect 2015 will be a warm year, but i don’t think this Niño will be close to the one in 1998 or the one in 2010…..and by next year we should be cooler as the regime shifts to La Niña. This graph is from Roy Spencer vía Watts:
¿Por qué estás publicando esto? Por favor, permanezca dentro del área de su especialización. Gracias!
its not polite to use languages people can’t read. I suggest you fly to Cuba and get a government job if you want to practice censorship.
I guess you missed people posting here in Russian… anyways there’s always google translate. And Spanish is already the second quasi official language in the US. However my point was that there was absolutely zero need for you to post something unrelated to your area of expertise given that no one else was posting anything on that topic and you of all people are usually the first to complain how others are hijacking threads with posts about climate change on a peak oil blog… just giving you a small dose of your own medicine and suggesting you practice a little more of what you preach.
Cheers!
Hi Fred,
I do not agree with Fernando about climate change being of little consequence.
He is not the only one who posts stuff about climate change and I don’t remember him complaining about others doing that.
Here is another take on satellite temperature data, this is lower trophosphere data from RSS and UAH. Chart below. Since 1979 temperatures have increased about 0.4 to 0.5 C based on the satellite data and a linear trend applied over the 1979 to 2014 period. Data points are the annual average temperatures for each year.
Link below:
http://www.ncdc.noaa.gov/temp-and-precip/msu/time-series/global/lt/dec/ann
Hi Dennis, point taken I guess I just keep having knee jerk reactions to his non oil related posts… might have something to do with my perception of him being a little too arrogant for my taste! Then again I certainly have my own share of faults, foibles and idiosyncrasies. Maybe we should all post our IQs, my own is just a tad shy of genius so I don’t quite make the grade GRIN!
I suggest you skip over my comments. This way your dogma won’t be threatened.
Hi Fred,
I have no idea what my IQ is, but nobody has ever mistaken me for a genius 🙂
I like Fernando, he is very polite and his input is appreciated by me at least. There is much we do agree on, there is much more research needed in climate science particularly on clouds and aerosols and their interaction. Many of the IPCC scenarios assume that there is much more fossil fuel available than will likely be the case, the amount of carbon available will be in the 1200 to 1400 Gt range, I have done some scenarios with about 1200 Gt of carbon (all sources including land use change) released to the atmosphere, this is with realistic estimates for fossil fuel URR (coal, oil, and natural gas).
Atmospheric CO2 ends up around 520 ppm and remains above 450 ppm for thousands of years.
Where we part company is that Fernando believes this is not likely to be a problem, I disagree strongly with that view and believe he dismisses the expert opinions of thousands of scientists a little too lightly.
That may be the problem with someone believing they are smarter than everyone else.
A typical response to uncertainty is to choose the safer path, but everyone is different.
Oil and climate are related bits of earth sciences and if people are not interested in the merge of the topics, too bad for them. Just the physical processes behind sequestration of CO2 are fascinating. It will take hundreds if not thousands of years for the excess of CO2 that we have exhausted into the atmosphere to return to pre-industrial levels. No one really knows what the long-term outcome of this situation will be.
I’m not part of any “lot” so I’m not tied to any ideology, unlike what you see with many of the global warming researchers. I wish more people so tied up in promoting the global warming research would get out of their censored environments and look around. The ozone hole has not decreased in mean size for years (just check our beloved federal government’s own web sites). Likewise, the globe has not warmed for about 17 years and is actually cooling at present (by all measures–satellite, surface stations, etc.)
Its not global warming research but in fact climate research.
And too bad that you can not do anything about eliminating funding for the science, as climate is a global concern. A strong El Nino in the equatorial Pacific will impact everyone in the world for a a few years. If one country does not invest in climate research, another country will.
I suggest you get over it.
“I’m not part of any “lot” so I’m not tied to any ideology”
~James Stricher
Ha ha.
I’m not interested in eliminating funding generally for global warming science, but I am interested in eliminating federal government funding through tax revenues going to global warming science. If global warming/climate change/etc. is really such a big concern, we should let the private sector and free markets decide if they want to fund any research to deal with it. If they don’t, well, then, the whole global warming thing probably doesn’t present much of a concern.
Let’s face it, aside from the military, our federal government corrupts everything it touches. The current setup whereby the untrustworthy public sector is being relied upon to bring us the science is just too easy to game for political and ideological driven purposes.
If global warming/climate change/etc. is really such a big concern, we should let the private sector and free markets decide if they want to fund any research to deal with it.
The insurance industry is.
Climate Change and Global Warming (E) Working Group
And I would like to see the free market deal with insurance rates. Let home owners who live in areas likely to be affected by flooding and hurricanes pay their own rates. Let’s pull the federal government out of subsidizing low property insurance which then encourages people to build too close to the ocean and rivers.
We should let people who are affected by changing weather patterns to pay unsubsidized insurance. And then whatever weather events there may be will become something they personally need to take responsibility for.
JS, I assume you are from the USA. Think it through — there is nothing that you can do about how other governments spend their money. If another country wants to spend money on climate research, none of your belly-aching about where your tax dollars are going is going to help.
So if the USA wants to remain competitive against corporate-like nation-states, they have to acknowledge what is happening elsewhere. And one of those issues that needs to be addressed is in best using climate science to our advantage.
Hey James, I’m for eliminating coercive government, never mind funding. You want it funded? Fund it yourself! Or ask and let people decide.
Coercive government is what gives us most, if not all, of the problems we see today, including climate change.
Dennis’ faith in, as he puts it, ‘government stepping in’ is akin to a criminal stepping in, such that coercive government is. Doesn’t work and never will.
You can flail around all your charts, graphs, statistics, degrees, and assorted puffery you want, but it won’t make a bit of difference without a fundamental ethical change like that.
The best you will do is merely chart, graph, etc., our downfall with mathematical precision (although you argue about that all the time too anyway, so no one seems to have a handle on anything, even the specialists, which are part of the problem too [specialization] ).
This is in large part why I think we are in deep trouble and why we will continue to be so until which time as we can step out from under coercive government. Anything we do until that time will be wasted effort– exercises in futility– like how the resource of oil is being forever squandered.
“Consequently, resources that have traditionally been managed communally by local organizations have been enclosed or privatized. Ostensibly, this serves to ‘protect’ such resources, but it ignores the pre-existing management, often appropriating resources and alienating indigenous (and frequently poor) populations. In effect, private or state use may result in worse outcomes than the previous management of commons.” ~ Wikipedia, entry on the Tragedy of the Commons
“If taxation were voluntary we would get a government fit for purpose.” ~ Bill, (comment on Permaculture Research Institute of Australia’s blog, January 24th, 2014)
Hi Caelan.
I found this gem down the page.
“When the peak arrives we will just snap our fingers and presto scarce fossil fuels will be no problem at all.”
~Dennis Coyne
Well I am fairly sure Dennis was joking there.
Incidentally, for a second it read, presto sauce.
It needs a comma or two.
Re: James Stricher says: March 19, 2015 at 1:03 pm
“Let’s face it, aside from the military, our federal government corrupts everything it touches.”
Okay, everybody…that pitcher on the table by Stricher? Don’t drink the Kool-aid.
Hi Paul,
It will be tens of thousands of years before the CO2 in the atmosphere goes from 500 ppm back to 280 ppm in David Archer’s view.
Many people are not aware of the long residence time of carbon dioxide in the atmosphere.
Dennis,
“That may be the problem with someone believing they are smarter than everyone else.”
Your arrogant genius meme is already getting old. There are a lot of smart people here. So?
Here is a pattern:
Only Caelan has a fight with toolpush, and every one talks about how Caelan and Futilitist have bad manners.
Now, only Fernando claims to be a genius, and everyone talks about how Fernando and Futilitist are arrogant. Everyone else’s worst traits are being attributed to me.
That’s scapegoating, folks.
It works like this: Once the well known unpleasant traits of certain individuals in the group are fully projected on to me, I will be ignored or even banned (sacrificed) and, thus, all the group tension will relieved and group “oneness” will be achieved.
I know I am the new guy and all, but I can’t help noticing that my role here seems to be to try to convince everyone of something they don’t want to accept. That seems to automatically generate this sort of scapegoating behavior from the group. Kill the messenger. If it weren’t for the internet, I would have been dead long ago.
“A typical response to uncertainty is to choose the safer path, but everyone is different.”
That is not true, Dennis. The typical response to uncertainty is to do nothing. That is not always the safest path. When Limits to Growth warned us that we needed to change our ways, we ignored the warning. Now we are screwed! So we obviously did not take the safer path.
Your goal is to generate uncertainty so we will keep to the BAU path. You are not looking out for our safety.
Peak Oil Barrel, less like The Oil Drum (TOD), but a little like it, may attract a dichotomy of people; those of/related to the oil industry and those of/related to interests revolving around its effects, like peak oil, climate change, collapse and relocalization.
So it would seem a given that there’s going to be some ‘creative friction’ (the end of cheap lube).
The 2 possible, main reasons why there seemed to be less on TOD is because it was moderated– mostly by women, apparently– and because its scope, or at least inferred scope, such as by its title/header, was broader– ‘Discussions About Energy and Our Future’ if I recall. Here, it appears more limited, and oriented around industry and its implications going forward.
And so, especially these daze, you are going to get guys like me, who despise most things industry, government and vertical hierarchy, rub up against guys who suck seriously up to, say, industry, government and/or vertical hierarchy and who might not have much of a clue, or care, about such things as anarchy, pure democracy, lateral hierarchy, and be in a seriously bad mood what with their revenue being slashed by ~50% to boot.
“Only Caelan has a fight with toolpush”
I believe Caelen was fighting with himself, as I was actively ignoring his comments.
That would be mental age divided by chronological age times 100.
If you are a one-year old and act like a two-year old, your IQ is 200.
2/1 x 100 = 200
Just to make sure; you do realize that Fernando was joking, right? (You were joking, right Fern? ‘u^ )
It, presumably, was a take on a quote in a comment by Throbbing Orville Reddenbudders. Is that a great name for a rooster cop or what?
I always had a hard time with the idea of IQ tests, by the way, so I decided once upon a time to look into them, and found something rather interesting about one of their problems, by someone in New Zealand, by the last name of Finn, if memory serves.
Spoiler:
Oh, by the way, that post had a kind of intellectual Easter Egg: The rooster cop, like human kinds, is a traitor to his feathered fellows, and would likely arrest Fernando’s pigeon in the event that it acted on what it was reading. It is like how we are all shitting on ourselves in part within the, often systemically-derived, contexts of competitive and hierarchical pursuits.
This all feeds into issues of democracy, oligarchy, climate change and collapse. Everything’s connected.
Specialization is a form of both a glorified obsessive compulsive disorder and willful ignorance.
Dennis, as you know there are 6433 blogs with temperature graphs and linear trends. I’m familiar with the main surface temperature trends but I think they are an incomplete product unless we also consider temperature changes elsewhere in the system.
I posted the graph because it was new and it does show the temperature has a slight bump. But we are in EL Niño conditions, and it’s supposed to strengthen a bit. So as I wrote it may increase precipitation in California. Politically this weakens Obama’s case.
I didn’t expect Freddy’s hissy fit. It seems some believe the subject can’t be touched unless one is approved by self appointed censors. The dude sounds like one of Mann’s graduate students.
Hi Fernando,
I am usually a little (maybe very) skeptical of the stuff from Watts blog, the chart you posted matches fairly well with the data I got from the NOAA( which I believe is more reliable). I have not been following the El Nino stuff closely of late and do not have an opinion, hopefully the drought conditions in California will improve as you predict. Obama will have no luck getting any legislation passed, any progress will have to be through executive action.
The data I posted is the NASA troposphere data, known as UAH because it’s prepared at the University of Alabama at Huntsville. It so happens that Watts posts the data as soon as it’s available because he gets it from Spencer.
In general all these data sets are very similar. I got a link to a very useful data set prepared by an european institution which shows a slightly different trend.
My observation is that most of the data cooking happens when they select a yearly interval, or when they choose a distorted color palette for their maps.
The maps prepared by NOAA and NASA have been getting funny looking color choices in recent years. It’s internal politics.
Hi Fernando,
If you are referring to the ocean, then I agree a lot more research and data gathering is needed there as well.
Since we mostly live on the surface of the planet, it seems to me those temperatures are pretty important, but if you are talking about the Top of atmosphere temperatures, those are also important for a scientific understanding.
The limited time span (back to about 1979 I believe) is a little problematic, the same can be said of ocean heat content which has a very limited time span.
Dennis,
You and Fernando are both doubt mongers.
Hi Futilitist,
I do not think that you think you are smarter than everyone else, or I hope not. I disagree with you that’s all.
Dennis,
I don’t know if I am smarter than anyone else or not. But that is beside the point.
It isn’t always the smartest one who gets the answer. That is what “The Emperor’s New Clothes” is all about. That is what the expression “Out of the mouths of babes” is all about. Beware of the madness of crowds.
Denial a very powerful thing. And I don’t mean only you. It is just human nature to turn away from that which frightens us.
I sure hope I am wrong, too. But I know I am not.
Dennis, over the last two days I decided to brush up on aerosols. Anyway, I found this abstract:
http://journals.ametsoc.org/doi/abs/10.1175/JCLI-D-14-00656.1
The abstract describes the results of an analysis of the aerosol forcings. The author concludes that aerosol forcings aren’t as large as used by most climate models.
A quick review of the impact of such reductions shows the climatologists think it leads to a reduction of the Transient Climate Response (I wrote think but the physics and the models are quite firm about this).
If one considers this paper and adds the results from Lewis and Curry 2014, it’s easy to set TCR at around 1.6 degrees C to doubling. The equilibrium climate sensitivity would be between 2 and 2.5.
This starts taking me to consider China’s coal resources a really important parameter in the dual puzzle (fossil fuel peak and climate change). It also reinforces (at least in my mind) the advantages we may derive from geoengineering.
Regarding Obama, he’s got a limited shelf life, and his decrees will be challenged in court. But to be honest I’m not really that worried. If, by 2025, the temperature has continued to deviate from the model predictions then those models will have been trashed and replaced.
I am still worried about the peak oil problem. And if the global warming bs helps increase efficiency then it’s a plus.
What I don’t support is the dumb subsidies for solar power.
And I’m definitely concerned about the way the government lies all the time. It seems the fake story about the Iraq WMD lesson didn’t sink in with the general public.
Hi Fernando,
I think taxes on fossil fuels are the right approach where carbon released to the atmosphere has a price attached to it and tax subsidies for fossil fuels are an equally bad idea as subsidies for solar and wind.
As long as the playing field is leveled (oil has gotten a lot of freebies over its history in the US, like the Federal government footing the bill for the interstate highway system.) and externalities are taxed, then subsidies can be eliminated.
The most recent IPCC estimate for total aerosol forcing is -0.9 W/m2, in line with the abstract you cite, though there is great uncertainty in this estimate, some models have very low estimates (-1.9 W/m2) and some are much higher (-0.1 W/m2).
Also note that for every abstract that you find that supports your view, someone can find other abstracts which imply the opposite. I am not going to play that game, you are looking for information that confirms what you believe.
Below is a CSALT variation where no aerosol data is used, call it the CSLT model, based on Paul Pukite’s simple model. This essentially assumes the aerosols have no forcing effect.
Hi Dennis,
Thanks for the analysis.
.5 degrees C over 35 years, is .14 C per decade, or 1.4 degrees C per century.
A 1.4 degree C increase would hardly be the end of the world.
Although I doubt we will be using much fossil fuel in 100 years, or even past 2050. And I think you probably believe that as well.
So therefore, AGW is simply not an issue.
You are omitting
1/ It is exponential not linear
2/ The rate of change is increasing as well
NAOM
If you look at the graph carefully, you can see very little increase over the last 20 years, and no increase over the last 10 years. That’s not increasing, it’s flattening out.
Also, CO2 emissions have stabilized.
http://news.hjnews.com/news/energy-bombshell-co-emissions-stabilized-in/article_2577c184-c9d1-11e4-929e-d7c3ac4cb951.html
Hi JohnB,
Temperatures are currently 0.8 C above the 5000 BC to 1750AD average temperature (aka pre-industrial temperature). The “safe limit” is 2 C, so 1.4C takes us to 2.2C. What you seem to not grasp is that once the fossil fuel burning stops the CO2 remains in the atmosphere for thousands of years and the earth continues to warm.
Currently much of the excess radiative forcing simply warms the ocean, as the ocean warms there is more evaporation which leads to higher average levels of water vapor in the atmosphere which causes further warming. Also a warmer ocean can dissolve less CO2 which tends to reduce the levels of atmospheric CO2 which is sequestered in the ocean and increases CO2 levels in the atmosphere.
If we emit about 1200 Gt of carbon into the atmosphere and the equilibrium climate sensitivity(ECS) is 3 C, then atmospheric CO2 peaks at around 500 ppm, other greenhouse gases likely would contribute the equivalent of another 50 ppm of CO2 equivalent forcing, which would lead to about 2 C of warming.
The problem with such a forecast is there is great uncertainty about the true level of the ECS, it might be as low as 1.5C or as high as 4.5 C, if we assume the higher ECS level in order to allow a margin of safety, then carbon emissions of 1200 Gt (1750 to 2100) leads to about 3 C of warming.
If carbon emissions were at 1000 Gt, atmospheric CO2 peaks at about 475 ppm, if we continue to add 50 ppm to CO2 levels (accounting for other greenhouse gases), we get 525 ppm of CO2 equivalent, leading to 1.9 C of warming. An ECS of 4.5 C also takes us above the 2C safe level for 1000 Gt of carbon emissions, the temperature would rise to 2.8 C if CO2 remained at this level for many years.
The other green house gases such as methane are removed from the atmosphere more quickly than CO2. It also takes some time for the climate to reach an equilibrium as the ocean slowly warms, so 1000 Gt is a reasonable number to shoot for. In the 1000 Gt model, CO2 peaks around 475 PPM in 2100 and falls to 450 ppm in 2200. Even with an ECS of 4.5C, 450 ppm keeps us close to 2 C.
Looking at the average CO2 level for 2100 to 2200 (464 ppm), if the ECS is 4C or less we remain around 2C above preindustrial with 1000 Gt of total carbon emissions (3670 Gt of CO2).
Unfortunately we have about 1200 Gt of potential emissions so if ECS is high (4C or more), we will go above 2 C. If ECS is 3.64C or less we may be ok, but it would be better if we didn’t gamble on the health of the planet.
I am not optimistic that we will leave any fossil fuels that are economically recoverable in the ground. Proper pricing of carbon emissions would increase our odds of keeping temperatures at safe levels.
Rapid adoption of renewable energy as fossil fuel prices rise is a possibility, but far from certain.
Greenhouse gas forcing starts to drop within 5 to 300 years after we stop emissions. We don’t have a very functional long term carbon cycle model, but that’s evident from the current CO2 sink performance and the methane to CO2 conversion rate.
Hi Fernando,
If total carbon emissions are only 1000 Gt, then atmospheric CO2 drops very slowly from 475 ppm in 2100 to 450 ppm in 2200 with no carbon emissions from any source over that period (which is not a realistic assumption.) I have ignored other greenhouse gases in this case, this is CO2 only.
Increased CO2 has caused the planet to become more green.
http://www.rationaloptimist.com/blog/the-greening-of-the-planet.aspx
The direct effect of CO2 forcing is .7 degrees C. Increased water vapor as a result of CO2 forcing is only theoretical, and is likely overstated by some climate scientists. This is probably the main reason why their models have failed.
As far as any “safe limit”, that it just someone’s personal opinion. Most likely the same people who got their climate models wrong.
CO2 levels in the past have been much higher, and the Earth survived just fine.
Hi John B,
CO2 levels were much higher before 20 million years ago, it takes some time for the flora and fauna to adapt to ne conditions.
Except for the period from 1958 to the present, the carbon dioxide levels in the Earth’s atmosphere have not been above 300 ppm for at least the past 400,000 years.
Modern humans only evolved about 200,000 years ago. We are not, nor is the flora and fauna we have become accustom to over the last 200,00 years well adapted to high levels of atmospheric CO2.
I beg to differ.
It will be stronger than 2010.
1998?
Strongest ever, for records we have.
No doubt, a lot of heat will be released into the atmosphere.
The Westerlies need to continue through the Spring, and this is the least predictive time of year.
But the Tropical Pacific is on fire!
Yep. On fire setting new lows.
http://iceagenow.info/2015/01/breaking-low-temperature-records-hawaii/
We will know by May.
As a former Hawaii resident, I think this needs more examination.
http://www.wunderground.com/blog/JeffMasters/comment.html?entrynum=2938
So, shall we see?
No use arguing now.
“Scientists use the Wheeler-Hendon MJO index to monitor how strong the MJO is, and this week, the amplitude of the MJO set a new all-time record for the strongest MJO event observed since record keeping began in 1974 (with no data available from 3/17/1978-12/31/1978 due to satellite problems). The MJO index hit 4.09 on March 15, 2015, beating the old record of 4.01 set on February 14, 1985. On March 16, 2015, the MJO index set an even higher mark–4.67. “
I’ll bet you don’t remember it being 54 degrees in March.
http://www.hawaiinewsnow.com/story/28357702/more-sweater-weather-ahead-as-overnight-lows-hover-near-records
I lived in Kula.
I had a fireplace going, and a sweater on for many months of the year.
A small localized weather event.
Hi John B,
There is a difference between climate and weather, for every place there is variability and new highs and new lows are not really relevant unless we are talking about the global annual average temperature, and even that is less important than 25 year trends in the global average annual temperature.
Interestingly if we look at the 25 year average of CO2 in 1960 and 2002 we get 317 ppm and 372 ppm and ln (372/317) is 0.16.
The 25 year temp average change from 1960 to 2002 is 0.48 C.
A doubling of atmospheric CO2 is ln(2)=0.693, so the ratio is 0.693/0.16=4.33. If we multiply the temperature change of 0.48C by the ratio of the doubling of CO2 to the logarithmic increase in CO2 (in ppm) corresponding with the 0.48 C temperature change, we get 0.48*4.33=2.1 C.
This gives a rough estimate of the transient climate response(TCR) based on the empirical CO2 and global temperature data.
The “dogmatic” IPPC estimate of TCR=1.8 C is relatively conservative by comparison.
Chart of NOAA Global Land Ocean annual temperature and centered 11 year and 25 year moving averages.
Your analysis has a flaw, it fails to consider energy balance. You can use similar logic to derive a lower number by cherry picking a different time window.
Hi Fernando,
Have you been suggesting that you don’t believe in global warming?
Caelan, I posted the latest UAH temperature plot, posted by Dr Spencer. It shows the temperature has increased. Global warming isn’t a religion.
The various AGW denier camps have religious wars with each other. Check out the WattsUpWithThat denier faction battling out with the TallBlokeTalkshop camp over inane and moot points. They act like different religious orders with their high priests having titles of Bishops and Lords. I kid you not.
In contrast, the mainstream climate science community behave like atheists and cordially use each others scientific arguments.
Hi Fernando,
Pick an interval of 42 years or more and see what you get. Because I used a 25 year centered moving average the 1960 data point is an average of 1948 to 1972 average annual temperature and atmospheric CO2, the 2002 data point covers 1989 to 2014. So in a sense the data period is more like 66 years.
If we use 1900 to 2002 (25 year centered averages of annual data) we get a TCR of 2.2. That pretty much covers almost all of the NOAA data set.
You are correct that energy balance is not included. If it were, the TCR would be higher as there is a lot of heat being stored in the ocean due to ocean warming. On land only the TCR is more like 3C because the ocean is not moderating the increase in temperature.
Dennis, your method is a bit funky, but if we assume it’s right I can use the GISS data set to estimate values around 1.6 for TCR.
Hi Fernando,
What is the time span you are using? Are you cherry picking? Find me two years in the NOAA data that results in 1.6C that are 42 years or more apart using 25 year centered moving averages. My guess is you have cherry picked to get the number you are looking for.
Hi Dennis,
There hasn’t been any statistical increase in temps for the past 18 years. There should have been at least a .36 degree C increase according to your sensitivity numbers, and there was 0. How do you explain that?
And don’t say heat hiding in the deep ocean, because that theory has already been debunked.
http://www.climatedepot.com/wp-content/uploads/2015/01/Monckton-jan-2014.png
I think it’s really quite simple. It remains the case that there is no evidence that co2 level has ever had a measurable effect on the global temperature. There’s not even been a good real-world correlation found between co2 and temperature among the literature.
The computer models have all projected higher temperatures than subsequently show up. The computer models cannot explain why, with co2 at its highest level there has been no additional warming for almost the past two decades. (Even if all 5 global temperature datasets are averaged and that is used – still 13+ years with no additional temperature. Even that period exceeds the 10 year stretch when the scientists began chanting about global warming (which later turned into climate change/disruption upon further review.
The AGW hypothesis brings with it a necessary condition – that the troposphere warm up. Neither satellite measurements nor thousands of weather balloon data have shown that to be the case.
What’s to debate?
Hi Robert a multilinear regression on the natural log of atmospheric CO2, the Southern oscillation index, aerosol levels in the atmosphere, the change in the length of day, and the total solar irradiance, matches the temperature fairly well.
See
http://contextearth.com/2015/01/30/csalt-re-analysis/
I did a simple, less sophisticated attempt at this model, chart below.
Monckton?! Really? Hahahahahahaha!
https://www.youtube.com/watch?v=w833cAs9EN0
Or more debunking of Monckton
https://www.youtube.com/watch?v=JfA1LpiYk2o&feature=youtu.be
This is a typical response from the climate alarmist cabal. No facts, just ridicule.
Let’s try addressing the facts for a few minutes.
https://www.youtube.com/watch?v=C35pasCr6KI
No facts, just ridicule.
LORD Monckton is not a scientist he is a journalist pretending to be one. Actually he pretends to be a lot of things he isn’t! The man is a pathological liar. He doesn’t deal in facts and is beyond ridiculous, the only response to him is to ridicule him and laugh very loudly!
Anyone who considers Monckton to be a legitimate skeptic is a fool!
As for the scientists in the video from Australia they seem to be right of the playbook Naomi Klien talks about in her book The Merchants of Doubt. Specifically with regards the corals on the Great Barrier Reef what they said was quite a stretch of the truth. BTW not one of the three panelists was a marine biologist which I’m sure was not by accident.
He was just showing the actual RSS numbers.
Is everyone at Remote Sensing Services pathological liars as well?
Or perhaps it’s the people using Mike’s nature “trick” to hide the decline.
Hi John B,
Well if Monckton is your source, and cherry picking is your game, I really won’t waste my time.
Hi John B,
You have heard of cherry picking I assume.
1998 was an unusally warm year, so Monckton picks a year near this to get the result he is looking for.
If we look at the past 25 years (1989 to 2014) we get a 1.42 C rise per century, using NOAA Land Ocean Data.
That’s still no explanation as to why there has been no warming for the past 18 years.
According to the AGW theory, the warming should have increased. And that’s what is show in the models.
Sure, you like to criticize Monckton because he looks funny. But he’s using RSS numbers. You can see those same numbers on the RSS website.
http://images.remss.com/msu/msu_time_series.html
Cytochrome, from your link:
“If El Niño is present this fall, it increases the odds that we will have a quiet Atlantic hurricane season. El Niño typically brings high wind shear to the tropical Atlantic, disrupting hurricanes and tropical storms as they try to form or intensify. Conversely, El Niño favors a more active than usual Eastern Pacific hurricane season, by lowering wind shear there and increasing water temperatures. If we get a strong El Niño this winter, it would increase the odds of breaking California’s streak of four consecutive dry winters, and put a decent dent in their crippling drought”
When I saw the temperature graph, and considered the ongoing weak El Niño conditions, I started to wonder if we may not see California get more rain, and temperature stay on the high side without hitting that really bad peak seen in 1998.
This climate issue could have a heavy impact on politics. It usually brings drought to Venezuela, and the country is already unstable. A drought will cause more power cuts, and this in turn could cause unrest and more oil productin drops.
For USA politics, if Obama doesn’t have some sort of weather event he can blame on climate change he’s not going to get much traction with the U.S. public. I thought the California drought story came in very handy, but if it starts raining he’s in a tight spot.
It really would be a terrible thing if we tried to prepare for a future with less fossil fuels 🙂
When the peak arrives we will just snap our fingers and presto scarce fossil fuels will be no problem at all. The solution to both peak fossil fuels and climate change are very similar.
By 2025 or sooner fossil fuels will become very expensive or they will be very scarce, we will wish we had taken action in 2015 on moving away from fossil fuels at that point.
“When the peak arrives we will just snap our fingers and presto scarce fossil fuels will be no problem at all.”
~Dennis Coyne 🙂
Good one Dennis.
The point of that comment is that we need to try to act now, to mitigate the coming peak. Nothing magical will happen and it will be very difficult to make the changes needed to avoid collapse.
I do not expect business as usual, I expect very difficult times, likely a Great Depression. There are a lot of possibilities between Business as usual and collapse, I expect over time some new paradigm may emerge, what this will look like I cannot foresee. Though perhaps others could give us their detailed vision of the future that they are certain will occur.
Dennis,
During the Greater Depression that you expect, the cost of oil production is not going to fall. It will just keep rising. An oil price that supports current production as well as investment in future production is now over $100 per barrel.
That means the oil industry will begin to shrink rapidly. So will the economy. This will lead to even less oil production.
This will lead to less economy, which will lead to lower oil production, which will lead to less economy, which will lead to lower oil production, which will lead to less economy, which will lead to lower oil production, which will lead to less economy, which will lead to lower oil production, which will lead to less economy, which will lead to lower oil production, which will lead to less economy, which will lead to lower oil production, which will lead to less economy, which will lead to lower oil production, which will lead to less economy, which will lead to lower oil production, which will lead to less economy, which will lead to lower oil production, which will lead to less economy, which will lead to lower oil production, which will lead to less economy, which will lead to lower oil production, which will lead to less economy, which will lead to lower oil production, which will lead to less economy, which will lead to lower oil production, which will lead to less economy, which will lead to lower oil production, which will lead to carpal tunnel syndrome, and so on.
How will we ever recover from the Greater Depression?
The point of that comment is that we need to try to act now, to mitigate the coming peak.
In all seriousness Dennis, do you really believe crying, “help, help, peak oil is coming, act now or there will be hell to pay”, will help? Do you really think anyone is going to take action to mitigate peak oil?
That is just not how human nature works Dennis.
Ron,
Dennis hopes the invisible hand will pick up the check.
Hi Ron,
It will change nothing, change will occur after the crisis, though a few reading this blog could make individual changes and inspire those around them to do the same.
That won’t be enough though. A crisis will lead to more rapid changes, some bad, some good. As you have said before to expect only good changes makes no sense.
Though some people seem to think that assuming only bad things can happen due to social change makes perfect sense. 🙂
“Though some people seem to think that assuming only bad things can happen due to social change makes perfect sense.” 🙂
~Dennis Coyne
We are not about to experience your run of the mill period of social change. We are about to experience social collapse. Big difference, Dennis.
Why do you insist upon downplaying the seriousness of the situation?
It sounds a lot like denial to me, but I don’t want to get in trouble for having bad manners, so I will just keep that one to myself. 🙂
By 2025 or sooner fossil fuels will become very expensive or they will be very scarce, we will wish we had taken action in 2015 on moving away from fossil fuels at that point.
I wish we’d avoid talking about climate in this forum because it triggers canned responses from certain groups.
If we focus on the economics of fossil fuels, we are still going to address a world with less fossil fuel consumption in the future but maybe the trolls will leave this forum alone.
Conventional oil production already peaked in 2005. Nobody noticed.
Hi JohnB,
Eventually a peak in energy available in liquid fuels will be reached, probably between now and 2020.
The price of liquid fuels will increase and perhaps they will increase enough that people will make different choices (smaller cars, hybrids, EVs, rail, light rail, biking, walking, and moving to more densely populated areas where less transportation may be needed). This is indeed the invisible hand and although it does not pick up the check, it allocates resources very efficiently, especially when the government taxes externalities. The peak will occur due to the interaction of supply and demand in the face of a diminishing resource.
“The price of liquid fuels will increase…”
Shouldn’t you say may increase? Or could increase? Or might someday increase?
You have to admit there is at least some chance that I am right, yet you still stay spot on message.
Why is that, Dennis? You said you are not being paid to do this. So, what does a good scientist do when new information comes along that forces him to rethink his long held stance?
You said that you admit when you are wrong.
Please do the right thing here and admit there may be at least some doubt about the certainty of your forecast. Thank you.
Hi Dennis,
Perhaps people are already making different choices? Less oil fired electricity, less home heating oil, and more transport alternatives.
And because of this, oil demand is not what it would otherwise be. And this lack of new demand is causing oil prices to go lower.
BTW, I’m serious about 2005 being the peak. Go back and look at the data, and minus out tight oil production.
John B,
“Conventional oil production already peaked in 2005. Nobody noticed.”
It’s like déjà vu all over again.
Last time you made this knee jerk comment I mentioned something about the bursting of the housing bubble, the 2008 oil spike, the stock market crash, the Great Recession and all that stuff that I am pretty sure people noticed.
Do you have a database for your comments like the one above? I have to type new answers each time.
All of those things you mentioned have happened before, and they’ll probably happen again. Nothing to do with Peak Oil.
John,
Those things had everything to do with peak oil. Everything, especially the economy, depends upon energy. That’s just physics.
Energy is cheaper, and more abundant than it has ever been in the history of civilization.
Furthermore, energy in the future will be even cheaper, and more abundant than it is now.
That’s just reality.
Yes, too cheap.
Read this to understand:
http://www.thehillsgroup.org/depletion2_022.htm
Production above the 2012 time frame must have a negative overall impact on the economy. Whereas, production increases before 2012 added to overall economic activity, production increases after 2012 reduce it. That reduction is now equal to $219/ barrel when production is above the 2012 level.
So every barrel of oil produced after 2012 has taken $219 out of the economy?
Who wrote this, Charles Manson?
Argument from astonishment.
Do you understand the physics?
John, I noticed. Oil prices went up, and my company increased the oil price forecast we were using. By 2005 it was 2.5x what it was in 1999. I recall very well because we had made a large property purchase and some of us felt it was a bad idea. But management came out looking like geniuses, and we were able to convert goodwill in the books to real assets. It was also noticeable because we started getting really nice bonuses. I bought a light saber with the Kung fu grip for my son that Xmas.
It really would be a terrible thing if we tried to prepare for a future with less fossil fuels 🙂
Especially if we unnecessarily built a better world while we were at it… Now THAT would be really horrible!
Thanks Fred.
You do realize that all change is bad, right? 🙂
Check what has happened recently.
http://tropic.ssec.wisc.edu/real-time/mimic-tpw/global2/anim/latest72hrs.gif
If this continues a scary amount of stored heat will be released.
Explains why we had an unseasonal 10″ rainstorm dump.
NAOM
No big deal. A Kelvin wave swings from just off Papua New Guinea and heads east towards Peru and Ecuador. The warmer water hits the surface, and that heats the air. It’s a subtle effect, but it’s a huge amount of water. The last two times we saw very strong effects were 1998 and 2010. We started seeing the Kelvin waves in 2014, but they have been erratic. If they do become stronger and the wind shifts it will start raining in California. And Venezuela will have drought.
“tight spot”? How do you figure? He isn’t going to be trying to pass any legislation in the next 18 months with this clown car of a congress. Why would he give two shits what the public thinks anymore. All he has to do is what he thinks is right and ride this fucked up job out until it is over.
According to my evangelical Republican friends, God gave man dominion over the the earth, and only God can destroy the earth, through climate changes and such. Therefore, Godless Democrats have a completely irrational fear in their climate change paranoia.
Europe just opened. Giving it all back. Oil down big, 43.33 as the Euro and cable both also give it all back, both down huge (and dollar thus up).
Crude’s price action has turned bullish. Might not look that way at first glance at the chart but the two previous days starting with the low that was made formed a bullish kicking candlestick formation which is a highly bullish reversal candlestick formation. Crude has given a little of those gains back today but some sort of a low is in here. Short-term i’d look higher. Dollar movement looks like consolidation of yesterday’s move. Look for weaker dollar ahead.
Slightly edited version of my Then & Now comparison:
Big diff was the Brent spread entity that wasn’t so discrete in 08/9, probably derived from diesel-rich Libya going offline.
Watcher, I was just over at ZH seen a post where they said Kuwait something, something, something of another,oil price just hit the 42 handle. I am looking at my trading platforms and oil is sitting at 45.37 and the low of the day is 44.77 there is an occasional gem over there but some of the stuff they post is complete BS.
Now it’s at 45.92 and about to hit the 46 handle.
Whaaa? I’m seeing $43.28, meaning 29 pennies ago it was at a 42 handle, as the article says.
Can you guys get your quotes aligned please? Thanks ‘u^
Thats interesting. All trading platforms should be the same on quoted price as they are highly regulated. The one i was looking at this morning is run through a fairly large US bank.
Whats even more interesting is i have more than one platform telling me the same thing.
Well, this is not a trading site, nor is ZH.
The numbers on cnbc, marketwatch, and an outright article on marketwatch (a WSJ product last I looked) , says $43.xx.
We obsess over price here for reasons other than trading. Given that preface, however, I have seen that sort of discontinuity before and it’s usually someone picking a different month.
Yeah i know it not a trading site. But trading platforms can give you a update by the minute or second as to what oil price is doing or what any of the markets are doing. I pay more attention to Daily and Weekly charts. If you know what to look for you can spot turns in price that are not always evident. There are a lot of players in the oil market and it’s impossible to know what everyone is doing and thinking. So if you understand what price action is telling you. You can figure out which way things are headed without knowing everything thats going on. I come to sites like this to learn as much technical information about the oil business as i can which i still feel like i know little about and to keep up with global oil production and the progress of peak oil itself. As far as trading goes i’d be very careful leaving money in any market once peak oils otherside hits. Which is another thing i see that should start to happen. People will start pulling their money out of everything they’ve got it invested in when oil starts to get scarce.
If you want free access to up to the minute charts go to TD Ameritrade open and account and download their trading platform ” thinkorswim” you don’t ever have to deposit any money or make any trades and the platform is free.
No collapse yet.
All of those oil workers working those oil jobs in the oil fields don’t want to lose their jobs, so they go to work each day. They are drilling for oil and hauling pumped oil right now. That’s what they’re doing day after day. The wells are there, the oil is there and it will be moved to a refinery then to tank farms. The BNSF has a knack for hauling oil hundreds of miles to places where it can be refined. It means jobs all over the place, not just in the oil fields.
Farmers are going to be buying diesel fuel real soon and then the draw down of the oil inventories will begin. They’ll need diesel in the trucks to haul seed to the field to fill the air seeders and drills to plant crops. The anhydrous ammonia plants are manufacturing anhydrous for field application. Monsanto is selling Roundup by the ton. It is going to happen within the next sixty to ninety days and nothing is going to stop it. John Deere and Caterpillar won’t shut the factories.
Collapse will have to wait until after harvest. Whatever the charts might forecast doesn’t matter for now.
Collapse will have to wait until after harvest.
No worries! Collapse is patient…
The world is becoming one giant Catch-22.
Brazil & Iraq, Remember When?
Circa 2009, the Iraqi Oil Ministry claimed that Iraq could hit 12 mbpd of production within about seven years, and following is a graph prepared by Stuart Staniford, showing a simple extrapolation that would put Iraq’s oil production at 12 mbpd by 2016. In 2014, based on the projection, they would be at about 9.6 mbpd.
Iraq’s actual production in 2014 was probably about 3.3 mbpd (total petroleum liquids).
http://3.bp.blogspot.com/_D9-JNTtRKgs/S0AwzBBUVqI/AAAAAAAAAMg/I9C6ykZfByY/s1600-h/Picture%20117.png
And following is an April, 2009 Bloomberg column talking about Brazil’s projected rising oil production “Taking market share away from OPEC.” In reality, Brazil is a net oil importer, with a recent track record of increasing net imports, even if we count biofuels as production. In 2009, Brazil’s production was basically equal to production, but by 2013 their net imports had increased to 0.4 mbpd.
Iraq’s net exports increased from 1.8 mbpd in 2009 to 2.3 mbpd in 2013 (total petroleum liquids + other liquids, EIA). So, the combined increase in net exports from Brazil + Iraq from 2009 to 2013 pretty much rounds to zero (0.1 mbpd).
Also, in regard to the April, 2009 Bloomberg column and the following quote from said column, “As OPEC nations make their biggest oil production cuts on record, Brazil, Russia and the U.S. are pumping more, threatening to send crude back below $50 a barrel as demand slows,” monthly Brent crude oil prices were then in the process of rising at 43%/year, from December, 2008 to February, 2011.
April, 2009: OPEC Cuts Thwarted as Brazil, Russia Grab U.S. Market
http://www.bloomberg.com/apps/news?pid=newsarchive&sid=aiSCDyK4CWmI&refer=news
Jeffrey,
In reality, Brazil is a net oil importer, with a recent track record of increasing net imports, even if we count biofuels as production. In 2009, Brazil’s production was basically equal to production, but by 2013 their net imports had increased to 0.4 mbpd.
I think Brazil is a perfect example of a country in the beginning stages of economic turmoil due to the consequences of your ELM theory.
Ironically I was talking to some well connected Brazilians last week and it looks like Brazil is really going to do some serious investing in solar and wind, even though the vested interests in oil are still all officially anti renewables. However the smart money has seen the writing on the wall so to speak.
There is going to be a sea change in the near future.
http://money.cnn.com/2015/03/17/news/economy/brazil-protests-economy-commodity-collapse/
Brazil’s economy is running on empty.
Over a million Brazilians protested in the streets Sunday, calling for the impeachment of President Dilma Rousseff.
A massive corruption case involving the president helped spark the protests, but Brazilians also marched out of frustration that Brazil’s economic boom is over.
South America’s largest economy was last decade’s emerging market darling. Now it’s edging toward recession and its currency is losing value quickly. The corruption scandal and economic collapse are creating a perfect storm for public unrest.
Circa 2009, the Iraqi Oil Ministry claimed that Iraq could hit 12 mbpd of production within about seven years
This is modest.
I specifically recall a guy designated as Iraq’s oil minister claiming Iraq would do 17 mbpd by 2020.
That . . . was reduced.
Some interesting EPA and Shale data:
http://truth-out.org/news/item/29714-internal-documents-reveal-extensive-industry-influence-over-epa-s-national-fracking-study
As usual, we have some dirty hands.
Typical truth out material. They write as if Chesapeake were the oil industry leaders in 2010.
Fernando—
This is a article about influencing data put out by the EPA, not an analysis as to the size of energy companies.
Yes cyto. The problem with the logic is that Chesapeake isn’t exactly that influential. It’s typical Truthout bs.
As usual, we have some dirty hands.
It is shortsighted for the industry to limit the amount of data collected on fracking. It’s the lack of transparency that is driving a lot of the opposition to fracking. So if the industry continues down this route, it will generate more opposition.
When fracking starts moving close to or within suburban developments, and home owners gain no benefit in living next to industrial sites, there is going to be a push back. Trying to hide numbers from them is not going to work.
Wait a minute.
If fracking moves to suburban areas it will be uneconomic, as it is now. And so if it moves there it will be as a result of desperation to have oil, even low on diesel oil.
And if that desperation exists, then pollution doesn’t matter, breadth of study doesn’t matter, none of that stuff matters.
If you HAVE to have it, you HAVE to have it and nothing else can trump it.
If fracking moves to suburban areas it will be uneconomic, as it is now.
Exactly. And I am hoping that some projects will have been killed permanently because of current economic realities.
And so if it moves there it will be as a result of desperation to have oil, even low on diesel oil.
Right again. If we are hitting such a great wall that we have to squeeze oil out of places where there isn’t so much oil there to begin with, then we do have bigger problems to address.
And if that desperation exists, then pollution doesn’t matter, breadth of study doesn’t matter, none of that stuff matters.
If you HAVE to have it, you HAVE to have it and nothing else can trump it.
http://www.asam.org/for-the-public/definition-of-addiction
Definition of Addiction
Public Policy Statement: Definition of Addiction
Short Definition of Addiction:
Addiction is a primary, chronic disease of brain reward, motivation, memory and related circuitry. Dysfunction in these circuits leads to characteristic biological, psychological, social and spiritual manifestations. This is reflected in an individual pathologically pursuing reward and/or relief by substance use and other behaviors.
Addiction is characterized by inability to consistently abstain, impairment in behavioral control, craving, diminished recognition of significant problems with one’s behaviors and interpersonal relationships, and a dysfunctional emotional response. Like other chronic diseases, addiction often involves cycles of relapse and remission. Without treatment or engagement in recovery activities, addiction is progressive and can result in disability or premature death.
Edit: I think a lot of people are still in deep denial of their addiction and perhaps that can at least partly explain some of the emotional responses on this site…
Be very, very careful what you put into that head,
because you will never, ever get it out.
Thomas Cardinal Wolsey (1471-1530)
Not quite.
“Be very, very careful what you put into that head,
because you will never, ever get it out.”
~Attributed to Cardinal Wolsey by columnist George Will, a line that he says was “uttered about Henry VIII”, as quoted in William A. Henry In Defense of Elitism (Anchor Books, 1995), p. 45
Are you a defender of elitism, cytochrome C?
Far from it.
I was just pointing out that it might not be wise to believe everything you think.
cytochrome C,
How in the hell did you happen upon the quote you posted? It was never actually said by Thomas Cardinal Wolsey. That is a misattribution. It is actually a quote by George Will. George Will is a well known defender of the elite. Most people who aren’t defenders of the elite would never have heard of this quote, but you have. Then you use it to make the same point as George Will does about knowing stuff.
And you aren’t a defender of the elite? For some reason, I don’t believe you.
Hi Fred.
We are all addicted to oil and perpetual growth.
This collective addiction produces an effect on society as a whole that is analogous to the effect of addiction on an individual.
[Our collective addiction to oil and perpetual growth] is characterized by inability to consistently abstain, impairment in behavioral control, craving, diminished recognition of significant problems [and a] dysfunctional response. Like other chronic diseases, addiction often involves cycles of relapse and remission. Without treatment or engagement in recovery activities, addiction is progressive and can result in disability or [the] premature death [of civilization].
~Fred Magyar and Futilitist
Notice:
There will be a new post out later this evening if the Texas RRC data comes in today. Otherwise there will be a new post tomorrow evening regardless of whether it comes in or not.
Ron
Ron,
Are you familiar with the site Real Climate? It has a section called The Bore Hole:
“For comments that would disrupt otherwise sensible conversations.”
Came to mind; I can’t think why.
No, I am not familiar with it. I don’t read much climate stuff. I know it is very serious but I don’t see anything really happening to change things. Lots to talk about though. But I have no patience with folks who say it is a hoax and blame the communists, or the democrats, or whoever their favorite bogyman is.
Synapsid,
We don’t need to compartmentalize. That is just institutionalized denial. The climate change people on both sides of the debate will soon come to understand that they are just having a symbolic, fetishized, ritualized emotional struggle with each other (and themselves) to avoid talking about what both really fear. Collapse.
The great collective unconscious is a morally schizophrenic hall of mirrors. It is an ultra massive denial machine on steroids.
Best climate site there is, from a scientific standpoint.
They just needed to throw out the trash.
cytochrome C
I think that was Synapsid’s point. But here on the Ron’s site?
Not here.
And it is often a reminder of where we are, culturally and educationally.
The Chinese government announces plans to build 18 GW of solar power in 2015.
In 2014, China had a plan to install 14 GW of solar power but only 10 GW was completed
China – which is already Venezuela’s biggest creditor with over $50 billion loaned since 2007 – as Reuters reports, is said to plan on signing another $5bn loan to Venezuela for “wide-ranging” projects like “mature oil fields.”
The chinese aren’t owed $50 billion. They get paid back with oil, using a special loan structure to make their loans senior to sovereign bonds.
The Chinese realize Maduro is desperate, and he’s an imbecile surrounded by thugs and mentored by the Castro family dictatorship. This means they give lip service, but little cash.
As far as I know Maduro has been selling gold bars, and the contracts for loans chavez gave to latin Anerican and Caribbean countries to buy indifference as they went into dictatorship mode.
Gail in China http://ourfiniteworld.com/2015/03/21/first-report-from-gail-in-china/
I wonder what they will make of her lectures.
I don’t agree with her premise that without economic growth the world collapses, but if they take the peak oil/collapse scenario seriously and plan accordingly, their petroleum engineers will likely be in a different place than petroleum engineers in other parts of the world.
I suppose the logical consequence of her advice is that one might as well pump out the oil like crazy because slowing growth won’t help you anyway. Pump fast, die young.
Or maybe they will plan on taking advantage of the collapse in countries dependent on oil income.
Whoever takes her advice will be very sorry.
Her ideas are astonishingly unrealistic.
#21963 – HRC OPERATING, LLC, FORT BERTHOLD 148-95-26A-35-2H, SESE 23-148N-95W, DUNN
CO., 4447 BOPD, 2215 BWPD – BAKKEN
4447 barrels of oil per day, that’s what it says.
Today’s daily activity report
Hi Ronald,
That is the first 24 hours of output, which is usually pretty high. The more important number is the first 30 days of output.
Even though the oil stats are dismal and the oil stocks are looking bleak, the real estate market is not looking too shabby for the Bakken Formation outlook.
Picks and shovels, the goods sell, even if there is no gold. Somehow, it looks like there really is some gold, black gold, much to the chagrin of the peak oil denizens.
The higher the initial rate the steeper the decline. Keep an eye on that well and it’ll oribaably produce within 20 % of the average well within 10 mile radius.
Dawn Paley: Drug War a Pretense to Expand Transnational Capitalism Southward
That form of capitalism began with the British East India Company, the Opium Wars were the result.
Been going on for hundreds of years. Dawn Paley is late to the party.
Dawn Paley is late to the party.
Yes, now the focus is on legalizing marijuana which is generating a healthy amount of tax revenues for the states that already have.
I’ll grant hundreds of years, though the British were perhaps not the first to that particular party, the Dutch and Portuguese before them making something of a stir in the Indian Ocean (“Pepper”, Marjorie Shaffer), or the Viennese in the Mediterranean (“Salt”, Mark Kurlansky).
Tee hee hee
Oh sure, but maybe it’s not for some of us then…
I tend to agree with/appreciate most, if not all of the comments from the likes of BC, TechGuy, Strummer, thrig and Ron, et al., and so, at least with regard to responding, tend to ignore them.
(When I have some leisure time, sometimes I like to indulge in junk food, sometimes to ill effect.)
…Maybe the book sort of collates it all together, though, into some kind of one-stop, here-just-read-this, shop.
A couple of quotes, in closing, for dn_girl, Gert, shallow sand, toolpush and Mike (et al.):
“The more you can increase fear of drugs and crime, welfare mothers, immigrants and aliens, the more you control all the people.” ~ Noam Chomsky
“People who dismiss the unemployed and dependent as ‘parasites’ fail to understand economics and parasitism. A successful parasite is one that is not recognized by its host, one that can make its host work for it without appearing as a burden. Such is the ruling class in a capitalistic society.” ~ Jason Read
…Ok one more:
“Tee hee hee” ~ Fernando
The bis have a new quarterly report out, with a special section on oil and debt: http://www.bis.org/publ/qtrpdf/r_qt1503.pdf
Nicely summarised in this article:
http://www.bloombergview.com/articles/2015-03-18/why-shale-producers-still-pump-and-pray-
Hi Sam,
I don’t think the article is correct when it says companies are going back to refrack old wells, there is not a lot of evidence of this. They are probably drilling fewer wells (due to fewer operating rigs) and are fracking some of the wells they have already drilled to try to remain cash flow positive (or less negative). At some point companies start to fail and output will decrease, unless oil prices rise.
No collapse overnight, so all is well so far today.
I spent some time reading this, a recommended reading.
Update on Greece:
http://www.nytimes.com/2015/03/19/business/international/warnings-raised-of-a-greek-exit-from-the-euro.html?mabReward=R7&action=click&pgtype=Homepage®ion=CColumn&module=Recommendation&src=rechp&WT.nav=RecEngine
Greece imports most of it’s oil and from my understanding oil is what they use the most in their energy mix. If there is a greek exit from the Euro Greece will have to print their own currency which will be 40-50% more worthless than the Euro. They won’t be able to import anywhere near as much oil as what they are currently importing. Greece will become a failed state if they leave or get kicked out. Staying in isn’t really all that appealing for them either.
We covered this a week or two ago. Greece has geography that permits GAZPROM to get a pipeline from Southstream 2.0 (Turkey rather than Bulgaria) out of Turkey and north through some non EU countries (and thus the EU can’t stop them) to the heavily dependent EU countries (whose pipelines would not be built by GAZPROM anyway). Greece could collect transit fee for the gas and probably an upfront lump sum for permission to route the pipeline from Turkey into Greece and then north. It doesn’t get very cold in Greece so there will never be a Ukraine theft issue. The gas will transit, Greece will get paid.
They burn about 350K bpd of the good stuff. Russia can throw a discounted supply into the deal.
Never ever forget, as way too many on this blog do too often. Concerns about how much or how many whimsically printed pieces of paper flow this way or that way get trumped when the focus becomes defeat of your enemies.
Correct me if i am wrong but i believe the deal that Russia and China signed insured that the volume of gas to be exported to China after pipeline is completed would effectively stop all exports of gas to Europe. So unless Russia can produce more gas than they are currently producing. Europe is SOL and if no pipeline can be built through Syria they are double SOL and out of gas.
Think that’s wrong, but it’s worth a recheck. The volume going to China would reduce Europe flow, but my recall is not even by 50%. Going to recheck. It should not be so . . . there would have been no Southstream if it was so, and Southstream got GAZPROM investment.
Say It’s reduced by only 25%. Thats a big deal if your a European country that can’t replace that energy resource somewhere else.
We’ve speculated on this. Offer more Euros? Russia says not interested in pieces of paper.
The extra cost will be non monetary. Disarm. Send young people to wash Russian toilets.
It’s wrong. Check the number of pipelines needed to move that gas to Hebei. I prepared a conceptual plan to move 3 BCFD to Jilin and THAT barely put a dent on the West bound supply.
ZH has an article up about shale companies apparently unable to borrow and are doing 2ndary offerings and diluting shareholders.
This is not all that unusual when there are too many low-equity executives on a Board and too few independent Board members. The executives want salary to flow, don’t care much about dilution, and that doesn’t happen if a fiduciary conscious board chooses bankruptcy.
There is some danger, usually, of triggering equity expansion covenants, but those are more rare than others. Also a tad odd, the article says the dilution generated cash will be used to retire debt. That certainly addresses certain covenants, but I don’t quite see how that funds more drilling. If they were using the cash to drill, then it funds drilling. Using it to retire debt when new debt is scarce . . . I don’t see how that funds drilling.
I appreciate all the minute calculations done on this site for various TO regions of the US, but for me, this chart tells the story.
Interior Department Releases Final Rule to Support Safe, Responsible Hydraulic Fracturing Activities on Public and Tribal Lands
Key components of the rule, which will take effect in 90 days include:
• Provisions for ensuring the protection of groundwater supplies by requiring a validation of well integrity and strong cement barriers between the wellbore and water zones through which the wellbore passes;
• Increased transparency by requiring companies to publicly disclose chemicals used in hydraulic fracturing to the Bureau of Land Management through the website FracFocus, within 30 days of completing fracturing operations;
• Higher standards for interim storage of recovered waste fluids from hydraulic fracturing to mitigate risks to air, water and wildlife;
• Measures to lower the risk of cross-well contamination with chemicals and fluids used in the fracturing operation, by requiring companies to submit more detailed information on the geology, depth, and location of preexisting wells to afford the BLM an opportunity to better evaluate and manage unique site characteristics.
http://www.blm.gov/wo/st/en/info/newsroom/2015/march/nr_03_20_2015.html
No big deal. They missed some points I would have included.
There have been quite a few comments about fossil fuel subsidies. I haven’t dug into the IEA database, but their intro statement is astounding to me.
“The IEA, within the framework of the World Energy Outlook, has been measuring fossil-fuel subsidies in a systematic and regular fashion for more than a decade. Its analysis is aimed at demonstrating the impact of fossil-fuel subsidy removal for energy markets, climate change and government budgets. The IEA’s latest estimates indicate that fossil-fuel consumption subsidies worldwide amounted to $548 billion in 2013, $25 billion down on the previous year, in part due to the drop in international energy prices, with subsidies to oil products representing over half of the total. Those subsidies were over four-times the value of subsidies to renewable energy and more than four times the amount invested globally in improving energy efficiency.”
http://www.worldenergyoutlook.org/resources/energysubsidies/
The problem with that statement starts when one breaks down the numbers. Venezuela sells about 500 thousand barrels of gasoline and diesel at about 1% of the international price.
If we add the cheap natural gas, they alone account for $20 billion USD. I bet OPEC and Former Soviet Union subsidies alone are $300 billion if we add all fossil fuels.
Today on C-Span 2. Right of Boom. If it is a dirty bomb there will probably be unwarranted radiation hysteria. http://www.c-span.org/video/?323979-1/book-discussion-right-boom
[…] mensile di marzo dell’OPEC, il solito mattoncino di oltre 100 pagine sul mercato petrolifero. Ron Patterson riassume per noi in forma grafica la produzione dei paesi OPEC, e fa alcune considerazioni sulle […]