EIA Short Term Energy Outlook and Tight Oil Update, November 2023

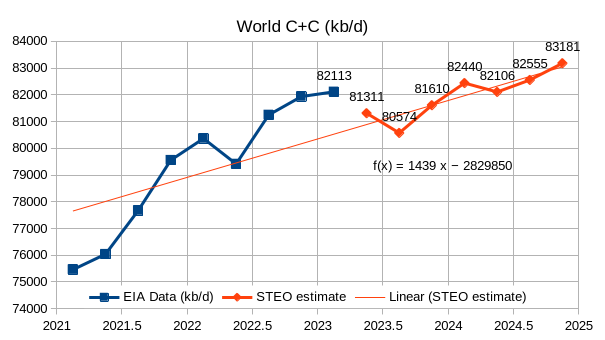
The EIA’s Short Term Energy Outlook (STEO) was published in early November. The chart below estimates World C+C by using the STEO forecast combined with past data from the EIA on World Output.

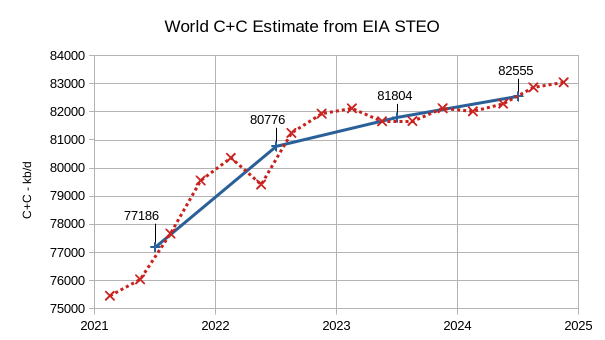
The EIA’s Short Term Energy Outlook (STEO) was revised lower in November compared to September (we skipped the October STEO). World C+C output is expected to decrease in the 2nd and 3rd quarters of 2023 and then increase over the next 5 quarters. Annual average World C+C output increases by about 1028 kb/d Mb/d in 2023 to 81804 kb/d and then to 82555 kb/d in 2024, about 445 kb/d below the centered 12 month average peak in 2018. This month’s World C+C estimates are about 400 kb/d lower than September’s estimate for 2023 and 1150 kb/d lower for 2024 due to the revisions in the STEO forecast since Sept 2023.

Read More

STEO and Tight Oil Update, July 2023

The EIA’s Short Term Energy Outlook (STEO) was published in early July. The chart below estimates World C+C by using the STEO forecast combined with past data from the EIA on World Output.

This month we have actual EIA data for 2023Q1 which increases the annual rate of increase for the forecast period compared to last month by 600 kb/d, part of the reason is an 800 kb/d forecasted drop in output from Q1 to Q2 of 2023. If we use the 2023Q1 to 2024Q4 trend the annual rate of increase is 911 kb/d, about a 100 kb/d increase from last month’s estimate. The trend from 2022Q1 to 2024Q4 is similar at about 916 kb/d. If this forecast through 2024Q4 is roughly correct, I expect increases in output after 2024 will be considerably lower, I also think this STEO forecast is optimistic. Annual average output in 2022 was 80.74 Mb/d and increases to 81.4 Mb/d in 2023 and to 82.6 Mb/d in 2024. These annual averages are 0.25 Mb/d less in 2023 and similar for 2024 as last month’s estimates.

Read More

Future Decline Rate of World Oil Output

A conservative model of future World Crude plus Condensate (C+C) output is presented below with an average decline rate of 2.8% from 2040 to 2110. From 1933 to 1972 World C+C output increased at an average annual rate of about 7.8% and after the oil shocks in the 1970s and 1980s from 1983 to 2016 output increased at 1.2%/year on average. The decrease in the rate of change in World output was 6.5% between the high growth period up to 1972 and the slower growth period up to 2016. My model projects continued 1.2% average annual growth in C+C output from 2022 to 2029 when the final peak in output is projected. The annual rate of decline gradually increases to above 2.5% by 2039 and is followed by steady decline at 2.8% for the next 70 years. The decrease in the rate of change in output from the earlier period from 1983 to 2029 (about 1.2%) to the period after 2039 is 4%. Chart has a log vertical axis to indicate rates of change in output.

Figure 1
Read More

The Oil Shock Model and Compartmental Models

The coronavirus pandemic and the global oil economy

Chapter 5 of our book Mathematical Geoenergy describes a model of the production of oil based on discoveries followed by a sequence of lags relating to decisions made and physical constraints governing the flow of that oil. As it turns out, this so-named Oil Shock Model is mathematically similar to the compartmental models used to model contagion growth in epidemiology, pharmaceutical/drug deliver systems, and other applications as demonstrated in Appendix E of the book.

One aspect of the 2020 pandemic is that everyone with any math acumen is becoming aware of contagion models such as the SIR compartmental model, where S I R stands for Susceptible, Infectious, and Recovered individuals. The Infectious part of the time progression within a population resembles a bell curve that peaks at a particular point indicating maximum contagiousness. The hope is that this either peaks quickly or that it doesn’t peak at too high a level.

Read More

Oil Shock Model Scenarios

Many different oil shock model scenarios have been presented over time at Peak Oil Barrel. Information on the Oil Shock Model, originally developed by Paul Pukite can be found in Mathematical Geoenergy. The future is unknown, so future extraction rates from conventional (excludes tight oil and extra heavy oil) oil producing reserves are unknown. Also not known are future oil prices which will affect the amount of tight oil and extra heavy oil that is ultimately produced.

For tight oil I have created three scenarios corresponding to a low, medium and high oil price scenario. Likewise I have created three scenarios for extra heavy oil which correspond to the same low to high price scenarios used for the tight oil scenarios.

The mean estimates by the United States Geological Survey (USGS) for technically recoverable resources in tight oil plays combined with reasonable economic assumptions and data gathered from www.shaleprofile.com are used to model tight oil output. The EIA’s AEO 2018 reference oil price scenario is used for the high oil price case and the low scenario uses the AEO reference price case up to the date when it reaches $70/b in 2017$ and assumes oil prices remain at $70/b for all future dates. The medium oil price scenario is the average of the low and high price cases.
chart/

Read More