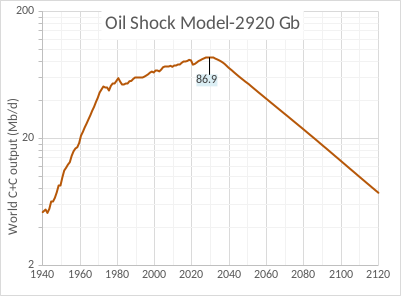
A conservative model of future World Crude plus Condensate (C+C) output is presented below with an average decline rate of 2.8% from 2040 to 2110. From 1933 to 1972 World C+C output increased at an average annual rate of about 7.8% and after the oil shocks in the 1970s and 1980s from 1983 to 2016 output increased at 1.2%/year on average. The decrease in the rate of change in World output was 6.5% between the high growth period up to 1972 and the slower growth period up to 2016. My model projects continued 1.2% average annual growth in C+C output from 2022 to 2029 when the final peak in output is projected. The annual rate of decline gradually increases to above 2.5% by 2039 and is followed by steady decline at 2.8% for the next 70 years. The decrease in the rate of change in output from the earlier period from 1983 to 2029 (about 1.2%) to the period after 2039 is 4%. Chart has a log vertical axis to indicate rates of change in output.
The chart below shows how this output is divided between conventional and unconventional oil, where unconventional oil consists of US light tight oil (LTO) and extra heavy (XH) oil from Canadian oil sands and Venezuelan Orinoco Belt.
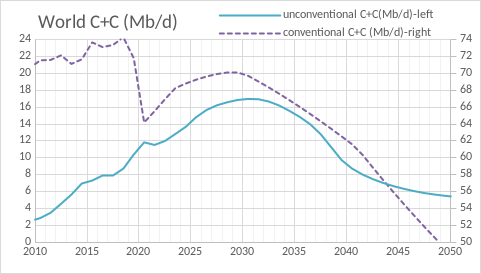
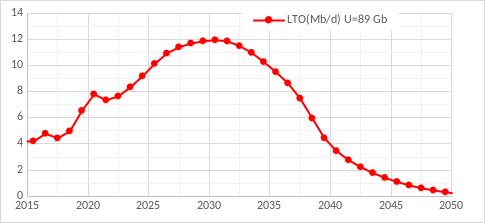
The extra heavy oil projection up to 2050 uses the Canadian Energy Regulator current policies scenario and assumes Orinoco output remains steady at 100 kb/d each year, after 2050 XH oil is assumed to decrease by 5% annually. The tight oil scenario has been revised to reflect expected Brent oil prices to remain high ($100/bo in 2021 $) until 2040 which leads to an increase in URR, previously I expected oil prices to decrease in 2030. The new tight oil scenario has a URR of 89 Gb compared to the previous scenario with a URR of 74 Gb, most of the difference is higher output after 2030.
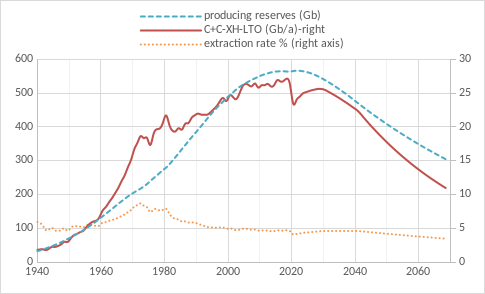
For the chart below I show the extraction rate on the right axis which applies only to conventional oil, but the Oil output shown includes both conventional and unconventional oil.
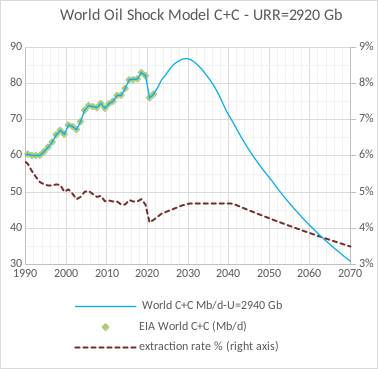
The chart below shows conventional output (C+C-XH-LTO) in Gb/year and the extraction rate on the right axis and producing reserves on the left axis in Gb at the end of a given year. Output is the producing reserves at the end of last year times the average annual extraction rate in the current year. Notice that producing reserves have been increasing from 1940 to 2017, they dipped a bit in 2018 and 2019 and then increased due to the low extraction rates in 2020 and 2021, the projection has the peak in producing reserves in 2021, these producing reserves represent conventional oil only, unconventional oil is modeled separately.
Some of the data for this model is in the spreadsheet linked here, the new reserves column comes from the oil shock model using a discovery model with 2750 Gb of conventional oil URR.
269 responses to “Future Decline Rate of World Oil Output”
The oil market is set to tighten rapidly as winter approaches and prices are still on track to top $120 a barrel, energy expert says Bold mine.
The oil market has eased up in recent weeks – but supplies will tighten up rapidly as winter approaches, said Energy Aspects director Amrita Sen, warning that prices could still be on track to top $120 a barrel by the end of the year.
Oil prices fell below $90 a barrel in the last week, and Sen told Bloomberg TV that weakness will likely continue in the near term, noting that oil refineries will soon enter maintenance season, which has historically cut demand for crude.
But it doesn’t mean supply woes are over for the energy market. In November, the US is due to stop rreleasing oil from the Strategic Petroleum Reserve, she said. China is also likely to snap up more oil, as officials are expected to ease up on lockdown restrictions at the 20th National Congress in November, Sen added.
And in December, the EU’s partial ban on Russian oil products is expected to fully go into effect, potentially taking 2.2 million barrels of oil off the market.
Oil Updates — Crude at multi-month low; US oil rig count falls; US to talk with Indonesia on Russia oil price cap Bold theirs.
RIYADH: Oil prices settled higher on Friday, recouping some of this week’s losses on strong US job growth data, but closed the week at their lowest levels since February, rattled by worries a recession could hit fuel demand.
Brent crude settled up 80 cents to $94.92 a barrel, 11 percent off last Friday’s settlement.
US West Texas Intermediate crude settled up 47 cents to $89.01, off 8 percent in the week.
US oil rig count falls by the most since September
US energy firms this week cut the number of oil rigs by the most since September as production grows incrementally because energy firms are boosting shareholder returns and facing higher operating costs due to inflationary and supply chain pressures.
The number of oil rigs, an early indicator of future output, fell seven to 598 in the week to Aug. 5, the first weekly decline in 10 weeks, energy services firm Baker Hughes Co. said in its closely followed report on Friday.
There is a lot more interesting stuff in this article. Click on the header to read it.
Strong attempt at putting the future production on the chart, with years included! Dennis.
Many people like to draw a cliff without specifying the the timeframes, and thus rate of decline-
which doesn’t end up be useful for a purpose other than demonstrating a basic fact about depletion that is already known to anyone woke/awake.
Fig 4 looks like a steep slope down, yet the big decline doesn’t happen over night.
Global output stays at or above this current level for 15 years.
If that pans out to being even close to true, it gives people plenty of time to make some dramatic change of business and living plans. Especially when you you add it to the 40+ years we’ve already had to get our shit together.
Of course the decline could end up being steeper. I’m sure you’ll have just about everyone saying that.
Hickory,
Thanks.
People can adjust the extraction rates in the spreadsheet after 2021 to anything they like. Note that the 2750 Gb of conventional URR is the average of the recent Laherrere estimate (2500 Gb) and a USGS estimate from 2014 (3000 Gb). Some will claim it is too high, others that it is too low, basically we don’t know what it will be, Note that Laherrere’s estimate was 1800 Gb in 1998, perhaps the estimate will continue to increase.
If we assume extraction rates decrease at 5% per year (that is previous year’s extraction rate times 0.95), we get roughly a 5% annual decline rate, I will leave it to the readers to decide if that is a reasonable assumption.
Very very interesting. Thanks, Dennis, for sticking your neck out with such specific dates and production figures, and for helping us make progress on this topic. Figure 4 reminds me of a brilliant looking stacked graph that George Kaplan had shown us a few years ago that plotted future oil production; approx 50 million barrels a day by 2050’ish was what I believe George’s piece had plotted, if I recall correctly. The last time world oil production was approx 50 million barrels a day was 1971/1972 (world population 3.8 billion/USA population 208 million). I wonder what the EROEI curve, so to speak, would look like within the gross production curve. George’s stacked graph might hold some indications, as it was stacked by source. Perhaps peak net energy from oil is well in the rear view mirror. Fascinating stuff. If I’ve ever made any progress at all in coming to grips with peak oil, and a lot of other ideas too on the non-oil thread, it is in great part for having read much by all those who post and comment here. Even the ones I harass.
American economist Kenneth Boulding famously quipped, “Anyone who believes that exponential growth can go on forever in a finite world is either a madman or an economist”
This remark about exponential growth is less clever than it sounds actually. Just as the world is not infinitely large, we never get to infinity on the timeline.
Exponential growth does not lead to infinite values in a finite period of time. So this is just a cheap shot at models that use exponentials that mostly shows its author doesn’t really understnad the concept of “forever”.
I was thrown a bit by the phrase “brilliant looking” but I think you mean the chart below. The only brilliant thing in it is the estimates for recoverable oil reserves, which I got from Jean Laherrere with a bit from Rystad. In the years since this was produced Rystad global estimates have fallen by, from memory, 12%, 9% and 9%. This shows a peak in 2021, which is obviously wrong. Whether the Covid bite will get added back on fast enough to give a new peak I somehow doubt. There’s no evidence that drilling activity is growing much in response to higher prices and exploration success continues to fall.
The lines overlaid are a poor attempt to show the effect of the export land model, I.e. if exporting countries maintain the same level of internal use the rest of the world runs out of imports fairly quickly, if the exporters show a modest level of growth on internal use then import availability disappears really quickly.
That’s the one George, or one very much like it, thanks for refreshing my mind. “50 by 2050”, roughly speaking, sticks in my mind as feature of both Dennis’ & yours, although yours does a nice job of emphasizing the ELM trend.
And that shows a much more rapid decline than the one Dennis presents in Fig 4
Hickory,
Note that Mr. Kaplan’s chart starts declining in 2021, my chart has decline starting 8 years later, Mr. Kaplan’s chart reached 40 Mb/d in 2055 after 35 years from a peak of 83 Mb/d and a decline of about 2% per year. My scenario falls to 40 Mb/d in 2060 from a peak of 86.9 Mb/d in 2029, this is an average decline rate over those 31 years of about 2.5%. My scenario actually declines more steeply, but the peak is 9 years later and about 4 Mb/d higher than shown in Mr. Kaplan’s chart. At minimum I think the 2018 scenario could not have predicted the pandemic and I would think the peak might be delayed a bit by the pandemic.
A more recent analysis by Laherrere and others has C plus C less extra heavy oil at about 55 Mb/d in 2053, extra heavu oil output would be at least 4.5 Mb/d in 2050 under the current policies scenario by the Canadian Energy Regulator suggesting about 60 Mb/d in 2050. My scenario has World output at about 53 Mb/d in 2050, somewhat more conservative than that of Laherrere et al. The crude oil scenario has output at 63 Mb/d in 2060 vs 40 Mb/d for my scenario in 2060.
See figure 7 in paper linked below
https://www.sciencedirect.com/science/article/pii/S2666049022000524
The terminal implications of the ELM trend, between 2036 and 2049, look perhaps like a cause for much strife.
Thanks Dennis.
understatement of the month-
‘Bears watching’
We may get get to see how the economies of various countries react to long sustained high prices for oil and gas, as well increasingly dramatic climate instability over the next couple years. The demand side of the equation is subject to alteration.
This is more likely and the cliff should be steeper
Ed,
To get a steeper cliff we need to assume extraction rates drop very precipitously, I have yet to hear a convincing scenario of why this would occur.
Would you like to provide one?
US economic collapse, check out Russia production after the Soviet Economic crisis and Soviet Collapse
https://www.researchgate.net/figure/Former-Soviet-Union-oil-production_fig4_268024541
And Russia had traditional fields and not fracking, fracking is more dependent on the economy than the Russian fields
Dennis doesn’t believe an economic collapse can happen.
You can give him all the scenario’s you want.
You can show him that the deepest most sophisticated markets in the world are pricing in this scenario. US treasuries/Eurodollar markets.
It just doesn’t register with him.
Btw Europe, China and Japan all collapse before the US does. Not going to be just a US thing. Oil production at current levels and prices at current levels won’t survive.
Collapse will definitely happen. Peak Oil will only be a partial cause. Collapse will be when a nation doesn’t have the money to buy oil, or fertilizer for crops, of food for it’s people.
Collapse is what is happening right now in Sri Lanka, then very soon in Pakastan, then in….. The dominos are starting to fall. Sri Lanka is just the first domino.
Amid the country’s economic collapse, many Sri Lankans struggle to eat
HHH,
I don’t believe an economic collapse can be predicted in advance. Statistically there have been about 3 Worldwide economic collapses since 1873. If we use a maximum entropy probability distribution, it would suggest and economic collapse with a mean and standard deviation of about 49 years, the median would be about 31 years where there is a 50/50 chance a collapse would occur before or after 31 years, about a 20% probability such a collapse happens by 2030. Also note 2 of the 3 “collapses” were fairly short-lived (in 2008/2009 and 2020) only the Great Depression was a long-lived multi-year collapse and part of this was a failure of classical economics and poor policy decisions based on that theory.
@Denis,
You just gave me a better argument BTW 2020 oil production collapse cliff is steep enough isn’t it.
Ed, if you wish to be taken seriously then don’t make silly statements. You called the 2020 collapse a production collapse. You should know better than that. The 2020 collapse was not a production collapse, it was a demand collapse because of the covid lockdowns all over the world.
@Ron
Yes you are totally right, not directly a production collapse but ultimately it goes to production pretty fast doesn’t it, but in case of economic collapse is demand collapse first too, these two are so close that from a historical perspective they are almost the same line on the graph.
And to add to what HHH said – what’s even more interesting when DC does his “collapse distribution” is that its during a period of continually rising oil production. an absolute refusal to understand that we are in a dynamic interaction between a collapsing economic system (few markets to exploit, few frontiers) and a collapsing oil production system (few discoveries to be made). Even his comments about the “short lived” 2008/2009 is laughable. The entire global economic system had to be retooled in order to recover from it. We’ve had a zombie-economy of CB planning alongside organic growth for 15 years and the decay is pretty widespread and severe.
On the flip side I think the system will sacrifice as many people as needed in order to TRY and make “collapse” controlled to the point that there will be a sense of continuity. I don’t know as we will see “THE END!!” OR “COLLAPSE!!”, at least within the next 10 years. Climate change, Peak Oil, Pestilence are the three horsemen and they are putting in work. I’m betting for the Trifecta.
Two cats,
I simply show what would need to happen to the extraction rate for conventional crude plus condensate in order to see a “collapse” in World crude plus condensate output.
Note that in 2020 the extraction rate dropped from the 2019 level by 10.5%, in order to see output drop in the manner that Berndt and others expect (10 Mb/d by 2035) we need to see two times more of a drop in conventional crude extraction rate seen in 2020 relative to 2019 every year from 2023 to 2035 and even in that case we end up at 20 Mbpd for World C plus C output rather than 10 Mbpd.
Perhaps you believe that is a reasonable scenario, I will leave that to others of they agree, I do not.
Two cats,
Scenario with conventional crude extraction rate on right axis with 20%/year lower extraction rate each year from 2023 to 2040.
Does this seem reasonable to you?
Two cats,
A very big change in the rate of increase in oil production from 7.8% to 1.2% over the period from 1973 to 1983. The change from a 1.2% increase over most of the last 40 years to a 2.8% decline rate starting in 2040 is a smaller change in rate. That is the important factor, the second derivative of the oil production curve..
Hickory,
In chart below the “low scenario” has extraction rate decreasing by 5% each year starting in 2036 (current year extraction rate is 0.95 times previous year’s extraction rate.) The average annual decline rate from 2035 to 2110 is 4.94% per year for the low scenario. The “high scenario” is the original scenario presented in the post.
Shale drillers continue consistent output as oil field costs rise Bold mine
(Bloomberg) — U.S. shale oil drillers continue to show little sign of responding to high global prices with more production, only now it’s not just their focus on rewarding shareholders that’s holding them back, but also a preoccupation with soaring costs.
The combined oil and gas production forecasts from a dozen companies that have reported second-quarter results in recent days is barely changed from three months earlier, down just 0.6%, despite US crude prices surging to $120 a barrel this year after Russia invaded Ukraine. At the same time, higher diesel, steel, chemical and labor costs have prompted the companies to raise capital budgets by 7%.
Shale executives’ unwillingness to boost production means the world oil market has effectively lost its two biggest growth engines. The Organization of Petroleum Exporting Countries admitted to “severely limited availability of excess capacity” this week, and said what little is left can only be tapped with “great caution.” Meanwhile, US drillers have concluded that record profits and cash flows are better spent on share buybacks and dividends rather than deploying more rigs.
“There’s no oil out there,” Kaes Van’t Hof, chief financial officer of Diamondback Energy Inc., said during a conference call with analysts. “We’re not changing our plan for every $10, $20, $30 move in oil price.”
US oilfields currently pump about 12 million barrels a day, 8% higher than a year ago but still 1 million barrels a day below the pre-pandemic all-time high. Just about the only American companies planning to significantly expand output are supermajors like Exxon Mobil Corp. and Chevron Corp. or family-owned operators such as Mewbourne Oil Co.
This is about half the article. Click on header to read the rest.
It’s hard to see under what circumstances US gets anywhere near 13M/day again. With oil below $100 for only about a month the Permian is losing rigs almost immediately. Safe to say the honeymoon is over for tight oil. A long slow grind is all that’s left, with likely irrelevance by the end of the decade. If you can’t grow output, you’re just another peak oil liability.
Stephen,
If they continue to drill wells output may continue to increase. I think people are overreacting to a one week drop in rig count. Supply of steel, pumps, tanks, sand, chemicals, workers, and other stuff in short supply (there’s lots of stuff I don’t know about) won’t remain tight forever. Also unlikely that oil prices continue to drop with stock levels as low as they are currently. Eventually either we stop draining the SPR or it gets to zero and then we stop. At that point we see very high oil prices and this affects active rigs, wells drilled, completion rate and tight oil output. Tight oil output increases by 4 Mb/d over the next 8 years, about a 500 kb/d increase. In 2018 and 2019 tight oil output increased at an annual rate of 1400 kb/d so this rate is nearly 3 times slower than that 2 year period.
Stephen Hren,
Rig count from last week, I have not updated chart ising this weeks data, but the trend has been up pretty strongly, plenty of rigs to keep output growing. Perhaps there will be a brief pause, I don’t get too excited by one weeks data point.
Thanks Dennis, on point as usual. Generally this is a pretty good outlook you got going on here, I would personally just move everything forward 2-5 years regarding the peak. In the grand scheme of things not much of a difference. Appreciate your hard work as always!
Stephen Hren,
Thanks.
I appreciate other perspectives, I am often wrong, but historically (in the absence of major shocks like the GFC or the pandemic) I have tended to underestimate future output of C plus C,
one problem with my current outlook for tight oil is that I assume Brent oil price remains at about $100/bo in 2021$ from now until Dec 2040 (perhaps with a $10/bo window for average centered 12 month oil price). It is unlikely that oil prices will be that stable, but I think they will probably stay in the $90 to $150/bo range for 12 month average price for Brent over that period, if I am wrong the scenario for World crude output will also be wrong (this is virtually certain).
Stephen Hren,
I think the peak will be determined by the interaction of tight oil output, the price of oil, and the speed of the transition to alternative land transport away from oil based products.
My current thinking has demand for oil falling below supply around 2040 and this allows a slightly larger output of tight oil after 2030 than my earlier scenario (which had oil prices falling after 2030, so 10 years earlier than my current scenario).
My modeling of tight oil with this new oil price scenario is in the chart below.
Peak is 11.93 Mb/d for centered 12 month average output in Sept 2030 for US tight oil output URR is 91 Gb. For this scenario US tight oil output grows at about 9% per year from 2022 to 2026. From 2018 to 2020 US tight oil grew at an average annual rate of 22.5%.
Plenty of Rigs and shortage of labor. You need high prices and both rigs and labor.
LTO Survivor,
The Baker Hughes rig count may be inaccurate, but if it is not wouldn’t an oil company only have a rig active if they had workers to run it?
I am not in the oil business, but if I were to run an oil company I would only have a rig active if I had the work force to support it.
Am I missing something?
LTO Survivor,
Gerry Maddoux suggests current well costs for an average tight oil well (I assume this would be about a 9000 foot lateral) is about $12 million. Does this sound about right for the Delaware basin?
Thanks.
Also is there a significant difference in capital cost per lateral foot for drilling and completion between Wolfcamp and Bonespring wells?
Ron,
If output rises another 8% from 11.6 Mb/d that gets us to 12.5 Mb/d in 2023, annual output in 2019 for US C plus C was about 12.3 Mb/d. I doubt we see that big an increase in one year, but we are likely to get to a new annual output peak by 2024 for US C plus C.
Yeah, that could happen Dennis. Not very likely but possible. However, by that time World C+C production will be down at least 2 million barrels per day from where it is today. Soooo… A few more barrels out of the Permian is just not all that important
Ron,
I noticed in a couple of articles I have read lately that the big tight oil companies are saying they will increase output at about 5% per year, so that’s probably a better guess. That would amount to about 580 kb/d, if the rest of US conventional output declined at about 3% (111 kb/d) that would be roughly a 469 kb/d increase in US output.
But everyone is predicting an economic collapse how will they be able to keep the current production much less increase through that ?
Ed,
Everyone is not predicting an economic collapse. There are a few that say an economic collapse is going to happen tomorrow. They do this every day and eventually they are right, about every 47 years.
Dennis, a worldwide collapse is something that will not and cannot happen overnight. You seem to think it is something that we predict will happen suddenly. We will wake up one morning, and the news will be blasting: “The world economy collapsed yesterday!” No, hell no, no one is predicting such a thing.
National collapse is something that happens gradually over a few months. For instance, the Sri Lankan collapse has been in the works for about five months. That is not something that will happen; it has occurred. Pakistan’s collapse is happening but is not a full-blown collapse just yet.
Many countries are approaching collapse as their debts mount, and the IMF cannot bail them all out. After all, the IMF can only do so much.
But there is something far more alarming happening right now. China is in serious trouble. We have heard about ghost cities in China for years. China kept building, and the Chinese people kept giving the builders money. But now all the building has suddenly stopped. The builders have run out of money, and the Chinese people won’t give them anymore. They have paid for apartments that are either incomplete or not even started. They have stopped their monthly payments on their purchases. And they are all trying to withdraw their money from the bank, but the banks will not give them the money they have already deposited. China is in crisis.
A collapse of China would have worldwide consequences. It would affect every nation in the world.
But that is another story. The China collapse is a little like peak oil. People predicted the world would see peak oil fifteen years ago, but it didn’t happen. Now that it is upon up, no one believes it. Likewise, people have been predicting the collapse of China for a couple of decades now. It didn’t happen. Now no one thinks it can happen. But like peak oil, it is happening.
https://www.youtube.com/watch?v=rX5f9Gwoxiw
China crashing at alarming rate
The decline rate seems very even and steady, but will that really be how things go? Won’t the social breakdown from less energy lead to a faster collapse in some areas of the world as the infrastructure for oil extraction gets permanently damaged due to riots, crime, etc.?
C8.
Yes.
Who knows how much, and when…no one.
Another issue may be that as globalisation shrinks away it will become impossible to complete multi-billion, multi year projects needed to develop, say, large ultra deep-water oil projects in some areas or Arctic LNG (or CTL plants which seem to keep cropping up here).
George,
I doubt future Arctic LNG projects or CTL will make sense, their will likely be cheaper alternatives.
Agree that drop off in supply chains and global exchange of goods and could end up being a big drag on energy projects- big and small.
Semiconductors, electric motors, photovoltaics, turbines, piping, wire harness/connectors, transformers, base minerals, etc are all at risk for supply disruptions.
C8,
Yes the scenario assumes that does not occur, or at least not enough to affect oil demand substantially, if and when this happens is unknown. Also possible that high oil prices leads to lower demand as the world substitutes other forms of land transport for petroleum powered land transport. My expectation is that a transition to electric transport leads to oil demand falling below supply by 2040 which leads to falling oil prices and lower extraction rates after 2040. Notice the extraction rate curve in Figure 4 and the change in slope after 2040. I have assumed each year the extraction rate is 99% of the extraction rate of the previous year after 2040, you can download the spreadsheet and make other assumptions, we don’t really know what will happen, extraction rate could remain the same, it could rise and it could fall, the possibilities are infinite, much wiil depend on the future demand for oil, also unknown.
Also remember that oil is not the only form of energy, there is natural gas, nuclear, solar, wind, hydro, geothermal, and coal.
Dennis
I have learned a lot about the near-term trajectory of oil supply from following this site, but one of my interests has been sustainability, and it frustrates me when politicians equate renewable with sustainable.
During the lockdown I wrote up an overview of the challenges my children and grandchildren will face during their lives. If I knew how to send it to you, I could send it for your review, to see if it is worth posting on the other site
Old chemist,
Send it to peakoilbarrel at g mail. Thanks.
Old Chemist,
Got your piece, will contact you after I have finished reading.
Thanks.
I hope to see it!
Anyone care to tell me what “the other site” refers to? As a non-energy-professional/lurker I’m always keen to learn of new sources of info on our global population/energy/climate problem. RIP theoildrum.com
I’m grateful for this site in spite of the abundant technical jargon that I filter out as I read between the lines.
Tehodler,
The “other” site refers to the Open thread Non-Petroleum that is published each week where most anything is discussed often it is indirectly related to the petroleum industry, things like climate change, alternative energy, etc are discussed there.
BRAVE NEW WORLD of INFLATION/TAX/RECESSION
Current cost of US shale oil well: Approximately $12M.
Estimated 10-year recovery: 475,000 boe (maybe).
Release of SPR + ? Shenanigans—>30% price collapse.
US Administration’s stated goal: MUCH lower prices.
Major new incentive for EV, solar, wind.
NO incentive to drill gangbusters. ZERO.
Especially w new tax on oilfield methane.
Better just to collect credits for carbon capture.
Shenanigans?
Excerpt: {The collapse in oil prices has been so epic and unexpected that some oil pundits are now accusing the Biden administration of fabricating low gas demand data in a bid to hammer oil prices.
To wit, in late June the EIA shut down reporting for several weeks, ostensibly due to a server malfunction. But as ForexLive has pointed out, gasoline demand data has been consistently bad ever since the EIA returned: “Maybe there’s an issue with reporting or maybe it’s a conspiracy”, ForexLive has declared.
Even Wall Street has begun questioning the EIA data.
Bank of America energy strategist Doug Legate has published a note titled the “fall of gasoline demand appears grossly exaggerated.’’}
Question: Will electricity be nationalized? Norway is making contingency plans for rationing energy. Norway! The UK is planning warming stations for cold citizens. Coal is being burned at record levels. Is there an energy plan or just a hope on the wings of a prayer?
I personally believe that the Biden administration is doing everything within it’s power to force oil prices down over the next few months.
And for what it’s worth, I’m on board with this, even unto the extent of drawing down the SPR.
That’s a risky thing to do, for sure.
But considering the consequences, in terms of our long term energy security, I think doing it is a nobrainer bet, given my expectations of national energy policies if the Republicans gain enough seats to get their way on anything and everything from renewable electricity to mandated fuel economy standards for new cars and trucks.
3 May 2022
Will the world ever reach peak crude production of November 2018 again?
https://crudeoilpeak.info/will-the-world-ever-reach-peak-crude-production-of-november-2018-again-part-1
we are still below 4,7 mbd
Yet another problem popping up: Middle East supplies to Asia
5/8/2022
Australian diesel imports from Taiwan May 2022
http://crudeoilpeak.info/australian-diesel-imports-from-taiwan-may-2022
Australia is in DEEP trouble as a Nation if it does not start converting it’s coal supplies to liquid fuels.
And accepting a relationship with USA or Britain for military support.
https://www.youtube.com/watch?v=O9OSbXjuqUU
I’m not joking
Between this and Europe deciding “nah, we’ll do without gas, thanks”, I’m really spoilt for choice when it comes to choosing which nation implodes first due to energy.
I have kin in Europe and Australia. Australia looks tough country for planting ones Victory Garden. The European side has a family allotment for growing root veg on the edge of town, just a short train ride away.
Americans may not understand…
The Queen’s birthday is celebrated in Aussie…
https://publicholidays.com.au/queens-birthday/
If you think Australia is gonna give up without a fight…..think again…
“Forces of Freedom” – USA, UK, Australia, Canada,
Burp!!!
Could the Aussies just import from the US? We are a major production country.
No, we are not. It’s pretty much a wash. We import about as much as we export. No one could depend on the US for their imports of crude oil.
Ron – this is an important point which Dennis misses. Our global trade/economy requires cheap fuels for input, and ideally cheap labor too (as the Permian is currently experiencing $$$ labor). The best combination is oil producing countries exporting cheap oil to cheap labor available countries (China, India, Sri Lanka, so on). As exports dry up global trade/economy has only one choice (Sri Lanka)…doesn’t matter that US is playing import export games…makes no difference to global supply/demand balance…it might even be a net negative effect since oil is consumed during shipping one fuel out and importing another…
Kengeo,
The effect of fuel used for shipping oil is marginal. If US did not export 3.5 Mbpd, there would be 3.5 Mbpd less oil on the World export market.
It is not complicated. This is why banning US crude exports is not likely, it is a recipe for higher crude import prices in th US and higher gasoline prices. Not a good recipe for being elected for any politician.
Americans that have worked hard their entire lives to build themselves, and their families, a future are seldom so easy to roll over for “politicians” and the hope that big government will care for them and make the world right. They don’t trust the establishment, they question it. So, they speak out, advocate for something different and vote their conscious. Bringing awareness to an issue and hoping for ensuing change is their advocacy. They believe they can make a difference. THAT is the American way.
Crude oil exports from the US are now draining the last of our nation’s oil resources at an alarming rate. In the very near future we will look back on that policy as being very short sighted, stupid, and essentially forced on us by private enterprise only wanting to make a buck. America does not have the remaining oil resources in the Permian to be exporting 75% of that production, below other world oil price postings, while we flare the snot out its associated gas and drain our valuable groundwater sources for frac’ing.
It is the height of hypocrisy to rant and rave about oil supply, provide charts, arguments and data about “peak” this and peak that, to discuss depletion, labor issues in the oilfield, pressure depletion, well costs in the US, what the KSA can and can’t do to stabilize oil supply… then dismiss what oil exports are doing to our country’s long term energy security. The excuses people use to advocate for oil exports imply they are incapable of thinking past next week.
Mike, you have an entitlement and reality issues. If you where honest with yourself, you would be advocating for EV’s, solar panels and conservation. Your projecting self short comings.
Mike,
Feel free to advocate for what you think is best. I will do the same.
I really don’t care if crude oil gets exported or not. If you like high crude oil prices you will be for that policy, unless you produce tight oil.
I have studied economics and am convinced free trade is best for everyone. I have never seen a convincing argument that the government should decide what can be traded freely makes anyone better off.
Australia has a massive hydrocarbon resource and a very small population.
I am not smart enough to understand how recoverable that resource is.
My bet is the value is going to sky rocket
Aussies do not want to be communists or be thrown in Chinese Labor camps.
In a resource war, which we are in NOW , this is about the best opportunity available for the Yanks (USA) and the Pommies (Brits).
Australia is a country that could lead the charge in CTL.
Australia needs to question how it can defend its supply lines among other things.
We stupidly got rid of our only refinery and now can easily be embargoed by foreign nations.
Elect me for Prime Minister, we will have Liquid Fuels, Rare Earths, Food, Water (desalination),
Crocodile Nuggets, Porn movie with Steve “Crocodile Hunter” Irwin and Bindi Irwin (american)
Nuclear Bombs, Bunker Busters, Nuclear Armed Submarines…..
Peak Avocado 2023!
I apologise I didn’t mean Bindi which is the great Steve Irwin’s Daughter.
I meant Terri Raines who is an american naturalist.
Embarissing mistake and a intended joke.
https://www.youtube.com/watch?v=dQM0i9OheC0
So will you hit peak ripeness in 2023?
🙂
rgds
WP
More on diesel shortages
https://oilprice.com/Energy/Energy-General/Diesel-Shortage-Deepens-Global-Dependency-On-US-Fuel.html
https://oilprice.com/Energy/Energy-General/The-Global-Diesel-Crunch-Is-Going-To-Get-Worse.html
Opec+ oil drilling has been fairly steady after a slight recovery following the Covid crash, even as prices have risen further. Baker Hughes does not record numbers for Iran or ex-USSR countries.
My guess is that the sanctions will have a bigger effect on drilling than anywhere else. It takes special skills and experience to drill the ultra long-reach wells in Sakhalin, or for Arctic LNG, or to revitalise the knackered Siberian fields with water flood. The service companies will be taking all that away with them. In my contact with Russian projects a met a one or two of most types of engineer but never a drilling engineer. Presumably the sanctions mean Russia does not have access to the well design software, at least once licences expire, and no support at all. I don’t think that replacements of the same fidelity will be available from anywhere else.
I think I’m leaning more and more towards the view that a lot if the yet to be produced oil will be too cheap for the operators to produce (and given the risks even to look for) and too expensive for customers to buy.
A couple of years ago Westwood showed all the planned exploration wells in the North Sea, as below. High impact wells, this targeting more than 100mmboe, are named. I can’t find anything about Stovegulvet, which I think means floor oven, so if the operator had any nous it was renamed to something more exciting – maybe the George Foreman grill well, but of the others all but two were dry. Flipper was a 30 that 50mmboe discovery which will be tied to Johan Carlsberg when production capacity becomes available, and Toppand showed 20 to 35mmboe. Neither reached the expected reserves.
There have been reports of 50% success rates for the Norwegian sector in the recent years so this must refer to smaller fields, but also success here would mean “not dry” and not “commercially viable”. In the Barents small oil finds and even quite large gas finds cannot be developed and, in general, as platforms are decommissioned the opportunities to tie back small pools are starting to diminish.
This is a recent Westwood report on exploration and appraisal activity. There have been recent successes in new basins at Namibia and Surinam but mature basins have been worse than disappointing, I.e. “…key frontier failures at Mlima in the Lamu Basin offshore Kenya and at Ulcinj offshore Montenegro”, “…Key emerging play failures include Cutthroat in the Sergipe-Alagoas Basin, which tried to extend the Barra Upper Cretaceous play, as well as Apus in the Roebuck Basin offshore Australia, which was unsuccessful in extending the Dorado play”, “…High impact exploration in maturing/mature plays disappointed, with only one potentially commercial discovery from 12 wells drilled”, “…There were multiple failures attempting to extend the pre-salt play in Brazil, as well as further disappointments in the SWAP licence in the shallow waters of Azerbaijan”.
https://www.westwoodenergy.com/news/westwood-insight/westwood-insight-high-impact-exploration-on-the-rebound-major-frontier-discoveries-and-the-most-wells-since-2019
Thanks George,
Another excerpt from the westwood piece you linked in the comment above.
High impact drilling activity will pick up in the second half of the year, with between 80 and 90 high impact wells expected to have been drilled by the end of 2022, the highest number since 2019 when 98 high impact wells completed.
This is a report on recent exploration history from S&P Global, which bought IHS. It shows the well reported decline in discoveries over the last decade and more. Note that I think IHS includes non-conventional discoveries, which Rysted doesn’t, and also its recovered reserve estimates tend to be a bit higher
https://ihsmarkit.com/research-analysis/2022-high-impact-well-report.html
George. There has been much discussion of labor and supply constraints in the shale basins. We have and continue to experience this is the US conventional fields.
I assume the same is occurring offshore?
I have always viewed offshore as requiring a more well trained labor force than onshore, given the many added challenges. Am I correct in assuming there is an offshore labor shortage which is limiting production growth?
Likewise, is the equipment to grow offshore production even being made. When we have trouble finding our small and generally unsophisticated equipment, I can only imagine this is even worse for offshore.
I don’t have much to do directly with the industry now but I don’t get the impression there is much of a labour shortage, certainly not like in the mid 90s or 2009 to 2013. The number of large development projects has been falling, surely partly due to the fall in discoveries over the past decade, and I think the high level of buy backs announced recently reflects the fact that the majors don’t have enough projects to spend their profits on. Plus they appear to be increasingly risk averse. In the last boom offshore had to compete with tar sands, Iraq revival and petrochemical projects, all these sectors are quiet at the moment, plus there must be plenty of engineers freed from Russian projects.
For development of major projects there has always been a limit to the capacity that an operating company has, or how much global EPIC capacity there is, and projects have been scheduled and planned accordingly. There are individual contractors that move from project to project but there is a limit in total (and the contractors were ageing even ten years ago). The capacities are being reduced as personnel age and retire but there have also been big staff reductions in the majors when prices were low over the last few years (e.g. ExxonMobil, BP, Chevron).
There hasn’t been a problem with being able to get equipment at that I know off, but there have always been issues with getting long lead items to fit in with a project’s schedule. There may be problems with quick turn arounds for spare parts, which would be closer to what you are experiencing, but I don’t know. I can see growing issues if the world economy starts to fracture because there are relatively few suppliers for each bit of specialised equipment and they tend to be scattered all around. The same dispersion of manufacturers make it complicated to ensure quality control is maintained (corruption is always an issue and finding adequate local expertise to provide oversight and checking is sometimes problematic).
The offshore operating personnel have to be well trained, if for nothing else because of the safety requirements. All oil and gas equipment is relatively high spec so it has to be designed by fully qualified engineers whether on or offshore. There are far fewer drilling personnel needed offshore than onshore in the USA as there are fewer, but much larger, wells.
Do you know how much offshore workers get paid?
Try Google: “offshore worker salary”
Thanks for the reply.
I know very little about offshore and always appreciate when you and Bob M comment.
Great piece George, thank you.
A fair amount of discoveries in Brazil and Guyana with 6 of the 10 top largest discoveries in 2021 and about 5000 MMboe out of total World discoveries of 13800 MMboe discovered worldwide (36% of the total). There were a total of 197 discoveries with the top 10 of these yielding about 7000 MMboe (roughly 51% of all conventional petroleum discoveries) from 5% (10 of 197) of the newly discovered fields. Many of the smaller discoveries might never be developed (particularly smaller ultra deepwater fields that may not be near enough to existing infrastructure or other larger discoveries.
The EIA’s Short-Term Energy Outlook is just out. I was interested in what they were projecting for Russia. They project Russia to be down about 850,000 bp/d by December. The European Union is projecting them to be down by 2,200,000 by December.
Below is the EIA’s Russian projection for all liquids.
Something tells me this will all play out in a secondary demand peak, but not because of fancy EVs, but a kneedeep depression. All the actual conflicts have as their main goal the debasement of the US Dollar (and the Euro). If they only halfway succeed, the damage will be HUGE. Such are things when paradigms change and resource scarcity looms. In a perfect world of mutual understanding and cooperation, Dennis‘ graphs might become real. I just don‘t see these conditions above ground.
I never expect graphs to reflect the real world, this would be unfair as there is no way to predict the real world political, economic changes. But the graphs are fun to think about. I agree with you that reality will be far different.
Somebody has a link to my question. Thanks in advance!
I’m trying to find a reasonably new report from any well known organization concerning the number of new oil wells that must be drilled on average, each year, as a percentage of all working wells, in order to maintain production.
Any answer is only going to be a rough estimate due to making various assumptions, but any answer is also a lot better than none.
OFM
Here is a partial answer for the Permian based on DPR info. In the last US update, link below, under the Permian chart, the following is stated:
During June, 408 wells were drilled and 438 were completed in the Permian. The completed wells added 373 kb/d to June’s output for an average of 852 kb/d/well. The overall decline was 288 kb/d which resulted in a net increase for Permian output of 85 kb/d. The completion of 30 extra DUCs over the drilled wells contributed 25.6 kb/d of the 85 kb/d increase.
The number of completed wells required to over come the decline of 288 kb/d is 288,000/852 = 338.
As the decline rate increases, more wells are required, assuming the average new well average production stays roughly the same.
https://peakoilbarrel.com/us-may-oil-production-extends-dropping-trend/#more-38133
Not sure about wells but looks like we can expect Kazakh production to be down…
https://www.reuters.com/business/energy/caspian-pipeline-consortium-says-oil-supplies-significantly-down-2022-08-03/
Interesting dynamic at play in Kazakhstan (China vs. Russia):
Perspectives | Beijing and Moscow clash over Kazakhstan’s oil China wants Russia to stop interfering with Kazakh oil exports. Joe Webster, Paddy Ryan Aug 11, 2022
https://eurasianet.org/perspectives-beijing-and-moscow-clash-over-kazakhstans-oil
There is some optimism that a deal may be close on an new Iran nuclear deal. If agreement is reached this coud eventually increase Iranian output by about 1000 kb/d, this would help to offset any reductions in Russian oil output, though I think Russian oil will continue to flow to places other than Europe such as China and India.
Russian C plus C output was 10.76 Mb/d in July based on article linked below, 2% higher than June or an increase of about 200 kb/d.
https://energy.economictimes.indiatimes.com/news/oil-and-gas/russia-increased-oil-and-gas-condensate-output-by-2-per-cent-m/m-in-july/93289939
That 2% must be gas or a combination of the two. 10,760 Kb/d is 80 Kb/d more than June, or an increase of .75%. The EIA STEO predicts them to be down slightly in August. I am predicting them to be down slightly more than slightly in August. 🤣
Ron,
The numbers for the STEO are all liquids, I believe the number I found is C plus C. Though Russian output data is difficult to find these days. The data I found for the last OPEC report for June was 10.75 Mb/d for Russian C plus C, so if both estimates are correct this would not be a 2% increase unless June output was revised lower. In any case the data I have suggests Russian output in Feb 2022 was 11.06 Mb/d, so roughly a 300 kb/d drop in output since then and about 600 kb/d below the centered 12 month average peak of about 11.3 Mb/d (since break up of Soviet Union).
Dennis/Ron
This is the latest data I have.
Russia Raises July Oil Output as Domestic Refineries Ramp Up
(Bloomberg) — The recovery in Russian oil production has continued this month as higher domestic demand offset a slight drop in exports to key markets.
The nation’s producers pumped 10.78 million barrels a day on average from July 1 to 17, according to data from the Energy Ministry’s CDU-TEK unit that was seen by Bloomberg. That’s 0.6% above the June level, according to calculations based on the data, indicating that the pace of the country’s output recovery has slowed.
https://www.bnnbloomberg.ca/russia-raises-july-oil-output-as-domestic-refineries-ramp-up-1.1793562
Real well costs are up 35-40%. That IS a fact, Jack. Or Travis. —Mike Shellman
(Is that good enough for you, Dennis?)
Thanks Gerry.
Reading the Senate “IRA” bill.
Appears upstream companies which emit less than 25,000 metric tons of methane annually are exempt.
From my reading, this is a very high threshold and would exempt small stripper oil well operators.
Estimates I have read for methane emissions in US upstream are 1.4 million metric tons annually for the entire Permian Basin and 8-13 million tons annually for all US onshore and offshore operations.
Shallow sand,
Have you heard from others in your areas how much capex cost for new wells has increased? Does about 20% sound right from Dec 2019 to today.
The OPEC Monthly Oil Market Repor is out. July crude-only production was up by 216,000 bp/d but that was after June production was revised down by 35,000 bp/d and May was revised down by 75,000 bp/d. So from last months estimate production was only up by 180,000 bp/d.
From the below chart you can see that OPEC has been pretty much running in place for the last six months. Estimates are that they will be up slightly more in August but plateauing to down after that.
Looking at the chart it looks like the past 5 months they have been “running in place.” Over the past 6 months it looks like output has increased about 900 kb/d. A deal with Iran might raise output a bit.
Yeah, but the important part is what will happen August through December 2022. Watch this space. If you are a cornucopian wearing rose-colored glasses, you may be shocked.
IEA sees OPEC+ as unlikely to supply more oil in coming months
(Bloomberg) — OPEC+ is unlikely to increase output in the coming months because of limited spare capacity, according to the International Energy Agency.
Furthermore, the “largely symbolic” 100,000 barrel-a-day hike promised for September may actually turn into a cut as Russian production declines, the IEA said.
“Comparatively low levels of operational spare production capacity, held mainly by Saudi Arabia and the United Arab Emirates, may thus all but rule out substantial further OPEC+ output increases in the coming months,” the IEA said in its monthly report on Thursday.
The outlook from the Paris-based organization that advises major developed economies on energy policy suggests the burden of satisfying global oil demand growth in the latter part of the year will fall on countries outside the Organization of Petroleum Exporting Countries and its allies.
Non-OPEC+ supply is projected to rise by 1.7 million barrels a day this year and 1.9 million next year, according to the IEA. That’s a significant acceleration compared with last year, but still falls short of 2.1 million barrels a day of demand growth expected in 2022 and 2023.
https://worldoil.com/news/2022/8/11/iea-sees-opec-as-unlikely-to-supply-more-oil-in-coming-months/
Non-OPEC+ supply is projected to rise by 1.7 million barrels a day this year and 1.9 million next year, according to the IEA.
That is insane. That puts Non-OPEC up 3.6 million barrels per day from December 2021. By March 2022 they were already up 751,000 bp/d by March 2022. But that was mostly recovery from covid. And April 2022 was when Russia took the plunge, down over 1.3 million barrels per day in April. Though they have recovered about 80 percent of that decline by July, that will be their high mark for the rest of the year. They are projected to be down by another 1 million barrels per day by December.
The USA is up about a quarter million barrels per day, from December 2021 to July 2022 according to the EIA STEO. They will be lucky if they are up half a million bp/d by December 2022. That means Russia plus USA will be down by around half a million bp/d in 2022. And Russia will, very likely, continue to decline in 2023 by at least enough to offset any increase by the USA.
Non-OPEC is basically USA plus Russia. The below chart shows that in spades. Non-OPEC will be down in the years 2022 and 2023, not up 3.6 million barrels per day as the EIA projects. So if OPEC+ is unlikely to supply more oil then that means…. Hell, we all know what that means.
Ron
Appreciate that the IEA numbers are all liquids. So C + C would be close to 85% of those increases. Regardless, it does not change your basic points.
Another view of the IEA’s announcement posted by Ovi above. The main thrust of this article is that OPEC+ is totally spent and we can look for declines from here on out. They are betting that non-OPEC will come through and save the world. It ain’t gonna happen.
OPEC+ Oil Production Could Dip In September
The 100,000 bpd production target increase that OPEC+ set for September may end up effectively being a production cut, the IEA said on Thursday, with a possible dip in Russian production.
OPEC+ is unlikely, the IEA said, to increase production in the coming months because they are short on spare capacity.
“Comparatively low levels of operational spare production capacity, held mainly by Saudi Arabia and the United Arab Emirates, may thus all but rule out substantial further OPEC+ output increases in the coming months,” the IEA”s new Oil Market Report-August 2022 reads.
This will place the burden of meeting the anticipated 2.1 million bpd 2023 demand growth squarely on the shoulders of those producers that lie outside OPEC+, the IEA said.
The IEA noted, however, that while they were still expecting a decline in Russian crude oil production, it had revised its outlook for world oil supply upwards, with Russia’s supply declines now seen as more limited than it previously forecast.
According to new IEA data, OPEC-10’s spare capacity is 2.73 million bpd, with the total OPEC spare capacity at 3.38 million bpd. The IEA estimates the total OPEC+ effective spare capacity at 3.74 million bpd.
OPEC+, however, is not eager to tap into this effective spare capacity, which would diminish the group’s power to respond to market emergencies with increased production. After OPEC+’s last meeting in early August, OPEC+ referred to its “severely limited” spare capacity, which should be used with “great caution in response to severe supply disruptions”, reinforcing the IEA’s predictions that additional OPEC+ output increases are unlikely in the coming months.
Isn’t there a possibility that SA is lying about spare capacity to keep Biden of their back when he asks for more oil? Low production keeps prices high, which is good for them. Could they have more space capacity than they are letting on?
SA lying about spare capacity has nothing to do with Biden, they have been lying about everything for many decades. Biden on their back is not of the least concern to them. Spare capacity is a bragging point for them. They might lie about the spare capacity they don’t have but never lie about the spare capacity they do have.
That’s funny, how can it be called spare capacity if they never use it?
I’ll tell you how, it is marketing. As long as there is spare capacity (even if never tapped) then the party can roll on, if they admit to being maxed out it implies that change is coming.
Since I’ve been reading about PO, all the charts and models and guesses have been based on exaggeration, press release, propaganda, and quota fudging… marketing in other words. Any attempting to mark down the flagrant lies of OPEC to reality, let alone divining NOCs and supranational corporations true worth obscures more than clarifies. Humans cheat for dollar bills but expect truth concerning trillions. LOL.
My forecast is everyone will be surprised because everyone has been lying.
Here’s a hypothetical trend for OPEC monthly data.
This assumes a similar trend exists in the future as the 2016-2019 trend.
This equates to 6-7% annual decline, this seems reasonable since many of the fields have been pumping for 70+ years…
I have a question about OPEC, particularly SA. Have they fracked much? If not, couldn’t they get a lot more that way and extend out that downward slope? Or is the oil they get not in formations that are fracked?
C8 – I don’t think the majority of their oil is tied up in shale. Also, production cost for shale is much higher than what they currently produce. This is a guess…
See Saudi Arabia graph below:
Here’s a longer term for Saudi Arabia with a hypothetical curve peaking in 2000 timeframe…
Saudi has shale gas but it has been proving difficult to develop although there has been signs that things are moving. The aim would be to displace the oil used in power generation (not of course to leave it in the ground but to be able to export it).
Shale oil is fracked in the original source rock. Rock so tight that the oil cannot escape. The Saudi reservoirs are all reservoir rock. The source rock for those reservoirs are way below those reservoirs and obviously not that tight at all else the oil would not have escaped. There is no reason to believe there is a lot of oil left in those reservoirs. At any rate they are now likely well below the oil window and if they have anything it would be gas and not likely a lot of that.
Thanks to all for the replies about SA fracking. I feel bad for asking so much- but is there a possibility some of you could fill me in on the fracking potential of other OPEC nations? I am assuming that if SA oil is not shale then that probably goes for much of the remainder of the Middle East – esp. Iraq and Iran (am I wrong?) What about Nigeria and Russia?
I appreciate ANY educated replies
Argentina is the only other player that I know of—-
But I’m an amateur .
https://www.spglobal.com/commodityinsights/en/market-insights/latest-news/natural-gas/040521-argentinas-vaca-muerta-fracking-activity-rises-to-record-high-in-march
Russia has what could be the largest shale resource in the world in the bashenov formation in siberia. Produced from it it the 1970s at Salym. Very high productivity from natural fractures for a very short and unpredictable time. Then they had Samatlor and other conventional resources, so the Soviets did not pursue it much. Vast resource, much bigger than the Permian, but very remote.
Some Roger Blanchard dude wrote some interesting articles for Resilience.org.
Good assessment of world oil production up to now:
https://www.resilience.org/stories/2022-08-03/the-status-of-global-oil-production-part-1/
Part 2: OPEC and how they suck.
https://www.resilience.org/stories/2022-08-09/the-status-of-global-oil-production-part-2/
Thanks, Seattle for posting this. These two articles are very long and it will take me a while to digest them. But I will definitely do it and get back with a reply, likely tomorrow.
Thanks again.
Those are both really good articles actually…don’t let Dennis read them though!
Yea, we have explanations of the fat-tail stats of oil discoveries in the book Mathematical Geoenergy
This is interesting — was Hubbert off by 1/2 in his prediction made in the 1950s?
https://www.resilience.org/wp-content/uploads/2022/08/image029.png
Hubbert used 1P for the curve, technology available at the time. Reality is 2P recovery or twice 1P.
Can you please reference in Hubbert’s work where said he was using 1P for the full shape of his bell shaped curve fitting please.
1P was the only box he had. As sherlock would say….if it fits it is it
What does 1P and 2P mean?
In the ‘old days’ 1 P was what you could pump out of the ground with a vertical pipe drilled into a oil region (no 3D models, no CO2 injection, no water injection, no horizontal wells, no fracking, no nothing)…just oil pressure from earth on top pushing oil out of the ground. 1P is estimated at 30% of the oil in place in the location in which the oil resides, typically in a sand region bound by clay… 2P is a rough estimate of using all the above extra ordinary means to recover oil (3D models….to fracking).. or getting 60% of oil in place out of the cavern in which it resides… The idea of 1P was the technology of the 1950s had no electronics…big setback…all Hubbert had at the time…he was very good with estimates though. Saudis back then were very good with thinking americans are tech savy and would eventually get 80% of Oil in place out of the ground ….so Saudi estimates of recoverable oil included tech, not so with Hubbert, he was good at tech at the time. Horizontal wells came in for Saudi about 2000 they help for about a decade for the oil size reseviour called Gehwar… biggest of all giants…also for Debi…? Spelling?
What are P1 P2 and P3 reserves?
Proven (P1), Probable (P2) & Possible (P3) reserves depending on the degree of probability and the level of technical certainty of production.
Hey, google works, who would have thunk it?
Ron,
P2 is not 2P and P3 is not 3P.
2P=P1 plus P2 and 3P=P1 plus P2 plus P3.
Dennis, that was a copy and paste from the net. I guess those fools who posted that on the net were wrong. I really don’t care.
Kind of interesting example of horse trading in the Eagle Ford.
In May of 2014 Encana (now Ovintiv) bought acreage and production at the time producing 53k BOEPD from Freeport-McMoran for $3.1 billion. Bad timing.
In 2021 Ovintiv sold it to a PE firm for $880 million.
Devon just announced it is buying from PE firm for $1.8 billion. Current production is 35k BOEPD, Devon hopes to get up to 40k BOEPD.
Couldn’t find oil, NGL, gas breakdown of the BOEPD.
In Part I of the Blanchard pieces he uses an unconventional definition of unconventional oil where he includes deepwater offshore as “unconventional oil”. I use extra heavy (Canadian oil sands and Orinoco belt) plus tight oil as my definition of unconventional oil consistent with the recent publication by Laherrere et al.
Also note that the USGS World Petroleum Assessment (probably the most authoritative one that exists) has a conventional oil URR of about 3000 Gb. Other assessments by Laherrere have been increasing over time from 1800 Gb in 1998 to 2500 Gb in 2022. Will these conventional oil URR assessments continue to increase?
My estimate for Conventional C plus C URR is 2750 Gb midway between Laherrere’s recent assessment and the USGS assessment.
As oil global production production declines the gasoline for transport will gradually get replaced by electricity for transport. Or people will walk.
But what about the other crude oil products, including diesel fuel and heating oil, jet fuel, petrochemical feedstocks, waxes, solvents, lubricating oils, and asphalt.
Which off these categories will reach shortage status first, second?
For about 3 hours on Tuesday the PJM system and ISO New England power systems consumed, I mathematically calculated, about 120,000 gallons of diesel to provide power to their grids. ( + 5,000 MW ) Before and after the peaking they were burning diesel, just less.
Haber-Bosch feedstock shortage has already influenced the amount of ammonium nitrate fertilizer. Planetary soil has by now been tilled for between 100 and 200 years—no fertilizer, no crops. So we will see the first tangible evidence of the energy crisis with fall harvest. And this predated the Ukraine War.
There is talk of nationalized electricity: Mexico, Norway, UK. Lots of collateral damage: pacemakers are more expensive from a double whammy, lithium and petrochemical feedstock cost. Nationalized electricity would open the door for rations of virtually everything, including pacemakers.
At this point, Ghawar is more seawater than oil: a massive skimming operation. Shale is racing it to the Seneca Cliff. This is happening, alas, in real time. GDP has for over a century been inextricably linked to growth in the utilization of fossil fuels. Without fossil fuels, providing vast amounts of electricity for data storage centers, no cloud. Blame computers.
A dramatic decline is rather different from a plateau. Electric vehicles require an awful lot more fossil fuel expenditure than is being bantered about. This transition could be somewhat rougher than is being modeled. Why? Because nobody in a position of power has the foggiest idea about the longevity of Ghawar, or the Permian. The world is flying blind.
Gerry
And don’t forget that everywhere in the developed world there is an army of people ready to fight drilling or digging every place for any reason.
This I don’t understand how are projection so optimistic when future relies on ghawar, fracking and economic collapse for major producers
I personally believe that anybody who is a really well informed upstream oil guy, somebody who knows just about everything a pro can know about his profession, probably has a damned good idea about how much longer Ghawar can produce at today’s levels.
The Saudi’s are obviously mostly dependent on imported equipment and technologies.
Somebody who knows what they’re buying and how much they’re buying, in detail, can figure out where they are in terms of managing the various parts of the field. There must be dozens if not hundreds of people who are working for them who can read between the lines they’re allowed to see, and come up with a damned good idea what is truly going on.
And the various governments of the world all have people on the payroll paid to dig up this information and analyze it.
Joe Biden could very likely schedule a meeting for tomorrow with the people who are best qualified to discuss this matter with him. Too many of them are likely out of town to do it today, lol.
I am interested in the answer to this question also so if anyone can address this I would be thankful
silence is agreement
My view is that many here simply assume an economic collapse will occur as soon as we reach peak oil. If they are correct and 2018 is the oilpeak as some assume, it should happen any day.
Based on my research there should be enough discovered oil reserves so that continued development of discovered oil resources is likely to lead to a new oil peak in 2029 followed by gradual oil decline at about 2.5% per year after 2040. The decine rate gradually increases after 2030 to about 3% maximum then settles at about 2.5%. The overall change in slope of the output curve is only 4%, far less than the change 1933 to 1972 (7.5% annual increase) to 1983 to 2016 (1.2% annual increase). In the earlier period the world adjusted to the change in rate of 6.3%, the world will adjust again to this smaller change in rate of only 3.7% (from 1.2% to -2.5%.)
Most explanations of why there will be a collapse in oil output assume an economic collapse, no such collapse worldwide occurred from 1973 to 1982, unclear why it is assumed in this case.
Dennis, it has always been my position that peak oil would happen at a time when prices were low because at the time more oil would be being produced ever in history. I think it is obvious that at such a time prices would be low and no one would ever dream it was the peak. Peak oil can only be known, for sure, when it is at least four to five years in the past.
Also, I have always maintained that the declining oil supply would be only a partial cause of the collapse. I think that is obvious because we are in the early stages of collapse right now and only a very few very wise people know that peak oil is in the past. 🤣
I just now saw on the news that people are starving in Afghanistan. Perhaps a million people in Sri Lanka are kept alive by soup kitchens. Pakistan is almost in that condition. People who think a collapse is not going to happen should live in one of those countries for a few days and they would change their minds.
As for your “discovered resources”, I think you are dreaming. The covid recovery is over and the decline has already begun. There will be no new peak above the 2018 peak.
EDIT: It just occurred to me that next year, 2023, will mark 5 years since the peak. Next year we will know for sure.
It also helps when you are a country that can unilaterally freeze $7 billion from Afghanistan, let them starve, and then immediately “set aside” $3.5 billion for 3,000 or so families to divvy up. It sure is nice.
The lesson is – effects of peak arrived early for many, and will arrive late for some.
Ron,
I disagree prices will be low at the peak if demand is less than supply at a higher price level as in 2018, or it could be high as was the case at a previous peak in 2008 when supply was lower than demand if oil prices had been lower. It simply depends upon the market clearing price at the time of the peak, this depends upon a multitude of factors which cannot possibly be predicted in advance.
Because it wasn’t peak world oil. Peak world oil is a little more frightening in my opinion.
I don’t think it was frightening at all. It happened when the world was awash in oil, as expected. It happened when oil prices were low, as expected. Now peak oil is four years in the rearview mirror and still no one is frightened.
Ron,
People are not frightened because they do not believe that peak oil is in the past, they think it will be in the future. Many previous peaks have occurred when oil prices were relatively high.
Dennis, I fully realize that the vast majority of the world don’t realize that world oil production has peaked. You don’t need to remind me of that. That was the point of my post.
On another subject, Looking at your “Big 11” oil producers whom you believe will save the world from peak oil, in April they were down two million barrels per day from the peak of November 2018. Of course Russia being down one million bp/d in April contribituded heavily to that.
However, World oil production less that big 11 was down three million barrels per day in April since peak…. and falling… and that does not include Russia. That means that your big 11 would need to increase production by another five million barrels per day to reach a new peak. Really now!
Dennis, I think it is blatantly obvious that we are post peak. I find it astonishing that this fact is so opeque to you.
I have posted a graph of the Big 11 lower in this thread. Check it out and reply there if you have one.
World Less Big 11
Nov-18 … 23,548
Apr-22 … 20,518
………. -3,030
Yes, global peak oil is extremely frightening to anyone who gives it a thought or two.
The world of over 8 billion is entirely unprepared to make a quick adjustment to having less,
and people will drift towards poverty and worse as basic items like food become less affordable or available.
That is why some people have been advocating for a hard push away from dependency on oil as quick as possible. I am under no illusion that this job can be accomplished on a quick time frame or at scale to avoid big shortfalls. But better to get some of the job done than just watching the depletion curve unfold, and people fall off the map in a most painful way.
But to Rons point- true, most people have not given the topic much thought. More pleasant to think of other things and delusions.
Once upon a time, there was a shepherd boy who used to take his flock of sheep to the hill to graze on the fresh green grass. Sitting there, he had nothing to do the whole day. One day, an idea struck him. To overcome his boredom, he cried out, “wolf!
“Mankind has always lived on the edge. In 2008 nearly everyone who posted on TOD thought the world was at peak oil and there was no seeable alternative to oil free transportation, as there is today. In 2015 Ron called peak oil, only to be wrong(opinion, not fact). It was 48 years from the United States peak of 1970 to a new peak in 2018(modern technology). Yet, like never before all this peak, peak, peak, every auto manufacturer in the world will be selling EV’s in the next couple of years.”
https://peakoilbarrel.com/open-thread-non-petroleum-august-8-2022/#comment-744416
Bait & Switch. Climate change is a euphemism for peak oil, repackaged and sold in a form that people feel that they can deal with. Climate change CAN be mitigated but oil depletion can not. Peak oil is the true existential crisis to those that can’t deal with a change in their lifestyle.
Russian oil production to fall by a fifth since EU import ban, IEA says Bold mine
Russian oil production is set to drop by 20% next year as the European Union’s import ban on Russian oil-product shipments kicks in, according to the International Energy Agency (IEA).
The Paris-based agency said on Thursday that gradual monthly declines in output will start as soon as this month as the Kremlin cuts back oil refining, and will quicken as the embargo comes into force.
The IEA expects to see close to 2 million barrels a day shut in by the start of 2023, despite a healthy recovery in production in recent months.
Rig Count for August 12
US Tot: Down 3 for the wk. Down 6 from the high of 551 two wks ago
Permian: Down 4 for the wk. Down 8 from the high of 330 two wks ago
Texas: Down 4 for the wk from 311 last wk.
New Mexico: Down 1 for the wk. Down 10 from 6 wks ago.
Is this slow down related to increasing costs or shortage of equipment or both?
Is this slow down related to increasing costs or shortage of equipment or both?
Ovi, I would say it is both. Also a shortage of labor. But I would guess that the most important factor in the rig count slow down is a shortage of good sweet spots to drill.
Combination of things:
Just a few months ago one could complete a shale well for $10M & sell oil into a &120/bll market with a good chance of a 3,4-fold return, especially since quite a few operators warehoused pipe when they threw a fire sale during the pandemic. Also, there was a large overhang of DUC’s.
But now that inventory is gone, and rig costs are sky-high. To get a rig out of warm stack you have to agree to drill at least 6 wells. Casing pipe is like gold dust. In some places frack water costs a million dollars a well.
Very quickly the price of WTI got hammered down to < $90 in an inflationary environment. And like Ron says, the sweet spots became scarce. So now, if it costs $12M to D/C, and ultimate yield falls from 450,000 boe down to 350,000, and if the price were to go to $80 or less, it would be easy to wake up in a lather, knowing that you might be upside down, especially if demand goes to hell.
To run a high-risk operation, you used to expect a 10:1 return if you got lucky and did things right. Now it’s down to 3:1 and getting worse. I saw a flyer nailed to a tree once: “Lost, good black dog with left ear torn off, right hind leg amputated, recently castrated, goes by the name of Lucky.”
We’re going to come through this . . . if we’re lucky.
I really learn a lot reading your post- the more details the better- that dog joke made me laugh. Post some more details of production costs changes please. How much are labor costs rising by? How hard is it to get workers?
>> What does 1P and 2P mean? <<
Like George said above, you really should learn to use Google, eg: 1P 2P oil
Try it, you might learn how to get information for yourself…
Except in the boxes of text that I read, 1P and 2P were just stated by themselves and the word “reserves” was not included, (check it out for yourself) so what was I supposed to search for without that context?
But I will take your hint and not post here anymore- thanks to all those who have be kind enough to help me
In the 1950s… 1P was proven.. 2P was probable. 1P was oil that you could retrieve, 2P was oil that at that time was not retrevable but in the future might be. Definitions change with time. IN the 1950s deep water oil tech did not exist. Deep water that did exist was classified with extra heavy Venezula oil and Canadian tar sands. It was extremely hard to get any oil from it. Now a days 2Billion dollar deepwater is considered 1P.. not back then. If you have no history then none of this makes any sense. Most 20 year olds don’t get it…cell phones always existed… not back in the 1950s.. no computers back then.. sliderules…no electronics.. sorry..very sad days back then.
C8
Post questions about oil in the NON petroleum thread if you wish. That’s a far more relaxed and free wheeling place.
C8,
Also ignore the negative replies, sometimes people are impolite, don’t worry about it. The 1P reserves are prove reserves with 90% probability at least that much will be produced.
2P reserves are proved plus probable reserves where there is a 50% probability at least as much will be produced as the 2P estimate. Finally there is a 3P estimate which is proved plus probable plus possible reserves and there is only a 10% probability that actual output will be more than the 3P estimate.
Frac Spread Count for Aug 12. 2022
Down 4 for the wk and down 10 from 295 two weeks ago.
Appreciate that on Feb 25, 290 frac crews were operational. Something fundamental has changed.
Have the rig and frac crews arrived at a comfortable equilibrium of slow and steady pace.
The new Iran nuclear deal just might make it. My guess is Biden wants this badly as he has prioritized lower gas prices before the election.
https://oilprice.com/Geopolitics/International/Iran-Signals-That-Latest-Nuclear-Deal-Proposal-Could-Be-Acceptable.html
If this were to happen, let’s say in the next three months, it would just offset the US SPR release. Then if the the US decides to refill the SPR, demand will increase for a period of close to a year. The downward impact on prices would only be temporary, order of three months.
I would even bet, that some Russian oil will end in the SPRs, like always when the admin hypocrites are involved…
I would bet you haven’t a damn clue as to what the hell you are talking about.
I only watch mainstream news to entertain my father with dementia and I can tell you that “Iran Assassin Plot on John Bolton” has been playing for weeks, and they just got “Iran attack on Salmon Rushdie” will be playing for another week or two. There are clearly “people” who don’t want this nuclear deal to happen.
If you believe that global warming is real, and that oil and gas are depleting one time gifts of nature, and that the Earth orbits the Sun, rather than the other way around, you had best be hoping the Democrats at least hold onto the seats they have in Washington and the various states in November.
And it’s a bedrock fact that Americans vote their pocketbooks.
Yes, Biden is doing what he can to keep energy prices stable or even trending down from now until then.
Regardless of which depletion curve plays out, global oil production will be down significantly in the 2030’s.
Implications include
-the price for diesel and petrochemical feedstock will be much higher and only those countries with domestic production, lots of money, and/or geopolitcal standing will be able to rely on steady supplies to industry/commerce. This means that many things we take for granted in the wealthier parts of the world, such as affordable and available lumber, paint, concrete, medical supplies, clothing/shoes, tools, appliances, electronics, and food will be in short supply since their production is all dependent on the crude derivatives.
Empty shelves, ‘on back-order indefinitely’, ‘not available at any price’ will become much more frequent and widespread. Not everywhere and everything, but increasingly so.
-‘have nots’ for affordable food, energy and basic goods will become a much bigger portion of the world population. This trend alone will shake the stability of many countries right down to the level of rubble. Desperate people elect fools with promises, with the long trend towards democracy under severe threat throughout. The US Grand Trump Embarrassment was just an appetizer on this.
Geopolitical reshuffling picks up steam. ‘Have not’ countries no longer can abide by treaties and trade agreements. Survival of the most brutal makes a big comeback in these zones.
-those who can afford to do so switch rapidly to electric transport while production remains available, and for many this will be significantly scaled back in capability (range) compared to what was the norm in the pre-peak era. Optional uses of petrol start to fade under the crush of higher prices. Gasoline is more and more just for the wealthy.
This kind of narrative is a quick glimpse at the pressures just over the horizon- how certain things will play out. This whole topic deserves a hell of lot more thought by all, now that depletion curves are clearly the new topic of conversation.
Destruction of charging stations is already pretty common. As larger and larger percentages of ‘have nots’ are created, a certain percentage of those are going to steal and vandalize existing infrastructure for copper or games
https://insideevs.com/news/586101/tesla-supercharger-cable-cut-vandals/
“Desperate people elect fools with promises, with the long trend towards democracy under severe threat throughout. The US Grand Trump Embarrassment was just an appetizer on this.” ~ Hick
Agreed. Perhaps worth noting is that Trump voters & supporters didn’t and don’t really look that desperate, relatively speaking.
Perhaps self entitled Americans who’d rather grab a pistol than accept a ration card will also elect some fools.
https://www.nationalww2museum.org/students-teachers/student-resources/research-starters/take-closer-look-ration-books
‘desperate’ soul, as in willing elect someone who is not even qualified in character or experience to be a school principle, let alone the mayor of a small town
A kakistocracy (/kækɪˈstɒkrəsi/, /kækɪsˈtɒ-/) is a government run by the worst, least qualified, or most unscrupulous citizens. …
Trump comes to mind—
You are right. Biden, our beloved leader, is the most intelligent, most qualified, most honest, most strategic, most gifted, most trusted, loved by the people, best father to his daughter and son, of any one individual in the history of mankind!
I considered Hunter foolish for raw-doggin’ strippers at 50, until I remembered I had done it myself.
Mankind has been exceptionally careless with fossil fuels. Petroleum is rare. For example, the ratio of all organic carbon to petroleum carbon is roughly 12,000 to one. And then for petroleum carbon to be turned into oil, a great # of conditions must be satisfied: high pressure but not too high, hot temperatures (-100 degrees C) but not too hot (or it’s “cooked”), long duration (about 200-million years).
As such, oil should have been treated as a precious resource, but it wasn’t. Billions of barrels have been wasted.
Scarcity could very well change geopolitical spheres, but probably not. Scarcity will very likely instigate war. And those wars will determine geopolitical influence.
Hickory is right: a very different world lies just over the horizon. With the Saudis, you have to study their carefully parsed remarks. In May, the Saudi oil minister warned that “energy capacity is being stretched.” To me that means don’t look to us to fix this mess. And Scott Sheffield, head of Pioneer, arguably the holder of the best acreage in the Permian, said that if his company speeded up, it would run out of drilling sites in two years.
We are there. Or almost there. Laying down rigs with WTI @ $90 is not a good sign. Young technical people are not going into petroleum, wages are high, it’s hard to find a good geologist who knows anything about “conventional” wells, and tens of thousands of wells will be plugged @ $20,000 per. This is not a healthy industry, no matter the headlines. Big companies are going to scoop up subsidies for carbon capture while drilling like there’s no tomorrow—that’s their “pivot.” Small companies are—@ these inflationary prices of drilling in the wake of crashing WTI prices—living from the initial flush of one well to the next.
Soon it will all be over. And the world is not ready.
“ A Scarcity could very well change geopolitical spheres, but probably not. Scarcity will very likely instigate war. And those wars will determine geopolitical influence “
[sarcasm on] Really? I tought the wars in the middle east were about freedom and democracy. But lately I was having second thoughts about this , because I don´t think Saudi Arabia is a democracy and they never get sanctioned. [sarcasm off]
Peak Oil and the future oil production will be determined by economic effects, not by geologic. I believe, i am the first here who uses economic data (which are in agreement with data from physics) for a prediction of future oil production.
My starting point is car sales data of the five areas EU, UK, USA, India and China. I have explained that from the two sales increases in 2013 at 14 %BOE, and in 2021 at 6 %BOE, it is to be expected that in 2027 the limit for sales increases is 0 %BOE. Car sales will go down; after 2027 „normal consumers“ will be unable to buy new cars.
That means, until 2027 people can use their money to drive; they can afford gasoline, but not cars. Not much will change. I expect the oil consumption will be roughly the same as today. I expect a small decrease, because some people will avoid the increasing costs of driving.
Berndt, peak oil will not be determined in the future. It was determined in the past, 2018 to be exact. And it was determined by geology.
Peak Oil and the future oil production will be determined by economic effects, not by geologic.
Can’t it be both? Aren’t they directly related to one another?
Is there anything sillier than an either/or mindset?
Oh yes, one thing: that unreadable graph that follows.
After 2027, oil and gasoline get so expensive, that use of it does do not result in money earnings compensating the costs. People make a loss when using oil, but are forced to use the existing infrastructure with cars and roads. After some time, people can not afford the operating costs of a car. I assume, that this point is reached after eight years, that is in 2035. The value eight years is the result of a comparison of german average income with german average car operating costs. In 2035, oil will not be used anymore. Then oil production gets close to zero.
One of the uncertainties with this prediction is, that it requires a stable social environment. Several countries will not be stable.
Another one is, that food production needs a lot of oil. All governments will redirect the use of oil.
A third is, that countries are very different. For example, more than 60 % of Chinas energy comes from coal. Chinas economy will last longer than others. Europes oil is mostly imported; Europe will be one of the first without oil.
And a lot more uncertainties exist.
“more than 60 % of Chinas energy comes from coal. Chinas economy will last longer than others. Europes oil is mostly imported; Europe will be one of the first without oil.”
Many poor countries already run on an oil-starved basis. Not enough fuel to run irrigation pumps or fertilize crops (natgas derived), or afford basic construction material and operations. Most of these countries are in Africa.
Big economies that are entirely dependent on imported oil include Germany, Netherlands, Korea, Japan and Taiwan, with many others close behind on the dependency scale. The countries listed here are all able to afford a ten year switch to electric transport. Many less wealthy countries (and population segments within the richer countries) will struggle mightily with that. What of countries like Hungary, Turkey, Egypt, Pakistan, Indonesia, Vietnam, to name just a few? The economic pressure will be massive. Default comes to mind quick.
“In 2035, oil will not be used anymore.”
Maybe that is true for light transport, but it will still be in demand as much as ever for all the other things. Probably even more so, since the world will be approaching 9 Billion people.
Berndt,
Doubtful World C + C output falls to 10 Mbpd by 2035. If we assume the conventional extraction rate falls by 20% each year (extraction rate is 0.8 times last year’s extraction rate.) from 2023 to 2060 we get the following scenario.
Not likely that demand falls this fast in my opinion.
Dennis,
it is not possible to fly faster than the speed of light, and it is not possible to violate the second law of thermodynamics, even for oil production.
The 2nd law tells us that the net energy of produced oil decreases. The car production history is consistent with the expected history of net energy loss of the oil production process.
This forces me to believe in a decrease of produced crude oil, slowly in the next 5 years, and accelerating after 2027.
“Demand” is not the correct word, “affordability” is better. If we look back to 2018 and later, billions of people had demands for new cars, and most were not able to afford them.
The image below depicts the thermodynamic background and problem to be considered. It is solved by using the “steady state entropy rate balance for control volumes”, according to the book of Moran/Shapiro.
Berndt, I spent almost my entire career repairing large mainframe computers. They are gone now as this laptop I am typing on has many times more computing power and hundreds of times more memory than those old dinosaurs. But I was basically a traveling computer repairman. We, computer repairmen, had a way of dealing with customers who doubted our expertise. Our motto was: “If you can’t dazzle them with brilliance, then baffle them with bullshit”.
I am not sure wich you were trying to do with your “steady state entropy rate balance for control volumes” explanation above. But I am sure it was one or the other.
Ron,
this is a standard book for thermodynamics: https://www.amazon.com/Fundamentals-Engineering-Thermodynamics-Michael-Moran/dp/0470495901
In this book the “steady state entropy rate balance for control volumes” is mentioned, which is one form of the second law in mathematical description. See below, in the 7th edition it is chapter 6, page 308.
What i have done is applying a standard engineering method to oil production. In principle, each person can do the same. There is no secret. I know, most people don’t have the required mathematical capabilities, and i know, most people have no idea about thermodynamics. So they have a problem to understand.
But this is neither brilliance nor bullshit, it is a standard procedure.
The Hills Group has applied the equation first and set up a report. Because i had worked in the natural gas industry in northern Germany with task of optimizing gas flow in pipes (thermodynamics), i have been fascinated to check their report and formulas. I found errors and a true core.
After setting up the theorical base for entropy generation during oil production, i searched for data checks to verify it. (see Feynman for scientific theories: https://www.youtube.com/watch?v=EYPapE-3FRw) Oil prices and car sales numbers are my means to check the theory.
The Hills Group Report was given a treatment here about 5 years ago. Here’s a link. What do you think of it?
On the Thermodynamic Model of Oil Extraction by the Hill’s Group
https://peakoilbarrel.com/on-the-thermodynamic-model-of-oil-extraction-by-the-hills-group/
“The car production history is consistent with the expected history of net energy loss of the oil production process.This forces me to believe in a decrease of produced crude oil,..”
Nice attempt to tie yourself in knots Berndt, as your favorite chart depicts so well.
Hickory, i’m still waiting for your prediction of the future of the car industry. I want to compare your and my predictions in one year.
@Survivalist,
The HG report has a lot of errors. Seppo Korpela has found them. The most important error is, that the HG did not recognize, that the calculated exergy is not required, because equipment detoriates, but because the earth crust temperature equilibrium is distorted. The calculated exergy itself has been correct.
But Seppo Korpela made his own mistakes: His biggest error is, that he did not recognize, that the HG calculation is based on the second law, and the second law is always valid. He concluded: Because the HG report is faulty, the second law is not valid for oil production. This, evidently, is wrong. He should have set up his own calculation to compare it with the HG calculation. Instead, he acted as a professor correcting the work of his students.
Berndt,
Professor Korpela remains unconvinced, as do I, I know my thermodynamics, but certainly not as well as a professor who taught engineering students for many years.
As I have pointed out many times there is a lot of energy that goes into the petroleum producing system from coal, natural gas, nuclear, and many other sources of energy, so you need to look at the entire Earth system and all energy systems for an adequate analysis.
The price of oil is not determined by thermodynamics as long as the petroleum producing system has other energy inputs besides crude oil plus condensate.
W. Edwards Deming: “In god we trust, all others must bring data”.
I still don’t trust Korpelas opinion. I prefer real world data to opinions.
Dennis, my diagram for the energy intensity contained all forms of primary energy, including coal, natural gas, oil, etc. So all forms of energy are included in the energy intensity curve. And the e.i.curve i used to generate the diagram below.
It shows a perfect fit between theoretical calculated energy cost and real world energy cost until 2021. No correction factor is necessary, it is 1.0. If oil energy would be the only important energy form, i would expect a factor of about three. But is is 1.0.
That implies, that all forms of primary energy are included in the diagram.
Brendt,
What is your bottom line here. That civilization is EROI negative now?
@Iron Mike
I believe, total energy production will get EROI negative in 2027. Oil production has got EROI negative some years ago, and is now subsidized by other energy forms.
Interestingly, if oil production stops now, total energy production will get EROI positive again. But the economy does not work without oil. And thats not what people like, they want to use their cars.
with one word: collapse
Berndt,
Nonsense.
Brendt,
Interestingly, if oil production stops now, total energy production will get EROI positive again.
How did you reach this conclusion please? Are you saying because oil EROI became negative sometime ago if we remove this element the rest of the energy sources are EROI positive?
@Iron Mike
Again, this is a conclusion from my diagrams. The light green triangle displaying the useful exergy in image “#_220816_A” is valid for an efficiency of 69%, near the theoretical limit of 71% for the Carnot process. The same light green triangle is displayed in “#_220815_A”. That implies, that the use of oil is highly efficient, with an efficiency near the Carnot process.
But, real machines (motors) using oil never work with efficiencies of 69%. Most have efficiencies between 30% and 50%, the rest of the energy is converted to anergy (heat).
My conclusion is: If oil would be the only energy source for oil production, the light green triangle would be smaller, and oil prices from 2008 to 2020 would have been lower. Example: If the efficiency had been about 62%, we can expect from image “‘220816_A” that the economy would reach negative EROIs today.
At the moment, the only explanation i have, why consumers can use oil with an efficiency near the Carnot maximum is: other, cheaper energy sources are involved. And that implies, that the total amount of exergy used in the oil production process is higher than the useful exergy content of oil.
Berndt,
A question about the #_220816_A chart.
How did you get the 62% for practical exergy and the 71% theoretical limit. Are you estimating these efficiencies based on some datum (car sales) ?
Yes i can see the triangle in your figure would be smaller with lower efficiencies and you are concluding oil prices would have dropped 2008 onwards due to civilization negative EROI i assume ?
Don’t you think you are oversimplifing something of a very high complexity. The datum for the carnot process efficiency could be completely wrong as a pointer. Secondly the dynamic nature of the global economy and credit availability play a possible role in this as well as a myriad of other factors.
For e.g.
Assume we have an oil well which is producing @ negative EROI. But the bank is willing to lend the company money to continue extraction due to high oil prices. All those entropy caculations would go out of the window would they not in your opinion ?
Explanation of diagram #_220816_A:
It shows specific energy contents of crude oil, that is energies per kg. The dashed green horizontal line is the thermal energy per kg. If the oil is burned, 12,97 kWh of heat are generated.
If the oil is burned in a motor, some of the energy can be converted in mechanical work. In an ideal machine, the carnot machine, the maximum value which can be converted in mechanical energy, is 71% (red line). The rest is converted into heat. This useful amount of energy is called exergy, the heat is called anergy. The Carnot machine has an efficiency of 71%.
Real machines can’t be as efficient as a Carnot machine, they have a practical value.
A total optimized machine can have 62% (black line). Motors in cars are even less efficient. Depending on the specific motor and the operation mode, they have efficiencies between 20% and 45%.
The values of 71% and 62% i took from the HG report, page 36.
The blue line is a result from the thermodynamic calculation. It shows the required exergy for oil production as a function of time. That amount of exergy is required for the change of the temperature equilibrium of the earth crust.
Oversimplifying: I analyze the oil production (world economy) as a system driven by energy, not by money. Many people do not understand the analysis. Its too complicated for them, so its not oversimplified.
LTO production is energy negative. It converts cheap energy (coal, gas) in expensive energy (oil), with an energy loss, but generating a financial profit. Banks lent money to companies, they are not interested in EROI, only in ROI.
@Bernd
Most the cheap natural gas of the USA is produced with fracking – and the tight oil wells produce a lot of gas, too.
So your cheap gas for getting the oil is a byproduct of the oil.
Of Interest .. KSA Production vs Exports vs Storage Reserves
https://www.theburningplatform.com/2022/08/12/oil-at-the-crossroads-belief-or-reality/#more-276485
Things seem to be getting tight for the Saudis…but they will make buckets of money on the way down
https://news.yahoo.com/saudi-aramcos-profits-already-88b-065444460.html
Cuba’s Peak Oil experiment phase II. Many are predicting a mass exodus from the
island. https://twitter.com/cubadebatecu/status/1557482282205827072/photo/1
If they exit the island, where would they go?
More Cubans immigrating to the U.S. by crossing from Mexico
https://www.latimes.com/world-nation/story/2022-04-25/more-cubans-immigrating-to-the-us-by-crossing-from-mexico?_amp=true
The trend lately seems to be heading for USA via Mexican land routes.
In 2010 ExxonMobil bought XTO shale gas company. It wasn’t thought to be a great bargain at the time and things haven’t got better since, although the high prices this year might be helping. The purchase doubled EM proven gas reserves and “discoveries” since have doubled them again. For shale gas discoveries really just mean that FIDs have been taken to develop known resources that convert them from probable to proven. This has been countered by continuous significant negative revisions, with large drops precipitated by any fall in gas price that are not then recovered as the price rises again. The amount lost is to close to that added from discoveries. Combined with steady production this means remaining reserves are now starting to fall. The rate of adding new gas through development appears to be flattening so reserves might start to drop more steeply and/or production will need to start declining. ExxonMobil is probably in the worst state for this of all the main shale gas operators but something similar might be on the cards for them all.
Saudi Aramco to raise output capacity to 12.3 million b/d by 2025
Saudi Aramco plans to raise its sustainable production capacity to 12.3 million b/d by 2025 as the world’s largest oil-exporting company accelerates plans to bring additional output to market to meet the needs of global consumers, its chief executive told reporters during an earnings call Aug. 14.
“It is going come gradually in 2024. I mean limited increase but in 2025, we should go to 12.3 million b/d and in 2026, we should go to 12.7 million b/d before reaching 13 million b/d by 2027,” CEO Amin Nasser said.
Saudi Arabia claims a current production capacity of around 12 million b/d but Platts Analytics estimates this at closer to 11.5 million b/d. The kingdom, alongside fellow OPEC producer UAE, holds virtually all of the world’s remaining spare capacity.
The kingdom plans to bring on additional capacity in increments, with its Dammam field set to provide a further 75,000 b/d by 2024, and the offshore Marjan and Berri fields expected to add 300,000 b/d and 250,000 b/d, respectively, by 2025. The expansion of the Zuluf field is projected to add another 600,000 b/d by 2026, with the Safaniyah development also set to add 700,000 b/d by late 2027.
https://www.spglobal.com/commodityinsights/en/market-insights/latest-news/oil/081422-saudi-aramco-to-raise-output-capacity-to-123-million-bd-by-2025
This is astounding. They have no plans to bring any new fields on line. I am sure that is because they don’t have any. They instead plan on increasing production from their very tired old giant fields and one supergiant field, Safaniyah. They even plan on increasing production from the Dammam. Dammam produced its first barrel of oil in 1935 and began producing commercially in 1938. It has been producing for over 80 years. Now they are going to try something new and increase its production by 75,000 barrels per day.
Strange that they did not mention Ghawar. Anyway there is something very strange about this revelation of how they are going to increase production by almost two million barrels per day. I will believe it when I see it.
As with anything having to do with Saudi oil, this is very complicated. Not to go conspiracy theorist but the Saudis doubled their purchase of Russian oil in the last quarter. There is going to be a lot of Russian oil “going off the market,” but transshipment has been used by Iran since the sanctions went on—the clandestine movement of crude oil has been refined. My point is that it would be child’s play to purchase 2 million barrels of oil from Russia each day (for thermal modulation and other domestic use) while increasing Saudi output. I have no doubt that they will employ the latest technology @ Dammam, but that field has been hammered and the rejuvenation program there is mostly good theater. From here on out, from the Middle East to Midland, sleigh of hand is the name of the game.
Ron,
It seems they claim their capacity is currently 12 Mb/d and it will increase to 13 Mb/d by 2027, so only a 1 Mb/d increase. As you know their real capacity is about 10.5 Mb/d, so perhaps their capacity will increase to 11.5 Mb/d. I will also only believe this has been accomplished when they produce at 11.5 Mb/d on average over 12 month period.
People throw around the term ‘collapse’ in a pretty haphazard way.
The term indicates a decline- but by how much and over what period?
Is it 30%, and lasting for a few years?
Or over 50% and permanent?
No, 20% over 10 years is not collapse, thinks I.
That is a moderate decline [averaging 2% a year].
The degree and timing of decline make a world of difference.
And that’s why I say thanks to Dennis for having the gumption to put the prospects as he sees them
out in this public view for everyone else to ponder over. With detailed justifications for his assumptions included. Open book, willing and asking for input variations.
Thanks again for all that/this!
Yeah, Dennis is a legit treat! I think it’s a bit humorous that Dennis is considered an optimist on a collapse blog. The sitcom writes itself; pure comedy gold.
I prefer the term rapid contraction, as opposed to collapse. Rapid is perhaps a subjective term that varies with perceptions of unease and ability to withstand it. Perhaps an economist type could define it and give it a meaningful threshold value for various categories of activity. Anyway, if we have a contraction of something important, like agricultural production or oil production; then it should be straight forward to measure it and state what it is. Then we can argue about whether it is rapid or not lol
If a 10% decline in both oil and food production means a reasonably concurrent 10% reduction in population, then it might feel rapid to the ones starving out, but kinda slow and boring to those out of work but doing better than starving.
Yeah, Dennis is a legit treat! I think it’s a bit humorous that Dennis is considered an optimist on a collapse blog.
To be fair Dennis is only an optimist when compared to the majority of posters on this blog. To the rest of the world he would be considered a crazed pessimist because he predicts peak oil to happen in the latter half of this decade. The vast majority of the rest of the world is not worried about the oil supply, they know, as the EIA has predicted, that oil production will keep climbing until at least mid century.
However he would be an optimist in the fact that he believes that as oil declines, renewables will kick in and the world will keep business as usual going until the end of time.
I guess it’s all just a matter of prespective.
I’m not sure it really matters if the decline in production is rapid or gradual. Capitalism and by default most of the world economy relies on growth that’s the basis of debt and expansion of wealth. All made possible by an expanding energy supply.
With that energy supply now starting to contract the world has to figure out how to survive with less tomorrow than you had today. Not just for a few months or years before a recession clears but perpetually. This is what when it becomes obvious will cause the shock. When stock markets crash they ultimately find a bottom because somebody somewhere believes that there will be a recovery and it is a buying opportunity the same applies to housing and any other asset class. When the penny drops that things will never improve in fact the opposite is true then sentiment is dead.
Ron,
That is somewhat correct. I think there will be a demographic transition which will lead to stable and then falling population. World real GDP per capita has grown at a relatively stable rate for about 50 years (around 1.5% per year), this might continue, but if population is falling at 1.5% per year this would lead to no growth in real GDP and if population falls faster than 1.5% per year, real GDP growth will be negatve.
Business as usual is a moving target and changes all the time. For things to remain the same would be unusual. That has never occurred in my lifetime.
It used to be so poetic. For example, the saying was, “As Ghawar goes, so goes the world.” And when the esteemed oil minister Ali Al-Naimi was asked in 2015 about declining prices he replied, “No one can set the price of oil, it’s up to Allah.”
But under the stoic surface, things were going to hell, and had been for some time. Circa 2005, experienced and knowledgeable Glenn Norton reported that the water cut @ Ghawar was 30% and the decline rate was 8%. To hold the reservoir pressure, 7 million barrels of seawater were being pumped into Ghawar on a daily basis. In Haradh and Khurais it was worse.
Maybe someone came up with revolutionary technology. Even as Allah turned sour on the oil industry and let the price of oil go from $114 to $27, KSA kept production steady. Alas, the new prince thought that al-Naimi had lost his touch, not Allah, so replaced him in 2016.
Alongside his other talents, Al-Naimi dropped hints. One of them was that the rest of the world should keep to the hunt for oil. But the global climate change people—the Black Rocks and private equity houses—had a louder voice. The rest of the world stopped looking.
Now no one outside Saudi Arabia has a firm grasp on the status of their production capacity. I personally believe that Ghawar is in very steep decline, and any “enhanced capacity” will derive from the KSA using Russian oil for Saudi domestic purposes.
This could go into a steep decline, and very rapidly, which is what the fellow in Italy called the Seneca Effect. Maybe that’s overly dramatic but if you take Glenn Norton’s numbers and apply them to any depletion curve in the world, you have to shake your head in wonderment at the current level of Saudi production.
So you genuinely believe that the folks at Exxon stopped looking for oil because of some climate protests? And not because they don’t have anywhere else to drill? For real?
Yes, I do. First, Exxon had Guyana, and that was a complicated project with a massive amount of gas—enough that they had to pause and get the platforms manufactured to handle that kind of volume. Second, Exxon wasn’t really making much money at the time. Thirdly, and this was so important that you might want to Google it, about a third of the Exxon board was replaced by green energy folks. A small hedge fund named Engine No. 1, without a huge stake, got a few board seats. For the record, I don’t say things that I can’t substantiate and personally believe.
Thats a nice political narrative Gerry, but drilling success for finding new fields has been falling off the cliff for the past 15-20 years.
XOM’s liquids production has been essentially flat for the past decade, ranging between 2.1 and 2.4 million BPD annually.
Oil is down 3.5% today on China data. This isn’t just Covid lockdowns. Consumers in Europe aren’t consuming as much due to high prices. Which results in bad data coming out of China.
Lack of cheap energy is deflationary in the long run.
Growth and inflation are going to fall off a cliff from here. Because we’re heading into global recession. Not because central banks are tightening. They going to make it worse by tightening. We going to overshoot to the downside into outright deflation. Which is why $25 oil is in the cards.
Consumers in Europe aren’t consuming as much due to high prices. Which results in bad data coming out of China.
Somehow that logic just don’t add up. What would Europeans consuming less oil have to do with Chinese data? China is in Asia, not Europe.
I know exactly why the data coming out of China is horrible and it has nothing with the price of oil in Europe. Yea, some provinces in China are in lockdown but the real cause of bad Chinese data is construction in China is 30% of their economy. And almost all construction in China has stopped. That plus there is a run on their banks. People who were investing in new apartments have stopped paying their mortgages because construction has stoppe on the apartments they were paying. And some banks have told them their contractors are broke so there are all trying to get their money out of the banks and the banks wont give them a dime of their deposits.
Yes, the data coming out of China is horrible and it is not going to get any better.
But look on the bright side. China will build no more ghost cities.
I guess HHH wanted to say: Europeans consuming less because of high energy prices. This results in less buying from China!?
Less burning and buying is deflationary!
My opinion here is:
The OPEC is strengthened by it’s success cleaning up the COVID clut in oil faster than thought – and all members know this by their balance sheet.
So they will cut 10mbpd when oil goes under 50$ and 20 when it goes under 40. Compliance will be good.
Shale production will crash the same time.
Good luck to get some oil then, even when it’s cheap. It can happen on the paper market, but you won’t get much real oil for this money once the tanks are empty. And prices for oil supply (pipes, contractors, trucking …) only will come down when demand craters, too – nobody will invest in expanding supply here in a recession. And cratering demand on oil supply stuff will result in even less oil.
I’m with you that there will be a lot of volatility in the energy marktets, and big spikes down. The paper markets will get really crazy when there are more margin problems.
The most importand date is somewhere in November when Xi gets a new term (or not). He can drop the COVID police after this if he wants.
Eulenspiegel,
I doubt we see $25/bo for any length of time prior to 2040, possibly a one month average price might reach that level, if we have a severe financial crisis or other severe economic recession. the 12 month average price of oil might fall below $30/b after 2050 or 2060, but not very likely before then unless we see Great Depression 2 with Worldwide unemployment levels of 25% or higher, maybe if classical economics comes back into fashion (or all economists become brain dead).
China is rolling past its demographic peak. It’s where Japan was in 1989. This means death for property markets, slow or fast we are yet to see. Note that property prices in Japan are still below their ‘89 peaks. And Covid lockdowns are reducing births even faster. Think about it. Some cities are seeing 30-40% declines in births rates for the first six months of this year. There is a protest movement called The Last Generation which refuses to reproduce because of their totalitarian government. Of course this has all been censored. The long and short of it is that China is no longer going to drive demand on the world stage. They are becoming an isolated police state gerontocracy with every movement controlled by their smart phones.
https://news.yahoo.com/china-birth-rates-plummet-more-223414630.html
HHH that is not what the data shows-
EU imports from China have grown from 489 billion Euro Q1 2019 seasonally adjusted (precovid)
up to 664 billion Euro Q1 2022.
The pandemic decline in EU imports from China recovered back above the prior peak 1 year ago
[508 B Euro Q2 2021]
https://ec.europa.eu/eurostat/statistics-explained/index.php?title=EU_international_trade_in_goods_-_latest_developments&oldid=572379
Europe like everyone else is paying way more for a lesser amount of goods and services. That’s not growth nor is it good for the economy.
Volume wise is a different story. Less volume means not as much work going on in China.
Japan is in same boat paying even more 35%
More for 5% less total goods and services.
That’s not growth. That’s inflated prices.
Trade data temporarily doesn’t look too bad until you look under the hood at the details.
But let’s wait till winter comes to Europe this year. And see what the trade data says. My guess is if they don’t have near enough natural gas.
They won’t be ordering too much from China.
At the moment we have for electricity generation complete chaos in Germany.
The progressive green-social-liberal government allowed old coal plants to be fired up again to save nat gas —-
… and then sabotaged it. The regulation is, the plant only may start when it has a 4 week coal pile. And the permission can be canceled any time the “gas emergency” is called of, leaving the companies on a pile of several 100 million € coal.
So no plant has started yet, leaving the gas plants on the net which the green fraction likes.
Chaos to come.
Oh, and in principle 4 GW of old oil buringing plants could be fired up now, too. So oil usage has a wildcard in winter here. They are all from the 50s and 60s, so the efficiency is not the best.
At least, a rain front end of the week will help a bit with the Rhine transport issue – for a few weeks at least. When the Rhine is down several weeks, coal and Diesel supply in the southwest will get difficult.
The railway has already changed priority – commuter local trains now have to wait for freight trains, not the other way around as usual.
More chaos to come – but at least the stock exchange has written off the crisis, expecting new hights.
PS: On top, the real estate sector is in turmoil because a interrest rate change from 1 to 3% in just one year made many projects too expensive.
More chaos to come
Russian oil production down in August
August 15, 2022
Average daily oil and condensate production in Russia stood at 1.428 million tonnes in the first weeks of August, down 3% from July, sources familiar with the data told the Kommersant newspaper. (Reporting by Maxim Rodionov; Editing by Christian Schmollinger)
Reuters
1.428 million tons work out to be 10,467,000 barrels per day using 7.33 barrels per ton. That is a decline of almost 300,000 barrels per day, so far. The below chart shows what that will look like if they hold that level for the rest of the month. However, it is not likely that they will hold that production for the rest of the month. Their production level is dropping therefore their production will likely be even lower for the rest of the month.
Ron
The report I posted about a week ago stated that early July production was 10.78 Mb/d. So the early August numbers are down by a little over 300 kb/d and confirm the July numbers.
Ovi,
Lately the numbers have been a little weird with data for the first couple of weeks of the month being reported, but it is harder to find data for the entire month, also some places report crude only, some report C plus C and others report C plus C plus NGL and it is often not stated very clearly (sometimes they call it “oil production”, but different people have different definitions for “oil”.
Ovi, perhaps you didn’t catch it but there was a final report out of Russia that came out after the one you speak of. That report put July Russian production at 10.76 million barrels per day.
Ron
I did miss that one.
Net Oil Import Dependency Ratio- Europe
In 2017 the European Union (EU) relied on net imports for 87% of its oil consumption. This ratio, known as the oil import dependency rate, is unchanged from 2016 and two percentage points below the peak of 89% recorded in 2015.
In 18 EU Member States, the levels of net oil imports were close to their oil consumption levels, with dependency rates lying between 96% and 104%. Dependency rates above 100% indicate a build-up of oil stocks, while negative dependency rates indicate a net exporting country.
The EU Member State with the highest oil import dependency rate in 2017 was Estonia (115%). At the other end of the scale, the dependency rate for the United Kingdom was 35% and -4% for Denmark.
https://ec.europa.eu/eurostat/web/products-eurostat-news/-/DDN-20190828-1
Would love to see data for the rest of the world
I found 2018 data for China 71%, India 77%, Se Asia 65%
In current times, there is no way to validate either Russian oil production or exports. There is said to be a transshipment hub off the west coast of Portugal expressly to handle Russian bootleg oil. I’m sure it’s a mere coincidence but 13 oil cargo ships were recently purchased by a difficult to trace Chinese company. In the U.S. we can shut in some wells and when we crank them up again they usually work (though they may take a production hit). Not so for those old Siberian wells. Putin probably hasn’t dropped production a whit. Saudi Arabia is buying more, on the record, and possibly much more sub Rosa. China and India are voracious customers. Sri Lanka, anyone? There is no shortage of customers for Russian oil, much of which has hit a well established transshipment route.
EIA Drilling Productivity Report is out and another significant downward revision in oil production estimates.
August production was adjusted down160k bbl/d with Permian accounting for 73% of it.
The amount of wells that need to be drilled in the Permian to keep the field growing in getting very high.
It will perhaps soon need to complete over 6,000 wells per year just to keep it flat.
Yep!!!!!!
Dennis has proposed that 11 big oil producers will drive production for the next several years and keep peak oil in the future. It is my contention that this will not happen. As of April of this year, that Big 11 was down by about 2 million barrels per day from the World peak of November 2018. However, the World less that Big was down a whopping 3 million barrels per day from that November 2028 peak. And I think it obvious they will continue to decline.
That means that the Big 11 would have to increase production by 5 million barrels per day for the world to reach the 2018 peak. It is blatantly obvious that is not going to happen.
The Big 11 that will keep peak oil at bay…. Yeah right!
These are brilliant charts. They certainly put things in perspective.
Mike B,
In 2019, 4 of big 11 producers were reducing output due to OPEC quotas, so the “plateau” is due to that. The period from 2014 to 2018 is more representative of what the big 11 might do in the future. This is about 10000 kb/d over a 5 year period or an average annual increase of roughly 2000 kb/d. Also note that the World less big 11 is affected by Venezuela which went from 2500 kb/d in 2014 to about 700 kb/d in 2019 and is responsible for much of the World less Big 11 decrease (about 1800 kb/d out of a total of 3500 kb/d for the entire World less Big 11). Even if Venezuela is included the decrease for the whole group is 600 kb/d on average, so the net increase would be 1400 kb/d for World output over the 2014 to 2018 period which is the important figure.
Also keep in mind that the 12 month average is more important than single month records. Currently the big 11 is 3000 kb/d below the previous 12 month peak, if they increase output by about 2/3 of their previous rate of increase a new peak is reached in a little over 3 years. Ron claims this cannot happen, we will see.
The period from 2014 to 2018 is more representative of what the big 11 might do in the future.
I find it hilarious that you really believe that. The EIA predicts Russia to be down 2 million barrels per day by the end of this year. Of course, in about 5 years or so they may recover… somewhat. But they will likely never reach 10 million barrels per day. My guess is that they will recover to about 9 million bp/d by the end of the decade.
Also, from November 2018 to April 2022, Venezuela was down 571 K bp/d, not 1800 kb/d as you posted. Venezuela was way over half the way into its decline when the world peaked in November 2018. You should check your facts before you post Dennis. Venezuelan production stood at 1,331 Kb/d on in November 2018. They account for about one-sixth of the total decline of the World less the big 11.
World oil production will be much lower in 2023 than in 2022 and lower still in 2024.
Ron,
I was looking at 2014 to 2019, so get your facts straight and read what I have written.
If you look at your chart fro World less big 11 it is pretty clear that output declined fairly steadily from 2014 to 2019. There is nothing special about November 2018 except that OPEC increased output ahead of quotas as they always do. The 12 month average is what matters in my opinion, not any single month. In addition looking at April 2022 is silly, the pandemic messed everything up. Trends from 2014 to 2018 (for OPEC) or 2014 to 2019 for non-OPEC are much more instructive.
Dennis, the pandemic demand decline is over. I know it messed everything up but what is happening now is all flat-out post-pandemic production. There was no demand destruction in April 2022 and since that is the last World data we have, and since every nation on earth was producing flat out in that month, your assertion that me stressing that month as “silly”, is not just silly, it is absurd, no, beyond absurdity.
Agree Ron, all eyes on the top 3 (Russia, Saudi Arabia, and US)…we have a very good idea of where all other producers are headed…
I stand by previous analysis that things get really bad over next five years…beyond 2030 looks extremely bleak, likely total loss of global trade. Trading partnerships may emerge at local/regional scale…
Ron,
Venezuelan C plus C output from the EIA from Jan 2014 to April 2022 in chart below.
North Dakota data is in.
ND Monthly Oil Production Statistics
Not much is happening in North Dakota. Their production was up 37,191 barrels per day to 1,096,251 barrels per day in June from a May level that was still depressed from the April weather event.
Last time the SPR was this low was 1985:
Weekly U.S. Ending Stocks of Crude Oil in SPR (Thousand Barrels)
– Aug. 2022 – 464,558
– Apr 26, 1985 – 464,051
Peak SPR: Jan 01, 2010 726,617
SPR in 2010 was around 6 weeks supply…
SPR is currently 64% of the 2010 peak.
Works out to ~3 week supply of crude oil, currently.
Crude oil price peaked recently in June at $120 per barrel. It’s currently below $90…
Imagine a reversal is coming soon.
Kengeo,
The important figure is net imports, in 2010 it was about 9400 kb/d, but in 2021 the US was a net exporter of crude plus petroleum products. If we look at crude plus condensate only in 2010 US net imports of crude was 9172 kb/d and in 2021 it was 3130 kb/d, so about 3 times less than 2010. So a comparble leve to the 2010 SPR level would be about 242 million barrels relative to 2021 net imports of crude, currently we seem to have an extra 220 million barrel cushion in the US. Not much need to worry.
Worried?!? Dennis – The time to worry was 50 years ago…
It was a great run from 1980s to 2000s…but the cheap oil ran out and the rest is history…
Peak oil started in mid-to-late 2000s and finished up in late 2010s (2018 per Ron), Obama was the peak oil president…Trump the aftermath….Biden…the corpse?
World exports tells the story:
Dennis.
Do you think USA will not refill its SPR?
I’m thinking it just might not.
Seems like many think the SPR is not needed given the “abundance of US shale” combined with the idea that peak demand has passed in the USA.
I think surely the SPR sales will stop after the mid-term elections? But also think Congress had committed to SPR sales in future years, before this big draw occured due to the price spike earlier this year.
Shallow sand,
I do not know if the SPR will be refilled in the short term, one problem with looking at net imports is that the exported oil is not useful for the US, so we really should look at imports of crude.
By that measure in 2010 we imported 9213 kb/d of crude and in 2021 crude imports were 6110 kb/d. In 2010 ending SPR stocks were 726.5 million barrels or about 79 days of average crude imports. For a similar level in 2021, about 483 million barrels would be needed. For week ending August 12, 2022 the SPR was at 461 million barrels and this does seem a bit low. It seems likely the SPR will be refilled to about a 90 day supply of crude oil imports, roughly 540 million barrels. I imagine the government might wait for oil prices to drop, though they might be waiting a long time, or they will do this after the mid-term elections.
Here’s my attempt to put many of the folks in the forum into a diagram on where they think global oil production is at (pre/post peak/near peak)…
Please reply if I got it wrong and I’ll move you (or reply and I’ll add you).
I made some guesses based off comments from June-August timeframe.
Enjoy…
Looks about right though I am not sure about Ovi. I do not remember him expressing an opinion on his expected date of peak oil. I just assumed he pretty much agreed with me. But I could be wrong.
Ron
Kangeo has it about right with a bias to the early side, based on today’s post. Let me clarify, my 2025 ±2 is for the second peak.
A new thread on Non-OPEC production has been posted
https://peakoilbarrel.com/russia-oil-drop-collapses-april-non-opec-production/
A new open thread Non-Petroleum has been posted.
https://peakoilbarrel.com/open-thread-non-petroleum-august-17-2022/
On Hickory…I am really just an observer on this with no expertise or global insider knowledge that allows me to pick a date on such a topic that has so many unknown variables.
I’m pretty certain that we are well within the peak rocky plateau phase (peak +/- 7%).
I’m not one of the people who devotes much mental energy to knowing when peak is, but I appreciate all the comments on it, especially the few that are well informed.
I am much more focused on just what the implications of the oil depletion era are.
So put me in the middle or off the chart to be more accurate.
“Not sure but sooner than later” seems right Ken. I once thought PO was entirely about geology but realize now the exact date is as much about politics, money and tech, none of which are predictable. Well, except for debt. Since the conventional peak (and really since the first US peak) we’ve been borrowing more each year than the economy has grown. So it is more the confluence of peak oil, peak debt and peak democracy that I think about.
On predicting dates, I am more interested in the timing of two moments
– the first being Peak Global Combustion day [fossil fuels]. I’m leaning to sometime around 2037, being the moment when combined coal, nat gas, and oil derivatives combustion reaches apex, best measured in CO2 emission for accurate tracking. Of course this has to do primarily with global supplies, but also human population and level of technologies deployed/afforded. It will be an epic day in the history of apes with fire. It will be hot, crowded, and I suspect a strong scent of sweat, ash and fear. Peak population will occur within 2-3 decades of peak combustion I suspect.
-the second being the Terminal Deforestation Event [TDE]
Will it happen, and when? Before humans had fossil fuel they cut the forests and burned wood to heat, cook and smelt rock to get metal. When fossil fuel is unavailable they do the same, now with great efficiency and on the vast scale of 8-10 billion people when it happens. When fossil fuels peter out, those without some of the other sources of energy will burn through the forests at breakneck speed. I call it an event and in some areas it just may be- such as at the great Congo rain-forest. But really the ‘event’ will happen in different regions at a staggered pace, maybe spread out over 3 decades. I think this a high probability eventuality.
Hickory,
There may be cheaper sources of energy than biomass in the future, including coal, natural gas and oil, along with wind, solar, hydro, nuclear, geothermal, and tidal energy. There is still a lot of room for using energy far more efficiently with existing technology than it is used today, as energy becomes more expensive, efficiency is likely to improve.
A new thread on Non-OPEC production has been posted.
https://peakoilbarrel.com/russia-oil-drop-collapses-april-non-opec-production/
A new open thread Non-Petroleum has been posted.
https://peakoilbarrel.com/open-thread-non-petroleum-august-17-2022/