Predicting Stratospheric Winds

Last week the USA shot down a suspected Chinese balloon with an air-to-air missile. The balloon itself was obviously just following the stratospheric jet stream and was not completely controllable in terms of navigation [1]. This brings up an interesting issue, as the state-of-the-art in atmospheric science has never been able to predict which direction the jet streams will follow at any future time. Nowhere is this more evident than with the stratospheric winds that encircle the Earth along the equator, known as the QBO. Scientists have been able to heuristically gauge when this wind will reverse it’s direction (hence the name Quasi-Biennial Oscillation) but have never been able to explain why it reverses. The first time they were able to systematically measure it was via the launching of instrumented weather balloons (radiosondes) in the 1950’s.

The QBO is visualized by the following animation:

Read More

Explaining Natural Climate Variations

Get this out of the way first. Making a prediction and then waiting 20-30 years to gather sufficient data to validate the prediction is not the way to do science. Yet this is the expectation in geoscience and earth science, where quick-turn-around of controlled experiments is not possible. The result of this lack of experimental control is that progress in climate science is glacially slow — since most models will fail to some degree, a geophysicist or climate scientist working in a specific domain may only get one chance in their career to test a long lead-time hypothesis. Feedback on results occurs over decades and breakthroughs are rare (see plate tectonics). So what I want to get out of the way first is: don’t expect any predictions from me. And I guarantee someone will ask for one.

However there are ways around having to do a prediction. One option is to consider the application of cross-validation of a model against existing data. As I was trained in the lab world of controlled experiments, this seems quite reasonable. One gets a fast turnaround on evaluating a model so you can try something else, or move on to another problem.

Read More

The Oil Shock Model and Compartmental Models

The coronavirus pandemic and the global oil economy

Chapter 5 of our book Mathematical Geoenergy describes a model of the production of oil based on discoveries followed by a sequence of lags relating to decisions made and physical constraints governing the flow of that oil. As it turns out, this so-named Oil Shock Model is mathematically similar to the compartmental models used to model contagion growth in epidemiology, pharmaceutical/drug deliver systems, and other applications as demonstrated in Appendix E of the book.

One aspect of the 2020 pandemic is that everyone with any math acumen is becoming aware of contagion models such as the SIR compartmental model, where S I R stands for Susceptible, Infectious, and Recovered individuals. The Infectious part of the time progression within a population resembles a bell curve that peaks at a particular point indicating maximum contagiousness. The hope is that this either peaks quickly or that it doesn’t peak at too high a level.

Read More

Climate Variability vs AGW

Emissions of CO2 from burning fossil fuel contributes significantly to a gradual increase in the world’s average temperature.  What’s also known but less understood is the erratic variation in the average temperature due to cycles in the ocean, resulting in episodes of El Nino and La Nina.  Some claim that these temperature extremes are well-understood as a result of changes in the trade winds, as the wind pushes the water around the Pacific ocean, exposing colder or warmer water to the surface. This may have been a perfectly acceptable explanation, except it doesn’t address what causes the wind to vary — in other words the source of the erratic wind variation is just as unknown.

So we are still left with no root cause for the ocean cycles. Apart from the strictly seasonal changes we have no explanation for the longer-term pattern of natural variation observed.

Read More

Arguments over RCP8.5

The climate change scientific consensus is summarized via the annual IPCC documents. In one of the IPCC sections, projections of CO2 emissions from fossil fuel usage are made in the context of several scenarios, which are referred to as Representation Concentration Pathways (RCP).  Historically, the “business-as-usual” pathway was declared to be RCP8.5.

That has worked out as describing an extreme emission scenario IF society did not take corrective action in reducing emissions. In other words, RCP8.5 tracks a growth path in fossil fuels that is extrapolated from the current economic growth rate and largely dead-reckoned FF production increases.

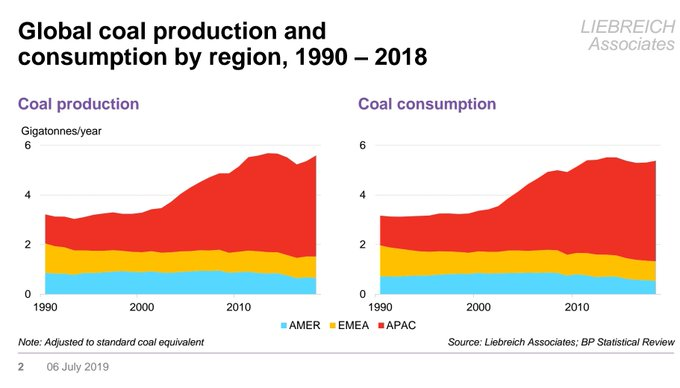
Recently an energy analyst named Michael Liebreich challenged this assumption in the context of the possibility of greater fossil fuel depletion than is currently mapped out in the IPCC, calling the RCP8.5 estimate “bollox” in a tweet.  When challenged on this assertion, he rationalized his claim as follows:

“Here’s why I reject scare stories based on RCP 8.5 and SSP5. They assume a vast increase in coal use in the absence of more international cooperation on climate. But the reality is that it coal power is peaking already. Climate change is scary enough, we don’t need ghost stories.”

— Michael Liebreich (@MLiebreich) August 4, 2019

Read More