A Guest Post by Dr. Minqi Li, Professor
Department of Economics, University of Utah
E-mail: [email protected]
September 2018
This is Part 4 of the World Energy Annual Report in 2018. This part of the Annual Report provides updated analysis of world coal production and consumption, evaluates the future prospect of world coal supply and considers the implications of peak coal production for global economic growth.
This report uses Hubbert linearization to evaluate a region’s ultimately recoverable coal resources where a Hubbert linear trend can be meaningfully established, that is, where a clear downward trend of the annual production to cumulative production ratios can be identified and has been established for at least several years. Otherwise, this report uses alternative sources to establish a region’s ultimately recoverable coal resources, such as official reserves, official projections, or estimates made by energy research institutions.
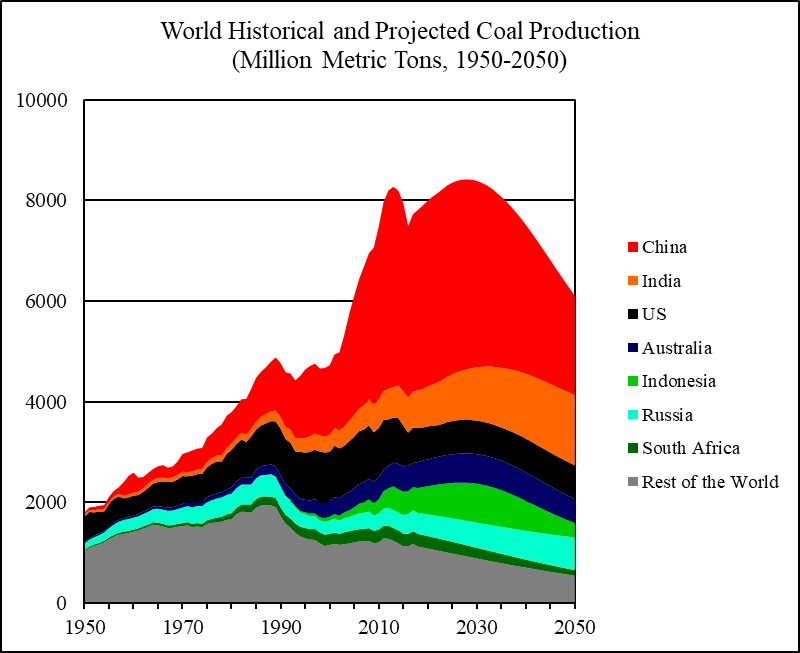
Figure 14 World Historical and Projected Coal Production, 1950-2050
Figures are placed at the end of each section.
Coal Consumption by Major Economies, 1990-2017
According to the BP Statistical Review of World Energy, world coal consumption was 3,732 million tons of oil equivalent in 2017. Between 2007 and 2017, world coal consumption grew at an average annual rate of 0.8 percent.
Figure 1 compares the historical world economic growth rates and the coal consumption growth rates from 1991 to 2017. The coal consumption growth rate has an intercept of -0.031 at zero economic growth rate and a slope of 1.496. That is, coal consumption has an “autonomous” tendency to fall by 3.1 percent a year when economic growth rate is zero. However, an increase (or decrease) in economic growth rate by one percentage point is associated with an increase (or decrease) in coal consumption by about 1.5 percent. R-square for the linear trend is 0.45. In 2017, world coal consumption grew by 0.7 percent, a rate that is 1.9 percentage points below what is implied by the historical trend.
Figure 2 compares the per capita coal consumption in relation to per capita GDP for the world’s six largest national coal consumers and the European Union.
China is the world’s largest coal consumer. In 2017, China’s coal consumption was 1,893 million tons of oil equivalent, accounting for 51 percent of the world coal consumption. China’s per capita coal consumption peaked at 1.45 tons of oil equivalent in 2013. By 2017, China’s per capita coal consumption fell to 1.37 tons of oil equivalent.
India is the world’s second largest coal consumer. In 2017, India’s coal consumption reached 424 million tons of oil equivalent, accounting for 11 percent of the world coal consumption. From 1990 to 2017, India’s per capita coal consumption rose from 126 kilograms of oil equivalent to 317 kilograms of oil equivalent. If India’s per capita coal consumption continues to follow its historical trend in relation to per capita GDP, India’s per capita coal consumption will rise to 676 kilograms of oil equivalent by 2050 (when India’s per capita GDP is projected to rise to about 19,000 dollars). India’s population is expected to grow to 1.72 billion by 2050. Given these projections, India’s coal demand will rise to about 1.2 billion tons of oil equivalent by 2050.
The United States is the world’s third largest coal consumer. In 2017, the US consumed 332 million tons of oil equivalent, accounting for 8.8 percent of the world coal consumption. The US per capita coal consumption peaked at 1.92 tons of oil equivalent in 2000. The US coal consumption has declined sharply since the Great Recession of 2008-2009. By 2017, the US per capita coal consumption fell to 1.02 tons of oil equivalent.
The European Union is the world’s fourth largest coal consumer. In 2017, the EU coal consumption was 234 million tons of oil equivalent, accounting for 6.3 percent of the world coal consumption. The EU per capita coal consumption was 957 kilograms of oil equivalent in 1990. By 2017, the EU per capita coal consumption declined to 457 kilograms of oil equivalent.
Japan is the world’s fifth largest coal consumer. In 2017, Japan’s coal consumption was 121 million tons of oil equivalent, accounting for 3.2 percent of the world coal consumption. Japan’s per capita coal consumption rose from 632 kilograms of oil equivalent in 1990 to 939 kilograms of oil equivalent in 2008. In 2017, Japan’s per capita coal consumption was 950 kilograms of oil equivalent.
The Russian Federation is the world’s sixth largest coal consumer. In 2017, Russia’s coal consumption was 92 million tons of oil equivalent, accounting for 2.5 percent of the world coal consumption. Russia’s per capita coal consumption declined sharply from 1.23 tons of oil equivalent in 1990 to 685 kilograms of oil equivalent in 1998. By 2017, Russia’s per capita coal consumption fell to 639 kilograms of oil equivalent.
South Korea is the world’s seventh largest coal consumer. In 2017, South Korea’s coal consumption was 86 million tons of oil equivalent, accounting for 2.3 percent of the world coal consumption. South Korea’s per capita coal consumption surged from 569 kilograms of oil equivalent in 1990 to 1.67 tons of oil equivalent in 2011. In 2017, South Korea’s per capita coal consumption was 1.68 tons of oil equivalent.
Rising coal consumption in several major Asian economies such as Japan, South Korea, India, and Indonesia suggests that it is premature to declare that global economic growth has been decoupled from coal consumption.
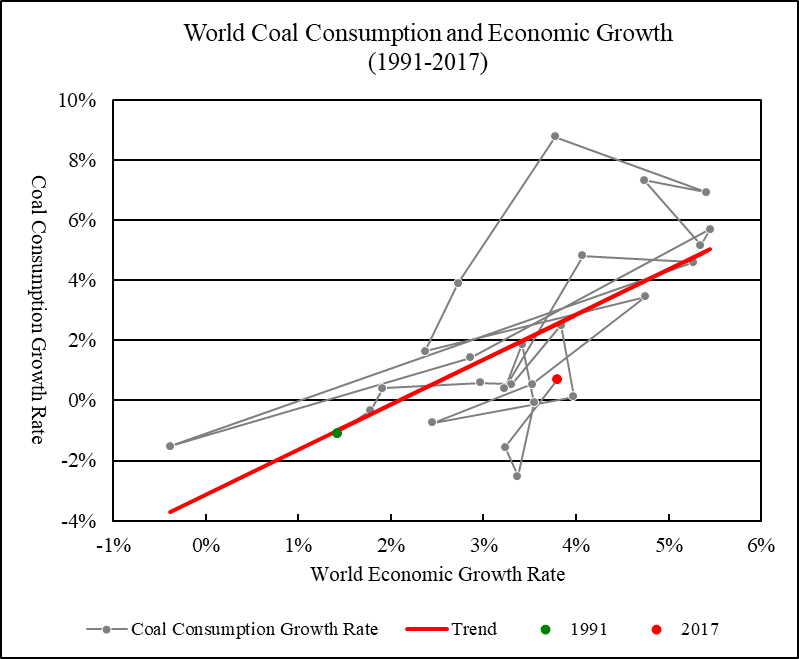
Figure 1 World Coal Consumption and Economic Growth, 1991-2017
Linear Trend: Coal Consumption Growth Rate = -0.031 + 1.496 * Economic Growth Rate (R-square = 0.448)
Sources: World coal consumption from 1990 to 2017 is from BP (2018). Gross world product in constant 2011 international dollars from 1990 to 2016 is from World Bank (2018), extended to 2017 using growth rate reported by IMF (2018, Statistical Appendix, Table A1).
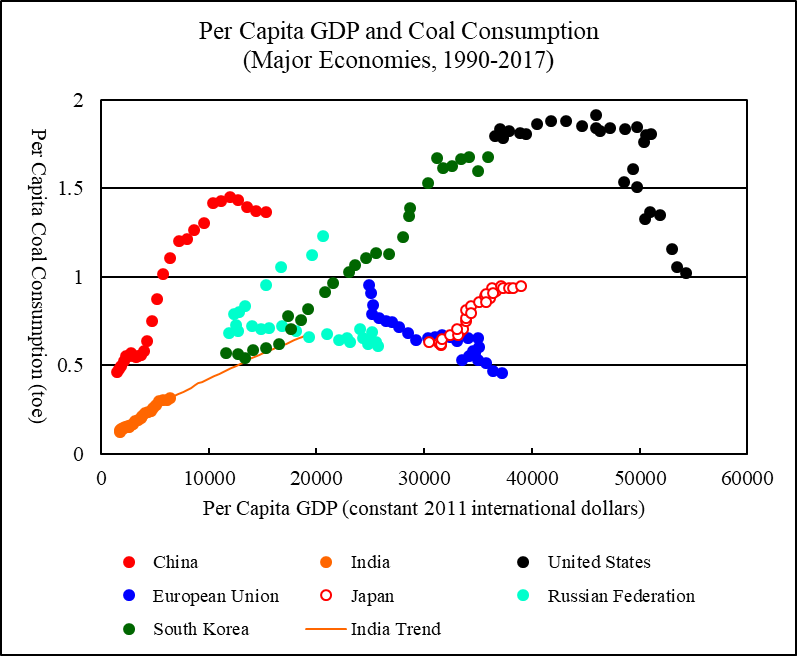
Figure 2 Per Capita GDP and Coal Consumption, Major Economies, 1990-2017
Sources: Per capita coal consumption and per capita GDP are calculated using data for coal consumption, GDP, and population. National and regional coal consumption from 1990 to 2017 is from BP (2018). National and regional GDP from 1990 to 2016 is from World Bank (2018), extended to 2017 using growth rates reported by IMF (2018, Statistical Appendix, Table A1, A2, and A4). National and regional population from 1990 to 2016 is from World Bank (2018), extended to 2017 by assuming that the 2017 population growth rates are the same as the 2016 growth rates. To project India’s per capita coal consumption, a log-linear relationship is estimated between the per capita coal consumption and per capita GDP for the period 1990-2017. India’s GDP and population projections from 2018 to 2050 are from EIA (2017, Reference Case, Table A3 and Table J4), adjusted to make the projected GDP and population levels in 2017 matching the levels reported by World Bank (2018).
China
China is the world’s largest coal producer. In 2017, China produced 3,523 million metric tons of coal (1,747 million tons of oil equivalent), accounting for 46 percent of the world coal production (in term of metric tons). China’s coal production peaked in 2013 at 3,974 million metric tons.
Although China’s coal production may have peaked in 2013, it remains premature to apply Hubbert linearization to China’s coal production as the annual production to cumulative production ratios have not yet settled on a relatively stable downward trend. This report assumes that China’s ultimately recoverable coal resources are the sum of historical cumulative production and the official reserves. China’s cumulative coal production up to 2017 was 82.1 billion metric tons (cumulative production up to 1980 is from Rutledge 2011, extended to 2017 using annual production data from BP 2018). China’s official coal reserves at the end of 2017 were reported to be 138.8 billion metric tons (BP 2018). The ultimately recoverable coal resources are estimated to be 220.9 billion metric tons.
Based on the above assumptions, China’s coal production is projected to rise to 3,807 million metric tons by 2025 before entering into permanent decline. By 2050, China’s coal production will fall to 1,968 million metric tons. Figure 3 shows China’s historical and projected coal production.
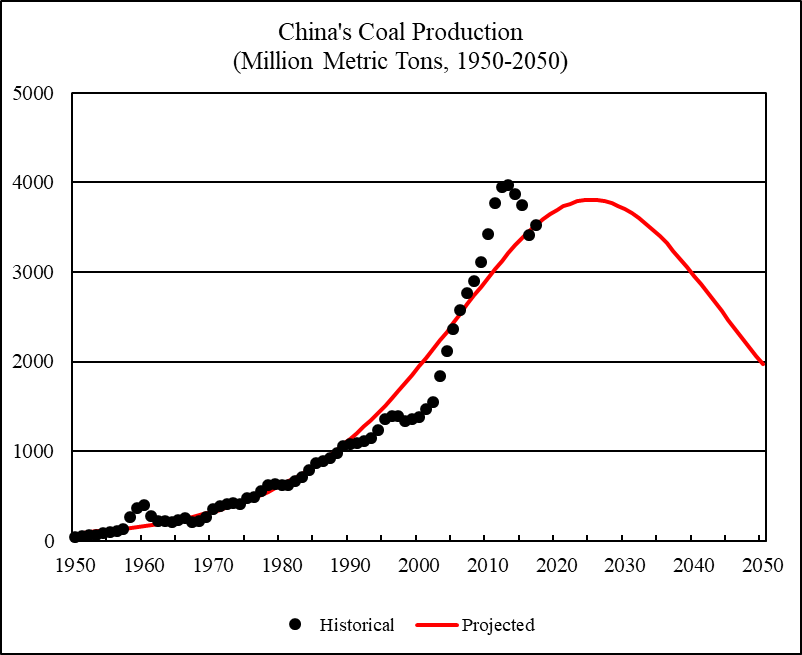
Figure 3 China’s Coal Production, 1950-2050
Sources: China’s historical coal production from 1950 to 1980 is from Rutledge (2011); coal production from 1981 to 2017 is from BP (2017). To project China’s coal production, I used a logistic curve assuming the ultimately recoverable resources are the sum of cumulative production and official reserves. The parameters are calculated so that the projected annual production equals the actual annual production in 2017.
India
India is the world’s second largest coal producer. In 2017, India produced 716 million metric tons of coal (294 million tons of oil equivalent), accounting for 9.2 percent of the world coal production (in term of metric tons).
This report assumes that India’s ultimately recoverable coal resources are the sum of historical cumulative production and the official reserves. India’s cumulative coal production up to 2017 was 17.2 billion metric tons (South Asia’s cumulative coal production up to 1980 is from Rutledge 2011, which is assumed to be India’s cumulative coal production up to 1980 and extended to 2017 using India’s annual production data from BP 2018). India’s official coal reserves at the end of 2017 were reported to be 97.7 billion metric tons (BP 2018). The ultimately recoverable coal resources are estimated to be 114.9 billion metric tons.
Figure 4 compares India’s historical and projected coal production and consumption. India’s coal production is projected to rise to 1,426 million metric tons by 2050. India’s coal consumption is projected to rise from 1,032 million metric tons (424 million tons of oil equivalent; 1 ton of oil equivalent = 2.43 tons of India’s coal) in 2017, to 1,184 million tons in 2020, 1,730 million tons in 2030, 2,314 million tons in 2040, and 2,822 million tons in 2050. Under the projections, India’s net coal imports (consumption less production) will rise from 316 million metric tons in 2017, to 391 million tons in 2020, 665 million tons in 2030, 1,010 million tons in 2040, and 1,396 million tons in 2050. This will be equivalent to 18 percent of the world coal production in 2017.
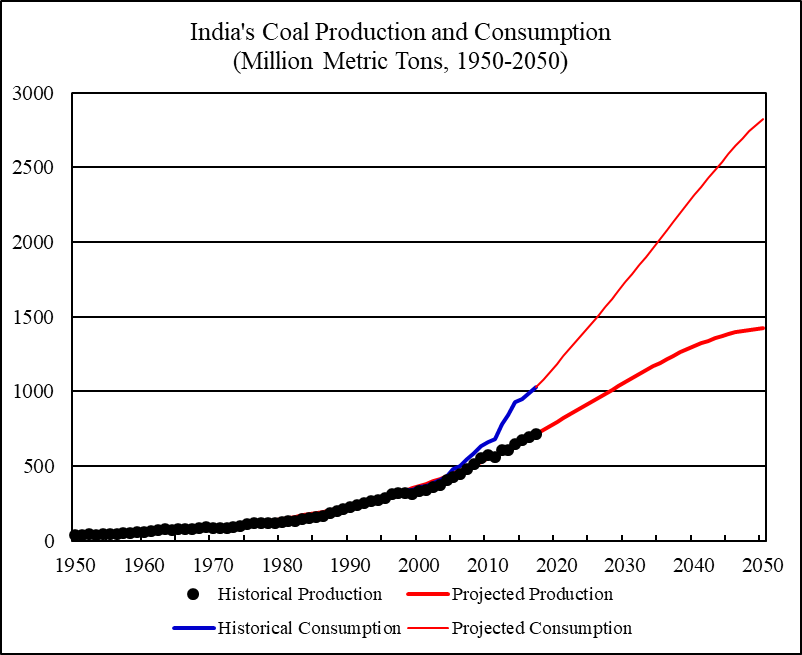
Figure 4 India’s Coal Production and Consumption, 1950-2050
Sources: India’s historical coal production from 1950 to 1980 is from Rutledge (2011); historical production from 1981 to 2017 and historical consumption from 1965 to 2017 is from BP (2018). To project India’s coal production, I used a logistic curve assuming the ultimately recoverable resources are the sum of cumulative production and official reserves. The parameters are calculated so that the projected annual production equals the actual annual production in 2017. India’s future per capita coal consumption is projected by assuming that per capita coal consumption will grow in accordance with the historical relationship between per capita coal consumption and per capita GDP (see Figure 2). Future coal consumption is then calculated using per capita coal consumption multiplied by the projected population. India’s population from 2018 to 2050 is projected using growth rates implied by the US Energy Information Administration’s population projections (EIA 2017, Reference Case, Table J4).
The United States
The United States is the world’s third largest coal producer. In 2017, the US produced 702 million metric tons of coal (371 million tons of oil equivalent), accounting for 9.1 percent of the world coal production (in term of metric tons).
The US coal production peaked in 2008 at 1,063 million metric tons. The US coal production fell by 38 percent from 2008 to 2016. The US Energy Information Administration projects that the US coal production will stabilize in the coming years and production will be around 670 million metric tons by 2050 (EIA 2018, Reference Case, Table A1).
The US cumulative coal production up to 2017 was 76.4 billion metric tons (cumulative production up to 1980 is from Rutledge 2011, extended to 2017 using annual production data from BP 2018). Applying Hubbert linearization to the annual production to cumulative production ratios implied by the projected US coal production from 2041 to 2050, the US ultimately recoverable coal resources are estimated to be 189.5 billion metric tons and the remaining recoverable coal resources are estimated to be 113.1 billion metric tons. By comparison, the US coal reserves at the end of 2017 were reported to be 250.9 billion metric tons (BP 2018).
Figure 5 shows the historical US coal production and the future production projected by EIA.
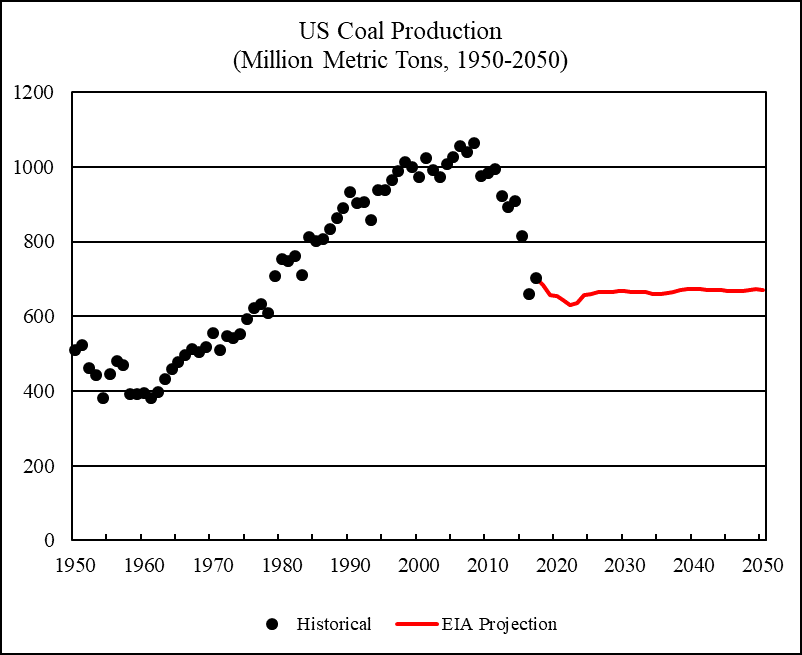
Figure 5 US Coal Production, 1950-2050
Sources: The US historical coal production from 1950 to 1980 is from Rutledge (2011); coal production from 1981 to 2017 is from BP (2018). Projected US coal production from 2018 to 2050 is from EIA (2018, Reference Case, Table A1), adjusted to make the projected coal production level in 2017 matching the production level reported by BP (2018).
Australia
Australia is the world’s fourth largest coal producer. In 2017, Australia produced 481 million metric tons of coal (297 million tons of oil equivalent), accounting for 6.2 percent of the world coal production (in term of metric tons).
Figure 6 projects Australia’s annual production to cumulative production ratios against the historical cumulative coal production. Hubbert linearization is applied to the annual production to cumulative production ratios from 1985 to 2017. Regression R-square is 0.927. Where the downward linear trend meets the horizontal axis indicates that Australia’s ultimately recoverable coal resources will be 44.8 billion metric tons. Australia’s cumulative coal production up to 2017 was 14.2 billion metric tons. Thus, Australia’s remaining recoverable coal resources are estimated to be 30.6 billion metric tons. The parameters from the Hubbert linear trend are used to project Australia’s future coal production.
Figure 7 shows Australia’s historical and projected coal production. Australia’s coal production is projected to peak in 2032 at 589 million metric tons.
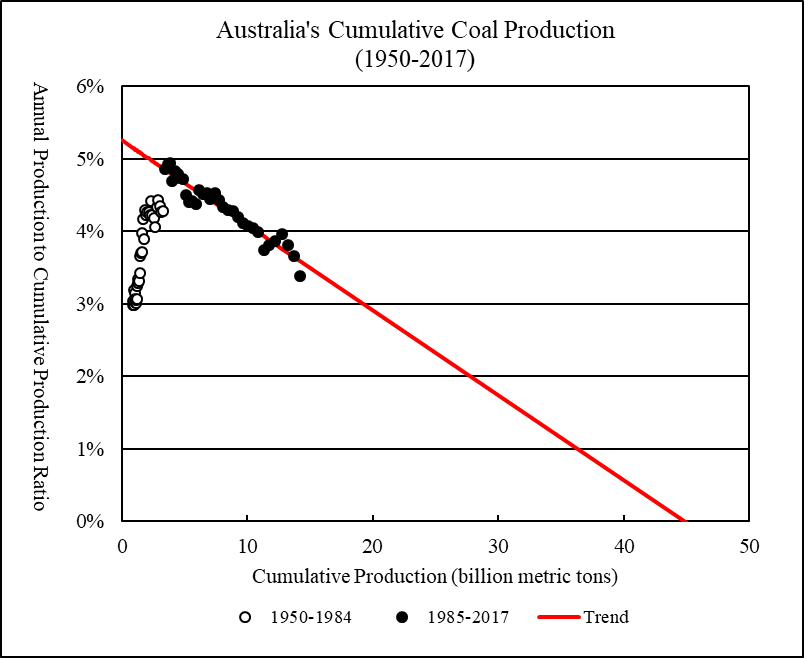
Figure 6 Australia’s Cumulative Coal Production
Sources: Australia’s cumulative coal production up to 1980 is from Rutledge (2011); extended to other years using annual production data from BP (2018).
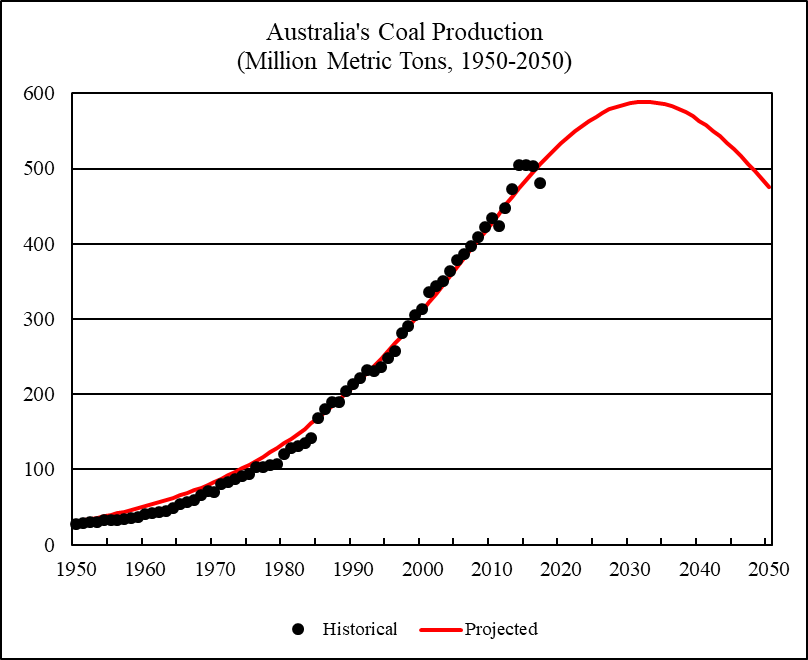
Figure 7 Australia’s Coal Production, 1950-2050
Sources: Australia’s historical coal production from 1950 to 1980 is from Rutledge (2011); coal production from 1981 to 2017 is from BP (2018).
Indonesia
Indonesia is the world’s fifth largest coal producer. In 2017, Indonesia produced 461 million metric tons (272 million tons of oil equivalent), accounting for 6 percent of the world coal production (in term of metric tons).
This report assumes that Indonesia’s ultimately recoverable coal resources are the sum of historical cumulative production and the official reserves. Indonesia’s cumulative coal production from 1981 to 2017 was 5.3 billion tons of oil equivalent (Indonesia’s cumulative coal production before 1981 is assumed to be zero). Indonesia’s coal reserves at the end of 2017 were reported to be 22.6 billion metric tons (BP 2018). The ultimately recoverable coal resources are estimated to be 27.9 billion metric tons.
Based on the above assumptions, Indonesia’s coal production is projected to peak in 2031 at 773 million metric tons. Figure 8 shows Indonesia’s historical and projected coal production.
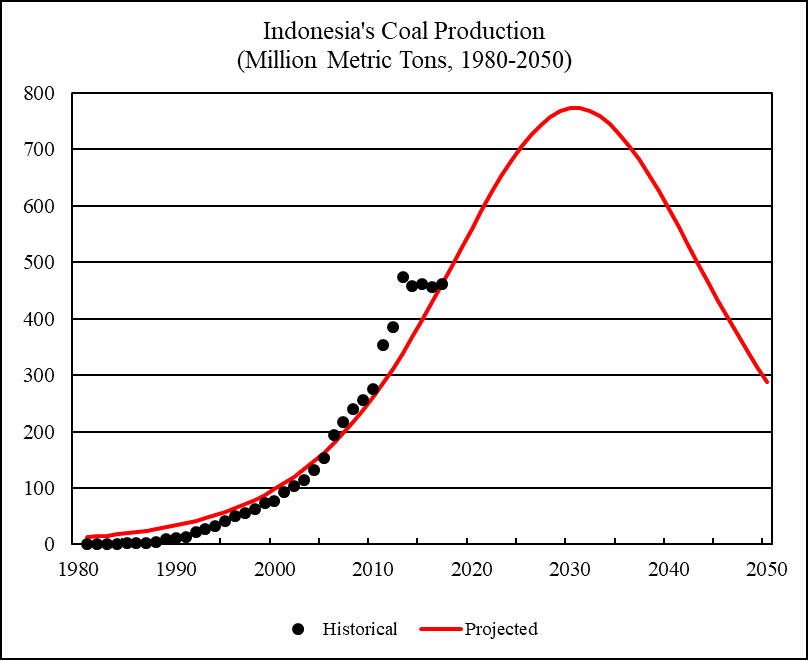
Figure 8 Indonesia’s Coal Production, 1980-2050
Sources: Indonesia’s historical coal production from 1980 to 2017 is from BP (2018). To project Indonesia’s coal production, I used a logistic curve assuming the ultimately recoverable resources are the sum of cumulative production and official reserves. The parameters are calculated so that the projected annual production equals the actual annual production in 2017.
The Russian Federation
The Russian Federation is the world’s sixth largest coal producer. In 2017, Russia produced 411 million metric tons (206 million tons of oil equivalent), accounting for 5.3 percent of the world coal production (in term of metric tons).
In 1988, Russia’s coal production reached the Soviet-era peak of 440 million metric tons. By 1998, Russia’s coal production collapsed to 235 million metric tons. Since then Russia’s coal production has steadily recovered. Russia’s annual coal production to cumulative coal production ratios have been rising in recent years, making it impossible to apply Hubbert linearization.
This report assumes that Russia’s ultimately recoverable coal resources are the sum of historical cumulative production and the official reserves. David Rutledge (2011) defined the coal production region of “Russia” as the former Soviet Union excluding Ukraine but plus Mongolia and North Korea. I use cumulative coal production by Rutledge’s “Russia” up to 1950 as Russian Federation’s cumulative coal production up to 1950. From 1950 to 1984, I assume Russia Federation’s annual coal production to be 68.7 percent of the annual coal production of Rutledge’s “Russia”. From 1985 to 2017, Russia’s annual coal production is from BP (2018).
Russia’s cumulative coal production up to 2017 was 22.9 billion metric tons. Russia’s coal reserves at the end of 2017 were reported to be 160.4 billion metric tons (BP 2018). The ultimately recoverable coal resources are estimated to be 183.3 billion metric tons.
Based on the above assumptions, Russia’s coal production is projected to rise to 647 million metric tons by 2050. Figure 9 shows Russia’s historical and projected coal production.
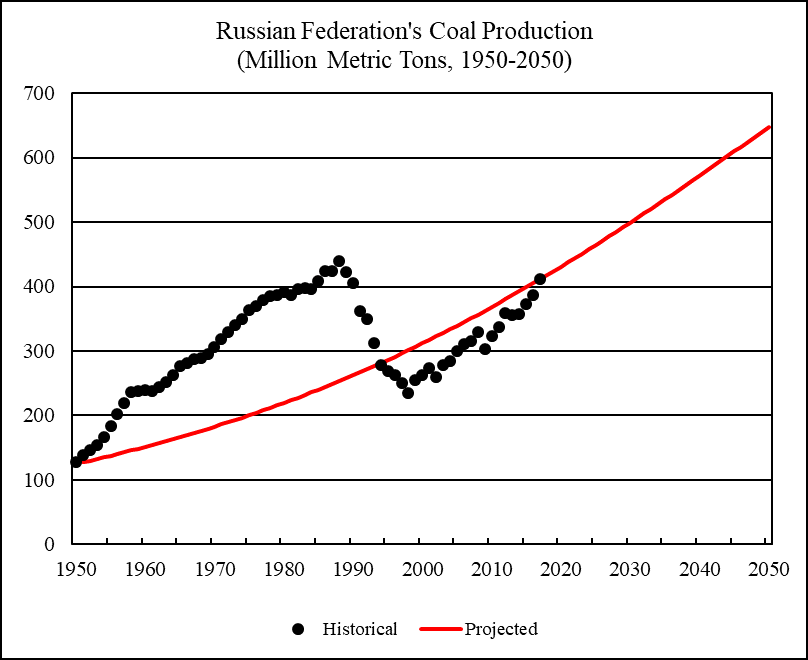
Figure 9 Russia’s Coal Production, 1950-2050
Sources: Russia’s annual coal production from 1950 to 1984 is assumed to be 68.7 percent of the annual coal production by Rutledge’s “Russia” (Rutledge 2011); Russian’s annual coal production from 1985 to 2017 is from BP (2018). To project Russia’s coal production, I used a logistic curve assuming the ultimately recoverable resources are the sum of cumulative production and official reserves. The parameters are calculated so that the projected annual production equals the actual annual production in 2017.
South Africa
South Africa is the world’s seventh largest coal producer. In 2017, South Africa produced 252 million metric tons of coal (143 million tons of oil equivalent), accounting for 3.3 percent of the world coal production (in term of metric tons).
Figure 10 projects South Africa’s annual production to cumulative production ratios against the historical cumulative coal production. Hubbert linearization is applied to the annual production to cumulative production ratios from 1990 to 2017. Regression R-square is 0.987. Where the downward linear trend meets the horizontal axis indicates that South Africa’s ultimately recoverable coal resources will be 18.5 billion metric tons. South Africa’s cumulative coal production up to 2017 was 10.3 billion metric tons. Thus, South Africa’s remaining recoverable coal resources are estimated to be 8.2 billion metric tons. By comparison, South Africa’s coal reserves at the end of 2017 were reported to be 9.9 billion metric tons (BP 2018).
The parameters from the Hubbert linear trend are used to project South Africa’s future coal production. Figure 11 shows South Africa’s historical and projected coal production. South Africa’s coal production peaked in 2014 at 262 million metric tons and is projected to decline to 110 million metric tons by 2050.
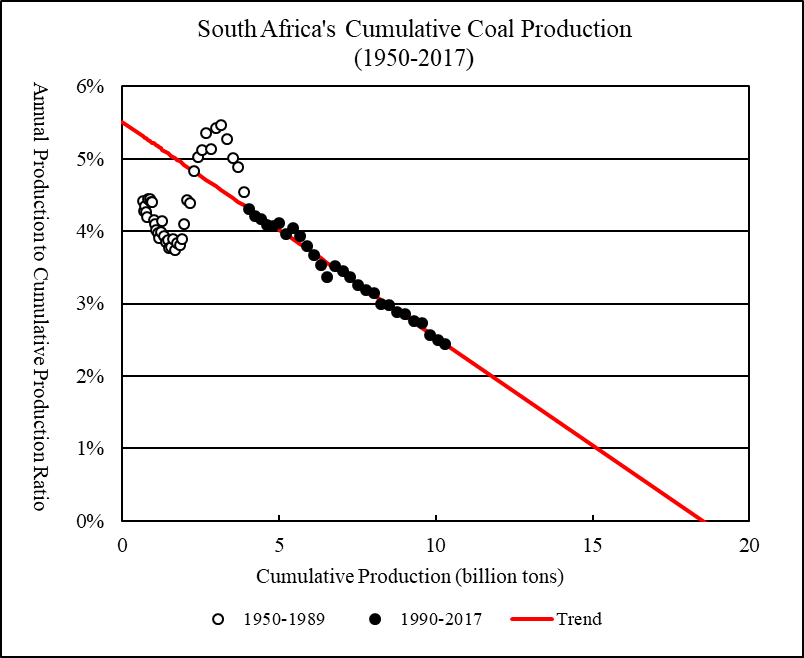
Figure 10 South Africa’s Cumulative Coal Production
Sources: Africa’s cumulative coal production up to 1980 is from Rutledge (2011), which is assumed to be South Africa’s cumulative coal production up to 1980 and extended to other years using South Africa’s annual production data from BP (2018).
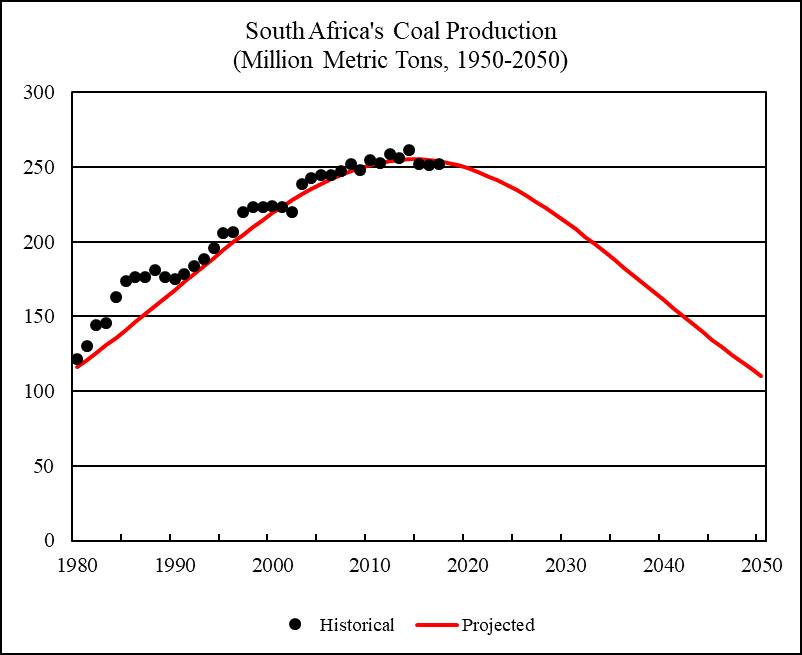
Figure 11 South Africa’s Coal Production, 1950-2050
Sources: Africa’s historical coal production from 1950 to 1980 is from Rutledge (2011), which is assumed to be South Africa’s coal production from 1950 to 1980; South Africa’s annual coal production from 1981 to 2017 is from BP (2017).
Rest of the World
Rest of the world is defined as the world total excluding the seven largest coal producers. In 2017, rest of the world produced 1,180 million metric tons of coal, accounting for 15 percent of the world coal production (in term of metric tons). Rest of the world’s coal production peaked in 1987 at 1,945 million metric tons.
Figure 12 projects the rest of the world’s annual production to cumulative production ratios against the historical cumulative coal production. Hubbert linearization is applied to the annual production to cumulative production ratios from 1950 to 2017. Regression R-square is 0.91. Where the downward linear trend meets the horizontal axis indicates that the rest of the world’s ultimately recoverable coal resources will be 192.3 billion metric tons. Rest of the world’s cumulative coal production up to 2017 was 147 billion metric tons. Thus, the rest of the world’s remaining recoverable coal resources are estimated to be 45.3 billion metric tons. The parameters from the Hubbert linear trend are used to project the rest of the world’s future coal production. Figure 13 shows the rest of the world’s historical and projected coal production.
Figure 14 shows the historical and projected world coal production. World cumulative coal production up to 2017 was 375 billion metric tons. World ultimately recoverable coal resources are estimated to be 992 billion metric tons. World remaining recoverable coal resources are estimated to be 617 billion metric tons. By comparison, the world coal reserves at the end of 2017 were 1.04 trillion metric tons (BP 2018).
World coal production is projected to peak in 2028 at 8,417 million metric tons and decline to 6,101 million metric tons by 2050.
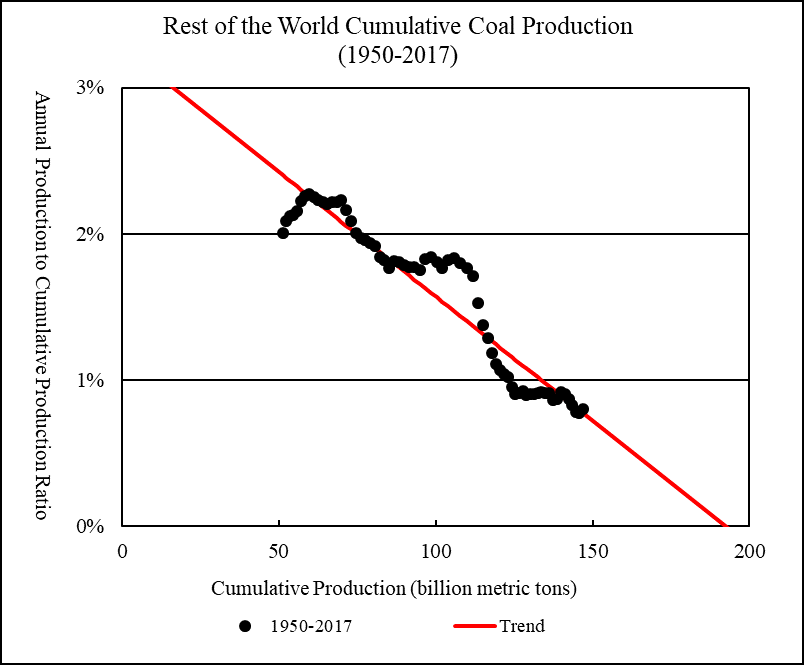
Figure 12 Rest of the World’s Cumulative Coal Production, 1950-2017
Sources: Rest of the world’s cumulative coal production up to 1980 is calculated using data from Rutledge (2011); cumulative production ending in other years is calculated using annual production data reported by BP (2018).
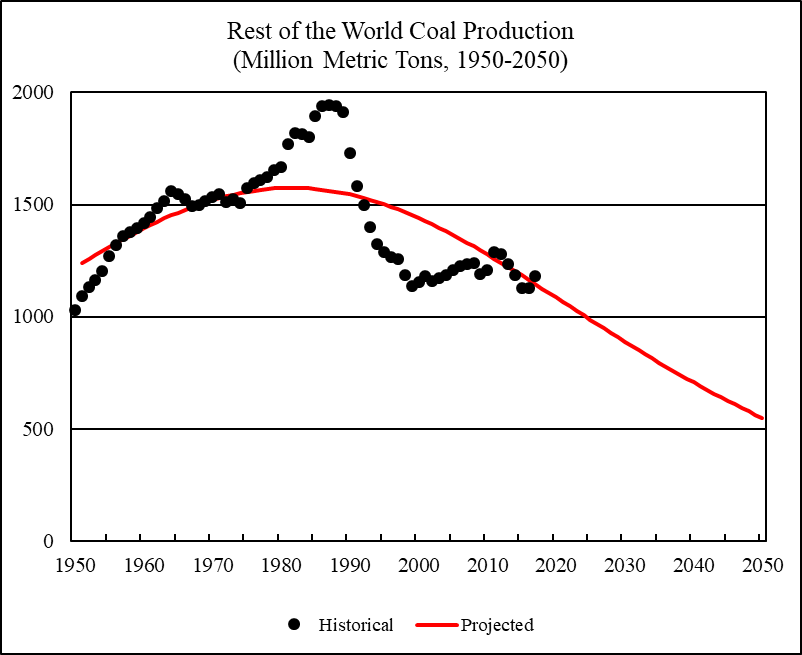
Figure 13 Rest of the World’s Coal Production, 1950-2050
Sources: Rest of the world’s historical coal production from 1950 to 1980 is from Rutledge (2011); annual coal production from 1981 to 2017 is from BP (2018).
Figure 14 World Historical and Projected Coal Production, 1950-2050
Sources: Historical coal production from 1950 to 1980 is from Rutledge (2011); annual coal production from 1981 to 2017 is from BP (2018).
251 responses to “World Coal 2018-2050: World Energy Annual Report (Part 4)”
With the energy sector to be dominated by renewable energy in the future, coal production of thermal coal might fall much faster. Efforts are moving forward to use coal for other purposes. Maybe our car bodies and parts will be made from coal.
Perhaps the greatest potential for coal now is in carbon fiber already widely used in aircraft and high-cost luxury items, said Eric Eddings, a scientist at the University of Utah in Salt Lake City. The strong, stiff and ultra-lightweight fibers of nearly pure carbon could be used to replace heavier materials including aluminum and steel in a growing range of products.
While Mitsubishi doesn’t disclose its proprietary process, Eddings is trying to replicate the results using Utah coal in hopes of driving down costs, which so far have prevented many manufacturers from using the material. Cheaper carbon fiber could expand demand, allowing for lighter vehicles that need less fuel, or larger, more-efficient wind turbines, he said.
“That’s really the Holy Grail,” Eddings said. “The mass of coal being mined wouldn’t be as high, but if you get more value per ton of coal, then it can still work out.’’
https://www.bloomberg.com/news/articles/2017-09-13/-beautiful-coal-seeks-new-life-as-carbon-fiber-for-submarines
Thanks Minqi,
A 2018 Rutledge power point presentation at link below:
http://www.its.caltech.edu/~rutledge/Rutledge2018ACS.pptx
He makes no attempt to predict a peak, but gives an estimated year when 10% and 90% of coal URR will be reached by cumulative coal output.
His URR is 784 Gt for the World with t10 at 1947 and t90 in 2066. For China he estimates URR=254 Gt with t90 in 2063. Also for mature regions the coal URR has a median value that is about 21% of the early reported reserves and at t90 output was about 50% of peak output.
If Rutledge’s estimate of World Coal Resources is correct, then at the end of 2017 we were at 375/784=48% of the Ultimate, current consumption is about 7.7 Gt per year, so if consumption were flat we would reach 50% of the Rutledge estimate in 2020.
An alternative is to take your 992 Gt estimate and average with the Rutledge estimate for an 888 Gt coal URR. With flat output we would reach 50% of URR in 2026, with increasing output we would reach the 50% point sooner. Peak might occur before or after cumulative output reaches 50% of URR.
Europe will allow imports of Chinese solar products duty-free.
https://cleantechnica.com/2018/09/04/eu-removes-trade-barriers-on-chinese-solar-imports/
One of the most coal addicted countries on Earth is Australia. Scott Morrison, then treasurer, now Prime Minister, came to Parliament with a lump of coal
“This is coal,” the treasurer said triumphantly, brandishing the trophy as if he’d just stumbled across an exotic species previously thought to be extinct.
“Don’t be afraid,” he said, soothingly, “don’t be scared.”
https://www.theguardian.com/australia-news/2017/feb/09/scott-morrison-brings-coal-to-question-time-what-fresh-idiocy-is-this
He also enjoyed, together with a former Prime Minister, a joke by the Immigration Minister about sea level rises impacting on Pacific islands:
Mr Dutton was involved in a conversation with Prime Minister Tony Abbott, who had just returned from lengthy talks focused on climate change with Pacific Island leaders in Port Moresby in Papua New Guinea.
Noting that today’s meeting on Syrian refugees was running a bit late, Mr Dutton remarked that it was running to “Cape York time”, to which Mr Abbott replied, “we had a bit of that up in Port Moresby”.
Mr Dutton then added, “time doesn’t mean anything when you’re about to have water lapping at your door”.
http://www.abc.net.au/news/2015-09-11/dutton-overheard-joking-about-sea-levels-in-pacific-islands/6768324
However, there’s no indication that islands are sinking in the ocean. Atoll sandbars shift, poor construction practices cause erosion and the amount of feces they dump in lagoons alters the ecosystem. But rising sea level isnt a problem for Pacific islands that’s really worth worrying about. Their biggest problems are overpopulation and unemployment.
Fernando, I strongly suspect that if you got your head out of your ass and stopped pulling shit out of it, you might be a lot less concerned with the global fecal matter problem!
Don’t suppose any facts would make a difference to you at this point but you might want to try doing a comprehensive search of the scientific literature and read up a bit on some of the topics you opine upon.
I assume even engineers are capable of using a search engine…
This is a quote from a recent paper:
“Sea-level rise and climatic change threaten the existence of atoll nations. Inundation and erosion are expected to render islands uninhabitable over the next century, forcing human migration. Here we present analysis of shoreline change in all 101 islands in the Pacific atoll nation of Tuvalu. Using remotely sensed data, change is analysed over the past four decades, a period when local sea level has risen at twice the global average (~3.90 ± 0.4 mm.yr−1). Results highlight a net increase in land area in Tuvalu of 73.5 ha (2.9%), despite sea-level rise, and land area increase in eight of nine atolls. Island change has lacked uniformity with 74% increasing and 27% decreasing in size. Results challenge perceptions of island loss, showing islands are dynamic features that will persist as sites for habitation over the next century, presenting alternate opportunities for adaptation that embrace the heterogeneity of island types and their dynamics.”
The link is here
https://www.nature.com/articles/s41467-018-02954-1
This being a publication in Nature, which has a very ideological editor, they start the abstract giving lip service to the usual global warming bullshit. Then the paper explains the islands are growing 😐
Here’s one from the non-ideological DOD.
https://www.serdp-estcp.org/Program-Areas/Resource-Conservation-and-Resiliency/Infrastructure-Resiliency/Vulnerability-and-Impact-Assessment/RC-2334/
The Impact of Sea-Level Rise and Climate Change on Department of Defense Installations on Atolls in the Pacific Ocean
Objective
The U.S. Geological Survey (USGS), National Oceanographic and Atmospheric Administration (NOAA), Deltares, and University of Hawaii (UH) conducted a study to provide basic understanding and specific information on the impact of climate change and sea-level rise on Roi-Namur Island on Kwajalein Atoll in the Republic of the Marshall Islands, which is part of the Ronald Reagan Ballistic Missile Test Site. The primary goal of this joint investigation was to determine the influence of climate change and sea-level rise on wave-driven flooding and the resulting impacts to infrastructure and freshwater resources on atoll islands.
Anyone suggesting that: Rising sea level isn’t a problem for Pacific islands that’s really worth worrying about. has got some sort of blinders on!
I failed to understand how “local sea level has risen at twice the global average”.
Does this means that sea level in Tuvalu is higher than the rest of the world now?
If this trend continues, the sea around Tuvalu will be a hill ?
I failed to understand how “local sea level has risen at twice the global average”
Local sea level rise can be influenced by local factors which are different from the causes of global sea level rise. So local sea level rise can be greater than or less than, the global average. Here’s a simple 2:30 minute explanation.
https://www.youtube.com/watch?v=gq5DmiRfmG0
Global vs Local Sea Level
Regional sea level can vary due to water temperature, wind patterns and dynamic factors. Warmer water is less dense, therefore an area with more warming will have a bit higher sea level increase. But this can be a temporary effect as the warm water region moves or disappears. This means using short term trends is a bit misleading.
Many years ago I worked aboard a NOAA research vessel, we measured currents and sea water properties. This data was used to fine tune our models, which in those days were very primitive, but we could use them to map the rise and fall of sea level as the Gulf Stream moved back and forth offshore the Eastern Seaboard.
Regarding the comment about the US Armed Forces study, that was biased by intense Obama administration pressure to pump up climate hysteria. Sea level rise and ground level changes do have to be considered, for example they dont want storm waves to reach generators and critical electronic gear, runways may need an extra 30 cm of fill, and special care needs to be used to avoid beach erosion. But as reported in the Nature paper, those islands arent about to disappear, and some are growing. What i see heppening is simply a bunch of bogus propaganda, based on mickey mouse pseudo science, used to peddle political causes.
Regarding the comment about the US Armed Forces study, that was biased by intense Obama administration pressure to pump up climate hysteria.
I guess the long arm of the Obama Administration must still be influencing every single scientific organization on the face of the planet to this very day! On the other hand maybe, besides being a denier of science you’re also a died in the wool conspiracy nut. Either way, most of what you post on the subjects of Climate Change, Sea Level Rise, and Ocean Acidification is generally outdated, made up of half truths, or has been totally debunked and definitely is not supported in the current scientific literature, from many different converging fields.
https://www.eurekalert.org/pub_releases/2018-06/uol-aru061118.php
PUBLIC RELEASE: 13-JUN-2018
Antarctica ramps up sea level rise
UNIVERSITY OF LEEDS
Ice losses from Antarctica have increased global sea levels by 7.6 mm since 1992, with two fifths of this rise (3.0 mm) coming in the last five years alone.
The findings are from a major climate assessment known as the Ice Sheet Mass Balance Inter-comparison Exercise (IMBIE), and are published today in Nature. It is the most complete picture of Antarctic ice sheet change to date – 84 scientists from 44 international organisations combined 24 satellite surveys to produce the assessment.
The assessment, led by Professor Andrew Shepherd at the University of Leeds and Dr Erik Ivins at NASA’s Jet Propulsion Laboratory in California, was supported by the European Space Agency (ESA) and the US National Aeronautics and Space Administration (NASA).
Their findings show that, prior to 2012, Antarctica lost ice at a steady rate of 76 billion tonnes per year – a 0.2 mm per year contribution to sea level rise. However, since then there has been a sharp, threefold increase. Between 2012 and 2017 the continent lost 219 billion tonnes of ice per year – a 0.6 mm per year sea level contribution.
“Meanwhile, what scientists used to refer to as “the last ice area,” thinking it would hold out at the edge of Greenland even as the warming planet melted all the ice around it. But now, according to satellite images, a big piece of that Greenland coastal ice suddenly vanished or was reduced to floating bits and slush.” Isn’t reality a bugger Fred?
https://www.livescience.com/63395-greenland-ice-oldest-melting-ocean.html
Isn’t reality a bugger Fred?
Nah! No worries. Today we live in a world of fake news and altenative facts so we no longer have to deal with the ‘REAL’ reality! Makes me nostalgic for the good old days when at least someone was openly and actively creating our reality!
“We’re an empire now, and when we act, we create our own reality. And while you’re studying that reality—judiciously, as you will—we’ll act again … We’re history’s actors … and you, all of you, will be left to just study what we do.
Karl Rove
Ironically he served the same President as Donald Rumsfeld who had this to say:
There are known knowns. These are things we know that we know. There are known unknowns. That is to say, there are things that we know we don’t know. But there are also unknown unknowns. There are things we don’t know we don’t know.
Donald Rumsfeld
A very far cry from today when the orange buffoon in the white house knows everything there is to know, about everything…
Cheers!
You are right Fred, there is so much fake news and distorted reality in the media and in the minds of the people that even gravity may be repealed soon.
What I find of great concern is that some bloggers who were generally sensible and factual have turned on their heads and are sometimes spouting BS and conspiracy myths. I stopped reading or watching them.
Is the stress of all the bad news just getting to people?
New Rule: The good news is fake and now so is some of the bad news.
“Regarding the comment about the US Armed Forces study, that was biased by intense Obama administration pressure to pump up climate hysteria”
here expressing the insight of a mentally self-handicapped person
Fernando, what kind of denier are you? So you dare question the UN, the IPCC, and 97% of scientists that agree that producing any more CO2 is going to result in the sinking of island nations? Why? Because it didn’t happened yesterday?
There has been a strong El Niño, and when that happens water accumulates in the tropical Pacific where it is warmer, affecting sea levels. After El Niño, sea levels stop rising for a while, but then they do a catch up. When they repeat those measurements in a couple of years they’ll find that the islands are smaller.
What happens now to the people living in those islands is that when there is a storm they get their houses and plots flooded. And if you ask them they tell you it wasn’t like that when they were young. I have seen it in documentaries.
Here you have a tool for exploring chronic inundation areas by the Union of Concerned Scientists:
https://ucsusa.maps.arcgis.com/apps/MapSeries/index.html?appid=64b2cbd03a3d4b87aaddaf65f6b33332
Do you think they are wrong or lying?
Fernando, what kind of denier are you?
The kind that that thinks this gentleman is either a fool or a liar.
https://www.youtube.com/watch?v=9Xuf5mcv_1U
Anote’s Ark: Saving a Sinking Island
Carlos, Pacific atolls are built on coral. As you know, sea level is much lower when the ice fields grow, and goes up as the ice melts. The coral has a comfort zone which allows it to grow as sea level rises. If sea level rises too fast, the coral cant catch up. The same applies to ground subsidence. If the ground drops as volcanic acivity ceases, sometimes the coral can’t reach the right extent and grow upwards into sunlight.
What is being observed, is documented in papers (some of this is quite old, i learned it when studying coastal engineering decades ago) is that most coral islands are doing fine at current sea level rise rates. If you look at the data, more are increasing than are decreasing in size. This implies the coral grows, gets busted up and ground into sand, and the process at this time yields a slightly positive figure. What hurts coral growth is the enormous amount of feces and trash being dumped on overpopulated islands such as Funafuti, which have become the poster islands for efforts to grab cash from rich nations.
I feel those overpopulated islands do need help (free condoms and family planning are critical), but the help should not be called “climate funds”, because thats simply pouring money down a pit.
As for all the denier insults i get here, you should understand that i like to educate you. And sometimes this requires breaking the brainwashing you have undergone. I dont get into a subject like this unless ive studied it. And this means i see your insults as mindless mutterings by innocent victims of propaganda and brain washing i have to overcome.
What is being observed, is documented in papers (some of this is quite old, i learned it when studying coastal engineering decades ago) is that most coral islands are doing fine at current sea level rise rates. If you look at the data, more are increasing than are decreasing in size.
Any chance you could post that data?! Especially the current data?! I’m sure most scientists who study corals and coral atolls would love to see it as well!
I’m sure someone somewhere will nominate you for a Nobel prize in the biochemistry of marine ecosystem studies!
In Fig 1 the left hand axis title refers to gas, but it should be coal
Thanks for pointing this out. Dennis will correct it.
Could we get a stacked coal consumption graph?
Great post on your blog Mushalik. I like your most recent graph too.
Another report saying coal is on its way out and China is looking to the future.
https://cleantechnica.com/2018/08/27/bnef-2018-report-renewables-surge-china-dominates-coal-loses-evs-soar/
Indonesia is on no media radar at all. At least not in my focal reality tunnel. They all chime in on bashing Trump for coal, China and sometimes India. Russia is of course evil, so no coal bashing there.
Really interesting to place everything in such a clear manner. Thanks.
I would like to suggest a different set of projection than those in the lead post. Coal for electricity generation is facing serious headwinds in all four of the world’s largest producers.
In China, pollution issues spurred interest in less polluting alternatives like renewable energy, in particular wind and solar but, also natural gas. On the natural gas front, a comment from TechGuy in the OPEC August Production Data thread stated that “The Russia-China NatGas pipeline goes operation in Dec 2019”. China has a lot of stuff they can trade with Russia in exchange for gas and oil. On the renewable energy front, the latest statistics from the web site, China Energy Portal, 2018 Q2 Electricity and energy statistics, show year on year growth for the quarter in question at 28.6% for wind and 24.5% for solar versus 8% for coal. Globally, PPAs are being entered into for electricity from solar in a diverse set of jurisdictions at prices lower than those at which any coal powered plant can compete. How long before all the contributing factors in China lead to a decline in Chinese coal consumption? The graph up top says circa 2025 but I suspect it may be much sooner.
India is getting very keen on renewable energy for pretty much, similar reasons as China.
In the US, coal for electricity is being walloped by natural gas and increasingly by wind and solar with storage to complement wind and solar growing strongly.
In Australia, despite the best efforts of the federal government, growth in electricity from renewable sources is booming.
I wouldn’t bet on coal consumption increasing much longer. There are disruptive forces at work that will probably result in the decline of coal much sooner than expected by most,
India’s coal consumption last year grew 5%. Indonesia 7%. China’s was +0.4%, reversing recent declines.
South Korea’s coal consumption grew 6% and is now almost 3/4 Japan’s coal consumption, which grew last year 2%.
Total world coal consumption last year grew about 1%, which is the average growth for all years since 2006. No sign of decline.
The problem is not just about what current or recent trends show, it’s about how future growth projections are made. Below is a graphic that is part of a pinned tweet from the twitter page of Auke Hoekstra, researcher and senior advisor smart mobility at the Eindhoven University of Technology.
Looking him up on the internet I found an interesting blog post composed by him that discusses topics that have been discussed around here like confirmation bias, linear thinking cognitive dissonance etc.
Better Predictions in Renewable Energy (by Auke Hoekstra)
Against the background of Hoekstra’s work, I wonder what projections were like for various companies just before and while they were being disrupted. Names like Kodak, Polaroid, IBM, Nokia and Blockbuster come to mind. The demise of Kodak is described in an article at the following link:
10 Companies That Failed To Innovate, Resulting In Business Failure
At one time the world’s biggest film company, Kodak could not keep up with the digital revolution, for fear of cannibalizing its strongest product lines. The leader of design, production and marketing of photographic equipment had a number of opportunities to steer the company in the right direction but its hesitation to fully embrace the transition to digital led to its demise. For example, Kodak invested billions of dollars into developing technology for taking pictures using mobile phones and other digital devices. However, it held back from developing digital cameras for the mass market for fear of eradicating its all-important film business. Competitors, such as the Japanese firm Canon, grasped this opportunity and has consequently outlived the giant. Another example is Kodak’s acquisition of a photo sharing site called Ofoto in 2001. However, instead of pioneering what might have been a predecessor of Instagram, Kodak used Ofoto to try to get more people to print digital images. Kodak filed for bankruptcy in 2012 and after exiting most of its product streams, re-emerged in 2013 as a much smaller, consolidated company focused on serving commercial customers.
Yes, Asia’s coal demand is likely to continue in the coming years. China’s coal demand is set to grow by about 2% this year.
Gas pipelines from Russia take years to build, Russia’s main new supply sources are the Yamal peninsula and the Kara Sea. Therefore there’s a limit to the natural gas the Russians can ship. An alternate supply could be Iran, and possibly new fields in the Caspian, although thats a bit iffy.
Fernando L,
They do indeed take years to build. One, the Power of Siberia pipeline to China, is due to go into service next year but it’ll be a while before the next ones.
The maps are spiffy though.
I spent several years trying to figure out how to send Russian gas to China. Unfortunately, I couldn’t get buy in for my plan to send Lunskoye gas (offshore Sakhalin) to the russian mainland and on to Harbin.
Fernando L,
From the map it looks like the distances are comparable for Lunskoye field to Harbin / the Power of Siberia route. I don’t know anything about actual construction differences in the two cases. There has been talk about sending Sakhalin II gas to South Korea and to Japan but I think it’s all at the “How about this?” stage for both cases.
I havent worked Russia projects for a long time. When i looked at it, the Russians had Lunskoye up for bids (Marathon won the original contest). I felt that sending the gas by pipe to the mainland was a key to beat Marathon and the Japanese, because it would allow natural gas to flow to Khabarovsk Oblast, and this would get us the governor’s vote. I also went into northern China and checked their layout to take the gas, and saw a couple of fields the chinese could use for summer time gas storage. So the package fit very nice. But company management was a bit lost when it came to China’s economic growth. I kept insisting that capitalism was creating a giant tiger with huge energy needs, and they simply ignored me.
Fernando L,
It sounds like you were thinking ahead of your time all right.
The rate of Chinese industrial growth did catch the world flat-footed, though. Deciding to make large investments in China back then would have faced a lot of uncertainty.
Prof. Li – Could there be a second set of logistics if in-situ gasification was made to work, a bit like the non-conventional oil curve on top of conventional oil in US? China has some gasification but I think it is mined first. There’s a lot of deep coal, it’s always bubbling around the news, there’s a huge amount under the North Sea and the UK has turned back to coal this year as gas has got more expensive and renewables haven’t been built out enough. There was some design that allowed the gas to be generated and the CO2 reinjected back into the same area which had been previously depleted.
George,
We could also project what would happen if viable fusion reactors were developed. 🙂
Do you have any cost estimates for coal gasification for coal that is too deep to mine?
Can it compete with wind and solar on cost?
No that’s why I was asking Prof Li. You seem to have already made your mind up on all such technical questions I prefer to keep mine open.
George,
Anything is possible.
For recent experience with coal gasification in the US there are a few examples:
https://en.wikipedia.org/wiki/Kemper_Project
https://en.wikipedia.org/wiki/Hydrogen_Energy_California
https://www.oaoa.com/news/business/article_3101bb5e-c983-11e7-9d9a-effbc4b7d7a2.html
These were the three US projects cited in the Wikipedia Coal Gasification piece.
None of the three projects were successful, and they were less challenging than underground coal gasification and were all using mined coal as an input rather than in situ gasification (which I imagine would be more of a technical challenge.)
Potentially, if the technical challenges were overcome, it might be easier to capture and store CO2 from such a process because it would be mixed with much less nitrogen if captured pre combustion.
It just seems from an economic perspective it is unlikely to be competitive with wind, solar, nuclear, or natural gas in the foreseeable future, in my opinion.
George,
Have you looked at the article by Auke Hoekstra on Better Predictions in Renewable Energy that I mentioned in my earlier post? I would really like to see a critique of it from someone who is less enthusiastic about renewable energy than I am. There appears to be some (recent?) cross pollination between the work of Hoekstra and that of Tony Seba.
The most recent version of Seba’s presentation based on his book is also the shortest I have seen to date and at about 10 minutes into the 37 minute video titled “Technology Megatrends Leading to the Disruption of Transportation 2020-2030 – Tony Seba”, a graphic pops up that is very similar to the graphic below, with the title “Adoption Rates of Consumer Technologies in the US (10% to 90% Penetration)” from the linked Hoekstra article under the section 3) Endogenous Feedback Loops. Then the next graphic that is shown at 10 min. 21 sec. in the Seba Youtube presentation is the same graphic from Hoekstra shown in my post above.
What do you make of Hoekstra’s ideas?
I’m not against renewables quite the opposite. I’m against the messages that EV proponents give, such as EVs will solve it so they are the only thing we need to consider, or let’s fix US and Europe first and the rest of the world is bound to be happy, or we don’t need to cut down on anything, or there’s nothing bad about EVs and if there is let’s not talk about in case it stops progress, or of course we can extrapolate exponential curves as fast as we want, or we don’t need to worry about soil erosion, aquifer depletion, permafrost melt, metal ore degradation, plastic pollution, overpopulation, food poverty because all we need is fossil free happy motoring etc.
Moore’s Law has finished so that’s a bad example to use. With computers there is no issue with material availability – raw material use is pretty small and doubling it is still pretty small. Maintenance isn’t an issue – just throw it away and get something new. If the computer is mostly used for entertainment doubling speed is more a status thing than anything useful. With renewables quite a lot of stuff is needed and it’s not going to go down much with higher efficiencies, like access roads, supports, headoffices etc. Plus they have to be maintained and replaced so basing growth on a period when that hasn’t been needed and there hasn’t ben real competition for the raw materials is wrong.
It’s a logical fallacy to say that X (e.g. EIA) is wrong and therefore the opposite of what X says must always be right, which seems to partly be what he is saying. The argument for EVs and renewables must be made on it’s own merit.
It’s not really possible to do these arguments without presenting the real numbers (if I skim an article and don’t see some actual equations I normally don’t bother) otherwise it just ends up as arm waving and a whole bunch of strawman arguments on either side with neither taking much notice either way. My view is all options need to be considered but even doing that we are in very serious problems. Most of human existence has been pretty tough, our generations, especially in the west, have had things amazingly good, but the cost of that is probably fucking it up completely for others to come.
Thanks for the reply George. I don’t think you’re anti-renewable. There are others posting in this very thread who might find Hoekstra’s article difficult going, since he talks about biases caused by tribalism, which is very much on display here from time to time. I asked you because you don’t appear to me to have any tribal leanings in this context. I find you very objective and analytical and thought you might find some of Hoekstra’s ideas and methods valid.
First thing I’d point out is that Hoekstra appears to be big on transparency. From the linked article:
1) Open Source Modelling: the Scientific Method for the 21st Century
Sunlight is the best disinfectant. Allow others outside your tribe to falsify your model or play with the assumptions to get different results. Without this, bias can go unchecked.
The scientific method might have some antidotes against the discussed biases because it tries to be independent (as much as possible) from the scientist making the prediction. To quote Richard Feynman:
In order to avoid fooling him or herself, a scientist is required to open up himself to criticism as much as possible. Science is based on falsifiability: your findings are only taken seriously if they can be disproven. When you make your claims easier to disprove, you are taken more seriously. Or more popularly formulated: “In God we trust, all others bring data.”…[snip]
The solution seems obvious to me. Your raw data, your assumptions and your model should be publicly available. Preferably in an easy to download format on the web. E.g. a github repository for code and a csv file for data.
There’s a lot more than what I excerpted but, I prefer not to cut and paste the entire section. I think it’s worth a read.
It covers a lot of the same ground as the books Superforecasters and The Signal and the Noise. ‘Tribalism’ collect together a few of the same issues covered in those as different reasons for poor forecasting. It’s a kind of vested interest that leads to lots of argumentum ad nauseum.
As far as the last part where he attempts to put a better model for renewables together, all he says looks reasonable but there’s no actual model with equations and assumptions etc. so I don’t know what I can say.
Moore’s Law has been declared dead a few times, but it is still chugging along just fine.
Solar cost has also been said to fall by 20% every time cumulative production doubles, but has been falling more quickly in recent years.
Saying that EVs won’t solve all are problems is not a cogent argument against EVs. There is no general solution to all of our problems. “Cutting waste” is probably a good start, but it isn’t a single technology, it is a general strategy.
I’m against the messages that EV proponents give, such as EVs will solve it…
I don’t think I’ve ever seen anyone on this blog give those messages! I think you’re assuming them as some kind of subtext.
I get that you want to keep people’s aspirations high. You don’t want people to settle for limited solutions. That’s fine. That makes sense. But it’s still not any reason to object to EVs or renewables.
EVs and renewables can help eliminate fossil fuels. That’s enough justification for them.
“No that’s why I was asking Prof Li. You seem to have already made your mind up on all such technical questions I prefer to keep mine open.”
The only cost estimates for fusion reactors in the past were done by using the costs of NPPs. 🙂
With this methodology fusion reactors are economic still births. 🙂
George, I am not familiar with in situ gasification.
But I think currently there is no large scale commercial in situ gasification projects. For that reason, current official coal reserves probably does include potential coal resources for that purpose
Coal to oil appears to be viable at $120 per barrel. I looked at it for a couple of places, and its possible to build a heavy oil residue plus pulverized coal plant with a natural gas supply for hydrogenating products. The heavy oil simply allows the mix to be easier to move, and reduces the coal ash problem.
We also looked at injecting enriched air into coal seams and making carbon monoxide which can be extracted to make syncrudes. But i cant discuss the costs. I concluded the idea was crazy but somebody may try it in the far future.
Fernando,
What price for coal is assumed for that $120/b oil scenario? When coal peaks its price will rise, if it’s being used to produce oil, it is likely to drive up consumption and peak sooner.
Denis, in one case we assumed we would mine the coal as part of a huge proyect.
One case i can comment on is the Colombian coal delivered to Santa Marta for loading on barges (i cant remember the price). Colombian coal is cheap, but natural gas is expensive. I was looking at an option to ship Venezuela crude, blend a bit of Rubiales and Castilla, get the still bottoms mixed with coal and run that mess through a syncrude plant.
Fernando,
Thanks. I wonder if the $120/b estimate would be correct when coal prices start to rise. Columbian coal may have been cheap when you considered the project, but assuming World coal output peaks in 2028 to 2030, one would expect the price of coal will rise, as a Coal to liquids project depends on coal as an input, a rising price of coal will increase the cost of the CTL barrels produced to something higher than $120/b.
These projects are often capital intensive and might never pay out if they simply beak even with the World oil price due to rising coal prices.
Eventually high oil prices lead to substitution of alternatives and demand falls below supply at the higher oil price and oil prices start to fall. I expect this to occur between 2040 and 2050 and CTL projects would be unlikely to ever make a profit.
If in-situ coal gasification were to become viable, the energy contribution would be huge. We didn’t for-see fracking, and perhaps gasification of coal will surprise everyone as well.
But I very much doubt it, primarily on thermodynamic grounds. EROEI looks very poor.
Other energy sources such as deep water offshore wind has a much better chance of viability, IMHO-
https://www.youtube.com/watch?v=IO7GXLR4YUo
https://www.forbes.com/sites/mergermarket/2018/07/30/offshore-wind-is-likely-the-next-big-us-renewable-sector/#77f221a64182
Appologies if already posted.
https://www.spglobal.com/platts/en/market-insights/latest-news/oil/092018-bakken-operators-facing-shift-to-less-prolific-geography-study
The article has a couple of mistakes. For example the recovery factors it mentions are goofy.
Lightsout, I moved your link to the Petroleum Post. It is very interesting and replies should be posted over there.
Thanks Ron. I didn’t realise it was the wrong thread before I posted
Thanks Lightsout. Nice Piece.
Should be in Petroleum Thread however.
Let’s take the discussion there.
http://peakoilbarrel.com/open-thread-petroleum-sept-20-2018/
Let me start with two disclaimers:
First, I have a deep respect for Professor Minqi Li and the work he has done here and other reports he has posted. My following comment is in no way intended as a personal criticism of him or his work.
Second, the excerpt below regarding India is just an arbitrary example chosen by me to underscore what I consider to be typical of a number of deeply flawed assumptions on which future projections are based. I have no personal animus toward India, the Indian people or even those who have made these projections.
If India’s per capita coal consumption continues to follow its historical trend in relation to per capita GDP, India’s per capita coal consumption will rise to 676 kilograms of oil equivalent by 2050 (when India’s per capita GDP is projected to rise to about 19,000 dollars). India’s population is expected to grow to 1.72 billion by 2050. Given these projections, India’s coal demand will rise to about 1.2 billion tons of oil equivalent by 2050.
Lets start with the very first word in that excerpt: ‘IF’, In the English language it is generally employed as a conjunction or as a noun denoting a supposition; uncertain possibility:a condition, requirement, or stipulation! So right off the bat its use implies multiple caveats. Which I am going to contend should be examined in depth and not taken for granted.
Since the excerpt mentions India, perhaps I might be allowed to take a small detour into the realm of Rudyard Kippling’s poetry and his poem titled ‘If’… I’ll post the second verse here for your enjoyment:
If you can dream—and not make dreams your master;
If you can think—and not make thoughts your aim;
If you can meet with Triumph and Disaster
And treat those two impostors just the same;
If you can bear to hear the truth you’ve spoken
Twisted by knaves to make a trap for fools,
Or watch the things you gave your life to, broken,
And stoop and build ’em up with worn-out tools:
Now let’s go examine some of the assumptions in the exerpt:
I’d like to start with the one about India’s projected population by the year 2050 estimated to be 1.72 billion. Perhaps I’m alone in thinking that this assumption borders on the absurd?! It does not take much effort to find scientific research in the literature from multiple converging fields to provide us with copious ammunition to shoot the plausibility of that idea down. I will not post any links at this time, but suffice it to say, we know for a fact that the human population is in already in deep ecological overshoot and has passed the earth’s carrying capacity quite a few decades ago.
Let’s now examine this statement:
India’s per capita GDP is projected to rise to about 19,000 dollars Putting aside for a moment discussions about whether or not ‘GDP’ is still even a useful economic metric to be using for a date thirty years hence, the current technological disruptions in AI and robotics and the ensuing social and political perturbations they may cause to the global economic status quo are currently very big unknown unknowns! Then add to that the very real potential for social and economic collapse due to collapsing ecosystems and the global agricultural and food production systems. I won’t get into the potential disruptions caused by climate change and sea level rise but those certainly need to be included on the risk assessment ledgers.
So I think the likelihood of India’s coal demand rising to about 1.2 billion tons of oil equivalent by 2050 is highly unlikely just based on those factors alone. And there are many more that also need to be considered.
My problem with these and many other similar projections of human population and consequent resource consumption trends based on past usage is that they so blatantly fly in the face of what we already know to be true!
In his 2007 Edge Master Class in ‘Thinking about Thinking’, Daniel Kahneman goes into detail about why experts with all the available knowledge at their fingertips make projections that they know are completely unrealistic!
DANIEL KAHNEMAN, Eugene Higgins Professor of Psychology, Princeton University, and Professor of Public Affairs, Woodrow Wilson School of Public and International Affairs. Winner of the 2002 Nobel Prize in Economic Sciences for his pioneering work integrating insights from psychological research into economic science, especially concerning human judgment and decision-making under uncertainty.
I’ll start with a topic that is called an inside-outside view of the planning fallacy.
…because there are two ways of looking at a problem; the inside view and the outside view. The inside view is looking at your problem and trying to estimate what will happen in your problem. The outside view involves making that an instance of something else—of a class. When you then look at the statistics of the class, it is a very different way of thinking about problems. And what’s interesting is that it is a very unnatural way to think about problems, because you have to forget things that you know—and you know everything about what you’re trying to do, your plan and so on—and to look at yourself as a point in the distribution is a very un-natural exercise; people actually hate doing this and resist it.
Cheers!
Fred,
Every analysis needs to make assumptions, I believe Minqi used expert estimates of population projections and probably assumed economic growth might continue on a trajectory already demonstrated as possible by China over the past few decades.
As to coal consumption, he made the simplified assumption that the per capita coal consumption vs per capita GDP relationship would be unchanged in the future. That assumption may indeed be flawed as I expect coal prices will rise and alternatives to coal will be considerably cheaper in the future.
In addition there is very likely to be political and economic changes in the future, those are very difficult to predict.
We could just read poetry. 🙂
That’s fun, but might not help with policy decisions all that much.
We could also try other assumptions, the possibilities are infinite.
Every analysis needs to make assumptions, I believe Minqi used expert estimates of population projections and probably assumed economic growth might continue on a trajectory already demonstrated as possible by China over the past few decades.
No shit, Sherlock! That totally misses the point of my comment. Which was twofold, one, that the assumptions are absurd and two, that it is necessary to examine the psychology behind why experts make absurd assumptions to begin with!
I thought I had made it quite clear that I was not interested in criticizing Prof. Minqi, or even the fact that he was using said assumptions to make future projections!
Given that I consider you to be a highly intelligent and well educated individual, and that even so, the point of my comment seems to have gone so far over your head, makes me conclude that pursuing this discussion with you or anyone else for that matter is a completely pointless and futile exercise!
Let’s just continue with the tragicomedy of the absurd and refuse to even consider examining our flawed thinking processes.
Now, I’ll just go read some more Rudyard Kippling and buy some popcorn while it is still available!
Fred,
In many cases we don’t even know what the statistical distribution is, in most cases I take a maximum entropy approach which makes the fewest assumptions about the distribution.
For a variable that takes only positive values such a probability distribution only assumes there is a mean value that is equal to the standard deviation of the distribution.
Typically I take a range of expert opinions on something like the URR of a resource which is likely to range from the amount already produced to an infinite amount. Generally infinity seems too large an estimate so I narrow the scope a bit by taking low and high estimates by experts.
Similar approaches can be taken for population growth, per capita GDP growth, and so forth.
For India the paper linked below has 5 different estimates for 2050
https://www.sciencedirect.com/science/article/pii/S0959378014001095?via%3Dihub
they range from 1.5 to 2 billion for India’s population in 2050, with intermediate estimates of 1.6 and 1.7 billion. For the World the estimates range from 8.5 to 10 billion in 2050 with an intermediate estimate of 9.1 billion.
World per capita real GDP growth has been relatively constant from 1970 to 2017 at about 1.4% real GDP per capita Growth over that period, we could assume in the future it is anything from -1.4% to 1.4%, though my guess is that it will be closer to 1% and population growth will coincide with the lower estimates (8.5 billion in 2050 and perhaps 7 billion in 2100).
For coal and other fossil fuel resources I expect lower estimates are probably more accurate especially as solar, wind, hydro and nuclear resources are ramped up as fossil fuels peak and become more costly.
I also do not think EVs, solar, wind, hydro solve all problems, we need lower population growth, with a peak by 2070, less resource use where all recources are recycled as much as possible, better farming practices to reduce erosion,
there are many problems both known and unknown. As the focus of the blog is energy, I focus on energy and the environment.
The scenarios are an attempt to see what might happen if we change some of the variables, obviously the correct future values for any variable is unknown for any length of time in the future whether it be a millennium or a second.
…they range from 1.5 to 2 billion for India’s population in 2050, with intermediate estimates of 1.6 and 1.7 billion. For the World the estimates range from 8.5 to 10 billion in 2050 with an intermediate estimate of 9.1 billion.
I guess you simply do not accept the well established fact that humans are in ecological overshoot. Which is what makes those projections absurd!
https://www.researchgate.net/publication/11286869_Tracking_the_Ecological_Overshoot_of_the_Human_Economy
Abstract
Sustainability requires living within the regenerative capacity of the biosphere. In an attempt to measure the extent to which humanity satisfies this requirement, we use existing data to translate human demand on the environment into the area required for the production of food and other goods, together with the absorption of wastes. Our accounts indicate that human demand may well have exceeded the biosphere’s regenerative capacity since the 1980s. According to this preliminary and exploratory assessment, humanity’s load corresponded to 70% of the capacity of the global biosphere in 1961, and grew to 120% in 1999.
Below is a graphical representation, I think you are only looking at the growth part of that curve, which ended in the 1980’s and while I don’t know exactly where we are on the overshoot part of the curve, baring some miracle, we will have to deal with a degraded K (carrying capacity) in the near future:
.
Fred,
There are a wide range of opinions on where we are on that chart,
I guess if you had something peer reviewed, like the paper I linked, I would tend to believe it.
I am not of the opinion that all experts should be ignored.
I am not of the opinion that all experts should be ignored.
Neither am I! If I’m sick for example, I much prefer an expert doctor to the opinion of my neighbor…
Not quite sure why you didn’t like the paper I linked above?
So here’s a few more:
https://www.ncbi.nlm.nih.gov/pmc/articles/PMC2610164/
https://ec.europa.eu/eurostat/documents/3888793/5835641/KS-AU-06-001-EN.PDF
https://sustainabledevelopment.un.org/content/documents/5686humanitysgrowingecologicalfootprint.pdf
The question is what effect will sustainability have on population.
That question was not addressed.
Well, I can answer what effect lack of sustainability will have on the population, it’s called ‘Dieoff’ or Population Crash. It is described by what population biologists call a J Curve.
.
Fred,
Note that in all those curves there is no definition on the time axis, so I would like to see some peer reviewed literature that estimates demographic outcomes, I have never seen anything, both charts you have posted tell us very little without specific numbers on the horizontal (time) axis.
“The question is what effect will sustainability have on population.”
The real question should be “How much degrowth is needed to achieve a sustainable society.”
Here is a video on the concept. I don’t agree with the outcome, it’s too simplistic and does not have any vision (common problem across much of civilization). However, it poses some of the correct questions that need to be answered.
How Much Degrowth Is Enough?
https://www.youtube.com/watch?v=fcQYI4yo8mM
Of course, under the current paradigm we will not get the chance to answer the proper questions, weakest links will break and nature will reduce population (demand) in it’s own way. Still, something to think about, especially for any survivors.
Dennis, I don’t ever remember you giving your opinion on human population overshoot. Perhaps you did and I just don’t remember it.
But if you have, please refresh my memory. If you have not, then could you do that right now? Are we, in your opinion, currently in population overshoot? If so, by how much? If not, at what point do you think we will reach population overshoot, if ever?
BTW, here’s an article from an ecological economist and scholar of sustainability who claims that we may be underestimating our ecological footprint!
https://phys.org/news/2018-07-humans-depleting-earth-resources-footprint.html
We are in the process of having a generation not wondering why there are no bugs splatted on the windshields of their vehicles. A generation that will accept a sterile world devoid of wild animal life.
How then will they even miss what they never experienced? They will mostly look inward not outward. A world where wildlife is an oddity, an annoyance and an exception to the rule.
We are the last generation to have seen something of abundance in the natural world of animal life and even then it was diminished.
I walked in their footsteps, the young will rarely see the tracks of most animals except in museums.
Of course with the bugs and fish mostly gone, they may not live long either.
Ron,
I would agree we are in overshoot.
I do not know by how much.
Population and per capita GDP projections are from EIA (EIA might have used population projections from UN)
Tks, Prof. Minqi! It doesn’t change the main point of my comment in any way, since I’m not the least bit interested in arguing with how they arrive at those numbers! I already know how and why they do.
I’m arguing that the thinking process they have used in arriving at those numbers is deeply flawed and no longer valid in the context of our current reality. I’m more interested in the psychological whys of the thinking behind their analysis!
Fred, read the article “Better Predictions in Renewable Energy (by Auke Hoekstra)” and tell me what you think. It might answer one or two of your questions!
Tks, Islandboy, I read the article and while there is much in there that makes sense, it isn’t quite what I’m talking about if for no other reason than that it is quite narrowly focused on technology. Granted that is indeed relevant to my point but not the point itself.
Perhaps watch the first video less than 8 minutes long and read the accompanying script from Daniel Kahneman’s Edge Master Class
https://www.edge.org/event/edge-master-class-2007-daniel-kahneman-a-short-course-in-thinking-about-thinking
The key point being exemplified in the text excerpt below, which differs in degree from what Tony Seba talks about when he mentions why for example Kodak missed out on the digital imaging revolution. In Kodak’s case they had no clue! In this Master Class example The Dean had all the information in his head, necessary to make a correct evaluation yet he said something totally ridiculous:
…There are also many difficulties in determining the reference class. In this case, the reference class is pretty straightforward; it’s other people developing curricula. But what’s psychologically interesting about the incident is all of that information was in the head of the Dean of the School of Education, and still he said two years. There was no contact between something he knew and something he said. What psychologically to me was the truly insightful thing, was that he had all the information necessary to conclude that the prediction he was writing down was ridiculous.
COMMENT: Perhaps he was being tactful.
KAHNEMAN: No, he wasn’t being tactful; he really didn’t know.
Yet he had all the information necessary to know and make a correct evaluation and still did not do so!
Basically he knew everything there was to know about the situation, He knew what he knew and he still didn’t know… think about that and let it sink in! 😉
Fred,
I read the transcripts, were the videos any different?
It was awesome, thank you for introducing it to me.
No they are the same!
BTW, I’m not normally a huge fan of economists and psychologists but having read a few of Kahneman’s books, I think there is a good reason they gave him a Nobel…
Cheers!
Here is a good place for keeping track of what is actually happening with India power generation (as opposed to what various people wish would happen)
https://indiapowerreview.com/how-india-generated-power-each-day-first-seven-months-of-2018/
Note on the graph the relative drop in coal and rise in hydro over the first seven months. Don’t get too excited. This is normal seasonal variation. The monsoon helps with hydroelectric output mid year.
I speculate that coal burning with have a very long life, especially in the winter and in cloudy zones. Ex- Korea will be burning coal as fast as they can in the winter. Not enough sun to power a modern industrial country much of the year.
Fred, you are singing to deaf ears. We are progressing toward an intersection of multiple predicaments and of fast growing disruptive technology (in itself a predicament), Any projections concerning human activity past five years is stretching it, past 10 is moving into the absurd. Basically we are in a period of chaos not seen in the world for many millions of years. Changes that might normally take thousands of years are happening in a decade.
Typically when a population reaches overshoot the population plummets. We are an atypical species so the new question is how long can we put off the inevitable and to what end?
We need a global plan, not lollygagging, helter-skelter and brouhaha. At least then there is something to measure against, rather than insanity that now prevails.
Yeah, GF, you are right. See my reply to Dennis, upthread.
Fred, out!
We need a global plan, not lollygagging, helter-skelter and brouhaha.
Yes, we definitely need a global plan. Unfortunately, global populations don’t make plans. Individual governments do make plans but if those plans are very unpopular, then those plans cause nothing but chaos among the population.
Austerity measures and population control measures are always extremely unpopular and will be resisted by the population. People know what they want and what they want is seldom what they need.
People will get what they want or there will be hell to pay. And if they do get what they want there will still be hell to pay.
Austerity measures and population control measures are always extremely unpopular and will be resisted by the population. People know what they want and what they want is seldom what they need.
Not quite! There are plenty of examples from recent history where National governments imposed drastic austerity measures and the citizenry willingly complied. Take for example the UK during WWII. The only thing that was needed for this to occur, was a common enemy!
In Sam Harris’ most recent podcast, #138 – THE EDGE OF HUMANITY, he discusses this with Historian Yuval Noah Harari. Yuval contends that humanity currently has three such common enemies that could become focal points for global co-operation. Climate Change, Ending the potential for Nuclear War and Technological Disruption.
Spoiler alert, Sam and Yuval have a rather amusing exchange on this point begining at roughly the 1:03 hour mark. Given that the talk is being held in the US, a country, which as Sam mentions, has elected to the highest levels of leadership, a person, who nobody, not even his supporters could possibly imagine, that there is any chance these problems could be addressed in any rational manner by said, leadership.
Government is reactive not proactive. They will make no plans until the crisis is at hand. However many individuals of the world are planning accordingly.
The ‘open on impact’ parachute syndrome.
NAOM
I agree that the best way to save the planet in some form is a global plan. I don’t see it happening soon.
However, I am counting on China to move us forward. Yes I know they still burn coal. Yes I know they still use ICE vehicles.
But I think they also see developing and exporting renewable energy, EVs, batteries, etc. as their best option for world domination. It is in their strategic and economic best interests (not even considering reducing pollution) to do this and I think they appreciate their role in the future more than fossil fuel advocates in other countries.
Is it my wish for China to rule the world? No, but if it is the best option we currently have for making the switch to renewables, so be it.
“People will get what they want or there will be hell to pay. And if they do get what they want there will still be hell to pay.”
Do you lay claim to this aphorism? It’s brilliant.
Yeah, I do. I just thought it up after I had written the first half. Then I thought, hell there will still to be hell to pay even if they do get what they want.
Population control measures are not always unpopular by any means. In fact they are often spontaneous. Introducing the pill, for example, cut birth rates drastically in the developed world without any problems. Several large Islamic countries also cut births rates without strong pressure from above, including Turkey, Iran, Bangladesh, Indonesia and Malaysia.
It’s also notable that China’s draconian one child policy has been eased, but the Chinese don’t show much inclination to have more children.
All you really need to do to cut the birth rate is provide universal health care and educate women. Of course, that lowers the death rate too, which is why world population is growing right now — more and more old people.
Your point about there not being any global planning is true. That is why the best bet is to find methods that have both local and global advantages, such as the massive terracing efforts going on in East Africa these days, or the Sahel Zone reclamation using planting pits. The work is done by farmers because it benefits them in the short term. But it also locks carbon into the soil on a massive scales.
“Any projections concerning human activity past five years is stretching it, past 10 is moving into the absurd.”
Fish/Fred — I agree 150%. Have been saying this to Dennis for years but he doesn’t get it, seems he never will.
Have been saying this to Dennis for years but he doesn’t get it, seems he never will.
And that, despite the fact that he probably took enough calculus to fly a Cessna 😉
In the meantime I’ve been enjoying the applied mathematics course on Non-linear Dynamics and Chaos Theory that GF posted the other day.
You can expose a human to knowledge, but you can’t force him or her to learn!
Cheers!
Fred,
I never studied psychology, more of a physics and economics person with degrees in both.
Doug,
Of course one cannot create an accurate scenario of the future for the next nanosecond, that pretty obvious to anyone. Call it an unstated assumption embodied in any scenario.
Frankly 5 days into the future is way beyond me.
The scenario is what will happen, if the model and assumptions are correct, no more, no less and true of every scenario whether it be 100 nanoseconds or 100 years.
Thanks for pointing out though. 🙂
I see the value in creating economic models, but I tend to assume they never contain all relevant variables. And most likely don’t/can’t factor in unquantifiable human behavior.
I see a lot of irrational behavior on the part of consumers, politicians, and sometimes companies.
I have suggested that higher oil prices will not necessarily result in a predictable increase in investment and production because these do not operate in isolation. There will likely be better investments other industries. Politicians might back laws that favor one industry over another. Wars and natural disasters may stop drilling. Estimates of available oil might be off.
The two areas I am most interested in are decline rates and corporate behavior of large oil companies. Those are happening right now and may provide insight to the future.
A couple of interesting articles on the limits of economic models.
https://www.scientificamerican.com/article/finance-why-economic-models-are-always-wrong/
https://www.ineteconomics.org/perspectives/blog/economic-models-that-are-costing-us-all
Boomer,
Agree economic models can never include everything, a d even if that could be done correctly, knowledge of the model by economic actors will change their behavior as they try to game the system.
This is a problem with social science in general.
I don’t quite get all the angst here. You (generic) don’t think modeling future energy production is worth the effort, but you can get all excited about Sebas projections. Am I getting this all wrong?
Hickory,
Pretty sure many don’t think Seba’s projections are good, I think many believe it’s a futile exercise/waste of time. I often ask for other people’s suggested assumptions, mostly nobody suggests anything. If anyone is ever interested in seeing the spreadsheet underlying a model I can provide it and people can tweak the assumptions or change anything they wish in the model.
When I have posted spreadsheets I have never gotten any feedback, so not much point.
I would also point out that many agencies do projections to 2050 and Jean Laherrere often projects out to 2100. The longer term projections are easy to do, but beyond a month will probably be wrong, as guesses about any future variable have an infinite range and we choose one point for each variable in a single scenario. Odds of success are pretty low.
I applaud your attempts Dennis, recognizing the outputs are only as good as the assumptions are well-conceived.
Thanks.
Often people make very good criticisms and I adjust assumptions in response. That’s more helpful than you cant predict the future, thats obvious, nobody can.
Seba is basically right about the way disruptive technology, but his predictions are hard to test. You can’t look at a new technology’s track record, so how can you tell that disruption is coming? And worse, you can’t tell when it’s coming, because it comes suddenly.
The way you can tell is that successful new technologies enter the mainstream by filling niches and then building enough volume there to move into the main market. Things like Theranos, which promise to do everything and take over the mass market in one step, are obviously fake.
Both battery technology and renewable energy are small scale compared to the total energy market, but both are rapidly filling a lot of niches.
For example, the electric bicycle and scooter markets are booming, as is the battery power tool market. And the market for larger vehicles is booming in one country, China. Also electric luxury cars are doing very well. This suggests that batteries are headed for other destinies as well.
Similarly, renewables are doing very well in certain markets where electricity prices are high, like islands, or resources are plentiful, like the American West, or where governments favor them, like Germany and North Carolina.
Meanwhile the price of both technologies is falling quickly, meaning the number of niches they can fill is expanding. If Seba’s predictions are to come true, you’ll be able to tell in advance as more and more niches are filled.
“You can’t look at a new technology’s track record, so how can you tell that disruption is coming? And worse, you can’t tell when it’s coming, because it comes suddenly.”
Seba would be the first to tell you that he has spent years studying this very phenomenon (disruption) and IIRC says as much in at least one of the many “Clean Disruption” presentations available on Youtube.
Seba Co-authored a report produced by the RethinkX Project which is available as a download at the following URL:
https://www.rethinkx.com/transportation/
On page 11 they address “the Seba Technology Disruption Framework TM” and the write up concludes with, “For a full description of the Seba Technology Disruption Framework, please see Appendix B.” Appedix B begins on page 67 and contains six more pages of text. There is also a 16 page PDF on the topic available from Seba’s web site at the following URL:
https://tonyseba.com/wp-content/uploads/2014/05/STDF-booklet-binding-ok.pdf
Seba appears to have made a considerable amount of effort to figure out how, why and when disruptions happen. He doesn’t appear to be very secretive about the results of those efforts!
Climate scientists have been getting scooped by geophysicists in terms of explaining what they thought were chaotic mechanisms are actually fairly straightforward. That means the predictions may work for more than a few years.
That’s also good news since the math of chaos is a dead-end.
That’s also good news since the math of chaos is a dead-end.
What chaos math is good for, is helping us identify potential tipping points in a system. What Chaos theory helps us understand is that once a tipping point is passed. Returning to a previous stable state is highly unlikely. So it’s probably best not to push the system… And it really doesn’t matter if we are talking about physical, chemical or biological systems the main lesson to be learned is that the math is pretty much the same across all non-linear dynamic systems. Not to mention that in the real world all of those systems are interconnected making for a very large order state space.
My point is that chaos theory has been of very little help in any practical way. Here is a site that claims that there are applications, yet the first is an example regarding the atmosphere
http://csuw3.csuohio.edu/sciences/dept/physics/physicsweb/kaufman/yurkon/chaos.html
yet, I don’t believe it’s that chaotic, especially in terms of some rather obvious behaviors
My point is that chaos theory has been of very little help in any practical way.
To be honest, I don’t know enough about the modeling of atmospheric physics to be able to make any fact based comments about practical applications of chaos theory to that field. I have to assume that the scientists who study these phenomena would at the very least benefit from having a deep understanding of the chaotic nature of turbulent flows.
I am aware of at least one example of applying insights from chaos theory to changes in flowing urban traffic, specifically in how that traffic is managed in the city of Rio de Janeiro Brazil. I don’t have a link to back that up because it is not from the literature but rather first hand knowledge from people I know who are personally involved in that project.
I did however search the literature and found this, which is a practical application in a similar context.
https://www.hindawi.com/journals/mpe/2016/5656734/
Mathematical Problems in Engineering
Volume 2016, Article ID 5656734, 15 pages
http://dx.doi.org/10.1155/2016/5656734
Review Article
Application of Chaos Theory in the Prediction of Motorised Traffic Flows on Urban Networks
Anyways, my personal interests lie more along the lines of tipping points in ecosystems which are able to be predicted by chaos theory.
http://www.pnas.org/content/112/20/6252
Nonlinearity and chaos in ecological dynamics revisited
Edit: link to Benincà et al’s paper; Species fluctuations sustained by a cyclic succession at the edge of chaos
http://www.pnas.org/content/112/20/6389?ijkey=dd802ec71652b9c561f0053b94a46226a0446bfc&keytype2=tf_ipsecsha
Cheers!
Our research on climate topics found these behaviors that actually not chaotic
1. ENSO – El Nino Southern Oscillation
Thought to be chaotic, but is just deterministically complex, much like a complicated tidal model
2. QBO – Quasi-biennial Oscillation of atmospheric winds
Easy to show that it follows a non-chaotic forcing
3. Chandler wobble of Earth’s rotation
Same
I think the attribution of some complex behavior to chaotic processes is just an excuse because they have run out of other options.
Would chaos become more significant the finer the detail one looks at? For example, looking at weather on a 5 or 10 km grid scale follow predictable rules but chaos taking over when going below 1 km.
NAOM
Google: Ed Lorenz and the Butterfly Effect.
Cheers!
Hi Fred, “if” is a standard word used in English academic papers to introduce assumptions and its equivalent in other languages is usually used for similar purposes.
Please note that given the assumptions (India’s future population, future per capita GDP, and future relationship between coal consumption and GDP), India’s per capita coal consumption by 2050 would still be substantially below the current per capita consumption levels in China, Japan, and US and roughly comparable to South Korea’s per capita consumption levels in the 1990s. These results are not particularly outrageous.
Prof. Minqi,
My intent was certainly not to quibble about the standard usage of the word ‘IF’, in the English language. I have absolutely no problem with how you used it and I’m quite aware of how its equivalents in other languages are also used.
With regards India, my second disclaimer at the start of my comment was this:
Second, the excerpt below regarding India is just an arbitrary example chosen by me to underscore what I consider to be typical of a number of deeply flawed assumptions on which future projections are based. I have no personal animus toward India, the Indian people or even those who have made these projections.
So to be clear, I’m not disputing the numerical output of those projections based on the data input into the models. I’m sure the math is 100% correct!
What I am trying to say, is that based on current available knowledge about the ecological carrying capacity of planet earth, suggesting that those numbers are even remotely plausible, belies, deep fundamental flaws in our thinking processes, and especially how we assess future risks.
http://worldpopulationhistory.org/carrying-capacity/
OUR ECOLOGICAL FOOTPRINT
One way to address the challenges associated with making future projections is to look at current human impact on the planet. The ecological footprint is a measurement of the anthropogenic impact on earth. It tracks how much biocapacity (biological capacity) there is and how much biocapacity people use by comparing the rate at which we consume natural resources and generate waste to the planet’s ability to replenish those resources and absorb waste. Today, our global footprint is in overshoot. It would take 1.5 Earths to sustain our current population. If current trends continue, we will reach 3 Earths by the year 2050.
On top of already being in ecological overshoot we have not been paying enough attention to existential threaths that may compound the consequences of overshoot. Climate Change, Sea level Rise and Ocean Acidification!
https://www.researchgate.net/publication/324528571_What_Lies_Beneath_The_scientific_understatement_of_climate_risks
OVERVIEW Human-induced climate change is an existential risk to human civilisation: an adverse outcome that would either annihilate intelligent life or permanently and drastically curtail its potential. Special precautions that go well beyond conventional risk management practice are required if the “fat tails” — the increased likelihood of very large impacts — are to be adequately dealt with. The potential consequences of these lower-probability, but higher-impact events would be devastating for human societies. The bulk of climate research has tended to underplay these risks, and exhibited a preference for conservative projections and scholarly reticence, albeit increasing numbers of scientists have spoken out in recent years on the dangers of such an approach. Climate policymaking and the public narrative are significantly informed by the important work of the Intergovernmental Panel on Climate Change (IPCC). However, IPCC reports also tend toward reticence and caution, erring on the side of “least drama”, and downplaying more extreme and more damaging outcomes. Whilst this has been understandable historically, given the pressure exerted upon the IPCC by political and vested interests, it is now becoming dangerously misleading, given the acceleration of climate impacts globally. What were lower-probability, higher-impact events are now becoming more likely. This is a particular concern with potential climatic “tipping points” — passing critical thresholds which result in step changes in the system — such as the polar ice sheets (and hence sea levels), and permafrost and other carbon stores, where the impacts of global warming are non-linear and difficult to model at present. Under-reporting on these issues contributes to the “failure of imagination” that is occurring today in our understanding of, and response to, climate change. If climate policymaking is to be soundly based, a reframing of scientific research within an existential risk-management framework is now urgently required.
(PDF) What Lies Beneath: The scientific understatement of climate risks.
So I just do not see any of those projections, whether it be GDP, per capita coal consumption or population growth numbers as being based on reality!
Cheers!
I definitely agree pursuit of infinite economic growth is fundamentally incompatible with sustainability.
For that matter, I do hope that some of the scenarios projected here will not materialize
Note that current trends in fossil fuel use are not likely to continue as all fossil fuel use will peak by 2030.
So an assumption that current trends will continue is absurd.
WSJ – Article does not say much. Vote is Monday. Florida imports 99+% of Energy
“Growing Opposition Threatens Completion of Last U.S. Nuclear Plant
Primary owners of Georgia’s Vogtle power plant are set to vote on the project—already years behind schedule, billions over budget”
Noteworthy:
400Watt 72 cell (1 m x 2 m size) PV Modules on the Horizon. We already have 350W 60 cell (1 mx1.6 m size)
https://www.trinasolar.com/us/resources/blog/trina-solar-blazes-trail-toward-400w-solar-modules
400w from 2 sq meter is 20% efficiency. Sunpower was there a decade ago, Like Apple they just got exempted from ALL Tariffs including the Solar Panel Tariff.
The Argument From Incredulity
Fred Magyar, a few days ago we discussed how people acquire their worldview. I stated it started with early indoctrination, as children, by authority figures in our early lives. Then there was confirmation bias by all our teachers and peers, and so on.
You stated that you were raised a Catholic, went to a Catholic school and received all the necessary indoctrination as a child but you became an atheist at a very early age. What happened? I stated that the same thing happened to me, raised in a staunch Baptist fundamentalist household, yet I also became an atheist in my early 20s. I stated that I did not understand why we were exceptions to the rule.
I think I have figured it out. The seed was planted a few weeks earlier in an August 13th post. I stated that I just could not believe the many world’s theory. “That is the universe splits many times a second, and we split with it. That means you are splitting into millions of copies of ourselves a minute. And a million million more times in the next minute.” I did not say so then but quite obviously after just a few hours there would be more universes, and copies of our world and ourselves than there are atoms in the universe. I just don’t believe it.
George Kaplan stated: I believe it is a valid hypothesis that has not been disproved. I also believe argument from incredulity is a logical fallacy with especially little bearing in the field of quantum mechanics.
That’s it! Some people, people like you and I, are just not capable of believing the incredulous. Some things are just too goddam stupid to be believed. Thank you, George, for helping me out here. I have told this story here before, but for the benefit of those who did not read it then I will tell it again, to illustrate the fact that the argument from incredulity is sometimes not just valid, but can possibly save one from a lifetime of gullibility, that is stupid credulity.
I was about 16 or 17 years old. My dad was sitting in his easy chair reading. I sidled up to him and asked, in the southern dialect I spoke back then: “Dad, how did them there Kangaroos git from Australia to over there where Noah’s Ark wuz. And how did they git back?” Dad shot up from his chair, poked his finger right in my face, and literally yelled these words at me: “Son, that is the word of God and that is not for you to question.”
But I still wanted to know. But the main thing was, I just could not believe something that incredulous. I think it is perhaps a genetic thing. Perhaps not. But there are just seems to be some people who just cannot believe really, really stupid things. And I know I am one of them and I think perhaps you are also.
Perhaps not. But there are just seems to be some people who just cannot believe really, really stupid things. And I know I am one of them and I think perhaps you are also.
Tks, for the vote of confidence, though to be honest, I’m sure that at one time or another throughout my life I have believed a few truly stupid things here and there. Santa Claus, comes to mind… Though one does tend to outgrow such notions over time. Maybe some people just remain infantile and never grow up, and may always need a sky daddy to tell them what to do.
As far as the Many Worlds Theory, that one, seems to fit more into the realm of philosophy than it does science, due to the fact that it doesn’t seem to be falsifiable.
https://www.technologyreview.com/s/424073/multiverse-many-worlds-say-physicists/
While I don’t want to get bogged down into a discussion involving String Theory (hypothesis) there are some physicists who consider the Many Worlds Theory to be the other side of the coin of The Multiverse Theory. Which I think we both agree, does have a somewhat firmer scientific basis.
Anyways, for those who might be interested, a good discussion of these issues: Beyond Falsifiability: Normal Science in a Multiverse
https://arxiv.org/pdf/1801.05016.pdf
Either way, most of the this discussion is above my pay grade! Though it might for a moment be rather amusing to imagine the traditional Christian God splitting into infinite versions… I could see infinite numbers of good christian heads exploding, just imagining that 😉
Cheers!
Ron- “Dad, how did them there Kangaroos git from Australia to over there where Noah’s Ark wuz. And how did they git back?” Dad shot up from his chair, poked his finger right in my face, and literally yelled these words at me: “Son, that is the word of God and that is not for you to question.”
That would be so hilarious, if it wasn’t true. You ought to supply this ‘screenplay” version to the Coen Bros.
Ron, I took an on line version Myers Briggs personality type and IIRC the result was INTJ. This was back in the days of theoildrum.com and I think it turned out that a lot of the members were either INTJ or INTP. One of the characteristics of my personality type that has stuck with me is that my personality type just wants things to make sense. IMO this would lead to a tendency towards atheism.
Whats better for a country like Malaysia or the Philippines- burn coal or replace farmland or forest with PV lots? Note- these places do not have big areas of wasteland/desert for lower impact PV lots like the Gobi.
Another version of this question- in Washington State a group wanted to cut down a big forest for a PV installation, something like 400 acres. Excellent forest land, mediocre solar capacity (like Germany or Pennsylvania). To me this seemed ludicrous.
-Thanks for the posting Dr Li!
“Whats better for a country like Malaysia or the Philippines- burn coal or replace farmland or forest with PV lots? Note- these places do not have big areas of wasteland/desert for lower impact PV lots like the Gobi.”
Or chop down forests, kill the animals, burn the trees and plant groves palm oil trees instead to feed the masses and burn for “clean” energy. “Malaysia is one of the largest producers of palm oil, and possesses the second largest area of plantations in the world. As of 2015, palm oil plantations in Malaysia covered 5.64 million hectares, of which 47% were in Peninsular Malaysia.”
And the Philippines plan to convert another 8 million hectares to palm oil production.
The Philippines is lacking in power infrastructure and it looks like coal might be pushed aside. http://mainstreamrp.com/how-wind-and-solar-energy-can-help-the-philippines-build-a-new-economy/
Right now the Philippines is out-sourcing the environmental disaster of coal mining by importing most of it, but seems to be reaping the rewards of coal burning. When forests and mountains are destroyed in other places, does that count?
S0 enough with the anti-PV rhetoric. PV can go on buildings, waste land and anywhere the sun shines. Wind power does not preclude forests.
Nothing is perfect, but it can be far better than the current system of mine/burn/put head in sand/get kicked in the ass.
S0 enough with the anti-PV rhetoric. PV can go on buildings, waste land and anywhere the sun shines. Wind power does not preclude forests
Gee! Anti-PV rhetoric on this site?! I must be very subtle because I hadn’t even noticed… /sarc
I don’t understand the attitude, the benefits of PV are orders of magnitude above any downsides. These people are so disconnected from nature and reality that they don’t want to see the blatantly obvious.
I used about 2 gallons of gasoline this week which is about 1/7 the norm and no I did not use any public transport (none here). Could you imagine a US where we use 1/7 of the fossil fuel energy that is now consumed?
Think back to about 1915.
I’ve driven less than 100 miles in the last 3 months. Been walking and biking. So I’ve used about 4 gals of fuel during that entire time. I’m getting to the point where it may no longer make sense for me to even continue to own a car.
Full disclosure, I am getting on an airplane and flying to Europe next week but I haven’t flown either domestically or internationally since 2016.
I’d be more than happy to take a nice slow cruise across the Atlantic in a solar powered dirigible if such a service were provided by someone… 🙂
Why do you own a car? Maybe the occasional rental would serve you better. Around here they pick you up if you rent a car.
I don’t live in town. I walk about 5 to 6 miles a day but that still would not get me to and from the nearest grocery store, not even close.
Yeah, when I get back from Europe I will serious think about getting rid of it. BTW, my local super market is only about 500 yds. away. The beach is less than 2 mi. The only thing is I’d be giving up the convenience of getting my kayak to the ocean. Maybe I can store it at a marina by the intracoastal.
you can easily move a Kayak with a bicycle. Just trying to help.
Very hard to go around corners.
Hi Gone Fishing. My comment was not at all meant to be anti-PV. Just pointing out that replacing good farmland or forest/wildlife lands with massive PV lots is not a step in any good direction. And make no mistake- we would need hundreds of billions of PV units to replace current coal and oil consumption. The take home message is that we are so far into overshoot that there are no good solutions. Massive PV deployment is its own kind of environmental catastrophe. Just ask the animals who use to live there.
And I am just as concerned with Palm as you.
Renewables are actually better for the Philippines because they don’t need a massive grid system. Local solar for houses and communities will actually give many people more electricity than they have now. Per Capita energy consumption is quite a bit lower than in developed countries, so local renewable energy will be a boost compared to what some have now.
According to this, the Philippines ranked 140 among countries in terms of electricity consumption per capita.
https://photius.com/rankings/2017/energy/electricity_consumption_per_capita_2017_0.html
Puerto Rico is an example of a country that is depending on solar now out of necessity.
Hi Hickory, my major point was that people are taking over huge swaths of land for other purposes far beyond what solar would ever need. Right now we have over 16% of the land surface covered in our infrastructure and less than 1% would cover all our power needs.
To replace coal power globally would take about the area of Rhode Island which is less than the area of land directly impacted by coal mining. Of course coal mining pollution also impacts many streams and rivers as well as the atmosphere and the oceans along with much of the land. What you see is not what you get.
So comparing areas is just not logical. Solar PV does not spread any of that pollution.
Using a systems approach:
Area energy density of solar PV is about 56 w/m2.
Area energy density of coal is about 0.015 w/m2 since it distributed across the globe and uses the whole globe as a toilet.
Well, I surely hope you are correct, and that the many (hundreds of) billions of PV units that will be needed to offset depleting coal, oil and nat gas over the next 50 yrs won’t be placed on fertile spots where once green things did flourish. Forests, grasslands, fields, orchards and good grazing land. These are places that once animals did live.
I would be satisfied if all class 1 and 2 farmland were off limits to all building (including PV), and a similar criteria applied to the biologic productivity and diversity rankings of non-farmed lands.
Like people here have said- this does leave rooftops and poor lands open. It will be hard in some locales that are blessed with fertile environs to find enough space, but they could perhaps import the energy on wires.
Bottom line- we need to have green things growing wherever they grow well. Not even a PV cell should be in violation of this.
Edward Abbey and Rachael Carson are with me on this.
I came back from my morning observations and wanderings, lots of geese in the lake, a young swan, birds singing in the trees around me, vultures having a battle flying right over my head driving the dog crazy, pink sunlight on a dappled sky and the first shades of autumn showing, to find your comment.
I wish I could sit and talk with you about my vision, no way I can express it in this format. Those bullshit numbers of PV panels you make up don’t do anyone or anything justice.
Sure, kill the PV and wind industry. Watch the world go away and most of the species die off under the waste product blanket of fossil fuel burn. Keep those poisoned farms. Watch as the forests and jungles are cut and burned for fuel and electric power, things PV and wind power could have stopped.
You think civilization will collapse and things will just go back to some imaginary natural setting. Civilization will not just lie down and vanish, the breakdown will wreck most everything and exacerbate all the problems we have now. Nature is only too glad to wipe the slate clean and give the planet to the jellyfish and fungi.
THIS IS A PLANETARY EMERGENCY WE ARE DEALING WITH. NO DERRICK JENSEN IMAGINARY RESULT WILL EVER COME TRUE.
BTW I think you need to reread Abbey and Carson, you seem to have missed a lot.
I too would enjoy a long chat by the lakeside. Please understand that my comments have no intent of taking the wind out of the renewable s deployment.
More to point out that we don’t do nature any good, or the ultimate carrying capacity of the earth any good, by diminishing the earth natural photosynthetic capability, even for the sake of PV deployment.
We need rapid downsizing, not covering forests with PV.
This will be hard in verdant places like N.Carolina and Malaysia, easy in west Texas and S. Calif..
Of course we should start with the rooftops. I have already seen PV lots on class 1-2 farmland. This land could be highly productive nature preserves if not needed for food.
Agree about the emergency setting of situation. Killing off more nature won’t help the long run.
” Just pointing out that replacing good farmland or forest/wildlife lands with massive PV lots is not a step in any good direction. And make no mistake- we would need hundreds of billions of PV units to replace current coal and oil consumption.”
1) In many cases you can combine PV and agriculture. PV gives shadow, very nice aspect in many countries.
2) Most countries do not have an issue with large PV arrays as there is a lot of wasteland.
You have to prove that the proposed issues are the rule, not the exeption.
Our local Wallymart is attached to a shopping mall, mostly empty, surrounded by car parks with a couple of other companies and a bunch of lots available. If the whole area had been built under a solar roof it would have been capable of generating 50MW daily.
NAOM
Replacing farmland with PV is an excellent idea in many cases, such as in the absurd farmland of California’S Imperial Valley, were farms are ruining the local water supply, or Antelope Valley, which farms have already ruined.
There are other cases where PVs improves the land. For example, PV on surface parking makes a lot of sense in hot dry climates.
Question: If we take Minqi Li’s forecasts and estimate emissions (remembering to correct for plastics, asphalt, and the fact that propane and butane have less emissions than oil), what do they look like? Has anybody tried it?
Emissions scenarios will be shown in Part 5 of this report. We are set for more than two-degrees warming. But given the projections shown in Part 2, 3, and 4 of this report, global warming by the end of this century will probably be less than 2.5 degrees.
The satellites have been up for nearly 40 years. Close to half a century. Only 0.19 degrees C so far. Global warming theory has failed. I recommend that you do not degrade your report by wandering off into fantasy.
The 0.19 degree anomaly isnt referenced to pre-industrial. It also lacks coverage over the far north in the Arctic region, where warming is amplified. The increase thus far is about 0.9 degrees C since 1850. Minqi Li is probably right, the fossil fuel constraints will take temperature into the 2 to 2.5 degrees anomaly range. So we need to focus on several geoengineering options, which of course are opposed by the witch doctor mentality we see these days.
So we need to focus on several geoengineering options, which of course are opposed by the witch doctor mentality we see these days.
UGA BUGA WUGA!
.
How about 0.04 C per year for the next dozen years?
I will let Dr. Tony Ingraffea, Professor at the School of Civil and Environmental Engineering of Cornell, speak about the data and realities of climate change and shale production.
https://www.youtube.com/watch?v=80IAt6a4F2Y
A more thorough and complete lecture from Dr. Tony Ingraffea.
Shale Gas: The Technological Gamble That Should Not Have Been Taken by Anthony Ingraffea
https://www.youtube.com/watch?v=PGfIjCG-zB4
Fish, theses vids are pretty phenomenal, especially the half-hour interview.
So you do accept that all the warming since 1850 has been caused by humans. You confuse me.
Geoengineering will solve nothing. We are past the tipping point. We must abandon fossil fuels to avoid making things worse, but that won’t help with all the warming in the pipeline coming our way. The amount of heat accumulated in the oceans makes the Arctic sea ice a goner.
Damn, David A must be super-smart, not like those NASA people that show 0.9 degree C global land-ocean temperature rise 1975 to 2017.
You missed the word arse before the second comma.
An oldie, but a goodie
http://woodfortrees.org/plot/crutem4vnh/mean:12/plot/hadcrut4gl/mean:12/plot/crutem4vnh/trend/plot/hadcrut4gl/trend
News just in:
Navajo Generating Station buyer backs out, putting coal plant future in doubt
Dive Insight:
A number of groups — including the Trump administration — want the Navajo plant to stay open, but there are no takers yet for the power it produces.
Central Arizona Water Conservation District, which currently buys the Navajo plant’s output, wants to replace that energy with renewables. Several state initiatives are driving other consumers to buy electricity from sources with lower greenhouse gas emissions. California seeks to use 100% carbon free energy by 2045, and voters in Arizona will consider a 50% renewables standard in November.
On the other side is Peabody Coal, which supplies the plant with its fuel; the Department of Interior, which owns a 25% share of NGS; and the Navajo Nation, which derives a significant portion of its budgets from plant lease payments and relies on the plant for employment.
At one time the plant was expected to continue operating until 2044.
This is a bit of a challenge for the Trump administration considering this:
Navajo power plant likely to close, despite Trump’s promises to save coal
Fees from the power plant and the nearby mine that supplies its coal make up roughly a third of the Nation’s operating budget each year, Begaye said.
So, he wanted to save the plant. And he turned to a man he saw as a natural ally, newly inaugurated President Trump, who campaigned on promises to bring back coal and return power to people outside Washington.
“I immediately challenged President Trump in the media, saying, we’re the local people that you said you were going to listen to, and you said that you were going to support the coal industry,” Begaye said. “Now is the time to make that real.”
But the Navajo president was disappointed.
He wanted a dramatic deal from Trump: tax subsidies or incentives to keep the plant open.
The help he got was more subtle. The Bureau of Reclamation, a federal agency that’s part owner of the plant, has been facilitating negotiations to keep the plant open for two more years, in the hopes of buying time to find new owners who will keep the plant running after that.
But as the July 1 deadline for those negotiations nears, the vision for the future of the Navajo Nation is already changing.
This plant has been struggling to compete with NG fueled generators and more recently has had to contend with competition from PPAs for electricity from solar that feature the lowest prices for solar in the US and are among the lowest in the world. I think it is very unlikely that the prospects for this plant, which is the largest west of the Mississippi, are ever going to improve.
If electricity production using coal cannot remain competitive in the four nations that are the world’s largest producers of coal, how do they expect to convince nations that have to import coal that, coal is the a better choice than the alternatives that are making it uncompetitive in their home markets?
OPEC meeting: https://www.reuters.com/article/us-oil-opec/opec-russia-rebuff-trumps-call-for-immediate-boost-to-oil-output-idUSKCN1M30DK?il=0
I interpret the outcome as all members (perhaps excluding SA) pump more or less flat out. The cartel will not make any immediate additional increase but some of the spokespersons say “they needed to focus on reaching 100 percent compliance with production cuts agreed in June” (i.e. increase output).
THE USE OF HISTORICAL PRODUCTION DATA TO PREDICT FUTURE COAL PRODUCTION RATES
Pennsylvania Anthracite
The historical production curve for Pennsylvania anthracite (figs. 3A, 3B) is a classic example of a nearly normal discovery-to-depletion life cycle. The coal resource was developed in the middle of the last century and went through a 70-year long period of rapid growth until 1917, when annual production reached 99.7 million tons during World War I. Following the War, production at first declined rapidly into the years of the Depression, then rose a little to a relatively small second-cycle peak of 63.7 million tons in 1944 during World War II. Production has declined ever since to the 5 million tons or less that are currently produced annually. Even though the anthracite resource remaining in the ground is substantial, the complex geologic structure, steep terrain, and early mining of the thicker and more accessible blocks of coal preclude the use of modern mechanized equipment underground. Large-scale surface mining of shallow old works is conducted in the few places where the anthracite may be extracted profitably (Edmunds, 1995), and only 5 million tons or less are produced annually.
The historical production curve for anthracite is used herein to illustrate the use of both production decline rates and reserve decline rates to forecast future production (figs. 3A, 3B).
Virginia’s Bituminous Coal
Virginia has three historical mining districts of significance: the Richmond basin of Early Mesozoic age, the Valley coal fields of Mississippian age, and the southwestern coal fields of Pennsylvanian age. Only the latter, which is an extension of the great Pennsylvanian coal fields of the Appalachian Plateaus into the southwestern corner of Virginia, is of any current economic significance to the State. Because of the remoteness of the southwestern Virginia coal fields from the industrial markets of the northeast, full-scale development did not begin there until 1882 (Hibbard, 1990), much later than the first production of Pennsylvania anthracite (fig 4).
https://pubs.usgs.gov/circ/c1147/historical.html
At the bottom of the article is a link to the larger Virginia study.
BTW, Pennsylvania is now producing about 8 million tons of year of anthracite coal, more than half of which is from refuse sites. http://files.dep.state.pa.us/Mining/BureauOfMiningPrograms/BMPPortalFiles/Annual_Reports/AnthraciteAnnualReports/2016/2016AnthraciteStatewideProductionSummary.pdf
Well, Canada’s coal production seems to be holding fairly steady and, “There’s great coal here, there’s great infrastructure here, it’s equidistant to market, but moreover the government supports us here,” Peter Doyle, Atrum’s vice president of marketing and business development, told a Coal Association of Canada conference in Vancouver Friday, September 18. Atrum has long-range plans to develop multiple underground anthracite coal mines, and eventually move the coal through the Port of Stewart. It has signed a memorandum of understanding with the Stewart World Port for 5 million tonnes of shipping capacity per year.”
Personally I have never come across the term “great” relating to coal quality assessment.
Is that above anthracite in quality or have Canadians started sounding like Trump?
I wonder why the renewable energy boys have not caught onto the pumping and transport problem. For example, one third of Russian transport energy is pipeline energy. When one can collect wind and solar in a local area (sometimes right at the user site), all that transport energy and infrastructure maintenance could be eliminated (as well as mining and refining). No need to ever replace all those millions of miles of pipelines, ships and trucks. No constant pumping energy at the mining and drilling site either.
We’re one of a declining number of households here in Maine who burn anthracite. We have burned wood and kerosene, but both are hard work, have severe limitations and stink detestably. We don’t have an oil furnace in this old farmhouse. There is no natural gas pipeline nearby. In the wintertime, the antique range we use heats all our hot water and cooks all our food, in addition to heating half the house. I adore anthracite as fuel–it is the original “clean coal,” in fact it was typically called “smokeless coal” because of its hardness and clean, blue flame. It has the lowest moisture content and highest carbon of any coal. And you wouldn’t believe the shit we catch from people who find out we burn “coal,” as if all coal is the same. Germany burns over 70 million TONS of lignite a year to charge people’s cellphones, and we’re supposed to agonize over burning 6 tons of anthracite in a season….
At least we haven’t reproduced.
Six tons, seems like a lot of energy to heat a house, equivalent to 1500 gallons of oil.
Remember–this is Maine, and we also use the fuel for heating our hot water and for cooking.
Edit: Here people spend about 280 dollars per month on fuel oil bills. Maine is the most oil-dependent state for heating in the US. Everyone burns something. It’s pretty sad.
And you wouldn’t believe the shit we catch from people who find out we burn “coal,” as if all coal is the same.
The problem isn’t a few people here and there burning it for their own needs. It only becomes a problem when entire civilizations do it collectively and no one is accountable or is held responsible for the consequences and damages to the commons.
Yeah, and I still reel from a statistic I read last year–that Germany goes through 77 million tons of LIGNITE per year. Nothing against Germany, mind you. It’s just another sad fact of our existence.
To be fair, I think most Germans realize that that can’t and won’t go on forever. They also were pioneers in starting down the path to a carbon free future with their Energiewende program and they did put their money where their mouths were. A lot of the technology that China uses today in PV was originally developed by Germany. The R&D was not cheap and there was a step learning curve. They still have a long ways to go for sure, but think of how bad things would be if they hadn’t even taken those first steps.
Unfortunately while coal use is already in decline through out Germany its things like this, that really keep me up at night:
https://journals.plos.org/plosone/article?id=10.1371/journal.pone.0185809
More than 75 percent decline over 27 years in total flying insect biomass in protected areas
Abstract
Global declines in insects have sparked wide interest among scientists, politicians, and the general public. Loss of insect diversity and abundance is expected to provoke cascading effects on food webs and to jeopardize ecosystem services. Our understanding of the extent and underlying causes of this decline is based on the abundance of single species or taxonomic groups only, rather than changes in insect biomass which is more relevant for ecological functioning. Here, we used a standardized protocol to measure total insect biomass using Malaise traps, deployed over 27 years in 63 nature protection areas in Germany (96 unique location-year combinations) to infer on the status and trend of local entomofauna. Our analysis estimates a seasonal decline of 76%, and mid-summer decline of 82% in flying insect biomass over the 27 years of study. We show that this decline is apparent regardless of habitat type, while changes in weather, land use, and habitat characteristics cannot explain this overall decline. This yet unrecognized loss of insect biomass must be taken into account in evaluating declines in abundance of species depending on insects as a food source, and ecosystem functioning in the European landscape.
Energiewende is a failure outside of the social engineering aspect. Some people feel now good about themselves but the hundreds of thousands living off the grid with renewable means the industrial cost of power is not affordable. This causes some of the social instability Germany experiences because the country is losing industry while gaining low skilled refugees. The unexpected American tariffs are now another threat to German industry.
Ohne Senf aber mit Scheiss. -:)
If you make propaganda, then at least try to make good propaganda. You are a stupid lier as all of
“Some people feel now good about themselves but the hundreds of thousands living off the grid with renewable means the industrial cost of power is not affordable. This causes some of the social instability Germany experiences because the country is losing industry while gaining low skilled refugees.”
is wrong.
This causes some of the social instability Germany experiences because the country is losing industry while gaining low skilled refugees. The unexpected American tariffs are now another threat to German industry.
Ich muss die Neuigkeiten über Deexit verpasst haben!
Gab es einen deutschen Austritt aus der Europäischen Union? Oder hat Donald dir gesagt, dass du das schreiben sollst? Sie sind ein Idiot!
Hold the mustard!
“A lot of the technology that China uses today in PV was originally developed by Germany.”
Before Germany, there was the US…
“Your President Jimmy Carter was the first politician to promote an industrial revolution with renewables,” primary author of the Germany law, Hans-Josef Fell, said when we met in his Berlin office in April. “I looked to the USA in the 1970s. There was wind power in California and solar power on the White House. I thought, ‘Oh, this is wonderful! Why can’t we have this in Germany?’”
For a time, the United States led the world in developing renewable energy. At one point the Carter administration’s Solar Energy Research Institute (SERI) made the dream of a renewable energy economy so real that it set off alarms in the oil-rich countries of the Middle East.
“The big powers are seriously trying to find alternatives to oil by seeking to draw energy from the sun,” Saudi Arabia’s oil minister Sheikh Ahmad Zaki Yamani warned his colleagues. “We hope to God they will not succeed quickly because our position in that case will be painful.”
Four years later, Carter was defeated by Ronald Reagan. The new administration considered SERI a prime example of what it derided as “solar socialism.” The budget of the world’s leading solar institute was slashed and before long it was back to (oil) business as usual.
As Fell tells it: “Reagan said, ‘Go away with this shit of renewables.’ And that was that.”
A generation of Germans picked up the renewable torch that the Reagan administration tossed aside and bought up SERI-produced patents at fire-sale prices. The renewable energy revolution didn’t end. It moved overseas and was renamed die Energiewende.
https://insideclimatenews.org/news/20121120/germany-energiewende-clean-energy-economy-solar-wind-electric-grid-utilities
“Yeah, and I still reel from a statistic I read last year–that Germany goes through 77 million tons of LIGNITE per year. Nothing against Germany, mind you. It’s just another sad fact of our existence.”
What is the GGH difference between lignite in Germany and hard coal and between lignite and NG?
Your gut feeling is no substitute for hard data, please provide them.
The other aspect is of course that Germans have despite the still quite high use of coal a much lower footprint in comparisons to North Americans and wipe the floor with them when it comes to GDP/kWh. :-).
In other news, in case anyone is interested, In a new study just released in the Journal, Geophysical Research Letters (behind paywall). Seems there is another little twist in the consequences of melting permafrost!
Story written up in Live Science:
https://www.livescience.com/63612-arctic-acid-permafrost.html
Melting Arctic Permafrost Releases Acid that Dissolves Rocks
As temperatures rise in the Arctic, permafrost — permanently frozen ground — is defrosting at an alarming rate. But the permafrost isn’t the only thing in the Arctic that’s melting.
Exposed rock that was once covered in ice is dissolving, eaten away by acid. And the effects of this acid bath could have far-reaching impacts on global climate, according to a new study.
Icy permafrost is rich in minerals, which are released when the ice melts. The minerals then become vulnerable to chemical weathering, or the breakdown of rock through chemical reactions, scientists recently reported. They investigated areas once covered by permafrost in the western Canadian Arctic, finding evidence of weathering caused by sulfuric acid, produced by sulfide minerals that were released when the permafrost melted.
Ain’t dat COOL?!
In case someone has access here’s a link to the actual paper:
https://agupubs.onlinelibrary.wiley.com/doi/abs/10.1029/2018GL078748
Abstract
Permafrost thaw in the Arctic enables the biogeochemical transformation of vast stores of organic carbon into carbon dioxide (CO2). This CO2 release has significant implications for climate feedbacks, yet the potential counterbalance from CO2 fixation via chemical weathering of minerals exposed by thawing permafrost is entirely unstudied. We show that thermokarst in the western Canadian Arctic can enable rapid weathering of carbonate tills, driven by sulfuric acid from sulfide oxidation. Unlike carbonic acid‐driven weathering, this caused significant and previously undocumented CO2 production and outgassing in headwater streams. Increasing riverine solute fluxes correspond with long‐term intensification of thermokarst and reflect the regional predominance of sulfuric acid‐driven carbonate weathering. We conclude that thermokarst‐enhanced mineral weathering has potential to profoundly disrupt Arctic freshwater carbon cycling. While thermokarst and sulfuric acid‐driven carbonate weathering in the western Canadian Arctic amplify CO2 release, regional variation in sulfide oxidation will moderate the effects on the permafrost carbon‐climate feedback.
I guess based on that we really have nothing to worry about, eh?!
Fred, you’re being so yesterday. Think geoengineering solutions: realize that we have thermopiles now for maintaining integrity and stability in warm permafrost. Think of how much (melting) permafrost there is in the world then think business opportunities. Don’t be so negative man.
Think geoengineering solutions: realize that we have thermopiles now for maintaining integrity and stability in warm permafrost.
I’m sure the H2SO4 loving thermophiles will love dissolving all those thermopiles… 😉
You have any business plans that include thermophiles?
Cheers!
Estimable DougL,
Then I wish we’d had thermopiles in Kiana, on the Kobuk River in NW Alaska back in 19-ought-81. The village had had an insulated sewer line put in the year before so they’d filled in all their outhouse pits. The insulation proved proved inadequate during the following winter and the permafrost around the sewer line melted (unevenly, as is its wont) stressing the line and causing breaks in it, so the line was closed and the villagers, and we, had to use Nature for our, um, needs. This meant the trees (there were some, we were just south of regional treeline). The trees were where the mosquitos were and they were overjoyed to greet us.
Think about it: There you are, engaged in what amounts to an exercise in selective muscle relaxation, while whole nations of mosquitos are lined up on you, mapping out your circulatory system.
Then, early in August, the villagers began talking about the imminent gnat season…
Then, early in August, the villagers began talking about the imminent gnat season…
Yeah, here’s a sculpture of a Borrachudo (blood sucking gnat, Brazilian version) on the wall of a local sandwich shop in Ilha Bela, SP. They are very welcoming of both natives and tourists alike though they seem to prefer new blood.
.
Funny, one fellow in the town has sculpture of a five foot long mosquito prominently displayed in his front lawn. Not many mosquitos left but still enough to know they are around, definitely a good crop of gnats though.
Synapsid’s story reminds me of canoe trips in the Adirondacks, baring skin to a horde of mosquitos and or black flies. I do mean horde.
Gone Fishing,
Black flies are far worse than mosquitos in my mind. We encountered them on the Appalachian Crest in New Hampshire while coring a lake. For years afterward I could tell where the tops of my socks had been, from the scars.
Most of my field work has been in the Sierras and Cascades, and in the Rockies in Colorado. I’d never run into black flies before.
Do you know the Canadian song “The Black Fly”? It was written by a fellow working in northern Ontario in the 1940s, I think it was. “The black fly, the little black fly / The black fly, wherever I go…” It’s online.
They dive-bomb into your ears, mouth, and up into your nose holes. Believe me, I know. You haven’t really been to Maine until you’ve swallowed a flack by.
We have a beast called Jejenhe (pronounce heh-heh-ne). These form black clouds of pain, normally, 1-2 meters across. I watched one of these clouds and several Dragonflies were hovering about 2 meters away. The Dragonflies took turns, darting into the cloud and out, picking off lunch. If you really want hurt, go to a coffee plantation, you can’t even see the blighters as your skin erupts in red bites.
NAOM
If you really want hurt, go to a coffee plantation, you can’t even see the blighters as your skin erupts in red bites.
Hey you could also enjoy an excursion into the Florida mangroves at dawn or dusk to be greeted by our friendly No See Ums!
I almost prefer their Borrachudo cousins that I posted about the other day, at least you can see those…
I raised coffee in Maui.
Growing it was not a problem—
Processing the beans? Incredibly energy intensive.
There would be no golf ever played in large swathes of Canada without DEET.
Golf:
https://www.youtube.com/watch?v=Z4w7H48tBS8
Climate Change Comes Home To Roost In North Carolina
Breached swine lagoons. Overflowing coal waste ponds. Sewage in the streets. The hellish aftermath of climate-fueled Hurricane Florence
FAYETTEVILLE, N.C. — Florence’s rain came down in sheets ― unrelenting, and for days on end.
The water inundated homes, many still boarded up from Hurricane Matthew two years earlier. It swallowed farm operations, killing millions of chickens and turkeys and overflowing open pits full of hog feces. It flooded coal ash ponds, sending the toxic byproduct of burning coal into area waterways. The smell of human waste tainted neighborhoods; in the small town of Benson, 300,000 gallons of raw sewage spilled into the streets.
On Friday, Charlotte-based Duke Energy reported that a dam containing a lake at one of its power plants in Wilmington had been breached by floodwaters, potentially spilling coal ash from a nearby dump into the Cape Fear River.
Many parts of North Carolina are still unnavigable, with entire stretches of highway turned to rivers. Rural roads have been washed out.
https://www.huffingtonpost.com/entry/hurricane-florence-climate-change_us_5ba53abae4b069d5f9d2a909
https://www.huffingtonpost.com/entry/pigs-chickens-killed-hurricane-florence_us_5ba15035e4b046313fc0213f
The needs of the many, the needs of the few, and non-cooperation with finger pointing:
Hole in the Levee where the trains run through.
https://www.nbcnews.com/news/us-news/rail-company-blamed-hurricane-florence-flooding-north-carolina-town-n911526
Perhaps they should have hired more finger pointers…
.
Many parts of North Carolina are still unnavigable, with entire stretches of highway turned to rivers. Rural roads have been washed out.
I’m sure that can’t be right! There must be dozens of types of boats in North Carolina, perfectly capable of navigating those flooded highways! 😉
Personally I have never come across the term “great” relating to coal quality assessment.
Is that above anthracite in quality or have Canadians started sounding like Trump?
What?! You are not familiar with GREATHRACITE?
It’s just GRRRREAT! Even better than putting a tiger in your tank!
.
Does this count as a geoengineered project? And, why does the expression ‘geoengineered project’ give me the willies? At least fish are smarter than the engineers who came up with this nutty plan!
FRANCE REMOVES TOXIC TYRES FROM FAILED REEF PROJECT
“Teams of divers are painstakingly lifting an artificial reef made of tens of thousands of old car tyres from the seafloor south of France, after it was found to spread pollution from toxic chemicals. The operation is costing well over a million euros ($1.1m; £898,000) and is part-funded by the tyre manufacturer Michelin as well as the French state. The divers are supported by a boat with lifting equipment. Fish had been avoiding the area.”
https://www.bbc.com/news/world-europe-45620299
Yep, they tried the same tired idea of tiered tires off of the Florida coast with pretty much the same disastrous results! The idea was proposed by a Professor of Ocean Engineering. I guess you could say it was the marine equivalent of a geoengineering project where they unleashed a whole slew of unintended consequences.
http://www.nbcnews.com/id/17189132/ns/us_news-environment/t/idea-making-reef-tires-backfires/#.W6geV9NKjIU
“The really good idea was to provide habitat for marine critters so we could double or triple marine life in the area. It just didn’t work that way,” said Ray McAllister, a professor of ocean engineering at Florida Atlantic University who was instrumental in organizing the project. “I look back now and see it was a bad idea.”
In fact, similar problems have been reported at tire reefs worldwide.
“They’re a constantly killing coral-destruction machine,” said William Nuckols, coordinator for Coastal America, a federal group involved in organizing a cleanup effort that includes Broward County biologists, state scientists and Army and Navy salvage divers.
As for:
And, why does the expression ‘geoengineered project’ give me the willies?
Here’s my theory: Because, the very last people on this planet who should ever be allowed to propose any geoengineering project are engineers. Because they don’t understand that their simplistic ideas may actually result in massive disasters. They often suffer from acute Dunning Kruger syndrome and generally speaking are too arrogant to listen to, or take advice from the people who actually study ecosystems.
Little press about which Utility Locked up the Q cell PV Production in Ga. Perhaps there was fall out on Next Era Contracting 120% of Jinko’s Jacksonville Fl production. Keep in mind that Centralized Investor Owned Utility “IOU” Solar Costs MANY times Customer-owned Rooftop solar.
Investor Owned Return on Capital Model – Rate in NWFlorida is 14.4% for 30 years. So a Single $350 PV Panel will cost YOU $1533. Now you know why the Edison Institute is spending millions of YOUR dollars to Halt 3rd Party ownership of Distributed Energy Resources.
https://www.pv-magazine.com/2018/09/21/hanwha-q-cells-to-make-half-cut-mono-modules-at-u-s-factory/
RESEARCH FORECASTS US AMONG TOP NATIONS TO SUFFER ECONOMIC DAMAGE FROM CLIMATE CHANGE
“The findings point to some paradoxical behavior in the climate governance arena. While the European Union has been an international leader on climate issues, the research shows the threat levels of future warming to be much higher for counties such as the U.S. and India. These nations might be expected to take a leadership role on climate, which historically has not been the case.”
Read more at: https://phys.org/news/2018-09-nations-economic-climate.html#jCp
I read an op-ed in the MSM recently that down played the correlation between climate change and the recent intensity and size of Hurricane Florence, claiming that this was just weather related. The science obviously shows otherwise. Same with Hurricanes such as Katrina, Sandy, Harvey, Irma and Maria.
At some point the economic impact of all this just ‘Normal Weather’ has got get the attention of the Insurance companies, wouldn’t you think? I have not seen any numbers on the costs of Florence alone but am willing to bet it will be in the multiple billions.
I live in the greater Miami area and there hasn’t been anything normal about the weather around here for well over a decade or more. And I can clearly see the signs of sea level rise just by walking down the street towards the Intracoastal at high tide. There is salt water coming up through the storm drains on the street corners and its easy to see where it is killing off front lawns and landscaping of the multi million dollar homes near the water. Fortunately for me, I live on the poorer side of Federal Highway 1 and it hasn’t reached me as of yet… 😉
Cheers!
I think $30 billion for Florence. It ‘s not just the intensification, the big thing with Florence, and before that Sandy, is that the change in the jet stream means the storms can get pushed ashore and stall rather than veering out into the Atlantic (previously they mostly turned right). Another interesting point for Florence was that it flooded areas that were still boarded up from the last hurricane from a few years ago. I think once things don’t recover between major events is when area will get abandoned with 100% losses.
“I think once things don’t recover between major events is when area will get abandoned with 100% losses.”
I expect a similar scenario will unfold in many rural areas, such as where I live, owing to an increasing frequency and severity of wildfires. Every year, it seems, insurance companies are making it more difficult, and more expensive, to renew policies.
True, as I can see around my own neighborhood, damage from previous storms (including Sandy) is not all being repaired or cleaned up. Large cyclonic storms are achieving wind speeds of F3, near F4, tornados.
Also, often ignored, is the new potential of just linear storms to do damage. There are several damaged houses and buildings within walking distance from my house, all from this years typical storms. One house had to be completely demolished. I have repairs to do as some siding got ripped off that Sandy did not touch. A boat was lifted out of the lake and deposited 50 feet onto land from one thunderstorm. The rate of damage and severity is on the increase. Trees are going down in every strong storm now. The electrical grid is under heavy onslaught.
Damaging storms are nothing new, so it is easy to ignore the changes.
Yeah, its weird: “Low-lying south Florida, at the front line of climate change in the US, will be swallowed as sea levels rise. Astonishingly, the population is growing, house prices are rising and building goes on. The problem is the city is run by climate change deniers”
And, as I’m sure you know Fred, of the 4.2 million US citizens who live at an elevation of four feet or less, 2.4 million of them live in south Florida.
https://www.theguardian.com/world/2014/jul/11/miami-drowning-climate-change-deniers-sea-levels-rising
And, as I’m sure you know Fred, of the 4.2 million US citizens who live at an elevation of four feet or less, 2.4 million of them live in south Florida.
Oh yeah! Though there are times when I wish I too could be as blissfully ignorant of that reality as our resident engineer, Mr. Leanme, who recently pontificated up thread about how sea level rise was not a problem. The journal Nature, is an ideological publication, and how a US DOD US Armed Forces study, was biased by intense Obama administration pressure to pump up climate hysteria.
I think he should move to Miami! He would probably fit right in with all the other deniers here!
We have lost about 20 square miles along the Atlantic coast between 1996 and 2012.
Globally, a rise of 0.74 meter would cause loss of 420,000 km2 land and displacement of more than 115 million people.
What is helpful is that sea level rise versus land lost is not linear. One meter of sea level rise would inundate 1,055,000 km2 of land. To double that area lost would take nearly six meters of sea level rise.
The downside is the societal and ecological importance of that land. Many high population regions, ports, etc would be destroyed while vast areas of marshlands would also. For that same of 1 m versus 6 m rise, the population affected would be a multiple of four times.
Thinking about the non-linearity of sea level rise versus land lost and also human regions lost, we take our biggest hit in the first 3 to 4 meters of rise. Also that can occur quite quickly.
Combine that with increasing storm size and strength to get a nasty combination for anyone within 10 meters of sea level in the near future.
I was at an race meet at a go-kart track near to the airport in Kingston (Jamaica) yesterday (Sunday Sept. 23). The airport is located on the Palisados strip. From Wikipedia:
Palisadoes is the thin tombolo of sand that serves as a natural protection for Kingston Harbour, Jamaica. Norman Manley International Airport and the historic town
(Port Royal was the base of operations for Captain Henry Morgan the infamous pirate on whom the movie series “Pirates of the Caribbean” is based”)
The spectator stands look out north across the track and across the harbour to the downtown Kingston waterfront as seen in the picture below. The picture below must be at least 5 years old since it does does not show the new 13 story headquarters of a mobile phone company that was opened circa 2012, much less two new multi-story office complexes being built to the east (right). I looked at this scene, thought about this very topic and thought to myself, brilliant! I remarked to a friend that if sea levels rise as has been predicted, that whole area will be under water.
To make matters worse, there’s this:
B&D to develop The Spires in tribute to founder
Roderick ‘Ricky’ Francis, son of the late Roderick ‘Bunny’ Francis, says he intends to execute the dream project conceived by his father, a multibillion-dollar complex called The Spires to be developed on the Kingston waterfront.
Bunny Francis was the founder of seafood company B&D Trawling, which launched in 1980, a business his son now operates.
The Spires will comprise residences, a marina, retail stores and restaurants.
“The first stage will be the 10-storey residential project on the waterside on the site we occupy. It’s always been a dream of my father to develop the area and bring back downtown,” said Francis. “We want to see Kingston as a premier city in the Caribbean, with downtown in particular being a driver for bringing people and commerce back.”
The land on which B&D sits is owned by the Urban Development Corporation (UDC). Francis said Thursday that negotiations are under way with the agency to acquire the five-acre property, adding that B&D holds a lease with an option to buy, which it is now attempting to execute.
“We are in the final stages of negotiation in terms of just identifying the land usage,” he said, but declined to disclose the price offered for the land.
The B&D Trawling Seafood Market, Processing Centre and a Major Water-Front Entertainment Park is listed by the Ministry of Economic Growth and Job Creation as included in the Downtown Kingston Redevelopment Plan – the DKRP.
Other proposed developments under the DKRP a proposed Musson’s West Kingston Business Park; Kingston Lifestyles Plaza; Railway Station Museum projects; a Microbrewery, Restaurant and Beer Garden and the Pan-Jam Boutique Hotel and Business Centre. They were cited as public private partnerships.
Somebody isn’t thinking this whole thing through and/or has not been listening to the warnings of the scientists! I’ve been accused of thinking too much! If (when?) the stuff warned about comes to pass, folks will realise that a shitload of money has been wasted on what will turn out to be largely useless shit!
They are betting on 20 to 30 years if they thought at all.
If you watched those videos I put up, it becomes clear that the waste is/was on a huge scale.
http://peakoilbarrel.com/world-coal-2018-2050-world-energy-annual-report-part-4/#comment-653071
http://digjamaica.com/m/blog/sea-level-rise-affecting-property-values/
New reporting out of the Washington Post and studies from Harvard, the Journal of Financial Economics and the non-profit First Street Foundation are all saying the same thing – Sea Levels have been rising for the past 100 years, faster in the last 25. And they will continue to rise for the next 100 years, even by as much as 1.3 metres (4.3 feet).
Areas of Kingston 21 like Miami Beach are only 0.7 metres above sea level putting them in impending danger.</I?
Study from Harvard
http://iopscience.iop.org/article/10.1088/1748-9326/aabb32
Climate gentrification: from theory to empiricism in Miami-Dade County, Florida
Abstract
This article provides a conceptual model for the pathways by which climate change could operate to impact geographies and property markets whose inferior or superior qualities for supporting the built environment are subject to a descriptive theory known as ‘Climate Gentrification.’ The article utilizes Miami-Dade County, Florida (MDC) as a case study to explore the market mechanisms that speak to the operations and processes inherent in the theory. This article tests the hypothesis that the rate of price appreciation of single-family properties in MDC is positively related to and correlated with incremental measures of higher elevation (the ‘Elevation Hypothesis’). As a reflection of an increase in observed nuisance flooding and relative SLR, the second hypothesis is that the rates of price appreciation in lowest the elevation cohorts have not kept up with the rates of appreciation of higher elevation cohorts since approximately 2000 (the ‘Nuisance Hypothesis’). The findings support a validation of both hypotheses and suggest the potential existence of consumer preferences that are based, in part, on perceptions of flood risk and/or observations of flooding. These preferences and perceptions are anticipated to be amplified by climate change in a manner that reinforces the proposition that climate change impacts will affect the marketability and valuation of property with varying degrees of environmental exposure and resilience functionality. Uncovering these empirical relationships is a critical first step for understanding the occurrence and parameters of Climate Gentrification.
Ah! Kingston 21!
An explanation is due here. The city of Kingston is served by roughly 20 post offices, Central Kingston and 19 others, numbered 2 through 20. One of the ways Kingston residents refer to locations in the city is by using the post office that is part of their mailing address, the closest thing we have to a post code. Jamaicans, being the creative people they are thought it would be cute if they designated another area with a high concentration of Jamaicans to be Kingston 21. That area is Miami/Fort Lauderdale/South Florida.
You will sometimes hear Jamaicans jokingly referring to people spending the weekend or going shopping or moving house to/from Kingston 21, when referring to South Florida. It takes less time to travel to South Florida by air than it takes to drive from one end of the island to the other!
Either way, your mail is still going to get wet! 😉
Hey Fred, it’s not Noah’s ark time. We could still use mail boats to service the parts above water.
When you see all the gators pointed north, time to get worried. 🙂
You may like the following, the title says it all
https://www.theguardian.com/environment/2018/sep/24/americas-era-of-climate-mass-migration-is-here
NAOM
The problem I always have with these articles is how the press tries to make people fearful by exaggerating and then have climate scientists give opinions only backed up by there vague research … like
not clearly measurable.
nothing anybody can definitely see.
nothing anybody can fact check right now.
Have you tried methods to work out this problem you have impressing non-realistic mental constructs on reality?
Ooooh! I struck a nerve there to bring out a troll.
NAOM
That’s the funny thing about future tends analysis, it’s hard to fact check, like, right now.
Your talents are wasted, you should work for CIA Department of Complicated Operations.
https://www.youtube.com/watch?v=-b5aW08ivHU
Twilight Zone Opening THEME MUSIC 1962 Rod Serling
Ah, yes! The ever present fear mongering exaggerations of the Orwellian press, using the cryptic announcements from the obscure research of those shadowy, ever so opinionated climate scientists, to create fear and doubt amongst the unsuspecting populace…
Another gem falling by the way?
URBANIZATION IS CUTTING OFF LIFE SUPPORT TO NYC’S WETLANDS
“Historically, salt marshes have not only served as ecological nurseries for fish, birds, and other wildlife—they’ve been stalwart defenses against coastal storms. But recently, coastal development coupled with accelerated sea level rise has threatened wetlands across the globe. Among them are the salt marshes in New York City’s Jamaica Bay, an 18,000-acre estuary bordered by Queens and Brooklyn.”
Read more at: https://phys.org/news/2018-09-urbanization-life-nyc-wetlands.html#jCp
Well if anyone still had any doubts that the US is currently the laughing stock of the whole world, then those doubts can finally be put firmly to rest!
https://thinkprogress.org/united-nations-laughs-at-trump-video-4a6d85d2d8fb/
President Trump was laughed at during his speech to the United Nations on Tuesday.
Seconds into it, Trump made a boast he regularly makes at his rallies — that his administration has been the most successful in U.S. history.
“My administration has accomplished more than almost any administration in the history of our country,” Trump said.
But instead of being received with the applause he’s accustomed to at political events, the crowd audibly laughed at Trump. The president responded with an uncomfortable quip about how he “didn’t expect that reaction,” before quickly moving on.
That wasn’t the only time Trump was met with chuckles or groans during his speech. Later, the crowd audibly stirred when Trump accused OPEC nations of “ripping off” the world by making oil prices too high.
At another point, German diplomats appeared to be openly mocking him.
You can watch the videos at the link…
What a fucking clown show this guy is!
I am not very interested in the foreign policy but am much more concerned with how the admin and the repugs are stealing from nature and the American people to fund an even bigger military and fund toxic/deadly corporations.
Our national interest, protecting the citizens ? Which citizens, what interest? The one percent? The interests of the rich?
Sounds like he told the UN to go fly and OPEC to straighten up it’s act. Pointedly, he didn’t tell Russia to stay out of US affairs. Russia was not mentioned.
. The foreign aid hammer was nasty.
This appeared to be a campaign speech aimed at his constituency.
The whole nation’s safer theme is a bunch of crock. My own decades long evaluations conclude that continued use of fossil fuels and continued degradation of the natural world will mean there will be no safe place on earth in the near future, for anyone. The danger is local, national and global and growing. It needs no army to attack with and cannot be fought with an army. Trump’s policies and his parties policies are not making us safer but accelerating and exacerbating the danger to all of us and all species.
Have a happy day!
Trump’s policies and his parties policies are not making us safer but accelerating and exacerbating the danger to all of us and all species.
Amen!
Have a happy day!
Yeah, tks! I have to go out now and buy a MAGA hat so I can wear it on the flight over to Germany… /sarc
Be careful the Germans appear to have developed a sense of humor.
https://www.youtube.com/watch?v=hzUfrLJRWaU
Too bad they cut out the part where “Britain is now just a red telephone booth in a cellphone world”
I’d bet Trump only recently found out what OPEC is and does, probably only after reversing the Iran agreement, which he did solely as an anti Obama thing. He’s on them now to cover up his fuck up (to protect his ego more than for his followers).
Response from the UN General Assembly:
“Bwhahahahaha, Ahahahaha! Heeheehee! Hahahahaha!
Interestingly enough, Trump campaigned on the idea that the world would no longer be laughing at America if he was to be elected President.
The last thing I did before I went out yesterday evening was watch his entire speech on Youtube courtesy of C-SPAN, as difficult as that was to do. There are so many criticisms on so many levels that it could be the topic of a lead post but, I will address a couple that stuck out to me. The largest general criticism on my part though, is Trumps propensity to brag and engage in the use of hyperbole and superlatives, like a man boasting that my ____ is bigger than yours. The constant use of words and phrases like “greatest”, “wealthiest”, “biggest” and “most powerful” must have been quite tiresome for most of the diplomats in attendance. It’s a pity there were not more shots of the audience reaction. It is my sincere hope that the team in charge of the video production puts a video together and then leaks it, showing the reactions of the delegates of each country as Trump rails into them, without showing Trump at all. It would be 35 minutes of epic entertainment and comedy!
My first criticism is the way he addressed the refugee/humanitarian crisis in several regions round the world by hinting that a hard stance against the free movement of people is what he prefers. He then went on to say that the best way to curb migration is to improve the conditions that people experience in their home countries. If one then juxtaposes that with his comment on putting America and American jobs first, rejecting globalism and free trade and cutting aid to countries that are not in agreement with his ways of thinking, it seems like a bit of a contradiction. If the country that he himself said was the greatest, wealthiest country in the world is not going to take the lead on helping to improve the lives of people in what he describes as “shithole countries”, which other country should?
The next issue I observed was his support for legacy fossil fuel industries, while lashing the Chinese for not respecting intellectual property, subsidising industry and “dumping” subsidised production on world markets. The hypocrisy of donor countries is well known in a whole host of lesser developed countries, including my neck of the woods where government assistance to agriculture is roundly criticised while food aid comes in the form of milk powder (EU) and grain (EU and US), products of subsidised agriculture in the developed world. There’s also the issue of meat parts that, are not prized in the US market, (chicken necks, backs (spine), feet, cow foot and tripe) and would other wise probably be dumped, being sold .very cheaply outside the US, after the prime cuts have been sold on the US consumer market.
I have repeatedly raised the issue of 1366 Technologies, a spinoff of DOE funded research at MIT, highlighting the tepid government assistance in scaling their production to significant levels. This would NOT have happened in China. The Chinese government would have bent over backwards to ensure that any technology that gives China a competitive advantage, gets the full support of the government. I guess that is is just China putting China first and making China great again but, I guess the Trump administration sees things differently! I will probably address some of these issues in separate comments later today.
Fate of $28 Billion U.S. Nuclear Project Is Down to ‘Game of Chicken’
“Last week, the U.S. Energy Department warned Southern’s partners against pulling out of the project, saying it would prompt the government to demand repayment of about $5.6 billion in federal loans.”
How Novel! What’s the Chance of that? Returning Blown dollars to gov?
How are you going to have any pudding if you don’t eat your radioactive meat?
https://seekingalpha.com/news/3392857-fate-vogtle-nuclear-project-game-chicken
https://finance.yahoo.com/news/fate-28-billion-u-nuclear-161007790.html
Vogtle – Most expensive Gadget on the Planet.
Only $12,000 per kW of capacity, what a bargain.
Too cheap to meter!
Extension deadline extended till 23:30 Tonight …. Behind closed doors.
https://www.utilitydive.com/news/vogtle-nuke-deadline-extended-again-to-1130-pm/533189/
Centralized Power from Centralized Power Soviet Style.
https://www.utilitydive.com/news/doe-urges-vogtle-nuke-owners-to-complete-project-ahead-of-monday-vote/533065/
27 billion dollars! These people should all be locked up and the keys thrown away!
30B+ .. No end in sight. A Spent fuel pool containment failure would cost Trillions. Spent fuel pool overfilled so gotta dig the debt hole deeper or shut the 2 existing reactors down.
No worries–
In 24,000 years, the half life will have happened.
Encouraging but far from being enough! Still, it is little incremental changes such as this that give me hope that countries such as China and India will fall far short of future coal consumption projections by the energy experts. Next on the international agenda, getting serious about reducing human population growth trends and reducing the anthropogenic impacts on ecosystems, with the goal of slowing the ongoing 6th mass extinction event…
https://www.engadget.com/2018/09/26/china-raises-renewable-energy-target-to-reduce-coal/
China bumps up renewable energy target to reduce reliance on coal
Non-compliant companies will be hit with fines.
China, the world’s biggest energy consumer, is stepping up its push into clean power with a revised renewable energy target. The nation is now aiming for renewables to account for at least 35 percent of energy consumption by 2030, whereas its previous target only stipulated “non-fossil fuels” making up 20 percent of energy use within the same time frame.
The new plan, called the Renewable Portfolio Standard, aims to tackle the country’s soaring pollution levels by reducing its reliance on coal. The legislation also raises targets for individual provinces, and calls for non-compliant firms to pay compensation charges to grid companies, which will be used to cover government subsidies for renewable projects.
It’s an encouraging step, especially from such an energy-hungry country. But in comparison to many other parts of the world, it’s essentially an exercise in keeping up. The EU has a target of 40 percent renewables by 2030, for example, while the US — although not beholden to any nationwide regulation — is home to over 30 states with enforced or voluntary renewables targets hovering around the same levels. California has pledged 50 percent by 2030, Colorado 30 percent by 2020 and Minnesota around 25 percent by 2025.
Fred, as I’ve tried to explain here on numerous occasions, what happens in China is largely determined at the Provincial level, notwithstanding what Beijing does or says. I know this because I’ve experienced it — many times. Your optimism may be displaced (or misplaced). 😉
CHINA COAL POWER BUILDING BOOM SPARKS CLIMATE WARNING
“Building work has restarted at hundreds of Chinese coal-fired power stations, according to an analysis of satellite imagery. There was a surge in new coal projects approved at provincial level in China between 2014 and 2016. This happened because of a decentralisation programme that shifted authority over coal plant construction approvals to local authorities. The report says that at present China has 993 gigawatts of coal power capacity, but the approved new plants would increase this by 25%.”
https://www.bbc.com/news/science-environment-45640706
1.2 TW of coal powered capacity for China compared to 0.5 TW US total consumption of which about 1/3 is coal.
Coal powered capacity is correctly stated in TW but, “total consumption” is usually stated in TWh. The coal powered capacity of the US would make for a better comparison.
It’s simple math, the difference between power and energy is time. Just divide the energy by the number of hours per year to get the average power to achieve that energy use.
100 watts for one year = 876000 Wh/year=876 kWh
So above I compare capacity(power) to consumption power. Since coal capacity is usually between 55% and 75% of nameplate capacity then China’s coal power alone is greater than the total power to run the US. That was the point of the comparison.
One could have compared coal consumption by nation, China uses close to 4.5 times the tonnage of coal as the US but then the nitpickers flock yapping about efficiency, quality and other uses, missing the magnitude of the difference which makes those objections mote and missing the point entirely
Thanks for the explanation,
Attention astronomy buffs. This is kind of cool!
HYPER SUPRIME-CAM SURVEY MAPS DARK MATTER IN THE UNIVERSE
“Our map gives us a better picture of how much dark energy there is and tells us a little more about its properties and how it’s making the expansion of the universe accelerate,” Mandelbaum said. “The HSC is a great complement to other surveys. Combining data across projects will be a powerful tool as we try uncover more and more about the nature of dark matter and dark energy.”
Read more at: https://phys.org/news/2018-09-hyper-suprime-cam-survey-dark-universe.html#jCp
Synapsid — Reflective, sagacious and sapient sometimes commenter on this not always so humble Blog
ARCHAEOLOGISTS CELEBRATE SPECTACULAR DISCOVERY OF IRON AGE TREASURE
“Gold treasure discovered in a field in Hjarnø over the past two years are now being analysed at The Vejle Museums. Archaeologists will try to decipher where the gold came from and how it was made.”
Read more at: https://phys.org/news/2018-09-archaeologists-celebrate-spectacular-discovery-iron.html#jCp
And,
WE ARE GETTING CLOSER TO UNDERSTANDING WHO THE FIRST AMERICANS REALLY WERE
http://www.bbc.com/earth/story/20170328-the-first-people-who-populated-the-americas
EDougL,
Thanks again.
I read this last night. The BBC is not a favorite source for publications in science but I thought this one was pretty well done. We’ve learned that Beringia was settled for long enough that the settlers there accumulated genomic differences from peoples who remained in NE Eurasia; those differences were carried into North and South America and that’s the reason the various Native American peoples differ so much from peoples in the regions of the Old World that their forebears came from. Well, that and the movements of peoples in NE Eurasia over the last 20 000 years or so.
One thing about the article that irked me, (and I irk so very seldom, he says modestly) was the use of “the Clovis people” for the makers of the well-known Clovis points and associated artifacts. We find Clovis material from Washington state to Florida, California and NW Mexico to Quebec, and points in between, and eventually Alaska where the youngest stuff has been found. The whole span of time this distribution represents is a few hundred years, and that looks to me like the spread of the knowledge of a set of techniques through populations already there, not the movement of a tool-making people.
David Meltzer’s First Peoples in a New World is a good introduction to the peopling of (surprise!) the New World, and Meltzer is not subject to enthusiasms as too many writers on the topic are.
Estimable DougL,
Thanks for this one.
Tracing the origin of metal objects in archaeology sites is a favorite topic of mine (One of my professional hats is geoarchaeologist) and one of the most interesting applications of geochemistry. Denmark is not a gold source that I know of but there’s plenty in Norway and Sweden and there was lots of trade from the south too, and earlier (pre-Iron Age) from Ireland. High-status materials are great for tracing ancient trade routes. Europe has long been a hotbed of, shall we say, travel with profit as the goal.
Facing the Ocean, by Barry Cunliffe, is a good source for the topic. (The ocean of the title is the Atlantic.)
Vogtle nuke deadline extended again to 5 p.m.
Dive Brief:
The fate of the only nuclear plant under construction in the United States was supposed to be decided yesterday, but is still up in the air as owners debate how to manage cost overruns.
Oglethorpe Power voted Monday night to continue construction of the Vogtle nuclear project in Georgia, but attached conditions that must also be accepted by other owners of the plant. The exit of one major owner would mean the project would be canceled.
Oglethorpe, which owns 30% of the project, wants a cap on the project’s costs to its ratepayers and a guarantee that future cost overruns would be borne by Southern Co., a co-owner in the plant. The owners faced a 5 p.m. (EDT) deadline Tuesday to reach an agreement, but have since extended their negotiation period to 5 p.m. Wednesday.
This is become a bit of a sick joke! Nobody wants to pull the plug on this debacle and nobody wants to pay what it’s going to cost to finish it, knowing fully well that it will be impossible to get rate payers to foot the bill in the face of ever less costly alternatives. This would be the single most expensive white elephant on the planet, with the UK’s Hinkley Point C racing to see if they can top it!
@ George Kaplan, is anybody in the UK keeping an eye on this?
I suspect that Hinkley C will suffer a similar fate and become a black hole of investment.
http://www.bbc.com/capital/story/20180914-the-trick-to-learning-when-to-cut-your-losses
“Anybody in the UK keeping an eye on this?”
The article I read earlier has disappeared but lobbyistas are warning that the UK needs nuklear and renewables/gas won’t cut the mustard.
NAOM
Edit
Found it!
https://www.theguardian.com/business/2018/sep/26/abandoning-nuclear-power-plans-would-push-up-carbon-emissions-energy
BREAKING: Vogtle nuclear plant owners agree to continue construction
Dive Insight:
The decision to continue construction of the Vogtle plant is a win for Southern and a boon for the fragile U.S. nuclear industry. The Department of Energy warned last week that cancelation of the project would strike a blow to the teetering sector and prompt the repayment of billions in federal loans.
The two-reactor expansion at Vogtle, proposed in 2008, is more than five years behind schedule and forecast to cost a total of $27 billion — almost double its original pricetag.
Last month, Southern announced that costs for the plant would be $2.3 billion more than it expected when it took over construction from bankrupt contractor Westinghouse in May. That cost overrun triggered a clause in the ownership agreement where 90% of the owners had to agree to continue construction.
Southern, which owns nearly half of Vogtle, quickly said it would stick with the plant, as did Dalton Utilities, with less than a 2% share. The Municipal Electric Authority of Georgia (MEAG) on Monday joined them, but Oglethorpe Power held out.
Oglethorpe leaders indicated their desire to move forward with the project, but said Southern should shoulder any future cost increases, since it owns Southern Nuclear Corp. (SNC), the construction subsidiary completing the plant.
Unlike Southern, an investor-owned utility, Oglethorpe and MEAG are publicly owned power companies, meaning their ratepayer-owners have to bear the full brunt of cost overruns.
While it may be possible to praise the people and government of the Netherlands for many things, this is NOT one of them!
Netherlands to test viability of solar roads
I think this remains an exceedingly stupid idea, especially give the amount of rooftop space probably available in the Netherlands. See exhibit A, picture below of an industrial area in Eindhoven that took about ten minutes to search for Eindhoven on Google Maps, spot a suitable looking area, take a screenshot and resize the screenshot to be able to post it on this blog! These people want to leave all that industrial/commercial roof space and put solar PV on roads, using limited land space as the rationale! Why? In heavens name, why?
edit: Another five minutes on Google Maps unearthed another are to the north of the city center, home to Science Park Einhoven, at least a couple of large shopping malls and an IKEA store.
Below is a picture of the area around the Science Park Einhoven. Not a PV panel in sight!
To be fair they developed this:
https://solarteameindhoven.nl/stella-vie/stella-lux/
Energy positive family car
Stella Lux, the energy positive family car. This means she is so efficient that she generates more energy than she consumes during the entire year, even in Dutch weather conditions! The aerodynamic design has an important role in this: consider, for example, the tunnel which runs through the center of the car. Furthermore, Stella Lux has an extended roof on both sides of the car. Because of this, we were able to place another row of solar panels on the car. Stella Lux is designed to be extremely light by using materials like carbon fibre and aluminium.
So I have to imagine that they must be acutely aware of the potential for using PV on roofs and parking lots for power generation. Not to mention linking parked EV batteries to form microgrids.
For the record, the fascination for embedding PV in roads, has also always eluded me. Perhaps someone out there can provide some redeeming information about that?!
Our local Wallymart could house 6MWh/day on it’s roof alone. The mall it is attached to could produce the same. In other words they could generate about 4x what Wallymart uses.
NAOM
Somebody please help me out! Much of what I see happening in the world these days is not making any sense to me! Please tell me I’m not alone!
Could be that the US is a really stupid country. The president says so repeatedly.
https://www.washingtonpost.com/opinions/we-are-a-deeply-stupid-country/2018/07/16/1742acdc-893b-11e8-85ae-511bc1146b0b_story.html?noredirect=on&utm_term=.587970930b9d
I contend that Americans, like most people around the world, are of average intelligence. However it seems that Americans are particularly susceptible to a culture that considers it a badge of honor to be deeply ignorant of the world at large.
Now the President is another matter entirely, he is pathologically stupid!
https://www.youtube.com/watch?v=SNYZYxLSgPQ
You’re not alone.
NAOM
I second that!
More support for my assertion that increased coal consumption in the US and Australia is unlikely.
AEP to retire Oklaunion coal plant due to renewables, gas competition
Dive Brief:
American Electric Power (AEP) will retire its 680 MW Oklaunion coal plant in 2020 because it cannot compete with cheaper power from gas and renewables, the utility announced Thursday.
The plant, partially owned by Oklahoma utilities, is located on the Texas side of the border between the two states and feeds power into the Southwest Power Pool (SPP) and Electric Reliability Council of Texas (ERCOT). AEP previously warned the profitability of Oklaunion and its other coal properties was declining.
The Sierra Club welcomed AEP’s announcement, saying Oklaunion was one of the top 10 producers of nitrogen oxide — a key component of smog — among all industrial facilities in Texas.
AGL promises no change in strategic direction, coal closures not “ideological”
AGL Energy, Australia’s biggest coal generation company, said on Wednesday there would be no change in strategic direction following the abrupt, and still unexplained departure of CEO Andy Vesey, and said its announced coal closures were not about ideology, but an operational decision.
“The most common question I have been asked is whether I anticipate a change in strategic direction for AGL,” acting CEO Brett Redman said in a speech to the annual general meeting, in his first public appearance since his appointment just over a month ago. “My answer, in a word, is no.”
The US has a lot of older coal plants near their operational life that will probably not be updated due to environmental law, natural gas competition and impending renewable energy competition.
At least 80,000 people died of flu last winter in U.S., CDC says
The U.S. government estimates that 80,000 Americans died of flu and its complications last winter — the disease’s highest death toll in at least four decades.
The director of the Centers for Disease Control and Prevention, Dr. Robert Redfield, revealed the total in an interview Tuesday night with The Associated Press.
Flu experts knew that it was a very bad season, but at least one found the estimate surprising.
“That’s huge,” said Dr. William Schaffner, a Vanderbilt University vaccine expert. The tally was nearly twice as much as what health officials had previously considered a bad year, he said.
In recent years, flu-related deaths have ranged from about 12,000 to 56,000, according to the CDC.
Last fall and winter, the U.S. went through one of the most severe flu seasons in recent memory. It was driven by a kind of flu that tends to put more people in the hospital and cause more deaths, particularly among young children and the elderly.
Now ain’t that sup’m! I submit that simple oral administration of high dosage vitamin C (to bowel tolerance) could have saved 100% of those lives! For those who don’t catch it early enough, IV administration should do the trick.
Somebody please stop this bus! I want to get off! It’s full of crazy people!
Silver lining- less Americans.
Solar PV to grow 65-fold by 2050, 2°C target will be missed by a long shot – report
Norwegian-based quality assurance and risk management company, DNV GL has released its annual Energy Transition Outlook (ETO 2018).
The report states that solar PV will be the biggest winner in the global energy transition. In other findings, it sees that the costs incurred by the energy transition will not surpass current fossil fuel investments, underlining that a move towards a low-carbon society is financially viable.
Despite rapid growth numbers for all renewable energy resources and positive developments in energy efficiency, the analysts conclude that current ambitions will fall short of meeting the Paris Agreement’s 2°C target, set in 2015.
Up until 2012 cumulative global PV capacity had been doubling every two years. Since then the doubling has been every three years. Six doublings grows a quantity 64 fold so 65 fold is six doublings for all intents and purposes. This projection has six doublings taking 32 years! Even if it took 4 years for capacity to double, we are still looking at 24 years while sticking with the current rate of a doubling every three years, six doublings would take 18 years. Does anybody else find this projection of six doublings in 32 years a tad on the low side? (barring a black swan event)
edit: Note that according to the graphic below (source: Wikipedia), global cumulative capacity grew more than 100 fold between 1999 and 2012, That’s 100 fold in thirteen years!
Seems way low to me. I have requested the download and will look over the actual report.