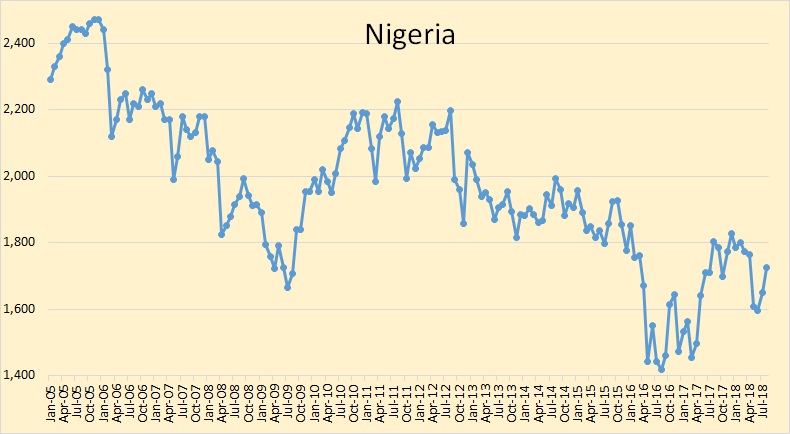
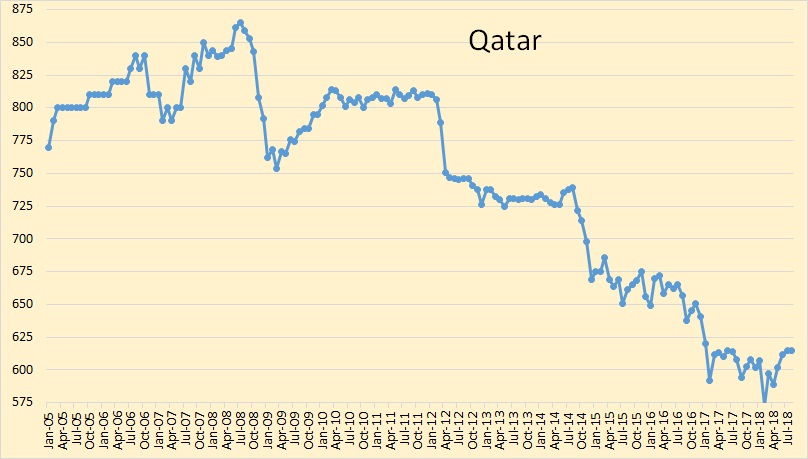
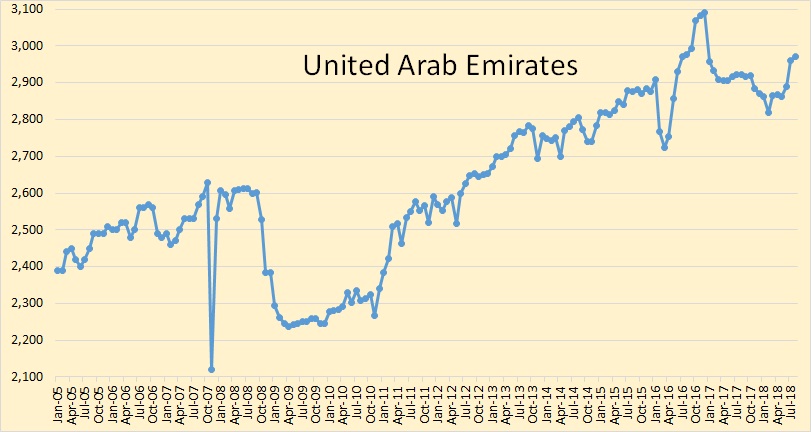
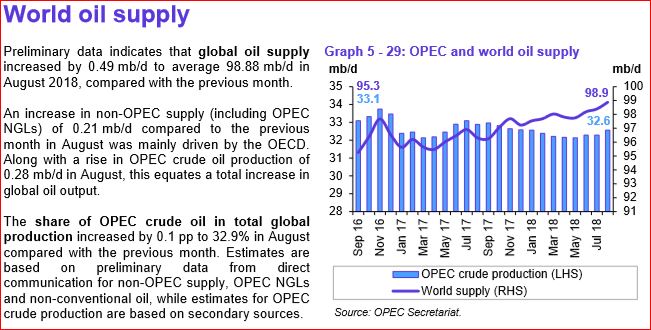
Data for the OPEC charts below are from the OPEC Monthly Oil Market Report. All OPEC data are through August 2018 and in thousand barrels per day.
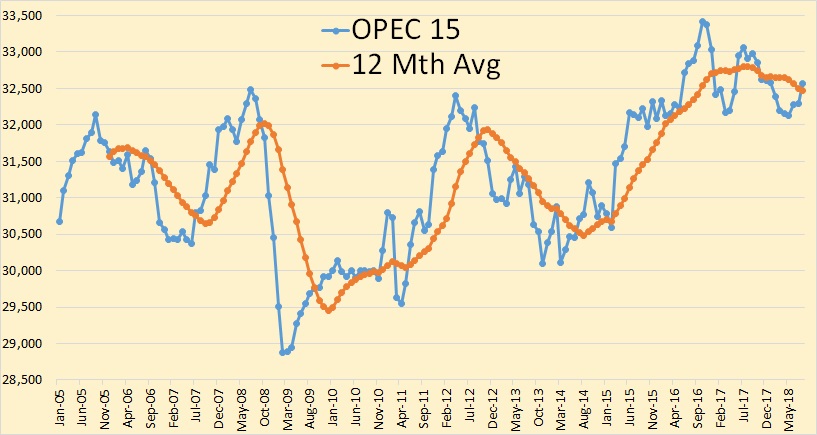
OPEC 15 crude only production was up 278,000 barrels per day in August to 32,565,000 bpd. Most of that increase was Libya, up 256,000 bpd.
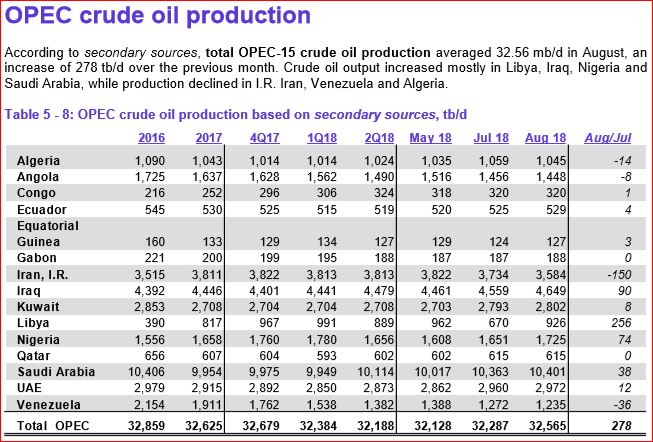
July OPEC production was revised down 38,000 barrels per day.
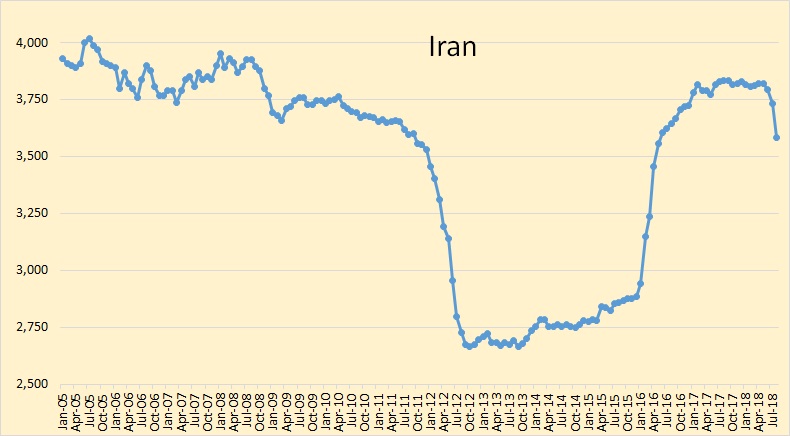
Sanctions are beginning to have an affect on Iranian production.
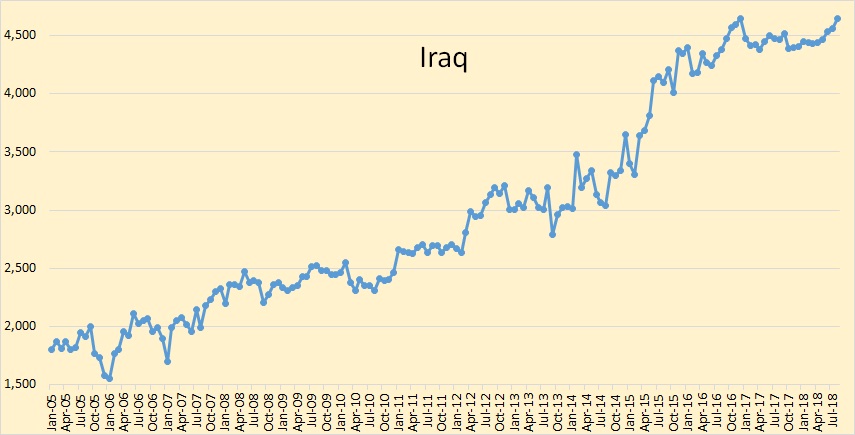
Iraq reached a new high in August, but just barely. They had 4,649,000 bpd. Their previous high was 4,642,000 bpd in December 2016.
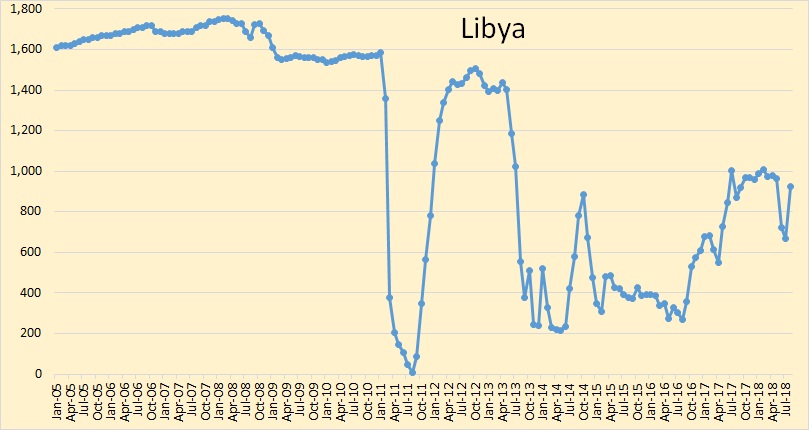
Libya was the big gainer in August, up 256,000 bpd to 926,000 bpd. They are still fighting rebels however. They will likely be down slightly in September.
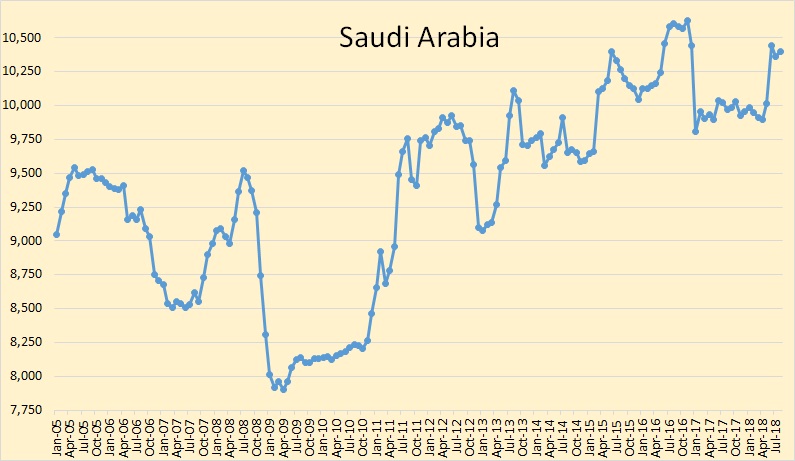
I think Saudi Arabia will hold pretty close to this level for awhile now.
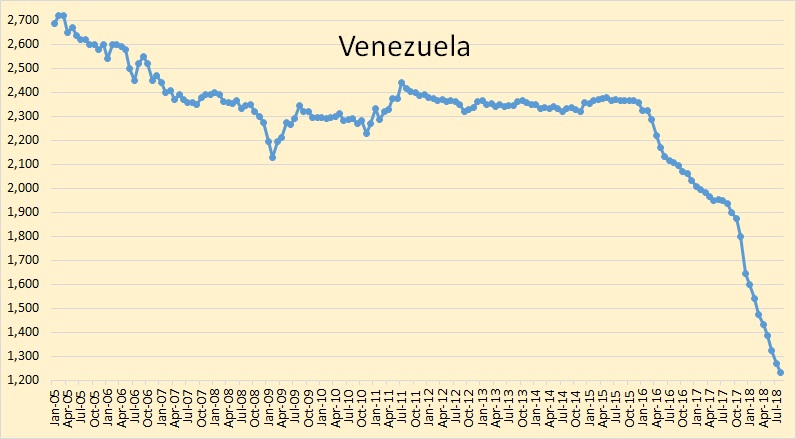
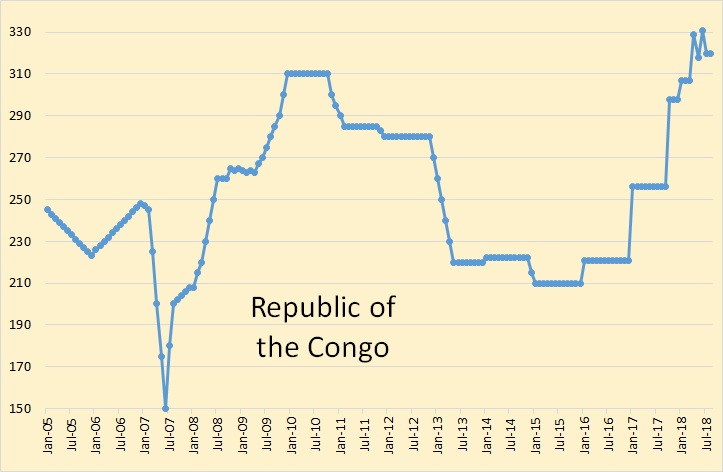
Venezuela’s decline continues. They are now over 1,100,000 barrels per day from their average in 2015.
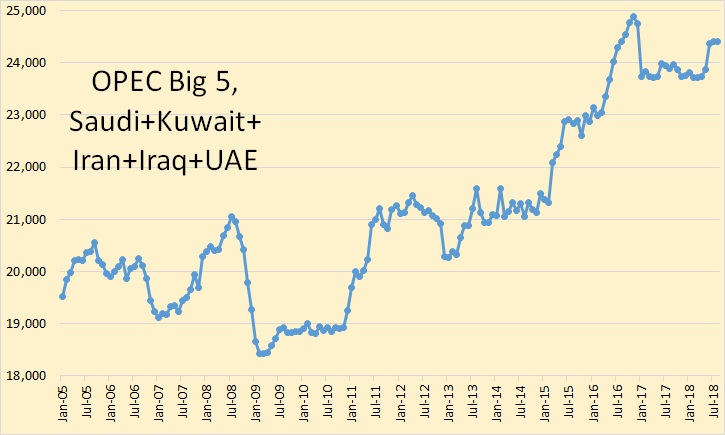
No change in OPEC big 5 output this week. The decline in Iran was offset by slight gains from the other 4. But I look for declines in the big five in the next few months because of Iranian sanctions.
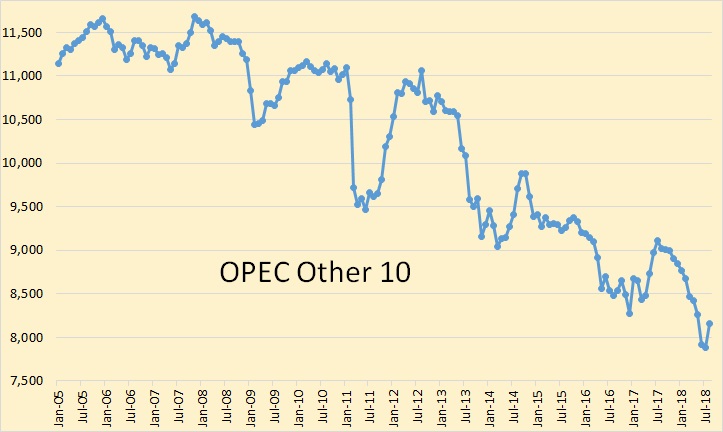
The OPEC Other 10 was up in August because of Libya. But the decline will continue.
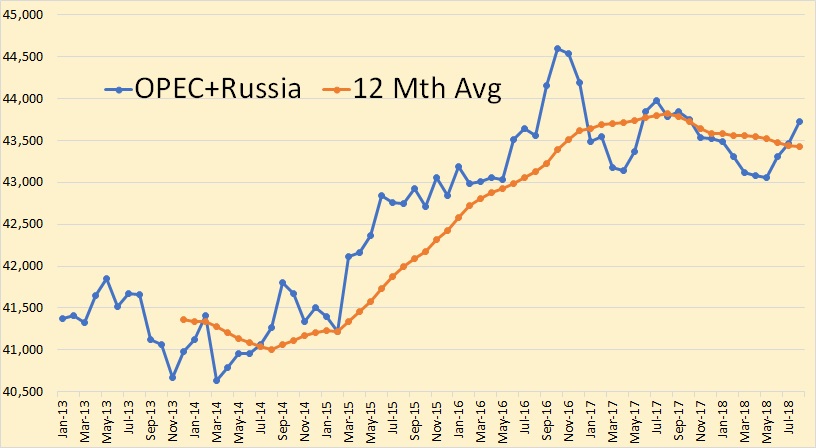
There was no increase in Russian production in August but OPEC did have an Increase. It is my opinion that both OPEC and Russia will level out for a few months then start a slight decline.
The three charts below are from Baker Hughes and the data are through August 2018. The Baker Hughes Iran and Iraq rig counts are incomplete and therefore not included.
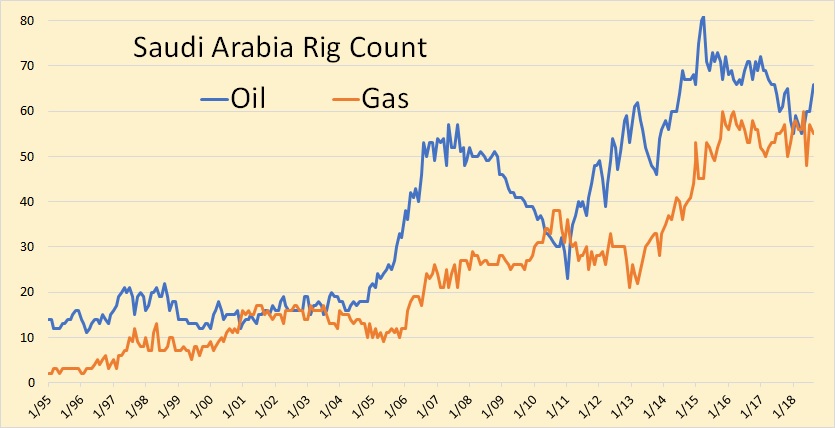
Saudi began its massive infill drilling program in 2006. They tapered off in 2009 and 2010. It is likely that the big increase that began in 2011 was mostly for the Khurais and Manifa projects. The oil rig count was 66 in August.
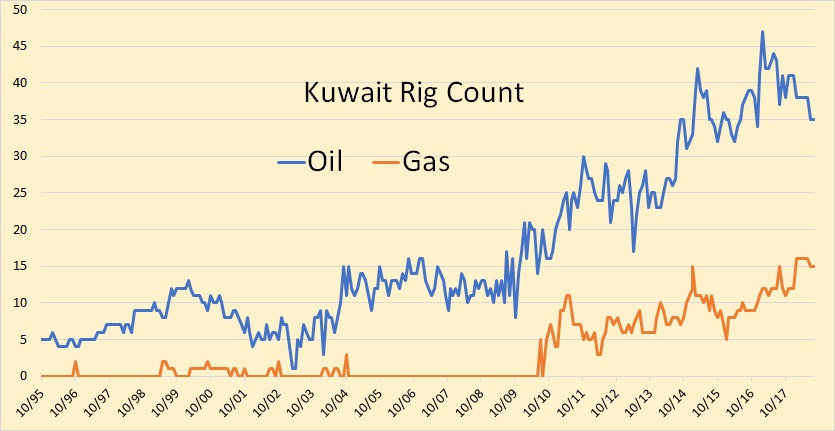
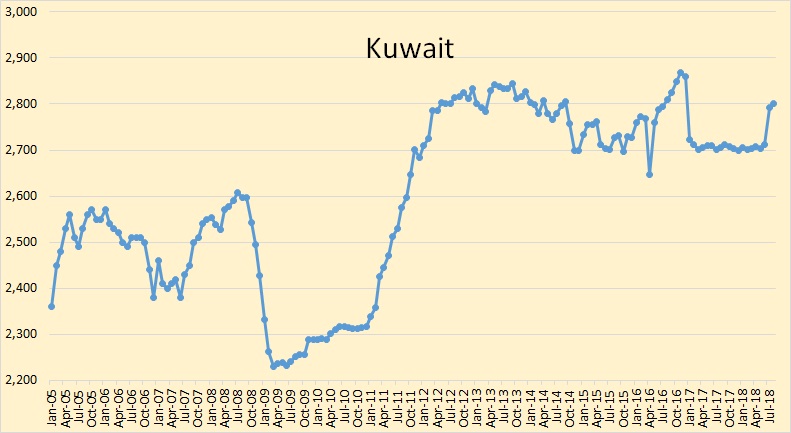
Kuwait’s oil rig count went from an average of 11 in 2009 to over 40 in 2017. The August count was 35.
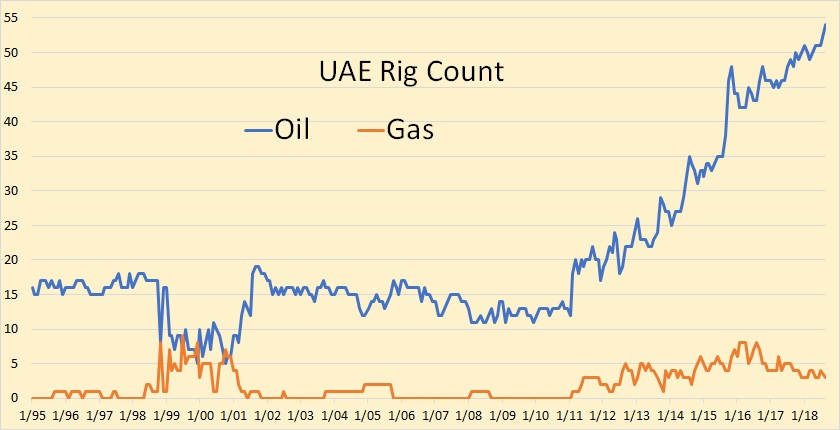
The UAE rig count, (Abu Dhabi+Dubai), went from an average of around 13 in 2010 to over 50 today. The count was 54 in August.
From Oil and Gas Journal 05/08/2000
Horizontal wells find varied applications in Saudi fields
King Saud University, Riyadh Horizontal-well applications in Saudi Arabia have many objectives, such as controlling oil and gas coning in relatively thin remaining columns, improving waterflood sweep efficiency, improving productivity rates from thin and tight reservoirs, and saving development costs. At yearend 1999, about 200 horizontal wells had been drilled in Saudi oil fields. Horizontal wells are recognized as one of the most important technical advances in the oil and gas industry in the last 20 years. At first, the industry considered this technology to be an exotic way of drill…
And that’s all I could read of the article without a subscription to Oil and Gas Journal. But that’s enough. We know that in 1999, Saudi oil columns were getting thin and that they had a serious coning problem.
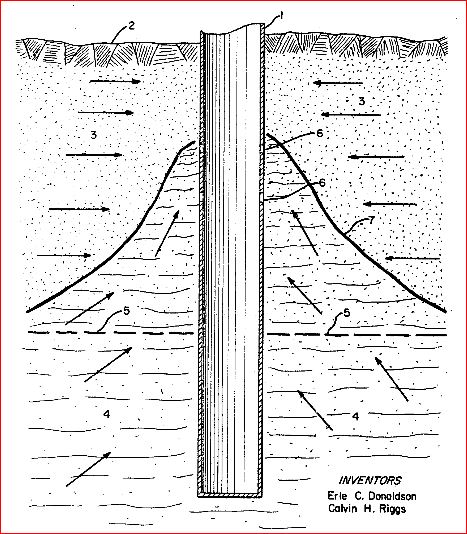
Above: Verticle oil well water coning.
They began combatting the problem by drilling Horizontal wells with laterals right along the top of the reservoir. They had, at that time, about 200 such wells. But 200 wells is not very many wells. They would need a lot more.
The below was posted by Stuart Staniford on April 7, 2007 on The Oil Drum.
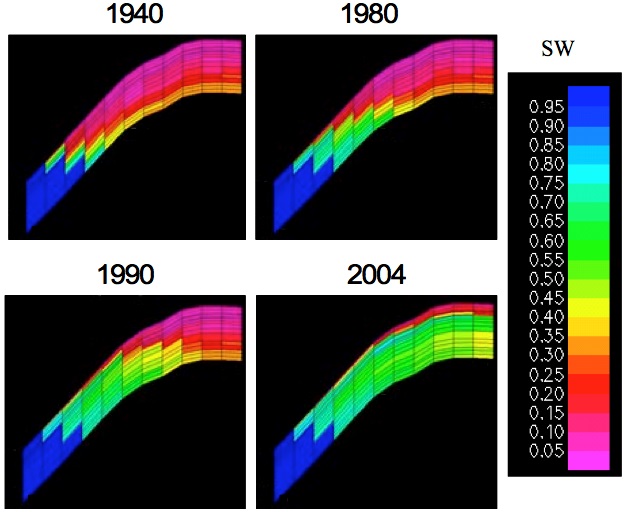
Western flank cross section of North ‘Ain Dar. Source: Figure 9 of Alhuthali et al, Society of Petroleum Engineers Paper #93439, March 2005.
The legend on the right is percent water. It is very hard to read, especially if, like me, one has defective color vision. But the 2004 image is not nearly as bad as it looks. If you go halfway down the column, from the top, you still have less than 50 percent water. So in 2004, there was still a lot of oil left in the Ain Dar section of Ghawar. But you can understand that the vertical wells were starting to pull up a lot of water. In fact, the water intrusion was so bad that all Saudi fields, at that time, had an average decline rate of about 8 percent. But not to worry Saudi had a solution.
Other Ghawar fields, Shedgum and Uthmaniyah, show similar profiles as Ain Dar.
I published most of the following in March 2014. The Ravensworth link had already been removed when I published this piece. However, the Saudi Arabia’s Center for Strategic and International Studies link was valid at the time but since been removed. The “International Business Publications” link still works but this publication is updated annually and the version with the quote below is no longer available. However, it is a Saudi publication and is still interesting.
Ravensworth.org published the following in 2006:
One challenge for the Saudis in achieving this objective is that their existing fields sustain 5 percent-12 percent annual “decline rates,” (according to Aramco Senior Vice President Abdullah Saif, as reported in Petroleum Intelligence Weekly and the International Oil Daily) meaning that the country needs around 500,000-1 million bbl/d in new capacity each year just to compensate.
That quote by Abdullah Saif was widely circulated. and in 2007 International Business Publications published this on page 144:
One challenge for Saudi in achieving their strategic vision to add production capacity is that their existing fields sustain, on average, 6 to 8 percent annual “decline rates” (as reported by Platts Oilgram) in their existing fields, meaning that the country needs around 700,000 bbl/d in additional capacity each year just to compensate for natural decline.
However, in 2006 Saudi Arabia’s Center for Strategic and International Studies claims they have gotten this decline rate down to almost 2%.
Without “maintain potential” drilling to make up for production, Saudi oil fields would have a natural decline rate of a hypothetical 8%. As Saudi Aramco has an extensive drilling program with a budget running in the billions of dollars, this decline is mitigated to a number close to 2%.
The drilling program they are talking about is those horizontal wells placed at the very top of the reservoir. Now imagine, that with all those brand new horizontal wells sucking the oil right off the top of the reservoir, they still had a decline rate of over 2%! Of course, that was in 2006, 12 years ago. And just what might that decline rate be today?
We have the following quote from the Aramco CEO in the Annual Review 2017, published August 17, 2018, bold mine.
Notwithstanding an improved market picture, the oil industry’s preparedness for the future remains in question as the sector has lost an estimated $1 trillion in planned investment since the market downturn began. The situation becomes more disconcerting when seen in the light of global demand growing at the rate of 1 to 1.5 million barrels per day annually, and maturing oil fields around the world exhibiting steepening natural declines that must also be offset by continuing Investment in the industry.
Khalid A. Al-Falih, Aramco Chairman of the Board of Directors.
Then we have this, bold mine:
Saudi Aramco Signs Deal With Baker Hughes To Boost Offshore Oil Production
Marjan is the first of three major offshore field expansions that Saudi Arabia plans. The other two will be for the Zuluf and Berri offshore fields, which currently have capacity of 800,000 bpd and 200,000 bpd, respectively, S&P Global Platts data shows.
The three major offshore expansion plans are expected to add 1 million bpd of production capacity by 2023. This could offset declining production from aging fields in Saudi Arabia, which continues to be viewed as the swing oil producer in the global market.
These three fields are themselves very old and mature oil fields. Berri was discovered in 1964, Zuluf in 1965, and Marjan in 1967. And all three have been online since. Saudi has discovered several new fields but they are all tiny little things that will add little to Saudi’s production capacity. So they must turn to more infill drilling in their old offshore fields to try to keep production flat.
Saudi’s last major discovery, Sahybah, was discovered in 1968 but did not go online until 1998 due to its very remote location. Khurais and Manifa were both discovered in 1957 and produced for many years before being mothballed because of low production and other problems. But both were brought out of mothballs due to declining production in their other fields. Massive water injection was used to increase reservoir pressure. There are no more supergiants to be discovered in Saudi Arabia and no more old giants to be brought out of mothballs and put back online.
Conclusion: I believe Saudi Arabia can keep producing at, or close to, current levels for a few more years. That is if more infill drilling in their old offshore fields can compensate for declining production in their old onshore fields. But don’t look for increased production from them if demand and prices increase in the future. They will, very likely, only try to keep production level, as long as they possibly can.
376 responses to “OPEC August Production Data”
So, the world should not expect them to make up the over 2 million a day we will be short next year?
Be interesting to see how the Iran sanctions finally unravel.
Hubbert linearization works for phase 1 (OIP1?) straight drilling? Phase 2 (OIP2?) horizontal sweep drilling hubber linearization resets to new curve… Phase 3 (OIP2+) has yet another steeper decline hubbert line. Saudi has all fields in all phases. However Gehwar and the most productive piece historically must be in last 10% of its oil (phase 3).. World flexibility to consumption is near zero…excepting Trump’s pulling down of overseas currencies (aka no gold std over there as to much issues)…so if Gehwar goes off line (5M/day) I seriously doubt other ‘sulfer fields’ can compensate…
World flexibility to consumption is near zero…excepting Trump’s pulling down of overseas currencies (aka no gold std over there as to much issues)…so if Gehwar goes off line (5M/day) I seriously doubt other ‘sulfer fields’ can compensate…
No worries! /sarc
In 2010, global crude oil demand was 86.4 million barrels per day. In 2018, it is expected to increase to approximately 99 million barrels per day. * This statistic was assembled from several IEA Oil Market Reports. All figures are annual averages and include biofuels.
Supply will always meet demand! Right?! And another 83 million humans added to the planet every year.
“The definition of insanity is doing the same thing over and over again and expecting different results”
Albert Einstein
Fred,
If “demand” is consumption of oil rather than “desired consumption”, then supply (that is production today as well as yesterday’s production that is stored as inventory) will indeed meet demand (consumption). One cannot consume something that does not exist. Supply=demand is a tautology.
Also market theory is about price setting. Economic statements about supply and demand always refer to the amount of money that changes hands, not about the quantity of goods. So for example, when the price fell from $100 to $30 a few years back, and demand quantity barely budged, demand fell by 70% — by definition.
Trying to apply statements about demand you thought you understood in economics 101 for jocks and engineers 40 years ago to demand quantity usually just leads to confusion.
Alimbiquated,
I disagree, you are talking about revenue, demand is shorthand for quantity of demand and supply is short for quantity of supply.
Also note that the price of the product is the same on both the buyer and seller side, so in your example the revenue collected by the seller also falls by 70% and supply is still equal to demand.
Those shorthands are all very well Dennis, but crucially, you cannot expect standard economic equations to apply to them.
I’m not just being pedantic about terminology. Calling demand quantity demand makes sense. But supply quantity and demand quantity aren’t the economic values of supply and demand, so the laws of economics do not apply to them. The law of supply and demand applies (unsurprisingly) to supply and demand, not supply quantity and demand quantity.
I am also fine with people saying “Green tea gives me lots of energy”, but that doesn’t mean I think there are a lot of calories in green tea.
[Edited for clarity]
Alimbiquated,
Why does the market price adjust? What is it that becomes scarce? It is the specific goods consumed and produced that economics is all about. It is the study of the allocation of scarce resources to meet the needs of society. Money is just a mechanism through which the exchange of goods is facilitated.
Also note that there is no “value” in economic theory today, we have no measure of value, the price is just a price, an amount of money that is exchanged for a good.
The “value” of that good is different for every consumer and cannot be objectively measured, value is subjective, it cannot be measured any better than a beautiful sunset.
Also as we are talking about a good produced (supply) and consumed (demand), as they are exchanged at some price P then the revenue (price times quantity) exchanged between buyer and seller will be equal, because the quantities are equal.
Economics is about both price and quantity and supply (short for quantity of supply) and demand (quantity of demand). This applies from Econ 101 to Walrasian microeconomics studied at the graduate level.
Yes, I do know that, Dennis! 😉
However I was thinking desired demand/consumption. That is where I think the rubber will actually hit the road. But the world is all transitioning to flying EVs so none of us will actually have to worry about it…
Cheers!
Fred,
Desired consumption is pretty much always higher than available supply, for goods that are produced and sold for profit. When this is not the case prices would be zero and there is little incentive to produce the good in question.
No doubt you knew that too, but some people don’t know economics.
When this is not the case prices would be zero and there is little incentive to produce the good in question.
Yes! Under the current global capitalist economic model that would indeed be correct!
However, from the dawn of agriculture and throughout the entire history of human civilization, up until about the 17th century, when modern capitalism emerged, humanity had somehow managed to produce goods and survive.
I strongly suspect that when we finally end, this already failed, collective economic experiment, we may again find alternative incentives to produce goods and services beyond the ‘Profit Motive’.
I realize. that the 50 or so individuals who currently hold as much wealth and assets as about the 3.5 billion poorer half of the world’s population, will probably disagree with me.
However as history has taught us many times, when there are gross injustices the oppressed eventually come up with revolutions and ingenious devices such as guillotines… 😉
Cheers!
It’s simple, people that work together and cooperate live a higher quality of life. People who take care of their own just because they exist also lead a higher quality of life.
That becomes noticeable quickly.
Hi Fred,
So do you prefer feudalism or slavery?
😉
Very good point! And right on the money, too!
The current form of capitalism is in many ways similar to a form of indentured slavery or a form of serfdom as in Feudalism, only with some minor superficial tweaks. You can’t get a title to another human being these days, but you can, for all practical purposes cause them to be indebted for life.
Obviously I prefer none of the above! I also do not think that any recent economic models will work all that well going forward.
Whether or not people freak out when hearing the label ‘Socialism’ applied to system by which to run a civil society is irrelevant and an unfortunate persistent consequence of brainwashing of the general population, especially in the US.
But I sincerely believe that some form of liberal Social Democratic form of government and an economic system that recognizes resource limits and the absurdity of pushing the myth of ‘GROWTH’ might be a start in the right direction.
Not holding my breath and so far I have seen no indication that sanity will prevail and as far as I can tell, time is quickly running out to prevent a collapse of civilization. At which point most of these arguments will be pretty much moot!
Cheers!
Fred,
The social democratic form of government is just a variation on global capitalism, it is simply a well regulated market capitalist system.
So far experiments with a Marxist type system have tended to lead to more problems and have generally required repressive regimes.
I am not saying a better system is not needed, simply pointing out that such a system has not yet been discovered.
So far a well regulated (where government intervention to solve problems of positive and negative externalities is encouraged) market capitalist system is the best system that exists, in my opinion.
Even though sometimes the leaders that are elected are suboptimal.
Democracy is a terrible political system, but better than any other system by far.
The social democratic form of government is just a variation on global capitalism, it is simply a well regulated market capitalist system.
Yes, but what I’m proposing is a hybrid system that takes into account limits to growth while creating social safety nets which are sorely lacking in the US. Such as universal health care, free university education, and a recognition of the fact that due to technological disruption ‘JOBs’ as we have defined them up until now, may be a thing of the past. So we need a system that finds ways to support citizens both financially and allows them to maintain a sense of purpose and dignity in life.
While it may at one time have done so, the current capitalist system in the US, no longer does any of the above, for the majority of its citizens. That is not a sustainable system.
Hi Fred,
That is clearly up to the citizens of the nation.
Plenty of nations with democratically elected governments have moved in the direction you suggest, mostly European nations.
The US can follow their lead or languish in a nineteenth century political system. Its up to the citizens to choose. Lately we have moving further into the past, perhaps a depression will move us forward or further backwards, maybe we’ll get to feudalism yet. 🙂
European nations are not all using the same system. Eastern europeans who suffered under communist rule tend to shy away from socialist practices, while Western European nations have divided into unsustainable messes like we see in Greece, Italy and Spain. Others, like Sweden are moving away from Socialism. And others are out to lunch, worry about their sun tans, have their streets full of garbage and beggars, like France.
People always get confused with the concept of demand, because it expresses several things.
Demand always refers to the present and the future. Once the purchased is made (and the product is not returned) demand becomes realized and equals consumption. Yet there is confusion because many people talk about past demand when they should talk about sales. Fred talks about demand in 2010. That is consumption or sales, not demand.
Demand can only be estimated statistically and is very dependent on the price. It is subject to a large uncertainty and gross errors that have brought down important companies.
If I want to buy the newest Play Station but I think it is too expensive and would buy it if it was $50 cheaper, I am demand at a lower price point only. Sony will eventually lower the price to reach me.
If I want the latest iPhone just launched at its price but there are not enough units and I can’t get one, I am unrealized demand and very bad for the company as I can go to the competition if the wait is too long.
In the case of oil there is very little storage for the amount of stuff we use, so the industry makes a great effort to produce only what is going to be sold and keep it in the ground otherwise. Production and consumption match rather well, but small deviations have a disproportionate effect on price.
In the case of oil, as the price is negotiated during the sale, there is no unsatisfied demand. Everybody that wants oil and can pay the price will get it. The problem is the part of the demand that becomes potential demand at a lower price as the price increases. The potential demand at a previous lower price translates into economic activity decrease somewhere.
When economists and experts talk about how much oil demand will grow next year, they are making a statistical guess at a certain price point. If prices are rising demand will increase less than if they are stable or decreasing. We shouldn’t put too much faith on that data.
If production turns out to be higher than demand, stores fill and price goes down (see 2014). If production turns out to be lower than demand, stores empty and price goes up (right now). The buffer to prevent huge swings in price used to be OPEC spare capacity. In the 21st C OPEC spare capacity has been unable to buffer mismatches between supply and demand. It is one more of the signs that we have reached terminal state and Peak Oil is upon us.
http://www.energyeconomist.com/a6257783p/world/outlook/graphs/clopspar.gif
Carlos,
In short, the quantity of demand at any time t is dependent on the price of the product at time t, generally a lower price ceteris paribus will result in a higher quantity of demand relative to some higher price and vice versa.
That is generally correct, Dennis. But in the case of oil there are two important inelasticities that result in a certain lack of linearity.
One is that oil is absolutely required and cannot be substituted in most cases. In response to a price variation the demand is relatively inelastic. If the price increases, businesses will continue buying oil products until they can’t, while people might drive less. If the price decreases, consumption will not increase much until the economy expands and uses more oil.
The second inelasticity is due to the long time required to increase oil production in response to increased consumption and high prices. This gap between the price signal and the increase in production used to be dealt with spare capacity. If not we get very destructive price swings.
Carlos, what percent of oil consumption is inelastic? I ask this knowing there is no accurate answer, but this is a source of uncertainty in the whole equation.
Some consumption can be dropped with ease, and other as a last resort. Some consumption is frivolous, and other critical. Some cultures have much less fat baked in their consumption cake, and others very much so.
An associated question relates to time. How much time does a consuming entity have to adapt to price increases?
I don’t know. My guess based on consumption reduction in EU countries during the debt crisis is that very little oil consumption can be reduced before causing economic contraction. People with two cars can choose the one with higher mileage and it is a factor when buying a new car. When it comes to the decision of not going to places, we must think that there is a whole industry of recreation, leisure and tourism that suffers from that. So discretionary usage is also economically important.
A consuming entity tries to pass the cost increase to customers. If it is not in position to do so it will try to optimize operations and cut other expenses. Labor costs are one of the obvious places for cutting. The relationship between gasoline prices and unemployment is very clear.
https://1.bp.blogspot.com/-ZPx1wURlDTM/UHLSVnCewGI/AAAAAAAAGXY/rIcD3I3ygMc/s1600/US-UE-rate-and-real-motor-gasoline-prices-2-yrs-later-1976-sept-2012.png
Carlos,
In the short term we might have perfectly inelastic demand, not so over the long term, consider 1980s oil demand.
My guess for the USA is that, over 10 yrs, a 1/3 drop in oil supply could be absorbed by the economy without depression. Certain sectors would suffer severely, and others would do just fine. People would make some big adjustments, but things would roll on. Would be a different story if it happened in 1 yr.
I’m not nearly as optimistic that this kind of restriction in supply could be swallowed by Japan, since they already run a fairly tight ship, and need to keep consuming in order to earn their income (export goods).
if Gehwar goes off line (5M/day) I seriously doubt other ‘sulfer fields’ can compensate…
Ghawar is not one field, it is five. It is highly unlikely that all five would ever go offline at the same time. And I doubt that Ghawar has produced 5 million barrels per day in years. 3 Mbpd would be my guess.
For the North ‘Ain Dar graphic.
It looks like they damaged their field in the 2000s somewhat, the water mixing up with the oil. But still lots of oil in, when you can produce this mix, with the horizontal technic.
Wonderful presentation of the current situation in OPEC oil especially KSA!
As most readers here know, USA light tight is fighting headwinds to increase its production. Should OPEC lose around 1 million bpd from Iran the world oil balance deficit would increase dangerously.
The situation in KSA cannot be accurately determined because of a lack of hard data. However, as Ron has described above the information available indicates that KSA is at or near an overall decline in its production. Whether that decline will be a gentle 2% per annum or a senica cliff 10 %+ like Cantrall is the big question.
In the past when they haven’t been bringing new developments on it’s looked to be around 5% – e.g. late 2015 and late 2102, the trend (from only three points, but so what this is just a blog) is about that since June.
The number of rigs drilling for oil is only half what it was at it’s peak.
http://phx.corporate-ir.net/phoenix.zhtml?c=79687&p=irol-rigcountsintl
Once all these rigs are back working I am sure they will find lots of oil like they did in 2014.
https://www.cambridgenetwork.co.uk/news/no-sign-of-peak-oil/
This detailed analysis shows how much oil and gas there is. Plenty
The maximum oil rig count in Saudi Arabia was 81, it is now 66.
The maximum oil rig count in Kuwait was 47, it is now 35.
The maximum oil rig count in the UAE was 54, it is now 54.
The maximum international oil rig count was 1080, it is now 792, 288 rigs below peak. Also, the number of working rigs does not determine how much oil is found. Most of those rigs are engaged in infill drilling, they are not wildcats just punching the ground trying to find oil.
Your detailed analysis is the BP Energy Outlook, a publication that just takes OPEC’s word for how much oil they have left in the ground. OPEC tells bigger lies than Donald Trump.
Sorry John, you haven’t a fucking clue as to what the hell you are talking about.
Here is someone that does have a clue – CEO of Schlumberger:
http://www.northamericanshalemagazine.com/articles/2497/schlumberger-ceo-can-u-s-shale-meet-future-global-oil-demand
“The short-term investment focus adopted since 2014 offers a finite set of opportunities over a limited period of time, and this period is now clearly coming to an end as seen by accelerating decline rates in many countries around the world,” Kibsgaard pointed out.
BAU won’t get it done – no quick fixes, ‘new shale revolution’ or ‘reserve production’ to get us through – my interest is mostly how we (as a society and culture) will react as constraints on the resource ‘haves’ and ‘have nots’ set in.
Went through Irma in South Florida last Fall – and in general order was maintained – but really only out of Gas for about 3 days – and was more of a shock type shortage. A very slow decline of world supply will hit those who can’t pay for it most – and maybe wake up enough through higher prices to begin planning for what will be the greatest energy transition that must take place!
Thanks, Captjohn, that is a very interesting read. Some people in the oil business really do know what’s going on.
Question: Is there any reason that BP, an oil company would publish optimistic bullshit while Schlumberger, a service company, would tell it like it is?
Because service companies dont know. Usually operators lie to them so that they can’t share proprietary data with other operators.
What the fuck are you talking about? What operators? Service companies are upstream people. Oil companies are mostly downstream people. When you say “operators”, just who are you talking about?
service companies do not operate wells. They may have WI in some international projects where they have access to data to generate reserve reports, but they do not operate wells. In those instances where they do not have a WI and outside of the data they collect when completing a well, they have no more info than anyone else.
I was referring to the incentive. Why would oil companies have the incentive to paint an optimistic picture of the future of oil production when service companies seem to have no such incentive.
Also, an operator of an oil well is just someone who controls the valves and pumps with instructions from headquarters. They would have no idea about anything. Unless you are talking about the owner of an oil well?
Don’t ask me why these pubcos do what they do. I am in the business and you can read the balance sheets like I do. NOne of it makes sense unless you are trying to squeeze out a 15% return using other peoples money, but even that is suspect. So your guess is as good as mine.
ETA: Producing a commodity with price swings as wild as Oil and Gas hoping to get a 15% return on your money is INSANE.
Operator is going to have ALL of the data. Production, tests, logs, etc, so they would know as much if not more in some instances than the non op WI, even if they have no interest in the well. That is my experience.
Fair enough. Thanks for the info.
The big oil companies are selling a story of long term stability to their investors, partly so they can justify the long term investments needed for the mega-projects where they get most of their oil and cashflow (some of those see no net return for many years). They only need to sell themselves to their investors, not their customers who just buy the cheapest or most convenient, be it crude to refineries or petrol to motorists.
The service companies live more year to year – they get hired to help develop and drill a field and then their workload drops a lot except for some well servicing during operation. Schlumberger is selling itself to its customers (the ‘operators’ who are the E&P companies) and investors as the go to guy for the next couple of years as activity tries to pick up but faces increasing issues as the easy (and now not so easy but still OK-ish) oil goes away.
Schlumberger is not a typical service provider to the producers, although that is a large portion of their business. Since their purchase of Cameron International and other oilfield manufacturing companies, they have been providing facility engineering and fabrication services to the oil producers worldwide.
In point of fact, Schlumberger does have the information that the producers have, and then some. They use those numbers as a basis for facility engineering, and as such are arguably in a better position to interpret them than the producer as of late.
I’ve regularly read the BP annual report, and have come to regard it as little more than a curiosity. Schlumberger, Shell and Total have a firmer grip on the world oil situation, based on my read of their CEO’s comments. However that may be confirmation bias on my part. We shall see….
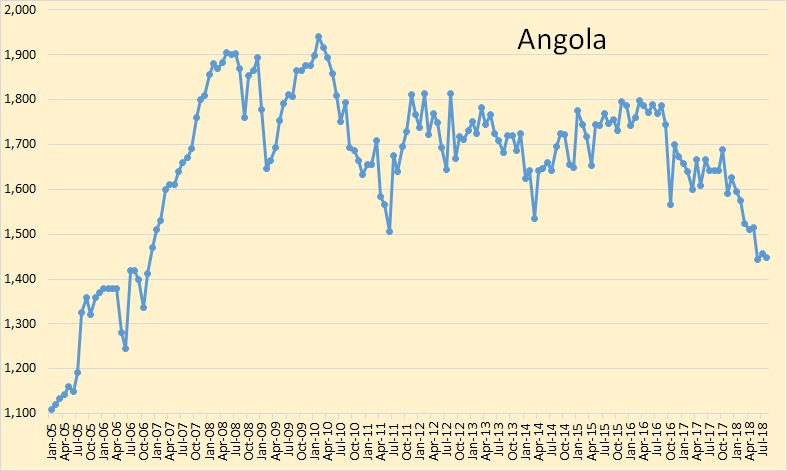
Libya and Nigeria more likely to go down than up from here to the end of the year and probably drag down overall OPEC numbers with them. First cargo from Egina (200 kbpd nameplate) will be in early January. Angola looks like it might be in trouble. Sonangol were predicting possible 10 to 20%+ decline rates for the on-line FPSOs from about 2023, but it might be happening a few years early, and their only new production was from EOR type projects as far as I could see, none of which have been announced, plus a couple of small tie-backs.
Fantastic report, as usual.
I remember Matthew Simmons saying that when Saudi peaks, the world peaks.
Mr.Simmons likely never considered the productive wonders of a cash flow negative oil boom aka USA LTO sarc/
I wonder how many more cash flow negative oil booms the world can endure, and how long USA LTO will last. While we’re at it, I wonder how the pension funds invested in USA LTO are gonna do for their members once the rats under the floorboards get flushed out.
Buckle your chin strap. Within a few to several years we’ll perhaps know better how this is gonna shake out. George Kaplan and Dennis Coyne had some future production charts in the comments of last post. By my rough eyeball and memory, I think George Kaplan had future production down to about 40 million barrels a day by 2050 (see link below). Dennis, ever the optimist ;), had us down to about 50 million barrels a day by 2050 (see Mr. Coynes comments in response to George). Either way, those alive in 2050 are gonna be living in a very different world!
http://peakoilbarrel.com/eias-latest-usa-world-oil-production-data/#comment-651548
Survivalist,
A lot depends on how much oil can be extracted. George Kaplan’s scenario looks to be roughly a URR of 2400 Gb if the 2020 to 2063 trend continues in future years (it is roughly straight line decline over that period so I just extended the line to zero and estimated URR. It is more likely, in my view that URR will be about 3060 Gb (including 260 Gb of extra heavy and LTO oil), that’s about midway between a pessimistic HL scenario(2600 GB) and optimistic USGS scenario (3000 Gb) for conventional oil.
Also higher rates of extraction could keep production a bit higher maybe 64 Mb/d in 2050, it will depend on the length of Great Depression 2 in 2030. Of course I think that might only last 4-5 years, being an optimist. 🙂
I haven’t worked it out but I’d guess the ultimate recovery is more than your estimate. First, as I said before, the XH production is based on long cycle projects, so it would have a fat tail extending beyond when most of the conventional oil is exhausted (there are a few reasons for that but one is that it needs upgraders and those are not built with excess capacity). Second, as I said twice before, Laherrere has about 180 Gb of “rest of the world” reserves that I didn’t include as I don’t know what they represent – if they are undiscovered oil then at current rates it will take about 40 years to find them, or if the recent trend for declining discoveries holds then forever.
And that is the last I am going to write – or read – on that Laherrere paper. It was just a comment on a blog, not an article in Nature or the Times or even a letter to either of those, or even a letter to the local free advertising paper. I wrote it most for my own interest, writing things out help clarify ideas, but I rarely do more than a cursory proofread. Most people who bothered to look at it would have read a couple of sentences and skimmed the rest, a very few might have got more out of it. It didn’t change anything fundamental. If somebody was going to write another comment they wrote exactly what they were going to write anyway.
Thanks George,
Well I appreciate your attempt as it made me read the Laherrere paper more closely. When I skimmed through the first time, I missed the fact that he revised his earlier OPEC (excluding extra heavy Orinoco oil) estimates to 200 Gb less than earlier papers (from 1300 Gb URR to 1100 Gb URR), there does seem to be 200 Gb missing from his URR estimate which is about 2200 Gb for C+C less extra heavy for the 35 nations he analyzed and about 200 Gb for extra heavy oil for a World total URR of 2400 Gb (about what your scenario has).
I had focused on his World C+C less extra heavy oil estimate near the start of the paper (2600 Gb) and then added the 200 Gb of extra heavy oil from the table at the end of the paper. From these two estimates there is 2800-2400 =400 Gb of missing oil when the two estimates are compared.
An HL on C+C-XH-LTO for 1993-2016 gives a URR estimate of about 2440 Gb. USGS has about 3000 Gb, average 2700 Gb for URR of C+C-XH-LTO
Survivalist
It won’t take to 2050 to see a different world. Just a small fall in supply has effects well out of proportion to the nominal cash value of the oil lost. Cheap flights would disappear, trade would plummet, GDPs shrink – the books have to balance one way or another (see recent paper on impact on trade, I think by Barclays, and works by Hall and Kummel). The biggest impact might be food prices, they could easily double and more short term, then the few billion who spend half their income on food suddenly have to spend it all. Turmoil would ensue and likely knock more oil supply off line. There was a paper about Sweden I think – from memory (don’t quote me) a rapid fall by a quarter of the oil available leads to collapse and by a half to complete loss of civilization.
At the same time the declining cheap and efficient energy would hamper efforts to address the other big ticket, long term issues: rising population, evolutionary inevitable aspirations – “poor man wanna be rich, rich man wanna be king, and a king ain’t satisfied till he rules everything” (of course); declining levels in some of the big aquifers (a few are getting to the point where the basic pump designs don’t work, the replacements needed are much more expensive and much more energy intensive); declining soil loss (at current rate all the soil on sloped arable land will be gone in 50 years – that’s a third – and most of the rest in another 50); and of course climate change related extreme weather. This year we’ve had record heat waves, wild fires, typhoons and (soon) hurricanes plus droughts etc. Soon those will be weekly events (we’re not far off now) but on top of that we will be having two or three extreme extreme-weather events per year. More and more of the oil will be going simply to triage on these (but the patient will get worse anyway). At some point countries will cease to be liberal democracies, the USA seems to be leading the way there, and say what you like about liberal democracies they have never declared war on each other, dictatorships on the other hand …
People will say oh we just need to do this, that or the other – but there is no “just” about any of it, and especially as oil disappears: ignoring the externalities there is absolutely no better real energy source imaginable by some way, especially the cheap stuff we used to have.
You of course know all this and are preparing much better than me, I do not much more than appease my conscience by not flying and hardly ever riding in a car, but I think I’m getting to the “acceptance” stage and pretty much missed out on depression (no physical symptoms anyway).
… [end of rant].
If I remember correctly someone once asked Matt Simmons how best to prepare for peak oil. His response was “be over 50”.
And that was , what, about 15 yrs ago? So make it 65 now.
I tend to agree with you George. Only a small decrease a short time after peak, and the realization that it’s not going back up, will likely open a lot of people’s eyes to the fact that almost every stock and equity is overvalued (come to understand that anticipated future growth will not be realized). I plan to hunker down and catch up on my reading while the dust settles, and I’m thinking there’ll be a lot of dust. I’ll send you a map. Password is ‘I think I’m with the band’.
I find this to be also an interesting take on the future of oil
Fracking (Tight Oil) delays Peak Oil by some years
https://aleklett.wordpress.com/2017/04/16/fracking-tight-oil-forskjuter-peak-oil-med-nagra-ar/
MudGod,
I remember Matthew Simmons arguing the decline in Saudi output is imminent. Eventually he will be correct, Laherrere estimates about 300 to 350 Gb of URR for KSA, call it 325 Gb. A hubbert linearization gives a result of about 320 Gb for URR with cumulative output through the end of 2017 at 150 Gb, that leaves about 170 Gb to be produced.
It is far from clear what future output from KSA will look like. Laherrere expects decline will be between 2%(350 Gb URR) and 3.5%(300Gb URR) per year after 2040 for KSA.
Hi Ron,
Awesome post as always, would you be able to fit nbr of drill rigs Into the same chart as production figures also for your three charts. Perhaps it would make the picture even more clear.
I will do that next post.
EIA confirms the stock draw reported by API yesterday. US is now below 400mb for first time since feb 2015 but the trend now is down.
Ron, when oil reservoirs have very low initial water saturation (that is, very high initial oil saturation), the rocks are oil wet, and this reduces recovery factor under waterflood or water drive. This leads to a recovery factor of say 40% for an oil wet rock, and 55 to 60% for a water wet rock with almost identical oil quality (I’m generalizing).
Fernando,
Which applies to KSA? Water wet or oil wet rocks?
Dennis, the four cross sections from a model shown in the post tell me the top of that reservoir ought to be oil wet, because oil saturation is shown to be so low. This depends on the oil, the water, rock properties, column height, etc. I assume some Saudi fields have large oil columns, the oil is swelled by temperature and solution gas, and the rocks can be oil wetted. But i really dont know. My point is that if you see a field with 10% initial water saturation, then the high water cut point could be say 50% water saturation of the rocks. That reduces oil from 90% to 50% saturation, so the recovery at that point is 4/9. Ron indicated he thought that field could have much more oil but if the saturations were so low near the top, it should be oil wet (but im not sure). We can of course pump wells to really high water cuts and this yields a much higher recovery factor. But that requires cheap gas to generate electricity so we can pump huge amounts of water
Some years ago someone posted (elsewhere) a description of oil to water ratio and concluded that disaster was about to befall all of society because the ratio was something like 90% water and 10% oil in what was being produced. My recall is this was a conventional well and I think it was Saudi Arabia.
Soon after, someone who knew about such things pointed out that 90/10 ratios are very common and suggested nothing about incipient disaster.
Ron
Although I have been lurking on your website for years, this is my first port.
I have been trying to follow Saudi oil production upgrades for years. This is the best summary I have seen.
I know they have one field with too high vanadium content to sell to other refineries, so they built a refinery to handle the large vanadium crude.
Also I know they had a heavy oil field that they could not sell all of the production because no other refineries could take all they could produce. Therefore, they built a refinery just for this very heavy crude.
Do you have updates on these two projects?
Manifa has very heavy oil and is also continued with vanadium. It is online now and producing about 900,000 barrels per day.
Manifa Project
I don’t know of another Saudi field that has a heavy oil problem.
Mike had some posts on the last thread about someone buying an 1180 acre State of New Mexico lease for about 100 million. There is a seeking alpha article about the great deal Matador Pet got in the last New Mexico auction snagging 8400 acres for only 387 million.
https://seekingalpha.com/news/3389832-matador-resources-buys-new-mexico-acreage-oil-gas-lease-sale
So people think that oil production next year will not meet demand. Of course consumption will equal production, but demand will be higher, and we won’t be belabor this further because the point here is a question above — how does society react too insufficient oil?
The question is never analyzed in a particular way. It’s usually evaluated from the consumer’s perspective. Who does what to get the oil they need. We can imagine they bid higher, we can imagine that day seize the oil enroute to someone else, and we can imagine a magical agreement on the part of everyone to stop all economic activity not involved in food production/distribution to reduce global consumption.
What seldom is described is the decision making process within the leadership of oil producers and exporters. It seems clear that a sudden awareness of insufficiency would yield leadership meetings making decisions not about how to distribute more oil to customers, but rather how to keep the oil for future generations of the producing country, without getting invaded and destroyed.
One would think that the optimal strategy for a country that has oil is to ally itself with a military power that can deter invasion by some other military power, without having the ally’s troops actually present on the territory. Or perhaps more effective would be investing in the necessary explosives or nuclear material for one’s own oil fields, and inform potential invaders that the oil will remain the property of the country whose geography covers it, or the fields will be contaminated for hundreds of years to deny them to anyone else.
Clearly this is the optimal path for an oil producer and not seeking some technology that can allow them to drain the resources of future generations more rapidly now.
So people think that oil production next year will not meet demand. Of course consumption will equal production, but demand will be higher,…
Watcher, I assume you think demand is what people want. But there is no way to measure what people want but can’t afford. So “demand” in that sense has no meaning whatsoever. So what happens is the price of gasoline, or whatever, rises or falls until supply equals demand. As prices rise, demand falls and as prices fall, demand rises because people can now afford it. Therefore demand always equals consumption. Demand is what people buy at the price they can afford. I wish we had a word for what people want but even if we did there would be no way to measure it. A poll perhaps? 😉
Ron,
I answered that above
http://peakoilbarrel.com/opec-august-production-data-2/#comment-651890
Estimating demand is essential for a company and can determine its survival. Demand is dependent on price, so demand estimates are essential for deciding the price of a product. The curves for price and demand cross at a point that maximizes income.
Demand is estimated statistically (polls sometimes), with models, and expert forecast. It has a large uncertainty.
That is potential demand at a lower price point. It is estimated in the same way. Companies decide to lower their prices with hopes to realize that lower-price demand.
Exactly. Demand becomes consumption when realized, so it only makes sense to talk about demand in the future or the present (due to lack of real-time data). It doesn’t make sense to talk about past demand, because it becomes consumption or sales.
There is a numerical measure for how much people want gasoline, regardless of price.
It is the length of the line of cars at the gas station in the 1970s. Demand was measured in 100s of feet. Price somewhat doesn’t matter. If you can’t afford it, you put it on a credit card and then default.
Put it on the credit card and not pay it. Because, it was de fault of the company to give it to you in the first place.
The length of the queue is an interesting metric by which to measure the want that people have for an item. Nice one. I’m gonna use that. Reminds me of my Dad’s old story about lining up for a week to buy tickets to see The Beatles.
When you are lining up to buy tickets to see the Beatles it might be called a ‘Want’ or a ‘Desire’. However, when it is the line at the soup kitchen it becomes ‘Hunger’ or ‘Desperation’!
And that queue can sometimes feel like a hundred miles…
I remember that—-
It was eye opening.
The bigger issue is people, Business, & gov’ts servicing their debt. If the cost of energy increases, it make it more difficult to service their debt. Recall that Oil prices peaked at $147 right before the beginning of the 2008/2009 economic crisis. Since then 2008 Debt continued to soar as companies & gov’ts piled on more debt. Debt is promise on future production. Borrow now and pay it back over time.
I recall the presentation Steven Kopits did about 4 or 5 years ago that stated Oil production was well below demand. I think real global oil demand was projected to be about 120mmbd back in 2012-2013 (sorry don’t recall the actual figures).
I think the bigger factor is how steep the declines will be. Presumably all of the super giants are in the same shape and likely heavily relied on horizontal drilling to offset natural decline rates. Presuming as the oil column shrinks in the decline rates will rapidly accelerate. Most of the Artic\Deep water projects were cancelled back in 2014\2015, and I believe most of those projects would take about 7 years to complete and need between Oil at $120 to $150/bbl (in 2012 dollars) to be economical. I am not sure the world can sustainably afford $120+ oil, especially considering the amount of new debt that has been added in the past 10 years.
Ron Wrote:
” I wish we had a word for what people want but even if we did there would be no way to measure it”
Perhaps the word “Gluttony” or the phase “Business As Usual”. People don’t like change, especially when the result, is a decrease in living standards.
Being willing to pay more for oil may change who gets it. But it will not alter the fact that someone who wants oil will not get it. That will be a ripple of market information which will travel around the world pretty quick, I should imagine!
There is always somebody who wants oil but cannot afford it.
This is unlikely to change in the next 30 to 40 years.
The vast majority in almost all the places in the world would like to use more oil but their income is not enough so they end up doing with less. That includes me. Who doesn’t want a bigger faster newer lawn mower, truck, or tractor? What person would not prefer the latest iphone etc. ? or going on vacation, eating out at high end steakhouses? The main reason they can’t is because it would take more and cheaper oil for them to be able to afford it. Else they can only try to take it away from someone else? The peak in global oil production/person happened back in 1979, not because folks were tired of using it all but due to the laws of physics coming into play.
So there are two ‘classes’ of ‘peak oil’. One class is where oil supply is constrained by price (throwing more money at production sees an increase in production), the second class is where oil supply is constrained by physical availability at any price (wave more money at production, but production cannot increase).
In the first case (price constrained) normal market behaviour will apply – folk pay more (if they can afford it) to get more.
But in the second case (resource constrained), it does not matter how much is offered, there is simply no more oil to be had.
With the prevailing declining yields and declining discoveries, are we not in the transition between these two states – moving from price constrained to resource constrained? And once we get well into resource constrained, the price a buyer can pay will determine who gets the remaining available oil, and no amount of screeching and dollar-bill-waving by those who have missed out will improve the supply situation for them.
The second case is my main interest. And I think we are already there. We wouldn’t be looking at LTO and oil sands if there were cheaper options.
LTO decline rates should make the issue more obvious when there are fewer places to drill new wells.
LTO decline rate would be no problem by a conventional / state possessed oil company.
They would have a field with tight oil, and then just equip let’s say 20 fracking / drilling teams and start to produce through their field in 30 or 50 years. They would have a slow decline by starting at the best location and getting to the worse one, while increasing experience / technic during the years to compensate a bit.
You have a pretty good argument except for the “30 or 50 years” part. That’s where the wheels fell off your go-cart. Just how large would the tight oil reservoir have to be to keep 20 drilling and fracking units for 30 to 50 years? And if you assume other oil companies are in that same reservoir doing the same thing? They are going to cover a lot of acreage very fast.
Adam Ash,
It matters very little. At any time t the available supply is limited and the market price will determine who gets what is available. Those willing to pay more than others will get the oil. When we reach a point where no more oil can be supplied at price P, there might always be some more oil that could be at some higher price P’, it is simply a matter of oil prices reaching the point that there are substitutes that can replace the use of oil in some uses. Today the biggest use for oil is transport and electricity and natural gas may soon replace a lot of this use, especially as oil becomes scarce and prices increase.
At $100 to $120/b the transition to EVs could be quite rapid, maybe taking 20 to 25 years to replace 90% of new ICEV sales and then another 15 years for most of the fleet to be replaced as old cars are scrapped. So by 2055 most land transport uses for oil will be eliminated.
The higher oil prices rise, the more incentive there will be to switch to cheaper EVs, even natural gas will probably not be able to compete with EVs as Natural Gas will also peak (2030 to 2035) and prices will rise. It will probably be unwise to spend a lot of money for Natural gas fueling infrastructure, though perhaps it might work for long haul trucking, rail seems a more sensible option.
Adam Ash Wrote:
“So there are two ‘classes’ of ‘peak oil’. One class is where oil supply is constrained by price (throwing more money at production sees an increase in production), the second class is where oil supply is constrained by physical availability at any price (wave more money at production, but production cannot increase)”
Consider this way:
There is already a huge shortage of $10/bbl oil, and a massive glut of $300/bbl oil. There is always shortage resources. Price is just a system that balances demand with supply.
Adam Ash Wrote:
“But in the second case (resource constrained), it does not matter how much is offered, there is simply no more oil to be had… no amount of screeching and dollar-bill-waving by those who have missed out will improve the supply situation for them.”
Not exactly. People that can only afford $50/bbl Oil get out priced by people willing to pay $100/bbl. Supply shifts to the people that can afford the hire price at the expense of people that cannot afford the higher cost. Higher prices will lead to new production, even if has a Negative EROEI (ie tar sands using cheap NatGas).
In an ideal world, higher prices lead to less energy waste (flying, recreation boating) and better efficiency (more energy efficient buildings & vehicles). But I am not sure that will be the case in our world.
The first to suffer from high energy prices will be the people living in poor nations. Recall back in 2008-2014 we had the Arab spring when people could afford the food costs, and started mass riots and overthrough gov’ts. This will return when Oil prices climb back up.
Its possible that the world make continue to experience price swings, as global demand struction decreases demand. For instance in July 2008 Oil was at $147/bbl but by Jan 2009 it was about $30/bbl. I doubt we will see such large price swings, but I also doubt that Oil will continuously move up without any price corrections.
Realistically we are in deflation driven global economy as the excessive debt applies deflationary force to the economy. However central banks counter deflation with artificially low interest rates and currency printing (ie Quantitive Easing). My guess is that industrialized nation gov’t will become increasing dependent on QE and other gimmicks that lead to high inflation\stagnation.
IEA OMR sept: https://www.iea.org/oilmarketreport/omrpublic/
OECD stocks are up but IEA forecast a decline in 4Q18.
“OECD commercial stocks rose 7.9 mb in July to 2 824 mb, only the fourth monthly increase in the last year. Stocks have been stable in a narrow range since March. Preliminary data for August point to significant inventory builds in Japan and the US, and a fall in Europe.”
“Even before we factor in any further fall in exports from Venezuela or Iran, record global refinery runs are expected to result in a crude stock draw of 0.5 mb/d in 4Q18. Any draw will be from a basis of relative tightness: in the OECD, stocks at end-July were 50 million barrels below the five-year average.”
They are still misreading US production, courtesy of the EIA. “Stellar?”. And, I really have a hard time understanding where they are coming from, because they deal in “liquids”. They are saying a 1.7 increase in liquids in 2018, and a 1.2 increase in 2019. On an average basis, oil may increase .6 for 2018, and .5 for 2019. Even EIA is at .7 for 2018, now. Where do the other one million in liquids come from??? Condensate is included in EIA and my figures, and I seriously doubt that LPG makes up the difference. Actually, from EIA it could make up .55 million of the difference, but half a million of phantom liquids is..where?
https://www.eia.gov/outlooks/steo/report/us_oil.php
Guym,
From 1982 to 2017 the average annual increase in C+C consumption has been about 800 kb/d each year. Better in my opinion to focus on C+C rather than “all liquids”, so if this rate of increase in consumption were to continue, then at 600 kb/d we would be 200 kb/d short (and that would come from inventory)
I’m reading the IEA report above. They deal in liquids, and it is better to concentrate on oil and condensate, but they don’t. And, yes, whatever amount they are off, will come out of inventory. An additional subtraction from their estimate of .5 million draw. Next year, we get to increase that draw dramatically.
OPEC reports non-OPEC increases to be 2.02 million for 2018, and that is reported this month. They report oil and condensate. It won’t get close. There may be some offset in demand calculations. If they are off this much on supply, their demand calculations have to come from what they get shooting darts.
Iea pretty useless because they oly have all liquids forecasts. eia is better as they have crude forecasts in aeo. Steo also not very good.
Actually its the EIA’s IEO (International Energy Outlook) from 2017 that’s useful and has a C+C projection through 2050. The projection is pretty reasonable through 2026, after that there is a rapid increase to 100 Mb/d in 2050 from 83 Mb/d in 2026, about a 700 kb/d annual increase for 24 years, after a 280 kb/d annual increase in output from 2017 to 2026.
The projection for 2027 to 2050 is not realistic in my view, but the 280 kb/d annual increase in output from 2018 to 2026 seems reasonable.
Would the real Dennis Coyne please stand up? Really Dennis if that’s some trolling you this is going to get effing confusing round here. Can’t you block the SOB
Hi Duanex,
That is me. My best guess is about World C+C at about 85 Mb/d in 2025, pretty close to the EIA’s IEO 2017 in 2025. I can create a very optimistic scenario that gets to 90 Mb/d in 2040 with very high extraction rates, but I don’t consider that a very likely scenario. The EIA’s IEO 2017 reaching 100 Mb/d of C+C output in 2050 is just not going to happen, maybe 1% probability at most.
From Kjell Aleklett in a link above:
“In 2003 the International Energy Agency (IEA) predicted that oil production (not including fracking) would reach over 120 million barrels per day (Mb/d) in 2030.
In 2015 oil production by fracking was around 4 Mb/d and there has also been an increase in natural gas liquids production through fracking.
The IEA’s current prediction for 2030 has been reduced from 120 Mb/d to 98 Mb/d despite the increased production from fracking. At the same time, the IEA in its World Energy Outlook 2016 report has warned that production may be significantly lower in 2025 due to insufficient investment.”
This is testimony to two important facts:
– How bad are future oil production predictions.
– After the unexpected addition of tight oil from fracking the predicted increase in production from 2000 to 2030 has dropped by 50% (from 45 to 23 Mbpd), and is expected to be reduced further. If anybody needs evidence that Peak Oil is approaching fast, there it is. Predictions of production increase even by the most optimistic organisms are eroding fast.
A little bit up in the comments for this thread…but, it is a point to make that OECD stocks increased 7.9 mb in July. What is much more important and difficult to measure is the inventory globally. If we have a 10-40 million draw in Chinese inventory in July/August as is plausible due to a variety of sources and maybe 30-10 million barrels of draw in KSA with close partners inventory for July/August…then the picture didn’t change that much as we were lead to believe. The first figure before the “-” is July, the second for Aug; all guesses of course. It is very difficult to push the botton to increase oil production, and therefore it is also very difficult to increase worldwide inventories after a prolonged investment drought as we have seen.
For Progressive music lovers, like me: https://m.youtube.com/watch?v=gJuxREA6AwA
From 2016
Saudi Arabia’s oil reserves: how big are they really? Kemp
https://www.reuters.com/article/us-saudi-oil-kemp/saudi-arabias-oil-reserves-how-big-are-they-really-kemp-idUSKCN0ZL1X6
Over the years there has been various speculation of how KSA defines reserves:
ya, per article, probable redefined as proven. maybe
there was a time when it was suggested KSA was defining reserves as what was originally there, ignoring production since 1960 or whatever.
there was even a suggestion that the oil/water mix coming up was being used to redefine original rock porosity, which would redefine reserves
Here is what you need to know about reserves: No one has any incentive to tell you the truth about them. How could KSA benefit by telling anyone the truth? If they were going to shut down 100% in the next 3 years, they absolutely would not tell anyone. That would just be begging to be invaded by someone who needs most of what’s left and has no reason to share.
So don’t expect that you’ll ever know KSA reserves. Why should you?
Actually, I’m not really very bothered about knowing their reserves. What I’d really like to know though is when they’re gonna peak, and how steep the decline will be after that. I guess I think it’ll give me an edge lol
Does anybody here think that KSA will mirror China in post peak proportions?
Here’s an article with a good chart on China.
http://peakoilbarrel.com/eias-latest-usa-world-oil-production-data/
Are there any good case studies that might give insight into KSA’s peak production profile?
Personally I think KSA is acting desperate. The anti corruption drive was just a big shakedown, they’re in Yemen for oil, gas (not much), ports close to Oman in what used to be called South Yemen, and maybe a pipeline to one of them ports that gets them to the ocean on the other side of Iran’s straits. Lots of other nonsense with their neighbours too. KSA is train wrecking, and I don’t think it’s all just some generational thing.
There’s been a couple of articles recently, from pretty sober and credible sources, saying that MbS might be gone next year. He lives mostly on his yacht with armed guards now. All his schemes have pretty much turned to dust one after the other: the Yemeni war is costing about $5 billion a month, his father has turned against him (my interpretation would be that someone else has taken over as having the the king’s ear now, as he’s got some sort of dementia so probably doesn’t do much original thinking), the attempt to distract attention with anti-Qatar sentiment isn’t working, the Ritz-Carlton extortion episode is backfiring even though it got him some ready money, Sunni-Shia issues still bubbling.
GeorgeK,
Sort of related: Saudi Arabia is buying Israel’s Iron Dome missile-defense system and Israel has offered to share intelligence on Iran with the Saudis. This according to an article at Reuters quoted at Oil-Price/ASPO under Peak Oil News.
I’m expecting next to see pigs in my silver maple.
Hanging out on a yacht is bad form for a man with such motivated & creative enemies. Obviously he and his security entourage have not heard of the late Lord Mountbatten, or The Rainbow Warrior.. A few limpet mines and he’s old news.
EIA Weekly U.S. Ending Stocks to Friday 7th September
Crude oil down -5.3 million barrels to 396 (green dot on the chart)
Oil products up +10.9
Overall total, up +5.6
Natural Gas: Propane & NGPLs up +3.7
Chart showing EU and US crude oil inventories, monthly: https://pbs.twimg.com/media/Dm_zjpTX0AAMhjq.jpg
A weekly measure of international inventories
Crude oil & products: https://pbs.twimg.com/media/Dm_0vELX4AAdLHB.jpg
Products: https://pbs.twimg.com/media/Dm_0NuEX0AAsPo0.jpg
Japan to the 8th of September, the date on the chart is the report date.
Japanese inventories usually peak in October
https://pbs.twimg.com/media/Dm_1ZfjW4AAelJl.jpg
Gas To Liquids (GTL) 200 barrel per day plant suspends operations
“The Board of ENVIA Energy (ENVIA) has decided to suspend operations at the Oklahoma City gas-to-liquids plant and to undertake a review of strategic alternatives in order to preserve the value inherent in the facility.
The ENVIA plant uses Velocys Fischer-Tropsch technology to produce premium wax, diesel and naphtha. …”
http://www.greencarcongress.com/2018/09/20180913-envia.html
A lot of GTL news at http://www.greencarcongress.com under the Gas-to-Liquids tag.
And most of it is plans for studies, or announcements of suspension of efforts.
GTL doesn’t seem likely to be a major player anytime soon, if ever.
Does anyone have an opinion on Extraction Oil and Gas? XOG.
I am wondering if they think they will survive or if they are in the business to make what they can now before debt catches up to them.
From above . . . when you have to have something, you put it on a credit card and default . . .
https://www.zerohedge.com/news/2018-09-13/china-offers-venezuela-5-billion-loan-support-ideological-ally-maduro
China won’t care. Why should they?
The Venezuelan National Assembly issued a statement (which was distributed to all foreign embassies) which says the National Comptroller is illegitimate and that all financial transactions, including loans, are illegal and will not be honored when the Maduro regime falls.
There’s a battle raging in the US between factions which focus mostly on US elections or providing cover so that Maduro can survive. They focus so much on Syria, Russia and israeli issues they don’t pay much attention to what goes on in Venezuela.
Meanwhile, the Supreme Court in exile, Luisa Ortega (the exiled State Prosecutor), Ledezma (the Caracas mayor who escaped from house arrest), Julio Borges (former National Assembly president who fled after being threatened by Maduro) are working quietly to set up a government in exile. This requires several steps which have to be followed as per the constitution. The decision point for President Trump will come in about 90 to 120 days (it should be closer to 90). This decision diesnt involve military or any of the violent means being discussed. But it could lead to Maduro’s defeat.
Blurb says his term is 6 yrs. Election was this year. But I suppose folks can declare they won’t honor that, either.
The article announcing the loan said that Venezuela had failed to make payments on present loans. It did not point out that payments are frozen by banking sanctions. Payments to China or Russia won’t be.
https://tradingeconomics.com/venezuela/government-debt-to-gdp
That’s an interesting chart. Debt to GDP is now about 23%. Banks discovered pretty early in the financial universe that they cannot collect interest from an entity that doesn’t borrow money from them. They tend to be not pleased about it.
(US debt to GDP is over 100%)
Just scrolled through some articles. An amusing one said this: China has loaned Venezuela $50 Billion since 2008. Lots of verbage about the horrors of it all and the collapse of this or that. Somewhat later in the article, near the end of it “Venezuela has repaid much of the debt to China with oil. About $20 Billion is outstanding.” Maybe that oil is in exile now.
Then there’s this:
More than 2.3 million Venezuelans out of a total population of around 32 million have left the country during the past four years, according to the NGO CARE.
So that’s what, 600K/yr? Now there’s not much doubt that some returned, no? And beyond returnees, immigration to Venezuela seemed to be 1 million per year as of 2014. There was a blurb out there throwing racism on the matter, that those leaving were light skinned and those arriving were from China and Haiti. Quite many from China.
Venezuela law apparently provides free healthcare for anyone in the country, regardless of nationality.
Regardless, the quoted population for 2018 is 32.5 million. That’s from UN data. 2017 31.97 million. Growth rate 1.26% (US is sub 1%)
Enough reality!
Wasn’t Maduro to be gone
23 years ago?MSM brings such sharp analysis—–
Hightrekker Wrote:
“Wasn’t Maduro to be gone 2 3 years ago?”
Usually when a gov’t is mismanage as badly as Venzuaela, it gets overthrown. VZ is just a quirk that it hasn’t resulted in a Coup or civil war. Recall that Civil wars & Coup’s are very common in Latin America.
Sooner or later Moe will be forced out or killed. Its just a matter of time.
Watcher wrote:
“Venezuela law apparently provides free healthcare for anyone in the country, regardless of nationality. ”
Kind of pointless when there are no drugs, medical equipment, or sufficient HCPs available. Free Healthcare in VZ is like putting a sign next to an empty Gas can that says “Free Fuel!”
Someone once said “One can tell a lot of lies speaking only the truth”.
One can tell even more lies quoting only true statistics.
But the reality is that my neighbour Venezuela currently is a complete chaos.
You would know more than me–
I was in Colombia for quite a while, and in Argentina for a shorter time, but not in Venezuela.
Many comrades were there for years.
But the reality is that my neighbour Venezuela currently is a complete chaos.
Don’t worry Jair Bolsonaro, will keep the great Brazilian march for order and progress right on track! Then he can expand it throughout the rest of South America…/sarc!
Right wing, left wing they are just opposite sides of the same worthless wooden nickle! Brazilian Ultra Nationalism and a wish for going back to failed policies of the past won’t work and they are a path to future chaos in Brazil as well.
Hopefully there are some sane Brazilians left who will stand up against this stupidity!
I guess China figures the Monroe Doctrine only applies to Europeans. Money grows on keyboards, I’ll be more impressed when China “sells” them advanced air, not just L-15’s and K-8’s.
https://www.nytimes.com/1984/11/08/world/us-warns-soviet-it-won-t-tolerate-mig-s-in-nicaragua.html
The elections held in 2018 are considered illegitimate because they were called by an illegitimate “constitutional assembly”. About 42 countries have already declared they consider that assembly and the spurious election to be illegitimate.
The steps being taken by the democratic firces are intended to lead to the creation of an alternate executive which can be recognized by other nations. This process takes time, but the international community has signaled they consider the Supreme Court in exile, Luisa Ortega, and the National Assembly to be the only legitimate powers.
The flow of refugees has increased steeply as hunger and despair increase, so the numbers by now probably exceed 3 million.
I talk to Venezuelans in exile as well as those inside, and I sense they wait to see if the US rescues them. But i keep explaining that they wont get help until the transitional government is formed and requests help. I also indicated to resistance leaders that its important to have a roster of young men who are in exile and have served in the military or worked as policemen or as private security guards. The idea is to recruit 20 thousand volunteers to form a national army, which would have civilian control from a Minister of Defense in exile. I know the shape of the Venezuelan military and the country. So all those 20 thousand would need is for the US to take out the Chavista air assets and provide air support with drones, a few B52s and C130 gunships.
Great, another US backed overthrow in Latin America. It usually leads to such positive outcomes.
The procedure we would follow isn’t an “overthrow”, because the legitimate executive would be the transitional givernment in exile. This givernment would declare that Maduro et al are posers who carried out a coup, ask help to arm 20 thousand venezuelan volunteers who would proceed to take a portion of Venezuela with USA air cover. Once this territory is liberated the legitimate venezuelan government would recruit an additional 100,000 volunteers and expand the territory it controls. The ultimate aim is to have an army with 500,000 soldiers and make sure the maduristas either surrender, run away to Cuba, or get killed. Its a legal solution, its gradual, works like a steam roller. And you can go tell them this is what’s coming down their throats. Maybe they’ll realize this is an end game they arent going to win, and run away to Cuba.
I should add this strategy doesnt require UN or other international approval, because it would be a government and people asking for help to get rid of a plague. We would make sure the liberated areas are kept under strict control to avoid popular lynchings of maduristas, secret police, colectivos and other gangsters who have been propping up the regime. The bad ones would be jailed, tried under Venezuelan law and serve time as required.
“Once this territory is liberated[confiscated] the [psuedo]-legitimate venezuelan government[regime] would recruit an additional 100,000 volunteers [death squads]”
two of the many ways to tell a story.
Hickory,
Yes, terrorist or freedom fighter is just a matter of who wins.
From the British perspective, the Sons of Liberty were terrorists.
Do the actions of Maduro seem legitimate to you?
How about Stalin?
Indeed Dennis.
Maduro legit? I don’t see how you have a legit leader in a country with so much manipulation of the process, from coup to press suppression etc.
On the other hand, how does a leadership installed by outside forces call itself legit?
Failed state isn’t easy to fix.
I sure wouldn’t trust anyone with such an authoritarian affinity to be involved in decision making regarding governance.
The main bodies creating the transitional government would be the Supreme Court judges who were named by the National Assembly with the required supermajority vote. The National Assembly at the time was the only legitimate body, thus it transferred its legitimacy to the judges.
The judges fled because as soon as they were named Mafuro ordered their arrest. The ones in exile are the ones who got away.
The State Prisecutor was also named and approved according to the constitution. She fled when she feared for her life after Maduro’s illegitimate assembly said they were replacing her (a power they lack given their illegitimacy).
My sense is that english speaking leftists we see on social media and writing comments include hard core regime supporters who would say or do anything to see their red genocidals tyrants rule and destroy nations in the name of “social justice”.
Hickory,
It would seem that removing a dictator by democratic means is difficult without some kind of revolution or military coup. In the case of Venezuela some government in exile which attempts to remove a dictator by force, might be the only viable option. I have never been to Venezuela so I don’t know the situation first hand.
Thats a dangerous game Dennis. Better make sure you have a very big majority of the population on your side. Else you can get situations like VietNam and Iraq. Is Brazil, Columbia, Chile, Argentina clamoring for this path? Does China, The EU and Russia concur?
Hickory,
Probably right, UN action might be better, though that usually accomplishes very little.
Weapons and advisory support and possibly air cover would seem to make sense as standing by and watching things fall apart as Obama did with Syria seems a poor policy.
I don’t ever expect much from the UN, other than discussion. They are not set up to actually do anything.
And I don’t trust the USA to get much right in the world. Picking winners and losers is not something we do well at all.
I have no trust for the right or left wingers. That leaves only 27 people in Venezuela., and they are wise enough to just shut up and work on surviving.
Once again, what do the other countries in S. America want?
Lastly, some people would say that the only way to fix a failed state is through an authoritarian process. They could be correct, I suppose. Hard to find that with good intent, especially when you throw in the lure of petrodollars.
https://mobile.reuters.com/article/amp/idUSL1N1TM1VJ
Older article, but more important, now. EIA, and most of the Rystad type companies are continuing to report significant increases in the Permian. Latest monthlies are from June, all else is estimated, including drilling info. Completions are happening, and the new wells included in drilling info are, no doubt, true as to production. Who measures shut ins until final numbers are accumulated? Who spends significant time communicating with the small producer? Heck, they make up half the wells drilled in the Permian. I think there are considerable shut ins that will eventually reduce the magnificent increases that are currently being reported.
Guym,
See tight oil estimates at page linked below
https://www.eia.gov/petroleum/data.php#crude
Permian output in July 2018 was about 480 kb/d higher than Dec 2017. For all US LTO output July 2018 output was 690 kb/d higher than Dec 2017. For the first 6 months of 2018 it was 440 and 610 kb/d for the Permian and US tight oil respectively.
For all US output the increase from Dec 2017 to June 2016 was 634 kb/d, so tight oil was 96% of the increase if the estimates are accurate (they are often revised).
Guym
You seem to be pretty in tune with the EFS.
I ran a quick search on horizontal wells in Karnes Co., TX.
I found 2,778 active horizontal wells with first production from 1/1/2009 to 12/31/2016,
In the most recent month, here are the numbers:
170 wells produced 3,001+ BO
1,034 wells produced 1,001-3,000 BO
872 wells produced 501-1,000 BO
702 wells produced 1-500 BO
Could that be correct?
Furthermore, there appear to be over 700 inactive wells, which are defined as wells that have no recorded oil or gas production in the last 12 months.
Could over 20% of the horizontal wells in Karnes Co., TX already be shut in for over one year? These wells first produced 1/1/2019 to 12/31/2016, so they are not old wells at all? Less than 10 year economic life?
I know Mike has commented on how bad the EFS really is economically. It seems the hyper focus is now on the PB. However, EFS produces significant volumes of oil. Looks like this one could really collapse once the last locations are completed.
I saw many, many wells with cumulative production of 250K oil, that are now producing under 500 BO per month.
I ran the same search on De Witt Co., TX. Less wells, but similar results. Interesting to see all the wells in both counties that have maybe paid out, but are now producing less than 500 BO per month.
Even Karnes County has it’s less than tier one oil areas, and a lot of the wells were not up to par in the beginning. The well has to pay out capex in the first year, or its not worth drilling. Profit in year two and three, and not much after that. Period. End of story. I don’t see much better out of the Permian, and may be getting worse. Yes, on the whole, less than a ten year economic life. Gets a lot worse in tier two stuff, and tier three stuff is, at these prices, a definite loss. But they are still drilling in tier three areas, go figure. My lease area is producing around 250k to 300k total, and it is barely touched, because EOG wants 300k. Yeah, when the tier one areas play out, costs to maintain will be prohibitive. Increase? Just a dream.
Efs works at higher prices for average well. Probably needs 85 per barrel for well to payout in 60 months, maybe 90 per barrel for 36 month payout.
Look at EOG’s economics of which wells are “premium” locations. There are not many left, and EOG probably owns the lion’s share. It has to produce 200k barrels the first year. They priced that at $40 oil price, but it makes no difference, because it doesn’t change the number of locations that can generate 200k barrels. They are justifying production to a 5200 ft lateral. Some make significantly more, some less. I have that memorized, as my wells have proven from the 125k to 175k the first year. Probably, a 250k to 300k EUR. So, I have to wait. They will be venturing into my area sometime before their “premium” locations are depleted. Beginning of the year, that count was at 2300. About 10 years at their current drilling rate, and less if they pick up activity. These are developmental wells, the Permian is still largely exploratory.
As far as holdings go, EOG is the cream of the crop. So, you can’t make averages based on one company. Most look far, far worse. Their financial info was shit before, as were all the rest. Setting a bar for where to drill, will, in all likelihood, make them much better. There are a large number of smaller companies who still complete wells in tier three acreage. It’s amazing, they know what they will get. I see initial production at 500 barrels a day, or less, and I know that someone is losing money.
But a big overview gives:
http://www.rrc.state.tx.us/media/47629/wells-monitored-0818.pdf
From completions of close to 15k oil wells in 2017 and 2018.
http://www.rrc.state.tx.us/media/43382/ogdc1217.pdf
http://www.rrc.state.tx.us/media/47577/ogdc0818.pdf
Now, do the math. There is not 10 years, or in most cases even five years of economically recoverable oil from shale. A 60 month payback???? At the highest bracket, it includes wells with about 3000 barrels a month. And there are only about 10k of those. Less than 3 years of completions. And if you look at the total number of producing wells it is slightly less now than in 2014. So, what happened to them??! To make it clearer, the number of wells that has become inactive is pretty close to the number of wells that has been drilled in four years. Yeah, production is up, because the wells producing over 3000 a month is up. But applying a ten year, or even five year economic life to them is pretty stupid. But, I don’t have to look at total numbers to get to that conclusion, I look at individual wells, or groups of wells in a lease. It’s a lot steeper treadmill than the hoopla indicates. Here’s the count from Dec 2014. Shale wells will probably not drop down into the last category, so just look at the first two to compare them to current. If they do drop into the last category, the production doesn’t mean much to the cost of the well, or profitability. About four thousand more, and tens of thousands of new wells since then.
http://www.rrc.state.tx.us/media/26405/welldistribution1214.pdf
So, think about this when your looking at Eno’s data, averages are deceiving. Whether they are tier one, two, or three makes a huge difference.
What are the operators doing with all of these inactive wells?
Are they able to keep them shut in or do they have to produce or plug within a certain amount of time.
The financial liability for all of these wells is huge.
700 wells x $250K per well to P&A? In just Karnes Co.
The links to the report show plugging activity. Substantial. In August EF had 120 oil completions, and 50 something oil wells plugged. Completions were higher in August. Dec 2017, oil wells completed and plugged were almost equal. That is not an exact description of EF horizontals, but that is the main thing going in these districts. $250 sounds low, I think.
I was assuming $250K net of salvage.
I assume given all the activity in PB, a lot of those 640’s, etc, might be traveling from EF to PB.
Maybe those guys P & A this stuff are making the real money?
Guym,
The average is just that some wells will be better than average and some will be worse, t has always been so.
I am not going to run the numbers on 1000 individual wells, only on the average well. I am giving the numbers for the average well.
For the 2016 average EFS well cumulative output at 60 months is projected at 182 kb, not that I did not suggest such wells pay out at $40/b at the wellhead, but $80/b will probably work.
Shallow, FTR, last thread: my current est. economic limits of 15-18 BOPD for LTO wells will be much higher for major integrated companies, yes. The everything is peachy ‘assumption’ is that smaller companies will buy those wells and carry on. I do not believe that. A 6-10% decline in total UR because of premature economic limits IS a big deal. It makes or breaks thousands of wells.
The liquids rich gas leg of DeWitt and Karnes Counties IMO will see <35% of its wells be 'significantly' profitable, for instance above 150 ROI. Your data you are showing is a big deal that seems to be going plum over peoples heads. Sorry. Time will show that the Eagle Ford was, is the biggest financial toilet of all three shale basins; the economics are indeed awful. I operate conventional production IN the EF trend and have interest in wells. Folks don't realize how many $10-12MM dollar wells were drilled from 2009-2013. Jeff Brown and I guessed eight years ago only 35-40% of shale oil wells in the EF will even pay back D&C&A costs. I think that is way too high now.
Whatever the definition of "works," means, Dennis, for the EF; newer well designs are leading to much higher IP180-360, but not higher UR. It does not look that way to me. Now new wells in the EF must carry the burden of the highest level of legacy debt in the LTO industry. To maintain and actually pay that debt back will take much higher oil prices than you think as the play is now pretty much exhausted. At current oil prices it takes 325-350K BO to pay new wells with longer laterals and much bigger frac's out.
The LTO industry is not in business so people can speculate about how much oil it is going to make, or the jobs it provides, or how much cheaper gasoline it can provide for consumers
https://www.oilystuffblog.com/single-post/2018/09/12/Cartoon-Of-the-Week; its in business to MAKE money. 150 ROI's is not making sufficient money to be self sustainable and be able to kick the credit/debt addiction.
Longhorn is correct, Matador did indeed pay $95K an acre for PMNM acreage. I suggest we bow our heads and honor its shareholders with a moment of silence and a little prayer to the Goddess of Wolfcamp in order that she be merciful. Another bench Matador is touting to justify its “wisdom” is the (De) Cline shale interval. Phftttttt.
The irony is that the majors and large independents divested of many assets in the US lower 48 in the 1990s because they were perceived as high cost with little economic future.
However, folks like us are still producing that stuff profitably.
OTOH the same companies are now spending large sums on shale, which is economically inferior to what they divested 20-30 years ago.
Since when did big oil ever have a plan?
Cline is the deepest layer of the Wolfcamp zone, and I thought they had pretty much given up on that one as a profitable area. At least that was my understanding.
Cline is not Wolfcamp. Its Pennsylvanian
My bad. They refer to it as the Wolfcamp D zone, so I assumed it was Wolfcamp.
It was popular print about the time the Pearsall Shale was being touted as the next best thing. Lot of initial production with the Pearsall, but it clogged up quickly. Technology is not there, yet. I have no idea of the results from the 2013 hoopla on Cline shale, but it obviously had some problems, as you can find little on the Internet, anymore.
Mike,
I agree at current oil prices EFS does not work, if oil prices rise it will.
So we agree in the first case. In the second case you think oil prices will not rise, I disagree. End of story.
Dennis, you must read more carefully; I wrote at $85 the Eagle Ford still won’t work and I have never said that prices will not rise. They will rise, maybe on Monday, then they will fall again, probably by Thursday. I am just not in the business of making lofty predictions I have to qualify all the time. I HAVE written that the world is burdened by massive amounts of unmanageable debt that will affect oil demand and shoot a big hole in your supply/demand theories. End of story.
The Eagle Ford has not “worked” in 10 years; six of those years at the highest, sustained oil prices in history.
I’m in Mike’s camp. To be a good investment, oil prices would have to go really high.
Oil companies have to compete with all other potential investments to attract money. Any thinking lender or investor would look at decline rates and realize that the amount of time available to recover upfront expenses is limited. Unlike some companies, there’s no growth potential. An oil well that declines relatively quickly is not an asset likely to increase in value over time.
In the past, an oil investor could hope to put money up for a relatively inexpensive well and have it pay out for decades. Now that well is much more expensive and the significant payout may only last for a few years.
Maybe buying land on the cheap and selling it later on at a much higher price might be a good investment. But drilling on that land, with the expenses that entails, doesn’t look so good.
Boomer,
Much depends on the oil price. The oil industry always has and always will be a risky investment. If done right the rewards can be high, but as in many high reward businesses risk is also high. The price of oil must be high enough to allow the potential for that high reward, otherwise you are correct nobody will be willing to take on that risk and oil will be scarce (low production will reduce supply), that in turn will tend to increase the oil price as consumers will bid the price up.
I’m not confident that the high rewards will ever be there again.
I suppose if one invests in a company capable of outlasting nearly all the others and ends up with a near monopoly on oil, then there might be the potential for high rewards.
But as long as oil prices can be driven down by competition, I don’t see the potential for high rewards on a depleting asset.
Boomer II,
Perhaps you are confident either that oil will easily be replaced or that oil won’t reach a peak in output in the near term (next 5 to 7 years). I don’t believe either of those will be true and thus oil prices will rise substantially over the next 5 to 7 years (possibly to $150/b in 2017$ by 2028).
If I am correct, a lot of current tight oil production will be quite profitable. Note that my Permian scenario that I presented elsewhere has oil prices rising to no more than $114/b in 2017$ by 2027 and then remaining at that level until 2045 and then decreasing gradually after 2045 (I assume EVs will replace a lot of oil use by then and consumption of oil will decrease faster than the decrease in output due to depletion.)
My expectation is that the cost of getting oil out of the ground will go up. So even though companies can sell it for more, their margins won’t improve.
There will be better investments than oil companies.
Hi Boomer II,
Doubtful that cost to produce will rise more than the rise in revenue as oil prices rise in my opinion, at least while the rate of growth in consumption exceeds the rate of growth in output.
If in the long term oil is not profitable to produce, it will not be produced, market dynamics will tend to push price to a level where oil can be produced at a profit for the most expensive barrel produced (though that most expensive barrel will be barely profitable or it will not be produced).
Perhaps you believe there will be some mechanism (permanent recession maybe) that will keep demand matched with supply. I think the mechanism will be higher oil prices and they will need to be high enough so that demand falls and supply rises so that they match over the long term ( as inventory draws cannot be unlimited as the inventory is limited).
What I am suggesting is that although oil prices may rise, and may rise enough to generate a profit for companies still operating, oil companies may no longer be considered a potential high reward investment. I say this because it is increasingly more expensive to generate oil, and assets constantly deplete.
If an investor or lender looks at every possible place to put money, I foresee oil companies will never again be perceived as having the potential to be high reward companies.
My point is that I’m not confident investors will consider oil companies to be high risk/high reward in comparison to other industries where there is the potential for both less risk and even higher rewards.
Boomer II,
You may be right. Much depends upon the price of oil, eventually oil will be replaced, but for the next 20 years it will remain a viable industry in my view. Then it may fade away over the following 20 years and attracting capital may be difficult.
Here are industries with the best return on equity. I just can’t foresee oil companies ever making this list in the future.
https://csimarket.com/screening/index.php?s=roe
Here are some high privately held ROE industries.
https://www.forbes.com/sites/sageworks/2017/11/05/these-types-of-businesses-have-the-highest-returns/#30b4b91e8a52
This is the best ROE list.
It’s very comprehensive and has a 2018 date.
Return on Equity by Sector (US)
http://pages.stern.nyu.edu/~adamodar/New_Home_Page/datafile/roe.html
Hi Mike,
Perhaps the Eagle Ford will never be profitable, it will depend on the price of oil and many other factors.
I guess I have a little more faith in the oil industry than you.
EOG has produced a fair amount of oil in the Eagle Ford and their net income in 2014 (when oil prices were high) was $2.9 billion, about 178 kb/d of C+C was produced from Eagle Ford in 2014 (about 65 million barrels) by EOG (about 62% of total 2014 EOG C+C output). The average price for C+C in the US received by EOG was about $93/b in 2014.
So it seems in 2014, for a well run oil company, $93/b worked just fine. Over the period from 2010 to 2014 EOG’s net income was about $6 billion. From 2010 to 2017, the total net income was about $2.6 billion (not adjusted for inflation) as 2015 and 2016 were bad years with 5 billion losses in net income.
Debt to assets at the end of 2017 was about 21% with debt at $6.4 billion and assets at $29.8 billion. In 2017 Eagle Ford output was about 47% of EOG’s C+C output, the average oil price EOG received in the US was $50.91/b in 2017, about $600 million of long term debt was paid off in 2017 with no new long term debt issued, but net cash flow was negative $766 million.
A discounted cash flow at a 10% annual discount rate results in a breakeven oil price (10% annual ROI) of $90.3/b for the average 2016 Eagle Ford well, if we assume a well cost of 9 million. Note that this is a “real” discount rate as I do costs in real inflation adjusted dollars, so it is equivalent to a nominal discount rate of 12.5% so would be equivalent to a nominal annual ROI of 12.5%.
EUR is 238 kb over 13.8 years and the well is shut in at 10 b/d. An assumption of 15 b/d shut in reduces EUR to 220 kb and well life to 9.75 years, and breakeven oil price rises to $91/b, an increase of 70 cents per barrel. Well payout is in 46 months at $91/b.
What is the full cost of the average Eagle Ford well?
Note that I have assumed zero revenue from natural gas or NGL in my breakeven analysis and am considering C+C output only, not sure if there are natural gas pipeline bottlenecks in the EFS as there seems to be in the Permian basin. In any case, the economics might be slightly better when natural gas is included.
Shallow Sand,
There wasn’t significant drilling in the Eagle Ford Shale until 2011. How many of the 700 inactive wells started producing in 2009 and 2010? By Enno Peters data using Eagle Ford and unknown wells in Karnes County from Jan 2011 to Dec 2016, I get 2487 horizontal wells completed in total over that period. Note that the productivity rate distribution at Enno’s site gives some funky numbers at the low end, so they should probably be ignored. “Zero” output after 24 months should probably be less than 15 b/d after 24 months. For Eagle Ford 2014 wells, supposedly there are 1747 wells with zero production rate after 24 months out of 3962 total wells, this is just a programming error. That is, zero does not mean zero in this case, would be my guess.
I checked with Enno Peters on this and the lowest column means output at 24 months is 0 to 50 b/d, same is true for each column it is from the previous to the next label so 0-50, 50-100, etc.
Shallow sand,
You said:
Could over 20% of the horizontal wells in Karnes Co., TX already be shut in for over one year? These wells first produced 1/1/2019 to 12/31/2016, so they are not old wells at all? Less than 10 year economic life?
No the wells have not been shut in as you think, for 2009 to 2016 wells in Karnes county and Eagle Ford Formation I get 763 wells with “zero” production rate at Enno’s site. He has pointed out that this is really 0 to 50 bopd for those 763 wells out of a total of 2425 wells producing that started production from 2009 to 2016. The average production rate was 86 bopd for all of the Karnes county Eagle Ford formation wells.
For all counties there were 15,600 wells with 7754 wells with output at 0 to 50 bopd at 24 months. Average for all counties is 63 bopd at 24 months. At 12 months the average rate was 127 bopd for all counties with about 25% of the wells at 0 to 50 bopd at 12 months.
Dennis:
I am using a subscription service and entering the parameters I mention in the post. I will run it again and maybe mention a few wells so we can look at them and see what is going on.
EDIT 1:
Ok, I ran a search of inactive wells operated by EOG in Karnes Co., TX. I come up with the following:
Vickers 2H
Milton Unit 1, 1H, 3H, 10H, 11H and 12H
Harper Unit 1H, 2H, 3H, 4H, 8H and 10H
Lyssy Unit 4H, 5H and 6H
Benyon Unit 1H
Orr Unit 1H, 2H, 3H, 4H and 5H
Dulling Unit 3H and 4H
Fischer Unit 3H, 4H and 6H
Rainbank East Unit 1H
Greenlaw Unit 5H
Cheslyn Unit 3H
It could be the well names have been changed, and this is why they are showing as inactive on the site I am looking at?
I try to weed out these issues, but maybe there is something I am missing.
Maybe take a look at these, or at least a few of them, and let me know what you think.
EDIT 2:
Ok, I think I see what is happening. For some reason, on several of these wells, the lease number was changed. On the subscription service, this causes there to be two listings for the well, the first with the old lease number, and the second with the new (current) lease number. The production histories for the two must then be added together.
There are some wells that are only listed once, and I assume those are, in fact, inactive.
However, most are listed twice, and therefore you are correct, there are not nearly that many shut in wells in the EFS. There are some, but much smaller number than I surmised above.
I will leave this work to Enno, I am sure he has figured out a way to follow wells when the lease numbers change. I wonder why this happens? Could be several explanations, I suppose.
Also, gives me a good reason to just stick with shaleprofile.com, as it appears to be more accurate than the site I am paying for, at least with regard to TX issues.
Thanks Shallow Sand,
I thought you had dumped the subscription service and were using shaleprofile. Note that when shaleprofile has the production rate at “zero”, it really means “zero to 50 bopd”. I confirmed this with Enno Peters.
I don’t have access to a subscription service and find the RRC website difficult to navigate for individual leases, and often there are multiple wells on a lease which makes tracking individual wells pretty tricky. My guess is the wells that are being plugged are mostly older wells that were completed in 2010 or earlier, some may be more recent wells that are in the bottom 10% of the cumulative output for wells completed from 2011 to 2015, I imagine any wells that get to 5 b/d or less might get plugged if they need high cost downhole maintenance.
Probably the more important item is Russian reserves…my estimate is we are at 90% depletion for existing technology and OIP at cost for western Russian reserves. At this point a squeeze plan in Syria would ensure foreign reserve earnings to into wars and not fuels…outcome is standard wars as a result of miss spending income…
Yes, I assume they have some problems since they reformed the tax system in favor of upstream risky projects and at the same time imposed more taxes on downstream refineries. But to assume Russia has problems is like assuming the whole world has a problem. Could be perfectly right, but why expose Russia as opposed to others? Russia has a lot of higher cost oil; just look at the land mass and offshore mass. How could there not be prospects? Some inside knowledge is sorely lacking, since I like most western people don’t have connections in that part of the world.
https://medium.com/insurge-intelligence/brace-for-the-financial-crash-of-2018-b2f81f85686b
only way to ‘pull off above’ is both Russia western province and gehwar at “90%” OIP gone.
Thanks for the link Conacher. Folks this article makes a prediction that needs to be read.
Brace for the oil, food and financial crash of 2018
80% of the world’s oil has peaked, and the resulting oil crunch will flatten the economy.
New scientific research suggests that the world faces an imminent oil crunch, which will trigger another financial crisis.
A report by HSBC shows that contrary to the commonplace narrative in the industry, even amidst the glut of unconventional oil and gas, the vast bulk of the world’s oil production has already peaked and is now in decline; while European government scientists show that the value of energy produced by oil has declined by half within just the first 15 years of the 21st century.
The upshot? Welcome to a new age of permanent economic recession driven by ongoing dependence on dirty, expensive, difficult oil… unless we choose a fundamentally different path.
Then they say:The HSBC report you need to read, now
Global Oil Supply, Will Mature Field Declines Drive Next Supply Crunch?
This thing came out two years ago. Why did I not hear about it before? Has this been posted here and talked about already?
Real issue is giants, your article in 2015…real issue is 90% ..real issue is squeeze play in motion in Syria..goal? if don’t have it, don’t drill it at home, no rig increases so ‘end game’ is cut off Isreali/Saudi friendly arab gas to Europe…own Caspian area (city I recall owned by Ukraine under British treaty Yelsin)…in end no WW2 buildup during economic issues (Russia 5M/day, Saudi similar)…no Hilter, just preempt what’s left..
Yes, it was. Here:
http://peakoilbarrel.com/open-thread-petroleum-jan-8-2017/#comment-591795
Here:
http://peakoilbarrel.com/opec-december-production-data/#comment-593747
And here:
http://peakoilbarrel.com/texas-update-january2017/#comment-594346
I downloaded it then, and just had to look at the date the file was created. You probably also have it in your hard-drive.
It provided a nice confirmation to my thesis that Peak Oil won’t happen in the future. It is taking place now, and the date we entered the Peak Oil plateau was 2015. You also forecasted that, as I did.
You are correct. Hey, I am 80 years old and I just can’t remember shit anymore.
Okay, I posted a few days ago that I thought peak oil would be in 2019. Perhaps I was wrong. Hell, I have been wrong quite a few times. But now perhaps peak oil is right now.
Perhaps? We shall see.
But my point is everyone seems to be agreeing with me now. Old giant fields are seeing an ever increase in decline rates. I predicted this a long time ago. Once the water hits those horizontal laterals at the very top of the reservoir, the game is over.
The decline rate in those old giant fields is increasing at an alarming rate. Obviously! Fucking obviously. It could not possibly be otherwise. Thank you and goodnight.
Memory is less necessary these days with internet, computers, and smart phones, where searches can be run in a moment. Don’t worry too much about that.
I discovered your blog in 2014 when looking for confirmation on my suspicion that the oil price crash was going to result in Peak Oil. I was impressed to see that you were there years before through your analyses. I have a lot of respect for you and your intellectual capacity, and I agree with you in many things, besides Peak Oil, including the population problem, and your worries about the environment.
I don’t believe the world cannot increase its oil production, I just believe it won’t do it. Both Saudi Arabia and Russia have the capacity to go full throttle on what they have left. Shaybah is the most recent supergiant in KSA and expected to produce until 2060 at current output. No doubt they could increase production from Shaybah by a lot, but it is not in their interest to do so. Russia lacks the capacity to quickly increase its production, but there’s still plenty of oil in Eastern Siberia, so they could also produce more. Again it is also unlikely, as it would require an investment and effort that goes against their own interest.
Peak Oil is not happening because the world is trying to produce more oil and failing, it is happening by a combination of economical, geological, and political factors that could not be easily predicted and that were set in motion in the early 2000’s when the low-hanging fruit of conventional on-shore and off-shore crude oil (the cheapest kind to produce) reached its production limit. Political errors, like taking out Gaddafi, added unnecessary difficulties. The collapse of Venezuela is the latest political cause. And when things start to go wrong, it never rains, but it pours.
“Peak Oil is not happening because the world is trying to produce more oil and failing, it is happening by a combination of economical, geological, and political factors that could not be easily predicted and that were set in motion in the early 2000’s when the low-hanging fruit of conventional on-shore and off-shore crude oil (the cheapest kind to produce) reached its production limit.”
Isn’t this just a distinction without a difference? It’s peak oil.
The issue is that Peak Oil has been misunderstood by most people. The argument that Peak Oil won’t happen until this or that date because ultimate reserves are such or such, so often read in this forum, is incorrect. Even economically recoverable reserves are not decisive. To make the problem intractable there are many liquids so some might peak while others don’t so discussions about Peak Oil are endless.
But it is very simple. Peak Oil is when the world no longer gets the oil it needs to keep expanding its economy. And the best way to measure it is through C+C, because crude oil is what we have been getting since the late 19th C ans is the stuff that produces everything our economy needs, from asphalt to diesel, plane fuel, and gasoline. NGL won’t cut it. Biofuels won’t cut it.
And Peak Oil is being determined by economical and political factors, besides the geology.
The difference matters because Peak Oil is going to get almost everybody by surprise. Most won’t realize what is the cause of all the troubles we are going to get and they’ll be reassured that there is plenty of oil to be extracted, which is true but irrelevant.
Thanks for the reply. I also tremble at the prospect of what is to happen because of the failure of the predictions last decade. I can only describe it through an analogy (being a lay reader and a writer):
In the 2000s, people were saying that we had an ugly wound and that we had better do something about it. But instead of properly addressing the wound, we just wrapped it in gauze, and when the blood stopped showing through, we said, “See? All better.” That’s my analogy for the “shale revolution” — it was essentially a Bandaid. The complacency has only worsened in the last ten years.
This has just made the infection all the worse. When pus starts showing through the dressing and we unwrap it this time — we’re going to find gangrene.
Michael,
I am re-reading Joseph Tainter’s 1998 book “The collapse of complex societies.” It is a sober reading that shows that in the end the laws of entropy and diminishing returns always produce the same result. We are not more intelligent than the people that preceded us. If anything we can only be stupider on average. We just have a very high opinion of ourselves.
Time for a wake up and a little bit more darwinism in our lives. The problem is the pain. With so many people it is just going to be unbearable. On a scale never imagined, not even by writers of bad sci-fi.
That would be a more important definition of peak oil to me, and I think we are definitely there. Then we have the absolute production definition, which was the original definition, as to production. It is now anticlimactic to your definition. As to the date or year it happens, who cares? More importantly, now, is when demand will lower enough to stop draining inventories. At what oil price will that start occurring? How fast will alternate sources replace unmet demand? New directions and everyone is likely to be wrong on estimates. EIA and IEA were totally useless before, and that will probably not change in the near future. Looking in the past won’t give us much, and the future is anybody’s guess.
As to current prices, $68 oil won’t get any extra interest from E&Ps outside of the Permian that is stalled. To any measurable extent. Close to $80 oil is not expanding interest very much outside of the US. We are just living on borrowed time.
Guym,
Oil prices are likely to continue to rise, especially if your estimates of future production (roughly similar to my estimates, but perhaps a bit more pessimistic) are correct, unless consumption of oil stops increasing. My guess is that oil (C+C) consumption will continue to increase at 400 to 800 kb/d each year , until oil prices get to about $150/b or more (around 2025 to 2027),by that time or soon after ( maybe 2030) oil consumption growth may stop either because of the expansion of electric and natural gas powered transport or because of a second Great Financial Crisis. My hope is it will be the former, but I think the latter scenario is much more likely.
Hopefully Keynes’ General Theory will make a comeback before then.
It is a dollar on Kindle
https://www.amazon.com/General-Theory-Employment-Interest-Illustrated-ebook/dp/B018055I7Q/ref=tmm_kin_swatch_0?_encoding=UTF8&qid=&sr=
Ron Wrote:
“I predicted this a long time ago. Once the water hits those horizontal laterals at the very top of the reservoir, the game is over. ”
FWIW: That’s already happened. when it occurs, they drill a new horizontal above the old one. The new lateral also have valves on there ports. so that when the water breaches one or more of the ports, they shut them off to reduce water cut. I posted Saudi Aramco tech articles here back between 2014 and 2016 when they were available on the SA website.
Hi Carlos, thanks for the trip down memory lane. I tend to agree with peak oil being now (ish). From what I recall the peak month for C+C was, so far, in November 2016. I suppose there is also a peak day, a peak weak, and a peak year. Folks seem to like packaging time in various proportions. Hell, there’s probably a peak decade and a peak hour. My guess is the peak year will be 2018. I like, because I’m a bit thick at maths, how Ron has added trailing 12 month average to his world production chart. I just look at the 12 month trailing average for each December to get an idea of how much was produced in each calendar year. It seems that 12 month trailing average for December 2018 will beat that of 2017. My guess is 2019 won’t beat 2018. Or will any other year after that. So, if Ron say’s 2019, and I say 2018, then it seems that I think he is wrong lol he’s probably 100 times smarter than me so doesn’t lose sleep over it lol. Up until this time I have always agreed with Ron on peak oil. But now, I throw down the gauntlet! 2018 vs 2019. Two will enter, one will leave.
Hi Survivalist,
The exact week, month, or year when maximal production is reached has only historical interest. The point is that since the end of 2015 the 12-month averaged C+C production has barely increased (EIA data) despite the increase in demand.
Dec 2015 80,564 100.0%
Dec 2016 80,579 100.0%
Dec 2017 80,936 100.5%
Apr 2018 81,363 101.0%
We will have to see how it evolves over to the next December, but so far it is annualized to a 0.4% increase. To me we are in a bumpy plateau since late 2015 and all those meager gains and more will be lost in the next crisis. The problem will be evident to many when after the crisis we are not able to increase production above those values.
Peak Oil is a situation, not a date, and we are in that situation since late 2015. The oil that the world demands cannot be produced so prices are going up, and up. I suppose it is possible that the powers that be intervene to reduce global oil demand by favoring a crisis in developing countries, like Argentina, Brazil, Turkey, South Africa, through interest rate changes. Wait, it is already happening. It is a dangerous tactic, as crises can spread around, and the interest rise weakens the economy.
Carlos,
Well one has to define the plateau a bit better. If we make the bounds wide enough one could say the peak was 2005 or even 1980 and we have been on a bumpy plateau since that point.
Better in my view to define peak as peak in centered 12 month average output wth center between month 6 and 7.
Dennis,
I use a 13-month centered average, so it is symmetrical with 6 months at each side.
But really, after a clear period of production growth 2010-2014, there was a strong growth in production 2014-2015 in response to falling prices, and then production got stuck in late 2015.
It is not a question if we are in a plateau (or very reduced growth) period, but what happens afterwards. After the previous plateau 2005-2009 there was a clear fall 2009-2010, before tight oil saved the day.
Carlos,
The recent plateau is due to excess inventory and the resulting low oil price level. Oil inventories have been reduced over the past 12 to 18 months and as oil prices increase, output will also increase with perhaps a 6 to 12 month lag. How much will it need to rise above the Dec 2015 level before you no longer consider that output has not risen above your “plateau”. Give me a number, is it 81.5 Mb/d, 82 Mb/b, I prefer to use a year rather than 13 months, that’s 182 days on either side of the middle of the 12 month period. On leap years we can use Midnight of day 183 🙂
One issue that has been corrected is that reserve requirements for large banks have increased.
Also lenders are more careful with their mortgages making a housing bubble less likely.
In addition, the assumption that higher oil prices played a major role in the GFC is incorrect.
Perhaps there is a looming recession, whether this happens in 2018, 2030 or some other year we will only know when it occurs.
Someone who predicts a recession every year will be right eventually.
I maintain my guess of 2023 to 2027 for the 12 month centered average c+c peak and severe recession GFC2 starting 2029 to 2033, lasting 5 to 7 years.
If the projections done by Tony Seba in his 2014 book “Clean Disruption of Energy and Transportation: How Silicon Valley Will Make Oil, Nuclear, Natural Gas, Coal, Electric Utilities and Conventional Cars Obsolete by 2030” and updated in subsequent presentation based on the book are correct, after 2025 there is very little chance that any recession will be driven by energy scarcity. According to Seba, by 2025 new solar PV capacity will represent most new electricity generating capacity worldwide, with fossil fuels increasingly being sidelined. A couple posts further down, I alluded to the transportation issues.
Islandboy,
I hope Seba is correct. The realist in me says he is off by 10 to 20 years.
Maybe optimistic me will be right, but I am skeptical.
“In addition, the assumption that higher oil prices played a major role in the GFC is incorrect.” ~ DC
Hi Dennis, I’m interested to see how $148/barrel goes the next time. What with all the debt and all. How do you envision the recovery from the 2029-2033’ish recession taking place in a post peak oil economy, any hot tips on how economic re-expansion will be achieved in an scenario perhaps highlighted by growing awareness of decreasing net energy flows through human civilizations? Or perhaps you reject the basis of my question, and anticipate expanding net energy flows from non oil sources? Will natural gas save the day (I’m actually asking because I don’t know. I’m not trying to be rhetorical)?
There will be a move to higher net energy resources such as wind and solar, they will be cheaper than fossil fuels and will gradually replace them especially for electricity generation.
Perhaps an HVDC grid will also be installed along with light rail and electic rail, more EVs, plugin hybrids, and smaller ICEVs.
The building of all this stuff creates economic activity.
Maybe policy makers will see the end of fossil fuel dominance and will adopt appropriate policy for a transition.
We can hope.
That’s just an opinion. The increase in oil prices causes inflation that is fought through a rise in interest rates causing the subprime mortgage crisis that cascaded into the GFC due to the high exposure of certain financial institutions.
Here you have the relationship you so vehemently deny:
http://3.bp.blogspot.com/-xSoIMfffP30/TeZB3pO47BI/AAAAAAAAC0w/i4ORyt_SCLI/s1600/Real%2BOil%2Band%2BReal%2BInterest.jpg
Carlos,
It is an opinion either way.
The GFC was due to the housing bubble and poor regulation of the financial industry.
High oil prices were at most a minor factor, high oil prices from 2011 to 2014 with 3% World real GDP growth is evidence supporting my view.
Dennis, you are not looking at the whole picture, as I have already told you, so you don’t understand much.
Economic crises take place with or without oil shocks, because the business cycle takes place anyway even when oil supply is adequate. It is Keynes animal spirits giving place to boom/bust cycles.
The 2008 crisis would have taken place anyway as imbalances were growing in the system. But the responsible factor for it taking place in 2008 was the increase in oil prices which caused the increase in interest rates that brought down the entire house of cards. Had interest rates grow more slowly the crisis would have taken place later. So it was not a minor factor.
The economy has three legs. Energy, labor, and finance. Or to limit it further: oil, demography, and credit. If two are strong the economy can resist despite the third being weak. During the 2011-2014 period China brought its strong demography and credit expansion capacity to the global economy, so high oil prices were resisted by several countries, while for other countries with the other two legs weak it was a disaster. The EU was close to imploding between 2010 and 2012.
The situation has changed. Chinese demography has turned and will face increasing head winds and it is now the fastest ageing country in the world. And China’s gross debt to GDP has become very high, 257% in 2017, and over 300% now.
https://nationalinterest.org/blog/the-buzz/scary-statistic-chinas-debt-gdp-ratio-reached-257-percent-22824
https://www.forbes.com/sites/douglasbulloch/2018/05/31/while-china-is-facing-its-own-debt-crisis-it-is-also-exacerbating-others/#189636443fc3
China will not be part of the solution this time, as it was in 2008. It will be part of the problem.
So your opinion that high oil prices are acceptable to the global economy is worthless. Much of the world faces awful demographic prospects, including China. And the world has a huge debt problem that makes further credit expansion very problematic. Africa has an expansive demography and is not as deeply indebted as other parts of the world, but it doesn’t have the right conditions. Its workforce is completely untrained and uneducated, most political systems are terribly corrupt with no law assurance, and has a terrible credit history.
I have told you before and you just don’t get it. The global economy cannot resist +$100/barrel oil price for years this time around. It is anybody’s guess at what price the global economy will give up, but I am pretty sure we are going to find out. Remember my words so you are not surprised.
Carlos,
As I have said before I do not agree with your analysis. The GFC would have occurred without the increase in oil prices, it was a minor factor.
China has plenty of ability to continue expanding, as does India. Europe did poorly in recovering from the GFC because individual nations in the Eurozone have little control over monetary policy and many Eurozone nations chose fiscal austerity in the face of an economic crisis, exactly the wrong economic policy.
Chart below uses an oil output scenario where oil (C+C)consumption peaks at 86 Mb/d in 2027 and falls to 85.6 Mb/d by 2030, World real GDP is assumed to grow at 3%/year from 2018-2020 (similar to World Bank and IMF estimates) and at 2% per year from 2021 to 2030.
The percentage of World GDP spent on C+C output on left axis and real Brent oil prices (2010$) per barrel (and scenario from 2018 to 2030) are on right axis.
Note the chart below was mislabeled for real oil prices which are in 2010$, not 2017$.
>Firstly, oil price spikes would have an immediate recessionary effect on the global economy, by amplifying inflation and leading to higher costs for social activity at all levels, driven by the higher underlying energy costs.
Heh, central banks all over the world have been setting zero or even negative nominal interest rates for nearly a decade and this guy panics about a price increase for a commodity with a small share of the world economy is going to cause inflation.
These people really are stuck in the 70s.
A recession is going to come as the article suggests, and I am going to stick out my head and guess 2019 and definitly late 2019 into 2020. But then again, noone is supposed to know when that will happen. To assume that it will be permanent is too much doomer theory for my liking. I much more believe we will have have credit/business cycles with more downside and adoption to a world with less oil will happen during the down cycles. A world without low interest rates and stability to insure aboundance of investments is not desirable, so I rather think Watcher has some points after all. There could be consumption restrictions like in 70s, to keep oil prices from increasing too much. A black market would eventually doom such an arragement though imo. Oil will be priced high, but I don’t think it is going to be the end of the world until energy/capita drops too much…and that is far ahead still.
I guess you don’t understand. Credit + interests can only be repaid in an economy that expands. In an economy in prolonged contraction credit is only given against guaranties that will result in a transfer of property, as it happened in the Middle Ages. And all the paper wealth, derivatives, and so on becomes absolutely worthless as the derivatives time bomb explodes. The run for the exit in paper wealth will create the biggest inflation known in most countries triggering a global currency crisis.
We’ll see what happens afterwards, or maybe we won’t as we might become casualties of the mayhem.
I think there is a flawed assumption in all these lines of argument. That assumption is that in 2008 the world economy is still as desperately dependent on oil as it was in 2008, The flaw in that assumtion is that this time, as oil prices rise there are some alternatives, albeit limited. In 2008 EVs made up 0% of the new car markets anywhere in the world and any plug in vehicles that existed were either one off, custom conversion jobs or leftovers from the zero emissions mandate of the 90s in California. Currently most recent data from my favorite EV news web site insideevs.com indicates, Plug-In Electric Car Market Share In UK Surges Above 4% In August 2018 and 2018 July US Plug-In Electric Car Sales Charted: Market Share Exceeds 2%. From the same web site, an article headlined Norway Sees Minor Decrease In Plug-In Electric Car Sales In July states that “After the first seven months of the year, 39,504 new passenger plug-in cars were registered (up 26.8%) at an average market share of 45.7%”. Norway had a market share for plug-in vehicles at about 25% in 2016.
The 2% market share in the US is being primarily driven by the Tesla Model 3 with insideevs.com reporting that Tesla Production At 6,700 In Last 7 Days? Turning Towards 8,000/Week. For the month of August the Tesla Model 3 Breaks Into Top 5 Best-Selling Passenger Cars In U.S.. Tesla’s target for 2019 is more than 10,000 vehicles a week, more than half a million for the year. Now while I fully acknowledge that these numbers are tiny compared to the 18 million new vehicles sold in the US each year, there is the effect that Tesla is having on the market. Tesla has been stealing and will increasingly steal car sales from other manufacturers where it hurts most, their most profitable models, spurring other manufacturers to introduce their own battery electric offerings.
There is also the fact that in the US light trucks and the SUVs based on them are outselling cars. Manufacturers should take no comfort in that since Tesla and other start-ups have their eyes focused on that market as well.
There is also a very different situation in the bus and heavy goods vehicle market with Tesla again promising to disrupt the market with their battery electric Semi. This has prompted several major truck manufacturers to announce their own battery powered offerings. There are electric buses beginning to appear in several major western cities, most notable of which is probably London. China, as it is with cars, is forging ahead with the electrification of heavy vehicles, The entire 16,000 plus bus fleet of the city of Shenzen, China is battery electric buses.
The point I am making is that this time is different and if the wizards at the central banks can prevent the economies from collapsing to the point where the companies responsible for these disruptive technologies fail, things could turn out a little different than you all are predicting. In 2008 there were no mass produced alternatives to internal combustion engine powered vehicles.
Recent statistics show a little over 3 million electric vehicles on the road worldwide.
Natgas vehicles are over 26 million.
China and Iran have 10 million with India, Pakistan, Brazil and Argentina adding another 10 million.
Italy over a million.
Interesting numbers on the site NGV Global, especially when correlating adoption with available resource.
Demand for oil may very well be cresting.
We are entering The Age of Gas.
Your most recent statistics are a little outdated. In a comment on the September 5 Open Thread, I linked to an article highlighting that the most recent million plug-in sales took just 6 months to go from 3 to 4 million. That’s how fast things are changing! From the linked article:
According to a report published recently, Bloomberg NEF estimates the global electric vehicle market will this week pass the milestone of 4 million sold to date. While four million vehicles sold in a space of about seven and a half years doesn’t sound impressive at all – and it isn’t – we have to look at the rate of change and the overall increase in sales, not just the absolute numbers, to grasp at how fast the electric car marker is progressing. While size does matter, growth is of the utmost importance for the EV car industry. After all, growth fuels the investments attracts both customer & investor attention, yields accelerated innovation and the introduction of new products. Everything we’ve seen from a similar market in the last decade – the rise of Apple and the fall of Nokia, naturally.
Coffeeguyzz,
What has the growth rate been for NG vehicles for the past 4 years?
No idea.
I just came across that data (and NGV site) when I was researching Iran and MOFs).
I was surprised there were so many as I’d never heard much about them.
The absolute number of cars, trucks, ships and airplanes using oil-derived fuels is still increasing the world over without any sign of slowing down. Moreover, not a single EV or Hybrid has been sold without state subsidies anywhere in the world, ever! Think about that for a minute! As their total sales rise, already heavily indebted governments will find it more and more difficult to keep subsidizing. There are also far more issues with EVs and hybrids that are very well known.
If last years rate of increase of plug-in vehicle sales growth continues, there would be no new ICE’s sold in 2031. The point at which the ICE sales start to diminish is about 2022.
This is why peak oil will not be much of a problem, within a few years the demand for vehicle liquid fuel will start falling and end completely by the early 2040’s as vehicles age out and are finally abandoned for vehicles that are far superior. Any price increase in liquid fuel or shortages will force the rate of EV build even faster.
So yes for the next few years ICE vehicle growth will continue but at a diminishing pace then peak and fall quickly.
Tesla’s subsidies in the US will end Dec 31, 2019. They fall to 3750 on Jan 1, 2019 and to 1875 on Jun 1, 2019 and to zero Jan 1, 2020, these are per vehicle tax rebates in US for Federal taxes.
There may be some state tax incentives that continue, in my state there are no EV tax incentives.
We use more oil, therefore we are more dependent.
A note to all. You can continue to ignore EVs until you can’t. I have chosen to keep a very keen eye on a couple of disruptive technologies, namely solar PV and EVs. In both cases, growth is what might be characterised as explosive. In the case of PV the contribution to US electricity generation has gone up by a factor greater than 100 in just ten years and the doubling time has been around two years in recent times. 2018 will see the contribution from solar above 2%, possibly as high as 2.5%. In either case, it will take less than five doublings for the contribution to be over 50%, so if the contribution from solar were to continue to double every two years, that would be realised by 2028!
To get back on topic and the effect on the demand for oil that will be attributable to EVs , the same source as I used for my earlier post has articles from the 10th and 11th of September with headlines, Nissan LEAF Sales Up 234% In Japan, Plug-In Electric Car Sales Up 245% In Canada In August and Netherlands Enjoys Three-Digit Growth Of Plug-In Car Sales (165%). In markets where subsidies or incentives are in effect, plug-in vehicle sales are growing rapidly and in many cases appear to be supply constrained.
I am quite confident that, barring a black swan event, battery electric vehicles with a range of 200 miles or more, will reach price parity with similar sized conventional vehicles within the next seven years. In the case of Tesla, their Model 3 will be within $5,000 of the Toyota Camry and the Honda Accord in the US by the end of next year, unsubsidised. It is a matter of time before an entry level BEV will cost the same to buy as it’s ICE powered counterpart, while having significantly lower O&M costs. Bear in mind that there have been no significant battery breakthroughs brought to market since the introduction of lithium ion batteries. The cost performance improvements thus far have been a result of incremental improvements of the order of between 14% and 16% a year. Billions of dollars are being spent on battery research, in search of the next big thing. Any breakthroughs will likely be game changing.
Past growth in solar and EVs was heavily influenced by subsidies and incentives. Future growth is likely to be as a result of competitive price/performance. I will continue to track the growth of these technologies very closely.
We use less oil per capita and less oil per unit of real GDP, than in 1980 so perhaps we are less dependent on oil.
I think you are right! World population in 1980 was about 4.46 billion. We are now pushing close to 8 billion.
Not to mention that the world was awash in an oil glut in 1980 and Exxon, despite what its own scientists were saying, was hell bent on denying the consequences of climate change due to the burning of fossil fuels!
Then Reagan became president and removed Carter’s solar panels from the white house.
But times are changing again and we will be leaving all fossil fuels behind! Hopefully much sooner than later!
Cheers!
As someone who is in their early 20s, this is why I chose not to invest any of my income in a 401K (even though my employer offered up to 6% match). The odds of that money being worth anything in the 2060s seems….low. The smarter option, IMO, is to use that extra cash to pay down debt, live well today, and plan for the future by (hopefully, one day) investing in real assets (land, for example).
The smarter option, IMO, is to use that extra cash to pay down debt, live well today, and plan for the future by (hopefully, one day) investing in real assets (land, for example).
Good Luck with that!
.
Baker Hughes rig count
oil: +7 to 867
natural gas: 0 to 186
Permian: -1
Table: https://pbs.twimg.com/media/DnEjZN9X4AAysla.jpg
Baker Hughes GE http://phx.corporate-ir.net/phoenix.zhtml?c=79687&p=irol-reportsother
The Permian seems to have stabilised or is dropping, but the drillers don’t seem to be moving to EF or Bakken, more like to some of the smaller plays. Does that mean the available prospects aren’t as good or that there are similar bottleneck problems as Permian? Bakken set new records for oil and gas this month, but EF looks like it might be entering the end game?
George Kaplan
Efs is not as attractive as Bakken, possibly some increased activity might be seen in Niobrara and SCOOP/STACK as well.
If oil prices rise we may see increased output.
http://www.rrc.state.tx.us/media/44985/own423_20180413_rrc180_feb2018.pdf
http://www.rrc.state.tx.us/media/47108/own423_20180816_rrc180_jun2018.pdf
District 1 and two are the Eagle Ford. Through May it is trending up by approx. 1.5 million a month from January. Some of that is EOG’s Austin Chalk, but they are putting capex into that one vs the EF, because returns are higher in Karnes County. Not the end game yet, but won’t rise substantially in the short run because prices increase. Or, it might. I am noticing a buildup in DUCs recently.
I think (for what it’s worth) that Bakken and EF both have some growrth left, just not as much as many imagine. It’s certainly not going to come close to meet the EIA imagination. But, nothing will for that matter.
Guym,
I agree there may be some growth left in Bakken and Eagle Ford, if oil prices rise.
Note that the EIA’s AEO 2018 has US tight oil rising to 7 Mb/d by 2025 (average for the year), average US tight oil output for the past 12 months has been 5.45 Mb/d and the 12 month average output has risen by 0.75 Mb/d in the past 7 months. So they are predicting a 1.5 Mb/d increase over the next 6.5 years or about 231 kb/d on average each year over that period.
Seems pretty conservative at least in the medium term. I think a faster rise to 7.5 Mb/d by 2024 is possible, but then US tight oil output will decline.
The long term EIA AEO 2018 tight oil forecast has 94 Gb of US tight oil output produced from 2016 to 2050, and there has been about 7 Gb of tight oil produced from 2000 to 2015 for a grand total of 101 Gb of tight oil in their reference scenario. This is likely to be too high by about a factor of 2 in my opinion, their scenario has a plateau at about 8 Mb/d from 2035 to 2050, we might get to 8 Mb/d by 2022, but tight oil output will have declined to 1 Mb/d by 2040 for a 54 Gb high oil price scenario.
Long term, the EIA is much too optimistic, but in the short term (up to 2025) their reference case scenario is conservative in my opinion. The STEO has 2019 output about 1 Mb/d higher than the AEO, and lower 48 (excluding GOM) increases by 2.05 Mb/d from 2017 to 2019. In the first 6 months of 2018 the 12 month average L48 onshore output increased by 700 kb/d, so the STEO may be a pretty good forecast at least on the annual scale, it might be a bit on the conservative side, as the rate of increase of the past 6 months would lead to a 2.8 Mb/d increase if it were to continue for 24 months (I do not expect that it will). Only an annual rate of increase of 900 kb/d over the next 18 months is needed to reach the STEO forecast increase through 2019, this is about 64% of the rate of increase over the past 6 months. Much will depend on future oil prices.
Guym,
I believe I asked this a few months back, but I forget the answer.
What is the average cost for an “average” Eagle Ford well (average lateral length, average amount of proppant, average land cost for an average well (which based on Enno Peters data was about a 240 kb EUR over the life of the average well completed in 2016?
I used $9 million in a recent breakeven calculation, but I remember you quoting something like $7.5 million as a rough guess.
breakeven prices are at the refinery gate, wellhead price is $4/b less (assumed transport cost).
$9 million well is $90.3/b
$8 million well is $82.70/b
$7 million well is $74.40/b
for breakeven oil price with 12.5% nominal annual discount rate.
If we reduce discount rate to 10% annual rate (nominal).
$9 million is $88/b
$8 million is $80.1/b
$7 million is $72.2/b
for breakeven prices where cumulative discounted cash flow over the life of the well is equal to the well cost. For last case of $7 million well at 10% DR, payout is at 51 months.
Yeah, the 7.5 million cost was real wag. EOG can do it cheaper, but they are the exception. EOG has set their drilling determination based on a “premium” well. That is, the well needs to produce 200k barrels the first year at a $40 oil price. Essentially, to keep drilling, the well has to mostly pay back capex the first year to grow internally. Otherwise, you are constantly borrowing to drill the same amount of wells. It’s killing most shale companies. If you have to wait five years to turn a profit, your screwed. In five years, the well is just above dribbling, at best.
Yes it’s about $3.78 million in net revenue (not discounted) at $40/b at the wellhead for the average 2016 EFS well, note that I am not figuring in any revenue for natural gas. Is their adequate natural gas pipeline capacity to move EFS associated gas, in the Permian most of it is being flared, but I am not sure about EFS.
Probably should be added to the breakeven analysis, there’s probably some NGL as well.
Guym,
George made me think a little more about Eagle ford. In past 15 months the trend has been an annual increase in EFS tight oil of 190 kb/d. Of course this could change in the future. I doubt the previous peak will be reached (1620 kb/d in March 2015).
I guess the Permian Basin appears to be the major growth area for shale in US and is expected to be in the future.
I assume many would say 2010-2016 well performance is now irrelevant, given the “technological” advances in shale.
Anyway, this is what I find for horizontal Permian Basin wells with first production 1/1/2010-12/31/2016, including only wells with total measured depth of 10,000’+:
11,164 wells
10,354 with recorded production in last 12 months
810 with no recorded production in last 12 months
4,298 have cumulative oil production of 100,000 BO or LESS
2,384 have cumulative oil production of 200,000 BO or MORE
4,482 have cumulative oil production of 100,001-199,999 BO
Of the 10,354 active wells:
4,805 produced 1,000 BO or LESS in the most recent month
1,762 produced 3,000 BO or MORE in the most recent month
3,787 produced 1,001-2,999 BO in the most recent month
Shallow sand,
2016 average Permian well profile has an EUR of about 257 kb at 60 months and 360 kb at 188 months (at 15 b/d) and 379 kb at 10 bopd at 238 months. this is based on a hyperbolic fit to first 18 months of output with an exponential tail when the decline rate reaches a 9% annual decline rate.
Dennis.
Per shaleprofile.com, in May, 2018, 2,215 Permian Basin wells produced 280,405 BOPD, or 126.59 BOPD. 3,798 BO for a 30 day month, 3,924 BO for a 31 day month. These wells are all the wells with a first flow date in 2016.
Now compare daily flow rates for the following months:
12/16- 168.90 BOPD
12/15- 89.27 BOPD
12/14- 48.77 BOPD.
I question whether you are modeling a steep enough decline rate. There have been some that suggest 14% as opposed to 9%.
I think the jury is still out on whether shale wells in any basin besides the Bakken will have “fat tails.”
Of course, this is very important, as I assume shale companies are still vastly overstating EUR. This means shale companies are vastly understating DD&A.
There will be writedowns taken on most of these wells when they reach economic limits, as actual production will be far less than estimated for accounting purposes.
I am not a math guy, am I looking at the Permian data wrong?
To work back,
12/13- 30.17 BOPD
12/12- 20.87 BOPD
12/11- 15.90 BOPD
12/10- 13.6 BOPD
Does you curve seem to support these actual data points? Or are you assuming higher IP = higher tail production rates. I don’t think that has necessarily been proven to be high correlated.
However, I stand to be corrected.
I would also note I ran a search on a subscription service for the following companies with regard to their operated vertical Sprayberry wells located in the Permian Basin, with a production start date on or before 12/31/2013:
Pioneer Natural Resources
Diamondback
Parsley
I find 6,412 wells that are listed as active.
Of those, 5,595 produced at or below 300 BO in the most recent month, generally being June, 2018.
Further, of those, 2,899 produced at or below 90 BO in the most recent month, generally being June, 2018.
I guess I would like to know why we should expect horizontal Sprayberry wells to have “fat tails” while it is clear the vertical Sprayberry wells dry up to nothing very fast.
I will admit, I assume most of these vertical Sprayberry wells can be operated fairly cheaply as they likely pump very few hours a week, and produce almost no water. Likely, many are also able to run off their own gas.
I think there are a lot of company predictions out there for these horizontal wells to have 30 year EUR of 500-800K BO. I am very skeptical of this.
Hi Shallow sand,
Note that the data shown in my chart is directly from shale profile (the red dots).
I think a mistake you may be making is to take all wells that started producing in 2016 (from Jan to Dec) and assuming all of those wells had been producing for 18 months, that is only true for wells completed in Dec 2016, the wells from Jan 2016 would have been producing for 29 months and wells completed in Dec 2016 would be at 18 months in May 2018. The well profile data is what I use and this aligns all the wells for 2016 so we see output for all 12 months matched up with month 1 output to month 18 output, I drop the later months because I only want to look at the wells that have been producing for 18 months, so the data for month 19 to Month 29 for the wells completed in Jan 2016 is ignored, likewise all the data for any wells from 2016 after month 18 is dropped. For the average 2016 well at month 18, shale profile has output at 4690 b/month (I multiply the daily output by 365.25/12).
As to the decline rate, note that the hyperbolic well has a decline rate that gradually decreases over time, the 9% decline rate is not reached until month 122 and the EUR is 322 kb at that point.
Yes there are some claims of a “bubble point of death”, but I do not believe these have been substantiated. I got the 9% terminal decline rate at the suggestion of Fernando Leanme.
What kind of decline rates do you see in your 10 or 15 year old wells?
If we use the 14% terminal decline rate (which I believe is too conservative), the EUR for the average 2016 Permian well is 350 kb if we assume shutin is at 10 b/d, 338 kb if the well is plugged at 15 b/d and 357 kb, if the well is plugged at 7 b/d.
So for the plugged at 10 b/d case the EUR is 379 kb for the 9% terminal decline assumption and 350 kb/d for the 14% terminal decline assumption, about 8% lower output over the end of the wells life (where discount rates would be higher so it’s lees important in todays dollars.)
Also note that the 14% decline rate is reached in month 77, so up to that point the well profile is unchanged, 10 bopd is reached at month 186 for the high decline case.
Also note that the company EUR predictions are typically in BOE and typically the oil is about 80% of that value so a 650 kboe EUR would be roughly a 520 kbo EUR, my EUR estimate is considerably lower at 350 kb (14% terminal decline) to 380 kb (9% terminal decline).
Note that there are those that claim my estimates are too pessimistic and many others that claim my estimates are too optimistic, probably means it’s about right.
If we polled Petroleum engineers on this question, I imagine there would be a wide range of opinions.
Shallow sand,
I think the reason for the horizontal wells producing for longer at a higher rate is the amount of contact with the oil producing zone of the formation than a vertical well, the average well falls to 10 b/d at 20 years so it is not a very fat tail, rather thin in my estimation. The “fat tail assumption” is that hyperbolic decline continues down to 6% before becoming exponential.
As most of the Permian horizontal wells are less than 7 years old, it is difficult to test the assumption.
Shallow sand,
They have been drilling wells in the Spraberry for quite a while, how old is the oldest well in that set of data.
see
https://www.onepetro.org/conference-paper/API-52-128
Shallow sand,
I think you might be looking at the data incorrectly.
Over time the Permian well completions have changed so early wells should not be mixed with older wells.
When estimating any well profile this is a problem because each well is unique and I typically do yearly averages which has a similar problem to averaging all wells over many years.
Rather than take total output and dividing by the number of wells producing (without worrying about the year of completion.) I use the well quality tab from shale profile.
It is absolutely the case that we do not know what the future output of these wells will be, in the past 5 years that I have been analyzing Bakken, Eagle Ford, and Permian well profiles, the process of fitting a hyperbolic well profile to the data has seemed to work fairly well.
If you look at the well quality tab it is pretty clear that the well quality has improved from 2013 to 2016, with cumulative output at 18 months increasing from about 70 kb in 2013 to over 150 kb in 2016. Much of this increase is due to longer lateral lengths and more sand and frack stages per foot for the average well. So comparing the average 2013 well to the average 2016 well in the Permian basin is kind of an apple to orange comparison.
A 200B hit to China via tariffs is a nice way of saying go home…a 700B DOD budget is a nice way of saying ‘stay home’…a 400B/month deficient in US budget is a war economy…this is not Kansas or Totto.
but totally western…a eastern approach (Russia with 30M dead two world wars, Napoleon, Ghanghas Kahn, ect) is nuc all western nuclear power plants.. let rest die.. I win. West never that bad. World saved from pollution (Rome 2012 study) and CO2..
https://oilprice.com/Energy/Energy-General/Iran-There-Is-No-Spare-Oil-Capacity.html
There is no spare capacity from Iran.
So what does Trump do before the midterms? Live with higher prices? Quietly drop the sanctions ? Find a way to get Iranian oil on the market while pretending there are sanctions? Accept the high prices and blame Obama?
Well, he is not the brightest porch light on the block—-
I had read a couple months ago that Trump was nattering about tapping the SPR around the time of the mid terms.
Oil price can rise some, now. It’s only a month and a half to go. Gasoline stocks are high, so it will take some trickle down time. Raiding the SPR is overkill.
Boomer,
Trump will blame Saudis for not increasing output, Saudis will then raise output in Sept to tamp prices down before midterms.
I’m betting they don’t. Saudi production in September is more likely to be down than up. But if it is up it will only by a tiny amount, not near enough to affect prices. Saudi Arabis is just not interested in increasing production by any significant amount. They would like to keep production steady….if possible.
Ron,
You may be right, but Trump may try to get Saudis to raise output and he may slow down aggressive action on Iranian sanctions until after midterms.
Seems Iran always has the trump cards.
Now if they could just get rid of religious oppression, and have a better functioning government–
Trump already tried that. Here is his tweet.
Trump asks Saudi Arabia to increase oil production
“Just spoke to King Salman of Saudi Arabia and explained to him that, because of the turmoil & disfunction in Iran and Venezuela, I am asking that Saudi Arabia increase oil production, maybe up to 2,000,000 barrels, to make up the difference…Prices to high! He has agreed!” the tweet read.
And of course, after the King hung up the phone he probably said: “We are not going to do any of that shit.” The Saudis, just like Trump’s staff, know he is an idiot.
“And of course, after the King hung up the phone he probably said: “We are not going to do any of that shit.”
I doubt that happened but I don’t have any inside contacts in the WH to confirm. My guess is that Trump has turned up the heat on Iran because of requests from KSA & Israel.
The USA has been helping MbS with is Yemen war, as well as proxy war in Syria. If KSA want the US to economically crush Iran, than KSA will need to help but increasing its Oil exports. Perhaps KSA as some oil stashed in storage that it could release for a short period. My guess KSA would delay using its storage reserves until there is a price spike that might force the US to back off on Iran.
I doubt that happened but I don’t have any inside contacts in the WH to confirm.
You doubt what happened? The quote was a tweet directly from the President. He sent it out to the world, you don’t need an inside contact to the White House. Trump’s tweets go out to the public.
Yes, it did happen. Of course, the part about what the King did afterward was just speculation on my part. But he did not increase oil production as Trump requested. That much we do know.
Hi Ron,
Not arguing the tweet Trumpet made, but your reasoning that the MbS will ignore the request.
I am reasonably sure MbS wants the USA to go after Iran, and thus has a motive to try to comply with Trumpet’s request for more Oil. That said, I very much doubt KSA can increase production, but they may have 50 to 150 mmbl in storage they could release if Oil prices spike.
FYI:
“Why The U.S. Is Suddenly Buying A Lot More Saudi Oil”
https://oilprice.com/Energy/Crude-Oil/Why-The-US-Is-Suddenly-Buying-A-Lot-More-Saudi-Oil.html
” the Saudis are responding to the demands of their staunch ally U.S. President Donald Trump, who has repeatedly slammed OPEC for the high gasoline prices, urging the cartel in early July to “REDUCE PRICING NOW!””
“Saudi Arabia Boosts Oil Supply To Asia As Iran Sanctions Return”
https://oilprice.com/Energy/Crude-Oil/Saudi-Arabia-Boosts-Oil-Supply-To-Asia-As-Iran-Sanctions-Return.html
“Saudi Arabia cut last week its official selling price (OSP) for its flagship Arab Light grade for October to Asia by US$0.10 a barrel to US$1.10 a barrel premium to the Dubai/Oman average”
So it appears that KSA is trying to comply with Trumpet’s request. At least by trying to lower the oil prices via selling their oil at a discount.
** Note: Not trying to be a PITA, just providing an alternative viewpoint. I do value what you post. Hope you understand.
There are a lot of folks out there talking recession in the near-term. Most of that derives from history. Recession occurs every so often, or rather it used to.
It’s really hard to have a decrease in GDP when you are running a deficit near a trillion dollars. A trillion dollars is about 4.8% of GDP. If GDP grew by less than that then you have some sort of word to invent to describe growth absent created money. (Not by the Fed, but also not by capitalism). And there’s a lot of cash being repatriated, and that damn sure hasn’t finished yet. So it’s really hard to get a GDP decrease until all of that works through.
As has been noted before, the real danger in all of this is drawing attention to what Bernanke did. When it is completely visible that money was created whimsically, and that the Chinese have proven that you don’t have to allow your currency to trade completely outside government controls, then the system gets dicey.
The only thing stopping exporting country leadership from concluding that the oil is better off underground for the grandchildren rather than being traded for pieces of paper with ink on it — the only thing preventing that conclusion is an array of advisors whose own personal wealth would be endangered by such an exposure about money in general. They are the ones whispering in the ears of their leadership, and their advice is not sourced in the best interests of that country.
To a certain extent we could label all such advisors for all oil exporting countries as, dare one say it, Deep State. Establishment political infrastructure in each country giving advice sourced in their own well-being and not that of the country.
Some interesting figures from the OPEC annual statistical review earlier this year that I missed when it came out: https://asb.opec.org/index.php/interactive-charts
First crude only peaked in 2016, with 2017 below 2016 and 2015.
Second oil reserves have been flat since around 2010, and declining recently for the first time since the 1970s. Note, before someone points it out, they don’t count Canadian Bitumen.
This is so ridiculous it is funny. Oil discoveries have been going down, down, and down, way below replacement level. Yet so-called “proven” reserves keep going up, up and up.
That’s to be expected.
“This is so ridiculous it is funny. Oil discoveries have been going down, down, and down, way below replacement level. Yet so-called “proven” reserves keep going up, up and up.”
Well to some degree, technology has been able to extract more oil from a field. Thus a field discovered in 1950 with an initial proven reserve of 100mbbls, may have 125mbbls or proven reserves as technology has improved recovery rates. That said technology improvements likely don’t match the paper proven reserves.
The Venezuelan heavy oil reserves are overstated (I assume the large bump prior to 2010 is the booking of the Magna Reserva in the Orinoco Oil belt, which i know are fake). It’s fairly easy to eyeball the better number by substracting 300 billion a flat line around 1200. If you want to add future bookings in that heavy oil belt, add up to 50 billion gradually. Dont forget that at the current decline rate Venezuela will be producing about 1.1 million BOPD in december, and IF things go as I think they will sometime in the first half of 2019 exports will drop to zero for a few months.
Third gas reserves also flat. If condensate and NGLs have been meeting the increased demand that crude has been unable to, then that might be about to stop.
I think Dennis said some time ago that Saudi’s 266 billion barrels of reserves that they claim was perhaps when they raised P2 reserves to P1 reserves.
Naaaa, that’s not where they got it. They still claim 403 billion barrels of P2 reserves and 802 billion barrels of P3 reserves. And that 802 billion barrels will soon be increased to 900 billion barrels via enhanced recovery techniques.
This is a good article if you need a good belly laugh today. It is brought to you on the opinion page of Arab News. Arab News is a Saudi Publication just in case anyone is wondering. I used to get it in hard copy, free, courtesy of ARAMCO, when I was there.
Does Saudi Arabia have enough oil?
Saudi Aramco, according to its own records, has about 802.2 billion barrels of oil resources, including about 261 billion barrels of proven reserves; 403.1 billion of probable, possible and contingent reserves. The company has produced up to 138 billion barrels of oil to date out of the 802.2 billion barrels.
It plans to raise oil resources to 900 billion barrels from the 802.2 billion over the long term as its also plans to increase recovery rate of reserves to 70 percent from the current 50 percent.
P.S. When I was in Saudi they had a word for this kind of thing. They called it wasta. Wasta means “deliberate exaggeration” as a way of dialogue. That’s just the way they talk. They don’t believe they are lying. They really expect you to know they are just exaggerating. They don’t expect you to take it literally.
261 + 403 = 664. 138 is what was produced and burned somewhere. 664 + 138 = 802. How can 138 be in there? We did speculate yrs ago that KSA was calling original oil . . . reserves.
802 to 900 is 98.
20% increase in recovery of 664 is 132, not 98. 0.2 X any of those numbers doesn’t yield 98. Something amiss here.
Watcher, you do not add P1 and P2 to get P3. P2 reserves of 403 billion barrels includes 261 billion barrels P1 reserves. P1 is proved, p2 is proved+probable. Or, 261 Gb of proved plus 142 Gb of probable equals 403 of proved+probable.
But Ron, that would mean it is an unreal coincidence that the numbers added to 802.
I don’t care what the coincidence is:
P1=Proved
P2=Proved + Probable
P3=Proved + Probable + Possible
Wiki, Proved Reserves
These reserve categories are totaled up by the measures 1P, 2P, and 3P, which are inclusive of all reserves types:
“1P reserves” = proven reserves (both proved developed reserves + proved undeveloped reserves).
“2P reserves” = 1P (proven reserves) + probable reserves, hence “proved AND probable.”[2]
“3P reserves” = the sum of 2P (proven reserves + probable reserves) + possible reserves, all 3Ps “proven AND probable AND possible
People have different interpretation but it used to be (at least in some places): P1 proven, P2 probable, P3 possible. So 1P = P1, 2P = P1 + P2, and 3P = P1+P2+P3 = 2P + P3. Plus these days there are three level of contingent resources.
George, your post is confusing. I am not at all sure what you are trying to say. There is only one official definition. Just google it. There are dozens of links that all say the same thing. Another google hit:
The Energy Standard
Proved 1P – at least 90% probability
Proved + Probable 2P – at least 50% probability
Proved + Probable +Possible 3P – at least 10 % probability
George is right. While it can be confusing, there is a difference between P2 and 2P, and P3 and 3P, while P1 = 1P. We had this discussion about a year ago.
No problem South. But I need a link that explains all this because I cannot make heads or tails of George’s explanation.
Do you, or anyone else for that matter, have such a link?
I searched quite throughly on google and found the terms 1p and p1 interchangable. Ditto with p2 and p3. Example right here:
What are 3P Oil & Gas Reserves and Why Are They Important?
https://www.spe.org/industry/docs/Petroleum-Resources-Management-System.pdf?ecid=O~E~~~B2B~Listed@ASX~~201711~4D17FF62DA924A448FCAEF04CEC4541A~
xP is cumulative while Px is not…
100% >= P1 >= 90%
90% > P2 >= 50%
50% > P3 >= 10%
1P >= 90% (same as P1)
2P >= 50% (P1 + P2)
3P >= 10% (P1 + P2 + P3)
Hi Ron,
There is much confusion on this on the internet. Have you found a reputable source such as the Society of Petroleum Engineers that says P2 and 2P are interchangeable.
Everyone agrees that P1=1P, however 2P is not equal to P2 and 3P is not equal to P3 there is a clear distinction.
P2=probable reserves
P3=possible reserves
2P= proved plus probable
3P=proved plus probable plus possible
See also Fig 2.1 in
file:///C:/Users/dcoyn/Downloads/PRMS_Guidelines_Nov2011.pdf
Ron this agrees with what George said.
What seems to agree with what George said?
This link:
file:///C:/Users/dcoyn/Downloads/PRMS_Guidelines_Nov2011.pdf
Don’t work. I think that’s on your hard drive and I cannot reach it.
Hi Ron,
Your comment
http://peakoilbarrel.com/opec-august-production-data-2/#comment-652323
and the document you linked agree with George Kaplan.
There is also the document that George linked above
https://www.spe.org/industry/docs/Petroleum-Resources-Management-System.pdf?ecid=O~E~~~B2B~Listed@ASX~~201711~4D17FF62DA924A448FCAEF04CEC4541A~
Figure 1-1 on page 3 is pretty clear (George has the figure in the comment linked below)
http://peakoilbarrel.com/opec-august-production-data-2/#comment-652327
South LaGeo and George Kaplan both know more than me, as does the Society of Petroleum engineers.
Can you find a link from the SPE that shows P2=2P and/or P3=3P?
The other links you found are not authoritative in my opinion.
In any case not worth discussing further in my opinion, I agree with George Kaplan (and the SPE).
Can you find a link from the SPE that shows P2=2P and/or P3=3P?
No, Dennis, and you cannot find any link that says they are not equal. None of the links George posted, or that I posted, says they are not equal. However, I posted two links that say P2 is Proven plus Probable. Now can you could just post one link that says they are something different I would greatly appreciate it. That is just one link that says P2 does not equal Proven plus Probable. Can you do that?
No website bothers to make a distinction between 2P and P2 because they mean the same damn thing.
Hi Ron,
You do understand that there is incorrect information on the internet, I hope.
The links you found are examples of such incorrect information.
Information from the SPE is very technical, has it been your experience that technical documents are in the habit of using different abbreviations for the same thing?
It is pretty clear in the figure that George Kaplan found that P2 is an abbreviation for probable reserves and P3 is an abbreviation for possible reserves, it is also very clear from reading the SPE document.
So no, probable reserves (P2) are not the same as 2P (proved plus probable) reserves, except in the very unusual case where proved reserves are equal to zero, for that exceptional case you would be correct.
Hi Ron,
Last try. If you don’t understand the chart below, I give up.
2P=proved plus probable reserves
P2=probable reserves, (notice that proved reserves are not included)
Maybe numbers will help.
Nation x has 100 Gb of proved reserves and 50 Gb of probable reserves, and 25 Gb of possible reserves.
So for nation x
P1=100 Gb, P2=50 Gb, and P3=25 Gb
1P=100 Gb, what is 2P and 3P?
You seem to believe 2P=P2=50 Gb, when the correct answer is 150 Gb, likewise 3P=P1+P2+P3=175 Gb in this case.
From link below
https://www.spe.org/industry/docs/Petroleum-Resources-Management-System.pdf?ecid=O~E~~~B2B~Listed@ASX~~201711~4D17FF62DA924A448FCAEF04CEC4541A~
on page 3 there is Fig 1-1 reproduced below.
Look closely at the chart and ignore stuff from places other than the SPE (as many of them are incorrect and say 2P=P2 and 3P=P3 when in fact that is wrong).
Have you found any SPE document that says P2=2P or P2=2P. The chart below has P2 with “PROBABLE” right below it and P3 with “POSSIBLE” right below it.
Also from page 13 of the document linked above:
Use of consistent terminology (Figures 1-1 and 2-1) promotes clarity in communication of evaluation results. For Reserves, the general cumulative terms Low/Best/High technical forecasts are used to estimate the resulting 1P/2P/3P quantities, respectively. The associated incremental quantities are termed Proved (P1), Probable (P2) and Possible (P3). Reserves are a subset of, and must be viewed within the context of, the complete Resources classification system. While the categorization criteria are proposed specifically for Reserves, in most cases, the criteria can be equally applied to Contingent and Prospective Resources. Conditional upon satisfying the commercial maturity criteria for discovery and/or development, the Project quantities will then move to the appropriate Resources sub-class. Criteria for the Reserve categories determination are provided in Table 3.
Dennis, for God’s sake, get real. From your link, this says it all:
The Uncertainty in a Project’s recoverable quantities is reflected by the following: 1P, 2P, 3P, Proved (P1), Probable (P2), Possible (P3),
In other words,
The example of 1P, Proved (P1)
The example of 2P, Probable (P2)
The example of 3P, Possible (P3)
It could not possibly be any clearer than that. And that is exactly what is shown in the chart.
I believe your chart Dennis, and I believe the example your link posted. Again, It could not be clearer. You are just trying, and trying rather desperately I might add, to make the chart and the text say something that it clearly does not say.
So let’s call it quits because you will never give up on your mistaken idea.
One more very important thing. The terms P1, P2, and P3 do not represent different or expansions in the reservoir. They all represent the same oil in the same reservoir. They are all three just different estimates of how much oil that can be recovered. P1 or 1P is just the low estimate, P2 or 2P is the higher estimate and P3 or 3P is the highest estimate. P1 and P2 are not different areas of the reservoir that must be added to get P3. You must understand that.
Hi Ron,
You are correct that I will not give up on my correct idea.
But I will give up on showing you that you are wrong.
Try reading the quote I gave, or read the entire paper I linked (thanks for finding that George Kaplan).
Do you really believe that everyone has this wrong except you?
Interesting.
You have defined 1P, 2P and 3P correctly, on that we agree.
When SPE writes Probable(P2) and Possible(P3) what do you think they mean?
I interpret it as Probable reserves=P2 and
Possible reserves=P3.
I believe you have already said (and I agree) that 2P reserves =proved reserves plus probable reserves.
For Reserves, the general cumulative terms Low/Best/High technical forecasts are used to estimate the resulting 1P/2P/3P quantities, respectively. The associated incremental quantities are termed Proved (P1), Probable (P2) and Possible (P3).
Read the quote above carefully.
We have the cumulative terms 1P, 2P, and 3P in the first sentence. These can be thought of as
1P=low estimate of reserves
2P=best estimate of reserves
3P=high estimate of reserves
The incremental terms are proved, probable, and possible reserves which can be abbreviated as P1, P2, and P3 respectively. These are added up to produce the cumulative 2P and 3P reserves in the following way:
2P=P1+P2
3P=P1+P2+P3 and 3P=2P+P3 (if this last one, after the “and” is confusing, just ignore it as it is an algebra thing which some people find confusing).
Then in the second sentence they talk about the incremental terms P1, P2, and P3.
Have you found any place where they say 2P=P2?
Or that Probable reserves (aka P2 reserves) are the same as proved plus probable reserves (aka 2P reserves)?
When you find that, I would be convinced, otherwise we will just have to disagree.
Do you really believe that everyone has this wrong except you?
Bullshit. I quoted and linked to two websites, one an oil magazine. And they both supported my position.
I think Dennis, the part you don’t understand, is that you think P1, P2, and P3 are different oil and must be counted separately. That P1 oil is somehow separate from P2 oil and can be counted, or estimated as if found in a different place.
No, they are the same oil. P1 is just an estimate of how much oil can be pumped from a given reservoir. P2 is a higher estimate. And P3 is just another higher estimate, nothing more. Same field, same wells. There is no way of definitely knowing P2 exist until you have pumped more than the P1 estimate. Ditto for P3.
Ron,
Yes Ron you found two websites that got it wrong. You will need to find some thing from:
Society of Petroleum Engineers (SPE)
American Association of Petroleum Geologists (AAPG)
World Petroleum Council (WPC)
Society of Petroleum Evaluation Engineers (SPEE)
Society of Exploration Geophysicists (SEG)
to be convincing.
Yes these are different estimates of the oil in the reservoir. The increments are the different cumulative probabilities.
Generally proved (1P) reserves are considered P90 where there is a 90% probability that oil produced will be greater than or equal to proved reserves. The 2P reserves are typically P50 where there a 50% probability that oil produced will be greater than or equal to the 2P estimate. Lastly the 3P estimate is a P10 estimate where there is a 10% probability that the oil produced will be greater than or equal to the 3P estimate.
I understand quite well that in every case the reserves are estimates of future production.
The increments are increments in probability.
One can think of it as making a bet on what the correct reserve estimate will be, the best estimate (the one with the highest odds of being closest to the ultimately recovered resource) is the 2P estimate, with the 1P estimate being a low estimate and the 3P estimate being a high estimate.
In theory, there should be an equal chance of 2P estimates being either too high or too low. In practice, improving technology, and gradually increasing real oil prices (which result in more contingent resources and prospective resources becoming commercially viable) tends to result in more 2P, 2C, and 2U estimates being revised higher over time rather than lower.
In the end it’s not worth arguing over, I interpret the SPE figures and text as meaning that P2 is and abbreviation for probable reserves, in agreement with the interpretation of several others.
Can you explain why the figure and text have both 2P and P2? This would seem to be the source of endless confusion. I would stick with the usage of authorities such as Jean Laherrere who never uses the term P2 and always refers to 2P reserves (proved plus probable.)
Pretty sure that SouthLaGeo and George Kaplan are correct in their interpretation of these abbreviations and that P2 means probable reserves and P3 means possible reserves. 2P is proved plus possible and 3P is proved plus probable plus possible, this last sentence we all agree on.
Yes Ron you found two websites that got it wrong.
Well hell, how about another website that got it right, not wrong. And this is one of the most prestigious websites in the business: The American Oil and Gas Reporter.
Reserve Estimates
Considering only proved reserves (1P), the study ranks Saudi Arabia at the top with 70 billion barrels, followed by Russia with 51 billion, Iran with 32 billion, the United States with 29 billion and Canada with 24 billion. Ranked by proved plus probable reserves (P2), Saudi Arabia holds 120 billion barrels, followed by Russia with 77 billion, Iran with 59 billion, Canada with 41 billion and the United States with 40 billion.
And there is a chart on that website that lists Saudi Arabia as having 1P 70 GB, 2P 120 GB and 3P 168 GB. So they say in one place that Saudi has P2 of 120 GB and in another place that Saudi has 2P of 120 GB. They are saying they both mean the same thing.
This site proves me right twice. First that P2 = 2P and second that Saudi is full of shit when they claim 266 GB of proven reserves.
This site gives the proven reserves for all the world’s major oil producers. You should check it out.
These guys know what they are talking about.
Hi Ron,
You will need to find something from a technical or peer reviewed source. Magazines, newspapers, and blogs get stuff wrong all the time. I am getting information from the people who create the reserve classifications (SPEE for example who created the PRMS [Petroleum Resources Management System], most recent edition published in June 2018.)
See http://peakoilbarrel.com/opec-august-production-data-2/#comment-652490
As I have suggested before, many make the incorrect assumption that because 1P=P1, that this is also true for 2P and 3P, just because many have made this mistake, does not make it correct.
Hi Ron,
I don’t care what the coincidence is:
P1=Proved
P2=Proved + Probable
P3=Proved + Probable + Possible
The quote above would be correct if you had said:
1P=Proved
2P=Proved + Probable
3P=Proved + Probable + Possible
or
1P=P1
2P=P1+P2
3P=P1+P2+P3
George was pointing out that P2 and 2P are different and that P3 and 3P are also different.
In your first post you got 2P and P2 confused as well as P3 and 3P
P2=probable reserves
P3=possible reserves
2P=proved plus probable= P1+P2
3P=2P+P3=P1+P2+P3
Only in the case of proved reserves is 1P=P1
For 2P and 3P categories the following statements are false:
P2=2P
P3=3P
That was what George Kaplan was trying to point out, or so it seemed to me.
Well now, a lot of folks out there on the web had better get their act together because they have it all wrong, Starting with these folks:
Oilman Magazine, Mexico: Prospective Resources and Reserves by Field
When assessing a country’s oil and gas reserves the engineering terms P1, P2, and P3 are used. These terms can be defined as follows:
P1 is proven reserves (proved developed reserves and proved undeveloped reserves.
P2 contains P1 and adds probable reserves. This is proven and probable reserves.
P3 is the sum of P2 (proven and probable) plus possible reserves.
Perhaps you should email Oilman Magazine and tell them to get their act together.
Hi Ron,
I will go with the SPE as they are the people who create these classifications.
As George Kaplan suggested, the way he explained it is the way the society of petroleum engineers does it.
Oilmen may have different definitions. 🙂
I need a link!
Here is another of my links, I keep finding them. Ain’t google fun? 😉
Probable Reserves
The estimated amount of hydrocarbon reserves that are in the underground reservoir are classified in three categories: Proved reserves (P1), Proved plus probable reserves (P2) and Proved, probable plus possible reserves (P3). Proven reserves have a very high degree of recovery with wells in place and techniques that are proven. But probable and possible reserves are based on future techno-economic conditions. Probable reserve has a higher chance of recovery than possible reserves.
The Society of Petroleum Engineers, Glossary of Terms Used in Petroleum Reserves/Resources Definitions, gives only the definition of 1P, 2P and 3P.
Ron,
I think the confusion may arise because 1P=P1 and then people assume that must also mean that 2P=P2 and 3P=P3.
Instead P2=probable, 2P=proved plus probable and P3=possible and 3P=P1+P2+P3=proved+probable+possible
as is pretty clear in the figure that George reproduced for us.
EDIT: I found another one! However I am taking this discussion to the bottom of the page for a wider posting area.
The 804 Bbbl is the P4 estimate: P4 = Impossible, the 900 Bbbl is P5 = Devine Intervention 🙂
Hi Ron,
I found an up to date document from the SPEE at link below:
https://secure.spee.org/sites/spee.org/files/prmgmtsystem_final_2018.pdf
See page 46 of that document where I find:
P2 1.1 Denotes Probable Reserves
P3 1.1 Denotes Possible Reserves
Also see page 37 for 1P, 2P, and 3P and note that only for 1P does it say that it is equal to P1, this is absent for both 2P and 3P. Note also that on page 46 where P1 is said to denote Proved Reserves, that it says P1 is equal to 1P, but it does not say this for either P2 or P3.
Now I am done.
“LA MORDIDA”
Hi,
Here are my Bakken updates.
Production increased quite a bit in July and it was mainly because of many new wells. There were 138 new wells in July compared to 83 in June.
The 2014 curve continue to follow the not so good 2012 curve. 2015 is at the moment closer to the other curves while 2016 is clearly above the other curves.
The GOR graph shows a mixed picture. Increases for some years and decreases for others.
Here is the one month after first production graph.
Freddy, this jagged line past 2016 is the average of month 2 of all wells in that time frame? So if a well is 3 or 4 months old it doesn’t appear on this graph? It doesn’t look seasonal. How does it get so jagged?
Yes all wells are of the same age. Why it´s so jagged we talked about in the last post. I don’t know, but I think it´s a combination of fewer wells each month and average number of production days vary more too. Why average number of production days vary could be because wells are closer and may need to be put offline more often because of completions of nearby wells.
New record, it says. 1.269k ? But, it says some companies may get production restrictions, as they are not meeting the gas capture 85%.
Guym,
I think North Dakota has these gas capture rules as a “goal”, there’s not a lot of enforcement and the NDIC is fighting the EIA every step of the way and my guess is that under Trump the EIA will do very little and leave it up to North Dakota to waste as much natural gas as they want.
This has probably been posted here before but I just ran across it doing research. It’s from 2016.
————
“Short of capital? Risk of underinvestment in oil and gas is amplified by competing cash priorities”
https://www2.deloitte.com/content/dam/Deloitte/us/Documents/energy-resources/us-er-short-of-capital.pdf
————-
My question:
Have we established how much oil would have to sell for to cover expenses, pay back debt (not just service it), and account for decline rates? In other words, how much does oil have to sell for so that LTO companies are truly profitable and not just pushing the bills down the road until the oil runs out?
Note the study calls LTO supplementary oil. That’s all it ever could have been. Supplementary at a higher price. Treating it as the yen and yang is stupid, at best. It would need a price above $100, now. But, it will not cure the problem. There is not enough oil discoveries found, or maybe existing. So, we can bang on LTO all we want, but everyone should realize, it is not the long term answer. As a supply over time, it is very small.
No.
Boomer,
I did this for the Permian basin, from 2010 to 2040. I created a scenario with what I thought were reasonable oil prices and well completion rates and required wells to at least have a positive discounted cash flow over its life at the assumed price scenario for the wells to be completed. The assumed interest rate for debt is a nominal annual rate of 7.4% (real annual interest rate with zero annual rate of inflation is 4.9%.)
Cumulative net revenue (set at zero for end of year 2009) in billions of 2017$ and oil price (2017$) on left axis and Permian tight oil output in kb/d on right axis. Cumulative net revenue reaches 601 billion 2017$ in 2050, all debt is paid off by 2025.
Is the debt that is paid off current debt, or current debt plus new debt to keep drilling more wells?
Boomer,
It is current and new debt that is paid off, note that over time fewer wells are drilled as the sweet spots get fully drilled (no space for more wells). The peak well completion rate is 550 new wells per month in 2022 and by the end of 2030 the rate falls to 208 wells completed per month, by the end of 2042 no more wells are completed. Total wells completed from 2010 to 2042 is 93,400 wells and tight oil URR for the Permian is 31 Gb from 2010 to 2080.
The model starts in Jan 2010 when drilling took off in Permian basin, see chart below.
Oh, by the way, somewhere far above in the scroll there is talk about how people want oil and cannot afford it and make do with less. Nope. This doesn’t escape the situation.
The issue is not that there are people who want oil and cannot afford it. The issue is the people who absolutely, desperately need oil beyond what they can afford, and thus don’t care about “afford”.
There’s a difference between want and need. We’ll be seeing that difference soon.
Watcher,
The difference is the price one is willing to pay. People may want something and be unwilling to pay the asking price, something that is “needed” people will pay any price, up to what they can afford, beyond that they might go without and make adjustments, walk, ride a bike, use public transport, hitchhike, etc.
Comparing inventories of crude oil plus major products (light+middle+heavy distillates) for the US & EU
http://www.arabnews.com/node/1372841/business-economy
More belly laughs for Ron from his favorite newspaper. Iran is screwed, because SA has 2 million in excess capacity. “Wasta”.
Older, but from Iran;
https://financialtribune.com/articles/energy/92801/oil-surplus-vanishes-ahead-of-iran-deadline
And from the article I posted above, Iran says SA doesn’t have it.
Hubbert peak says SA has 260…or 90% of giants found…and ‘easy oil’… of which supposedly 160 produced… older ‘easy’ fields gone….rest hard..70 a barrel to keep going…
EIA international energy statistics. A quick look at “World Other Liquids” to see the seasonality in total liquids supply. I guess that this “other liquids” is mostly ethanol and biodiesel but they do list a number of other things?
Seasonality = September 2017 production subtract January 2017 is 942 kb/day.
Just as much of the world was blindsided by the so called Shale Revolution, there is an equally disruptive component in the energy sphere that will catch unawares those who are not following, namely natgas, including all its derivatives.
US Congress is in the process of expediting export rules for small scale (52Bcf/year = 1 mtpa [million tonnes per annum]) LNG export facilities aiding both smaller exporters and importers.
Primary targets are Central/South America and Caribbean. Woodymac claims sixfold increase in LNG imports in coming years.
Numbers? 2005 had US export 2mtpa. 2017 it shot up to 18 mtpa. Projected in 5 years, 20022, to pass 77 mtpa.
That’s a lot of gas.
The rapid adoption of smaller, modular liquification trains – see Elba Island and, most notably, Phase 3 of Cheniere’s Corpus Christi project – combined with evolving transportation and storage hardware, ensures an entirely new paradigm is emerging in the energy world.
Reuters writeup from February, 2018 provides a pretty good description of what is unfolding.
For operationally inclined wonks, the numerous online videos depicting the manufacture, transportation, and installation of these mammoth components are highly educational.
From the Bible:
South and Central America nat gas consumption, summed
2015 17.3 Bcf
2016 16.9 Bcf
2017 16.8 Bcf
South and Central America summed Nat gas production 17.3 Bcf
This is the primary target for a X6?
The countries cited by the 2017 Woodmac report were El Salvador, Dominican Republic, Panama, Puerto Rico, Curacao, Jamaica and Columbia.
Excluding Columbia, 54% of these countries’ electricity generation is from fuel oil or diesel sources.
Current LNG imports are a little over 2 mtpa and expected to exceed 16 mtpa in a decade.
The Numbers are fairly small, but 2 things are somewhat noteworthy …
More evidence of the shift away from oil derivatives …and
As these markets are fairly small, they offer good examples of how the new, smaller LNG hardware can economically serve heretofore non viable locations.
Several areas around the globe, such as Indonesian islands, Philippines, parts of Africa will be able to access cheaper electricity through these types of developments.
Okay look. You have to do your homework.
There is a list of proposed LNG regasification terminals (which cost about $1B each for any significant magnitude flow). It’s in the LNG wiki. Central Am and Caribbean (excl PR, which is part of US) list the following sites for LNG terminals, in existence or proposed:
None.
Probably more significant, Trinidad and Tobago produce gas several times more than their production. There are pipelines proposed and already built that send gas to Barbados and extends north. There are also pipelines from Venezuela to Columbia and north to Panama. Ven isn’t filling those pipes right now, but almost certainly will at some point.
Those islands do mostly what SE Asia does for cooking. Propane. They certainly don’t need furnaces. This is not going to be the way you X6. As for Asia, Australia has the distance cost advantage, and GAZPROM the pipeline cost advantage.
Watcher
Your comment is exactly proving my point on so many levels.
If you go to the Wartsila website and click on the Wartsila mobile LNG link, you will see the future right in front of your eyes.
And the future is, like, right now.
The Floating Storage and Regassification Barge (FSRB), is what will take the place of your stated $1 billion legacy plants.
There is a Jones Act compliant articulated tug barge being built in Mississippi right now using this structure.
Ranging in size from 7 to 30 cubic meter storage, these mobile units will provide the fuel for the existing or proposed electric plants mentioned in Woody Mac’s report.
Lightening fast developments are taking place all over the globe in the natgas world.
If you check out the Methax power plant in Argentina, you will see the advances being made in providing LNG fuel to remote locations.
In addition, you will see this company’s hopes for gas capture that may become more adopted in areas like the Permian as flaring and it’s restrictions – think Bakken – start to cost producers serious money.
What has this to do with no need for furnaces and thus no way to consume enough to achieve X6?
Cooking = propane, not furnaces (???)
Electric power generation, aka the stuff needed for light bulbs, refrigerators, televisions, now comes from oil based products = expensive.
HH at under 3 bucks per mmbtu means gas could be great if possible to handle/deliver economically.
Enter US el cheapo feedgas, especially to new generation of LNG plants like Driftwood or floaters from Delfin/Golnar and deliver product economically in smaller quantities.
The actual downstream generators – some from Wartsila – are also new iterations targeting smaller end users.
There is no need for furnaces. Have you been to the Caribbean? There is no need for furnaces.
Clearly they already have enough power for air con. Look at their consumption and production numbers.
And any uneven distribution for, say Barbados, gets it from a pipeline to Trinidad. Why pay extra for LNG when you can have piped gas a short distance from Trinidad?
Now, it IS possible for LNG to become the choice of gas for countries that could have pipeline gas. Just threaten them with banking sanctions if they don’t choose LNG. If that works in Europe, it would work in the Caribbean, too.
U.S. Shale Oil Production Set To Reach 10 Million B/D By 2020
https://seekingalpha.com/article/4206765-u-s-shale-oil-production-set-reach-10-million-b-d-2020
How does this fit into the “peak” discussion?
The article states that using the most convoluted and inaccurate report by the EIA, which is a major feat, the cumulative production of these fields could reach 10 million barrels by 2020. However, they admit it is impossible, because of the pipeline constraints in the Permian until 2020. Stimulating discussion.
Green bub,
I assume the scenario shown below for tight oil (LTO) and extra heavy oil (XH) from Canada and Venezuela, the sum of LTO and XH I call “unconventional” oil shown on right axis of chart below.
I think 8 Mb/d of tight oil by 2021 is reasonable, but 10 Mb/d for tight oil by 2020 is not. I expect the peak to be about 8.5 Mb/d in 2022 or 2023 with URR of roughly 60 Gb for US tight oil.
Attached is some interesting info from the 2018 DPRs. I checked the projected production increase from the DPRs starting in January 2018 to September 2018. In January 2018, the DPR projected that February production would increase by 111 kb/d. After peaking in the May to July period at slightly over 140 kb/d, the September report projects that October production will increase by 79 kb/d. It will be interesting to see if the production increases continue to drop. Is this drop temporary due to infrastructure issues. How much is due to increasing decline rates ?
Ovi,
The actual increase in tight oil output has been about 650 kb/d for the first 7 months of 2018, that chart would give us about 900 kb/d for the first 7 months of 2018, about 250 kb/d too high (about 40% too high). The projection for August and September look pretty reasonable, though they may still be a bit high. I expect about a 70 kb/d increase on average in tight oil output each month for the rest of 2018, this may pick up a bit when more pipeline capacity is completed in the Permian Basin during 2019, or if well completion rates pick up in other US tight oil plays.
Dennis
My intention in creating that chart was to see whether the EIA/DPR next month predictions were decreasing after reading so many articles on the infrastucture issues in the Permian. The chart does demonstrate that.
Nevertheless, I did not think of checking their estimated production growth with the actual next month production growth that they posted. In the accompanying chart, I have added a second graph comparing the actual growth to their prediction.
For example, in the March DPR, they predicted that April LTO production would be 6954 kb/d. In the April DPR, they reported that April production was 6871 kb/d. This was 83 kb/d LOWER than their production and significantly lower than their growth prediction. The last data point I have is for September production and it is 7 kb/d lower than their August production and 100 kb/d lower than their growth prediction. As you can see from the updated chart, their next month predictions are always too high/optimistic.
Ovi,
As you have already gathered the data, an interesting exercise would be to look at the EIA’s tight oil estimates (not the DPR) and compare actual growth with projected growth.
Chart below has actual month over month (mom) tight oil increases from Nov 2017 to July 2018.
Dotted line is the average monthly increase over that period (about 100 kb/d each month on average).
Dennis
As suggested, the EIA data for LTO production growth from February to August has been added to the above chart.
So to refresh, the January data point is the DPR’s estimated February growth (green), from the January DPR, and is compared to the actual growth (red). These DPR growth numbers are compared to the EIA LTO growth numbers (blue). The DPR growth has been over estimated every month and the EIA data fall in between the DPR data from March to August. The EIA LTO July data point, which shows August growth, is 56 kb/d below and 127 kb/d above the DPR data.
US LNG projects expected to ramp up in 2019 shown on this map from PlattsGas
map: https://pbs.twimg.com/media/DnVReeAW0AAUlwp.jpg
oil prices in the news today…
2018-09-18 (Bloomberg) Saudi Arabia is said to be comfortable with Brent oil prices rising above $80 a barrel, at least in the short term, as the global market adjusts to the loss of Iranian supply from U.S. sanctions
2018-09-18 (Reuters) Russia energy minister Novak says based on estimates by analysts and companies oil prices will be in range of $50/barrel in long-term, the recent increase to $70-$80 is “temporary” and driven by sanctions
Back in June he said that $70 would be alright for fuel prices: 2018-06-13 (IFX) Russia energy minister Novak: a reduction in (Brent) oil prices to $70/barrel will lead to stabilizatiom in petroleum products market.
2018-09-18 (Bloomberg) Russia Raises 2018 Oil-Output Estimate to 553M Tons, Novak Says. This year’s estimate equates to ~11.23m b/d in 2H, up from about 11.15m b/d indicated in July
Jodi data out: Saudi crude inventories fell by 5.5mb m/m in July.
A lot of half empty or empty storage tanks visible on satellite photos. Exports are lower compared to aug so far in sept.
Yeah, well. Surprise, SA is comfortable with prices above $80, and does not plan to increase output.
https://www.cnbc.com/amp/2018/09/18/oil-markets-us-china-trade-war-in-focus.html
5.5mb m/m decline in July. That is about 185k bpd. Was KSA taking oil out of inventory just to increase exports? If that is the case that is a bad sign for the Kingdom to even maintain the current production increase. Are they hoping to take oil out of inventory until the neutral zone comes online next year next year which might be about 500k bpd?
Neutral zone was recently estimated to be a 100k increase by SA.
https://oilprice.com/Energy/Crude-Oil/Saudi-Arabia-Kuwait-Halt-Oil-Production-In-Neutral-Zone.html
“As of 2015, the oil production capacity in the neutral zone stood at 600,000 bpd, equally divided between Kuwait and Saudi Arabia, according to the EIA.”
But, I can’t find an article on it, anymore. Ok, I found it, they are talking about one field in the neutral zone to come on by 2019 at 100k.
https://www.epmag.com/new-terms-govern-al-khafji-joint-saudi-kuwait-oil-field-1712821
The resumption of the other field is still under discussion, nothing immediate. The field they are starting has a 250k barrel a day potential, but will operate at less than 50% to prevent potential loss of production from an existing SA field. Though the actual article is more confusing, as it says more than 50%. 100k is below 50% of 250k, according to my meager abilities at math.
It looks like the neutral zone is mainly made up of two oil fields
Al-Khafji 250k bpd capacity (offshore)
Al-Wafra 220k bpd capacity (onshore)
From the article is sounds like the two countries are still in discussion and work as yet to start.
“The newspaper also said that Kuwait will issue a special decree to ratify the deal instead of waiting for the approval of the Kuwaiti Senate, which is supposed to held its meeting in October.”
Al-wafra came online in 1984, and was producing 600k barrels before it was damaged in the Gulf War. Now, it is listed as 220k bpd. Don’t know how much of that was from war damage, or how much is normal decline. Maybe 200k when both come online?? If they do.
Al-Wafra needs steam EOR to get much more out. Al-Khafji is an extension of Safaniya and drains from it. If production is in the neutral zone Saudi only gets 50%, if it’s directly from Safaniya they get 100%. Hence overall it’s been agreed to limit production to 100 kbpd.
Saudi stock draw (crude + products) has been pretty steady at around 100 kbpd since late 2015 now.
Can it really be that high? 100kbpd is a draw down in inventory of 36,000,000 barrels per year which means over the last two and half years inventory has drawn down by over 91,000,000 barrels.
That would be about right. I found a chart where they were around 325 million barrels in 2015, and now around 229 million. I learned long ago, not to question George’s omniscience.
More like senescence than omniscience.
There must be something to be inferred from how constant the decline is, but I don’t know what. (Primary is Saudi crude, secondary are products).
George,
I would guess this means consumption plus exports are greater than production. 🙂
Their export “uptick” was definitely them draining storage, not increasing field production.
72 kk views in 60 days. More than a million per day.
https://m.youtube.com/watch?v=W9P_qUnMaFg
76,5 :O
I found another one. This makes four.
INSTITUTE FOR DEFENSE ANALYSES Review and Analysis of the Peak Oil Debate
• Proved (a.k.a. P1 or P90)—90% probability that more than this fraction of oil can be produced economically.
• Proved + Probable (a.k.a. P2 or P50—50% probability that more than this fraction of oil can be produced economically.
• Proved + Probable + Possible (a.k.a. P3 or P10—10% probability that more than this fraction of oil can be produced economically.
Okay, I am out of this debate. If you cannot accept the opinion of these four websites then I have nothing more to say.
Bye now.
Hi Ron,
https://secure.spee.org/resources/reserves-definitions-committee-rdc
https://secure.spee.org/sites/spee.org/files/prmgmtsystem_final_2018.pdf
The second link is to the most recent edition of the PRMS.
From Appendix A on Page 37 I did a screenshot. Note that for 1P it says “equal to P1”, but this is not the case for 2P or 3P. Care to explain why this might be the case?
Ron,
Now from the same document in the second link above, page 46 also part of Appendix A, we have the following where P1, P2, and P3 are defined. Again for P1 it says “P1 is equal to 1P”, but for P2 and P3 is does not say that P2 is equal to 2P or that P3 is equal to 3P.
Screenshot of page 46 from PRMS June 2018
Back ground on PRMS at
https://www.spe.org/en/industry/petroleum-resources-management-system-2018/
From page above:
The Petroleum Resources Management System (PRMS) is a system developed for consistent and reliable definition, classification, and estimation of hydrocarbon resources.
The Oil and Gas Reserves Committee has completed the revision of the Petroleum Resources Management System (PRMS) and the SPE Board approved it in June 2018. The updated PRMS is a consensus of input collected from consulting and financial firms, government agencies, and E&P companies. The process included a 90-day public comment period, and required input and approval by six sponsoring societies: the World Petroleum Council, the American Association of Petroleum Geologists, the Society of Petroleum Evaluation Engineers, the Society of Exploration Geophysicists, the European Association of Geoscientists and Engineers, and the Society of Petrophysicists and Well Log Analysts.
The paper can be downloaded at the link above or at the link below
https://secure.spee.org/sites/spee.org/files/prmgmtsystem_final_2018.pdf
It is based on the input from 6 separate societies of Engineers and geoscientists focused on the Petroleum industry, essentially the most up to date Word on Petroleum reserve definitions.
Read and learn, many of you probably have done this already.
Curious but did you read and learn anything from the four websites I posted?
Ron,
Yes. That they think P2=2P and P3=3P, just like you.
Possibly they have made the mistake that because 1P=P1, that in general xP=Px,
as is pretty clear, the SPE and 6 other engineering and geoscience societies, E&P companies, government agencies, and financial firms, who are behind the PRMS disagree. P2=probable reserves, P3=possible reserves, just as George Kaplan explained very concisely at the start.
The SPE nomenclature is the one used in the oil companies where I’ve worked, but as I said there’s a lot of confusion, it was best always to clearly say proven and probable etc.
George,
I agree.
It seems that a clear statement of the distinction between 2P and P2 is relatively recent (maybe 2015?). Laherrere rarely (or perhaps never) uses the P2 or P3 convention and prefers to say probable or possible, he tends to focus on 2P reserves which is the best estimate and can be aggregated correctly by simply adding which is not the case for proved reserves.
I actually was not aware of the P2=probable and P3=possible convention until you pointed it out about a year ago. I had been aware of the 2P=proved +probable and 3P=2P+possible convention for many years.
I have no oil industry experience like you and SouthLaGeo (and many others).
Guys, the reserves that exist likely bears little resemblance to any estimate, and if they were known to high confidence there would be no incentive to reveal the number. Why should you know?
Watcher,
Many oil companies are publicly traded and the owners want to know this information. In the case of national oil companies (who hold most of the known reserves), you are correct, we have no idea about their reserves and according to Laherrere the newer estimates by IHS are not as good as the older estimates (circa 1998) by Petroconsultants.
Hi Ron,
From your last link they used the following document as their source (link below):
https://www.iea.org/media/weowebsite/2008-1994/WEO2004.pdf
Figure 3.7 is on page 88 of the report linked above (a 577 page document that takes a while to download.)
That figure is reproduced below.
Perhaps the author assumed P2 and 2P and P3 and 3P are the same, just as you do. The IEA gets this right the piece you linked does not.
I won’t do a search to show all the cases that this is done correctly, basically it would be every IEA World Energy Outlook, every publication that Jean Laherrere has written, you get the idea, it’s a lot more than 4.
Saudi Arabia, domestic demand (products + direct burn) during July was down -511 kb/day from the average for July
https://pbs.twimg.com/media/DneKCrdWwAA07UE.jpg
Saudi Arabia imported 1000 kb/day of products in July including 353 fuel oil, 280 gasoline & 243 diesel.
https://pbs.twimg.com/media/DneKNICXoAIss5T.jpg
Net exports (crude & products) https://pbs.twimg.com/media/DneKgD8W4AINhWS.jpg
EIA Weekly U.S. Ending Stocks to Friday 14th September
Crude oil down -2 million barrels to 394
Oil products down -0.6
Overall total (shown on chart), down -2.6
Natural Gas: Propane & NGPLs up +2.4 (not included)
chart: https://pbs.twimg.com/media/DnekEQ4X4AEp5e4.jpg
You have to look at the bottom page, as it’s close to final numbers. But, it looks like the June increase came in a large part from District 1 and 2, which are the Eagle Ford.
http://www.rrc.state.tx.us/media/47108/own423_20180816_rrc180_jun2018.pdf
Wouldn’t let me edit. The first post above is for May close to final, this one is June.
http://www.rrc.state.tx.us/media/47664/own423_20180914_rrc180_jul2018.pdf
Districts 7c, 8, and 8A are the Permian.
So, it looks like more activity in the EFS in June, interesting and perhaps expected.
interesting new graph at crude oil peak
http://crudeoilpeak.info/latest-graphs
and a recent post
http://crudeoilpeak.info/what-happened-to-crude-oil-production-after-the-first-peak-in-2005
If you look at the first graph he presents [World Crude Prod to May 2018]
you can very clearly see that if you remove the top three countries from the graph, then world production clearly peaked in 2005. The three countries
-USA with shale after 2009
-Iraq with recovery of production after the USA invasion
-Canada with gradual increase
Even without these three, the tail does look fat and long if you extrapolate.
Qatar just appointed a new dood to run their SWF. It’s a mere $320 Billion, funded from LNG sales and a drop or two of oil as well.
Interesting investment profile. Top holding, Qatar National Bank (this is not the central bank). They own over 50% of it.
They own 17% of Volkswagen
6% of Barclays
10% of the London Stock Exchange
10% of Tiffany
They are the #10 SWF in the world.
Ready for an eyebrow raiser? They own 9.75% of Rosneft.
Russian Oil Minister Novak projects that Russia will hit peak Russian oil production in three years (2021). He also projects they could drop to 56% of current production by 2035.
He is lobbying for better tax treatment so these projections could be conservative. But, they could be a recognition of the effects creaming of the older fields.
https://themoscowtimes.com/news/russia-only-3-years-away-peak-oil-energy-minister-warns-62926
This should move the oil market, but apparently it was in a speech he gave last Tuesday and hasn’t had much publicity yet. After all, Russia only produces around 11 million bpd.
Wonder what would happen to the markets if KSA would project a 44% decline in production over the next 17 years?
Yeah, which one is the real Russia, or for that matter, which one is the real SA? 300k barrels within a year won’t stop the bleeding from Iran, or any of the other OPEC outages. Although it may help keep up with their decline rate. Most projections expect the Russia production to peak, or had already peaked. When they have their meeting as to who is going to share in eating up the one million barrel pie, they will be staring at that pie for a long, long time. I’ve been there, eyes were bigger than my stomach.
Yeah, it really amazes me what gets media’s attention, and concern. Fairly recently, it has been Novak’s statement that Russia sees oil in the $50 range, within the next few years. Holy moly! How do you justify $50 oil, when you are the world’s biggest, or close to biggest, oil producer and you are running out of oil, soon.
The most concern I get out of the whole thing, is Russia’s oil is going to decline. They will need more. Iran has it. So, does Iraq. Russia has their own wierd view of an Asian Monroe Doctrine.
Trump recently tweeted, again. OPEC is the problem. They need to get oil prices down immediately. So, the price of oil goes down, again. SA, may flood the market with some more of their inventory, leaving the world in a much more dangerous position, because it depletes inventory and decreases interest in new production. Kicking the can down the road.
https://www.bloomberg.com/news/articles/2018-09-20/iran-warns-it-will-veto-opec-decisions-that-harm-its-interests
Iran has its problems, but they are, no doubt, correct when they say SA is only pulling the oil out of inventory, without increasing production.
That can only continue until inventory falls to zero, as we approach that point oil prices will rise sharply.
Oh, it’s only a short term cure, for sure. The oil price lives and breathes on what the EIA comes out with on its weeklies. SA has increased exports to the US to help lower the draw. Problem is the exports. They were up, so we still had a draw. At a $8 to $9 spread, it won’t decrease. All we have is short term price declines based on jaw boning. I have no idea how long Trump is going to keep this shit up. No doubt, until Nov 4, but it runs out of gas soon thereafter. But, in the meantime, we have the SPR draw at Trump’s disposal of price lowering tools. Eleven million would work through probably October. Even lower the price, possibly.
So, we continue to stave off price increases by depleting inventories. Real smart. But, as every country is intent on hiding the problem, it will no doubt work. Just not in the interest of national security, only political security.
I’d really like to thank Ron for this post. The post itself, and the ensuing discussions have been a real eye opener. Too bad we can’t get this info to the rest of the world. But, then again, they don’t want to hear it. They will just raise P3, or 3P, or whatever.
If you ain’t cheatin you ain’t trying… got to keep the national average for a gallon of gas below $3. The margin of error is small for the GOP to keep the house and a little bigger for the Senate. I’m curious what does happen after the mid terms. It will be very interesting.
Guym- “The most concern I get out of the whole thing, is Russia’s oil is going to decline. They will need more. Iran has it. So, does Iraq. Russia has their own wierd view of an Asian Monroe Doctrine.”
I believe that in a few years other countries will need oil much more than Russia. Such as Japan, S. Korea, the EU. And the big one- China. China won’t stand around and let Russia make a move beyond Ukraine/Georgia/Azerbaijan, IMHO. New realities.
In fact, I think China is going to be putting their eyes more heavily on Russian oil. And they are smart enough to get access to it without firing a shot.
China is pushing hard at developing electric cars. They need oil the next 10 years, but then it’s done, or at least the own ressources will be enough again.
Otherwise, they would have to increase their military much more, more international bases to build up presences to secure theses oil claims.
From where will their electricity come?
Not from oil. Most likely bigger increases from solar.
Solar is an energy sink, so from where will energy come from? From nowhere. Only carbon dioxide emitting energy is a source. Everything else is a sink.
I’ve just added another person to my hide list.
Coffeeguyzz Asked:
From where will their electricity come?
Boomer Replied:
“Not from oil. Most likely bigger increases from solar.”
Coal, NatGas & Nuclear. The Russia-China NatGas pipeline goes operation in Dec 2019. China has multiple Nuclear power plants under construction. China always have is go-to energy domestic energy source: Coal
That said, China has the biggest auto-market and all of them are Oil burners.
Strategically it’s in China’s interest to phase out dependence on imported fossil fuels as soon as possible. Also, to lessen air pollution.
Why would China want to continue to build an economy dependent on imported fuel when they can own the world via renewables?
https://oilprice.com/Energy/Crude-Oil/Strong-Rise-In-Spending-Keeps-Offshore-Ahead-Of-Shale.html
16% growth in the shale sector in 2019, won’t increase production with decline rates. I’m expecting to see year 2019, as the great gobble up year for larger oil companies. A lot of their capex will be spent on getting acreage from the companies who won’t make it. New companies will start up with OPM to pick up that tier three stuff that would be lucky to make it at $200 oil price. Good to see offshore picking up, but growth is always much more long term there.
Guym,
I agree, the offshore investment increase probably won’t result in an output increase for 5 years unless this is just new wells being tied in to existing platforms to replace declining production from older wells, which would simply reduce decline rates.
According to companies like EOG, there are a fair number of “premium” tier one locations left to be drilled, I think it will be 2023 or so before we see a lot of tier 3 drilling (if ever), but there will be a gradual transition from tier one to tier 2 over the 2019 to 2023 period as the premium well locations gradually get completed. As you said in another comment, on the grand scale, 50 to 60 Gb from tight oil is a drop in the bucket in a World consuming 30 Gb per year of C+C. Peak in tight oil output is likely to be 8 to 9 Mb/d in 2023 and by 2025 or 2026 annual decline rates for tight oil output will be quite steep at 6.5% per year and they will increase to 11% per year by 2030 and then moderate to an average annual decline rate of 8.7% from 2030 to 2040.
Tight oil is a very temporary fix and extra heavy oil from Canadian oil sands is unlikely to be able to fill this gap, OPEC might be able to increase a bit to mitigate decline, but with disruptions in Libya, Nigeria, Venezuela, and Iran a 2023 to 2025 peak n World C+C seems pretty likely as there a lot of places with declining output currently which will probably get steeper with time.
I don’t think your projection in peak shale production in 2023 is out of bounds. Maybe a little high, but either one of us could be wrong for reasons as yet unknown. I just thing world decline rates will overshadow that peak production. Just a bumpy peak for awhile. And higher prices, because Trump has no control over geology, and not much else that I can think of either. Matter of fact, he is OOC, pretty much.
Why pump stuff out of the ground in order to put it in tanks above the ground? Werent the tanks underground as good as the tanks above the ground?
It’s not the size of the tank but the size of the tap that is the main consideration.
https://oilprice.com/Latest-Energy-News/World-News/Canada-Transport-Ministry-Fast-Tracks-Crude-Oil-Rail-Car-Phase-Out.html
This can’t help Canada’s immediate oil transportation problems.
Has anyone ever heard of 2PC and/or 2PCX. The data below is in billion barrels of C+C and is from BP. What is “existing fields and discoveries”? If it is an existing field, then it has already been discovered. Those numbers are unreal, especially the “undiscovered fields number.
Discovered+Undiscovered comes to 1,437 billion barrels above 2P and Undiscovered comes to 940 billion barrels above 2PC. Almost a trillion barrels are yet to be discovered. Bullshit.
Reserve Estimates
……………….. 1P…….2P…… 2PC…..2PCX
Non-OPEC… 175….283….. 555……1269
OPEC……….. 205…372…….597…..823
World……….. 381…655……1152….2092
tar oil, shale oil….sololumenescene acoustic heating extraction?
Hi Ron,
C is for contingent resources (these are discovered fields that have some reason for not being classified as reserves, waiting for project approval because of environmental considerations, next years budget approvals, or some other regulatory matter), X might be for prospective resources (those fields that geophysicists estimate will be discovered in the future), in the PRMS they use the symbol U rather than X.
For both the contingent and prospective resource classes there are low, best, high estimates.
So there is 1P, 2P, and 3P reserves
and 1C, 2C, and 3C contingent resources
and 1U, 2U, and 3 U prospective resources.
I think 2PC is the same as 2P+2C and
I think 2PCX is the same as 2P+2C+2U, and might be considered the best estimate of the total remaining C+C resource at the present time.
So 2PCX would be the remaining resources for the World, if we add this to cumulative production (1300 Gb at the end of 2015) we would have a URR estimate of 3392 Gb for World C+C.
Jean Laherrere’s recent estimate for World URR is about 2815 to 3215 Gb, though he seems to favor the lower estimate of 2815 Gb.
USGS estimated about 3000 Gb of conventional resources in 2000, if we add another 400 Gb of extra heavy and tight oil resources, we get 3400 Gb.
For a low end estimate, HL gives about 2450 Gb for C+C-XH-LTO URR, if we take a 350 Gb estimate for World XH plus LTO resources, we would have 2800 Gb for a URR (very close to Laherrere’s recent estimate.) I expect we will see some discovery and reserve growth that may push this estimate to 3050 Gb (roughly between the estimate in the piece you linked and Laherrere’s August 2018 estimate.)
Just a silly idea…1P is 1/3, 2P is 2/3, 3P is all oil existing? 1P is 50/gallon extraction cost; 2P is 100/barrel…3P is 200/barrel? No way to get to 3P …no enough funds.
POTUS harping on OPEC that Oil is too high!
If Oil was kin to US Healthcare racketeering, it be 1K or more.
Want to be Famous?
https://community.oilprice.com/topic/3528-the-great-oil-price-prediction-challenge-of-2018/
2018-09-20 (Bloomberg) Chart showing the price of Brent and Trump’s tweets calling for lower prices.
https://pbs.twimg.com/media/DnjuT7YXgAYiRAG.jpg
IEA – Key World Energy Statistics (2018) is the IEA’s introduction to energy data and statistics, including energy indicators, energy balances, prices, RDD budgets, CO2 emissions and forecasts.
You have to create an account to be able to download free publications.
http://www.iea.org/statistics/kwes/
Dennis has a new post up. Might want to repost your last posts in the new area