The new January OPEC Monthly Oil Market Report is out with crude only production numbers for December 2016. All charts are in thousand barrels per day.
Indonesia has left OPEC so they are now down to 13 nations. The Indonesia historical data has been removed from the entire OPEC data. Therefore the December data does not reflect any drop due to Indonesia leaving OPEC.
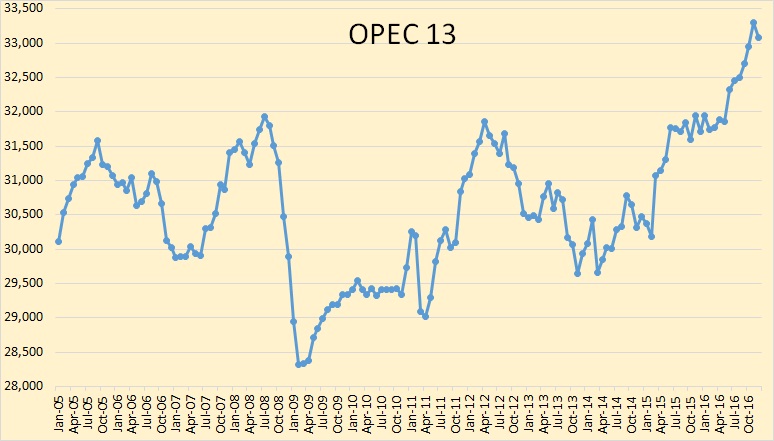
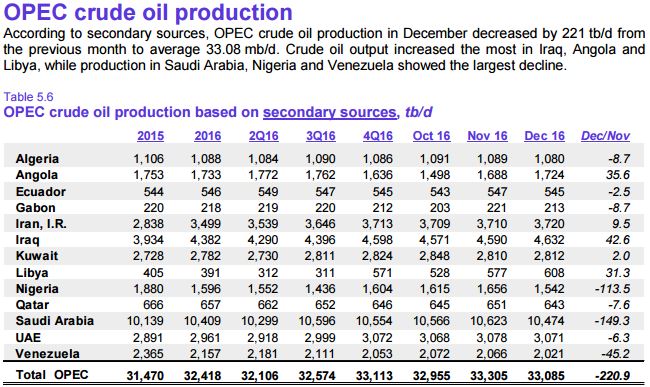
OPEC crude oil production dropped to 33,085,000 bpd in December. That was a drop of 220,900 bpd. However that was after the November production numbers were revised upward by 175,000 bpd. Therefore the drop was only 46,000 bpd from what was reported last month.
Officially, the OPEC agreed to cut production by 1.2 million barrels per day. Those cuts are supposed to kick in in January. But I would not count on their January production numbers being down that much.
OPEC’s December production represents an all time high for the cartel.
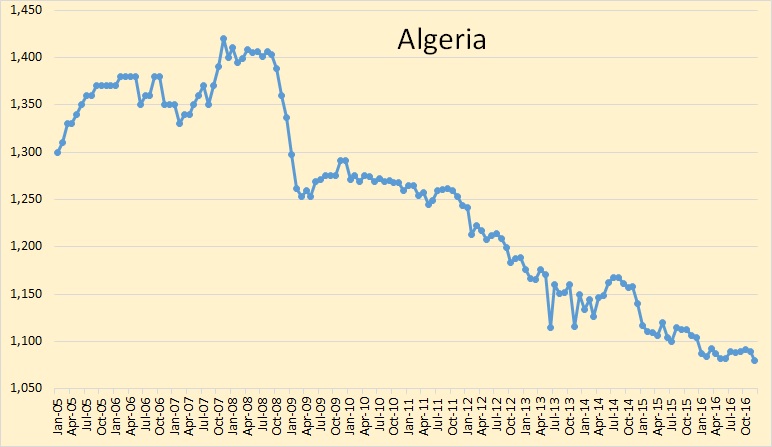
Algeria is in slow decline.
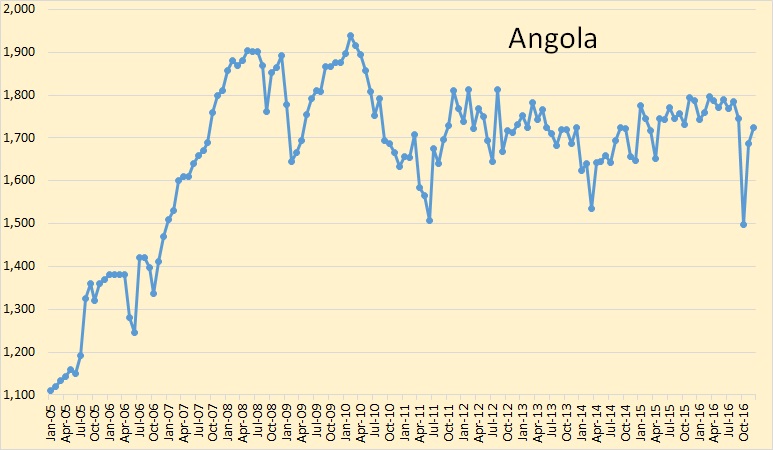
Angola’s production continues to recover from the sudden drop they had in October.
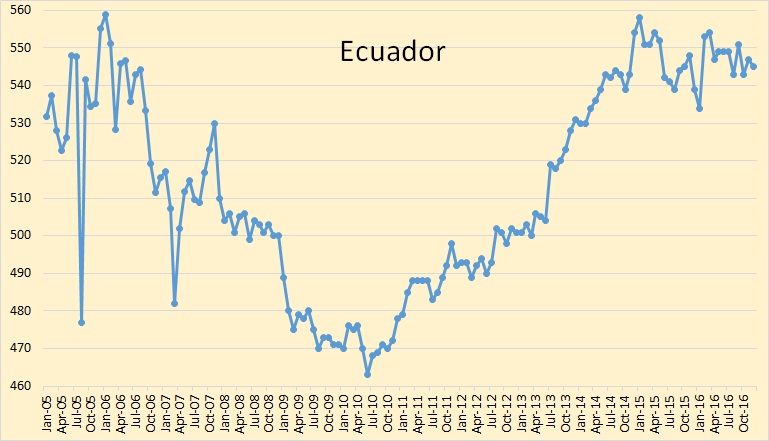
Ecuador seems to be holding steady for the last two years.
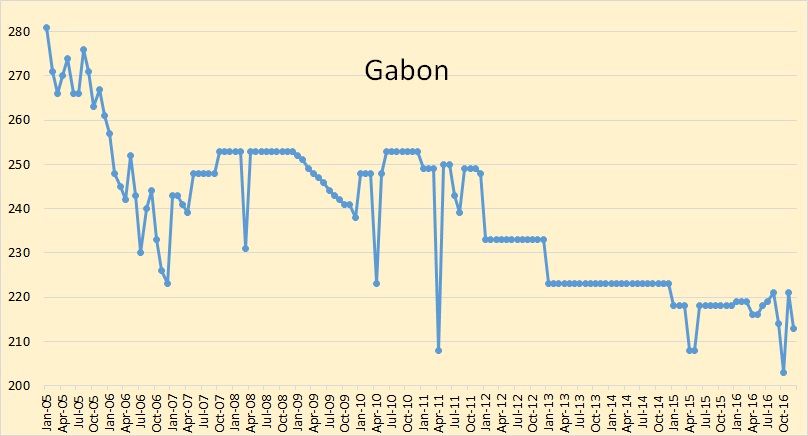
Gabon was added to OPEC a few months ago but their production is so low it will have little effect one way or the other.
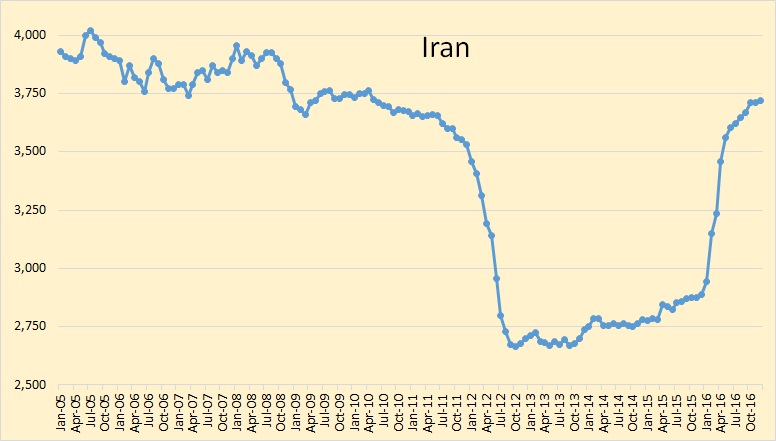
Iran’s increase since sanctions were lifted has slowed to a crawl. There are other problems on the horizon for Iran. They are talking about changing all their oil field contracts to “buy back” contracts. That is they want the option to nationalize all everything. This will likely cause a mass exodus of foreign oil companies from Iran and hit their production considerably.
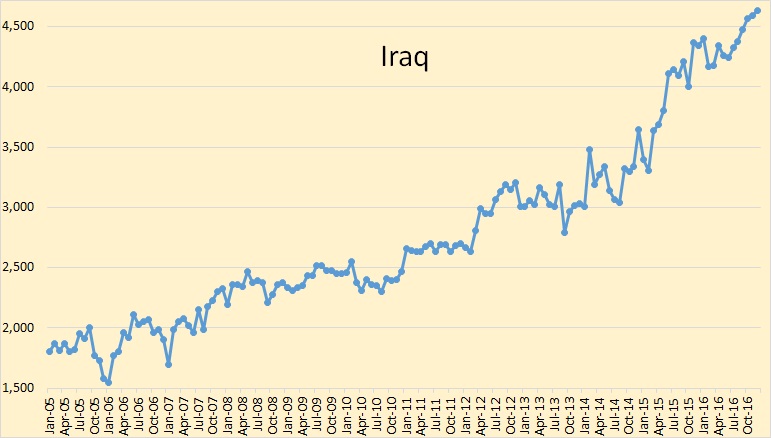
Iraq is the wild card in the plan to cut production. Their production was up 42.6 thousand bpd in December. A lot of analyst doubt Iraq will cut their fair share.
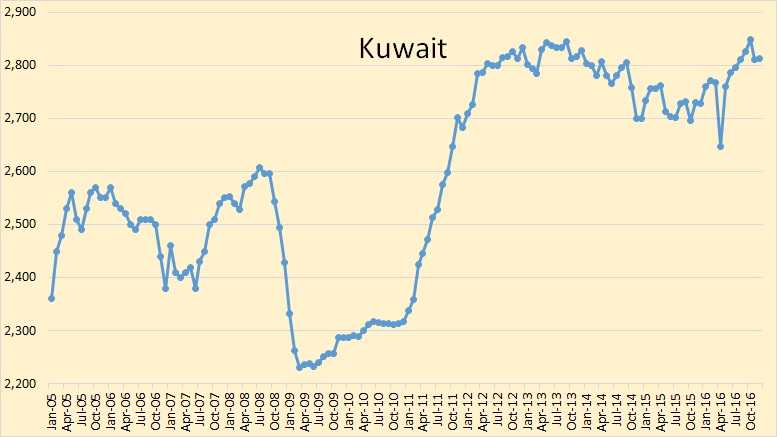
Kuwaiti December production was almost flat from November.
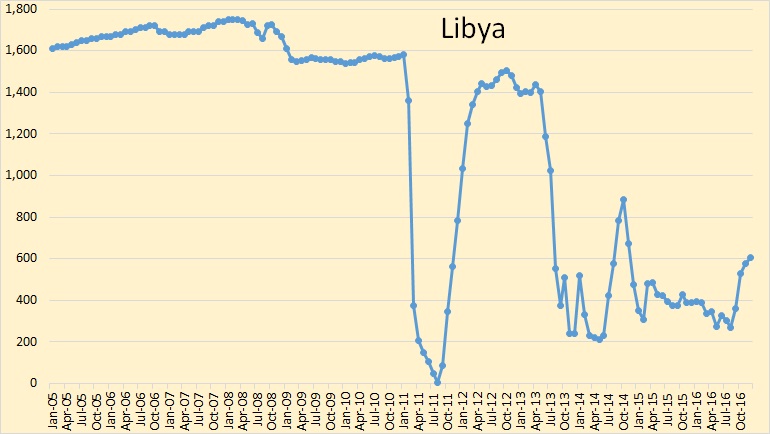
Libya continues to recover but ever so slowly now. No doubt that Libya will say they must cut only from where their full production would have been had they no political problems. I think we can look for Libyan production to continue to increase, or to follow their political fares.
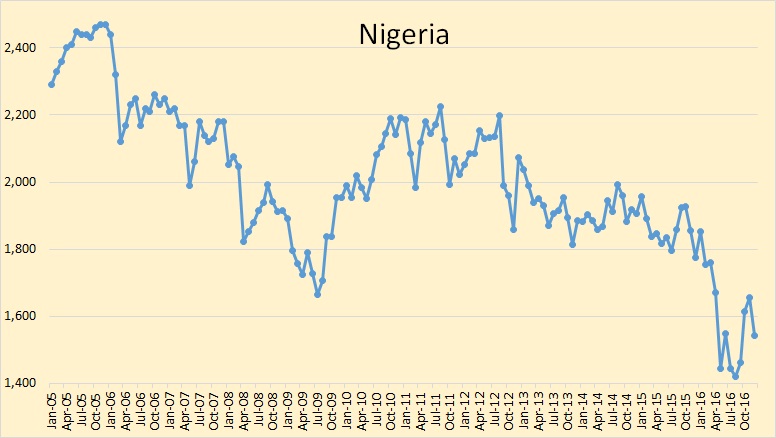
Nigeria took another hit in December. Their production will also follow their political fares. Their January production will depend on how successful they will be in fighting off the rebels rather than any OPEC dictates.
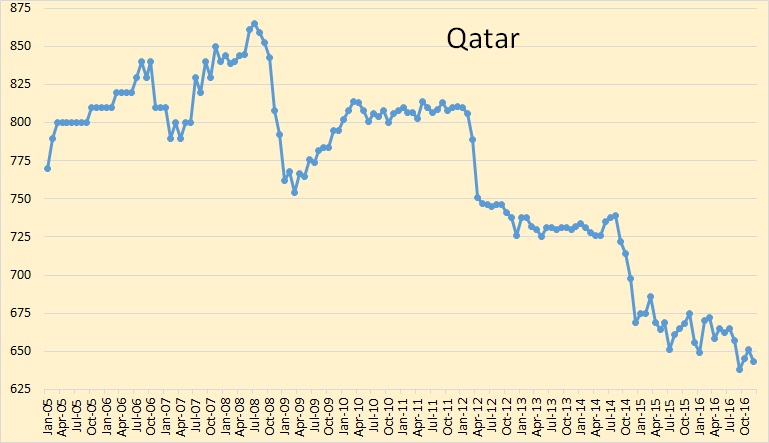
The decline in Qatar’s oil production seems to have slowed since late 2014. But nevertheless their decline continues… and will continue.
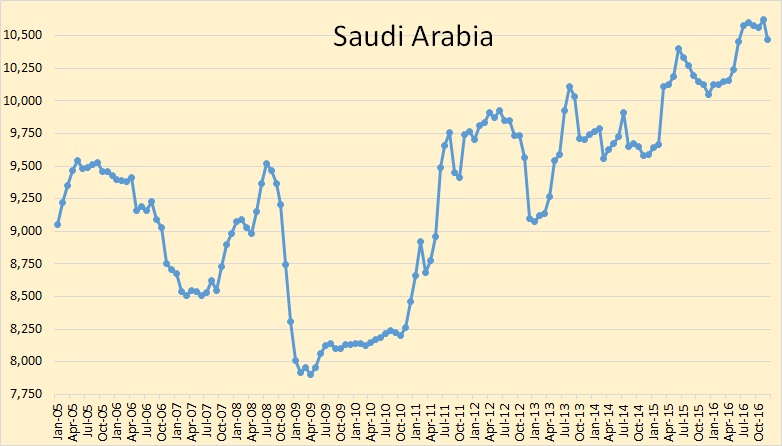
Saudi Arabia’s production was down 149,000 bpd but that was after their November production had been revised upward by 111,000 bpd.
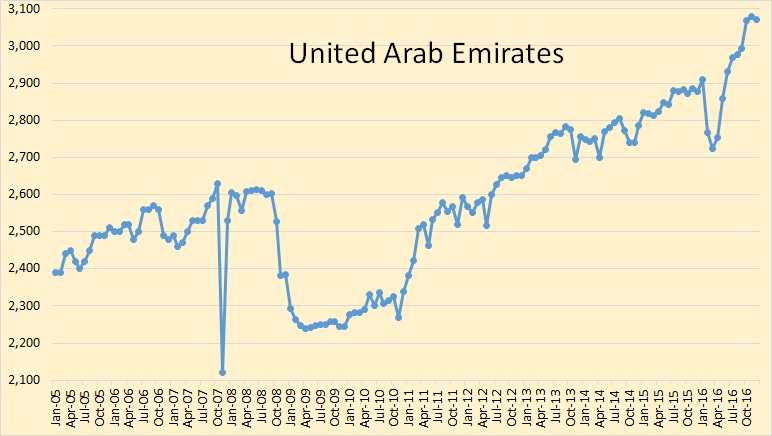
UAE production was down 6,300 bpd in December but that was after their November production had been revised upward by 82,000 bpd.
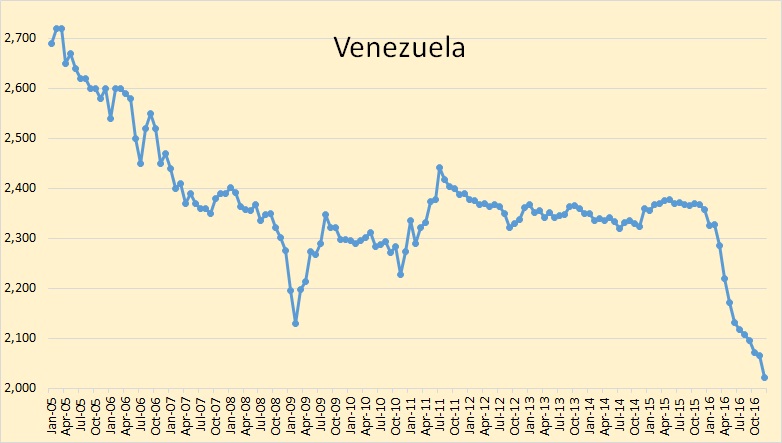
Venezuela took a huge hit in December, down by 45,200 bpd, and that was after their November production had been revised downward by 31,000 bpd. Venezuela has very serious political problems.
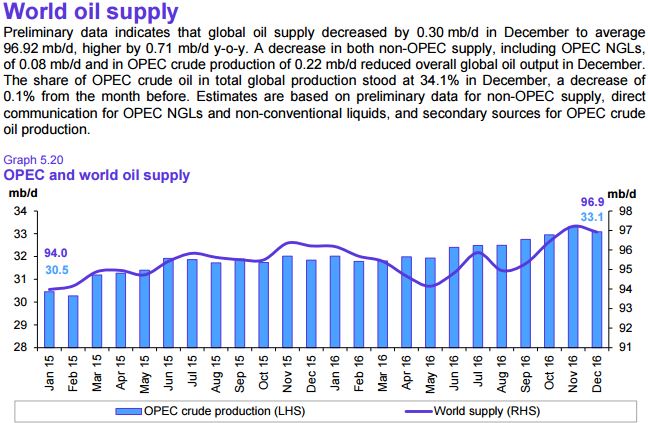
World oil supply hit a new high in November but was down in December. The 2016 average is still slightly lower than the 2015 average.
267 responses to “OPEC December Production Data”
Ron, you might be interested in this:
Global Energy Graphed
The charts here are live, so you can read the data from the underlying data base. Currently have the whole of IEA monthly oil production in there, lots more to come.
Ron,
We are going to have to come to grips with the reality of 3, not 1 or 2, but 3 million bpd more production at a price less than 12 Spring 2014’s since Jan 2015. That surge in output showing unequivocal disinterest in price is undeniable.
something ate the / in 1/2
Watcher, I have no idea what you are talking about. Right now the average 2016 world C+C production is still about 100,000 to 200,000 bpd below the average for 2015. World peak will turn out to be November 2016 and that is about 700,000 bpd higher than the November 2015 peak. But that was due to the recent surge in OPEC production.
Unfortunately the EIA only has data through September. But the last three months of OPEC data will not upset things as much as you assume.
“World peak will turn out to be November 2016 and that is about 700,000 bpd higher than the November 2015 peak. But that was due to the recent surge in OPEC production.”
So peak oil did not occur in 2015.
Also, still possible for yet another higher peak than Nov. 2016 to occur in the future.
And the beat, the rhythm of oil being pumped, just keeps on going…
But peak oil for export was 2005.
No, net exports was higher in 2015. Not by much though.
Hi Jeff,
Where do you see the data for this?
Thanks
BP Statistical Review of World Energy http://www.bp.com/content/dam/bp/excel/energy-economics/statistical-review-2016/bp-statistical-review-of-world-energy-2016-workbook.xlsx
BP provides data for export and consumption so it´s easy to calculate.
See also http://mazamascience.com/OilExport/
Thanks Jeff. Indeed, according to their data the Total World Exports of Oil increased from 52Mbd to 61Mbd from 2005 to 2015.
So, no peak export oil, just yet.
And as you can see from the below chart, it has been all OPEC as far as production increase is concerned.
Ron,
Russia’s C+C output in October-December 2016 was 425 kb/d higher than in the same period of 2015
I understand that Alex, but that is already in the figures thru September. And Russian production for October thru December is only about 100,000 bpd above September. That will not alter the 2016 figures enough to push 2016 world oil production above that of 2015.
So not just OPEC didn’t care about price.
Russia didn’t care either. Well above early 2014 production levels, when price was more than double.
In fairness we could say OPEC’s disinterest in price is mostly Iran and Iraq as the source of the upticks, but Libya is just as much a special case in the other direction, and ditto Nigeria. “Other factors” sort of thing. The numbers are what they are. Production has risen as price fell.
Regardless, btw, even your world C+C chart shows a LOT more production today than May 2014 when the price was more than double today. And your point is valid, most of that is OPEC, but even the non OPEC is higher than Spring 2014.
It just isn’t determinant. That is clearly inescapable. We’ve had more than enough time to see reality.
From end-2014 to end-2016, both OPEC and Russia did care about market share.
That approach may return in 2H 2017 when there will be signs of rebound in US LTO production. Saudi Arabia has already said that output cut agreement may not be prolonged for the second half of the year.
BTW, Russian companies remained profitable and free cash flow positive in 2015-16. Hence, it made sense for them to maximize revenues, earnings and cashflows thru higher volumes.
Am I all alone? Probably. But, with all due respect, I am tired of hearing about market share with a commodity.
To exaggerate the point. It is almost like some wheat farmer in Kansas says that he wants to maintain his market share. Or, maybe more to the point, the largest gold producer in the world saying that they are willing to sell gold at any price in order to maintain their market share.
The oblique point to that point is pretty straightforward — namely the entire Peak Oil concept is about scarcity.
If there is scarcity every producer will have a customer. What can market share possibly mean if there is too little to go around and every drop produced will have a customer?
(As if that is not already true. We have to keep in mind all those buyers out there who have no intention to resell, but rather just want to store it, for going on 3 yrs now)
clueless,
You may be tired, but there were many episodes when oil producers were struggling for market share over the past 35 years (and earlier in the history of the oil industry).
In 2015-16, four large producers have significantly increased oil output and exports: Saudi Arabia, Iraq, Iran, and Russia. Unlike your wheat farmer in Kansas, none of them were producing at loss, and they were trying to partly offset lower prices by higher volumes.
None of them trusted each other; and some of them were (and remain) political rivals in the Middle East. In that situation, if you cut production, others may take your market share, and you will be producing less, while oil prices would remain low.
There were several other countries that increased output thanks to start-up of the projects initiated during the years of high oil prices: Canada, Brazil, Norway, and even U.K.
Market share is a WEAPON in terms of economic warfare. PRICE is a WEAPON in terms of economic warfare.
Countries that hate each others guts and that compete selling oil as exporters can and are obviously in my estimation trying to bleed each other dry, in terms of revenue, in a very real way.
The loser has less power and less influence. We don’t know yet who will give up first and REALLY cut back production.
But we might know, within the next few months.
There’s a lot more to it than just economic warfare, but anybody that denies it plays a major role is naive to say the least.
“Market share” is a euphemism for “cash flow” in this case, I think.
“Russian production for October thru December is only about 100,000 bpd above September.”
Correct.
Hey Watcher I normally get your dark memes right off the bat, but could do with some clarity on this one. Where is this 3mbpd of which you speak?
Ron’s OPEC chart.
There is hysteresis in the response of oil production to price. Oil companies respond to low oil prices by pumping as much oil as they possibly can today (to pay bills) and cutting capex so that production decreases later. The response in production to the current low prices should be apparent in 2020. The hysteresis also occurs with respect to high prices. When prices are high, capex increases, but the increased production is not seen immediately because it takes time to come online. Once online, the production is not cut, even if prices decrease. In fact, low prices tend to increase output from existing wells.
So this hysteresis theory says that when prices are low capex gets low with a later response in production, and . . . because flow is low generates less revenue with the allegedly higher price than it might otherwise.
And if price goes high then you increase capex so that oil flow comes online at the later lower price to earn less money.
Shrewd. You’re selling your reserves for the lowest possible amount of money.
That’s correct. That’s why I don’t think much of these models that use optimization to predict prices.
Shrewd. You’re selling your reserves for the lowest possible amount of money.
If you must have the cash, and just about every oil producer appears to be in dire need of the cash, twenty or thirty bucks net over actual cash cost of production for a barrel in the HAND TODAY is worth over a hundred bucks for a barrel in the five or ten year down the road BUSH.
It may not be shrewd, but it’s not at all hard to understand.
Schinzy is dead on. This sort of oscillation in supply and price, and the reasons for it occurring are covered even in sophomore level economics texts.
The only real difference between the oscillations in oil and in other industries is that the time lags are longer in oil than in most industries.
They are as short as two or three years in my industry, agriculture, in respect to grain.
But in my own specialty, orchards, they are similarly long. It takes tree fruit growers five to ten years to significantly expand production,and once new orchards are established, you must either produce them,or abandon them, there’s hardly any middle ground at all. It’s usually cheaper to produce them, you lose less overall that way, and you can generate a little cash by producing them as well, most of the time.
The time is variable. A 10 well program in the Permian basin may have a one year lag, a large (200,000 BOPD) project in the Ecuadorian jungle can be say five years, a development in the Kara Sea could be say 7 years and reaches plateau in 9 years.
My guess is that outside of LTO, long term projects are cut first. I still think the strongest effects of the current price downturn will be seen between 2020 and 2025. Possibly beyond 2025 if prices do not significantly rise from where they are now.
LTO is the exception and the wild card. I am not convinced that capex cuts in LTO would not have happened even if prices had remained high. Low prices attracted large amounts of fresh capital because investors have been taught to buy low and sell high. Bankruptcies attract investors like flies to a dung pile. Lower earnings on sales may have been made up for with capital inflows. I continue to be amazed at LTO’s capacity to attract capital. We will see how long it continues.
Hmmm. That’s a very interesting guess as to the timing.
We have a secular reduction in demand on the horizon — a very large one. My forecasts are not precise (they could be off by 5 years in either direction) but I’m projecting that circa 2023, secular demand reduction will exceed the natural decline rate of “normal” (not fracked) oil fields.
I think you can all see what happens then.
Someone help me out here? My assumption is that GOM production is under the purview of the BOEM. What BOEM and EIA report as the production from GOM differs drastically. November is incomplete, but the three earlier months has EIA reporting hundreds of thousands barrels a day higher than what the BOEM reports. BOEM data has it trending down, and EIA has it trending up.
So it is not just the November data that is incomplete, but the August, September and October data as well. And of course, the earlier months are more complete than the later months.
Guy, BOEM is kinda like Texas, that is they report the data as it comes in. And if it isn’t in yet, they don’t report it. The EIA, on the other hand, estimates production that has not been reported yet. Eventually, after a few months, the BOEM data will equal the EIA data. Of course the EIA data will be revised as the data comes in. It is usually, but not always, revised downward.
This is BOEM data for new producing leases in GoM. Note that data for Gunflint has just been added, and the profile looks a bit more realistic. I added a few others that had started up as well, including Caesar/Tonga – this had a short blip and then faded away to nothing – there has been no data for about three months so this may come back as as well. All the other data is up to date to October (some for November is available but not all so I haven’t shown it). It is noticeable how early the deep production starts to come off plateau (assuming it has been achieved) – e.g. Lucius is already cutting water in high quantity, Tubular Bells and Son of Bluto 2 are in decline. Also Mars may be starting to blow down gas caps on one or two of the leases so production will decline unless they can balance with new tie backs (I am not aware of any due though).
Everything I have read, so far, indicates a max of 1.4 million a day. That is vs the current 1.6 and upwards reported by EIA. They originally projected a 1.8 for 2017, and have recently moved it down to 1.7.
I think you’re probably about right: BOEM has 413 mmbbls so far this year, which is probably to October for most leases, so giving about 1.36 mmbpd average, but there are some big fields that haven’t fully reported past July like Thunder Horse and St. Malo, and there should be a ramp up of at least 100 kbpd for the last two months. But 1.6 is looking difficult, and the higher projections for next year won’t happen (there is only about 60 kbpd in development, some of which won’t be seen till 2018, and maybe 100 kbpd in continued ramp up, but at least 150 kbpd in decline coming as well.
Thanks, George!
AlexS,
“Is that possible to get similar chart for XTO operation in the Delaware basin
(or NM portion of the Permian; or Permian in general).”
Sure, see below graph.
As you can see, also XTO’s 2015 wells in the Permian seem to follow the 2013 rather closely. Only oil is shown, but the gas part doesn’t seem to be significant (you can see this by changing product to gas).
I got there in 5 steps:
1. Going to my latest US update
2. Browse below to the “Advanced Insights” presentation
3. In the “Operator (current)” selection on the right side, make sure only XTO is checked. You can do this most easily by first clicking “All”, to deselect all operators, and then to scroll down and select XTO (there is also a search function to make it easier). After that click “Apply”, and anywhere on the presentation.
4. To show the wells by years, I changed the “Show wells by” to “Year of first flow”
5. I only checked the Permian basin
Enno, thanks a lot
I wasn’t smart enough to find it myself.
It seems that XTO’s wells in the Permian perform more or less similarly to Bopco’s, although there are significant annual fluctuations.
You’re welcome Alex,
> I wasn’t smart enough to find it myself.
I don’t belief that, and I’ve learned to look different at this: if it’s difficult to find something, that means the design can be improved; the issue is not with the user (well, okay, most of the time!). For now I can’t do much about that, but I can describe the steps needed to answer a particular question, and hope it benefits others as well.
> although there are significant annual fluctuations.
Indeed, I’ve noticed that individual well results vary wildly in all basins, so it’s always good to look at larger samples, before making conclusions. This is also why I’m not so fond of cherry-picking a few wells, as companies sometimes do in their presentations, or certain analysts on other sites. It’s meaningless, as it allows one to proof anything he wants.
“For now I can’t do much about that”
You are doing a herculean work, which requires a big research team.
I am really impressed!
” it’s always good to look at larger samples, before making conclusions.”
I agree. I think a more or less representative sample should include at least several hundred wells.
Huh. 3-year lifespans for wells.
Not worth drilling even at current prices.
FWIW, the latest EIA Weekly Crude Oil Stock report shows the stock level decreasing compared to the 5 year range.
http://www.eia.gov/petroleum/weekly/images/crstuss.gif
Granted, the top of the range is probably 2016 values, but they are still coming together.
Who knows what the rest of the world is doing.
OECD stocks are on 4 month decline, China also down (both from OMR). Based on Jodi data looks like Saudi stocks are on decline as well.
This shows world stocks according to Jodi – hard to see what all the fuss has been about. Note they don’t have every country – e.g. they don’t have China who probably have been increasing storage (I don’t know where OPEC get their data for them). The drop at the end is partly because not all the data is in (they are left as zero entries) but partly because of a real fall in OECD storage as shown in the OMR.
These are Saudi stocks according to Jodi – there has been a decline but it looks to have flattened off a bit. I guess it will accelerate now if they are reducing production, unless they can compensate by reducing internal use (e.g. switching to gas for power – which I think is going to be difficult as their electricity demand is increasing at 8% yearly, or reduce exports).
Colombia production dropped 2.1% to 837 kbpd – the reason (Google translation) is given as “The causes of the decline were operative and of public order, to a lesser extent.”
They are down 15% year on year. Average production for 2016 is 885 kbpd. Hard to see them maintaining a plateau next year.
SA wants a near-term proven history of high production for their Saudi Aramco IPO.
However, the ideal condition for the IPO is higher prices.
The time line of OPEC policy, SA production, and the IPO of Saudi Aramco is sensible from a financial perspective.
Peak oil is a natural process that has a several percent buffer of policy and economics.
The market currenty devalues the power and goal of Saudi Arabia. They desired high production before the IPO (to prove capability), and desire high prices during and after.
As the world’s most trusted source of reserve capacity (whether that trust is valid is another issue) SA has built trust of that capability as prices plunged.
At the very least, the leader of OPEC has tremendous incentive to increase prices as the IPO approaches, and their actions leading to the OPEC cut lend to the idea that they have used their influence to maximize their potential gains (as any sovieirgn entity should do).
To boil it down, SA’s objectives dictate OPEC policy overall. The IPO timing gives incentive, or was even intentionally timed, to coincide with a recent past of increasing production in the face of lower prices WHILE SALSO coinciding with higher current and future prices. If not intentional, cause it is happening, it was tremendous luck.
World liquids supply in 2015-17 (mb/d)
Source: OPEC Monthly Oil Market Report – January 2017
Note: * 2016 = Estimate.
2017 = Forecast, subject to review, following the most recent OPEC – non-OPEC Meetings.
** Data includes Indonesia.
As we can see, according to OPEC estimate, non-OPEC total liquids supply (excluding processing gains) was down 0.72 mb/d in 2016. The biggest declines were in the U.S. (-0.41 mb/d) and China (-0.31 mb/d), followed by Mexico (-0.13 mb/d) and Colombia (-0.12 mb/d).
OPEC total liquids supply increased by 1.11 mb/d, including + 0.95 b/d crude oil (according to secondary sources) and + 0.16 mb/d NGLs, condensate and non-conventional oils.
World liquids supply, excluding processing gains, but including NGLs, biofuels, and other liquids, was up 0.38 mb/d.
Unfortunately, OPEC, IEA and EIA do not provide separate numbers for non-OPEC C+C production in their monthly reports.
IEA OMR is out:
https://www.iea.org/OILMARKETREPORT/OMRPUBLIC/
They have definitely moved from a call on OPEC to a call on shale to meet all future demand growth.
“Whether it be shorter drilling times or larger amounts of oil produced per well, there is no doubt that US shale industry has emerged from the $30/bbl oil world we lived in a year ago much leaner and fitter. The IEA has anticipated for some time that LTO production will increase in 2017, but we are now expecting an even larger increase of 170 kb/d, following a decline of nearly 300 kb/d last year.”
U.S. total C+C+NGLs supply is expected to increase by ~600 kb/d year-on-year in the second half of 2017
Key growth drivers are NGLs and Permian C+C
In the Bakken, year-on-year declines are expected to continue in 1H2017, with flat output in 2H.
Texas Production for November should be out soon. I think the results will show how EIA and IEA are missing that production from Aug to Dec has declined. Not trending up as they suppose. A supposition of 170k per day is way off base, It could level off, but increasing by 170k is not in the cards.
I guess I am not a good palm reader. Texas production just reported, with an implied bump of about 35k a day for November. Everything else shows it should trend down.
Bakken production numbers for November are published. As others may elaborate more on the data, I just want to show the huge structural shift shale oil underwent over the last two years. In below chart producing wells show a yawning gap to actual production. Despite 64 more producing wells in November, production declined. In 2013 just 8000 wells produced the same amount of oil as today. However today 11000 producing wells are needed to produce the same amount. This is 40 % more, which actually increases operating cost by 40% per well. The ‘Red Queen’ effect really kicks in now and makes shale production increasingly unsustainable.
Bakken November statistics have been already discussed.
November production volume is a reversal to mid-2014 levels, not 2013.
8000 Bakken wells that were producing at that time included a much higher percentage of new wells than the current 11000 wells. In 2016, there were much less new well completions than in 2014.
That explains lower output per producing well.
Compared to the wells completed in previous years, new wells in 2016 show slightly higher average IPs. They also show slightly higher decline rates, but in sum we may conclude that average EURs per well are at least not deteriorating. That means that Bakken sweet spots are not yet exhausted. That also means that, with higher drilling and completion activity, Bakken production may rebound.
AlexS,
The percentage of new wells is exactly my point. Call it the law of high numbers. In order to increase production in the Bakken more than 4000 wells per year have to be drilled. At the early stage of the boom 2000 wells (which were then 100% new wells) were enough to increase production by 200 000 bbl/day. Today 2000 new wells ( which are now 20% new wells) just are enough to prevent production falling not more than 200 000 bbl/d. This is a mathematical issue. This will be also the case for the Permian, which is at an earlier stage of the bubble, so that more people can be fooled to invest in. Think of Bakken as a single company. At the early stage it had to invest USD 10 bn (2000 wells x 5 mill) to get 200 000 bbl/d production. Now the Bakken company gets 200 000 bbl/d less despite an investment of USD 10 bn. This is exactly why money is made a the early stage of a bubble, while the late comers are holding the bag. From now on more and more money has to be invested to get out less and less. It does not matter if it is oil or postal stamps, Bakken or Permian. It is the law of the bubble. Anyone who does not understand this will be paying a high price.
Heinrich Leopold,
Output growth (decline) in LTO plays depends not only on the number and productivity of new wells, but also on decline rates of the existing wells.
In general, the older is the stock of existing wells, the slower is average decline rate.
In 2011-2014, when production was increasing at very high rates, the share of new wells (with high decline rates) was increasing, and hence average decline rates were also rising.
Today, the existing stock of bakken wells is older than it was 2 years ago; and hence less new wells would be needed to stabilize production at current levels.
As I expect very slow growth rates for the Bakken from mid-2017 until the end of this decade, the number of new wells needed for this slow growth will be much less than for high growth in 2014.
The chart below from the latest EIA Drilling Productivity Report shows that in absolute terms monthly production declines from existing Bakken wells have peaked at 60 kb/d in early 2015 and have slowed to 51 kb/d now.
“As I expect very slow growth rates for the Bakken from mid-2017 until the end of this decade, the number of new wells needed for this slow growth will be much less than for high growth in 2014.”
But if the older wells continue to decline, how can you say you will need fewer new wells? The older wells are declining, so you’d need new wells to cover those, and then for any growth at all, you’d need more wells to generate a net gain.
Seems like no matter how you want to state it, in an area of declining production the only way to maintain or expand production is to keep drilling more rather than trying to coast along.
‘Permania’ grips the US shale oil industry: “As one respondent to a recent survey for the Federal Reserve Bank of Dallas put it: ‘Permian transactions are approaching price multiples associated with a bubble or a Ponzi scheme’, reminiscent of the property boom of the early 1980s or the technology bubble of the 1990s.”
It’s possible to hold production steady drilling a steady number of wells, even if well quality declines a bit over time. The trick is to have hyperbolic declines, and to stretch well life, so you can avoid having too many wells go off line. The first time I worked on this topic was 1978, so I have a lot of hindsight. Again: got to have hyperbolic declines which reach a very low decline rate (say 7-8%) when they are still commercial and can produce for 20 years. I don’t know if these shale wells do the trick.
Fernando,
Conventional wells decline in the range 5-15 % per year, shale oil and gas wells decline between 30-60% per year – and this is not just for the first year, it is for any following year.
This is the fundamental difference between shale and conventional production: shale can generate production very quickly at low upfront costs. This is why companies boast cost advantages versus conventional production. However, the picture changes completely over time. A well producing 1000 barrels and a decline rate of 50% just produces close to 100 barrels after three years.
If the operating/maintenance cost is around USD 1000 per day and well in the first year – which gives an impressive USD 1 per barrel – the operating costs balloon after three years towards USD 10 per barrel – although they remain the same per well.
“shale oil and gas wells decline between 30-60% per year – and this is not just for the first year, it is for any following year.”
Wrong. Decline rates for shale wells gradually slows ultimately reaching about 7-10% per year
AlexS,
Shale wells decline is slowing down when the wells are very old and down to a trickle.
Somewhere, the steep decline in production per well (from 140barrels per well to 80+ barrels depicted in your own chart) must come from, if not from annual declines. The evidence is now really striking.
Heinrich, these wells I referred to had pronounced hyperbolic decline. First year was about 60% decline, by the sixth year the decline was 10 %. I was trained to direct planning for a drilling program intended to keep production steady at 50,000 BOPD. This was accomplished with two drilling rigs, four completion rigs and some time devoted to gas and injection well drilling and completion. This operation was extremely fine tuned because we had to meet the 50k as a result of an agreement with the government, but there was reluctance to push production higher because we wanted positive cash flow out of that country.
“This is the fundamental difference between shale and conventional production: shale can generate production very quickly at low upfront costs”
How can you add a gazillion tons of sand or ceramic beads and a gazillion gallons of water and miles of laterals, lots of extra steel, etc, additional chemicals, crews and equipment to do the fracking, etc, and pay for all of this extra work and materials for less than you can drill a conventional well ?
Why should a conventional barrel of oil cost MORE than a barrel of shale oil?
Is the typical conventional new well drilled these days producing LESS oil for the first couple of years than a typical tight oil well ? Does the oil from a typical new conventional well sell for LESS than oil from a fracked well ?
AlexS,
Yes the total legacy rate declined, yet there is also lower production. So, the legacy rate as a share of current production is still growing.
Any bubble has a different size and shape. In this case decline rate of wells, geology……. determine the bubble. However, it is difficult to decide when it is time to go out of a bubble. Even Greenspan admitted that it is difficult to see if you are in a bubble and when it is time to act (he did not see the high tech bubble bursting in 2000).
Some bubbles are very shallow and take a long time (the bond bubble lasts now for at least 20 years). However the shale bubble is quite sharp and short. This is what the numbers tell me.
Why does the IEA more rigs and better productivity will increase US LTO when we have data from places like the Bakken showing the decline rates?
The IEA expects recovery in US LTO production to be driven by the Permian.
A slower recovery in the Bakken will follow from mid-2017.
Hasn’t there been some discussion that the Bakken is permanently on the decline because whatever money there is to put into LTO will shift to the Permian?
Bakken oil rig count dropped 9 times from September 2014 highs (198) to May 2016 lows (22). This was the main reason for the drop in oil production.
The recovery in rig count since May 2016 was very slow and uncertain.
Current drilling and completion activity is not sufficient to reverse the declines in production. But year-on-year decline rates have bottomed in 3Q2016 (-17.7% in August) and have slightly improved since then (-12.8% in November).
The IEA expects Bakken output to start increasing on a yearly basis since mid-2017.
Year-on-year change in Bakken oil production
But, as I asked before, is it game over in the Bakken, with the new focus on the Permian?
Texas’s Permian Basin is only U.S. oil-producing region where production will rise – MarketWatch: “The Bakken has suffered from ‘lack of development interest’ since the oil downturn, the Barclays analysts said. ‘Some larger producers in the basin have opted to focus more on other assets in their portfolio, while others are hamstrung by heavy debt burdens, unable to develop their acreage at a normal pace,’ they said.”
U.S. Shale To Put A Firm Cap On Oil Prices | OilPrice.com: “The rest of the shale oil patch will experience declines in production, including Bakken, which will see the greatest decline, at 20,000 bpd; Eagle Ford, where the decline is expected at 3,000 bpd; and Utica, where production is seen to fall by 3,000 bpd. Oil output in Haynesville will see no change in February.”
According to Barclays’ latest survey of global oil and gas companies, North America spending will increase 27% in 2017, after a decline of 38% in 2016.
The strongest growth among LTO plays will likely be seen in the Permian. Bakken and Eagle Ford will lag. As oil prices rise, upstream capex will continue to increase in 2018 and thereafter; and ultimately the tide will lift all boats.
Personally, I think that the rebound in the Bakken will be very slow. Bakken oil production may exceed previous peak (1,164 kb/d in December 2014), but not by much. I strongly disagree with forecasts that Bakken production may reach 2 mb/d. But I also disagree with the view that the Bakken is already in terminal decline.
Hi AlexS,
It will depend in part on the price of oil. If oil prices rise to $120/b the rate of well completion in the Bakken may increase enough to raise output to 1400 kb/d by 2022, but this will require a quick ramp up to 210 well completions per month which must be maintained for 30 months (on average). This very optimistic scenario is presented below, I doubt it will happen, but I have been wrong before (I didn’t think the Bakken would rise to 1100 kb/d by 2014 back in 2012).
Dennis,
In order to reach your goal of 1.4 mill bbl/d for Bakken 200 new wells per month are by far not enough. At 11.000 existing wells, around 400 new wells per month are needed just to stem the yearly production decline of existing wells. So, 600 new wells per month are minimum to reach the goal of 1.4 mill bbl per day.
This means a tripling of capex and substantial operating costs per newly produced barrel compared to the early days of shale producing. I do not think that companies can attract capital for these undertakings, unless the oil price will triple over the next years.
Never underestimate the availability of “dumb money”. It is quite possible that they can attract capital for these loss-making operations.
The smarter CEOs will attract the capital and will not drill the wells, and will then retire to the Cayman Islands with the capital. But I think most of them are religious true-believers in oil drilling.
It appears in 2/2004, Bakken wells hit lowest production level, 186 wells averaged 235 barrels per well per month, or rounded 8 bopd.
Further, in 11/2008, Bakken wells hit highest production level, 834 wells averaged 4,390 barrels per well per month, or rounded 146 bopd.
From 2008 to 2012, bopd per well ranged mostly in the 130s and 140s, with 12/2012 being the last month at 140 bopd or more, with 5,048 wells that month.
November, 2016 shows 10,927 wells averaged 2,694 barrels per well, or 90 bopd per well rounded.
North Dakota puts out a PDF which shows both “Bakken” production by month and “total” state production per month, this is where I pulled these figures, hope I read them right.
I took the following from Enno’s website, shaleprofile.com. Here is how wells with first flow in the following years contributed to 11/2016 production in North Dakota:
2005 127 wells 2,421 bopd 19.06 bopd per well
2006 212 wells 4,726 bopd 22.29 bopd per well
2007 258 wells 8,207 bopd 31.81 bopd per well
2008 514 wells 21,177 bopd 41.20 bopd per well
2009 488 wells 20,930 bopd 42.89 bopd per well
2010 828 wells 34,259 bopd 41.37 bopd per well
2011 1,279 wells 62,587 bopd 48.93 bopd per well
2012 1,849 wells 88,831 bopd 48.04 bopd per well
2013 2,060 wells 124,789 bopd 60.58 bopd per well
2014 2,277 wells 180,045 bopd 79.07 bopd per well
2015 1,535 wells 207,588 bopd 135.24 bopd per well
2016 653 wells 244,840 bopd 374.95 bopd per well
I do think the above illustrates the need for high oil prices early in the well’s life, in order for the well to achieve a payout in a reasonable period of time.
I suspect the majority of wells with first flow since 7/2014 have not and will not reach payout in a reasonable period of time.
US consumers are very thankful that US oil production companies are all willing to drill and complete wells at a loss.
Privately held US producers are not so happy about this, but there are thousands of times more consumers than privately held producers, so the consumers win out.
Only when it is apparent that the vast majority of locations have been put on production in US shale fields will it be profitable to drill and complete shale oil wells in the US. Ironically, there will be few locations left to complete at that point in time.
Most private companies drilling LTO wells stopped in early 2015 because drilling said wells was no longer profitable. OPEC wrongly assumed (as did I) that public companies would do the same, but they did not.
Note, if all ND drilling and completion ceased in 1/2015, ND production in 11/2016 would have been just 547,972 bopd. If that were extrapolated to all US shale fields, per Enno’s website, US production as of 9/2016 would be right at 2 million bopd less, as wells with first flow in 2015 and 2016 contributed just over 2 million bopd.
US producers complain about OPEC and Russia increasing production in 2015-2016. At least they could generate positive cash flow. I presume if US LTO increases dramatically in the first six months of 2017, OPEC and Russia will resume producing at maximum rates, again driving prices below $50 WTI.
This game, however, may very well end up causing an oil super spike at some point, as simultaneous with US LTO hitting a wall, lack of investment in multi-year oil projects will also show up.
Maybe this is why XOM paid so much for Bass Family’s HBP leases. They can bide their time until around 2020, and then cash in on some $150+ barrel oil.
shallow sand,
I think that commercial LTO production in ND portion of the Bakken started in 2006.
Before 2006, daily output for total play was only 2-3 kb/d.
Average daily oil production per well in the Bakken (barrels)
AlexS. I do think Enno’s data includes horizontal Red River formation wells.
Ironically, the Red River wells did produce quite a bit of oil, and per information contained in CLR 10K’s from those periods, the wells cost quite a bit less to drill and complete, as I recall less than $2 million per well. Interesting that CLR has (or at least had) posted on its website 10K for when it was a private company, going back to the late 1990’s.
There were vertical Bakken wells which commenced production in the 1950s, and which continued producing up to 2006 at least.
Further, if one goes back and looks at old ND state information, in the 1998 oil bust, the number of active rigs went to zero.
shallow sand,
there were zero drilling rigs in Montana since November 2015, and 1 or 0 rigs between March and November 2015.
Production in 2016 is declining at an average annual rate of 18-19%
Montana oil production (kb/d)
AlexS,
Well productivity is another sign of the dramatic increase in operating costs in the Bakken. In order to keep production stable, companies should drill at least 4000 new wells per year. However, the contrary is the case: spuds are down to 53 and permits are down to 34, which is a multiyear low.
https://www.dmr.nd.gov/oilgas/stats/2016monthlystats.pdf
The bubble is now deflating fast and I expect a multiyear low for December and January Bakken production.
Heinrich Leopold,
Well productivity, measured as IP (initial production) rates for the wells drilled in 2016 compared with the wells drilled earlier, is slightly higher.
You can see it in Enno Peters’ shaleprofile.com
Both operating and capital costs per well are sharply down, although I admit that this is partly due to cost deflation, and can reverse in future.
Development of LTO plays per se is not a bubble.
The bubble was very high growth rates in 2011-14, which were unsustainable and created a number of imbalances:
– inflated asset prices;
– inflated oil service costs;
– significant and constant outspent of operating cashflow;
– accumulation of large debt;
– supply glut in the global oil market.
Alex
Gotta tell ya, in addition to providing a wealth of relevant data to readers of this site, you also consistently offer concise, accurate explanations as to the ‘why/how’ of events in LTO world.
Muchos gracias for all your input.
De nada, amigo 🙂
AlexS,
What really counts is costs per produced barrel – and not costs per well. As production per well is down, this easily outweights any savings per well. So, I stick to my comment that Bakken costs – per produced barrel – is way up. The bubble deflates.
AlexS,
What really counts is costs per produced barrel. Even lower costs per well – mostly through spacing – cannot outweigh the dramatic decline of production per well. I stick to my point: Bakken production costs ( per produced barrel) are way up and this is why the companies are leaving the Bakken. The bubble deflates at increasing speed. Investors beware.
Continental Resources’ production and cash G&A costs per barrel
AlexS,
CLR is not a pure Bakken play. 60% of its net 1.8 reservoir acres are outside Bakken (Stack Meramec, Scoop Woodford, Scoop Springer, Stack Woodford). These properties are in their early stages and there CLR can play the game again from the beginning. In addition, there seems to be a trend emerging out of the Bakken as companies applied in the December for the first time less permits (34) than
spuds (54). This is a sign that companies draw on their inventories and do not re-invest fresh money. This is also why CLR has better cost data for Bakken as it prepares for the exit.
Yet overall, the cost structure in the Bakken deteriotates. Drilling 2000 new wells since 2015 and losing 200 000 bbl/d production can simply not lead to improved economics.
What “dramatic decline of production per well” are you talking about?
Well performance in the Bakken has been improving.
I think that he was talking about the average per day production of all producing wells, which is thousands of wells, and which will continue to go down.
That enables one to compute how many new wells are needed to stabilize the decline by 12/31/17. If during 2017, one estimates that on December 31 daily ND production from existing wells will be 180,000 bbl/day less than on Jan 1, 2017: then if one estimates that the average daily production from all new wells drilled in 2017 will be 200 bbl/day on 12/31/17, it would tell you that you need 900 new wells in 2017 to end up with the same daily production as at 1/1/2017.
But, it is just math. So, if you only drilled wells in November of 2017, and the new wells were producing and averaging 400 bbl/day on 12/31/17, you would only need 450 new wells.
And, there would be a totally different calculation to answer this question: How many new wells will be needed, ratably by month [or on some other schedule], such that total ND production is the same in 2017 as it was in 2016. That calculation [and the assumptions that it involves] is beyond the scope of this post.
clueless,
That is exactly my point. As this is difficult to calculate for the future, we can take history as a guide.
5 years ago 2000 new wells per year were enough to produce 200 000 bbl/d more. Today 2000 new wells give just a loss of 200 000 bbl/d production. So, we can assume that around 4000 new wells are needed for the Bakken to stay even. To reach the goal of 200 000 bbl/d of production growth at least 6000 new wells per year are needed. For this production growth USD 30 bn are required compared to just USD 10 bn five years ago for the same production growth. So Bakken needs now triple the investment to regain its previous growth.
The reality is that just 500-800 new wells are coming online and the trend is that there are even less wells drilled in the future.
Alex do you really need to stoop so low? Is it just to prove a point? The conversation was about barrels, your chart is also lumping in all the gas. Few would argue that initial production including gas, is going up. Question is how these wells will hold out over the long term.
Any idea how much of this gas would just be flared were it not for regulation against it?
farmboy,
You can visit Enno Peters’ shaleprofile.com.
He is showing similar charts for C+C.
BTW, cost per boe numbers are for total liquids and gas production. It doesn’t matter if the gas is consumed or flared.
AlexS,
You look just at the performance of new wells and “ignore” the huge decline of existing wells.
In order to reach 1,4 mill bbl/ by 2020 (as also Dennis suggests), Bakken has to drill 4.000 new wells, yet also at least 6.000 new wells just to stem the decline in existing wells, which will be swelled by 10.000 to an incredible 21.000 in 2020. That is the big difference now compared to 2009 when the boom started and little decline of existing wells had to be accounted for. This mechanismus will hit also Marcellus, Utica, Permian…. at increasing dynamics.
Despite the improvement in new well performance, the total well performance including existing well performance declines dramatically. This is exactly why I foresee a huge energy crisis over the next few years.
Factoid from here:
http://www.eia.gov/dnav/pet/pet_cons_psup_dc_nus_mbblpd_m.htm
Of the US 20 mbpd consumption, middle distillates (kerosene jet fuel and diesel) are about 5.7 mbpd
Given the magical number of 67% of total consumption being transportation, that says 42% of transportation fuel is not gasoline. Probably should throw in residual fuel oil and up to 45%.
Relevant to a past convo about dumbbell assays to synthesize WTI from very heavy and condensate. The resulting mix comforms to WTI parameters, but refiners can’t get any high profit distillates from it, because there isn’t much in it.
Oh btw, the magical number is from 2005ish.
And btw rev 1.0:
http://peakoilbarrel.com/wp-content/uploads/2015/03/5087801.png
distillate content crashes above API 40
Fascinating. I hadn’t spotted this…
So I’m repeatedly running the scenario for after gasoline demand starts really crashing through the floor. (Which is guaranteed to happen sooner or later as cars electrify.) It looks like condensate will become essentially worthless. Very heavy oil will also be quite undesirable. I’m not sure what effect this has on the shrinking oil business at that point…
Condensate will never be essentially worthless. The price of it might well fall off a good bit though.
When it gets cheap enough, and is available in large enough quantity, refiners can build new equipment to convert it into kerosene, jet, diesel fuel, etc, and burn some of it to run the equipment.
And there’s nothing to stop ICE engine manufacturers from building engines designed to run on it, if it’s cheap and expected to stay cheap. Farm equipment manufacturers built machinery to run on the dregs left over from manufacturing gasoline for automobiles for decades.
There are documented instances of farmers just putting a bucket under a leaky pipe at an oil well, when the leak was thin rather than thick crude, and pouring it right in their tractor fuel tank, on a routine basis.
How’s this for a thought. Somebody needs backup power, a lot of it, for a time when the grid is down. They put a million in a big diesel generator, or one that runs on natural gas, if they can count on gas delivery. ( Diesel is easily stored on site in large tanks, so emergency delivery is not an issue.)
That diesel engine can easily be tuned at the factory to run on condensate mixed with a little diesel fuel.
I don’t know how hard it is to store the really light stuff in tanks long term, and evaporation might be a major problem. Or it might not. The ships that haul LNG just burn what boils off in the ship engines, so they don’t lose any significant amounts of LNG during sea transport. The people who might want to store very light oils may be able to find uses for what they would lose to evaporation. My guess is that if you need a lot of electricity, and have free fuel, you can run a generator of your own for no more and maybe less than you can buy the juice from a utility.
I put something on this in the last post but it wasn’t up for long until this one:
“Global oil, gas discoveries drop to 70-year low: Rystad Energy”
http://www.reuters.com/article/us-oil-exploration-idUSKBN1521TA
“Total oil and gas resources found in 2016 reached just more than 6 billion barrels of oil equivalent (boe), … The numbers do not include North American shale resources which have been a key driver in supply growth in recent years. Offshore liquid discoveries, where most major new fields have been found in recent decades, reached 2.3 billion boe last year, 90 percent below 2010 levels. As a result, companies were able on average to replace only 10 percent of their oil and liquid gas reserves last year, …”
Another notable recent development is how any reasonable quality discovery is being immediately fast tracked for development – e.g. ExxonMobil Liza, BP and Eni Mediterranean gas projects, the recent Hurricane discovery in UK, and this year’s Statoil Cape Vulture well (referenced in the article). It doesn’t say much for the other, older projects the companies may have on their books. BP’s announcement today of keeping investment flat through 2018 and emphasising gas as the main growing energy supply may reflect this as well – they have few oil projects left now.
About a year or two ago I was talking with Jeffrey about the avg API gravity of new discoveries. Jeffrey said something like “Avg API gravity has been relentlessly rising with new discoveries this century”.
I know IHS has a database of discoveries, but probably not free. Anyone know where we can get an exact measure of API on new oil? Errr, “oil”.
It was only in the USA that there was an issue with lighter crudes because of the growing ratio of LTO and shale gas condensate in the production mix. It was a possible problem because the USA refinery capacity was built to process a heavier slate. The problem went away when the export ban was lifted so the light oil could be processed elsewhere. Most of the world worries about oil getting heavier. Tapis is still (I think) the highest priced oil and is very light (45 degrees). Before about 2008 the lighter WTI always sold at a premium to Brent.
Lighter fields are easier to produce and have higher sales revenue per barrel so got developed first, all else being equal. Now the heavier oil is left. A lot of the new production from Iraq is heavy – they had to introduce a new crude grade, Basra Heavy, to sell it. Two of the biggest recent discoveries (Brazil pre salt and J. Sverdrup) are medium grade with API around 28. A handful of old discoveries in UK/Norway are still undeveloped as they are heavy oil and weren’t economic even at $100 plus.
https://www.eia.gov/analysis/petroleum/crudetypes/
I would add that, in Saudi Arabia, light crude production at Ghawar field (with API ranging from 33 to 40) is declining and is being replaced with mostly medium crudes from Manifa (26-30.1 API ) and Khurais (around 32 API)
This is partly ofset by super-light crude from Shaybah (42 API).
Iranian crudes from the fields that are ramping up output are also mostly medium and heavy. Iran is also increasing condensate production from South Pars, but condensate is not included in OPEC crude production numbers and is accounted as NGLs.
One exception is Russia, where output of medium crudes from the old fields in Western Siberia is declining; and most of new production consists of lighter crudes. (Therefore, I am currently using 7.33 barrels/ton average conversion rate for Russian oil instead of 7.3).
Meanwhile, in the U.S., the share of ultra-light oil (>45 API) and condensate in total Lower 48 states C+C production (incl. GoM) has slightly declined over the past 2 years
Ultra-light oil (>45 API) and condensate as % of US Lower 48 states C+C production
Good data. That slight downtick would be the Bakken decline.
The overall issue is the need (growing) for diesel. The traditional concept of “easy to refine and therefore more valuable” is stressed by the need for diesel. If there is no diesel in easy to refine oil . . . .
There is also another quirk in the blends. API (or even sulphur or vanadium or metal content) doesn’t tell the whole story. There is a quote I will have to chase down, something like … Libyan oil of the same API gravity as Saudi oil has twice the diesel in it.
stressed as in put under stress
BTW, from the article:
“However, these ‘missing’ discovered volumes in the current years could have an impact on the global supply some 10 years down the line – depending on the investment decisions of the exploration companies.”
Always amusing how this gets said and the conclusion is . . . “Oh! Supply and demand! There will be too little, the price will rise, and then there will be enough tra la tra la!!”
Bullshit. If there’s too little, there is too little for YEARS. It takes that long for this magical investment incentive to fix the problem. The SPRs don’t have years in them.
SOMEONE DOESN’T GET AN ORDER FILLED. And it ain’t the guy who got outbid, because there’s gonna be too little REGARDLESS of bid.
Someone is going to forcibly take it from someone else. How could they not?
Well, the alternative is to simply switch to cheaper, more reliably supplied lternatives to oil.
This has been happening. The switch to NG is well documened. NG isn’t reliably supplied either, though, particularly in Europe.
Now the switch is to electricity, which can be powered by anything including hydro, solar, wind, geothermal, etc.
This is where the permanent demand decline in oil starts: with a desire for energy *security*. The second phase is when the alternatives are simply cheaper than oil, and we’re into the beginning of the second phase already.
thankyou Watcher,
can I ask – is there any public data on the “API’s” of oils held within the SPR ?, and also – is there any data on api’s within the various (private) storage facilities across the USA ?
rgds
Simon
It appears to vary. The SPR inventory quotes X amount of “light, sweet” and Y amount of “heavy, sour”. If they mix them, they get a mini dumbbell in refinery yield.
I recall reading that Cushing is WTI, and if oil coming in is not WTI, things are done to it to make it WTI (add condensate to heavy oil). It’s badly defined.
NYMEX WTI crude contracts are settled in Cushing, OK. That contract is extensively defined. My recollection is that it is multiple pages, but that also includes delivery requirements.
Considering the $ billions of value in those contracts, I believe that NYMEX WTI is well defined.
No, clueless. As recently as 2-3 yrs ago there was talk, covered in a Bloomberg article posted here somewhere, that WTI’s definition was being changed to address the issues of shale influx overwhelming influx from elsewhere.
I’ll do a cursory search, but I seem to always fail searches here It would be bloomberg wti definition
The specifications are on page 1 of the CME Rulebook Chapter 200.
https://www.cmegroup.com/rulebook/NYMEX/2/200.pdf
I put this in the wrong place, so I am reposting it.
‘Permania’ grips the US shale oil industry: “As one respondent to a recent survey for the Federal Reserve Bank of Dallas put it: ‘Permian transactions are approaching price multiples associated with a bubble or a Ponzi scheme’, reminiscent of the property boom of the early 1980s or the technology bubble of the 1990s.”
Boomer II,
It’s worth noting that a fair part of the acreage being bought is being sold by producers like Yates, Bass, and Clayton Williams (which was just acquired by Noble Energy, I believe.) These are names that have been around for decades, often those of families.
I think I read yesterday that the Clayton Williams/Noble deal was an all-stock deal. If so, maybe it’s just a decision to let someone else do the work now. Deals for cash, though, would seem to send a different message, the rat-down-the-hawser kind.
Somebody who knows chip in please?
Exxon’s deal was also stock. Cash only happens if they produce.
I think if oil companies fear their stock prices might go down in the future, they might feel it is best to use some of it to buy leases/acreage while the stock price is high.
Also, if you’re a company that doesn’t have many new discoveries to report, perhaps you want to announce a purchase to keep investors interested.
What Does ExxonMobil’s Permian Basin Deal Mean? – Market Realist
China’s crude oil output will fall 7 percent by 2020 – government
Tue Jan 17, 2017
http://www.reuters.com/article/us-china-energy-idUSKBN15118K
China’s crude oil output is expected to drop by 7 percent by 2020 compared with the previous five-year plan as output from some of the nation’s largest, but oldest, wells falls, while natural gas supplies will rocket by almost two-thirds.
Under a plan covering the period 2016-2020 published by the National Development and Reform Commission (NDRC) on Tuesday, crude output will be around 200 million tonnes by 2020, equivalent to 4 million barrels per day (bpd). That would be down from 215 million tonnes in the 2011-2015 plan.
The drop reflects falling output at aging, high-cost fields as producers scale back production in a lower oil price environment. For the first 11 months of 2016, production was down 6.9 percent at 182.91 million tonnes, just under 4 million bpd.
Consultancy Wood Mackenzie, however, forecasts a decline of nearly 500,000 bpd in Chinese crude oil production over the next four years at 3.5 million to 3.6 million bpd.
“We don’t see any large greenfield oil developments coming stream by 2020. As such, given the maturity and age of the main oil fields … we forecast an ongoing decline in output,” said Angus Rodger, Woodmac’s upstream research director.
Meanwhile, the NDRC said natural gas supply would be 220 billion cubic meters (bcm) by 2020, compared with 134 bcm under the 2012-2015 five-year plan as Beijing prioritizes the sector’s growth.
The government is maintaining an earlier target for shale gas output at 30 bcm, or 13.6 percent of the total.
———————————
Comment: China’s oil production has dropped below 4 mb/d since July 2016
There were 34 permits issued in North Dakota in December. That is the lowest count since July of 2009. The high was 370 in October, 2012. The high yearly average was 250 per month in 2014. Spuds dropped to 53. Rig count, today, is 37. I really don’t see things picking up in the Bakken in 2017. I am betting that December 2017 production will be well below one million barrels per day.
Baker Hughes weekly oil rig count is out.
Total U.S.: + 35
Oil rigs: + 29
Gas rigs: + 6
Oil rigs by major basins:
Permian: +13
Cana Woodford: +9
Williston: +3
Eagle Ford:+2
Niobrara: unchanged
BP predicts “peak oil” will hit between 2025 and 2040/
Broad consensus has suggested “peak oil” the peak oil window will be between the years of 2025 and 2040.
However the report added there was still “considerable uncertainty” surrounding this.
Yes, I would agree that there is still “considerable uncertainty” with that date. Peak oil could come much earlier, possibly as early as 2015.
Personally, the date I’m looking for is not peak oil, but the date at which it becomes permanently unprofitable to drill new oil wells.
This will happen due to reduction in gasoline and diesel demand by electric car substitution, reduction which happens faster than the natural decline rate of the existing fields. This starts the inevitable spiral of shrinkage for the industry as every piece of the supply chain has to shrink. As the supply chain shrinks, economies of scale disappear and competition disappears, causing production costs to rise. In addition, cost of capital skyrockets as equity investors demand higher near-term returns on a shrinking industry than on a growing one, and debt investors consider a shrinking industry much less credit-worthy than a growing one. This reduces profits on existing operations. And the shrinkage continues until a new equilibrium is reached based on jet fuel demand. Which is sufficiently low that it’ll be met by existing fields for a *very* long time — probably until the electric airplanes are ready to fly.
My current projection for this date, which is the end of the oil exploration industry, is 2023, maybe a few years earlier or later. Peak oil might be reached slightly before or slightly after that point. Doesn’t really matter which…
Anyway, the date is basically determined by the rate of electric car factory construction, which is hard to keep an eye on because it’s mostly in China.
As the Bakken bubble bursts at increasing speed, the recent Texas RRC data show that the Texan gas bubble is collapsing spectacurarily (see blow chart) as well. Although data will be revised, total gas production crashed towards 15 bcf/d. This is a beautiful Seneca cliff curve. As gas well completions (blue line at 93 in December) and permits hover around record lows, this trend is very likely to keep on going for a while.
I have speculated that the Exxon deal has more to do with Exxon trying to use its stock to expand its company and to look good to investors than a resounding indication of the company’s faith in the Permian.
Exxon plays catch-up after missing U.S. shale oil boom – Jan. 17, 2017: “Of course, Exxon is a bit more strapped for cash these days. Exxon’s long-term debt has quadrupled to nearly $30 billion even as its profits have tumbled to 17-year lows amid the crash in oil prices.
Exxon’s financial pressure has resulted in the loss of its once-perfect AAA credit rating.
That explains why Exxon is paying for the Permian assets by using the company’s stock.”
Exxon is constantly buying back its shares, and is from time to time using a small part of its huge treasury stock for acquisition. What’s wrong with that?
Nothing.
I’m just speculating that the purchase may be as much, or more, about Exxon’s business decisions than about Exxon’s belief in the future of oil development there.
Another suggestion that the Exxon deal may have to do with more than just acquiring access to oil.
I don’t have any idea how prolific the Permian will be. I’m just thinking of other aspects of this deal.
Exxon and Noble Stoke Permian Passions – Bloomberg Gadfly: “Exxon will also be able to steal some of rival Chevron Corp.’s Permian thunder with investors and possibly offset the fallout from a potential looming writeoff of some of its Canadian oil-sands reserves.”
Russian greenfields production growth, no mention of decline rates on older fields, just the new ones…
Original chart on twitter: https://pbs.twimg.com/media/C2sxX5yXUAEr-ny.jpg
Production cost? Production cost *matters*.
I have wondered if Trump’s appointees with oil and gas ties might, behind the scenes, be preparing for the shift away from fossil fuels and toward renewables. They are insiders and should know what is and isn’t available in terms of oil and gas and coal. I’m wondering if the public line is boom times ahead for the oil industry, but privately they are preparing for a different future.
I’ve posted a few articles about the Exxon purchase, wondering if it signals an investment deal as much or more than it does a future drilling plan.
I thought I’d look for articles about oil companies selling assets. Here’s one of them, from a month ago.
Oil company’s new bet on wind power signals shift in energy investments – Business Insider: “But energy companies are looking for growth in markets that provide more stable returns than oil projects, which have becoming incredibly expensive and risky. Wind provides predictable cash flows for decades, so the return on investment has much less risk than oil and gas projects do.”
Another article about a potential sale, this time Exxon doing the selling. Perhaps the Permian deal is to camouflage Exxon backing away from various oil projects?
Exxon Norway Oil Assets Said to Lure Aker BP, Hitec Interest – Bloomberg: “Billionaire Kjell Inge Rokke’s Aker BP Plc and two private equity-backed companies are in talks to buy stakes in oil fields off Norway from Exxon Mobil Corp. that are valued at about $1 billion, according to people with knowledge of the matter.”
Indonesia, Philippine groups acquire Chevron's $3 billion geothermal assets | Reuters: “Chevron is selling assets, cutting jobs globally and slashing capital spending to save cash in a bid to preserve its dividend amid weak oil prices.”
Royal Dutch Shell PLC saddled with a mountain of debt – Royal Dutch Shell Plc .com: “The Wall Street Journal does not mince its words.
In an article published today, it says that Shell has saddled itself with a mountain of debt as a result of its takeover of the BG Group.
Article author Sarah Kent points out Shell’s debt-to-equity ratio is far higher than its major rivals.
The same concern is expressed in a related Wall Street Journal article: Shell’s New Year Promise: Slimming Down
Although Shell promised to offload $30 billion of assets, it has thus far sold only $5 billion worth.”
Anadarko Petroleum Corproation (APC) To Sell Eagle Ford Assets: “Anadarko Petroleum Corporation (NYSE:APC) has recently announced that it would engage in another round of asset divestitures. This time, the company is selling its Eagle Ford Assets in South Texas.”
a href=”http://www.cnbc.com/2017/01/05/chesapeake-energy-is-not-done-selling-assets-says-ceo-doug-lawler.html”>Chesapeake Energy is not done selling assets, says CEO Doug Lawler: “‘We have 11.3 billion barrels of net recoverable resources across our asset base. … It’s going to be difficult for us to drill and complete all those as fast as what we’d like. We don’t have the capital funding, the cash flow to do it. So we are going to be continuing to look at additional asset sales,’ Lawler told CNBC’s ‘Power Lunch’ on Thursday.”
Here’s the active link to that article.
Chesapeake Energy is not done selling assets, says CEO Doug Lawler
The Exxon sale makes sense as their operated assets are coming to the end of life. They are planning to decommission Jotun, they had a recent drilling program on Balder which should be about finished, and it and Rinhorne will then be in terminal decline. Balder was initially a nightmare project and a lot of the Exxon engineers originally involved were encouraged to move on to opportunities in other companies. It had probably the worst availability record for any FPSO, but since has been extensively revamped so should have a few more years. However maintaining logistics and operator support for two small platforms would not be efficient, and they don’t have anything in UK which they could combine and streamline. They might keep some “operated by others” assets.
Anadarko are wanting money to cover development costs in GoM and probably the sale costs for Freeport Mcmoran. This also makes sense as they have not been very active in the EFS which is in steep decline for their wells, but now have a lot of synergy for new tie backs, and possibly one or two hubs, offshore.
Shell seem to be in a bit of trouble. I think it started when they invested huge sums in the Pearl GTL project and had to neglected investment in more traditional oil production. They had another high impact dry exploration well offshore Canada this week. Iraq didn’t work out – I think they are trying to leave there. I don’t really know what they have that would be easy to sell now, it might have to be a big gas development if they really need the money.
Chesapeake just seem to make things up as they go along.
What I am thinking is this. If you are an oil company and internal research suggests there’s no a path to profitability in the future, you might want to continue to talk up oil in order to sell assets at the highest possible price.
Why get stuck with assets if you think their value will go down over time and the income they generate won’t be as valuable as cash right now? So you make it look like you’ll be in the oil business for the long term, but in private you plan to get out as soon as you can do so.
Again, it’s the Trump administration that makes me wonder about this. It’s possible that Trump’s talk about boom times in oil is just a cover to get the wealthy out of the industry.
I was thinking just the opposite; that Tesla was going to have to make a hybrid gas/electric model in order to be competitive.
Competitive with whom? It’s been estimated that Tesla has received deposits for 400,000 Model 3s.
Getting into hybrids would only serve as a distraction from their main goals.
I think Tesla will likely sell as many EVs as it can make.
I would keep on thinking if I was you…as of now your conclusion as stated “If you are an oil company and internal research suggests there’s no a path to profitability in the future, you might want to continue to talk up oil in order to sell assets at the highest possible price.” show a complete lack of understanding of this business. Maybe you spend some tome thinking about just how little you know.
As a long time industry participate, the exxon deal does not surpriser me at all, and in fact I would have expected it and did. The classic signal the downturn is over or close to it. In commodity business such as the oil and nat gas business you buy assets during times of great stress and sell assets during the mania phase. The business model that looks to be in great danger of any viability is the solar and wind “industries” con job which is held together with lies, hysteria and government largess, which is about to vanish.??
“The classic signal the downturn is over or close to it. In commodity business such as the oil and nat gas business you buy assets during times of great stress and sell assets during the mania phase.”
Did you see the article I posted that says the Permian sales have all the markings of a bubble? So the ones who are selling are smart. The ones who are buying, not so much.
‘Permania’ grips the US shale oil industry: “As one respondent to a recent survey for the Federal Reserve Bank of Dallas put it: ‘Permian transactions are approaching price multiples associated with a bubble or a Ponzi scheme’, reminiscent of the property boom of the early 1980s or the technology bubble of the 1990s.”
This is a really good article about how the Permian may be more about Wall Street than production.
The Permian Bubble Is Underway | Seeking Alpha: “But the biggest issue is valuation. Permian properties are going to be valued very differently if the company has a great return on Wall Street for purchasing the properties in the first place. Drilling and production may become unnecessary, just buy the leases and hold them for appreciation while the market applauds the move. How far this particular valuation scheme goes depends upon market willingness to keep upgrading the value of Permian properties. Right now it appears that some companies have some Herculean assimilation tasks ahead of them. In the case of SM Energy, the market may be approving before any assimilation is done. So there is no confirmation from earnings needed because the deal is a ‘sure thing’.”
“Drilling and production may become unnecessary, just buy the leases and hold them for appreciation while the market applauds the move. ”
This is an even more refined version of the scheme the NG fracking companies used last time around. Last time they drilled, announced first-day production, and sold immediately. Now they are selling before drilling!
The Permian Pitfall: A Race To The Bottom For Tight Oil | OilPrice.com
Article in Reuters explaining the rise in merger and acquisition activity in the oil and gas sector.
Big Oil back on the acquisition trail as outlook brightens
http://www.reuters.com/article/us-oil-m-a-idUSKBN1530OK
The world’s top oil companies are back in acquisition mode, targeting smaller exploration and development firms to boost oil and gas reserves rather than the mega-mergers that followed previous slumps in crude prices.
Since late November, major oil companies have announced 11 deals worth more than $500 million each with a combined value of $31 billion, the clearest sign yet that oil executives are more confident a recovery is underway.
When crude prices collapsed in the second half of 2014, large oil firms slashed spending on exploration and production and offloaded assets to reduce debt so they could cope with lower revenue from oil and gas sales.
But with crude reservoirs declining at a rate of 10 percent a year in some cases, major oil companies are now looking to snap up assets to start growing again and there are plenty of smaller firms burdened with debt looking to sell.
Total acquisitions of oil and gas fields, known as upstream assets, tripled to $31 billion in December from a month earlier, when the Organization of the Petroleum Exporting Countries agreed to cut output for the first time in eight years, according to data from consultancy Energy Market Square.
Deals in the last month of 2016 alone accounted for nearly a quarter of total activity during the year.
The trend continued in January with Total boosting its stake in Uganda’s Lake Albert oil project by snapping up most of Tullow Oil’s (TLW.L) stake for $900 million.
ExxonMobile and Noble Energy (NBL.N) also struck deals worth nearly $10 billion combined for a larger slice of the Permian Basin, the largest U.S. oil field.
While deal making outside the United States almost ground to a halt at the start of 2016, acquisitions in North American shale basins have continued at a steady pace.
In the Permian Basin, for example, the time it takes to produce oil and gas after an initial investment is far quicker and cheaper than developing conventional fields over three to five years.
More deals are likely this year as the large overhang of crude oil in the world that has weighed on the market since 2014 continues to clear and oil prices rise.
“When you can cut capex (capital spending), two-and-a-half to three years later you see production decline and reserves depleting and you have one choice only and that is going after high quality resource,” said Sachin Oza, co-manager with Stephen Williams of the Guinness Global Oil and Gas Exploration Trust.
“If you’ve not spent any time filling your hopper with these opportunities that take five years to build up, there is only one choice: you have to buy them,” said Oza.
Here’s something that suggests BP doesn’t see such a bright future.
BP CEO Won’t Boost Spending, Signaling Caution on Oil Rebound – Bloomberg: “BP Plc boss Bob Dudley is not yet ready to boost spending despite the rebound in oil prices.
The company will keep capital expenditure below $17 billion this year and next, Chief Executive Officer Dudley said in a Bloomberg television interview in Davos, Switzerland. That’s $6 billion lower than 2014, when crude prices first started to slump, showing that the impact of the two-year industry downturn still lingers.”
I see a very robust M&A market the next 2-3 years. The cupboard is empty for the majors. Many will be flush with cash as som megaproject development comes to an end-CVX in particular. And with production falling at the major Chinese oils, I can see the Chinese govt. pushing them to go out and buy reserves. India Oil, Pertamina, Petronas, KNOC, and PTT will be on the hunt as well.
There is still a large number of pre-FID projects that were postponed over the past 2 years and that will likely be re-activated if oil prices continue to rise.
But I agree with you that M&A market will be robust.
There is also a large number of potential asset sellers, particularly shale companies with large debt. They did not want to sell in 2015-16 when assets prices were low, but will be more willing to divest part of their acreage at higher prices in order to improve their balance sheets.
What this forum mostly focuses on is depletion, and to a lesser extent, the price of oil and what that does to production.
There may be M&As that go on for show to reassure investors and are done with little financial risk.
But if the future isn’t profitable to oil companies, those deals won’t amount to much.
I am speculating that industry execs are saying one thing in private and another in public.
And I think Trump’s plans to somehow increase oil certainly won’t boost the price of oil. So we need to look beyond what companies and politicians are saying.
M&As can happen in two types of industry:
(1) A high-growth industry with a lot of undercapitalized startups: this takes the form of cash buyouts by older companies which are often from different industries, and is all about supplying more capital
(2) A mature industry with no growth prospects: this takes the form of cash or stock buyouts of small companies by big ones, and is largely about preserving market share
(3) A shrinking industry: this takes the form of huge merger-of-equals stock mergers, trying to gain economies of scale pricing power by consolidiation, against a background of shrinking volume
I believe we are somewhere between 2 and 3.
It’s good to look at how much cash is actually changing hands.
The Exxon is all stock until there is production.
The Total is relatively little cash upfront.
Tullow sells Uganda stake to Total for $900m: “Total is to pay $100m cash on completion, further installments of $50m at the final investment decision and again at first oil, and then a $700m deferred payment to fund Tullow’s share of the development.”
If a major oil company can give the illusion of future production without actually taking much risk, that’s a way to keep investors happy.
This is how BP is structuring its Abu Dhabi deal.BP Is On A Shopping Spree To Expand Its Operations — Trefis: “For this, the company will issue new ordinary shares representing approximately 2% of its issued share capital or approximately $2.2 billion, to be held on behalf of the Abu Dhabi Government.”
And this is how it is doing its Kosmos deal.
“Under the terms of the agreements, BP will pay Kosmos a cash bonus of $162 million on completion of the deal, followed by Kosmos’ exploration and appraisal costs of $221 million and development costs of $533 million.”
Sometimes the big numbers concerning acquisitions are misleading.
During the down-cycle in the oil market, when oil prices and oil and gas asset prices are low, oil majors prefer growth through acquisitions to organic capex.
That was the case in late 1990s, but this time the size of acquisitions is not that big.
From the article:
“While slides in oil prices typically unleash a wave of takeovers, companies emerging from the current downturn are generally shunning outright acquisitions and instead looking at specific deals for specific fields.
After a prolonged period of low oil prices in the late 1990s Exxon merged with Mobil, Total merged with Elf Aquitaine and Petrofina, Chevron (CVX.N) bought Texaco, BP snapped up Amoco and ARCO and Conoco and Philips merged.
This time round, the only stand-out acquisition has been Royal Dutch Shell’s takeover of BG, which was announced in April 2015 and completed in February a year later for $53 billion.
As large oil firms are wary of increasing their debt burden at this point, investors say corporate acquisitions are likely to be limited in numbers and scope but oil field assets are very much in the crosshairs.”
When oil prices are high oil and gas assets are expensive, oil majors typically increase organic capex (2005-08, 2011-14).
There is, however, a long-term issue for oil majors.
Investment opportunities in conventional oil and gas are shrinking:
– countries with significant resource potential (Middle East OPEC countries, Venezuela, Russia) are virtually closed for new foreign investment, or contract term are not lucrative;
– projects in deep-offshore, oil sands and LNG are high-cost, capital-intensive and with very long payout period.
M&As probably are cheap way to add assets to a company. The bigger question in terms of the oil market is whether those acquisitions ever amount to much.
You can buy up companies on the cheap and then never do anything with them.
Yes, they are removing rigs from the Permian and turning it back to goat pasture.
“You can buy up companies on the cheap and then never do anything with them.”
That seems like a wise thing to do. Over the years, I have bought up 100’s of cars on the cheap and just parked them in a pasture.
I used to follow tech stocks very closely. I saw that press releases usually tout big numbers and big deals, but then when you look more closely, there are so many terms and conditions that those big numbers rarely materialize.
The business press tends not to dig too deeply. They have deadlines, so they are happy to use press releases without much question, and they usually depend on the companies they cover to buy ads and sponsor conferences, so they don’t want to say too much that is negative.
As we try here to gain insight into the future of oil, we must consider what companies will or won’t do to improve their bottom lines and appeal to investors.
What I haven’t, and likely won’t take the time to do, is to look at insider stock buys and sells. I used to do it for some tech companies to see if corporate execs appeared to be in an unusual hurry to cash out.
I did go looking for something on Exxon and found this. This is just an example. I don’t know overall trends for Exxon or other companies. But it is worth following as a piece of information on the future of oil.
The Investors Buy Shares of Exxon Mobil Corp. (XOM) on Weakness Following Insider Selling – DailyQuint: “Traders bought shares of Exxon Mobil Corp. (NYSE:XOM) on weakness during trading on Thursday following insider selling activity. $165.69 million flowed into the stock on the tick-up and $113.10 million flowed out of the stock on the tick-down, for a money net flow of $52.59 million into the stock. Of all stocks tracked, Exxon Mobil Corp. had the 4th highest net in-flow for the day. Exxon Mobil Corp. traded down ($0.52) for the day and closed at $85.23Specifically, VP Robert Stuart Franklin sold 13,855 shares of the stock in a transaction on Wednesday, August 24th. The stock was sold at an average price of $87.93, for a total transaction of $1,218,270.15.”
Insider sells out number insider purchases probably by 10 to 1. Companies compensate employees with stock. So, if they need the money, they have to sell the stock. Or, if they accumulate virtually all of their net worth with stock compensation, their financial advisor has them sell in order to diversify.
Following stock trading money flows is, in my opinion, meaningless. I do not care what the price is. If I take $1000 out of the bank and buy any stock, the person selling the stock to me gets my $1000 and puts it in his bank.
The stock market is complicated. Even though only a small fraction of stock trades each day, at the end of the trading day, every share [all of them in pension plans, trusts, mutual funds, etc] is priced based upon the last trade of the day. Is that a fair indication of value? A similar illustration. There are 1000 concert tickets for sale at $100 each. They are are all sold. One Week before the concert, you discover that you cannot go and so you sell your ticket to a friend for $60. Did 999 other people just lose $40 each? They did if your transaction is printed in the Wall Street Journal.
“Is that a fair indication of value?”
I would agree that stock prices in general aren’t a good indicator of value.
I’m not interested in petroleum company stocks. I am interested, however, in the present and future of energy economics. We might glean some insight by looking at how M&As in the oil industry are being structured. If it is primarily a stock deal, then that may indicate that the buyer wants the acquisition, but not enough to put much cash into the purchase.
Also, if companies are taking some actions to primarily to boost stock prices rather than to increase future exploration and production, then that is probably relevant, too.
But yes, I agree, you can’t base the value of a company by its stock price.
clueless, you are partly right when saying there is no value created (in the whole monetary system) when exchanging stocks. For the image, you just give a piece of paper to someone else, you pay some value for buying and the seller receives exactly the same amount (in theory as you may have to pay taxes or fees). It is different when you contract a loan to buy the stocks. In that case, you create value from thing air (until your loan is paid).
The value of a stock itself should represent a mix of the future expected revenues (future cash flow), the risk associated, and the current revenue from long term secure investment (typically Treasury bonds). So in theory, at any moment, the agreed price between the seller and the buyer should represent the agreed expected value of the company between these two parties.
Is that the real value of the company? No. The are multiple methods to evaluate the value of a company. Stocks value is one.
Is that the value one could get by selling all the shares at the same time? No. If there are no buyer, the value is zero.
When a stock goes from $100 to $200, you have no additional money. You might have the feeling you have more, but that’s all. You only have capital gain(or lost) when you sell at that price.
Provided a stock have enough liquidity (many transactions per day), one could still look at the value of the stocks as an estimation of the value of the company. The only thing to remember is that this is an estimation based on publicly available information in a given context. The same company, with the same profits and the same associated risk will be valued differently if the Fed put interest rates to 0% or to 5%.
This question is maybe out of place here, but it won’t likely get answered in the other thread.
The background to the question:
I believe as Ron does that production is about as high as it can go, at least for now, because depletion is ongoing, whereas new capacity is slow coming on line. Maybe a few years down the road, production really could go up noticeably. MAYBE.
But it seems more likely to me that depletion and lack of investment will solve the price problem for producers within another year or maybe two at the most, barring a sharp economic downturn.
So – Does any body know how high the price must be for it to be a no brainer for a countries such as Saudia Arabia to start building solar farms , so as to sell some of the oil they are burning now to produce electricity? Let’s assume the cost of building new solar farms is holding steady, so there would be no incentive for the Saudi’s to delay construction waiting for the price of them to come down.
Are there good estimates of the amount of oil Middle Eastern producers could first save and then SELL on a daily basis by going all out for solar electricity?
Such factors as these are not generally included in these discussions involving long term prices, but they are precisely the sort of factors that occasionally turn rich people, the ones of them who are too narrowly focused on the status quo, into beggars,due to their failure to keep an eye on the BIG PICTURE.
Saudi to launch $30-50 billion renewable energy program soon: minister
Mon Jan 16, 2017
http://www.reuters.com/article/us-saudi-energy-renewables-idUSKBN1501HE
Saudi Arabia will launch in coming weeks a renewable energy program that is expected to involve investment of between $30 billion and $50 billion by 2023, Saudi Energy Minister Khalid al-Falih said on Monday.
Falih, speaking at an energy industry event in Abu Dhabi, said Riyadh would in the next few weeks start the first round of bidding for projects under the program, which would produce 10 gigawatts of power.
In addition to that program, Riyadh is in the early stages of feasibility and design studies for its first two commercial nuclear reactors, which will total 2.8 gigawatts, he said.
“There will be significant investment in nuclear energy,” Falih said.
Under an economic reform program launched last year, Saudi Arabia is seeking to use non-oil means to generate much of its additional future energy needs, to avoid running down oil resources which are required to generate foreign exchange through exports.
Falih said Saudi Arabia was working on ways to connect its renewable energy projects with Yemen, Jordan and Egypt. “We will connect to Africa to exchange non-fossil sources of energy,” he said, without elaborating.
Its finances strained by low oil prices, Riyadh wants to conduct many of its future infrastructure projects through partnerships in which private companies from within the kingdom and abroad would bear much of the cost and risk.
———————————————————-
KSA is also investing in natural gas:
Saudi Aramco to boost gas production at Hawiyah, Haradh: sources
Fri Jan 20, 2017
http://www.reuters.com/article/us-aramco-gas-idUSKBN1541PK
Saudi Aramco plans to boost gas production at its Hawiyah and Haradh plants to meet growing domestic energy needs, industry sources said.
The projects, estimated to cost approximately $4 billion, would see engineering companies expand the processing capacity at Hawiyah by 1.3 billion standard cubic feet per day. Hawiyah gas plant currently processes 2.5 billion scfd of gas.
Raising gas production is key to Saudi Arabia’s plan to diversify its energy mix by cutting its use of crude oil and liquids for power generation.
“But it seems more likely to me that depletion and lack of investment will solve the price problem for producers within another year or maybe two at the most, barring a sharp economic downturn.”
I’ve been pretty skeptical here about the boom times ahead for oil companies and how Trump is going to make it all work. That’s why I have been raising some issues. Either Trump is BSing his followers, he doesn’t understand oil pricing, or his oil industry appointees know more than they are saying.
The Overstated Impact Of Trump On Oil | OilPrice.com: “’It’s clear that he’s talked about relaxing environmental regulations, and that would obviously bode well for the drillers and what not, and that would include opening up some federal lands that have been restricted, both onshore and offshore,’ Thomas Watters, an energy analyst, was quoted as saying by USA Today. ‘But just to be clear, the drilling activity… that we have seen in the U.S. wasn’t due to regulation, it was due to economics. So, at the end of the day, it’s going to be about where oil prices are and how producers react to that’.”
This is from July.
The Future of Big Oil? At Shell, It’s Not Oil – Bloomberg: “‘The transformation to a world led by renewables is going to be faster’ than oil executives think, says Mark Moody-Stuart, a former Shell chairman who now serves on the board of Saudi Aramco.
Shell prides itself on taking a longer and more clear-eyed view of the future than its rivals. In the 1970s it began drafting ‘Shell Scenarios,’ detailed analyses of global politics and economics, and their implications for energy demand. It’s been less hesitant than competitors such as ExxonMobil—the only private oil company that’s larger—to acknowledge the need to cut carbon emissions and invest in greener energy as a hedge. This year it created a unit for renewables, and Van Beurden in June told investors that Shell ‘strongly supports’ global agreements to limit climate change.”
This is a really good article, with lots of interesting charts and graphs.
Understanding the challenges of oil price forecasting – Oilpro: “The point of Mr. Lynch’s research is not to argue that it is impossible to forecast oil prices, but rather that oil industry decision-makers need to understand that their forecasts can be ‘wildly wrong,’ and that ‘knowing why they might go wrong is crucial.’ This applies to bankers, too. Mr. Lynch went on to point out that ‘[t]he market has repeatedly moved in ways thought impossible, on both the high and low side, and too many oil companies have suffered because their strategies reflected either a narrow vision of future prices or, quite simply, senior executives’ wishes.’”
[…] above graph, taken from a detailed post on this December OPEC data at the Peak Oil Barrel blog, shows total oil production, in thousands of barrels per day, for Saudi Arabia over the period from […]
According to China’s National Bureau of Statistics, the country’s oil production in December was 3,949 kb/d, up 34 kb/d (+0.9%) from November and down 7.6% year-on-year.
December production was the highest since June; and that was the second monthly increase after several months of decline. In November, China’s oil production increased 135 kb/d (+3.6%) from October’s low.
Annual-average production was 3,983 kb/d, down 312 kb/d, or 7,3%, from 2015 level.
China monthly-average oil production, 2012-2016 (kb/d)
China monthly-average oil production, 2002-2016 (kb/d)
texas production numbers are out. Looks like another drop in production with 2.6 MMBPD (pre-correction)
Gulf of Mexico
January 23rd, 2017
BP Thunder Horse South Expansion starts up ahead of schedule and under budget. Deepwater Gulf Of Mexico start-up expected to add 50,000 barrels of production, marking latest major investment in U.S. Offshore region
http://www.reuters.com/article/idUSFWN1FD0K4
September 6th, 2016
Shell announces today that production has started from the Stones development in the Gulf of Mexico. Stones is expected to produce around 50,000 barrels of oil equivalent per day (boe/d) when fully ramped up at the end of 2017.
http://www.shell.com/media/news-and-media-releases/2016/shell-starts-production-at-stones-in-the-gulf-of-mexico.html
http://www.bp.com/en/global/bp-crudes/assays.html
Thunderhorse assay
API°
32.3
Sulphur (%wt)
0.896
Acidity (mgKOH/g)
0.08
Distillation Yields (%wt)
C1 to C4
1.40
Naphtha (C5 to 149°C)
15.25
Kerosene (149°C to 232°C)
13.30
Gas Oil (232°C to 369°C)
23.35
Atmospheric Residue (369°C+)
46.7
Looks a lot like Alaska North Slope
Contrast with Algerian
http://www.bp.com/en/global/bp-crudes/assays/north_africa/algerian_condensate.html
API°
68.6
Sulphur (%wt)
0.00
Acidity (mgKOH/g)
0.01
Distillation Yields (%wt)
C1 to C4
1.90
Naphtha (C5 to 149°C)
77.39
Kerosene (149°C to 232°C)
18.25
Gas Oil (232°C to 369°C)
2.30
Atmospheric Residue (369°C+)
0.16
Really good BP pages btw
Of course, Thunderhorse crude is heavier than Algerian condensate
Again, I am not quite sure what to make of Trump’s energy policies.
Oil slides as U.S. drilling recovery outweighs OPEC-led cuts | Reuters
Rick Perry. Bachelor’s degree in Animal Science from Texas A&M. Commissioned 2d Lt as an Air Force officer and flew C130s for 5 years.
Left the Air Force as a Captain and went into business with his father growing cotton. 7 yrs of that and elected to Texas House of Reps. Moved up and eventually served 3 full terms as Governor of Texas.
One of the steps was as Agriculture Commissioner. Like the Railroad Commission oddly having control of oil, the Ag Commissioner has control of the calibration of retail gasoline pumps, and apparently this is what pointed Trump at him as Secy of Energy.
It doesn’t seem too likely that Trump appointed him because he was in charge of gasoline pumps, lol.
And while Perry is often described as a dim bulb, it’s generally impossible to say what such people actually believe. If it suits their business and political agenda, most politicians will say damned near anything, up to and including bald faced lies.
He didn’t get out of Texas A and M with a degree in Animal Science thirty or forty years ago unless he had a working brain at the time. A and M isn’t an elite school by any means, but it’s not a diploma mill either, and standards were higher back in those days almost everywhere. At least half of his core courses would have been taught by biology professors at the same hour in the same classroom with biology majors, etc.
None of this is to say that he is either particularly intelligent, or that he will serve with the best interests of the country foremost.
The real reason he’s been appointed is that he has the right connections in the political and business world to suit TRUMP’s agenda.
He probably knows half of the top Texas dogs in the energy business on a first name basis.
I can’t remember if I already posted this.
‘Learning Curve’ as Rick Perry Pursues a Job He Initially Misunderstood – The New York Times: “When President-elect Donald J. Trump offered Rick Perry the job of energy secretary five weeks ago, Mr. Perry gladly accepted, believing he was taking on a role as a global ambassador for the American oil and gas industry that he had long championed in his home state.
In the days after, Mr. Perry, the former Texas governor, discovered that he would be no such thing — that in fact, if confirmed by the Senate, he would become the steward of a vast national security complex he knew almost nothing about, caring for the most fearsome weapons on the planet, the United States’ nuclear arsenal.”
I don’t yet know what to think about Perry. He has supported wind energy in Texas. He has acknowledged that global warming has a link to human activity.
He might promote more renewables. He might promote more nuclear. He might know the limits of gas and oil — that there are limits to supplies and that anything he does now to increase production will likely keep prices low.
Whatever this administration does to increase production or give the illusion of increased production will likely keep prices low. That is good politically if Trump wants to give voters low cost gasoline. But not so good for companies that need higher prices.
If, however, the goal is for energy independence, then getting as many drivers to switch to EVs as possible would be good to better match US petroleum to demand.
And if the goal is to create more energy related jobs, then encouraging more renewable energy manufacturing and instillation would be advised.
Cheap gasoline is to Americans as bread and circuses were to the Romans.
Whatever else he is , Trump isn’t altogether stupid. If gasoline stays cheap, it will help him and his homies get reelected.
And if he can find a way to make sure domestic oil production stays up, the odds might be good when it comes to cheap gasoline. Throwing money at the industry might do the trick.
Saudi Aramco operating 220 rigs, says energy minister
Sun Jan 22, 2017
http://www.reuters.com/article/saudi-drilling-oil-idUSL5N1FC0C1
Oil and gas company Saudi Aramco is operating about 220 drilling rigs thanks to continued investment in capacity despite low oil prices, Saudi Arabia’s energy minister told Sky News Arabia.
Khalid al-Falih, who is also chairman of Aramco, said that continuous investment in drilling enables Saudi Arabia to offset the gradual decline in output from mature fields and that the kingdom is maintaining production capacity at 12.5 million barrels per day.
“We have not reduced the number of drilling rigs during the crisis. Around 220 rigs are in operation,” he said.
“Aramco can capitalise on low production costs to increase funding for these ongoing investments from its own resources, and they have absolutely not been affected by the drop in prices.”
In the past couple of years Aramco has saved on drilling costs by obtaining discounts from oil field service companies and suppliers.
Falih reiterated on Sunday that an additional 300,000 bpd of oil from expansion of the Khurais oil field, which would come on stream in 2018, would compensate for declining fields elsewhere and not add to capacity.
That’s a lot of in-fill drilling when they don’t have any new fields to develop. No mention of the neutral zone – wasn’t there some news recently that they were going to gradually bring that back on line through this year? (I think only the offshore field, not the one involving Chevron).
from the IEA Oil Market Report, December 2016:
“Saudi Arabia and Kuwait are making moves to restart output from a shared oil field in the Neutral Zone between the two countries that has been shut in for more than two years due to a political dispute. Saudi Arabia unilaterally closed the offshore Khafji field in October 2014 – ostensibly for environmental reasons. The onshore Wafra field has been shut since May 2015 due to an operational dispute. A resumption of production from Khafji, which was pumping around 300 kb/d, is likely to be gradual. Kuwait, which has been producing virtually flat out, has been harder hit by the outage than Saudi Arabia, which has spare capacity of some 1.6 mb/d.”
“crisis?”
Did Saudi acknowledge decline and depletion before like they do now – I don’t remember it? What has happened to Mohammed bin Salman al-Saud, he used to make all these sort of announcements, now it’s always his mate al-Falil. MbS must be on the back foot, the wars are disasters, the rest of the world oil supply didn’t fall as expected and he has had to reverse direction on supply cuts, money is draining away – surely much faster than he expected, and the country is going into recession.
I’d say the in-fill drilling isn’t holding production steady, it is holding decline at about 5% which is now masked by the ‘voluntary’ OPEC cuts. Khurais is only going to be able to compensate for part of that. Also what happens next year after Khurais, there is nothing else – do they go to 400 rigs (almost certainly at increasing costs by then) and after that I guess 600, and why doesn’t anybody from Reuters or Bloomberg ever ask such questions.
They did not mention depletion, but de facto they had acknowledged it before, as their plan for the past several years was to maintain current capacity despite additional production from “new” fields.
They are still insisting that their capacity is 12.5 mb/d
The plan to increase capacity to 15 mb/d was abandoned some 10 years ago.
Stratfor on KSA
https://youtu.be/dcBkUDGtqKA
No Petro Dollars consumed in this Trade?
http://www.zerohedge.com/news/2017-01-23/first-time-ever-russia-beats-saudi-arabia-chinas-top-oil-supplier
One of the reasons is that, in the past, Chinese “teapot” refineries were not allowed to import crude oil and were buying Russian heavy fuel oil (mazut). Now they are buying Russian crude.
It’s likely that we’ll see an increase in activity in North America in 2017 but maybe not as much Internationally. Due to the difference in access to capital…
Schlumberger Announces Full-Year and 4Q 2016 Results
“We expect the growth in investments to initially be led by land operators in North America, where continued negative free cash flows seem less of a constraint, as external funding is readily available and the pursuit of shorter-term equity value takes precedence over full-cycle return on investment. E&P spending surveys currently indicate that 2017 NAM E&P investments will increase by around 30%, led by the Permian basin, which should lead to both higher activity and a long overdue recovery in service industry pricing.
“In the international markets, operators are more focused on full-cycle returns and E&P investments are generally governed by the operators’ free cash flow generation. Based on this, we expect the 2017 recovery in the international markets to start off more slowly, driven by the economic reality facing the E&P industry. This will likely lead to a third successive year of underinvestment, with a continued low rate of new project approvals and an accelerating production decline in the aging production base. These factors together are increasing the likelihood of a significant supply deficit in the medium term, which can only be avoided by a broad-based global increase in E&P spending, which we expect will start unfolding in the later parts of 2017 and leading into 2018.
http://seekingalpha.com/pr/16718991-schlumberger-announces-full-year-fourth-quarter-2016-results
external funding = I guess he means the $57 billion of new shares mentioned in the WSJ
https://s28.postimg.org/erj4b2d7x/2017_01_02_North_America_oil_and_gas_producer_st.jpg
http://www.forbes.com/sites/arthurberman/2017/01/23/the-days-of-cheap-natural-gas-are-over/3/#307159d53abd
At least some of the regulars here seem to have a high opinion of Art Berman’s skills as a forecaster.
How much will it help the oil industry if gas gets back to four bucks, and stays there or higher? I know some wells produce a lot of gas, especially tight oil wells. Will the gas bring in enough money to return some of the tight oil operators to profitability with oil prices remaining under fifty bucks or so ?
Thanks for the link OFM.
We need to keep this in mind.
Aaaagh. This is actually quite complicated.
Short version.
First, NG demand for electricity is going to vanish soon, which should bring the NG price down.
It is not financially sound to build new NG-burning plants to generate electricity. Right now. Solar or wind farms are cheaper. At higher prices, it is even less viable.
At $5 NG it is cheaper to *build a new wind farm* than to *operate an existing combined cycle NG power plant*.
Utility solar wasn’t quite as cheap as wind when Lazard ran its last report, but it should be by sometime in 2018.
Now, it gets much worse if the NG price goes higher than that At $6 NG, it’s cheaper to generate heat with electricity than with NG. This causes massive demand destruction.
We already know that gas at $3 makes the gas practically worthless to the producers.
So there’s a window of viable NG prices between $3 and $6 where demand isn’t totally destroyed. But a lot of demand is already destroyed at $5. The sweet spot may be between $4 and $5.
I think that doesn’t actually give much money to the gas producers. It’s better than a kick in the head, but it isn’t going to make standalone gas wells profitable and it isn’t going to change the economics of oil wells much.
I expect that wind and solar power will be cutting ever more sharply into the market for gas as the years pass, but there won’t be enough renewable electricity produced domestically to take much of a bite out of the market for gas for some years yet.
Gas has a lot of other uses than just as generating fuel, and the market for it is growing fast as a substitute for coal. There appears to be plenty of room on the upside for gas prices, at least at first glance.
Five or ten years down the road, Nanthaneal’s point will be dead on the money , but not so much in the shorter term.
If Trump’s focus is on jobs, this is another challenge for him.
Robots Are Taking Over Oil Rigs – Bloomberg
Only a challenge until red-lube-oiled American-made oil-producing robots are enfranchised (through Trump executive order) with their well-earned US citizenship and voting rights. You then can count a working robot as a +1 in the job employment category. Plus get another “R” vote in the 2020 elections.
Gives new meaning to the phrase “voting machine”;)
Farm machinery would be the first class of mobile equipment to go to full autonomous mode across the entire mobile machinery industry, except for one thing.
Farm machinery sits around most of the time, making it hard to justify the investment, compared to a truck for instance, which will be used on a daily basis.
And farm machine operators are usually either family members or regular employees. You can’t keep a good employee unless you have full time work for him, and variety in that work encourages him to stick around. Automate his operating duties, and he might get tired of working on his feet, especially in bad weather. Successful commercial farm operators buy equipment with cabs and heaters these days, and air conditioning as well.
And if you DO have problems at critical times , an automated tractor or combine can’t fill in as a mechanic, or truck driver, or plumber, or baby sitter, or cook, or supervisor of the rest of the crew.
But on the OTHER hand…… there’s hardly any traffic at all out in farm country, and the machines travel slow, and never get far from home base, meaning the technical side of automating them is actually a lot simpler than automating cars and trucks.
India had a good month and recovered all of November’s decline, but still didn’t meet any of it’s targets. The reports indicate producers had trouble with increasing water cut, dcline in mature fields and poorer than expected performance in new wells.
http://petroleum.nic.in/docs/Monthly_Production/P_Dec_16.pdf
Unclear when (or if) Azerbaijan is going to recover from recent maintenance shut downs.
Libya needs more investment…
The head of Libya’s National Oil Corporation has called on the central bank to free up more money for the energy sector to help boost production as he tries to rally investment from international oil companies for the struggling north African country.
Mustafa Sanalla, chairman of the NOC, said oil production could jump almost 70 per cent by the second half of this year to more than 1.2m barrels a day if he can attract more money and defend the independence of one of Libya’s few functioning institutions.
“We can get production back towards 1.2m barrels a day but we need investment to be unlocked,” Mr Sanalla told the Financial Times in London, where he is due to meet oil majors and international officials this week.
Financial Times, David Sheppard, Energy Markets Editor
(paywall but you can read one for free) https://www.ft.com/content/f5b42f88-e192-11e6-8405-9e5580d6e5fb
In Canada, C+C production in December was 4,103 kb/d, 23 kb/d above November’s levels, but still 34 kb/d below February 2016 peak.
Although output is recovering after wildfires, annual average production of 3,847 kb/d was 22 kb/d, or o.6%, below 2015 year’s level.
Oil sands production (including synthetic fuel) in December reached 2,664 kb/d, second largest after August 2015 peak. Despite the effect of wildfires, annual average oil sands production increased from 2,381 kb/d in 2015 to 2,403 kb/d in 2016
According to the IEA, “After growth was all but erased by the wildfires this year, total Canadian oil output [C+C+NGLs] is expected to expand by 205 kb/d next year, to 4.6 mb/d.”
Canada’s C+C production (kb/d)
source: National Energy Board
In Norway, monthly-average C+C production was down 59 kb/d, to 1,724 kb/d in December.
Full-year production was 1,649 kb/d, up 39 kb/d, or 2.4% year-on-year.
2016 was a third consecutive year of increasing oil production in Norway. Compared to 2013, C+C output was up 118 kb/d, or 7.7%.
According to the IEA, Norways’ output is expected to decline by 50 kb/d this year as field declines offset new project start-ups.
Norway’s liquid hydrocarbon production (mb/d)
Source: Norwegian Petroleum Directorate
AlexS.
Thanks for the data.
There has been some discussion about US dollar strength and relationship with oil. Do you have the ability to compare, for example today’s prices to 1/2014 in other currencies?
shallow sand,
US Dollar strength has mitigated the drop in oil prices for producers and consumers in other coutries. Thus the drop in oil price in EUR was much less than in USD. But this trend was particularly visible in 2014.
Brent in USD and EUR
While China’s decline in its own fields might require more imports, this article says there are also reasons why that might not happen as much as expected.
Is China”s Oil Demand Growth At Risk? : “The Chinese government may cut import quotas for some of its ‘teapot’ refiners.
China may slow down purchases for its Strategic Petroleum Reserves in 2017.”
An interesting comment about China’s oil demand if Trump starts a trade war. The article is dated today.
Trump trade policy: China speaks softly and carries a bigly stick – The Barrel Blog: “However, a Beijing-based analyst at an international oil company said that any reduction in exports might have an indirect impact on oil demand, due to reduced demand for transportation and logistics. Indeed, the State Information Center, a Chinese policy think tank, has forecasted that China’s GDP growth will continue to slow to around 6.5% in 2017. The Chinese policy think tank cited not only a weaker domestic economy, but also a slowdown in international trade amid global protectionism.”
There seems to be a new number around – i.e. that $1 trillion per year investment is needed for the next 25 years to meet oil and gas demand. It came from the Saudi Aramco CEO in Davos but I think I’ve seen it quoted by Fatih Birol of IEA and someone from IHS as well.
$1 trillion per year needs about a million employees in E&Ps, service companies and equipment suppliers. I think it would take 2 years of sustained high prices (I don’t know what ‘high’ would mean in dollar terms though) and another five of recruitment to build up to that level. $1 trillion also allows about 70 to 100 billion of oil reserves to be developed, producing 8 to 13 mmbpd nameplate. $2 trillion would be enough to develop all the known proven, and most of the probable, undeveloped conventional oil reserves on IOCs, NOCs and independents books. That would leave about 23 years worth of investment for exploration, operation and development of LTO, XH, natural gas and yet to find oil. Exploration success would have to improve by about one order of magnitude, and be sustained there, to meet these requirements.
I don’t think there is a chance in hell of this happening.
“$1 trillion per year needs about a million employees in E&Ps, service companies and equipment suppliers.”
Petrochina had a million employees at time of IPO
Yeah, that was supposed to be ten million, don’t know what happened subconsciously there, also I think they are saying this is need on top of existing investment in order to meet a rising demand.
Investment in global oil & gas was already close to 1 trillion in 2011-14.
source: IEA “World Energy Investment Outlook 2014”
And the IEA projections for 2014-35 from the same source
The first energy IPO of 2017 occurred last week, a US land based only well completion service company with the ticker symbol FRAC. They sold 69% more stock than anticipated, at a higher price than anticipated, despite having not made a profit the last three years. The company has a $2.2 billion market cap this morning, with cash as of last filing of $55 million and equipment on the books at just over $300 million.
Wall Street is anticipating high demand for completion services onshore US in the coming years. Apparently service pricing power is getting ready to rise, if this IPO is any indication.
There’s bimodal thinking going on on Wall Street. There’s “business as usual” money pouring into the oil business, and there’s major-change money pouring into renewables.
I know which group is the smart money and which is the dumb money, but you can’t convince dumb people with money to not waste it.
I have serious misgivings about Trump. However, I also think there may be more going on with energy policy than the public is being told. And he might turn out to get more done with renewables than a Democratic president might.
Musk is a business advisor.
There are oil and gas people being appointed to the administration, and they should know what the futures are for gas and oil are. They must be aware that increased drilling may not produce a lot more oil and gas, and if it does, that will keep prices low, hurting companies in the process.
This is an interesting spin on the pipelines. Trump may have found a way to stop or stall them and yet make it look like he is pro-pipelines.
Trump Pins Keystone and Dakota Pipeline Fate on Renegotiation – Bloomberg: “Trump stopped short of green lighting construction on either project, and reiterated an earlier campaign pledge to seek a ‘better deal’ on TransCanada Corp.’s proposed Keystone XL to transport Alberta oil sands crude into the U.S. On Tuesday, Trump called that ‘something that’s been in dispute and subject to a renegotiation of terms by us.’
‘We are going to renegotiate some of the terms, and if they like, we’ll see if we can get that pipeline built,’ Trump said. ‘If we’re going to build pipelines in the United States, the pipes should be made in the United States.’
The Dakota Access pipeline, too, is ‘subject to terms and conditions to be negotiated by us,’ Trump told reporters while signing measures to advance both projects in the Oval Office.”
Of course there is also this.
Trump Invested $1 Mil In Controversial Dakota Pipeline | The Daily Caller: “Republican presidential nominee Donald Trump has between $500,000 and $1 million invested in the company behind the construction of the hotly contested oil pipeline in North Dakota, according to financial disclosure forms Trump filed in 2015.”
He also previously announced that last spring he sold 100% of all of his stocks.
But people don’t believe him.
TransCanada Corporation (USA) (TRP): Why The Keystone Pipeline May Be Less Attractive: “But with the new tax coming in place, the Canadian economy may get a huge blow. As reported by the Financial Post, the tax would increase the cost of imported oil by 25%. Canada currently exports around 300,000 barrels of oil equivalent per day to the US.”
A summary of reasons why the pipeline might result in higher gasoline prices for US consumers.
Why The Keystone Pipeline Will Actually RAISE Gas Prices In the U.S. | Zero Hedge
As of an hour ago, I changed my mind on Trump’s energy strategy. I don’t think he has one. He plans to build a damn wall on the Mexican border. Announcement expected to come tomorrow. Among all the things that need to be done in this country, that is so far down on the list it’s laughable. Forget energy infrastructure. He wants a wall and he wants it now.
China might be thinking, “Let the US spend its money and attention on the wall. We’ve got the rest of the world.”
China does seen opportunities. The US is retreating from the world and even building a wall. That gives China a much bigger role in world leadership.
Davos offers unsettling glimpse of new world order | Reuters: “‘Whichever way you look at it, the EU and China will have to lead on climate change,’ the official said. ‘If we want to try to maintain a world economic model based on openness and free trade, it could be led by the EU and China if we do it smart.’
This is a new world, Niblett said, in which the Europeans see Russia as a threat and China as an opportunity, while Trump sees China as a threat and Russia as an opportunity.”
The states that voted for him want the wall.
You can’t backstab your voters.
Well, you can if you’re a politician. He isn’t one. He’d have never been elected if he was a politician.
The people where the wall will be built don’t want it. Recognize it as insane.
Also, having all that federal money going to just a few border states (yes, I know supplies can come from elsewhere) doesn’t help that many states. Health care money, which at least some GOP want to defund, goes to every state.
It does. Did you know Medicare will not send money outside the US for procedures performed elsewhere.
What is the California secession movement thinking? All their elderly will have no healthcare.
Trump certainly has no coherent strategy. That much is clear.
I do suspect Tillerson is deliberately using “conflict of interest” as an excuse to cash out of Exxon. He had restricted stock which he couldn’t sell for *ten years*. It would have been worthless in 10 years. He got the cash value now and put it in a trust which, here’s the kicker, is *prohibited from investing in oil and gas stocks*.
Yes, I think the cabinet post has given Tillerson an opportunity to get out of oil. That’s why I have thought perhaps he will have some influence on Trump to see the future of the industry.
Boomer,
I see all the talk about renegotiating and what percentage of pipe will be made in what country, but I think the rabbit has already run on that. The Dakota pipeline is mainly in the ground, and it is only the area around the river crossing that is in question, and I seem to remember from the oil drum, pictures of stacks of pipe out the back of Nebraska or somewhere, which had already been ordered and manufactured for Keystone. Not sure where the pipe was made, but it is hard to see anyone ordering a complete new pipeline just to comply with the new requirements.
The other option I see for Keystone, as the Dakota Access line will not be at capacity, is for Keystone just to go to North Dakota, and using the Dakota access pipeline, until more capacity is required. Of course that will depend on future Bakken production.
Tar sands production is largely unprofitable. The mining-based operations have recurring costs of $40-$50/bbl, which is hopeless at current oil prices. The SAGD operations have lower recurring costs around $25-$40, but new expansions cost more than $50.
As a result, the production from the tar sands *will* decline. I suspect Keystone XL won’t get built, and if it does get built, it’ll run empty and go bust.
Although there are a number of qualifications, the implementation of modular SAGD plants was just getting underway when prices collapsed awhile back.
The ability to transport, erect, and – if necessary – relocate – this infrastructure, offers enormous potential.
The evolving improvements using solvents, more effective lateral emplacement, as well as other innovations may provide more viable production in the coming years.
But do we need that oil right now or the pipelines to transport it? Seems like anything that increases oil supply now just keeps prices down, which punishes companies trying to survive in other places.
Doesn’t it still come down to the idea that oil sands are too expensive unless oil supply decreases significantly and prices go up enough?
Boomer
All good questions for which I have no answers.
One reason why I focus on operations rather than financials as there are so many cascading repercussions/consequences regarding this dizzying array of innovation.
Financials are my thing. The dizzying cascade of consquences of everything is the interesting part, to me!
The relocation of the SAGR plants is an interesting point… but the problem there is, of course, that relocates them away from the pipeline. So it ends up being trucked to the start of the pipeline, I guess?….
We can model these SAGR operations as something which doesn’t decline (just keep moving on to the next deposit) but also has constant fairly-high operating costs.
Anyway, my main point here is that it’s not cost effective to open up a NEW tar sands facility — and will not be cost effective unless oil prices go way up. This means that the total volume coming from the tar sands will stay constant at best, and may go down as demand drops.
I guess the stuff going by railroad can be displaced to the pipeline. Is that sufficient to make the pipeline profitable? Or were they depending on higher volumes?
I actually haven’t checked that. So I’ll do so.
Keystone: 591,000 bpd
Keystone XL: 830,000 bpd
Total: 1,421,000 bpd
(I’m not sure how many other pipelines absorb the tar sands oil)
Total tar sands production 2014: 2,300,000 bpd
OK, so it looks like at current production rates, a lot will still be going by train, so the pipelines will be filled. When production drops in half, they’ll have a shortfall.
I’m not sure exactly what pricing situation it will take for production to drop in half; I’m quite sure $20/bbl oil would do the trick.
My projections expect $20/bbl oil by 2025. Can the pipeline promoters make back their investment in 10 years? Good question,which would take even more research to answer… maybe they can.
Dakota Access pipeline is in a much, much worse situation. Bakken fracked oil wells decline *very* fast and it looks like the whole field is probably going into decline this year. Can they make money off delivering three years of production? Because that’s basically what they’re going to get. After that, the production volumes will decline so much that it wouldn’t have been worth building a pipeline. Sure, maybe it’s five, but you see my point.
Dakota Access is specced for 570,000 barrels per day. They’ll get that in 2017, 2018, and then roughly half that in 2019, and then it’ll drop fast. At $8/bbl, they make about $4.18 billion in revenue. It cost them $3.78 billion to build the thing. 10% gain over 3 years? Terrible ROI… and that assumes they have no financing costs…
PS — if I assume the same $8/bbl revenue for Keystone XL it pays for its raw construction costs in about 6 years. So it’ll probably break even… unless oil prices drop earlier than my central prediction date, which is definitely a possibility if idiots keep exploring for new oil. (My prediction date is based on that NOT happening.)
Nathanial- aren’t you far too biased about fossil fuels to do any useful financial analysis? Truely.
Hi Toolpush.
I doubt an economic case can be made for Keystone XL. If we look at the context we see Kinder Morgan’s TransMountain pipeline expansion approved by Ottawa and, if memory serves, by BC as well–a pipeline that goes to the Vancouver area and thus the Pacific; and TransCanada (KXL is TransCanada’s too) still trying to get Energy East approved, to terminals that serve the Atlantic, and the two together sum to more than the capacity of KXL. I expect that KXL’s minimum subscriptions won’t be met, any more than they were last time around.
Are you out in Oman? That is in my (failing) memory, but that isn’t dependable. Happy New Year, wherever you are.
Rystad Energy floating rig market outlook for 2017
2014: 261
2015: 225
2016: 159
Although we estimate the floater market to decline by 6% to 147 units in 2017, we expect to see a recovery into 2018 with a rig demand of 166 units, corresponding to a 13% increase over 2017’s forecasted exit.
Looking ahead to 2018, Rystad Energy forecasts rig demand to increase in South America and West Africa, driven by projects like the Libra Pilot in Brazil and Egina in Nigeria.
https://www.rystadenergy.com/NewsEvents/Newsletters/OfsArchive/ofs-january-2017
Shell looking like they are going to pull back from exploration now so that might change the 2018 figures a bit.
ZH blurb says sanctions against Russia, at least those relevant to Arctic drilling, are due to expire in March.
I’ve a new post on the Marcellus, here.
Jodi data out again. Saudi crude inventories dropped again in november. Appears to be fairly steady decline of a roughly 2 million barrel each month
BP Energy Outlook – 2017 edition
Download the latest edition of the BP Energy Outlook, supporting resources or our country and regional insight factsheets
http://www.bp.com/en/global/corporate/energy-economics/energy-outlook/energy-outlook-downloads.html
Marcellus inactive wells, is it just that they need more pipeline capacity? https://shaleprofile.com/
EN
Just did quick check using Enno’s site and looks like Exco’s 65 wells play a role.
I think they’re going BK or something.
Enno’s site offers amazing potential for analytical purposes.
Also looked like Cabot, Southwestern, Chesapeake and Anadarko had a fair amount of IA wells.
Anadarko just bailed out to Alta, the outfit George Mitchell funded a few years back.
While Trump Backs Oil Pipelines, Gas Lines Are in Limbo
by Jonathan Crawford – January 25th, 2017
At least five major gas pipelines planned across the U.S. are caught up in legal battles and lengthy reviews before energy regulators. The lack of pipeline space is meanwhile depressing prices for gas flowing out of prolific shale formations in the eastern U.S., forcing drillers to curb output.
https://www.bloomberg.com/news/articles/2017-01-25/while-trump-backs-oil-pipelines-gas-lines-are-the-ones-in-limbo
Why are there delays? There aren’t environmental issues, are there?
While I think oil sands are a questionable way to get oil and would rather not see that expanded, natural gas coming from fields already established seems more like a plus for the environment than a problem.
And why gas pipelines might pose an explosion issue, any leaks they have won’t pollute the ground or water, will they?
WARNING
Read no further if not interested in my opinion of the political sausage factory when it’s grinding oil based sausage.
xxxx
Its an invitation to a pissing match when I post a comment that can be construed as supporting the R camp, the BAU business camp.
BUT
Sometimes we really do suffer economic AND environmental pain due to over regulation or misguided regulation of business and industry, and the case of stalled permits for natural gas pipelines is such a case.
When I spend an hour once in a while reading about the legal barriers that are holding back or preventing the construction of any kind of pipeline, even one intended for drinking water occasionally, the impression I come away with is that the regulators- civil service employees of local, state, and federal government are usually at the center of the problem.
BUT I am NOT saying they are the CAUSE of the problem. They just happen to be handy targets for the pro BAU political faction. The large majority of them try to do the right thing, as best they know how.
There are two obvious important sources of interference that keep them from making a decision pro or con on any given proposed pipeline.
ONE source is political pressure coming from “upstairs”, pressure from their bosses, who do not have authority to actually TELL them what to decide, but bosses DO have ways of making their pleasure or displeasure known, and anybody who doubts this is a fool, enough said. A cynical hypocrite, R or D, his party does not matter, invariably says the decision is the RIGHT one on the merits, if it goes HIS way, or that it was a BOUGHT decision if it goes against him.
It’s obvious to me at that the long delay in announcing the federal level decision on the Keystone was the result of political manipulation of the regulatory process. It’s less clear whether the eventual no decision was the right one based on the environmental and economic facts on the table.
The OTHER major source of delays and the ultimate reason for some NO decisions is political opposition arising from environmental organizations and from people and communities of people who just don’t want pipelines built thru or near their home turf.
We all know about the nimby ( nothing in my back yard) faction. It can at times be a very powerful force. Witness the power of the people who own water front in some of the richest communities in the USA when it comes to stopping the development of offshore wind. Witness Trump doing what he can to stop or stall wind power in Scotland, lol.
Then there are the environmentalists who are opposed for various different reasons. One subset of environmentalists are referred to as bananas, build absolutely nothing absolutely nowhere. They aren’t very important , because they are few and seldom have much in the way of money or organization.
Serious environmentalists, the kind with money enough to show up at hearings with competent lawyers and witnesses, the kind that have long lists of contributors, and potent voter outreach campaigns, are the KEY to delays and denials.
Most of the time,but NOT all the time, they are doing the right thing, advocating for the most environmentally satisfactory option on the table.
We all know the joke about the environmental camp dropping it’s drawers and hopping in bed to make some political whoopee with the farmers and bankers and moonshine mafia, the owners of the ethanol industry. The GOAL sounded good, but the environmental camp was lead by it’s hand to bed, drunk. That’s what ethanol does to you, it makes you DRUNK. . The environmental camp got some sex,and apparently enjoyed it at the time, but they got no respect the next morning, and haven’t gotten their respect back YET, not entirely.The ethanol frat boys are still laughing about the fun they had with the environmental sorority girls.
But hell, mistakes WILL be made, every body makes some mistakes.
A further complication is added due to the leadership of the environmental camp being compelled to adjust campaign goals and strategies in such a way as to encourage the support of donors to their causes. They NECESSARILY have to feed some figurative red meat to the vegetarians with the money they must have to keep their offices open, and not to mention keeping their salary checks coming. So ………..
Even if a given environmental spokesman happens to know that the construction of any given pipeline is actually a GOOD thing, environmentally and economically, he may find himself opposing it for practical reasons.
In the case of a gas pipeline that would deliver gas to an electric utility, thereby enabling the utility to switch from coal to gas, a new pipeline is just about a sure thing environmental win. Sure there will always be a few leaks, and explosions, and sure there will always be some environmental damages incurred during construction, but compared to the air pollution issue, and the environmental destruction involved with just the MINING of coal ( never mind the burning of it ) the environmental cost of a new pipeline is minor to trivial.
All these factors tend to result in a cat’s ball of yarn mess of shifting alliances of convenience, further muddying the waters. Politicians in positions of power occasionally use the lawsuits brought by environmentalists as excellent fig leaves to hide their real motive, if their motive is to win votes and donations to their party or personal campaign fund by denying or delaying construction.
Should I mention that some people think maybe that the coal industry itself is behind a lot of the opposition to the construction of gas pipelines? Ya THINK? NAH!
Here’s what one of the regular members of my informal little local country club had to say about it over his Bud a few days back, as best I can relate it in the local vernacular.
. Only ah ignerunt dam fool dimmercrat would even THINK sich ah a slander ’bout the coal guys, never mind achley sayin’ it out loud.
The coal guys they’ r all bout free innerprize ,( an may the man with the mos’ money win ever time, as long as it’s them with the money and the win, according to another guy ) and the guv’mint staying outta the way of biz nis men providing on es goods ‘n services and on es work fer working men and wimmen.
They have TOLE us so their very selves, ‘n we the Koch brothers set the zample ‘n teach Sunny School ever Sunny morning , ‘n Bible Study ever Winsey nite,seven sharp, their own self. Ya kin read all ’bout it at Brother Barts news on that there smart fon in yer hip pokit. Ah have ah hard time unnerstannin’ how them scietis’s can be so good at their bizness one way , and invent sich things, an still be so dum they ‘bleve in that there so called klim it fool bull shit ‘n the weather gitting hotter ever year till we all dead frum it. . It’s got ter be that they have took the silver, they ain’t nothing else that makes enny sens ahtall.
Believe it or not, the guy who said it, more or less as I have related it, is a hard core Democrat, and has been ever since he got half of his right leg shot off in Vietnam, or along about that time. It MIGHT be that he was just a TAD sarcastic, perhaps.
I couldn’t really say for sure myself, because I have been told I’m a Trumpster so many times I’m about half ready to believe it, sometimes, and might therefore be biased in favor of the R’s and the coal guys. 😉
Nothing is ever simple and straight forward when it comes to politics, politicians, government, and the people who are pushing opposing agendas at decision making time.
The environmental camp really ought to be more careful when it draws a line in the sand, as a matter of principled opposition, or to rally the troops. In the case of gas pipelines, the ACTUAL result of delayed and denied construction is that not only do we continue to burn more coal, we are more likely to elect TRUMP’s.
There is hardly any question at all that the opposition to the Keystone backfired and played into the hands of the R party.
At the time the debate was going on, I argued that the smart move for the D’s would be to use the Keystone as a bargaining chip to win some serious, and I mean SERIOUS , concessions or victories in respect to some other environmental battles. They could have for instance used the leverage to get some large tracts of environmentally sensitive land permanently set aside as nature refuges or for public use as parks, or to get more money approved for research and development of renewable energy.
THAT way, they would have come out big winners politically. It was ALWAYS obvious that that nasty Canadian oil WOULD find its way to market, whether the Keystone was built, or not.
Competent generals pick the battles they can reasonably expect to win without expending too many resources, and losing too many troops. They avoid the ones that might result in major losses, while offering nothing of real substance in terms of winning the war. The Keystone was such a battle. It cost the environmental camp dearly indeed, in the end. They won a moral victory, but it cost them many times what it was worth, considering that the oil was going to get to market anyway, and that the issue was a GLOWING RED HEAT hot button that worked a hell of a lot better for the R’s than it did for the D’s.
Hess is the first biggish E&P to report that I have seen and they made a big loss, mostly because of an accounting charge:
http://phx.corporate-ir.net/phoenix.zhtml?c=101801&p=irol-news&nyo=0
“Net loss was $4,892 million, or $15.65 per common share, compared with a net loss of $1,821
million, or $6.43 per common share in the fourth quarter of 2015; Fourth quarter 2016 results
include a noncash accounting charge of $3,749 million on deferred tax assets and other aftertax
charges totaling $838 million”
“Oil and gas production was 311,000 barrels of oil equivalent per day (boepd) compared to
368,000 boepd in the fourth quarter of 2015”
Yearly loss was $6,132 billion. Next year production expected to be 300 to 310 kboepd (this year was 321).
Reserves increased (119% replacement ratio) mostly from the Malaysia and Denmark and (I think) some purchase in Bakken. They don’t include the Liza discovery for 2016, maybe that goes against 2015.
OK. Deferred tax assets mean old costs which you can deduct later. There are several ways that these can be written down. The most common, however, is that they expire. You’re allowed to carry over net operating losses for ten years, IIRC, so if you’re still losing money in year eleven, bang, your “deferred tax asset” disappears.
Most causes of deferred tax assets being written down are *bad* — they mean the company didn’t have enough income in recent years to use the tax deductions.
The only one which is *good* is if your tax rate just got cut (making the deductions less valuable), but that’s still only good if you actually make a profit.
http://www.zerohedge.com/news/2017-01-25/libya-bigger-threat-oil-prices-us-shale
Despite some suggestions that oil prices will level off at around $60 in 2017, since the initial surge of the OPEC production deal prices have barely nudged above $53. Over the long-term, outlooks are more bearish than bullish, and a major reason for that is the strong likelihood of increased production in three places: Libya, Nigeria and Iran.
Iran and Libya have truly low cost of production. Iran has a diversified economy and is not really dependent on oil to balance their budget. They can afford to increase production…
Geez. If everyone is still throwing capital at increased production, they may manage to keep oil prices low enough in the near term to make sure than nobody makes any money. Competitive markets at work. Meanwhile, oil prices are still high enough — even at $30/bbl — that electric cars are decimating the luxury car market and electric buses are replacing diesel buses…
Most people believe the price of oil today at under fifty dollars a barrel is depressing rather than supporting the sale of electric cars.
My opinion is that this is true, short term, meaning that electrics would be selling a LOT faster if oil had stayed up near a hundred bucks.
The usual explanation you hear from the old line automobile industry insiders speaking as individuals, and most business men who get their suits at BAU Men’s Wear, is that environmental regulations are THE driving force behind the growth of the electric car market. You can’t sell ICE Impalas and Corvettes by advertising peak oil. 😉
Hardly anybody at all with a personal stake, meaning money, status, professional standing, etc, in the business as usual establishment wants to even mention peak oil, any more than they want to mention that their wife ran of with the gardener.
And of course when electrics are advertised, the focus is almost entirely on the advantages of the technology, without even an oblique mention of the day when there will again be long lines and rationed purchases at service stations. Given that Tesla is about the only pure play electric car company selling enough cars to matter, you would think that Tesla would mention peak oil directly…….. but Tesla doesn’t advertise, lol.
Having said this much I will also say that I believe the FEAR of high oil prices is a major driving factor behind the huge and hugely expensive efforts all the major auto manufacturers are putting into adding hybrid and electric models to their lineup as fast as they can.
And the next time gasoline prices go up a buck a gallon over a short period of a year or less, well………. you will have to wait in line if you want a Volt or a BOLT or a TESLA THREE …… or even a LEAF.
And for what it’s worth, my guess is that there is an EXCELLENT chance that the next time NISSAN upgrades the LEAF, the LEAF will leapfrog the Bolt and the TESLA THREE.
Nissan/ Renault is a company with resources to be reckoned with, and it’s too early to count them out.
The Keystone XL pipeline may not have a future.
TransCanada CEO says shippers being polled for support of Keystone XL – MyMcMurray: WHISTLER, B.C. – “The CEO of TransCanada Corp. (TSX:TRP) says the company will be talking with shippers to determine if they still support the Keystone XL pipeline project after it was given a new lease on life by U.S. President Donald Trump earlier this week.”
Keystone XL Still Faces Obstacles Even With Trump’s Approval | OilPrice.com: “The midstream market is different than it was back when Keystone XL was the only game in town. It is not at all clear that Keystone XL makes sense anymore with two major competing pipelines now moving forward.”
Barclays’ projections for U.S. LTO production in 2017:
Texas’s Permian Basin is only U.S. oil-producing region where production will rise
http://www.marketwatch.com/story/texass-permian-basin-is-only-us-oil-producing-region-where-production-will-rise-2017-01-18
Barclays expects exploration and production companies to increase their spending by more than 50% this year
West Texas’s Permian Basin will be the only U.S. oil-producing area to see an increase in production this year, with the number of wells there rising by more than 30% and outpacing major basins in North Dakota and south Texas.
That’s from analysts at Barclays, who also predicted the Permian basin’s production will continue to exceed its pipeline capacity, a bottleneck point expected to last at least until a new pipeline is completed next year.
The Permian’s oil output looks to increase by 350,000 barrels a day year over year, and by 490,000 barrels a day from the fourth quarter of 2016 to fourth quarter 2017, the analysts said.
North Dakota’s Bakken formation will add more wells this year, which could be enough to increase production, but only in the later part of the year. The analysts forecast a decline of 40,000 barrels a day year on year for the area, also comprised of parts of Montana and the Canadian provinces of Saskatchewan and Manitoba. From fourth quarter 2016 to fourth quarter 2017, they see an increase of 10,000 barrels a day for the Bakken.
The Bakken has suffered from “lack of development interest” since the oil downturn, the Barclays analysts said. “Some larger producers in the basin have opted to focus more on other assets in their portfolio, while others are hamstrung by heavy debt burdens, unable to develop their acreage at a normal pace,” they said.
The number of rigs in the Bakken’s Williston area, for instance, fell from nearly 200 in 2014 to 22 at the end of May, they said. Since then, only 11 rigs have been added to the region, they said. It doesn’t help that the Bakken is dependent on rail to move roughly 30% of production out of the basin, which hinders well economics, the analysts said.
For south Texas’s Eagle Ford, the Barclays analysts said they expect a decline of 150,000 barrels a day year-on-year, but an increase of 10,000 barrels a day from the fourth quarter of 2016 to the fourth quarter of this year.
Link to a HSBC report discussing the prospect for oil prices. Very interesting discussion of decline rates. Bottom line: discoveries are getting smaller, and smaller fields suffer from substantially higher decline rates (>12% p.a. compared to average of 6.2% p.a.). 2015 saw an all-time low in new discoveries with only 5% exploration well success rate (is this really correct?): oil is getting harder to find, the fields are smaller, and they decline more quickly.
https://doc-08-84-apps-viewer.googleusercontent.com/viewer/secure/pdf/gpslif8seo0587rparh4iepe8e16eaev/70k6ptaa8vf56bvg7ck1nu5eai19k8f2/1485442950000/drive/14011321498742991046/ACFrOgBm2k8y9KRicb_3xmNJZJto1TvAW6vTdlD1t3RYKyC_vXGDBnW1PftjZ9nIyr4amDzaa7r1_YrRiUysWbllXA7-oD9pRBnhXzLMzSgXV4IgaEC3e79Ndt35Cm8=?print=true&nonce=20tq4cgbfni16&user=14011321498742991046&hash=8upich2tcpeditmvq845bc3314u5sdir
That link is broken. I think perhaps this is the page you are talking about: Global Oil Supply
This link has been posted here before, about a couple of weeks ago.
Your link doesn’t work for me. Is this the same document?
HSBC peak oil report 2017.pdf – Google Drive
Yes, that’s the one. Sorry about the broken link, and if it has been posted before. Full of very interesting data though.
Are HSBC correct in asserting that only 5% of exploration wells in 2015 discovered commercially viable oil reservoirs?
I going to post this here because I think it will get lost in the non-petroleum section.
Elon Musk Has Trump’s Ear, and Wall Street Takes Note – The New York Times
I’m planning on enjoying many a belly laugh when all the R puppies that have fallen in line and acknowledged Trump as the pack leader by rolling over and peeing themselves and then licking his paws to curry favor change the tune they have been singing about TESLA since day one.
Most of us here are acquainted with the way the boys in their frat house talk dirt about the girls they date, and how they ge t into their pants, and how dumb the girls are, etc. We can pretend we don’t indulge in such talk, but nobody at all actually believes it when we deny doing it. Well, sooner or later, one of those girls winds up paired off with one of those boys, to the point of going home to meet the parents, and getting married.
And her supposedly low life past is HISTORY along about that time. Mentioning it is almost guaranteed to start a fight.
The same people who have been talking themselves hoarse about TESLA getting fat on subsidies, and the injustice of it all, will soon be telling us non stop about how TESLA is a superlative example of good old GITERDONE AMERICAN ENTERPRISE. Trump will tweet it a few times, and like the dogs they are, they will fall in behind the pack leader.
Anybody who doubts it is as dumb as a fence post. 😉
I have stopped four or five of them dead in their tracks (among my personal acquaintances ) by way of asking them just how fast they have been able to write off their investments in their fancy pickup trucks, which after four or five years are still in near showroom condition, although they are SUPPOSED to be work trucks. Well, they DO drive them to their accountants office, and even to a meeting with a customer , once in a while. But mostly they drive them to the mall, and to the lake, and on vacation.
The best they can do is to mumble that it’s DIFFERENT in their case, but they have never been able to explain WHY it’s different. They get the tax break, the manufacturer gets the full price, the rest of us who can’t afford a TESLA or a new tricked out pickup pay for the subsidy.
Worth posting in the Oil section … we know what’s now possible. Creepy Crawlers wondering Lands and Oceans Extracting Hydro Carbons molecules we previously considered uneconomical.
http://www.zerohedge.com/news/2017-01-27/robots-over-roughnecks-next-drilling-boom-might-not-add-many-jobs
https://www.wired.com/brandlab/2015/07/re-planting-forest-one-drone-time/
http://www.zerohedge.com/news/2017-01-27/robots-over-roughnecks-next-drilling-boom-might-not-add-many-jobs
“Jobs lost during the oil price downturn may not come back.”
Mike and I had this discussion a couple of years ago. I think he said there’s simply not a lot of automation in the oil fields.
Maybe yet.
But I’d say no. The Prez will tweet the fear of God into them. There is no requirement (or societal merit) to automating people onto government benefits. If profit is squeezed, get some free loans. We have precedent for that, yes?
Many humans from employer perspective are not reliable. Heck they can’t even vote the Party line. /har The Financial capital vs Human capital race will indeed be of interest. Graphs of Manhours / BOE per Region?