The EIA’s Short-Term Energy Outlook gives the USA data as C+C as well as total liquids, OPEC as crude only, but the rest of the world is Total Liquids only. All data in the charts below are million barrels per day.
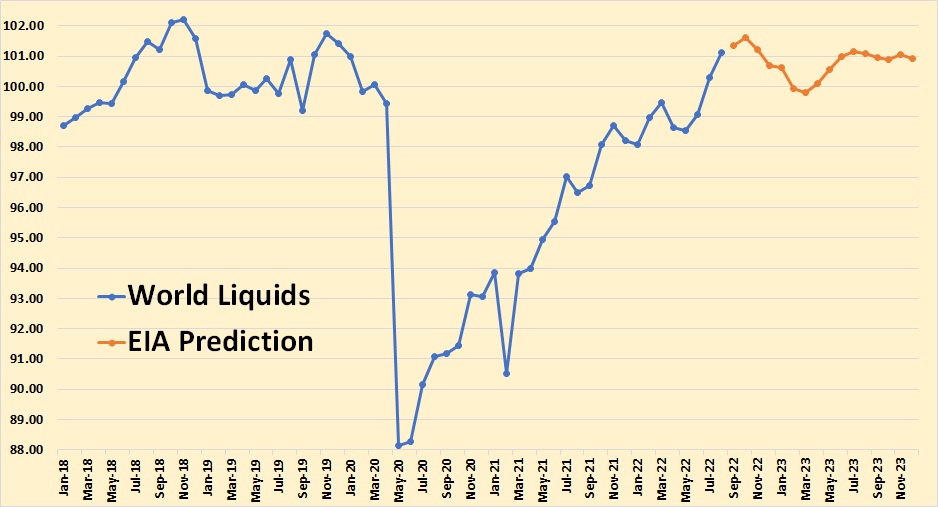
The known data is through August 2022, the rest, in red, in million bp/d, is the EIA’s estimate. However, this is Total Liquids, not C+C. And Total Liquids is not a good indicator of oil production as the below table shows.
July is the last world data we have for C+C, so the data in the table above is for July 2022. The data is thousands of barrels per day. As you can see, they Natural Gas Liquids were over 13 million barrels per day. Other Liquids, which included Biofuels were 4.6 million bp/d. Refinery process gain was 2.355 million barrels per day.
Though the World Liquids chart above shows July 2022 production at just 1.915 million bp/d below the November 2018 peak, the World C+C chart shows July 2022 production at 4.394 million barrels per day below the November 2022 peak. That is almost a 2.5 million bp/d difference. Again, July is the last world data we have.
Does anyone really believe that bottled gas, cane and corn ethanol, or refinery process gain tell us anything about world crude oil production? Of course, the EIA gives us the C+C data but the STEO does not. Also, when the news media quotes the world oil production numbers, it is always total liquids.
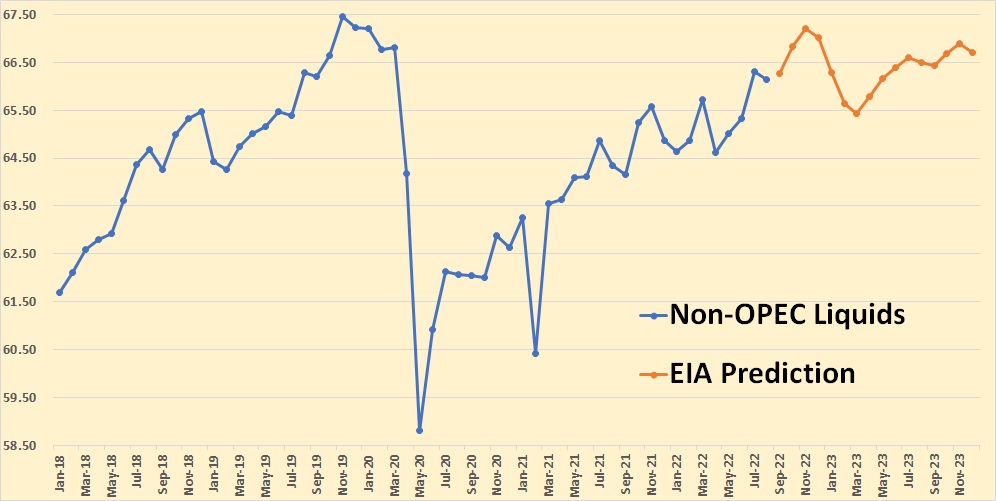
The known data is through August.
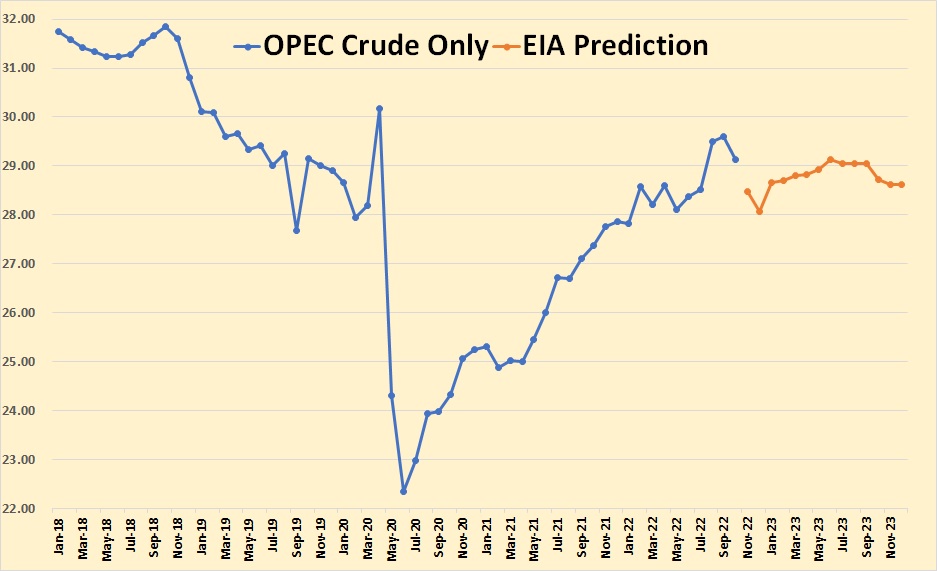
The known data for OPEC crude only is through October. The EIA expects OPEC crude to drop the almost 28 million bp/d by December but then rise to over 29 million bp/d by June 2023. I believe this is a bit overly optimistic.
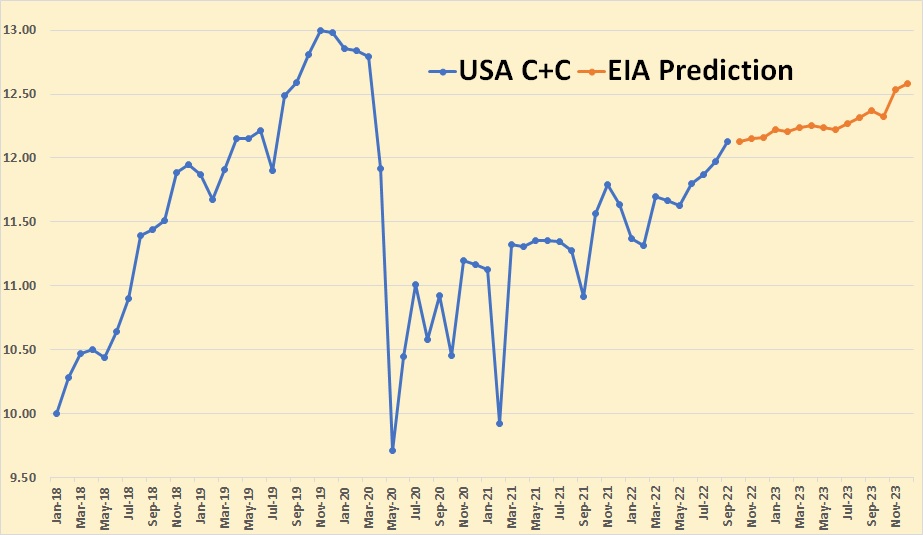
The known data for USA C+C is through September.
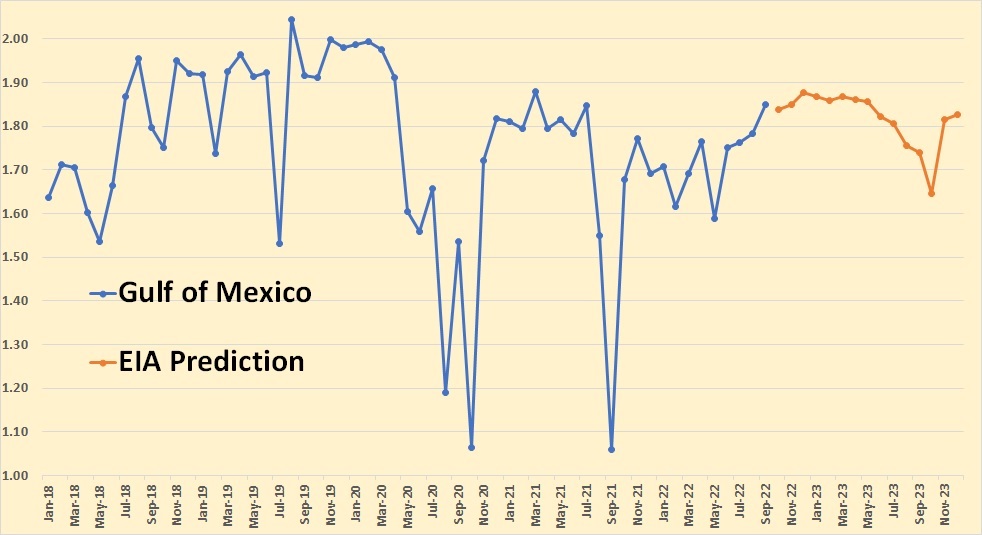
The known data for the Gulf of Mexico is through September. The EIA seems to think that the GOM has peaked, at least through 2023. The data here, as well as all data in the chart below, is Total Liquids.
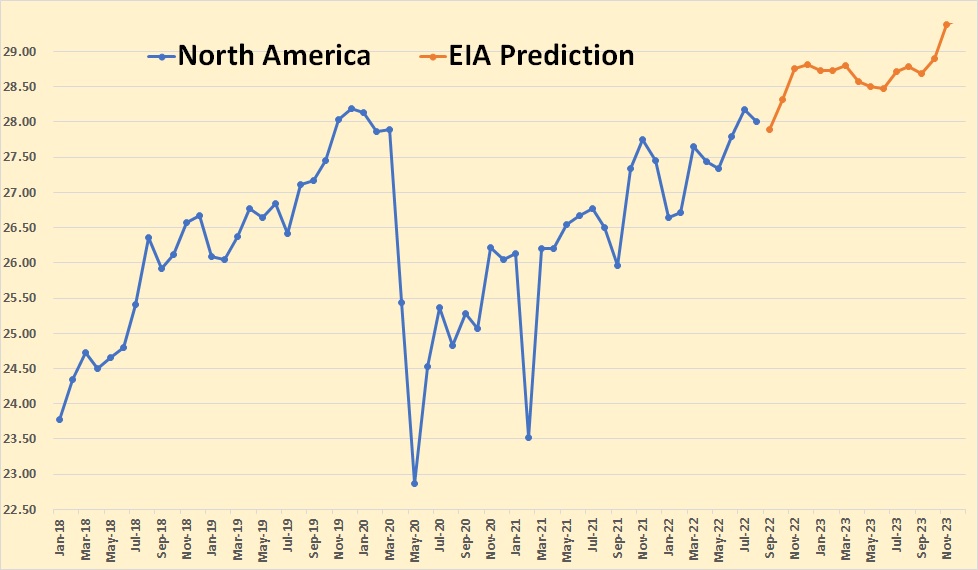
The North America Liquids known data is through August. The data includes the USA, Canada and Mexico. The EIA obviously thinks North America’s best days are ahead of her despite Mexico’s declining production.
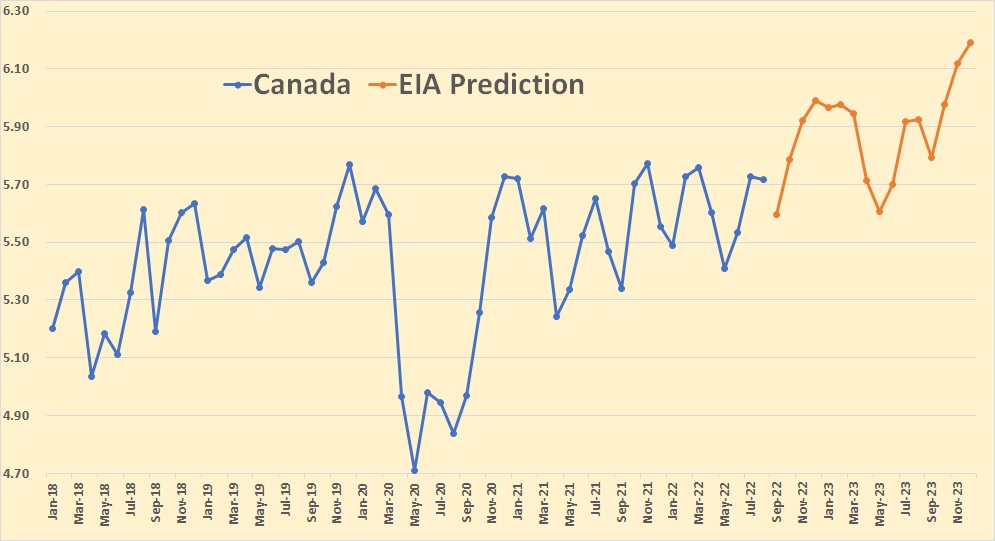
The known data for Canada Liquids is through August. The EIA is expecting Canadian Liquids to rise by almost half a million bp/d by December 2023.
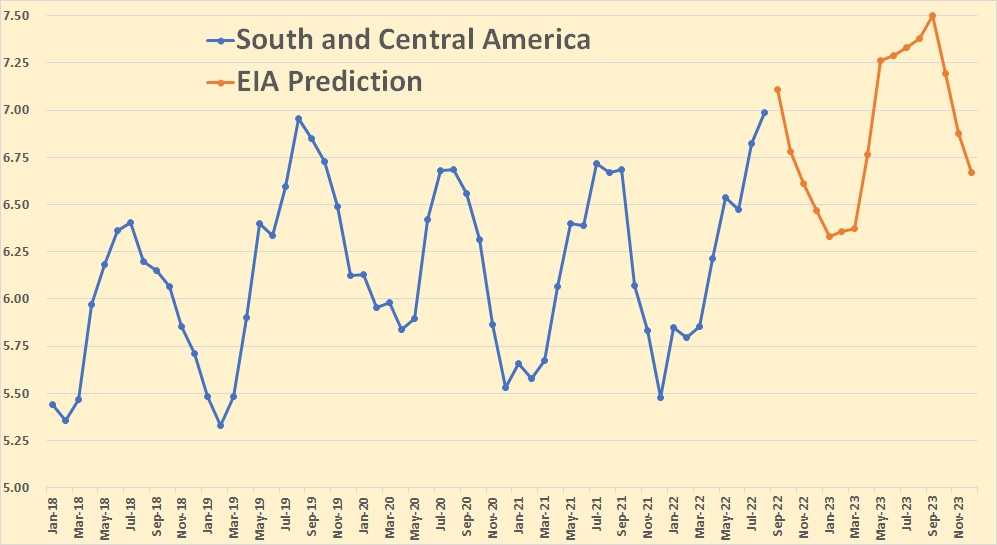
South and Central America include Argentina, Brazil, Colombia, and Ecuador. The huge seasonal swings are due to the seasonal production of ethanol in brazil. Known data in this chart and all charts below is through August 2022.
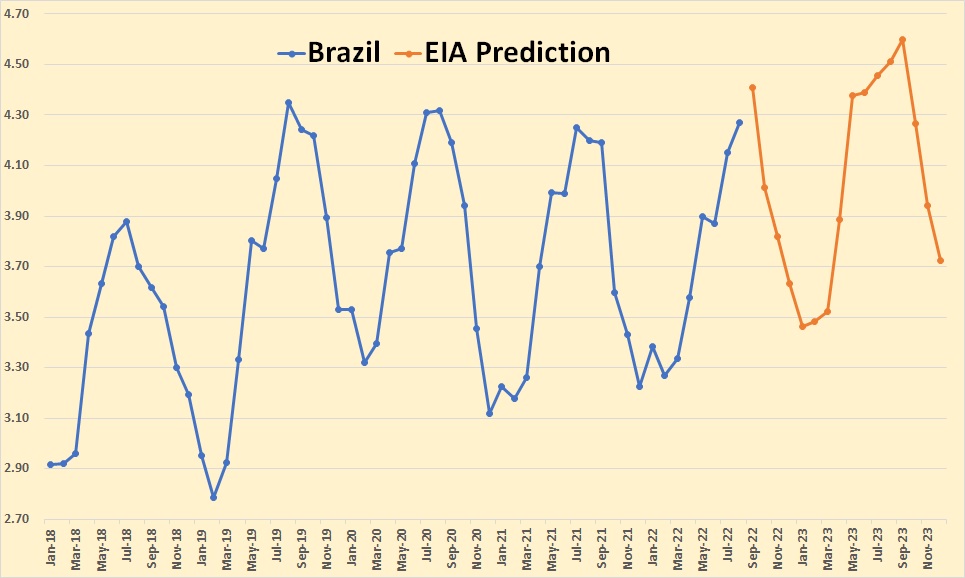
By including ethanol production in these charts, the EIA makes some of them useless.
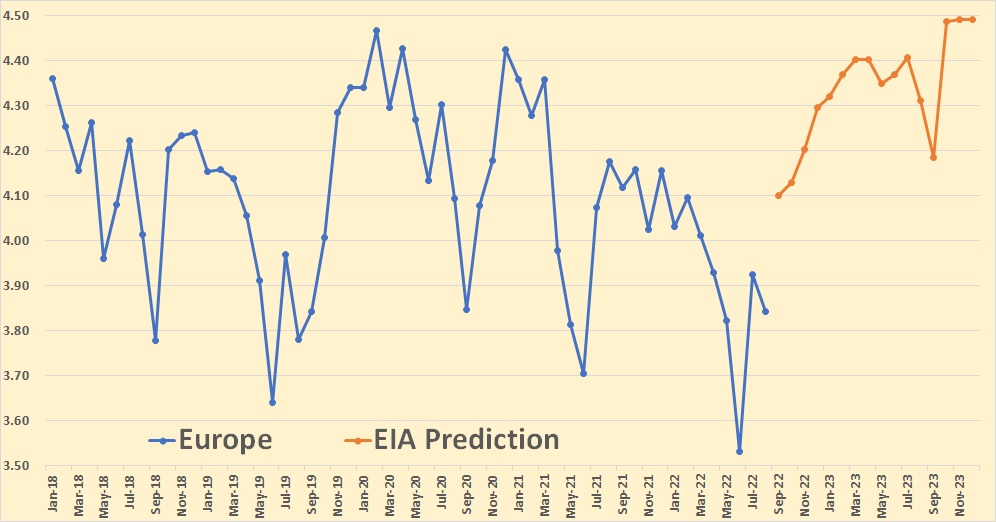
Europe consists primarily of Norway and the UK. Denmark and a few other countries contribute a small amount.
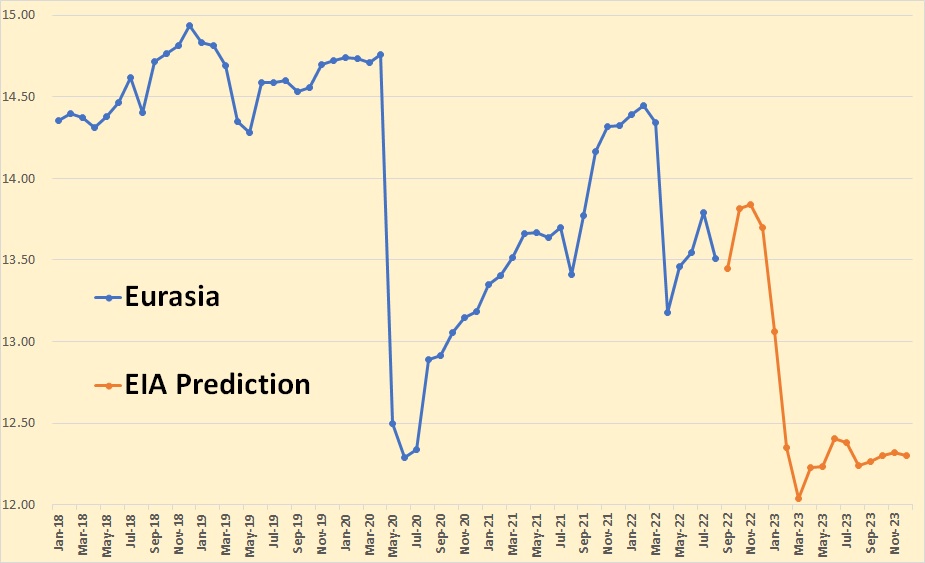
Eurasia consists of Azerbaijan, Kazakhstan, Russia, Turkmenistan, and a few smaller producers. The increase in expected October 2022 production is Kazakhstan getting their pipeline problems fixed, and the later huge decline is due to sanctions on Russia.
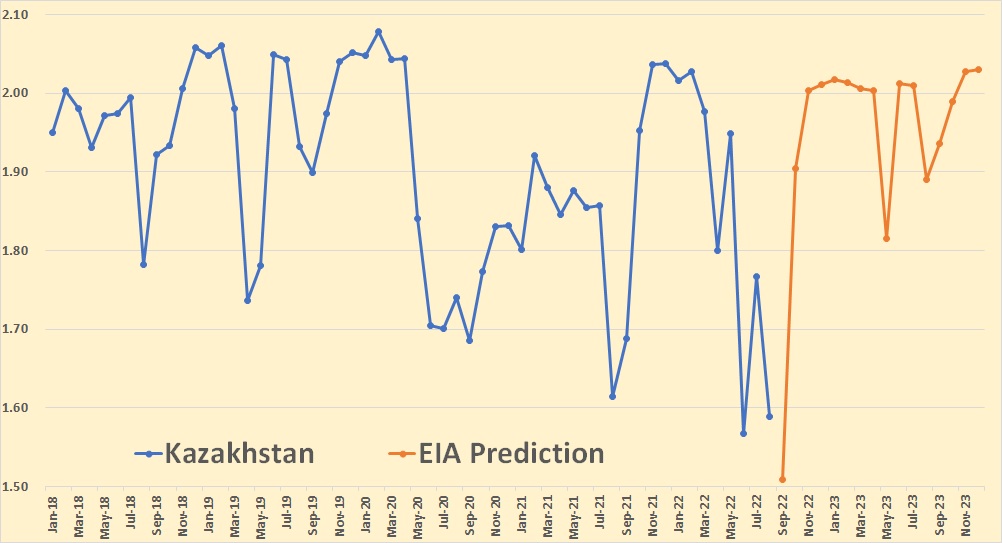
That’s a 390,000 production they are expecting from Kazakhstan in October.
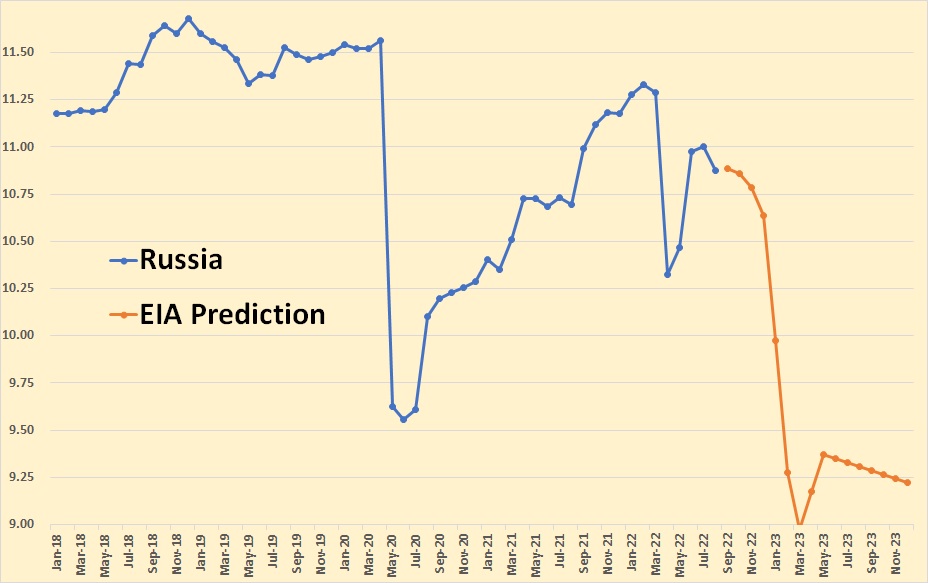
The EIA expects Russian production to drop by about 1.9 million barrels per day by March 2023 before recovering slightly.
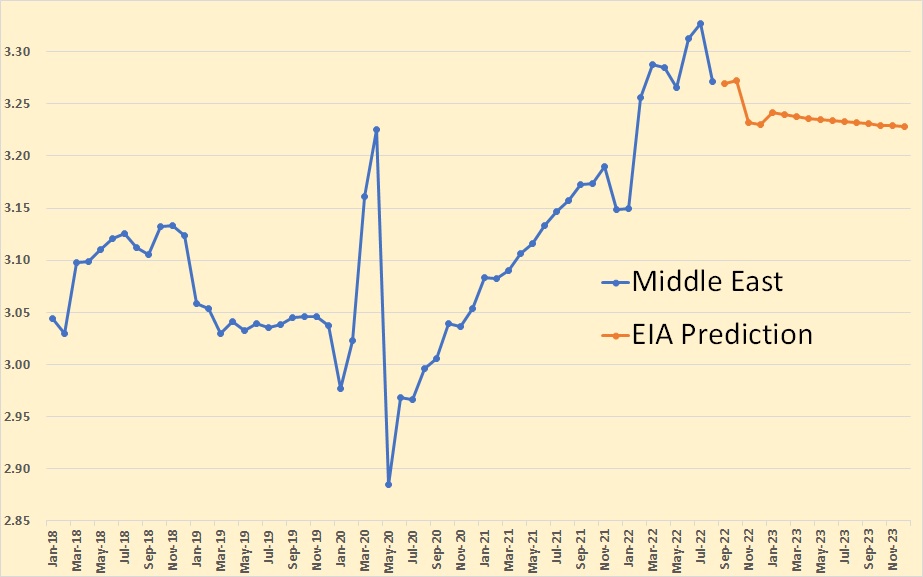
The Middle East is mostly OPEC, but all OPEC nations are bundled to gether in the EIA’ s STEO reporting. This chart includes only Oman and Qatar.
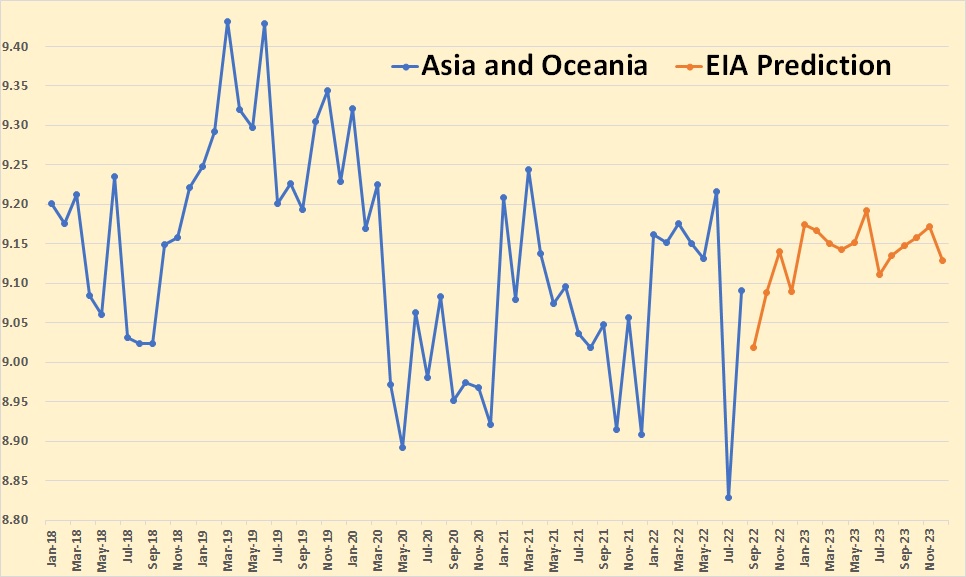
Asia and Oceania consist of Australia, China, India, Indonesia, Malaysia, and Vietnam.
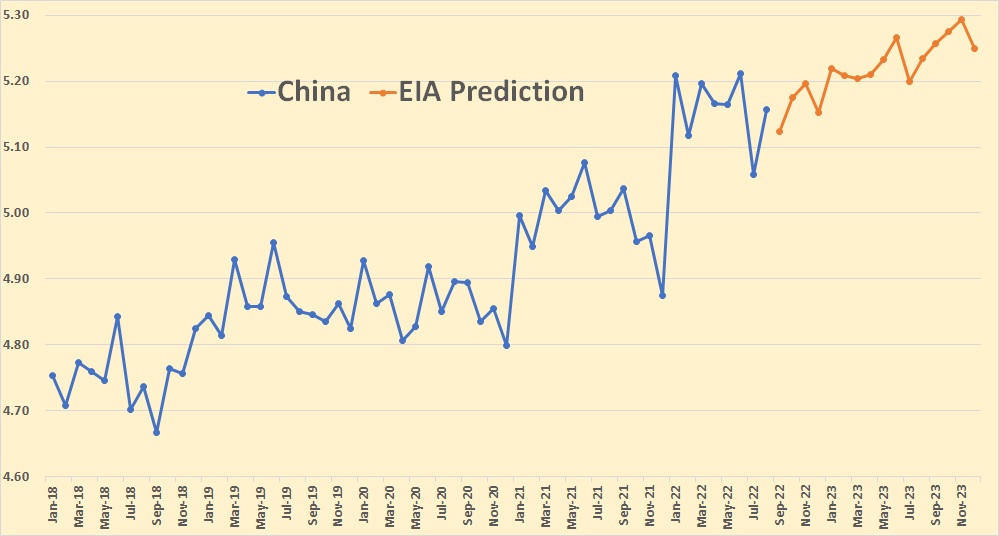
The EIA expects China to increase by about 100,000 barrels per day by the end of 2023.
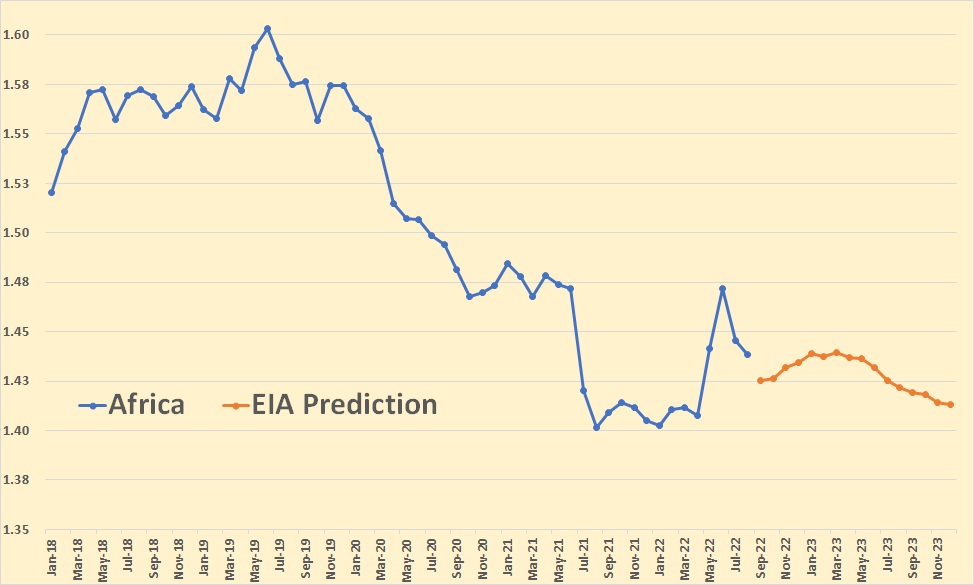
The African non-OPEC nations consist only of Egypt and South Sudan.
162 responses to “The EIA’s Short-Term Energy Outlook”
The U.S. Shale Boom Is Officially Over
The days of explosive growth in U.S. shale oil production are over. American oil production is rising, but at a much slower pace than it did before the 2020 crash, and at lower rates than expected a few months ago.
The new priorities of the shale patch – capital discipline and a focus on returns to shareholders and debt repayments – have coupled with supply chain constraints and cost inflation to drag down U.S. oil production growth.
SNIP
Despite the expectation of a record output next year, the EIA has downgraded the numbers several times in 2022 so far. The latest cut is a massive 21% reduction in the growth estimate, according to calculations by Reuters.
In the October forecast, the EIA had already downgraded the average production estimate for 2023 to 12.4 million bpd from the September forecast of 12.6 million bpd.
“Lower crude oil production in the forecast reflects lower crude oil prices in 4Q22 than we previously expected,” the administration said in October.
There is a lot more to this article, click on the blue link above to red it.
Very good report on oil & total liquids production & on the decline since 2018. Here is another report on shale oil peaking in the USA. https://oilprice.com/Energy/Energy-General/The-US-Shale-Boom-Is-Officially-Over.html
Thanks for the work Ron
Yep, thanks
Oil at $ 300 per barrel . Not my POV . EIA forecast from 2015 . What do these guys smoke ?
Holy cow, that came from the EIA? I hadn’t seen it before. Resource cost curves aren’t really forecasts though, just standard P/Q curves really.
Ron
In the table you posted above, it shows world daily NGPLs of 13,000 kb/d. Of that total, the US is providing almost 50%, see attached chart. US NGPLs are increasing at a rate of 27.4 kb/d/mth and possibly at an even higher rate over the last year. There has been much discussion recently of the increasing GOR in the Permian. This would also result in increasing NGPLs.
In January 2019, NGPLs were 40% of C + C. In November 2022, their production has reached 50% of C + C.
Ovi,
Permian Basin GOR based on DPR data (because recent EIA tight oil official estimate seems off.)
Dennis
The chart shows that the increase in the GOR in Jan 2020 coincides with the rapid rise in the percentage increase in NGPLs relative to C + C.
Ovi,
I agree, this might be due to lower levels of flaring natural gas or an increase in natural gas output relative to crude oil output. Chart below has annual natural gas vented or flared in millions of cubic feet (MMcf). EIA data (only annual data is available).
Ovi,
Around that same time (early 2020) US GOR jumped from about 9 Mcf/bo to 10 Mcf/bo. It may just be due to rising natural gas prices and better natural gas pipeline availability to ship gas from the Permian to the Gulf coast to be exported as LNG.
This first chart above is designed, I expect, to be decieving, with malice of intent. What happens to GOR before 2014 in the Permian is relevant to conventional gas depletion reservoirs in the PB, mostly on the Central Platform. HZ stuff did not kicked off until 2014.
In fact, the manner in which is GOR is re-defined, here, as a means of refuting that rising GOR IS a problem in the Permian HZ play, is meaningless. GOR is a metric used to gauge the health and life span of an oil well, it is NOT total gas production in Texas over total oil production in Texas. Yeow, that’s really dumb.
The Texas portion of the Haynesville and the liquids rich leg of the Eagle Ford is very rich in NGL’s. Some of us believe, for instance, that in the Midland Basin, where GOR is going thru the roof, gas liquids are drying up and BTU content is going down. That would make perfect sense to someone wishing to actually understand liquids phase transitions in gas depletion tight oil containers. As we get older we shrivel up.
At first the topic was Permian, then it shifted to Texas overall, and it shifted entirely away from the meaning of GOR. Ovi is correct, rising GOR IS causing a decline in liquids production from the Permian. Be mindful of the re-directs; there is a reason for that.
Novi and other data-sell companies like to dismiss rising GOR in the Permian by looking at the entire Permian Basin on a macro level. The entire basin is not getting drilled; high grading core areas is still the focus, in spite of high product prices. Why focus on the Basin when it’s the cores that matter?
Because it looks better.
One way to not allow the One Eyed Jack to reign as King is to not be blind to what is actually occuring. All real oilmen, save George Kaplan, have been been sent away here on AOB, mostly out of frustration. LTO Survivor, for instance. Imagine someone who’s never seen a HZ oil well arguing with someone who spends his own money in the tight oil space drilling wells and trying to make money in it.
There is actually a good reason for arguing with people like THAT too, if your think about it.
Mike thank you for your. Views as always. Yes rising GOR means gas is coming out of the solution quicker as we reach a bubble point. This is why you won’t see increasing production out of the shale basins for too much longer. Now with oil prices falling and costs rising it is going to make less sense to increase production fast. The oil market is probably tighter than it has been in a long time and it just doesn’t make any sense. I guess the tiled curve is predicting a recession and much lower demand. I don’t think the Saudis will let the market fall apart as they are in control now.
LTO Survivor and Mike Shellman,
When do you expect tight oil output will stop increasing? My expectation is around 2028, I expect about 6.5% annual growth in tight oil output from Jan 2023 to Dec 2027. Scenario below with URR of 71 Gb from 2000 to 2050. Expected tight oil output for December 2028 shown on chart which shows a US tight oil scenario in kb/d.
Dennis – Curious since growth has been <2% past 12 months, when/why would it triple current levels? Should show past 8 years to get a better picture…I think you are using covid rebound rates to extrapolate future production, which is definitely not a good way to do it….
Kengeo,
The scenario is based on a physical model of all US tight oil basins with a realistic increase in completion rates. The average annual rate of growth for US tight oil from Jan 2011 to Feb 2020 was about 19% per year so the rate of growth for my scenario is roughly 3 times less than the past. The linear rate of annual growth was about 729 kb/d from 2011 to 2020. My scenario has annual output growing by about 500 kb/d on average from Jan 2023 to Jan 2028.
Using DPR data I get about a 9% rate of increase for US tight oil output from Nov 2021 to October 2022.
Dennis,
So much depends on product price and costs. Since PE and Commercial bank lending have vanished for the time being ( on a meaningful scale) companies will have to rely on free cash flow for growth. This gets very difficult at today’s oil price for the smaller producers. To answer your question, I really don’t know because I can’t predict product prices very well. This is not a political statement but the current administration is at war with oil and fossil fuel use. As a result, draining of the SPR will continue and be used as a tool to attempt to keep prices down.
LTO survivor,
My scenario assumes real well costs in 2022$ remain constant and that Brent oil price remains at $90 or higher from 2023 to 2028 on average. You once suggested growth of 5% was reasonable, for my assumed oil prices and costs does that seem reasonable?
I assume all future wells are financed from cash flow in this scenario.
Mike,
The DPR data starts in Jan 2007, so that’s where the chart starts, quite malicious indeed. I use statewide data from the EIA, because that is the data I have available.
Chart below used RRC data from PDQ for all wells (oil and gas) in Midland county GOR is in Mcf/b.
Reeves county (Delaware Basin of Permian) GOR. Perhaps Permian Basin GOR has increased because more wells are being drilled in the Delaware basin which tends to have higher GOR than the Midland basin. Again data is from the Texas RRC PDQ.
http://webapps.rrc.texas.gov/PDQ/home.do
For anyone interested, I found New Mexico State oil production data at link below
https://wwwapps.emnrd.nm.gov/ocd/ocdpermitting/Reporting/Production/ExpandedProductionInjectionSummaryReport.aspx
The chart below focuses on southeast New Mexico wells (these are in the Permian basin) and in 2021 these wells produced about 98% of New Mexico’s oil output (the proportion has increased from 93% in 1996 to 98% in 2021). I was surprised the GOR was so low as I expected Delaware basin wells to have a higher GOR than those in Texas. This may be due to the rapid ramp up in output lately in New Mexico.
Also big jump in US NGL % of US C plus C plus NGL after March 2020, from about 29% to 33%, I use Monthly rather than weekly data as I believe it to be more accurate.
For Texas the % of NGL to C plus C plus NGL from Jan 2007 to Aug 2022 (monthly data) is below, data from EIA.
Texas GOR using EIA gross natural gas output per barrel of C plus C produced.
I realized that a fair amount of natural gas gets reinjected to keep pressure up, so marketed natural gas may be a better metric for GOR. Chart below uses market natural gas for Texas rather than gross natural gas.
Dennis
That is a typo on the chart. It is monthly data. Corrected typo.
Ovi,
Thanks. Longer term (Jan 2011 to August 2022) the monthly rate of increase (using OLS regression) is similar to your estimate (for shorter period) at 28.45 kb/month.
Dennis
The STEO is forcasting that the rate of increase of NGPLs will slow going into 2023. Blue is November 2022 to December 2023
Ovi,
Perhaps they expect natural gas growth to slow as the export capacity for LNG may be limited over the near term, or perhaps they expect levels of flaring to increase due to limited natural gas pipeline capacity out of the Permian and Marcellus or maybe a combination of these factors (and others that I no doubt am missing).
Dennis
How about a slowing in the rate of oil production. There hints of that in the latest DPR.
NGLs are a by product of natural gas production, so it is natural gas that affects the level of NGL.
Ovi,
Chart below has DPR for tight oil and shale gas (right axis) for all 7 basins.
The OLS trend lines don’t really show a slow down in tight oil output as far as I see.
Dennis
Yes. My bad on NGPLs
I was looking at these two charts. This first is from Shale Profile that shows the 2022 wells are not as productive as the 2021 wells. Peak second month for 2021 is 911 b/d vs 851 b/d for 2022. The second chart is the DPR Permian and was just looking at the last six months that appear to be starting tp roll over. Not conclusive but hinting at slowing.
Ovi,
I do see that very subtle bent in the trend in the DPR estimate, but would not read too much into it. Chart below looks at tight oil estimate by DPR from March 2021, the trend from Jan 2022 looks a bit steeper than the 2021 trend (from March because of winter storm in early 2021). It is not as steep as the annual 2018 to 2019 trend, in 2022 the annual rate of increase is 1204 kb/d, and in 2018 to 2019 it was 1366 kb/d.
On Permian wells for 2022 it is a bit early to judge with data from only Jan and Feb wells so far, if you look back at wells by month for 2021 and 2022 you will find that the Jan and Feb 2021 wells were also not very good, this may be due to weather difficulties in winter (particularly in 2021 when there was a severe storm).
Ovi,
The STEO is projecting slow growth for both Oil and natural gas in the US for the next 15 months.
Thank you Ron for this work.
Any chance to see this data as a graph over a couple of years? Could help to understand the tendencies and developments …
Yes. I will work on it. There are several ways to chart this. I will have something very detailed with several charts in my next STEO report. I will have charts on everything since January 2000. Those charts will explain a lot.
Does this mean that it is now officially recognised, at least in one government department, that we have passed peak. If so when did it happen. The EIA seems to have a split personalty: the long term energy outlooks are wildly optimistic, with even low cases far above reality, and the near term outlook are getting more realistic, in fact some of these look a bit pessimistic (e.g. the GoM has Vito and Mad Dog 2 starting up soon but their effects can’t be seen in the graph, I’m pretty sure the general decline in old fields won’t exactly match the ramp ups).
Also why have all comments become italic, is that something in my set up – used to be only for block quotes or italics marks in HTML?
no italics on mine
George,
The italics problem has been fixed. The longer term outlooks for the US (AEO) are done annually and short term outlooks are done monthly. The international outlooks are updated every two years at the EIA. I agree the long term outlooks, especially 2030 to 2050 are not very realistic.
Anyone have a good breakdown on the end use for NGL’s, by percentage?
Hickory,
You might find info at page linked below
https://www.eia.gov/totalenergy/data/annual/index.php
In 2021 about 4.83 Mb/d of NGL was for direct use with most of the rest used as refinery and blender inputs.
I couldn’t find where it is used, you would have to dig into that page more than I was willing to spend time on.
Is the figure for China correct
BP has China producing 3.99 million per day in 2021
https://www.bp.com/content/dam/bp/business-sites/en/global/corporate/pdfs/energy-economics/statistical-review/bp-stats-review-2022-full-report.pdf
Charles
The BP production number is C + C. The STEO data is All Liquids.
OVI
BP pg 15
Includes crude oil, shale oil, oil sands, condensates (lease condensate or gas condensates that require further refining) and NGLs (natural gas liquids – ethane, LPG and naphtha separated from the
production of natural gas
Charles,
From BP spreadsheet:
* Includes crude oil, shale oil, oil sands, condensates (lease condensate or gas condensates that require further refining) and NGLs (natural gas liquids – ethane, LPG and naphtha separated from the production of natural gas).
Excludes liquid fuels from other sources such as biofuels and synthetic derivatives of coal and natural gas. This also excludes liquid fuel adjustment factors such as refinery processing gain. Excludes oil shales/kerogen extracted in solid form.
The EIA estimate is total liquids which includes refinery processing gains, biofuels, and synthetic liquids from CTL and GTL, that may be the difference. EIA has C plus C plus NGL for China in 2021 at 3993 kb/d, other liquids are 720 kb/d and refinery processing gain is 281 kb/d, total liquids average in 2021 is 4993 kb/d.
The BP estimate for C plus C plus NGL in 2021 at 3994 kb/d is almost identical to the EIA estimate at 3993 kb/d.
EIA “other liquids” is defined below:
Other Liquids includes biodiesel, ethanol, liquids produced from coal, gas, and oil shale, Orimulsion, blending components, and other hydrocarbons.
China has over 100 kbpd CTL, about 500 methanol to liquids and over 200 in refinery gain, for a total almost 1000.
Charles
I compared China’s October reported C + C, which is very close to what the EIA reports, with the STEO report. China reported October C + C production to be 4,059 kb/d. The STEO October production for All liquids is 5,180 kb/d.
Maybe I should have said the BP number is closer to C + C while the STEO is all liquids. Since January 2021, China’s C + C has been bouncing around 4,000 kb/d. See chart.
Ovi
Thanks for that. C and C should be shown separate, NGPL shown by itself and biofuels again separate. That would provide a clearer view of what is happening.
As I remember china peaked in 2015
They are shown separately on the EIA’s International World Overview but not on the EIA’s Short-Term Energy Outlook.
This shows share buy backs by the big four IOCs, which have been tailing off since the 2015 crash but are due for a big rise this year and next with ExxonMobil committing $30 billion over the two years, Shell $15 billion this quarter, and BP and Chevron $10 billion this year.
How that will effect capital expenditure, which has been steadily, and relatively rapidly, declining remains to be seen. The only real increases that have been announced, so far, have been quite limited and only affecting the Permian.
Biden eases Venezuela sanctions as opposition talks resume
WASHINGTON — The Biden administration on Saturday eased some oil sanctions on Venezuela in an effort to support newly restarted negotiations between President Nicolás Maduro’s government and its opposition.
The Treasury Department is allowing Chevron to resume “limited” energy production in Venezuela after years of sanctions that have dramatically curtailed oil and gas profits that have flowed to Maduro’s government. Earlier this year the Treasury Department again allowed the California-based Chevron and other U.S. companies to perform basic upkeep of wells it operates jointly with state-run oil giant PDVSA.
Under the new policy, profits from the sale of energy would be directed to paying down debt owed to Chevron, rather than providing profits to PDVSA.
Talks between the Maduro government and the “Unitary Platform” resumed in Mexico City on Saturday after more than a yearlong pause. It remained to be seen whether they would take a different course from previous rounds of negotiations that have not brought relief to the political stalemate in the country.
A senior U.S. administration official, briefing reporters about the U.S. action under the condition of anonymity, said that easing the sanctions was not connected to the administration’s efforts to boost global energy production in the wake of Russia’s invasion of Ukraine and that the decision was not expected to impact global energy prices.
The official said the U.S. would closely monitor Maduro’s commitment to the talks and reserved the right to reimpose stricter sanctions or to continue to ease them depending on how the negotiations proceed.
“If Maduro again tries to use these negotiations to buy time to further consolidate his criminal dictatorship, the United States and our international partners must snap back the full force of our sanctions that brought his regime to the negotiating table in the first place,” said Democratic Sen. Bob Menendez of New Jersey, chairman of the Senate Foreign Relations Committee, in a statement.
WTI continues lower. There is some technical support on the chart around $65-$64. Probably see some sort of bounce in price at that price level.
But if that eventually gives way as global recession takes over. Lookout below!
The civil unrest going on in China right now is definitely a big negative for oil price.
Floor around $70 as the SPR will start getting refilled at this level adding large amount of demand. Does anyone know the potential refill rate?
Having seen oil go negative, I am fully aware the market is broken.
We traveled this weekend to visit family. The gasoline market must be broken also, as we never left the state, yet I saw unleaded regular range from $3.29 to $5.09, all within a 100 mile radius! A little of that could be a local tax difference, but not much.
Our chemical company is raising prices again, third increase since last fall. Prior to that we hadn’t had an increase in almost ten years.
It would only make sense for oil to go negative again.
I wonder what happens when our government orders us to P&A our wells someday and there isn’t a rig to plug them?
I guess I’d like to know, are we still gouging?
Talk about being broken. The PJM power system which sits atop of one of the worlds largest gas fields and an abundance of high quality coal, as of 2:00 pm today, they were consuming fuel oil at a rate of 40,000 gallons per hour to make electricity.
As of 3pm their generation mix is
38% nat gas
36% nuclear
19% coal
and last on the list below wind solar, misc
is fuel oil at less than 1% of total.
They must have an oil burning facility they have not retired.
You can keep track at https://www.pjm.com/
I do keep track almost everyday and have been for 20 years. I also follow most of the U.S. and most of Europe. On a few days last winter ISO New England was burning 200,000 gallons of fuel oil and hour for a 8 straight hours. And again just a couple of hundred miles from one of the worlds largest gas fields.
Hickory, I’m wondering if you missed my point. We have read many articles recently about the risk of a cold winter and the low inventory of distillates. PJM is one of the worlds leading electrical system operators in the world sitting in the middle of enormous coal and gas reserves, yet they are compelled to burn tremendous amounts of oil in what is fairly mild weather. Something is very wrong. Added note, 5 hours later and the burn rate went up to 50,000 gallons an hour. The percent of power produced by oil is irrelevant to me, the fact that any oil is burned at all is insane.
They have refineries. I suppose you think they should sell all the fuel oil distillate to someone else to burn, rather than use any of it in their dual fuel generating units.
I suspect they have solid rationale for their decisions based on real world operating conditions.
BP is considering ending the publication of its Statistical Review of World Energy, over 70 years after it first published the benchmark report, as it focuses on its shift to renewables, it tells Reuters.
That would be as reliable a contra-predictor as a cover of Time Magazine or The Economist. Happy days coming.
Mike
In the last OPEC update, you voiced some concerns with regard to the US exporting all of its tight oil. I started to write this comment but then the new post went up and I took it down.
As an outsider, Canadian, I tend to agree with the concept of keeping a country’s critical resources primarily for themselves but with some leeway for helping others.
However I see the Canadian and US situations in a different light.
On the crude side, I look at US crude exports as a swap of a lower grade crude for a better grade for making fuel. In the attached table, the US is a net importer of crude. So swapping OK oil for better oil makes sense to me. In Canada, we just keep selling our oil and it makes tons of money for the government and keeps the economy rolling.
A partial answer to the question of open ended exporting of US crude would be to limit the export of the lighter stuff and import more of the preferred crude. While this could result is a higher price for WTI/Brent, it would also raise the value of what’s left in the ground in the US and help US producers increase their profits. I wonder if there is some optimal import/export quantity that would maximize the value of US crude for US producers.
On the NG side, it is another story. The US is exporting LNG to the world market for short term gain. At some point in the future, I can see US citizens looking back and asking why did we export so much of this valuable fuel? It would be most useful to have a lot left in the ground for future US use.
Just a slightly different perspective on what the US is doing with its energy resources.
Ovi, I assume you mean this Mike.
I might argue there is very little “quality swapping” in the US refinery business; again, producers and refiners act independently of each other and I do not believe the end users buy LTO to swap with, for instance Ecuador, or what little Maya there is left to import. The world is getting gassier, big time, and as that goes so goes middle gravity oils with middle distillate benefits. To me that is the BIG elephant nobody talks about. I believe the refinery swapping BS is a tight oil propaganda thing used to justify exports. The API is really good with how LTO exports benefit American refineries; they lie particularly well.
A big piece of my heart lies in Canada and it IS different between us, and you. You ARE an ally and have proven as such many times. S. Korea is not, nor is China. If I were King I would be draining Canada of its heavies and making the most of American tight oil…to keep it all in North America, including Mexico. I would include my beloved Venezuela in that mix. I would make the west independent of the east. I would export as much LTO as you fellas can stand. We CAN seperate the west from the east and its time we do that. From here on out its every side of the world for itself.
But exporting US tight oil at the rate of over a G BO every year is hurting my country, and yours. Its stupid. Beyond belief. And there WILL, as you say, come a day when we will realize we made a grave, grave mistake. We are decades away from an economic transition to renewable trans fuels, we are half a decade away from being in deep shit in America with regards to liquids.
I appreciate your work, Ovi. Don’t think badly of me for speaking up against lies, half truths, cherry picking, changing definitions, changing the subject, re-directing, and narcissistic dog dookey in general. I hate lying. My industry, sadly, has gotten really good at it. I really DO care about the oily future of North America and all of our kids. We’re going to need every ounce we’ve got left.
Mike,
South Korea is not an ally? That is a strange point of view. How about Japan, Singapore, Taiwan, and India?
Are European nations ok? What about African nations? Is it ok to import from the “east”, but not export there?
Just trying to make sense of your point of view.
Mike
I agree, Canada and the US should be hugging each other because of our shared values but it seems the MAGA crowd knows better.
Please bear with me on this oil swapping because I only know oily stuff from newspapers and oily people on this site. You say “producers and refiners act independently of each other”. OK. I will buy that. So why do the LTO producers sell offshore and take a big price hit in sending it to Europe. I assume, possibly incorrectly, that US refiners don’t want it and would only take it at a much bigger discount. See article below.
Houston, 28 November (Argus) — December exports of US crude WTI look likely to fall because of record high freight rates and weather-related disruptions to export operations.
The cost of shipping light sweet WTI on an Aframax tanker to Europe climbed to the highest ever at $10.18/bl on 18 November, on record-high US crude flows to European refiners as they prepare for the 5 December implementation of the EU’s ban on seaborne imports from Russia (see graph). Aframax loadings have also been relatively unhindered by disruptions affecting very large crude carrier (VLCC) exports, helping to boost the freight rate.
Many US traders have been seeking to load crude for export on VLCCs instead of Aframaxes, which are traditionally used to ship oil to Europe, to save on freight costs. But loading operations for the larger tankers have been disrupted this month by bad weather. Crude usually has to be loaded on VLCCs along the Texas coast through reverse lightering, where the oil is first put on an Aframax or Suezmax and than moved to larger tankers by ship-to ship (STS) transfer.Butreverse lightering operations were halted on 15-22 November by high waves caused by a cold front along the Gulf coast. The disruption, combined with strong demand to ship crude on VLCCs, may lead to a backlog of tankers waiting to load at the US Gulf coast as far out as mid-December.
https://www.argusmedia.com/pages/NewsBody.aspx?frame=yes&id=2395168&menu=yes
Ovi,
Chart below shows how the GOR has changed for wells in the 10 core counties of the Permian (combined output from all 10 counties where about 90% of output occurs in Permian basin.) I take annual output of natural gas and oil for wells by year of first flow for 2014 to 2018 wells. Note that the first 3 years of 2014 and 2016 wells match so well that 2016 well is hidden behind 2014 well data for those first 3 years.
Data from Novi labs at
https://novilabs.com/blog/permian-update-through-march-2022/
Dennis
Maybe some of the oil experts can explain why the GOR is rising faster for the more recent wells. I wonder if is associated with the overall pressure drop in the Permian
Ovi,
That seems the likely explanation or potentially changes in how wells are fracked over time and possibly closer well spacing which might lead to a greater level of pressure depletion. Also there are three main formations the Wolfcamp, Spraberry, and Bonespring and these have various sub-formations (Wolfcamp A, B, C, etc), it is possible the different formations have different characteristics for levels of oil and natural gas output and the proportions of wells drilled in the various formations may change over time.
Ovi, I’m not sure I qualify but that whole area called the Delaware basin is karst: limestone and dolomite (both sedimentary rocks of a carbonate lattice). With a certain soil content of H2S, rainwater (or frack water) forms sulfuric acid. That’s precisely how Carlsbad Caverns was formed (rainwater seepage into a high H2S concentration, dissolving limestone, leaving a cavern).
This was put to a test, unwittingly, when brine wells were manufactured in Eddy County. Fresh water was pumped into a salt pit, the brine was withdrawn for fracking, until one fine day a massive sinkhole appeared. And then another. This karst phenomenon underlies the little city of Carlsbad, most of the Delaware, and quite a bit of the Permian.
The carbonate rocks are highly permeable sedimentary rocks. So will side-by-side horizontal well bores crosstalk? Yes. Will vertical well bores crosstalk? Yes again. With enough horizontal drilling and removal of hydrocarbons from a rocky environment under pressure, the pressure head ultimately drops for the particular well bore and eventually, through crosstalk, the pressure drops in neighboring well bores too.
When the pressure head drops below the bubble point of the methane, gas escapes its liquid capture and then, due to a gradient, its rocky prison. As the oil cut drops, the gas level rises–by now this is a going Jesse, because it feeds on itself, like Ouroboros eating his own tail.
Summary: The reservoir pressure is falling because underneath is a karst system containing both oil and gas. The physics of oil/gas/water interaction, influenced heavily by the pressure head, will always prevail. They’re drilling too close together, and are being forced by commercial interests to inject too much water. And they’re likely not being mindful that they’re very close to the Carlsbad Caverns–which is (was) of much the same substrate.
Disclaimer: I am an active investor in oil and gas of all varieties, and am intensely interested in getting the most bang for my buck. I read geology for dummies, and then I dumb it down. I am livid about venting and flaring of methane gas. I don’t own a Tesla. I am old, so anything you read that is written by me may be tarnished by the anger of a curmudgeon.
Gerry, H2S in oil & gas reservoirs is typically produced by sulphate-reducing bacteria, not H2S in soil.
Gerry,
Isn’t most of the Permian basin considered a tight oil play?
My understanding is that the permeability of most oil bearing rock in the basin has very low permeability. That’s the reason for fracking the wells. If they are spaced too closely they communicate.
Found some info on permeability, the Permian Wolfcamp average is about 10 millidarcies, pretty low permeability.
Ovi,
See comment down thread where I have corrected the Permian GOR charts to a more standard metric.
https://peakoilbarrel.com/the-eias-short-term-energy-outlook-2/#comment-749509
It also occurred to me that increasing lateral length may tend to increase GOR and average lateral length in the Permian basin was increasing from 2015 to 2018 (and continues through 2022).
For New Mexico Permian basin GOR for 2015 and 2018 wells, I find the following. So this may be more of a problem in Texas than in New Mexico.
Note the huge adjustment. Nothing has changed since Art Berman and me wrote this article:
8/10/2016
U.S. Storage Filling Up with Unaccounted-For Oil
http://crudeoilpeak.info/u-s-storage-filling-up-with-unaccounted-for-oil
Given the stated aim of US to destroy Russia’s government (and kill as many Russians as possible in what is a US proxy war), it is unreasonable to expect Russia to be in any way helpful to Europe or to USA.
Kazakhstani oil will not necessarily hit the European market. We have been here before:
https://www.lauriemeadows.info/conflict_security/The-West's-Apartheid-Trading-System.html#Kazakhstan
And recalling that the world needs a steady supply of heavier crudes to blend with the increasing amounts of condensate (especially true of USA), Russia’s Urals (for example) may be more important on the world market than many realise. And this grade will be shut off (it is piped to Europe) if the US introduces it’s oil price cap.
Light condensates like ethane, propane etc are harder to store and handle than normal crude, and the cost of railing the heavy oil from Canada down to the appropriately configured refinery (no pipeline available yet) must be factored. As USA is a nett crude oil importer now, then this setup can simply be absorbed as part of US energy security.
The fly in the ointment (well, one of several), is that natural gas must be produced in order to produce condensate.
What to do with it? Sell it to Europe as LNG. Too expensive. Blow up the Russian gas pipeline.
It seems a perilous way forward.
Russian retaliation hasn’t even begun. When it does, it will be economic retaliation, and along the dividing line between the west, led on by the (relatively oil sufficient) USA, and those unwilling to cooperate with the US trade and currency restrictions.
LOZ
What will be the Russian retaliation for people defending their country that Russian soldiers have invaded.
is this what you have in mind
https://apnews.com/article/russia-ukraine-kyiv-health-government-and-politics-c7b3f81befcce9fba5fddefd8250f29c
Obviously not.
The Russians were due to publish their foreign policy in March this year, I think.
It covers their diplomatic/trade relationship with the various countries of the world.
But as the Europeans convinced the UKR to trash the UN Security Council agreed Minsk agreement (7 years of diplomatic effort for peaceful resolution by Russia right there) in favor of a ‘military solution’ to the breakaway Donbass region, Russia, if it was to keep nuclear tipped US missiles off it’s immediate border, was forced to preempively prevent such a security catastrophe.
There will be no military retaliation against those who incited the conflict and vigorously fanned the flames. No, it will be an energy-based and mineral based retaliation, and it has only just begun.
My guess is that it will be a new foreign policy concept that allows for ‘friendly countries’ (that that don’t ‘sanction’ Russia) to receive oil, gas, wheat, minerals such as fertiliser, titanium etc at an indexed price. Unfriendly countries, I suspect, will pay a significantly higher price, more akin to a ‘spot plus’ price.
In the same way, electricity exports will likely (in my view) be at two different tariffs.
I doubt this ‘retaliation’ will be permanent – maybe a better word would be ‘re-balancing’, in the sense of what you did to us we do to you. In time, once the cost to Russia of a war they never wanted has been repaid via tariff, then things will normalise to an extent.
But Russia will have turned East by then. In the adjustment period, I expect all sorts of volatility. The energy system can be predicted, up to a point, as everyone’s work here shows. The action of inadequate and short termist politicians introduces many unwelcome chokepoints and unexpected feedback loops.
This is how Russia kept the Minsk agreement.
https://www.bbc.com/news/world-europe-28357880
Loss of Russian gas is a problem now because we stupidly did not build the home grown energy we should have.
With more wind and solar each year our dependance on foreign oil and gas will decline.
https://www.pv-magazine.com/2021/07/29/uk-power-generation-in-2020-renewables-up-to-43/
and new nuclear will also help
https://www.edfenergy.com/energy/nuclear-new-build-projects
Also there is massive investment in LNG production and delivery infrastructure being built, some very rapidly.
Electric cars will help reduce oil imports but probably not quickly enough to prevent oil prices going up to $150/$200. But that will hit poorer countries the most, such as India and Pakistan
So pretty soon Europe we will not need Russian oil or gas
“In time, once the cost to Russia of a war they never wanted has been repaid via tariff, then things will normalise to an extent. ”
A grand delusion. Withdraw back to your borders before 2014,
and then perhaps a 30 year period of Russia struggling to regain some international trust and credibilty can begin.
Yep, excellent analysis LOZ
Buried in the long link is the key item of importance to the future of Russia- will China value their relationship more than it values the its relationship to the vast majority of its trading partners/economic prospects?
Russia makes up less than 2% of Chinas international trade.
btw- who is this author Laurie Meadows? No google links to this ‘person’. Authorship courtesy of the election disruptors?
I’m 70, I think I have sorted out who I am – well, so far. After all, life is not a quiet river, as the Turks say.
https://twitter.com/Laurie_Meadows
Been around since the oil drum days..it’s been fascinating…still is. All power to Ron for keeping the venue going, by the way.
‘Loz’ is used because in America ‘Laurie’ is a female name. It (used to be) an exclusively male name here in NZ.
The latest from Brendt .
https://undenial.files.wordpress.com/2022/11/berndt-warm-calculations-on-the-lifespan-of-vehicle-production-and-petroleum-production-11-sep-2022.pdf
This is what you get when you mix science with some wild assumptions. There are some interesting correlations and I appreciate the tie in to exergy, but to linearly fit the trend to a 0 car production by 2027 is curious. Does the author actually believe that or is the depiction of the trend to 0 only a way to highlight the concern?
Hole in head,
If vehicle production decreases as Berndt believes, then it is possible that demand for oil would also decrease. Oil produced is not affected by net energy only by profitability, so if oil prices are high as he expects, that would imply higher profits for oil companies and relatively high supply of oil. Conversely low output of cars implies low demand and lower prices, so his conclusion that oil prices will be high is not consistent with how the economy works.
A net energy analysis needs to look at all energy sources in society, not just a single product like oil because energy surpluses in one sector can be transferred to other sectors through the buying and selling of energy products. The price of a product is not connected to its energy return on energy invested (which is typically not analyzed and remains unknown for individual products).
It is not my fault that nearly nobody knows the second law.
From Vaclav Smil, “Energy – a beginners guide” :
“A good many times I have been present at gatherings of people who, by the standards of the traditional culture, are thought highly educated and who have with considerable gusto been expressing their incredulity at the illiteracy of scientists. Once or twice I have been provoked and have asked the company how many of them could describe the Second Law of Thermodynamics. The response was cold: it was also negative. Yet I was asking something which is about the scientific equivalent of: “Have you read a work of Shakespeare’s?”
Three and a half years ago, i have posted the first time a graph for car production on a blog and written, that car sales will go down, caused by energy problems. And indeed, the sales go down.
So you can imagine, it is difficult to convince me that i am in error.
Berndt,
Everyone who has studied physics understands the second law of thermodynamics, professors of mechanical engineering who specialize in classical thermodynamics are particularly familiar with the concept as they teach this to mechanical engineering students who often specialize in the area of steam turbines and power systems where this is particularly relevant.
As far as light vehicle sales decreasing, there are plenty of reasons this could have occurred over the past 3 years, can you think of any?
Dennis
You claim that there will be 7 times fewer cars on the roads. In England on bank holidays and other times almost everyone with a car drives off somewhere usually quite far.
If there are only 15% of the cars on the road, many people will not be able to hire a car to travel to the Lake district of the coast. People are simply not willing to lose that mobility.
Charles,
Many families own more than one car. Obviously everyone doesn’t travel unless they are all going to visit people who are not at home. There could be 7 times fewer cars on the road, if all miles were travelled with TaaS, that probably won’t happen, but clearly fewer cars are needed than the current car stock. Also much of the time a car is hired , the car simply sits parked, one could hire a car by the hour to make a trip, drop it off and take an uber to final destination. The very wealthy will continue to have their own personal vehicles, the rest will adapt to new circumstances.
Berndt, much more likely the decrease in auto sales is because of the Osborne effect. When a vastly superior product (EVs) first enters the market but isn’t available in sufficient quantities there is a few years where sales lag. Essentially we are at a spot where a device (ICE) that produces its desired product (mobility) almost by accident (mostly heat) is being replaced by a device that is actually suited to its task. It’s similar to incandescent light bulbs. The amount of energy that will go to mobility after the transition will be vastly less, probably 80% reduction.
https://en.m.wikipedia.org/wiki/Osborne_effect
Stephen,
You say… “EVs are a vastly superior product.” Really??
How do we manufacture these vastly superior EVs? Have we employed Star Trek Replicators to make the parts? Or do we have a crew of Energy Tooth Fairies making these vastly superior EVs?
NADDA… the simple truth is that Green Energy & EVs are nothing more than Fossil Fuel Derivatives. So, the supposed VASTLY SUPERIOR EVs comes from burning Higher EROI Fossil Fuels.
Trying making EVs without Coal, Natgas & Oil, and tell me how far we get.
Nothing really superior about that. But, who uses wisdom and logic anymore?
steve
Steve,
With Transportation as a Service (TaaS), 7 times fewer EVs would be needed than a system will individual families each owning their own vehicle and the vehicles can travel more miles with less maintenance than ICEVs (about 500k to one million miles per vehicle for EVs) and use about 4 times less energy per mile travelled. Each EV used by a TaaS firm would travel about 100k per years vs 14k for an average US light passenger vehicle. Yes today much of the energy is provided by fossil fuel, of which there is plenty and can mostly be replaced with wind, solar, batteries, and nuclear power over the next couple of decades as the costs (particularly for solar and wind) are far lower.
Steve, how EVs are made, whether by fossil fuels or renewables, is a red herring. We are talking about the efficiency of the end product regardless of input.
So look at the EPA mpg ratings of the average sedan and compare that to the mpg-e (equivalent) for the best selling EV sedan. Those numbers are 31.7 and 132. For city driving the average fuel economy is 23 v 138, which conveniently is exactly 6. So anyone who does lots of city driving will have a 600% increase in efficiency by switching to an EV regardless of energy source.
Who will be the most interested in switching to a vehicle that is six times as efficient? Those who drive the most. Therefore even a small amount of EV saturation will have a dramatic reduction on energy use.
https://arstechnica.com/cars/2022/11/dominos-is-buying-a-fleet-of-chevrolet-bolt-evs-to-deliver-pizzas/amp/
@Dennis and Stephen,
the peak of car sales has been in 2017. 2018 has been the first year with decreasing sales. That is, we have now 5 years with decrease.
One explanation from a friend was “The market is saturated”. First i searched for arguments to answer him, then he added: “But.. constant sales are a sign for a saturated markets”. Another guy said: “Cars are today more durable”. This did not sound reasonable, because such a technology leap is improbable.
Sorry, but i think, its your task to present an explanation for the decrease. My explanation is, that the temperature change of the earth crust requires more and more exergy, so that car buyers can’t afford new cars.
Stephen, i didn’t know, that the effect i experienced in business with some products has the name “Osborne effect”. Nice explanation.
In Germany, the subsidies for EVs are up to 9000 Euro each in 2022. This seems a little high for a technical superior product, isn’t it ? And people are waiting since 5 years to get an EV ?
Berndt,
The fact is car sales are decreasing, age of cars in fleet has increased, population is aging which results in lower car sales and many young people see little need for a car so sales would tend to decrease. Many may be waiting for more choice in the EV space which will be coming very soon. Though we might be past peak vehicle sales especially if Transportation as a Service (TaaS) becomes more widespread, a policy switch to favor zero emissions miles travelled might increase the uptake of EVs in the TaaS space and reduce both the number of vehicles purchased and the number of vehicle miles travelled with oil based fuel.
Berndt,
I think you are right to disregard the “saturated markets” and “more durable cars” as the reasoning for declining auto sales.
Exergy and 2nd law of thermodynamics arguments are sound, but I believe too high level to rely on for a trend line. My favorite metrics to keep track of are EROEI, which has been in general decline since the very first well was drilled. New discoveries have a rather low EROEI and are contributing to civilization degrowth and contraction, which can be seen in auto sale statistics. Sometimes the contraction will be more dramatic due to compounding effects (covid, recession), but to me it looks the 2027 trend-line depicted is the brief moment in time you see these compound effects in action.
I think there are plenty of new discoveries and even existing drilling that supports car manufacturing beyond 2027. I’ll go a step further to say that even a negative EROEI on petroleum products is likely to occur which will benefit the few using energy from other sources (fuel switching, slave labor, etc.). Auto sales will continue to decline as our civilization contracts, but not 0 by 2027.
Berndt- “that car sales will go down, caused by energy problems”
No fancy graphs or understanding of physics is needed to make that simple point.
If there is global energy shortage, the sales of all sorts of items will decline.
The sales of more energy efficient equipment will go up.
Rather than vehicles sales, a much more compelling reflection of energy supply and affordability is ‘total miles traveled’. Over the next decades that indicator (miles traveled) will reflect both ICE and E vehicle use. Failure to include EV mileage in any calculation will insure a growing source of error over time.
Regarding the Osborne effect on vehicle sales- yes it is a big deal that will manifest over this 10 year period.
A good write up on the phenomena is here-
https://cleantechnica.com/2019/02/25/the-osborne-effect-on-the-auto-industry/
I have a disagreement with their particular projection of overall car sales shown on the graph below (far too optimistic on global sales), but the idea is well displayed.
@Hickory, the explanation of sales decrease with Osborne effect is nice. It is the first explanation which is able to compete with the thermodynamic explanation, at least for a car enthusiast.
Before commenting it, i will look in detail into it.
@Philip. The year 2027 is extrapolated for the german car industry, not for the world. In my report, 5 methods with different end years are mentioned. This gives a time span, not an exact date.
After reading the article about the Osborne effect, i have a preliminary summary:
1.The predictions for ICE sales and EV sales are not wrong. Car sales numbers vary from country to country and month to month. The prediction fits to the range of variations, at least at the first look.
2.It is not possible, to use the existing car sales numbers to contradict the article.
3.According to Feynman, the Osborne effect theory is to consider as valid, because there is no evidence that it is false.
But…their preconditions are wrong.
a) EVs are not cheaper than ICEs, especially in the C-segment.
b) battery packs do not get cheaper each year, in 2022 their price has increased.
c) subsidies are not considered in the article.
d) China, the country with most EV sales, shows no Osborne effect at all. China has about 2/3 of the world EV sales.
The osborne effect will be visible in the ICEV vs EV in China and elsewhere as the decade progresses. Not yet.
I suspect that despite a growing population of roughly 80 million people a year, that combined light passenger vehicles sales will be declining, rather than that grey line upslope that is depicted on the chart above.
Berndt
There is plenty of energy return on all the carbon fuels we use. That is why it is relatively cheap.
As Matt Simmonds said a litre of petrol is 10 times cheaper than a litre of coffee.
Coal the backbone of industries returns 20 times is energy it takes to get it out of the ground.
Even after burning to produce electricity it is still fantastic running all our electric appliances.
https://www.carbonbrief.org/energy-return-on-investment-which-fuels-win/
The problem is not EROI it is running out. Once oil production starts to decline around 2027 the world will not be able to replace ice cars quick enough. It would require a scrappage rate of 120 million each year to match oil decline.
Also the rate of building wind and solar would need to increase 10 fold to supply all the carbon free electricity needed in Africa, India, China etc.
EROI and cost of ultra deep water oil is still good trouble is there will not be enough of it.
So car production will decline by how much we will have to see.
“Once oil production starts to decline around 2027 the world will not be able to replace ice cars quick enough. It would require a scrappage rate of 120 million each year to match oil decline.”
People or companies don’t scrap an ICE vehicle just because petrol gets more expensive. They will put on less miles, and will delay or cancel plans for purchase a new ICE vehicle if the petrol price gets high enough.
Global miles driven/yr is the more important metric to watch.
I will believe electric is cheaper than ICE when I see Taxi companies switching over in a major way to electric. They moved quickly to hybrid for city driving, but full electric? They track costs to a fraction of a cent per mile.
I will believe that EVs are cheaper than ICEs when they are taxed more than ICEs and not subsidized.
London cabs goes EV:
https://electrek.co/2021/09/21/londons-largest-taxi-firm-to-go-fully-electric-by-2023-with-4000-evs/
Autonomous taxis may finally be taking off in China:
https://www.albawaba.com/business/baidu-posts-65-increase-number-driverless-taxi-services-1499695
Charles, please search for the “Societal EROI”, defined by Charles Hall. Your link points to an article, which is nine years old. Matt Simmons has died long ago. Hard coal production has stopped in Germany in 2018.
The 2nd law, to which i refer, is (nearly) the only law which determines the flow of time. And nine years is a lot of time, especially for the 2nd law. The first point in time, in which the influence of the thermodynamic effects (might) have been visible, was 2014.
Berndt
What you have just written is barely literate.
EROI for oil, coal and gas has hardly changed in 20 years.
China uses 4 billion tonnes of coal per year and the result is they use that power to built 36,000 miles of high speed rail lines in 12 years. More roads in 2 years than the Germany has built ever.
Oil pulled out of the ground is powering over 2 billion cars, lorries, ships, planes, tractors etc. All of it with the excess energy contained in oil.
The energy returns on oil is vast and has not declined in 20 years.
Charles, no.
https://www.researchgate.net/publication/259175194_EROI_of_Different_Fuels_and_the_Implications_for_Society
Look at Figure 4 for EROI change.
Look at Figure 1 and read for the societal EROI.
While the taxi company in London waits for the EV ‘s maybe they should read this . By the way Switzerland plans to have 50% of the car park as EV by 2030 . Best of luck .
https://oilprice.com/Latest-Energy-News/World-News/Switzerland-Considers-Electric-Vehicle-Ban-To-Avoid-Blackouts.html
Ovi,
I realized I did the GOR in the earlier charts in a non-standard way, using annual production for natural gas and oil. The typical method is to use monthly data for natural gas in Mcf and oil in barrels and take the natural gas to oil ratio in Mcf/bo. The charts below make this correction using data at 6, 12, …, 36, 42, … until the final 6 months where all wells are producing. The core counties in the Permian are those with the highest oil output which are Lea and Eddy counties in New Mexico and Howard, Martin, Midland, Reagan, Reeves, Loving, Upton, and Ward counties in Texas. The charts below compare the GOR in core counties with GOR in all Permian basin counties.
It occurs to me that higher GOR in recent wells may be in part due to longer average lateral length which may reduce output per foot of lateral more for oil than for natural gas and might tend to lead to higher GOR.
Click on chart for larger view.
Dennis
Thanks for the update.
I would think that that the concentration of NG dissolved in the oil should be fairly uniform within a given area of the Permian, such as in the core counties. If that assumption is reasonably correct, then lateral length would have minimal impact on the GOR. That brings us back to the more current explanation, that the higher GOR is related to a general pressure drop throughout the field.
Ovi,
I agree there is no doubt that there will be a pressure drop as fluids are removed from these rocks, I take this as a given understood by all (Ideal gas law PV=nRT).
What I am suggesting is that there may be more to this than simple chemistry and physics. Productivity normalized for lateral length drops as laterals become longer and the effect is likely more pronounced for tight oil with molecules at 8 to 16 carbon atoms per molecule than the tiny methane molecule with an atomic mass of only about 16 u.
I have read research that suggests the tight oil output per lateral foot for longer laterals is lower than for shorter laterals. My guess is that this effect is lower for natural gas, because the smaller molecules are less affected by the problems which arise from longer laterals. That is why average lateral length in gas focused plas such as the Haynesville or Marcellus are considerably longer than in the tight oil focused plays roughly 15000 feet vs 10000 feet.
See following article
https://jpt.spe.org/the-trend-in-drilling-horizontal-wells-is-longer-faster-cheaper
Excerpt from link above(but the article has a lot of good info and is worth a read imho):
Rystad forecast—based on the distribution of expected completion activity by county, landing zone, and well design—that the average productivity of new Permian wells seems to track the well length. Between 2019 and 2022, the average well output was up from about 850 to 1,000 BOE/D, and the average lateral length rose from 8,500 to 10,000 ft.
When the Norwegian data and consulting firm compared the results of companies doing 2- and 3-mile-long laterals in comparable rock with similar completions, they found the production per foot for longer laterals sometimes falls short.
From Novilabs Oct 2022 report:
Note that based on this metric, productivity growth has stagnated in several key
areas, including the Delaware and the Midland basin, while it has already clearly
fallen in the Eagle Ford.
The comment above from that report refers to the chart below which presents productivity per 1000 feet of lateral in various subbasins including the Delaware and Midland subbasins of the Permian basin.
See also following post which shows average lateral length increasing in Permian basin from 6000 feet in 2015 to about 8000 feet in 2018, about a 33% increase in average lateral length. Also note the chart showing that average productivity normalized for lateral length was fairly stable for the Permian basin from 2016 to 2020 after having increased by about 80% from 2013 to 2016 (from roughly 10k/1000 feet of lateral to 18k/1000 feet of lateral over first 12 months of production).
https://novilabs.com/blog/us-update-through-november-2021/
Also if wells are spaced too closely the pressure drop becomes more apparent as LTO Survivor has explained in the past. I believe he suggested the optimal spacing that minimizes this problem is 4 wells per mile (spacing of about 1320 feet between laterals for any given horizon targeted). Note that I do not expect this eliminates the problem of dropping pressure, but due to the tight nature of the rock the pressure drop may be localized.
A final note is that the scales of the two charts is identical, notice how the change in GOR over time is note all that different for the entire basin compared to core counties only.
Yep
LTO Survivor,
That is a yes to what Ovi said only, is that right? Or are you agreeing with what I said? If I am wrong I would love to be corrected, thanks!
Ovi, you are correct.
D COYNE: It occurs to me that higher GOR in recent wells may be in part due to longer average lateral length which may reduce output per foot of lateral more for oil than for natural gas and might tend to lead to higher GOR.
Probably more related to the REASON for longer laterals: to try to make a profit on diminishing returns.
This is actually working in some shale basins. Divide County has thin benches and 3-mile laterals b/c the benches are very oil-rich and besides, the percentage of Natural Gas being ethane is much higher. The farther you go out, the more apt long-chain hydrocarbons are to plug up tiny fissures and pores. If you keep up a steady downhole injection of ethane-rich NG to keep the long-chain hydrocarbons moving, based on maintaining the pressure head, the results will be much better.
The “Core Counties” have fringe zones too, and recently a lot more drilling is being done in these zones–not infrequently using 3-mile laterals. Many of them are going to be hard-pressed to make much of a profit–maybe a 2X D&C cost–unless prices go up again.
Gerry,
I agree the oil saturation is not uniform, not even in the core areas. If there is not ethane available for injection or the proportion of ethane is lower in some areas than others we might not have enough ethane available for injection. Your description of smaller molecules flowing more easily would suggest that longer laterals would have a higher proportion of methane to oil as the oil would flow less well than the natural gas in a 15k lateral in proportion to a 7.5 k lateral and thus GOR would tend to be higher in the longer lateral well. Average lateral length has been increasing so this would be a contributing factor to GOR increase along with pressure drop in ththe core areas that have been drilled heavily. Pressure drop is expected, happens in every oil field as fluids are removed, in some cases water flood, gas reinjection, etc are used to reduce the pressure drop, though this tends to increase water cut and GOR.
I agree that Ovi is right that pressure drop is likely the first order effect, but there is variation from county to county in GOR, some may simply be due the nature of the deposits and geology in different areas, some may be due to differences in pressure due to depth, and the amount of fluid that has been removed.
Bottom line, it may be a bit more complex than pressure drop, there is much that is unknown thousands of feet below the Earth’s surface and much of the information that is known is proprietary.
Dennis
I still have this blob view of a tight oil bearing region. When it is penetrated by a drill, the drill must go through the most productive part of the blob and then heads out to its extremities to the less productive region as the lateral gets longer.
I agree with you that the explanation for the rising GOR is more complex than just pressure but I think that pressure loss is the primary variable and then there are a number of secondary effects that come into play. I am sure some of our oily experts know what these are.
Your comment “Productivity normalized for lateral length drops as laterals become longer” must also imply that as the drill penetrates the blob, productivity normalized for lateral length must increase as the lateral becomes longer and then peaks as it goes beyond the optimal length.
US production is up by 279 Kb/d in September and surpassed 12,000 kb/d at 12,268 kb/d. Full report late Friday.
Ovi,
I think the usual model is relatively uniform oil saturation in a core area for tight oil plays, though the areas outside of the core will have less oil per cubic foot of rock. I agree there is likely an optimum lateral length for productivity (it might be somewhere between 7500 and 10000 feet, but it depends in part on frac spacing, and proppant use). Note that the optimum length for an oil company is not measured in oil output per foot of lateral but in return on investment per dollar spent. As lateral length increases the capital cost per foot of lateral decreases. So for a given oil price and capital cost per foot you might see productivity per foot of lateral decrease by 10%, at say 15000 feet vs 10000 feet, but the cost of the well might decrease by 15% per foot of lateral and the operator may come out ahead with the lower productivity per foot due to the lower capital cost of the well per lateral foot.
The optimization is based on profits not on output.
I think the blob of oil that you envision, might roughly be correct but in core areas the blob covers the entire area. The lateral ends because the edge of the leased volume of rock is reached. Often these are blocks of land about 2 miles by one mile, if the operator has access to a 3 mile by one mile block of land they will in core areas drill a set of 4 15000 foor wells spaced at 1320 feet (I assume here that LTO survivor’s suggested 4 wells per unit (one mile) is the optimum spacing in most core areas.
Note also that in many cased there may be 2 or three horizons that are prospective in any given block of Permian basin leased acres, in which case 8 or 12 wells might be drilled with 4 wells in each of the horizons (though it is no doubt far more complex than this and the optimum spacing might entail fewer than 8 or 12 wells in a 2 or 3 horizon setup.) The wells may be staggered such that 7 or 11 wells might be optimal (4/3 or 4/3/4).
Dennis
I agree 100% with your last statement. I was just making a point that there is also a physical optimum and realized it was different than the economic optimum.
We have a perfect example of maximizing profits in Ontario. We have one toll road. When it started, I think the fee was 15¢/km. Six months later it went to around 19¢/km. Traffic went down but total revenue was up. This process continued until they found the optimum price to maximize revenue. It turned out to be around 50¢/km. Slightly less off peak and more at peak, 54¢/km.
Ovi,
Yes I agree there is a physical optimum, but for a while I missed the economic aspects and my thinking was in terms of maximizing output and I had not realized that the costs per foot might decrease as lateral length increased, I thought you might have done the same.
It was rather obvious once I read about this, clearly an economies of scale kind of phenomenon, but something I missed in part because I am not an oil man and as some like to point out, I have never produced any crude oil. I do the best I can with the information I have available.
Ovi,
A surprising increase in US C plus C output in September, thanks. Perhaps it will be revised lower next month. The rate of increase since Jan 2022 has been pretty steep. Though we may see a downturn like in late 2021.
Returning to the pressure drop in the Permian, I agree that is likely the main first order reason for higher GOR. Though the tightness of the rock makes me think the phenomenon is localized to areas where there are a large number of wells, also it may be that there is a lot of vertical communication between different horizons, this is where the oil men can enlighten us.
Found this
https://novilabs.com/blog/complex-oil-well-spacing-optimization-completion/
and
https://www.dgi.com/blog/well-spacing-optimization/
Ovi
Do you have a prediction of when U.S. crude and condensate will peak and at what amount
Charles
No I don’t. However, I think peak production will be somewhere between 12,600 kb/d and 13,000 kb/d in late 2024 going into 2025. I wouldn’t bet more than 25¢ on that forecast.
US inventory report is out.
Commercial weekly inventory down by 12.6 million barrels.
SPR down by 1.4 million barrels. Is this the end of SPR sales?
SPR down 213.4 million barrels relative to one year ago. 33 million barrels more than Joe promised.
Domestic production continues at 12,100 kb/d. Unchanged for the last four weeks.
Yet oil is in contango all the way out to almost Jun contracts. As tight as supply is. As low as storage is we shouldn’t even be hearing anything remotely close to to the word contango.
HHH
I am seeing something different. Brent is just in cantango for just one month.
I think the futures market is broken. It hasn’t reflected the physical market for a long time. Traders only make money with volatility. It has become a casino and makes it impossible for long term planning and capturing the more expensive barrels. The market is predicting demand destruction. If China opens up, they will be wrong and the traders will make a lot of money. The Saudis hate contango and it should be an interesting few days as the OPEC zoom meeting may reveal more.
LTO Survivor,
I agree, when did it last work appropriately? Seems it has never worked, but maybe long ago it was better.
If it was just a one off liquidity issue it would have just been one month. This is softening in demand. Which is inline with yield curves being inverted and slowing growth and inflation expectations.
Saudi’s will likely make multiple cuts in 2023 in my opinion. But likely will only slow the decline in price.
Not stop the decline.
It’s one main event that matters most.
If China exits their zero Covid policy.
They have to decide soon :
At their current level they will have rising numbers – so either they risk unrest and put the whole Country in a multi month lockdown or they give up, making a vaccine campaign to cushen the blow.
The next elephant that can land any time is russia – one pistol shot and there are peace talks. This can happen any time.
A successor can give all guilt to Putin and so stop the war without loosing face. Including fast resume of exports.
The first event will moonshot oil, the second sink it first.
Most action is on the political stage the next years – as is the inflation.
It’s de- globalication-inflation mostly, triggered by covid action and old trade wars and now a hot one. High interrest rates is here a rather blunt tool. But you can solve any problem with a big enough hammer, at least somehow…
Just my 5 cents
Chinese vaccines are not very good. They may indeed open up and absolutely get steamrolled by Covid. Opening up might turnout to be very negative for oil prices.
China made a big politically based error when they decided to not allow ‘western’ mRNA based covid vaccinations for use within the country.
They are developing their own mRNA vaccinations, but none has yet been approved for rollout.
Now they are experiencing the internal political pain of that decision. The government is in a lose-lose situation on this issue now.
I expect they will allow a gradual relaxation of restriction now, choosing economic growth and ‘domestic tranquility’ over the health of the elderly population who are primarily at risk of death from covid. They will keep up with mandated vaccination and mask wearing, which is the smart public policy stance at their stage of pandemic.
Give me a break with your vaccine bs. It is all about control in China. What do you think dictatorships are all about.
We are experiencing another covid wave here in NSW Australia. The government won’t dare impose any more restrictions or masks out of fear of protests.
Sorry to offend you with science.
I suggest you get your tetanus booster every ten years or so regardless of whether your government stays as a democracy or rolls autocratic, and regardless of your belief system.
btw- in a state with recent data on Covid in the US- Michigan
“Unvaccinated are 4x more likely to get COVID vs. boosted, but 84x more likely to die”
I’ll say no more on this topic in this thread. It came up a response to a comment on covid affect on Chinese oil demand.
Hickory,
What you are peddling is not science its propaganda.
Even pfizer came out and admitted they never tested whether the vax prevents transmissions. And all data indicates they don’t and hence mandates where all based on lies.
By your skewed world view, every country with low vax rates should be dead.
Now i wont say anything else on the topic.
The vaccines were meant to stop ICU and death being an end result, not sterilise the patient. In that regard, they did exactly what they intended to do.
Oil market is a joke. Tried to trade it down below $73 WTI just a couple days ago. Now $82. Nuts.
Huge EIA draw, big enough it couldn’t be ignored.
At what point do physical shortages take off in the US? Not sure on commercial inventories as we have so much more oil in pipelines than 10+ years ago.
Me personally if I was to trade oil I’d wait until see strengthening and sell into it instead of selling at current lows.
Fundamentals are growth and inflation are slowing. And just a guess that the cycle doesn’t bottom until 2nd or 3rd qtr of 2023.
Judging by yield curves, negative interest on interest rate swaps. Contango on oil. We have a couple of rough qtrs ahead. At which point we will find a bottom in oil prices and it will be time to start buying into weakness.
OPEC oil output drops in November after cut pledged -survey Bold Mine
LONDON, Nov 30 (Reuters) – OPEC oil output has fallen in November, led by top exporter Saudi Arabia and other Gulf members, after the wider OPEC+ alliance pledged steep output cuts to support the market amid a worsening economic outlook, a Reuters survey found on Wednesday.
The Organization of the Petroleum Exporting Countries (OPEC)pumped 29.01 million barrels per day (bpd) this month, the survey found, down 710,000 bpd from October. In September, OPEC output had been the highest since 2020.
OPEC and its allies, known as OPEC+, have been boosting output for most of 2022 as demand recovered. For November, with oil prices weakening amid concern of recession, the group made its largest cut since the early days of the COVID-19 pandemic in 2020.
Their decision for November called for a 2 million bpd cut in the OPEC+ output target, of which about 1.27 million bpd was meant to come from the 10 participating OPEC countries.
SNIP
In November, Saudi Arabia has cut output by 500,000 bpd versus October, the survey found, virtually all of the pledged amount. The United Arab Emirates and Kuwait made the next largest curbs.
Algeria cut about half of the pledged amount and Iraq, OPEC’s second-largest producer which has been calling for its quota to be increased, barely lowered output in November, according to the survey.
OPEC’s cut of 2 million bp/d was from the October pledged amount. I don’t have the data to what that pledged amont was.
There is more to this article. Click on the blue headline to read.
EROI
Energy return on energy investment is not really a problem for oil. Some recent discoveries have very high EROI numbers.
https://link.springer.com/article/10.1007/s41247-021-00095-6/figures/3
The average for the top 30 oil producers has not changed much in 20 years.
The real problem is that global oil discovery peaked in the 1960s when globally we found (from memory). 400 billion barrels that decade and used 100 billion. In the last decade we found 100 billion and used over 300 billion. We are using up the old huge discoveries at a rate of knots. Now 2/3 of all oil producing countries are in decline just a few more will tip the balance into global terminal decline.
It is not EROI that is the problem it is running out of new discoveries that is the problem.
Anyone who thinks that people driving a bit less will balance things up simply have not bothered to do the math. Or they live in a self driving fantasy land.
Those top 30 companies don’t really capture the effect of tar sands and tight oil where the production comes more from medium sized companies (although partly captured in the reliability number). The figures are dominated by old giant fields where the are minor development costs. For newer fields coming on line especially deep water and non-conventional the ERoI is falling. For new discoveries part of the problem is that an increasing number of small pockets are non-commercial because their ERoI is too low, especially where there is no existing infrastructure for tie-ins.
George
Tar sands have been produced for decades and the EROI has not changed much. Secondly it does not matter if the energy in, is cheap and different from the energy out. It is vital to understand that.
EROI only becomes important if the energy in is expensive or and the same.
Gas will probably become more expensive in Canada and the U.S. over the years but the increase in oil price will cover that.
Tight oil is only 10% of global oil so it does not govern price, and $60 is enough to make a profit so EROI costs in cannot be that bad.
Anyway you miss the point entirely it is not oil EROI at 100 or 20 or 10. It is the fact that we are finding 10 billion and using 30 billion a year. The problem is not EROI it is no oil.
I was simply commenting on the article you cited – the data there is not enough to conclude that ERoI has not been falling for the last twenty years.
Oil price is more impacted by the most expensive marginal barrel not by an average, so tight oil could well be sitting the price. However, your link and my comment concerning it were about ERoI, not price.
Oil sands have been produced for a long time but most production has been added in the last twenty years.
My last point was that the falling ERoI is actually a big part of the reason the commercial discoveries are falling, a point which, apparently, you missed.
ERoEI is an interesting topic, but on a practical basis the important reflection of that notion
is simply the Cost of Production/unit Energy.
Cost of production/barrel of oil has been going up and up, particularly for deposits that are in deeper, farther, smaller, colder or subsea locations, or behind the walls of sanctions/trade barriers.
That price rise is an obvious manifestation of the combined affects of high demand and depletion of easier developed fields. Not at all a surprise.
At some point cost to develop new pockets will result in oil derived products becoming unaffordable for billions of people on a prolonged and large scale…maybe starting now or this decade.
That is one of the big reasons that I think there will be an overall lower percentage of URR that actually makes it out of the ground. The other one being disruption of global free trade of energy, materials and tools- pick your own favorite reason.
Electrification of transport will be a third reason for overall lower percentage of URR that actually makes it out of the ground.
This is why I still think there should be two different metrics, Joules/Joules for EROEI and something tangible for EROI, for example Au/J. Apparently now EROI mainly means J/J but is sometimes also used for Au/J. So maybe a job for SI. (will take a while though)
Hickory
I agree
ERoEI is a part of the cost, sometimes it is a big part and other times it is less.
Canadian tar sands will have the same ERoEI in say 5 years times, but if gas prices are double then the break even cost will be much higher.
Sometimes it is not energy in, but simply length of time to develop a field that costs money.
There are some recent very deep offshore like Bonny which have ERoEI of a hundred.
Oil prices of say $150 can develop deep and small fields they drilled in many difficult offshore places for $50 no problem.
I am sure we will not have lots of oil with low ERoEI we will actually have too little oil and much will still have ERoEI values of 50 and more.
This will make countries like Iraq very very rich.
Working out great for Iraq right now. If only they knew there was much more oil they could just drill for, the idiots.
Love to find there’s actually more fossilised carbon to pump into the atmosphere for many COP events to come. I’m stoked.
Bonny is in very shallow water in the Niger delta and was first developed in the fifties. You may instead mean Bonga, which is deeper and more recent but certainly has an ERoI less than 100, One problem that has continually delayed a new FPSO at SW Bonga is the complicated reservoir and hence low and uncertain ERoI.
For readers who may not be familiar with the term URR, here a few brief descriptions of it
-The ultimately recoverable resource (‘URR’) of a field or region is the sum of all oil that is expected to be recovered from that field or region over all time.
-Estimated Ultimate Recovery (EUR) is a production term used in the oil and gas industry to describe the quantity of recoverable resource.
-URR is an estimate of the total amount of oil that will ever be recovered and produced
-… The total petroleum resource estimated to be recoverable from a given area (which differs from the total “oil in place”, since not all may be recoverable) …
–
Harold Hamm takes Continental Resources private
I am surprised that this news item never appeared on this board. I think he figures the price of oil is heading up and is not worried about stranded assets.
https://www.oklahoman.com/story/business/energy-resource/2022/11/22/continental-resources-okc-goes-private-harold-hamm-stock-to-cease-trading-wednesday/69669869007/
He will soon be 77. This is an estate planning move, at least in part.
Another estimate of OPEC’s November 2022 crude oil production:
OPEC Slashes Oil Output by Most Since 2020 to Fulfill New Pact Bold Mine.
OPEC cut crude production by the most since 2020, fulfilling a new agreement aimed at stabilizing world oil markets.
The Organization of Petroleum Exporting Countries curbed supplies by just over 1 million barrels a day last month, roughly in line with the amount specified by a pact with its allies, according to a Bloomberg survey. Production averaged 28.79 million barrels a day.
That’s 705,000 barrels per day below their October production.
Ron
Did you notice these to paragraphs?
Russian oil output — including crude and condendate — rose to an eight-month high of 10.9 million barrels a day in November, according to Bloomberg calculations based on data from the Energy Ministry’s CDU-TEK unit.
Meanwhile, output from Kazakhstan surged last month by 348,000 barrels a day to 1.89 million a day with the return of the giant Kashagan field, according to Bloomberg calculations from government data.
No, I did not see them. I have exceeded my free article limit so I only got what I posted. But thanks, this is interesting. The last data I saw for Russia was October at 10.8 million bpd so that is an increase of 1 Kbpd. That was also from reporting it was from CDU-TEK. However I am not sure of the data coming out of Russia since Putin started giving orders to the oil Minister. Their data was very reliable before the war but…
Also, the EIA data for Russia has always been well below the CDU-TEK data.
Attached is the full article
EIA data was 404 kb/d lower the CDU.
https://www.rigzone.com/news/wire/opec_slashes_oil_output_by_most_since_2020-02-dec-2022-171255-article/
Interesting Reuters piece on tight oil
https://www.reuters.com/business/energy/energy-hungry-europe-cant-look-us-shale-fill-any-opec-gap-2022-12-02/
Watching Europe commit suicide by energy drought is a great end cap to the legacy of that continent. I wonder how long before it’s back to the old ways.
A new thread on US oil Production has been posted.
https://peakoilbarrel.com/permian-pushes-us-december-oil-production-to-post-pandemic-high/
A new open thread Non-Petroleum has been posted
https://peakoilbarrel.com/open-thread-non-petroleum-december-2-2022/