A guest post by Ovi at peakoilbarrel.
Below are a number of oil (C + C ) production charts for Non-OPEC countries created from data provided by the EIAʼs International Energy Statistics and updated to March 2021. Information from other sources such as OPEC, the STEO and country specific sites such as Russia, Norway and China is used to provide a short term outlook for future output and direction for a few countries and the world.
March Non-OPEC production recovered by 1,760 kb/d to 48,778 kb/d by returning shut in wells from the US winter storm to production status. The biggest contributors to the increase were the US, 1,401 kb/d, Russia, 150 kb/d, China 84 kb/d and Canada 83 kb/d. The US increase was driven by the recovery of oil output from the severe winter storm that affected Texas and other US gulf coast states in February.
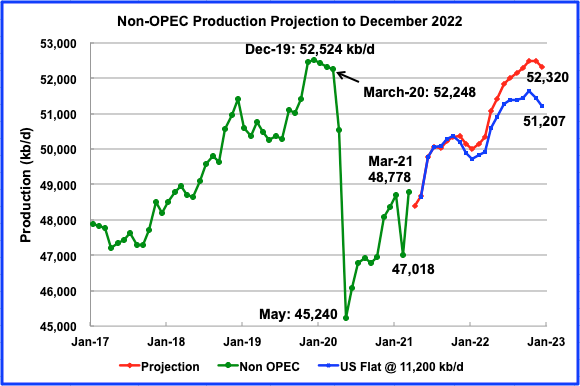
Using data from the July 2021 STEO, a projection for Non-OPEC oil output was made for the time period April 2021 to December 2022 (red graph).
Output is expected to reach 52,320 kb/d in December 2022, which is lower than the previous high of December 2019, by slightly more than 200 kb/d. In the July report, the forecast December 2022 output was revised up from 52,037 by 283 kb/d.
In the EIA July STEO, US output is forecast to be essentially flat at 11, 200 kb/d from March 2020 to October 2020, before beginning to increase every month. See US production chart further down.
The blue graph is intended to answer the question: “What would Non-OPEC output be if US production were to stay flat at 11,200 kb/d from May 2020 to December 2022?” As can be seen, production in December 2022 drops by 1,113 kb/d.
Ranking Production from NON-OPEC Countries
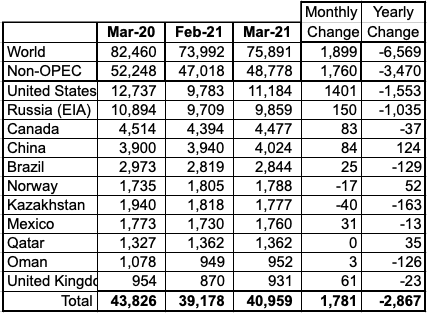
Above are listed the worldʼs 11th largest Non-OPEC producers. The original criteria for inclusion in the table was that all of the countries produced more than 1,000 kb/d. The last two have currently fallen below 1,000 kb/d.
In March, these 11 countries produced 84% of the Non-OPEC output. On a YoY basis, Non-OPEC production decreased by 3,470 kb/d while on a MoM basis, production increased by 1,760 kb/d to 48,778 kb/d. World YoY output was down by 6,569 kb/d.
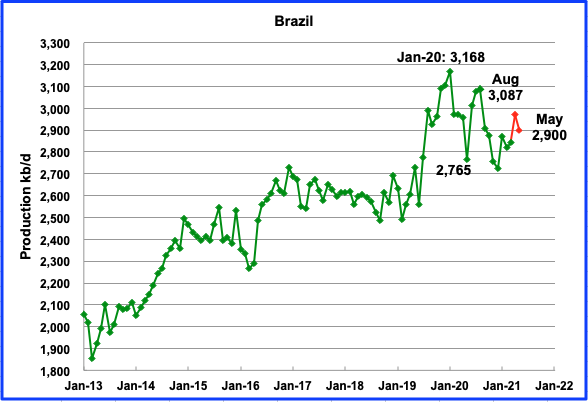
The EIA reported Brazilʼs March production increased by 25 kb/d to 2,844 kb/d. According to this source, May’s output decreased by 70 kb/d from March to 2,900 kb/d. (Red Markers).
“A key driver of Brazil’s growing petroleum production is the expansion in its pre-salt oil basins. By May 2021 pre-salt oil production was just under 2.7 million barrels daily, a notable 14% increase compared to the same period a year earlier, making it responsible for 93% of Brazil’s oil output and 71% of total hydrocarbon production.”
“The sweet medium grade crude oil grades pumped from Brazil’s pre-salt oilfields are growing in popularity among refiners, particularly in Asia where IMO 2020 and other regulations have sharply reduced the sulfur content of fuels. By October 2020 soaring demand from China for Brazil’s Lula and Buzios oil grades saw their prices spike sharply, trading at premiums to the international Brent price benchmark. At the time of writing this article Lula, which has an API gravity of 27 degrees and 0.27% sulfur content, making it heavier but sweeter than Brent, is trading at almost a 1% premium to the international benchmark price.”
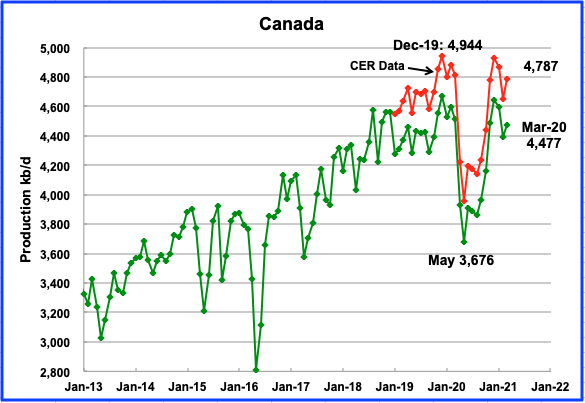
According to the EIA, March’s output increased by 83 kb/d to 4,477 kb/d. The Canada Energy Regulator (CER) reports March production was 4,787 kb/d. The CER data contains NGPLs. Oil exports by rail to the US in March were 175.6 kb/d but decreased to 129.7 kb/d in April.
On Wednesday June 23, 2021, the Biden administration passed up a chance to block Enbridge’s Line 3 pipeline replacement. Source.
The Biden administration signaled in a court filing this week that it does not plan to cancel federal permits for Enbridge’s Line 3 oil pipeline project, despite pleas by Native Americans and environmental groups for the president to intervene.
The U.S. Army Corps of Engineers used the filing to defend its decision in November to grant Enbridge a water permit for the project, the last major approval the Calgary-based company needed.
Wednesday’s filing by the Corps and its attorneys at the Department of Justice marks the first time President Joe Biden’s administration has taken a public position on Enbridge’s plan to replace its aging Line 3, which carries oil from western Canada to Enbridge’s terminal in Superior, Wisc., the Star Tribune of Minneapolis reported.
Environmental organizations expressed displeasure Thursday.
There is no guarantee the court will agree with the Army’s position.
According to this source, “Enbridge worked with local tribes in what Mr. Barnes called “the longest and most extensive” consultation process of its kind for an energy project. He added that the company was required under a consent decree reached during the Obama administration to replace its older pipeline.” In all of the articles I have read on this issue, this is the first time that I have read that the Obama Administration was instrumental in getting Line 3 replaced.
Oil Sands Production
A recent report from IHS Markit on the Canadian Oil Sands expects oil sands production in 2030 to be 3.6 million barrels per day, well above current level, but lower than prior projections.
“Canadian oil sands production has fully recovered from last year’s “COVID-19 Shock”—the largest contraction of upstream production in Canadian history—and has exceeded pre-pandemic levels. However, lingering COVID impacts, pipeline constraints and uncertainties related to an accelerating energy transition have reduced the longer-term growth projection for oil sands.
The latest forecast by the IHS Markit expects Canadian oil sands production to reach 3.6 million barrels per day (MMbd) in 2030, an increase of 650,000 barrels per day compared to 2021 levels (900,000 b/d from 2020). The previous IHS Markit forecast expected production to reach 3.8 MMbd in 2030.”
If higher WTI prices persist, the 3.8 Mb/d could still happen, provided pipeline capacity is expanded. This implies that oil sands expansion could increase annually at a rate of between 70 kb/d to 100 kb/d over the next 10 years.
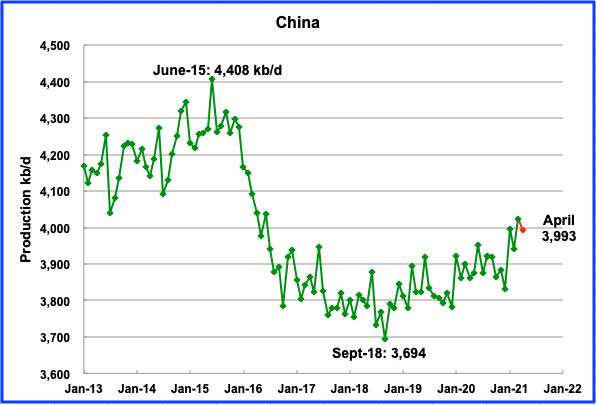
The EIA reported Chinaʼs March output increased by 84 kb/d over February to 4,024 kb/d. This source reported crude output in April was 16.41 million metric tons. Using 7.3 barrels per ton, April’s output was estimated to be 3,993 kb/d, down 31 kb/d from March.
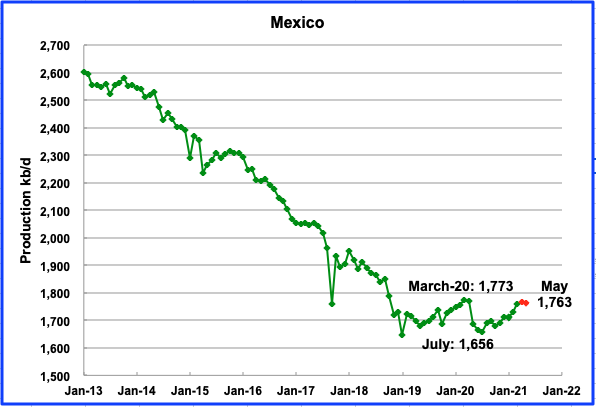
Mexicoʼs production, as reported by the EIA in March was 1,760 kb/d. Data from Pemex shows that May production was essentially the same at 1,763 kb/d. (Red markers).
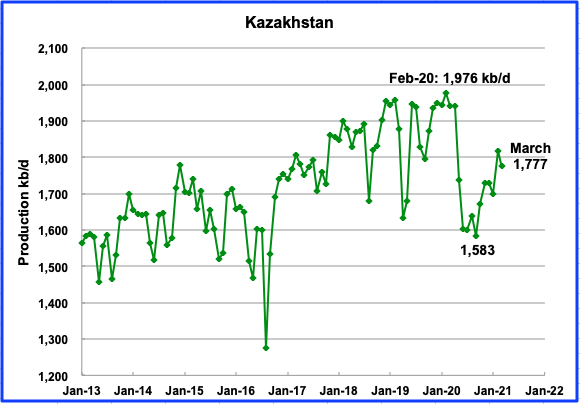
Kazakhstan’s output decreased by 41 kb/d in March to 1,777 kb/d.
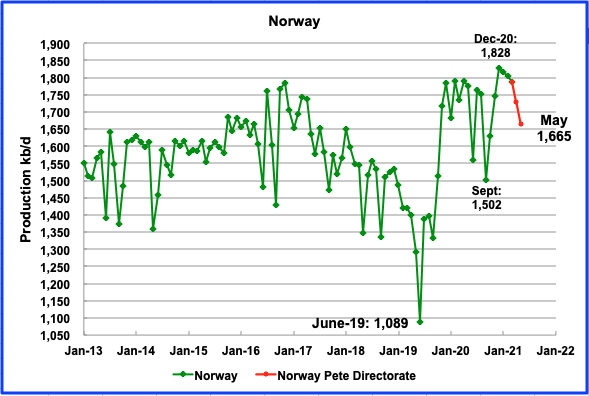
The EIA reported that Norwayʼs March production was 1,788 kb/d, a decrease of 17 kb/d from February. The Norway Petroleum Directorate reported that production in May dropped to 1,665 kb/d after dropping to 1,728 kb/d in April, red markers. The production drop since December is 163 kb/d and is partly due to maintenance.
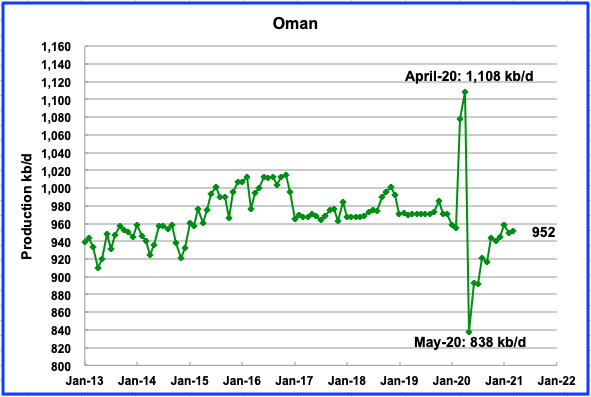
Omanʼs March production increased by 3 kb/d to 952 kb/d.
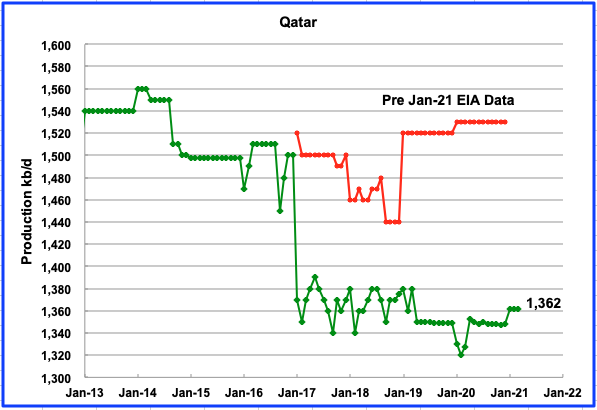
March’s output was unchanged at 1,362 kb/d.
Qatar’s output was drastically revised down by the EIA in its January 2021 report. The red graph represents the EIA’s earlier assessment of Qatar’s production.
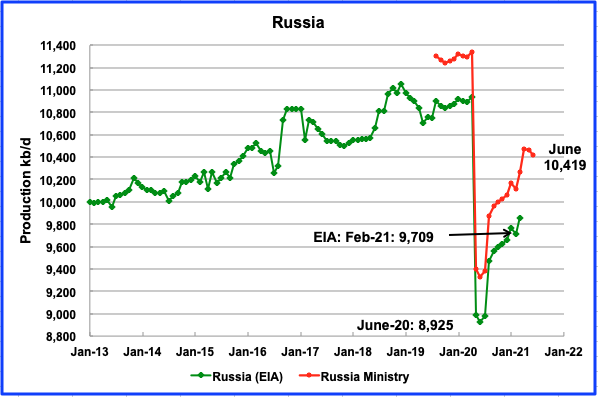
According to the Russian Ministry of Energy, Russian production decreased by 9 kb/d in May to 10,467 kb/d. The difference of close to 400 kb/d between the US and Russian numbers indicates a difference in the definition of Crude plus Condensate.
Bloomberg reported June output to be 10,419 kb/d, a drop of 48 kb/d.
“Producers pumped 42.64 million tons of crude and condensate last month, according to preliminary data from the Energy Ministry’s CDU-TEK unit. That’s about 10.419 million barrels a day, or 0.5% less than in May, Bloomberg calculations show, based on a 7.33 barrels-per-ton conversion rate.”
“This output drop may be because Russia is still trying to get back in line with its compliance and the Energy Ministry is trying to enforce some discipline,” said Ron Smith, senior oil and gas analyst at BCS Global Markets.”
Should the OPEC+ agree on further hikes, Russia will be able to boost its oil production quickly in August, according to analysts from Bank of America, Fitch, Wood & Co., Renaissance Capital and BCS Global Markets.
“I don’t see any problems with crude production, and for sure Russia can increase its output by over 100,000 barrels a day in August should OPEC+ reach a consensus,” Smith said.
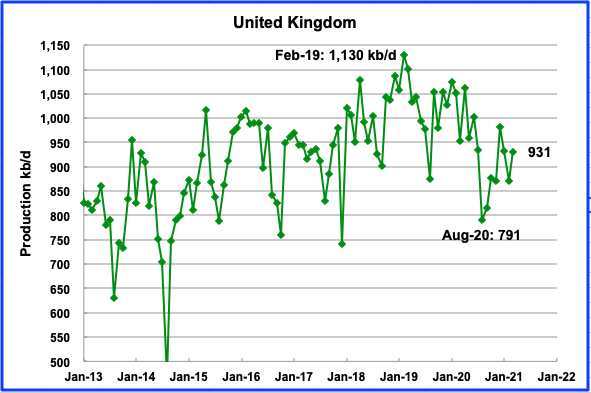
UKʼs production increased by 61 kb/d in March to 931 kb/d.
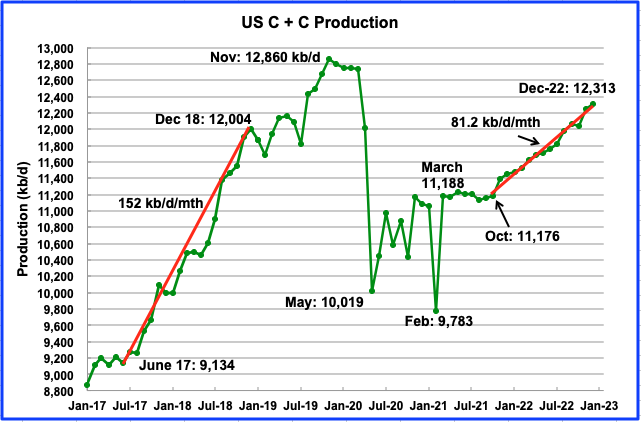
US production was updated in the previous post. The most significant information update since then has been the EIA’s release of the July STEO. They are now predicting essentially flat output from March to October. It then begins to climb in an almost linear manner up to December 2022 at an average rate of 81.2 kb/d/mth. It is not clear why output begins to climb almost linearly after November.
The July STEO has added 166 kb/d to December 2022 output from the previous June report which was 12,147 kb/d.
The July STEO is beginning to add more weight to the flat output projections shown in the DPR and LTO charts in the previous US post.
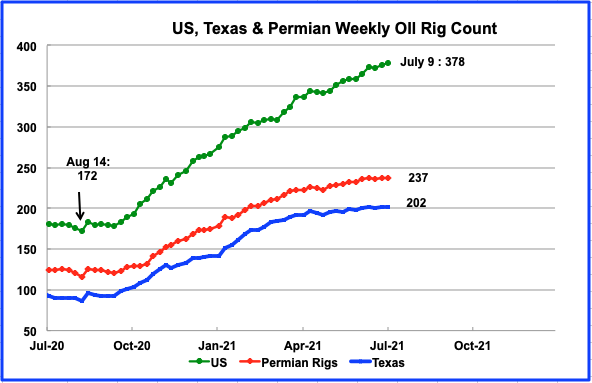
While two rigs were added in the week of July 9, no rigs were added in Texas or the Permian.
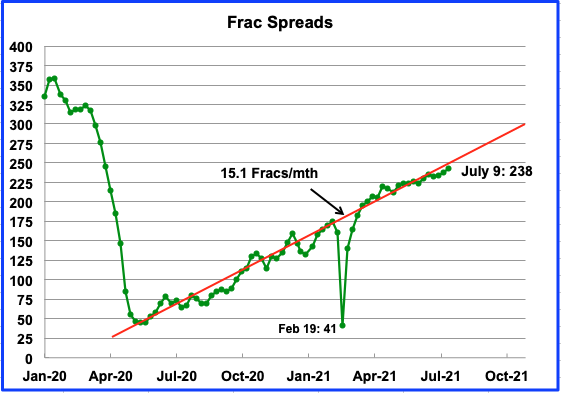
During the week of July 9, 4 frac spreads were added, bring the total to 236.
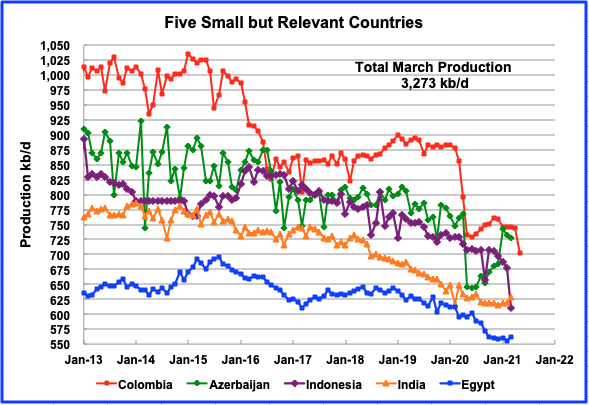
These five countries complete the list of Non-OPEC countries with annual production between 500 kb/d and 1,000 kb/d. Their combined March production was 3,273 kb/d, down by 58 kb/d from February. Indonesia dropped by 68 kb/d in March and Columbia dropped by 42 kb/d in May
World Oil Production Projection
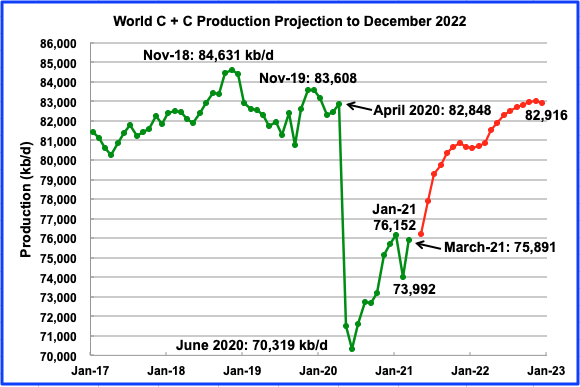
World oil production in March increased by 1,899 kb/d to 75,891 kb/d according to the EIA. Of the 1,899 kb/d increase, the biggest contributors were the US, 1,401 kb/d, Russia, 150 kb/d, China 84 kb/d and Canada 83 kb/d.
This chart also projects world production out to December 2022. It uses the July STEO report along with the International Energy Statistics to make the projection, red markers. It projects that world crude production in December 2022 will be close to 82,916 kb/d. This is 1,700 kb/d lower than the November 2018 peak of 84,631 kb/d.
World Proven Reserves
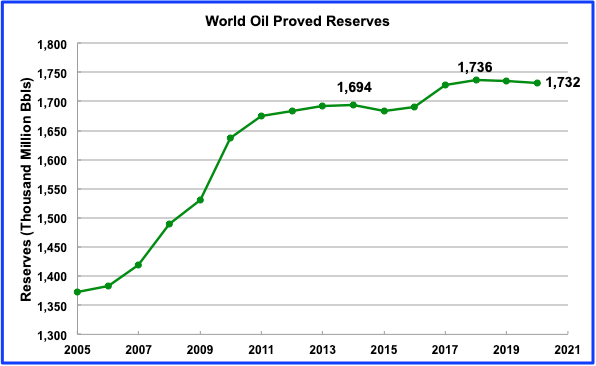
This chart shows BP’s world oil reserves updated to 2020. From 2006 to 2011, 291 B barrels were added to the world’s reserves. Of the 291 B, contributions came from Venezuela (210), Iran (16) and Iraq (28) for total of 254 B barrels. Are these increments believable??? More critically from 2011 to 2020, only 58 B barrels were added.
The only significant reserve additions between 2011 and 2020 occurred in 2017. This increase was due to the US adding 11.3 B barrels and Saudi Arabia adding 29.8 B barrels for a total of 41 B barrels. Without this increase world reserves would have been little changed from 2011 to 2020. Removing the 41 B barrels would put 2020 reserves at 1,691 B barrels, 3 B below 2014 which came in at 1,694 B barrels. It is the slowing yearly rate of increase that is more critical over the last eight years rather than the absolute level of the proven reserves.
Since the peak in 2018 at 1,736 B barrels, proven reserves have fallen by 4 B barrels. Clearly the world’s oil reserves are currently in their plateauing phase.
325 responses to “US Rebound from Winter Storm Raises Non -Opec Production”
Some confusing info from this morning’s weekly Inventory report.
July production is now up to 11,400 kb/d up from 10,800 kb/d six weeks ago. The STEO report in the US section of the above post forecasts flat production close to 11,200 kb/d out to October. It will be interesting to see who got it right, the flat production predictors or those predicting increasing output.
Thank you to the contributors of this site for your hard work, expertise and vision. I have followed for many years and it has been beneficial inhelping me stay focused in doing the work that I can that may make some difference for my children in the difficult times that surely lie ahead. The debate over the date of the absolute peak in oil production has always amused me. I am wondering if one of you modeling wisards good take the data from from one of Dennis’s runs and conver it to arough approximation of net oil. Perhaps a rough factor coud be applied to conventional, deep oil, tight oil, sand tar that would approximate the net available after the energy inputs of extraction. I know the boundaries of where to set the cost of extraction are debateable, but a rough approximation would do. Then take the net oil and compute the net oil per capita. When that is done we will all see that the true peak of oil has already occurred, after all this is what really matters to an industrial society ofth brink. Thank you.
Tom,
I don’t have the data needed to do that and think net energy is best looked at at a total society level for all sources of energy. A big problem with a net energy analysis is where to draw the boundries when looking at an individual product. I think a useful way to look at fossil fuel is to consider exergy which is the work a unit of energy can perform. For most uses of oil we get about 0.25 to 0.33 Joules of work for each Joule of energy that we burn (these are rough averages). This is not what you are looking for, but keep in mind that as we transition to electrical transport far less energy is needed because losses are more like 10% rather than 66%. As we move to solar and wind we eliminate further losses in fossil fuel power plants, though modern natural gas combined cycle plants are pretty good with efficiency as high as 60% (real world probably more like 50 to 55%).
I think i already pretty thoroughly destroyed renewables in my second post on peak oil.com, but in any case there’s problems.
Wind is 40% efficient. The rest goes to deforming the blade. It’s physically impossible for any wind system to EROI.
Solar burns up. Ivanpah, Al Dafra etc. Every single major solar plant built in the desert simply burned down.
Renewables will fail, libs will not survive.
Mark, in agreement with you on renewables . Maybe reduce the pain a little but definitely not a savior . Not enough EROEI in terms of total resources and land used .
Tell Iowa all about wind.
The people in that state got 57% of their electricity from wind energy in 2020.
Excellent work Ovi.
Iowa doesn’t manufacture anything. It proves the point.
Too add , 57 % works because 43 % from FF is there to subsidize it , the vice versa does not . 43% can stand on it’s own legs . Heck it can replace 57 % in a jiffy in a free market .
Germany manufactures a lot. And its electricity is about half renewable. Also about a quarter of new German cars are hybrid or all electric, so its beginning to be an issue in for the oil industry as well.
The hubris of oilmen thinking their pitiful little rigs can outproduce the sun and wind is astounding. Go out to West Texas at dawn and check the temperature. Then wait till noon and check it again. How much oil and coal would it take to heat all that air from horizon to horizon? Happens every day.
Germany probably has the worst wind industry in the world which is borderline bankrupt.
Mark –
Yes, wind doesn’t make much money in Germany. In fact the entire energy industry worldwide looks a lot less profitable than it did a few decades ago. Coal companies are bleeding cash, power plants all over the world are looking like stranded assets, and nuclear is pretty much dead. Even Saudi Aramco is hurting, borrowing money to pay its dividends.
This isn’t only because of renewables, but from the point of view of profits, wind and solar are primarily spoilers. The are extremely low margin industries that are undermining the profits of the fuel selling business, much like downloaded music destroyed the CD-ROM based music industry.
Nice way of thinking about it. Essentially big oil is now in the position of trying to compete against other “bottled water” suppliers where they will have to create their own niche. In music, the niche is making money via live performances.
Efficiency only matters when the fuel is in short supply. Wind is not in short supply, so efficiency doesn’t matter. “Peak Wind” is not a problem, as long as the sun shines and the Earth rotates.
What matters is whether you can build wind turbines cheaply enough to compete.
The wind turbines you don’t build waste 100% of the wind blowing all around us.
Solar panels pay the energy “debt” in 2-3 years, and last 20-30. Solar panels are increasingly made using solar as Chinese manufacturers look to cut costs.
Alimbiquated-
Photovoltaic panels last much longer these days.
For example Panasonic EverVolt modules also have efficiency ranging from 20% to 21.2% and power output of at least 92% is guaranteed after 25 years.
Once again- Power Output of at least 92% is guaranteed after 25 years.
Show me an oil well with such slow depletion.
The solar panels made by Enel green power with a technology (HJT) developed by the CEA (Commissariat à l’Énergie Atomique et aux énergies) have an efficiency of 24,63% and a life span of 30 years.
You don’t get it.
You are correct- I don’t get ‘it’, in fact I reject ‘it’
I am into realism, whether the facts match my inherent bias or not.
Speaking of realism, still waiting for your secret/unpublished scientific facts that indicate Covid-19 was created as a bioweapon, as you asserted.
Ok here.
https://www.google.com/amp/s/mobile.reuters.com/article/amp/idUSKBN29C26E
Just laugh at their fact check. A bat virus binding to human receptors.
Tom , an impossible task . What matters is not cost of extraction but the cost of getting the crude oil out of Ghawar to the petrol tank of ” Six Pack Joe ” in Montana . In this supply chain are electricity , natural gas , petrol/diesel , petro refinery stocks etc . Impossible to measure at the different stages . If the oil in Ghawar does not get to the tank of “Six Pack Joe ” its value is zero . What you are looking for an EROEI analysis which is not possible . Sorry to disappoint .
You don’t even need eroi, it’s the Betz equation for wind turbine efficiency as I said.
Wind is physically impossible as a energy source.
Totally agree.
LTO,
At least use a name so we know what you agree with. On a smart phone we cannot tell.
DC,
You supply an arrow for the quivers of those of us who don’t use the beastly things.
(shambles away muttering)
Great post Ovi, thanks!
Ovi , just repeating myself . Terrific . Just a little suggestion for all those who write the posts . Is it possible to give a 24 hr to 48 hr notice that a new post is coming ? The reason is that a new post comes up and comments on the old post continue but maybe unread . Of course the regulars read everything ,I am talking about the lurkers . I have earlier opined that as PO becomes mainstream (it will) this site will have more and more viewers . Just my two piece , at the end of the day it is your call .
Toby
Much appreciated.
Hole in Head
Thanks.
Interesting idea. I could give an estimated time for an update. Let’s see if that helps.
Peak oil will never be mainstream, people will just be totally overwhelmed and attribute it to some minor proximate cause like covid or news events or whatever.
Mark , agree that the politicians are going to mask peak oil with some other cause for the misery it will bring. However the truth will come out .Can’t keep it hidden too long . A lot depends on the media . A couple of incidents (riots,rationing,accidents) and hysteria sets in ,blown up the media .
When the the price of gasoline hits $5 to $6, there will be many reporters getting educated on peak oil and reporting on it. People pay attention when their wallet is hit.
How will anyone know if it hits $1 and no one is buying? The high prices will come in short bursts, but not be sustained and fall back. A little trickier to read what is happening then.
It costs about €1.55 a liter in Germany, nearly $7 a gallon.
America hasn’t been able to supply itself with oil since the late forties. Nobody complained. George Bush claimed there was no need to conserve because America was the land or plenty.
It’s the land of plenty of imports, but nobody cared. Nobody will worry about peak oil.
In my state (Washington) the cost of electricity is the same as the nationwide average ($0.11/kWh) .
It takes $4.07 to charge a Ford Mustang E to go 100 miles when taking into account the vehicles real world efficiency performance (37 kWh/100 miles).
To get the same cost performance, gasoline would have to cost $0.98/gallon
(assumes the US average car gas efficiency of 25 miles/gallon)
How will gasoline compete? Petrol products will be increasingly diverted to other non-transport important uses, such as in the industrial sector. This will happen due to cost competition from electricity, but also the higher value that will be placed on petrol for non-transport uses as depletion of oil gets real.
The economy will be facing a very difficult juggling act, shifting priorities and making tough choices. One easy choice will be shifting petrol away from routine transportation use and increasingly towards other critical/irreplaceable uses.
It will happen- like gravity happens.
Ovi, bullseye . Like they say ” Nothing bad happens , till it happens to you .” There was no Covid for the ” Covid deniers ” till they got infected .
A 1.7mb/d drop in global production in 3 years is alarming. Factor in inventory draws of 6-8m barrels a week from a total of 445.5m total, reduced capex from the supermajors and the IEA estimating demand to reach 101mb/d by the end of the year. It won’t be long until the politicians have to come clean.
p.s. President Jimmy Carter did tell the truth 40 years ago and was elected out of office.
Trade falls faster than production, and combined with population growth a relatively small fall will starve most of the world.
Mark, the sum of all my fears . A small wiggle and everything grinds to a halt . I think there will be no explosion or implosion but more like someone put a fistful of sand in the mobil oil and the engine seizes , grinds to a halt . The car is intact but the damage is done . All who have suffered low back pain understand that the disc slips less than a millimeter but one is bedridden and immobile .
My first impression . It is only US that contributed but that was because of extraordinary circumstances ( rebound from the winter storm ) . The rest Russia, China and Norway are just ” fill in the blanks ” . Maybe Ovi should change the headline . How about ” US rebound from winter storm raises Non -Opec production ” . 🙂
Check the new Headline
🙂 .
Second impression . Of those in the + column , China does not count because it is a nett importer . Norway will be flat . Nothing new happening . Their new oilfield Sven Nordurp is just about covering for their decline , Qatar is basically NGL and not crude . For the rest it is “Adois Amigo ” . 🙂
Hole in Head
I saw headline a few months back that we should expect one more bump up from Norway in H2 from Sverdrup
Ron
What do you know about this project. Is it being over hyped by as Sechin?
https://www.reuters.com/world/china/exclusive-rosneft-seeks-tempt-trading-houses-into-arctic-oil-project-sources-say-2021-01-28/
“The Vostok projects should already produce 30 million tonnes of oil by 2024 which rounds up to 600,000 barrels per day. This will need to increase to 50 million tonnes after the first phase, and 100 million tonnes after the second, which adds up to one million and two million barrels per day respectively.”
https://oilprice.com/Energy/Crude-Oil/Rosneft-Starts-Work-On-Mega-Arctic-Oil-Project.html
I have been reading about this project. From your link:
Rosneft has estimated its resources at 44 billion barrels, enough to supply the world for over a year, and said it could produce 1% of global oil later this decade at a price competitive with the cheap barrels of Middle Eastern producers.
1% later this decade is about 800,000 barrels per day or less. That may be a little ambitious but it will not be a game saver for Russia. Their old brownfields will have declined way more than that later this decade. But they are obviously over-hyping it in order to gain investors. From your link:
Vostok will require vast investments in new pipelines, roads and other infrastructure in East Siberia and the Arctic, with oil to be shipped to Asia via the Northern Sea route.
SNIP
Talks stalled after the oil price collapse of 2020, according to sources with knowledge of the matter, while approaches to oil majors have also generated little interest so far due to their rising emphasis on green energy.
This will be some really expensive oil. It will very likely be slow going due to lack of investment and laying roads and pipelines in such a challenging environment. But it will likely eventually get done. But as far as the peaking of world oil production goes, this will make very little difference.
https://coastalreview.org/2015/06/an-offshore-timeline/
https://www.geoexpro.com/articles/2017/07/russia-fall-in-offshore-exploration-investment
It takes about three years from discovery to develop a well and deep water wells only last 5-10 years. Most of the Russian offshore outside Sakhalin is deep water, and the Far East is not perceived as growing.
Virtually all Russian offshore discovery was before 2014. This means by 2020 that production should have peaked. It’s a drag on growth not a benefit. The second arctic development we are talking about starts production in 2024 by which time the other developments would have depleted anyway.
The only reason Russian production increased after 2017 at all was that OPEC ordered a cut. Russian production grew 2% in 2016 then was flat for three years. The growth, plateau and decline was deferred to now.
With offshore declining rather than growing this wipes out the entire Russian growth. A 2% decline rate with an added 1% from offshore means capacity fell 6% from 10,800 in early 2020, or 10,100 now.
That gives Russia no room for growth whatsoever, it’s producing at capacity.
Ron,
Many including me thought tight oil would make little difference. High oil prices can change things as it did with unconventional oil, deepwater offshore, and Arctic oil. Eventually there will be a peak when either due to a fall in demand at whatever price level is reached in the future (peak demand) or due to no supply available at an oil price at which there is both demand and resources that can be extracted profitably (peak supply). We can recognize which it is by the slope of the price curve, peak supply will have a positive slope (for yearly average price) and peak demand would have a negative slope. No idea which it will be, it’s a coin flip imo.
Eventually there will be a peak when either due to a fall in demand at whatever…
No, no, no, Dennis, peak oil will not eventually happen, peak oil has already happened. Damn, I thought you knew that. 😉
We can recognize which it is by the slope of the price curve, peak supply will have a positive slope (for yearly average price) and peak demand would have a negative slope.
Yes, that would have been the case if it had been a demand peak. But it was a supply peak. And you are very mistaken that a supply peak would necessarily have a price positive slope. Dennis, no one knew it was the peak when it happened. Everyone was producing flat out and all anyone saw was a supply glut. Dennis, just think about it. If everyone produces flat out, isn’t it just common sense that there would be a supply glut? And if there is a glut, why on earth would there be (A) a price spike and (B) why would anyone recognize it as the peak?
All delaying the peak accomplishes is making it more sudden. We’ve gone from gradual decline to 2030, to an abrupt social collapse in a few years.
Ron,
If 2018 was the peak, then it was peak demand, and yes everyone was producing flat out in 2018 (to position themselves for higher quotas), but the fall in output was precipitated by the fall in oil prices in autumn 2018 due to oversupply of oil. In 2019 output dropped because OPEC cut output to support oil prices. So the “peak” in oil output was due to a glut of oil on the market and production dropped in response to lower oil prices. That’s a peak demand story, not a peak supply story. A peak supply scenario would have oil prices rising and after the peak oil prices would rise further with falling output until an oil price was reached that would balance the market. Today (or in 2027 when it occurs) that price would be approximately ($150 to $200/bo for Brent in 2021 US$).
There is no peak demand, renewables are obviously physically impossible and you’re an example of how low the standards are for physics education.
Ron-“peak oil will not eventually happen, peak oil has already happened”
OK. Good call.
Now what (besides dramatically higher prices in the next few years)?
We won’t know if 2018 was the peak for some time, but it very well might have been. But I think Ron is correct about the price/supply/demand dynamic near the peak. If prices increase, production will increase until prices fall. It will be during a period of falling prices that the peak will be reached, i.e. Ron’s “glut”, since production will have been goosed by high prices in preceeding years. Since it takes time for production to fall after prices fall, the peak is likely to be at a time of low prices.
After the peak, production will fall and prices will rise again. If we see prices similar to those from 2008-2015 (in inflation adjusted dollars) and production doesn’t exceed the 2018 peak, then we will have solid evidence that the peak was then. But Dennis might be right about price slopes if using much longer time periods, perhaps decadal averages rather than annual averages.
The wild cards in the oil demand/supply/price dynamic are other dramatic economic events like pandemics, trade wars, hot wars, cyber wars or financial crises. A crippled global economy will use a lot less oil. Whether prices skyrocket or plunge might depend on factors other than oil production capacity. Some places might have gluts and low prices and other places might not have oil at any price.
Thanks Joe,
It is certainly difficult to predict what will happen. But for examples of peak supply see 1973, and 1980, 2018 was an example of a glut, with supply outrunning demand. I see a clear difference between 2018 when supply decreased due to action by OPEC to support oil prices.
Obviously lots can happen to the economy, but if oil prices remain over $80/bo in 2021$ for 3 years (average price over a three year period) and the peak has not been exceeded (centered 12 month average peak), I will be willing to admit that 2018 may have been the peak (or move my probabilty estimate to more than 50%).
Dennis Wrote:”
But for examples of peak supply see 1973, and 1980, 2018 was an example of a glut, with supply outrunning demand. ”
LOL! There was a peak Supply of $5/bbl Oil int the 1960s, but there has always been a glut of $300/bbl Oil. Prices go up, triggering demand destruction. Demand peaks because of price. If the Price of Oil was at $20/bbl today, demand would be considerably higher.
I think the game is up, OPEC-13 is averaging about 6% annual decline since 2017. I think OPEC is now in terminal decline. Perhaps production could be increase short term, but the long term trend will be at least a 6% decline, and probably will accelerate because Advance Oil recovery methods have reached there limits. Its likely most of OPEC fields now need to chase after pockets of trapped oil as the field oil columns and declined just two or three meters.
My guess is that global economy cannot sustain Oil prices above about $120\bbl. It might spike higher even bet the 2008 $147/bbl high, but it will trigger a global recession or depression, and probably a few wars.
Most of the industrialize nations are printing money just to maintain BAU. The EU & US have been doing QE nearly continously since 2008. That should be an strong indicator that the global economy is close to the tipping point. Not sure how the world will handle a global economic depression. The last one occured in the 1930s and triggers revolutions\civil wars and WW2.
The Great Depression was extremely mild and calories didn’t change. It was just a preexisting population crisis.
This one will be a shitfest.
The Great Depression was extremely mild and calories didn’t change. It was just a preexisting population crisis.
Of course, and what they call slavery wasn’t so bad either. After they gave the Africans free passage to America they immediately gave them jobs.
What is it that makes some people so goddammed ignorant of history????
Yes. The analysts who worked for the Shift project even included the extraction in the Bhazenov formation in their oil production forecast. And even with that, the oil production of Russia will decrease to 29% less in 2030.
Ovi,
Much of the increase in reserves were from the Orinoco belt in Venezuela (these are similar in quality to Canadian oil sands, but somewhat easier to extract because of higher average ambient temperatures near the equator.) I tend to put both oil sands from Canada and Venezuela in a separate “extra heavy oil category”. and would have a conventional oil reserve chart which would also subtract tight oil reserves. Chart attached “Conventional Oil” excludes Canadian oil sands, Orinoco belt, and tight oil reserves.
Note that in my models I only expect 150 Gb of the extra heavy oil resource to be extracted through 2300 (end of my models time frame). The total reserves reported by BP in 2019 is 424 Gb in Canadian oil sands and Orinoco belt. Jean Laherrere expects about 200 Gb of this resource might be extracted in his 35 country oil forecast published in August 2018. Note also that Laherrere has a total crude plus condensate URR of about 3000 Gb, my best guess Oil Shock model has a URR of about 3050 Gb, pretty close to Jean Laherrere’s 2018 estimate.
tight oil reserves are only available from 2011 to 2019, but using a zero tight oil reserve assumption for other years (due to lack of information), I get the following for Conventional oil reserves from 1980 to 2019.
You should give the big stick back to Ron. We aint stupid.
Houtskool,
Ron is always welcome to take the blog back, he wanted to move on, I am happy he still helps and comments. The chart is simply BP statistical review of world energy reserve data which ends in 2019 for historical data, then I deduct the Canadian oil sands and Orinoco reserve data reported by BP and also tight oil reserve data reported by EIA.
Data for chart uses BP statistical review of world energy 2021 for World, Canadian oil sands, and Orinoco belt data and EIA tight oil reserve data, conventional is defined as World oil reserves minus tight oil reserves minus Canadian oil sands reserves minus Orinoco reserves.
https://www.bp.com/en/global/corporate/energy-economics/statistical-review-of-world-energy.html
See data table 2 from EIA page linked below and go to previous issues (2011-2018) for estimates from earlier years.
https://www.eia.gov/naturalgas/crudeoilreserves/
The chart above uses data from those sources.
Also note that these are supossedly proved reserves, but an article published in 2014 states that BP proved reserves reported in 2011, were the same as proved plus probable (2P) reserves reported by IHS the same year. See section 3b, below figure 5 in paper linked below
https://royalsocietypublishing.org/doi/10.1098/rsta.2013.0179
an excerpt from that paper:
Globally, BP [13] estimates 1263 Gb of conventional proved reserves in 2011 (slightly more than cumulative production to date) and 389 Gb of non-conventional proved reserves. The latter comprise 169 Gb of Canadian oil sands and 220 Gb of Venezuelan extra-heavy oil, but both estimates are disputed and only a fraction of this volume is likely to be recovered over the next 25 years. In principle, global 2P reserves should be larger than 1P reserves, but according to an authoritative industry source (IHS Energy) global 2P reserves are approximately the same as national declared 1P reserves—suggesting an overstatement of proved reserves by several producing countries.
Dennis
There are two sources of oil sands. One is very close to the surface and covered with over burden. The over burden is cleared and the oil sands are recovered in an open pit mining operation, similar to open pit copper and gold mines. My understanding is that as the pit expands the over burden gets thicker and at some point the open pit mines stops expanding. Not sure at how many feet of overburden that happens.
The other source of oil sands is deeper and is recovered using a process called SAGD, Steam Assisted Gravity Drainage. In this case, steam is injected into a horizontal hole and the liquified bitumen is pumped to the surface by a submersible pump. Some solvents are now being added to the injected steam to improve the efficiency, Ratio of steam to barrels recovered.
As the technology advances and prices stay elevated, more will be recovered. According to National Resources Canada, the total Canadian proven oil reserves are estimated at 171.0 billion barrels. However as technology improves, “ultimate potential reserves, or the oil estimated to be recoverable as technology improves, are estimated at more than 300 billion barrels.”
So it will be a while before we know what the potential is for the oil sands. However, because it is capital intense on the front end, the rate of expansion of annual production is limited to between 75 kb/d and 100 kb/d/yr
I think the SAGD process is more energy intensive than the mining operation. I recall seeing a paper where the cost of producing a barrel of synthetic sweet crude (SSC) from SAGD vs mining was compared. As I recall, with low NG prices, SAGD was more economical. SAGD needs NG to get the bitumen out of the ground and then more to upgrade it to SSC. The mining operation uses diesel in their massive shovels and the trucks that bring the oil sands to the first stage operation, a bitumen/sand separator, i.e. a huge pot of hot water and solvents. The bitumen floats and the sand sinks.
https://www.nrcan.gc.ca/energy/energy-sources-distribution/crude-oil/oil-resources/18085
I am not sure that with a heatwave of 50 ° C and the forest fires they are currently experiencing, they will have the same motivation. https://globalnews.ca/news/7995210/bc-wildfire-map-2021/
Dennis
I forgot to ask. Why does that chart stop at 2019, now that the 2020 data is out.
Ovi, For reserves the data ends in 2019, so that’s the last data point I have for World, extra heavy, or tight oil reserves.
Thanks for the explanation on oil sands (I knew that, but no doubt many others may not have).
It one time I used 500 Gb for extra heavy oil resources (following Jean Laherrere’s estimate). In 2018 Laherrere revised his extra heavy oil estimte to 200 Gb (100 Gb each from Canada and Venezuela), I have further assumed that Canada will be about 100 Gb and Venezuela about 50 Gb.
My thinking on this is that demand for oil will fall below oil supply by 2035 as the World transitions to electricity for transport and that by 2040 oil prices will fall below the level that new investment in oil sands will be profitable, Middle east and Russia will be fighting for market share and we may see Brent oil prices drop to $30/bo in 2021 US$.
I am skeptical that oil sands resources extracted in Canada will ever reach more than 100 Gb. According to BP only about 20 Gb of Canadian oil sands is under active development and about 14 Gb total had been extraxted at the end of 2019, so a total of 34 Gb, extracted plus active development of resources.
I may well be wrong however as in the past I have consistently underestimated future oil output, this may be true of most of my future scenarios despite the prevailing sentiment of most who comment at POB.
Dennis
I generally agree with you future outlook. However with ever increasing population, I cannot see oil demand falling below 50 Mb/d.
Currently 55% of energy goes toward transportation and 45% for industrial use. I can’t see airplanes, trains and ships being powered by electricity in the next 20 years. So at this point I think oil demand will move asymptotically toward 50 Mb/d. The question is “How long will it take to get close to 51 Mb/d”
The changes our society will be required to make to move that asymptote below 50 Mb/d is anybody’s guess.
Ovi,
In 2018 according to BP stats regional data, gasoline and diesel use was about 51.7 Mb/d for World, leaving about 31.3 Mb/d for other uses in 2018 for World C plus C (assumes C plus C output at 83 Mbo/d in 2018). I ignore biofuel and NGL, not important for land transport. Over time the land transport use of fuel will disappear, perhaps by 2050. Other uses of fuel will become more efficient over time counteracting the increase in population, air transport may move to synthetic fuel, and ships can be natural gas powered. Even if not, my model has World C C at 50 Mb/d in 2058 with extra heavy oil at 5.54 Mb/d in that year, peak for XH at 6 Mbo/d. There is likely to be too much oil rather than not enough after 2050 when oil output will be about 61 Mb/d (this ids for a 3050 Gb URR scenario, current cumulative C plus C output (end of 2020) is about 1400 Gb. World reserves about 1400 Gb, the extra 250 Gb comes from reserve growth. Note that in 2050 cumulative C plus C is 2290 Gb for my best guess scenario. In 2100 cumulative C plus C is 2892 Gb for my scenario.
Almost all locomotives are actually diesel-electric hybrids.
https://en.wikipedia.org/wiki/Diesel_locomotive#Diesel%E2%80%93electric
In imagination, it is easy to convert to battery operated where the major battery power is on another rail car that is switched out as needed for recharging. By coupling, decoupling in turn on opposite ends of the train, it would not even be necessary for the train to slow down. It could even be a flow battery which are housed in cargo containers already.
Only in underdeveloped countries trains are not electric – or on rarely used tracks going to small towns.
Even the transsiberian railway is full electric, all subways are electric.
Interesting tidbit. From the BP consumption numbers:
Already noted KSA took over 4th place in the oil consumption list of the world, passing Japan, who declined far more in 2020 than KSA. Japan -11.4%. KSA -2.5% Japan 3.27 mbpd
Russia declined mildly, too. 4.6%. 3.2 mbpd now
So Russia. Lancet peer reviewed says their Sputnik V vaccine works very well. Solid trial data. But they are getting virus slammed right now and maybe it will prevent them catching Japan this year. Japan’s present death spike looks subdued in comparison, but they have the Olympics spike coming.
Overall it was interesting to see who didn’t decline (only China) and who declined very little — KSA, Norway, Russia — all of whom have oil to burn, as it were. If you have it, price doesn’t matter. You can define the price inside your own borders for your own consumption. Charge whatever you want externally.
Norway, Brazil, China and Australia grew oil output last year. How nice.
Norway peaked decades ago. China officially believes peak is imminent. Brazil and Australia are irrelevant.
Australia has shutdown its last refinery (Shell) . Wonder from where they will get their inputs ? Closest refinery is in China ? Why do they keep poking the dragon ?
HIH, there are massive, modern refineries in Singapore which provide most of the refined product imported to Australia. They are the reason Australia’s old, relatively small (equals much less efficient) refineries are closing.
Tks Phil , I was aware of the refineries in Singapore as they are used by Malaysia , Indonesia and Brunei for refining their crude . Just forgot they were around . Thanks for waking me .
What do you mean by ”China officially believes peak is imminent.” ? The peak of oil production in China was in 2015. They are speaking of the global oil production peak? They are living in an other world. It seems well that this peak in oil production is behind us. And I think that the people who are saying this are going to produce goods for the glory of China in some laogai, because in this case, the wonderful plans of World domination by China conceived by their dictatorXi Ji Ping will disappear in the trash can.
Reminder of the embarrassing situation of KSA out-consuming Japan at 1/4 Japan’s pop. When Russia overtakes them, this will be less uncomfortable since Russia has 10 million more people.
But, of course, KSA will then be consuming more than Russia, too. With 1/4 of Russia’s population. This might come up in OPEC+ conversations.
In the next few years, we are going to find out if the Export Land Model is accurate.
All these high-price / low-price scenarios fall apart if oil is unavailable at any price.
Just out of interest I checked what was Norway’s sale of petroleum products in 2020 in volume. Turns out it was down 7.2% yoy from 2019. Aviation being the big contributor with -53%, while shipping going the other direction 7%. Increased oil production in Norway means the oil goes somewhere, often nationally. Does not equal consumption for sales.
https://www.ssb.no/en/energi-og-industri/olje-og-gass/statistikk/sal-av-petroleumsprodukt
Thanks Ovi for all the work. Much appreciated. There is an error in your first sentence above, the update is to March 2021 (not February).
Rystad estimates 9 months before US extraction can increase. They estimate US extraction will break 12 mbd in October 2022: https://www.rystadenergy.com/newsevents/news/press-releases/us-shale-gets-tempted-by-high-prices-but-boosting-output-to-tap-opec-inaction-would-take-months/
Many thanks Ovi for your work!
The rystad report is interesting. Gas production grows much faster than oil production in their forecast. They are also forecasting that the higher gas production is from associated gas from Permian, Eagle Ford, Williston and Rockies rather than core gas regions of Appalachia and Haynesville.
This ties in very well with Mike’s views, presented many times on his oilystuffblog and here, that GOR is increasing and gas is increasingly displacing oil in the core oil producing shale basins. The trend of increasing gas ratio has not stopped – Mike thinks so and I completely agree. Please correct me Mike if I am wrong.
This is another strong headwind that the US shale sector faces when they try to increase production. And this headwind will only get stronger over time.
Ancient archer,
Yes without enough gas pressure the solution gas drive will be lost, shale profile provided this data for free in the past, but is only available by subscription now. Looking back at older reports GOR was quite a bit higher in Eagle Ford than Bakken or Permian, past of the increase may be due to more development in the Delaware basin which is gassier than the Midland.
Note that at $3/MCF, the natural gas and NGL along with the C plus C makes these wells (as of 2019) quite profitable for the average Permian well based on the 2019 average well profile.
Patzek agrees with Mike and you that the rising GOR will be a problem. This is probably correct and we may already be seeing it with falling well productivity. It will be interesting to watch. So far the productivity has fallen pretty gradually, again I do not have the data for productivity per lateral foot.
My model for all US tight oil (annual average output) is below URR=72 Gb (through 2052).
On model above, I did not extend the chart to the future very much, as many find such extrapolations absurd. Note that based on the assumptions I have made (oil prices start to fall in 2033 due to assumed transition to electric transport gradually reducing demand for oil) US tight oil output falls to 5000 kb/d by 2035 and to less than 2000 kb/d in 2040, in 2052 (final year of scenario) US tight oil output is 50 kb/d. From 2034 to 2041 annual decline rates are in the range of 15 to 20% per year for tight oil output for my scenario.
How did you decide that the recovery would be in 2022, is it just a made up number? Obviously it’s based on whatever rig model but when did you decide rigs will recover, and if they already did why is there no effect?
Also, isn’t your model just a (incorrectly made) hubbert curve, which you are so adamantly against?
Mark for an explanation of how the model works see
https://peakoilbarrel.com/oil-field-models-decline-rates-convolution/
Also you can see Webhubbletelescope’s (aka Paul Pukite) explanation at link below
http://theoildrum.com/node/10221
Also some details are covered in chapter 9 of the booklinked below, available in many University libraries
https://agupubs.onlinelibrary.wiley.com/doi/book/10.1002/9781119434351
Short answer, no not a hubbert model.
Dennis, your convolution model is wrong because in reality countries go into accelerating decline to a negligible output (Venezuela, FSR, etc). Empirically the field abandonment causes faster than linear decline to almost zero, not the slowing decline you predict. Can you find any countries or fields which behaved as you’re suggesting?
Also, that article doesn’t solve the problem at all because you haven’t described why you decided wells would recover in 2022 or whether it’s just a made up number. In particular, you haven’t described why the 2021 recovery got moved to 2022.
It seems you just automatically assume it will happen “next year”, or you are using Rystad, which is always wrong and over predicts. You can see here https://www.rystadenergy.com/energy-themes/commodity-markets/oil/oil-market-analytics/ https://www.rystadenergy.com/contentassets/751682232fd8428a9243cf8bea4ccd24/oil-market-analytics—v1b—graph-4.jpg
they were predicting tight output to recover fully by now.
So either way it’s just a made up number, other people have made up numbers as well and their predictions have also been ineffectual.
The recovery in 2022 is based on an assumption of increasing completion rate in the Permian basin primarily. Of course every prediction beyond today is made up, note this is also true of average output for 2021 as we still have 5.5 months until we reach the end of the year. The only annual tight oil data we have is through 2020, but most readers here are aware that the future is not known and that a model of future output is based on a set of assumptions about the future and doing the simple math to determine the output that results from those assumptions.
Mark,
The model has not changed a lot in the past few months except a slight revision lower for Permian output.
Tight oil starts to recover in Mid 2021, just as before, but the annual average tight oil output is lower than 2020, because output does not return to the levels of early 2020 until 2023 for my scenario. Although you believe the model is wrong it accurately matches 2010 to 2020 tight oil output.
Monthly scenario below.
Mark,
As far as your belief that the tight oil model is incorrect, chart below shows model output based on the well profiles I have found using decline curve analysis (DCA) on data gathered at shaleprofile.com. I also use well completion data gathered form shaleprofile .com. The well profiles and completion data for 4 major plays and “other US lto” are convolved in 5 separate models and the data is summed to find US tight oil model output. This is compared with EIA tight oil data in chart below from Jan 2010 to Dec 2020, correlation coefficient is 0.997.
Click on chart for clearer view.
Dennis, I believe you have a good, simple model of the lag between drilling and production. If you give me the source code I can have more specific comments but you probably don’t hand that out.
Every model is easy to make based on trends. It’s the inflections that cause models to fail. The federal reserve can predict 50% of GDP when it just goes straight up but that goes to 0% during recessions.
The 2015 crash was predicted by rigs so you got it right. Going forward rigs have fallen by half and have stopped recovering so that should mean a continued production fall.
So I’m not even saying your model is wrong, I’m saying there’s a hidden magic number there saying recovery is in 2022 because if you only use rigs as a predictor then that can’t happen. You probably have a good model you are just hacking it and biasing it up.
And although rigs did in fact stay low after 2015, that’s because laterals increased. Laterals are unlikely to increase due to crowding.
Mark,
The model will only be correct beyond May 2021 if future completion rate matches my model guess. I do not use rig count as a predictor as that would simply add another assumption about rig efficiency which changes over time in ways that cannot be predicted. I look at past increases in completion rates and assume these provide an upper bound to future increase in completion rates, I also look at future price expectations (a future oil price scenario is part of the model) and future expectations for economic growth to gage future oil demand.
In any case, predictions of the future have zero probability of being correct, infinite scenarios when one is chosen chance of being correct is one divided by infinity.
Mark,
You asked:
Can you find any countries or fields which behaved as you’re suggesting?
US L48 onshore conventional declined at about a 3.5% annual rate from 1970 to 2010, if we take the more recent and shorter period of 2000 to 2011, the average annual rate of decrease in US L48 onshore conventional oil output was about 1.7%. When we aggregate World output decline is likely to be more gradual as everyone is not on the steep part of their decline curve at the same time.
Mark said:
The convolution model is not wrong. It is actually correct because that is the actual mathematical description of what is happening when one considers a number of fields depleting over an extended period of time.
The problem is that you need to formulate your issue in mathematical terms so that it can model the empirical data.
I don’t think you have studied in detail how well Dennis and others can monitor the ongoing decline of the Bakken just by using a most basic convolution-based model.
Dennis, thats after it fell to a virtually negligible level. The Pennsylvania oil fields are operated after 100 years as museums.
Dennis, if we take your R2 literally it means you either predicted covid or have a very short predictive period.
Dennis,
I don’t think there will be a major rebound because of the drought. US is going to soon declare a Tier 1 emergency soon since all of the major reservoirs in the Western US, are at all time lows, and drought is likely to persist for considerable period. I think that will impact well completions in 2022.
It’s ironic you complain about the hubbert curve being moved back (it hasn’t, you’re just aggregating) when your own predictions of recovery keep being moved back.
Basically the only way someone would take your made up, physically impossible numbers seriously is if they didn’t read you.
Mark,
Clearly you have not done the analysis, read the work from Laherrere.
https://aspofrance.org/2018/08/31/extrapolation-of-oil-past-production-to-forecast-future-production-in-barrels/
His own analysis shows how his estimates of C plus C less extra heavy have evolved, a bottom up analysis doesn’t work because only fields and nations past their peak will yield a useful estimate. I do an estimate of World C+C minus extra heavy minus tight oil. It yields an estimate today of about 2600 Gb, I showed this chart earlier.
https://peakoilbarrel.com/us-april-oil-production-flat/#comment-720763
In the chart below, I see what the same type of analysis would yield using 1982-1997 World C plus C less tight less extra heavy oil, result is 1600 Gb, so in 23 years the URR increased by 1000 Gb. How much will URR increase over the next 10 years? I think my guess of 200 Gb (2800 minus 2600) is quite conservative, about half the rate of increase from 1997 to 2020 (a little over 400 Gb every 5 years).
Yes, and north ghawar peaked in 2000. They started in south ghawar in 2003 to stop the collapse. I can cite any of this, simply ask.
Indonesia began to plunge rapidly in 1997 leading to the “Asian financial crisis “. If you were to pluck out Indonesia from that estimate you’d get a different peak when somebody else peaked.
So even when you incorrectly aggregate as you do it still predicts the next peak in whatever resource is dominating your curve.
In fact if we drop a few countries dominated by offshore and heavy oil (FSR, Brazil, China, uae and Angola), we find that conventional oil peaked in 2005. Outside Saudi, 1998. Hubbert curve for conventional oil is looking good.
As for your question, the current curve gives 2.5T, which is the same as your number. It’s not gonna budge. You simply time the peak a little different, the curve says it already passed.
Mark, the word salad is not convincing. Read the Laherrere paper, you need to aggregate if you want to get an accurate answer. If we only include post peak regions there is no way to estimate the ultimately recoverable resources of regions with increasing output.
Read and learn.
Oh and you make many claims, most of it without any published work to back it up.
You seem to think Ghawar is the World, it is one field, a large one, but 3.8 of 83 or 4.6 % of World output and we don’t really have any data on it after 1982 except an occasional guess that output was 5 Mb/d in 2003 or 3.8 Gb in 2017 (roughly a 2% annual average decline rate over 14 years).
Ghawar is effectively Saudi output minus the offshore fields (which we usually get some kind of estimate for).
Here is the cite of where they started south ghawar in 2003 and this drove production growth to 2005.
https://www.google.com/amp/s/www.albawaba.com/amp/business/light-oil-field-discovered-saudi-arabian
“Published April 10th, 2003 – 02:00 GMT
Yabrin, a new field of Arabian Light crude oil, has been discovered by Saudi Aramco in the Kingdom’s Eastern Province, Minister of Petroleum and Mineral Resources Ali Al-Naimi announced recently.
The new oil field is 260 kilometers southeast of Riyadh and 50 kilometers south of Haradh, which is at the southern end of the giant Ghawar field.”
Of course there isn’t any information on what they did with the field because Saudis don’t publish that. However it would seem to explain their growth.
Now that’s out of the way, and you didn’t ask for more citations I’ll get to the rest.
“If we only include post peak regions there is no way to estimate the ultimately recoverable resources of regions with increasing output”
That is actually what you are doing for example with your 1900-45 US troll. So if anything your source refutes your point (as usual). You literally don’t even think about what your saying, your goal is mere contradiction and hoping the readers are too dumb to think.
If you disaggregate then of course all the growing fields are included, and there could be new fields but those are usually minor. Like I showed you could easily predict the entire 20th century US oil production using hubbert curve data from about 1945, broken by individual state instead of your aggregation troll. If you made some allowance for Louisiana you could predict everything in 1935 or maybe even earlier if you had data. The hubbert curve is limited by data availability and not even the methodology.
You assume the hubbert curve “gets better” over time but I think it’s actually gotten worse, for example conventional oil peaked in 1998 and not 2000 like hubbert predicted. If I get bored enough I will compare the extrapolation before and after 2020 also.
Because most production is in countries that aren’t growing, or are barely growing, Ghawar is about half of the global growth. Saudi Arabia grew 2m/d from 2000 to 2019 and the world outside America grew 5m. So yes, this one tiny field is enough to change the entire world production.
Mark,
The citation is for a discovery, the rest is pure speculation on your part. You draw conclusions based on very little information and claim you have proven your case, far from it.
Mark,
When I get good information, such as the stuff I learn from shallow sand, LTO survivor, Rasputin, and people who prefer I not use their name, I adjust my assumptions about the future. Sometimes lower (as when I changed my well spacing assumption from 1000 feet to 1320 feet for Permian basin and lowered my TRR estimate from the USGS mean of 75 Gb to 60 Gb) and other times I adjust higher as in 2018 when the USGS Delaware Wolfcamp and Bonespring assessment was published (I had guessed the TRR was about half of the USHS mean estimate for Delaware). Note that I still believe it likely that the USGS mean TRR estimate is more likely, so my best guess for the Permian remains 46 Gb.
In 2012 when I did my first oil shock models I used 2500 Gb to 2800 Gb for total World C+C URR (conventional and nonconventional). Since that time I have revised my estimates higher to about 2800 Gb minimum and 3200 Gb maximum with a best guess around 3000 Gb (for conventional and unconventional resources).
For you the math may be different, but in my world 3000 is a larger number than 2650 Gb, so your “revised lower” is backwards, unless you mean up is down.
See below for early model
https://oilpeakclimate.blogspot.com/2012/07/an-early-scenario-for-world-crude-oil.html
For something more recent see (June 2019)
https://peakoilbarrel.com/oil-shock-model-scenarios-2/
My best guess scenario has been revised a bit lower for URR as I currently expect World oil demand to fall after 2035, also in June 2019, I did not foresee the Global Pandemic.
You actually haven’t adjusted your predictions much except moving the recovery back another year. Your well spacing assumption is close, you have no concept of lateral overlap. In reality laterals are a mile and overlap at that distance. Anything less is some odd case. Of course you’ve already heard this many times and will just keep spacing wells 25x denser than they could be. You take whatever they say and make the smallest possible adjustment to what you already believe.
World production outside America went down after 2012 so it’s bizzare that caused you to increase your estimate. Obviously what you are doing is continually delaying the peak. The reason why poverty statistics stop after 2013 isn’t mere negligence, it’s because things started getting worse then. There is an accelerating growth of poverty, conflict and starvation in most of the world after 2013 due to peak oil.
Of course you, standing in the 1 country growing oil production will just ignore this even as it comes here.
About yabrin field, either they produced from it or it was some sort of aramco conspiracy to create fake reserves, which is what you’re implying.
Because it’s such a small discovery and part of a existing field I doubt they would report anything else. Of course you can take this as lack of evidence but so says the person whose entire model is a made up number saying the economy will recover in 2022.
Mark,
LTO survivor says 4 wells per mile, pretty sure he means 1320 foot spacing between laterals, unfortunately, although I have asked him many times he chooses not to answer this question. Must be a trade secret. It is the assuption I used. As to your suggestion of 1 mile well spacing, I will let oil pros who know far more than me comment. I am fairly certain you are wrong, but I will let others chime in.
You are asking about different things. 4 wells will work if you have different benches or something like that.
What matters is overlap and not the maximal possible wells you can drill in ideal conditions, which is what that 4 number sounds like. Some companies have extremely good acerage and others don’t so you can get totally different answers depending on what someone’s job is.
Mark,
The model takes the average well profile, some wells will be better others will be worse. For the average well, only profitable wells are completed (part of the analysis is a dicounted cash flow model) basically I assume oil companies know where the sweet spots are, they start there and when they are fully drilled they move to areas that are slightly less productive. That’s why the model comes up with only 120 thousand wells out of 190 thousand possible locations (based on a 60 Gb TRR assumption) get completed in my scenario (including the 28 thousand wells already completed in the Permian basin). You can claim it is wrong all you want. Time will tell us who is correct.
Mark,
You said:
World production outside America went down after 2012 so it’s bizzare that caused you to increase your estimate.
Here’s World C C from 2010-2018, before the 2019-2020 oil glut.
As usual you are off by 180 degrees.
Dennis,
https://stratasadvisors.com/Insights/2019/110419-Upstream-Q3-2019-Global-Crude-Condensate-Production-Outlook
Global crude oil production (excluding condensate) in 3Q19 was 76.2 million b/d,
Global condensate production in 3Q19 was 6.2 million b/d,
Of which the us was at least 18
https://www.eia.gov/petroleum/production/
https://www.eia.gov/dnav/pet/hist/LeafHandler.ashx?n=PET&s=M_EPL2_FPF_NUS_MBBLD&f=A
Leaving 82-18 = 64 non US production so there is something wrong with your graph. You have 72. You apparently threw in American condensate (most of global condensate).
Without that boost your graph proves rest of world (ROW) production peaked in 2012.
Mark,
I use EIA International data see link below
https://www.eia.gov/international/data/world/petroleum-and-other-liquids/annual-petroleum-and-other-liquids-production?pd=5&p=00000000000000000000000000000000002&u=0&f=A&v=line&a=-&i=none&vo=value&vb=173&t=C&g=none&l=249-00000000000000000000000000000000000000000000000201&s=94694400000&e=1577836800000&ev=true
data can be downloaded to a spreadsheet using download options link (csv table)
The data is crude plus condensate, you can also get data from BP at link below
https://www.bp.com/en/global/corporate/energy-economics/statistical-review-of-world-energy.html
Mark condensate and NGLs are not the same thing. There is not a good estimate of US condensate, a portion of NGL is condensate (but only about 11.5% in 2019 was pentanes plus aka C5 aka condensate), there is also lease condensate which is mixed with crude at the lease and is not quantified by the EIA. That is the reason most places report crude plus condensate with the exception of OPEC.
We would need a longer data set than 2016 to 2020. I think C plus C data is fine.
World C plus C minus US C+C from 2010 to 2018 using BP Statistical Review of World Energy crude plus condensate data.
Click on chart for larger view.
So in 2018:
World 83m CC
US 11m
2012:
World 76.5
US 6.5
World increased 6.5
US increased 4.5
Then Iraq grew 2m
https://tradingeconomics.com/iraq/crude-oil-production
So peak oil outside America and Iraq was 2012.
Mark,
Yes and if we take out all nations that have increased output, then the World minus those nations will be in decline.
What is important is World C+C output. So far that peaked in 2018, perhaps that will be the final peak, but I am doubtful, I would put the odds at 9 in 10 that World 12 month average C plus C output will exceed the 12 month peak in November 2018 (centered average) by December 2028.
Mark,
It is you who does not think.
The methodology assumes we can take a region such as the US and predict future output based on past output. If we do this for US L48 onshore conventional output (excluded GOM, Alaska, and tight oil) in 1945 we get a very different result than in 1985, that is a simple fact. Deny all you want. The point is the method does not work when annual production divided by cummulative production is over about 0.05, it really is that simple. So a Verhulst equation applied to tight oil output at present is likely to underestimate the URR, likely by a factor of 2 or more.
As to what is physically possible or made up, the future is unknown, most of my past scenarios of the future (made up as all scenarios of the future must be) were claimed to be physically impossible or absurdly optimistic.
(This applied to all my cases, low medium or high.)
In hindsight, nearly every one of my scenarios that were a best guess estimate (typically I called these a medium or average scenario, between high and low cases explored) proved to be too pessimistic.
We will have to wait a few years to see if history repeats. My guess is that it will, because despite what some believe my scenarios tend to be quite conservative and there is likely a 60% probability that they will prove too low rather than too high.
Because you’re aggregating different fields into a single thing. It’s like comparing apples and oranges production and saying both will fall when only oranges are.
Every individual state followed the hubbert curve. I gave examples for the ones that mattered. TX and LA. Can you find any state that doesn’t follow the hubbert curve?
Mark,
When you do an HL for Texas or Lousiana or any state for that matter, you aggregate fields. I am simply doing a larger aggregation following Jean Laherrere’s example.
So wait, you acknowledge every individual state followed the hubbert curve and yet the national doesn’t, and so you use the measure that doesn’t work?
Ok fine. If you’re going to combine thousands of individual fields into a single variable, even in your real model I don’t see how you could make your model any worse.
Mark,
You are correct that I was missing data from Gulf of Mexico and getting a bad estimate for USL48 onshore conventional using HL.
It remains the case that for early Hubbert linearizations for data before 1932 when annual production of C plus C divided by cumulative production was about 0.06 or higher that we would have underestimated URR for US L48 onshore conventional oil (estimate would be 20 to 25% of the estimate today (40 Gb vs 180 Gb).
The main point is that using a Hubbert type analysis for tight oil is likey to be a severe underestimate of tight oil URR. For tight oil befor the pandemic for tight oil annual production divided by cumulative production was about 0.17 and in May 2021 had decreased to 0.127, still much too high for an accurate result.
No I have never done HL for individual states, but my guess is that in every case an early HL when annual production divided by cumulative production is over 0.1, that the estimate will be inaccurate. I am simply saying that an HL on a state would require an aggregate of all fields in the state, when an HL gets to under 0.01 for aP/cP it is probably going to give a good estimate for conventional oil unless some very large field is discovered late (which is not likely).
Ah I see, thank you for not shifting anything. So the growth rate is just going to be blatantly wrong now.
Permain rigs are barely growing anymore, less than 1% monthly, if we plug this into your model we should get a decline. What is the lag between rigs and production? I think it should be 18 months but yours seems less.
Mark,
Most use 9 months for rigs, but I focus on frack spreads and the lag there is shorter, about 4 to 5 months at most.
I see. So since frac spreads have started increasing around end 2020 you expect production to grow now.
That’s a reasonable, fair prediction and seems to have been wrong for the past month or two but I understand if you give it time.
Often there will be a bit of lag as production turns around, notice that my scenario under predicts tight oil output for April and May 2021 by about 200 kb/d and doesnt reach the May 2021 actual level until Jan 2022. The completion rate may in fact be somewhat higher than I have guessed, at least through May 2021.
tight scenario (shorter time scale displayed but scenario unchanged) below. As always output beyond May 2021 unknown, model based on an assumed increase in completion rate from 570 in June to 750 in Dec 2021, (an increase of about 30 per month on average) in Dec 2022 the completion rate rises to 1030 per month with a gradually slowing rate of increase. This guess is very likely to be incorrect.
“Permain rigs are barely growing anymore, less than 1% monthly”
Lots of DUC wells in the Permian. Its going to take a while for the backlog of DUC’s to complete. That said, I think there might issue obtaining the water needed to complete all of the DUC’s.
FWIW: On my radar is the real possibility of soaring food prices in 2022 as farmers are cut off from access to water. Soaring food prices global is likely to break a lot more instability in the Middle East, which could impact oil production & transporting Oil (ie attacks on Tankers).
What I am seing is a financial impossibility. To reach the level of production of the end of 2019, the shale oil industry invested so much that they get a collective debt of 300 billions of dollars. I don’t think that the investors are going to be even more generous.
Schinzy
Thanks. I couldn’t tell you how many times I reread the article before it was posted.
From shaleprofile posts from Dec 2020 (last month when GOR was available on blog)
For Permian advanced insights GOR (link below) I have following (fuzzy, go to second link below for better chart)
https://shaleprofile.com/blog/permian/permian-update-through-september-2020/
https://peakoilbarrel.com/adv-2/
So true. This is what happens when the pressure has dimisnished. The GOR will only get larger.
For Eagle Ford I use Dec 2020 shaleprofile post below (advanced insights GOR)
https://shaleprofile.com/blog/eagle-ford/eagle-ford-update-through-september-2020/
GOR is much higher in Eagle Ford see link below for chart
https://public.tableau.com/shared/YZZD5Y9KX?:toolbar=n&:display_count=n&:origin=viz_share_link&:embed=y
Better link for Eagle Ford GOR chart below
https://peakoilbarrel.com/adv-4/
Thanks Dennis,
Mike had some good charts from shaleprofile in his blog that I can’t seem to find now. Maybe he can put those up here as well for the benefit of people here.
And also from the charts you have put up Dennis, it seems that GOR is trending up over the years. That will likely continue for the next few years and when pressure drops below a certain level, I expect we will see a sharp fall in oil volumes. While this might be the mechanism by which individual wells operate, we will see a slow cumulative impact on the basin and the total shale production. First, it will be difficult to increase oil production from shale, then it will fall slowly and after that it will collapse all of a sudden, echoing how people go bankrupt!
From Ernest Hemingway’s novel The Sun Also Rises:
“How did you go bankrupt?” Bill asked.
“Two ways,” Mike said. “Gradually, then suddenly.”
Hemingway could easily have been talking about declines in Shale oil output!!
😉
“From Ernest Hemingway’s novel The Sun Also Rises:
“How did you go bankrupt?” Bill asked.
“Two ways,” Mike said. “Gradually, then suddenly.”
Hemingway could easily have been talking about declines in Shale oil output!!
That’s a good one Ancient . 🙂
Ancient Archer,
Note the different scales for the Eagle Ford vs Permian GOR charts, Eagle Ford goes up to a GOR of 10 on the vertical scale, Permian only goes to 7.
Look carefully at Eagle Ford vs Permian, permian has mostly been at about a GOR of 3, Eagle Ford has been at 5 for years. As more and more wells are drilled a field will tend towars a highe GOR because older wells have higher GOR, also when completion rate decreases there are fewer new wells which tends to drove GOR higher. Look especially closely at the yearly GOR curves and see how the Permian curves have a different sahpe from the Eagle Ford curves which quickly go to a GOR of 5 or more where the Permian curves tend not to be as flat and gradually rise to a GOR of 5 late in the well’s life (over 60 months).
I agree this will become a problem eventually, different oil people have different thoughts on this. Perhaps no more wells will be drilled, that will tell us it is a serious problem. To date, when I look at the well profiles, I do not see a problem, the drop in productivity has been minor so far, even in the Eagle Ford.
Please hear me out.
There are two typical avenues for higher produced GORs: drilling in gassier parts of the reservoir and/or pressure depletion. The first cannot be helped as the rock is where the rock is and the second is partially man made.
These reservoirs, by their very nature, are typically solution gas drive reservoirs, also referred to as depletion drive reservoirs, augmented by rock compaction in varying measure. I discussed this with Mike on OSB in a recent forum or two. There will be much left behind oil due to pressure drop whether from general depletion or simply the inability of fractures to effectively contact near zero permeability oil bearing pore spaces. Dissolved gas breakout results in a negative relative permeability ratio where the less viscous gas move through whatever flow channels that exist more readily than the more viscous liquid hydrocarbons; and not to forget, formation waters.
These unconventional, tight reservoirs are victims of their own success and the annals of oilfield history are littered with flash in the pan fields of great value that were quickly ruined by wasting the gas resources, stranding much of the OOIP. Unless someone comes up with the magic bullet of reservoir pressure maintenance at the beginning of LTO exploitation the problem cannot be solved. That ship has already sailed and might have been impossible anyway due to the nature of the reservoir rock. Ask yourselves why water or gas reinjection wells are put in place at huge expense in offshore fields at the onset of and not in the middle or near the end of production life.
The reason that old legacy fields that Mike and SS refer to as very, very low decline is the drive mechanism. Those low decline rate fields are typically high permeability, high porosity, water drive reservoirs with the most efficient having large downdip aquifers driving and sweeping the oil. The great giant East Texas field produces from the Woodbine sand which is a usable aquifer many miles to the west and northwest and it’s still going after 90 years. One reason that water drive reservoirs have greater recovery of OOIP is the less drastic relative permeability ratio of oil/water as compared to that of oil/gas. Obviously, the continued water influx keeps the reservoir pressure closer to virgin pressure as the oil is produced relatively slowly (to prevent gas breakout). The degree to which of these factors plays in improved recovery varies by reservoir geology and aquifer efficiency. The creaming of Gahwar and the giant Russian fields as noted are evidence of this success and they will hit it out of the park until the oil/water interface reaches the horizontals and then the oil to water ratio plummets by well.
Furthermore, there are two conditions that simply cannot be overcome with a horizontal well. The first is low reservoir pressure as discussed above and the second is water coning/breakthrough. The latter was prevalent in the Mississippian play in northern OK that involved massive amounts of produced water with massive amounts of produced water disposal (in very unfortunate but approved zones) and increased seismicity. Anyone that has ever operated a waterflood secondary recovery operation knows full well that after water breakthrough one must produce the water to get the oil often down to a barrel or two of oil with one hundred barrels of water, often in multiples of thousands of barrels of water per day. But I digress.
The GOR, TRR and EUR metrics are not simply the results of analytics. Analytics help us to understand the symptoms but do not effect the causes. Metaphorically speaking, the solutions are more about wrenches and less about data and MBAs.
As I often repeat, if I am in error please educate me for my good and that of others. Simply silently dismissing these comments, if wrong, in part or throughout, serves no purpose in greater understanding which I believe is the purpose of this site. In his comments in the last post, HIH linked to our discussion to no apparent avail. FYI, I am a mechanical engineer by degree, a petroleum engineer by training and profession and a passionately self trained reservoir engineer by necessity over 40 years of spending my own money as motivation.
The gas oil ratio changes because gas is deeper and fields get deeper.
Natural water flooding like you’re talking about is substituted for by fracking, which is really just secondary recovery with more water. It’s already done and the recovery factor is the same regardless.
Getting the oil out faster is more important to companies than waiting.
It is interesting to me that nobody mentions the Sprayberry of the 1950s. Huge IP, very steep declines that had not previously been seen in the Permian Basin. Lots of money lost.
I suspect there will be hundreds of thousands of shale wells that pump just a few hours a day, in the future. There are tens of thousands of them now.
What worries me is that our limited experience with old horizontal wells is bad. Very expensive to workover horizontal well bores, many problems with those that you don’t have with verticals. Seems like a lot of casing issues in the bend and lateral, that pretty much ruin the well.
I stand to be corrected.
Great Post!! We are seeing rapidly increasing GORs in the Permian. It is a crime that producers are not pumping dry gas back into these reservoirs to help creat more isolated pressure cells. The gas will bring more fluid and will be wet when it comes out.
Mark
I honestly don’t know how to respond without a reply button on your comment but I must even if this incorrect etiquette.
Thank you for your response.
I must humbly and wholeheartedly disagree that fracking is the same as waterflooding with more water as that is incorrect on two counts. First, the purpose of fracking is to increase interconnectivity of natural fractures and reservoir porosity. Waterflooding is pressure maintenance and the sweeping of the oil filled porosity with a reasonable oil/water permeability ratio, sometimes modified by chemicals and polymers, to bypass less oil. Secondly, the volume of water swept through an oil reservoir through its secondary recovery life is many pore volumes not simply more fracture volumes. There might be some nuance here that is beyond my experience so school me up if so.
Waterflooding is performed at rates controlled enough to mitigate water breakthrough and more effectively sweep the rock. I have advised clients to inject into their new wells for some time before ramping up the producers in order to lessen the chance of creating too high of a pressure differential between the injector and producer resulting in channeling thus stranding reserves. It’s very hard to not seek a quick payback for the capex for setting up a flood.
There is no way that a 40 to 60% recovery factor for a well managed waterflood is equivalent to a 10% or so recovery from an LTO reservoir. Even at a 25% recovery it’s still not even close. Yet many a company has sold their legacy assets, to be run by folks willing to put in the time and elbow grease, to the end of getting on the LTO treadmill to net less in the end.
You are correct that greater up front cash flow is the MBAs playbook but it is not the best for overall EUR. My one man company is about to bring online a water drive gas reservoir that I’ve studied and worked on for over 15 years. Oddly enough, water drive gas reservoirs behave in the inverse such that the encroaching water is most likely to bypass gas in the pore spaces resulting in lower recovery factors. This sad reality means that I will have to manage the reservoir and pressure drawdown to a trickle with the goal of less is more. When I brought this up in a meeting at the OCC with several department heads I was scoffed at for not just ripping and tearing.
Reservoirs are special and need to be studied and understood to get the most of a diminishing resource to the market. Timing is just about everything. Perhaps when FCF is high enough or costs are low enough, pressure considerations will be in the fore front. As an aside, right now, dry gas producers are seeing their asset bases increase without turning to the right. Their unusual level of restraint has helped to substantially raise prices resulting in higher EURs based upon implied higher profitability at lower rates nearing depletion. One of the mandates of state oil and gas regulatory bodies is to prevent waste both of resources and money. Rate of withdrawal in oil and oil/gas reservoirs was managed for the good of all stakeholders for years. For all practical purposes they have been thrown out the window with what will ultimately be costly outcomes.
I apologize for sounding so harsh but the more that I have considered this EUR/TRR issue, the more I am passionate about understanding it better and focusing realities to that end.
Raspitun,
Absolutely, no dispute there.
Rasputin, when I was sent to reservoir school forty years ago, we were taught that highest recovery with a water-drive gas field was achieved by outrunning the water drive. Thus if you had a number of gas pools stacked in a well, you would blow down the bottom one first, plug that and then complete in sequence upwards. For what it is worth.
Mark Ingraham, The gas to oil ratio rises because gas travels faster than oil. The gas phase is seeing further into the formation. At the same time pressure is dropping, leaving more oil stranded.
Rasputin,
You replied to Mark correctly, the number of levels of comments ends at 5 or so, just use the person’s name in your reply so it is clear who you are replying to, maybe use full name if there are several people with same name (in this case it was clear.)
Consider data from this Jan 2021 post, where I picked 2013 to 2020 wells from Permian (NM and TX) I show these wells by year of first flow using advanced insights (this is the most recent post I have access to, shale profile stopped providing that information for free.) It now costs $50 per month.
The Permian basin shows an improvement in GOR in 2014 relative to 2013, 2015 is better than 2014 through about month 50, and 2016 is better than 2014 up to 43 months but becomes worse than the 2013 well after 55 months. The 2017 well follows the 2013 average well pretty closely and 2018 seems to follow the 2014 GOR curve pretty closely, the 2019 GOR does look to be the worst of the lot and 2020 may be following the 2014 or 2015 GOR curves (too early to tell).
Link to post
https://shaleprofile.com/blog/us/us-update-through-september-2020/
Chart below, click on it for larger view.
Rasputin,
Using the same shaleprofile.com blog post and using same years (2013-2020), the chart below uses the big 4 tight oil basins (Bakken, Permian, Eagle Ford, and Niobrara) and groups wells by year of first flow for GOR. We can see that the GOR is getting worse for the US tight oil as a whole from 2013 to 2019, with a bit of improvement in 2020 (though early days to make a judgement).
One explanation may be deteriorating down hole pressure as LTO Survivor has observed, but I wonder if it may be due to more wells being completed in high GOR basins such as Eagle Ford and Niobrara, all basins are higher for average GOR than the Bakken and older wells will have higher GOR than newer wells and as completion rates slow down we see a higher proportion of total output from older wells which will drive up overall GOR. I agree this is a problem, but I wonder if it is as big a problem as the charts might indicate. Chart below, click on it for bigger chart.
Rasputin,
This last chart uses the same group of wells as previous chart (Bakken, Permian, Eagle Ford, and Nibrara basins with first flow years from 2013-2020) from Jan 2021 US blog post at shaleprofile.com (linked 2 comments up).
Chart below groups these wells by basin rather than by year of first flow. Bakken low GOR at about 2 from 20 to 70 months. Permian higher than Bakken with GOR rising from 4 at 20 months to 6 at 60 months. Eagle Ford mostly higher than Permian with GOR around 5 to 6 from 20 to 70 months, though Permian rises above Eagle Ford after 52 months. Niobrara has highest GOR of all major basins after 10 months, with GOR rising from 5 to 10 from month 10 to month 40. Chart below, click on it for larger view.
Rasputin,
Note that I have not attempted to dismiss your comments, I agree with all you say. I am just trying to understand the basin wide situation in the Permian basin. I would expect that GOR would increase on a basin wide basis over time as older wells tend to have higher GOR as they age in a depletion drive reservoir.
Also there will be variation from location to location, we can see this within the permian by looking at the largest producing counties such as Eddy, Reeves, Midland, Lea, Howard, Martin, and Loving. Eddy and Reeves in particular have much higher GOR than other high production counties. Much of the increased GOR may be simply because a higher proportion of new wells are being completed in those counties since 2017. See chart below.
Sorry it is so fuzzy, best I could do. Click for larger chart.
Original blog post at link below (note that I misspoke earlier when I said the most recent post with the advanced insights was from December 2020 at shaleprofile, it was March 2021 when the last posts were published with that information.)
https://shaleprofile.com/blog/permian/permian-update-through-december-2020/
Rasputin, there are also situations where the GOR falls, like a gas drive reservoir where gas is forcing the oil out and depletes first.
https://www.sciencedirect.com/topics/engineering/depletion-drive-reservoir
Thanks for the post. Why people are saying that Russia is going to produce 100 kb/d more while they are decreasing their oil exports of 380 kb/d or so? That’s nonsensic! Where is the reality for the people (analysts from Bank of America, Fitch, Wood & Co., Renaissance Capital and BCS Global Markets) who are forecasting an increase of Russian oil production? https://www.nasdaq.com/articles/russia-plans-to-cut-oil-exports-from-its-western-ports-by-22-in-july-vs-june-schedule-2021
Russian C plus C from data at page linked below
https://minenergo.gov.ru/en/activity/statistic
Trend slope for past 13 months is about 80 kb/d increase each month on average. May 2021 output was 10617 kb/d (using 7.3 barrels per tonne) in May 2020 output was 9531 kb/d, peak was roughly 11247 kb/d for trailing 12 month average in August 2019.
If the trend continues from the past 13 months, Russia would reach its peak annual level of output (11247) in about 8 months. My expectation is output will flatten at around 550 to 560 million tonnes per year, the May rate of C plus C output was about 521.6 million tonnes per year and the rate of increase has been at an annual rate of 48 million tonnes per year over the past 13 months.
https://www.google.com/amp/s/mobile.reuters.com/article/amp/idUSKCN2E41O4
Russia struggles to raise oil output despite price rally – sources
Lack of correlation between output and price means field has peaked.
Oxford Institute for Energy Sudies has a good paper on Russia from Sept 2019, linked below
https://www.oxfordenergy.org/wpcms/wp-content/uploads/2019/09/The-Future-of-Russian-Oil-Production-in-the-Short-Medium-and-Long-Term-Insight-57.pdf
At the end of the paper they conclude with this:
Overall, then, it would seem that Russia does have the opportunity to meet the Russian Energy Minister’s target to keep oil output over 11 mb/dfor the next decade. Indeed, if the country’s import substitution strategy is a success then it could even exceed the target, as there is little doubt that the resources are in place. A combination of performance enhancement at existing fields, exploitation of EOR techniques and hard-to-recover reserves, plus some efforts to maintain offshore oil output should be enough to meet the overall goal. Perhaps the more interesting question, though, is what could happen if sanctions are lifted. At that point, the potential of all these resources could be released rapidly, leading to a surge inoutput towards 12 mb/dor above.
The last figure from the paper is reproduced below:
It looks like the entire growth hinges on EOR and shale. EOR is somewhat of a shell game- you’re re injecting co2 you already extracted- and the Russian government insists it will never frack.
https://www.aogr.com/magazine/editors-choice/industrial-co2-supply-crucial-for-eor
Just as a example you need 1 Ton co2 to obtain 2 tons oil using EOR.
Are you aware that the maintenance of oil production is due to the implementation of ”hard to recover oil” and EOR (Enhanced Oil Recovery)? Hard to recover oil means fracking on the eastern side of Ural. Sure, with the Siberian climate, it is going to be as easy as in the Permian fields. Even the analysts who worked for the shift project last report don’t believe in that. And what are the Russians doing now if not enhanced oil recovery from West Siberian oil fields? And, by the way, you didn’t answer about the decrease of oil exports. And, this is a fact.
Exports are decreasing because EROI is worse. Population growth, worsening eroi and sanctions will reduce living standards even if production increases.
Exports decreasing are due to high inflation. Holding supply back keeps their internal price of gasoline and diesel down. Russia’s central bank has also jacked interest rate to fight inflation. High prices at the pump reduce living standards. To me this means they aren’t able to just produce more oil to keep internal prices down. They are at or slightly past peak.
The question that should be asked is how long before their exports go to zero? Do they have 10 years?
Exports may be completely gone by 2030, however, even a third of oil trade disappearing in the next two years will be devastating and cause wars on every continent.
According to the analysts who worked on the data of the Shift Project, the oil production of Russia will decrease of 29% by 2030. And they included despite their skepticism the exploitation of the Bhazenov formation in their oil production forecasts.
Funny, this chart from the same PDF file has Russian production peaking in 2021.
Ron.
Here is an article about mining in Ugra.
Western Siberia = Ugra (65%) other Vankorskoe, Verkhnechonskoe, Talakanskoe and a few more (35%).
https://www.crru.ru/eng_dobicha.html
More detailed work on mining in western Siberia. True in Russian, but a lot of diagrams: https: //vygon.consulting/upload/iblock/da4/vygon_consulting_western_siberia_oil_production_reboot.pdf
Alexander,
What do you think of the conclusion of the Oxford Institute for Energy Studies paper? Seems you may think it is too optimistic.
Dennis: Yes, I think so. The Oxford Institute for Energy Research article is not based on first-hand information (of course, it is secret), but on official public reports, this can distort the truth in any direction. There have been no grandiose discoveries in recent years. Statements of industry officials and top managers of companies are political in nature. In any case, practice is a criterion of truth. We will have to wait five years. I think the decline in production by an average of 2% per year (from the level of 2019) will continue for the next 5-8 years, then the decline will accelerate.
In addition, I will add that there are reports about the great potential of the Bazhenov Formation. I agree with many familiar geologists, this has no confirmation. In most cases, the productive layers lie twice as deep as their counterparts in the United States, I can’t say anything about the density , but the fact is that the thickness of the productive layer in the Bazhenov Formation is several times less than, for example, in the Permian Basin. Development prospects are shrouded in darkness …
Thanks Alexander,
So the potential for EOR, hard to recover resources, and arctic oil are all negligible in your view, it seems. I agree the tight oil prospects for Russia seem unlikely, does your viewpoint on Russian future oil output change if the Brent oil price is over $100/bo in 2021 US$ for the 2023-2030 period?
I think the decline rate will be 4% and not 2% to begin with and accelerate with time . The Russian fields were overworked / mismanaged by the Soviet regime and were revived /reworked . All engineering takes its toll plus they are at the ” end of life” with EOR methods . Just my opinion . As to Bazhenov shale it will never be devolped . USA got lucky with shale because the infra ( roads, electricity , manpower , finance ) pre existed to kickstart it . 16 wheelers don’t run in slush . All vanity projects will stop from now , just not enough surplus energy to implement them . No exceptions ,even the Chinese ” One Road ,One link ” will be abandoned . Only the link to the Pakistan port of Gwadhar will be done as that will give them access to Iran .
I believe that the potential for increasing production is insignificant and only on the Arctic shelf, although it is shallow, but the technology has not been worked out. Pack ice is 1-2 meters thick. In Norway, the Gulf Stream. There is almost no ice. If they begin to develop the Arctic shelf, they will simply slow down the fall, because 80% of it is discovered there, gas, not oil.
“All vanity projects will stop from now, just not enough surplus energy to implement them.”
—
Well, something will be implemented. Vostok oil is several fields of which Vankorskoye has been operating since 2009, about 500 thousand barrels a day of low-sulfur oil is transferred to the Transneft pipeline, where it is mixed with high-sulfur oil and loses in price. There will still be discoveries. The project is being implemented. But I doubt the declared value estimates (2 million barrels per day).
The Vostok project is insignificant, the reserves of the individual fields nowhere near add up to the 50 billion claimed.
Russia grew only 1% from 2016 to 2019, and every forecast is negative.
Ron,
Yes that chart assumes little or no oil will come from EOR or hard to recover oil. It is a bit like the assumption many of us made in 2012 or 2013 that tight oil wouldn’t make any difference, the resource could not expand that quickly. The authors conclude with what I posted based on all the information they have and their expert judgement in Sept 2019.
However, Dennis, I thought you realized that Russia has had a rude awakening in the last two years. Their old Western Siberian fields have hit a brick wall. Or perhaps I should say they have hit a water wall. That’s the blue part of the bars in the chart above. They expected them to drop, as shown in the chart. But they are dropping much faster than they expected. So an article and charts from 2019 is woefully out of date.
I completely demolished the Russian arctic projects here https://peakoil.com/forums/post1472976.html#p1472976
For some context for Mark’s claim
see
https://peakoil.com/forums/russian-peak-t69531-100.html?sid=d649474d9a67ba66082c6ec15477eaf2
Ron
From the article we previously discussed.
The amount of oil that can be produced from an additional infill well is decreasing. Between 2008 and 2019, the average additional production from a new Russian well dropped by about 13%. For the western Siberian brownfields this drop was substantially larger, at 49%. Russian oil production will plateau, and subsequently decrease,
It’s over!
Trouble in Alaska? Massive oil pipeline is threatened by thawing permafrost”
The Trans-Alaska Pipeline, one of the world’s largest oil pipelines, could be in danger.
Thawing permafrost threatens to undermine the supports holding up an elevated section of the pipeline, jeopardizing its structural integrity and raising the potential of an oil spill in a delicate and remote landscape.
The slope of permafrost where an 810-foot section of the pipeline is secured has started to shift as it thaws, causing several of the braces holding up the pipeline to twist and bend.
This appears to be the first instance that pipeline supports have been damaged by “slope creep” caused by thawing permafrost, records and interviews with officials involved with managing the pipeline show.
In response, the Alaska Department of Natural Resources has approved the use of about 100 thermosyphons — tubes that suck heat out of permafrost — to keep the frozen slope in place and prevent further damage to the pipeline’s support structure.
“The proposed project is integral to the protection of the pipeline,” according to the department’s November 2020 analysis.
While the use of these tubes is common along the pipeline’s expanse, available records show that they have never been previously used as a defensive safeguard once a slope has begun to slide.
“This is a wake-up call,” said Carl Weimer, a special projects adviser for Pipeline Safety Trust, a nonprofit watchdog organization based in Bellingham, Washington. “The implications of this speak to the pipeline’s integrity and the effect climate change is having on pipeline safety in general.”
Permafrost is ground that has remained completely frozen for at least two years straight and is found beneath nearly 85 percent of Alaska. In the last few decades, permafrost temperatures there have warmed as much as 3.5 degrees Fahrenheit.
The state’s average temperature is projected to increase 2 to 4 degrees more by the middle of the century, and a study published in the journal Nature Climate Change projects that with every 2 degree increase in temperature, 1.5 million square miles of permafrost could be lost to thawing.
In seeking permission in February 2020 to install the thermosyphons on the slope northwest of Fairbanks near the Dalton Highway in the central part of the state, the Alyeska Pipeline Service Co., which operates the pipeline, confirmed that thawing permafrost posed a threat.
“The purpose of this project is to protect the integrity of the Trans-Alaska Pipeline (mainline) from permafrost degradation,” according to the company’s application.
Michelle Egan, a spokeswoman for Alyeska, an association of oil companies that includes a subsidiary of Hilcorp Energy Co., as well as ConocoPhillips and ExxonMobil, declined to talk about the condition of the weakened section of pipe or the extent of permafrost thawing.
Egan said that “permafrost changes were anticipated during the original design” of the 800-mile pipeline, which opened in 1977 and runs from Prudhoe Bay in the north to Valdez on Prince William Sound in the south.
There are about 124,000 thermosyphons arrayed along the path of the pipeline — a nod from its engineers to the importance of keeping the ground below it frozen. The tubes are bored from 15 to 70 feet into the permafrost in areas where warming might cause it to thaw. But those chillers only cool the permafrost directly below the pipeline, which holds the supports.
The new project, in which Alyeska is installing about 100 free-standing thermosyphons 40 to 60 feet into the ground, is required to keep a broader slope from collapsing or sliding and damaging the supports.
Construction began last month and is expected to take 120 days and will also include a three-foot layer of insulating wood chips atop the permafrost.
I guess if USA production is going to increase, I would like to read some commentary on the availability of labor to get that done. We have been waiting on a rig for weeks here.
Part of the reason the shale boom got going was there was a lot of labor coming out of the GFC. Recall all the people who went to North Dakota and Texas in order to make some money that could not be made at home.
Is there enough labor in Texas, New Mexico, etc?
Shallow sand,
Is it possible to offer more money to get a rig? If I were a rig operator with plently of people clamoring to get me to their site, I would raise my rates. For those that can’t find labor, I would think they would offer higher wages to attract workers, then pass on the higher costs to customers.
My recollection was that the pay was pretty good for those willing to move to North Dakota, in Texas I imagine there were a lot of experienced oil industry workers for the boom there, but LTO survivor or Rasputin can comment on labor in their areas when tight oil booms have occurred, I am speculating. Though I think I read pieces about the boom in Bakken, I assume it was true, I was not there to verify.
Dennis.
If I offered you $100 an hour could you come operate a rig for me? Of course you could not, because you have no experience doing it.
That is one problem.
Another problem is there are no unskilled hands either, and I do not see how that will change. Local factories here are hiring convicted felons, paying $20 plus an hour, with full benefits after a 90 day probationary period and they are still way understaffed. Fast food has closed, cut hours and/or stayed drive thru only. Wal-Mart has cut hours.
Heck, they are even having trouble keeping the local golf course mowed. Offering $12 an hour, have to be 16 years old. Wanted to hire five, only two takers. So golfers are getting on the mowers some in their spare time.
Finally, every young person has been repeatedly told oil & gas is a dying industry. So it is not like they are clamoring to join the ranks.
We have never seen anything like this. Maybe we are an outlier and there is plenty of labor in the Permian Basin? Maybe LTO survivor or somebody else in the Permian could comment on that?
Shallow sand,
Yes I would not be worth $100/hr. It does’t happen overnight, but often when there is a labor shortage, wages rise and sometimes that will attract people to move to places where the economy is short on workers.
I suppose if there was an answer to the problem, you would have solved it.
Obviously they will just train workers and the labor is easy to find in all but very temporary circumstances.
Hi Mark
You need to trust SS and me on this one. Uh, no.
There is a reason that, at my age, I single hand a rig that I built for shallow well work, L/T 3,500 ft. Takes me a while but…..
So all these rig operator postings asking for 3 YOE are fake? I’m not saying there’s no training, I’m just saying that they can move people from lower skilled jobs and then hire more. There’s about 1,000 rigs to operate out of 400,000 employees.
Yes, we have people doing that here to, which IMO is not good no matter how safe you try to be.
We have one contract puller who is stacked because his hand had to have surgery after a 4 wheeler accident. He had one replacement who showed up for one day, didn’t come back. So his wife got to help him run the well back in, I think her first time working on the rig. Now he’s stacked until his hand comes back.
Again, many wells that were shut in during COVID crash are still idle, waiting on a rig. There are under ten active workover rigs running here, which is remarkable for a field with thousands of wells.
As unemployment benefits expire we are hopeful that more will return to the field. But I have been reading that hasn’t made much of a difference.
Maybe if prices get to be like 2011-14, there will be even higher pay offered and more will seek oilfield work. It does seem different this time, but hard to predict the future.
Think of it this way, if you have kids or grandkids, would you be encouraging them towards a career in the oil & gas industry?
Strange that Americans think that convicted felons should never work again.
https://www.columbian.com/news/2021/jul/12/pandemic-caused-many-boomers-to-retire-what-that-means-for-the-economy-and-everyone-else/
In producing nations like the USA, the most likely scenario in the post-peak production period is classic shortage of good/rise in price, and the vast majority of people will not have gone electric with their transport yet.
If it happens fast, it will be an economic shock. If it happens slow it will more along the lines of a a very bad meal with prolonged loss of appetite, at first. There will be pain for certain sectors either way, its a matter of degree.
Which sectors of the economy will be first to become uneconomic because of higher petrol prices?
Which sectors of the population will be first to lose ability to afford fuel, or to lose jobs?
Should government support producers, or subsidize fuel purchasing?
And if so to support which sectors?
Some answers are simple- leisure travel will undergo sharp restriction of supply whereas manufacturing and food sectors will be last to lose fuel (because the cost of rising fuel will be adsorbed by these essential sectors longer since the price will be passed on to the consumer). It is a recipe for inflation (at first), and lower economic growth at the same time.
And what of other countries who are big importers. There are some big economies with oversized geopolitical impact that will face much quicker economic challenge, such as Germany, China, Korea.
The repercussions of oil shortfall will be huge. The chaos of a fast decline is unpredictable. A slower decline will have some economic effects that are predictable, such much higher prices for oil and nat gas, and a mad scramble for battery manufacturing capacity. Battery shortage, and likely photovoltaic shortage may become severe.
There are going to be a lot of very big questions that will need to be answered. So far, this country has tried hard to avoid the issue, as if the great advantages and abundance we have had will go on forever.
Well opined post Hickory.
The Hubbert Curve
Okay, I am going to say just one thing about the Hubbert Curve and say no more. I will not reply to any replies to this post.
I think the Hubbert Curve worked okay for conventional fields with conventional wells. However, most new fields are not conventional. We have shale fields, tar sands, deep sea, and whatever. Also, most infill wells are not conventional vertical wells, they are horizontal wells that cream the top of the reservoir. So for unconventional reservoirs and unconventional wells, the Hubbert Curve is not worth a bucket of warm spit.
And that is all I have to say on the subject.
But it’s also physically impossible for shale production to grow anyway so the hubbert curve has to be right.
A shape similar to the derivative of an S-shaped (sigmoid) curve has to be right. No one denies that, so perhaps what you have been meaning to say its a roughly bell-shaped curve instead of a Hubbert curve. The latter has specific properties which may or may match reality.
“In general, a sigmoid function is monotonic, and has a first derivative which is bell shaped”
https://en.wikipedia.org/wiki/Sigmoid_function
Ok, sure. The hubbert curve is wrong for wells because it predicts accelerating decline, but it’s correct for fields.
Fields accelerate down and not S curve.
https://www.researchgate.net/figure/The-decline-rate-of-the-worlds-giant-oilfields-The-trend-toward-an-increasing-average_fig10_46496655
Mark,
Look at the production forecast from that paper. In 2020 the expected World output was 40 Mb/d and 30 Mb/d in 2025. A pretty big miss it seems. There is little evidence that production weighted average decline rates are accelerating, imo.
Obviously only the Unweighted will decline until its disastrous.
World light onshore conventional production has fallen 20% since 2005 which is about half the base decline rate. Meaning world production minus Brazil, UAE, FSR, China and Angola. If we include those countries it’s probably the same as their forecast.
Mark said: “Fields accelerate down and not S curve.”
An S-curve is any cumulative curve that has roughly the shape of an S, which includes any curve charting out the depletion of a finite & nonrenewable resource.
I really don’t know what you are arguing over.
Ok fine, if it’s all the same result then we’re good.
One thing that I should bring up that will absolutely effect oil price over next 5-10 years. Over in Europe the ECB Europe’s central bank will be buying the debt that is required to buildout renewable energy. Don’t matter if the sun don’t really shine or wind don’t really blow in some of these countries. I’m thinking price tag will be $10-$20 Trillion. Over about a 10 year period to buildout all of Europe. Even if they say it will cost less it won’t
This will push US dollar up. A lot! And anything valued in dollars down in price. Because value is being transferred from the Euro to the dollar not from the Euro to price of oil.
Just something I think everyone should be aware of.
HHH , $ 10 -20 trillion ??? All talk . Not going to happen . Relax . Printing to infinity cannot work .
hole in head Wrote:
“Relax . Printing to infinity cannot work .”
That never stops gov’ts from trying!
Techguy ,
We know they are lying, they know they are lying, they know we know they are lying, we know they know we know they are lying, but they are still lying.” – Aleksandr Solzhenitsyn
I agree with you .
“This will push US dollar up. A lot! And anything valued in dollars down in price.”
Not so sure about that since the US wants to do the same thing. Yellen keeps on yelling about spending Trillions on renewables. That will probably take off in 2022 when the DNC takes control of the Senate. US is also currently printing a lot of money. Purchasing power of the Dollar has lost about 40% since 2000 and will continue to devalue. It does not matter if the dollar loses less than other nations, the issue is that it continue to lose every year.
On my Radar is the possibility of soaring food prices in 2022 as the US Is going to declare a Tier 1 water emergency which is going to cut off water for a lot of farms & ranchers. Plus the US Midwest has drought problems this year. Food inflation will likely accelerate inflation, regardless of gov’t policies.
Price of Ribeye steak was $18.05 per LBS in my neck of the woods this week. And we aren’t talking the highest grade highest quality meat. Pandemic high price was about $14.99 per LBS. Two years ago regular price $9.99 per LBS.
On the other hand price of coal is high now. Coal producers should have no problem making money. But all else equal. Unless we lots more stimulus these prices including price of oil aren’t sustainable.
But I do agree for now food prices will continue higher. But watch out for weak economic data as economy rolls over. The FED put isn’t going to mean very much. Mr. market will laugh at it’s $120 billion in monthly QE and sell off anyway.
I think a loss in faith in our elected and non-elected officials is coming. And a sell everything moment comes with it.
Ovi,
Do an article on how much the crude plus condensate measure has inflated growth. Without condensate oil production has barely grown since 2012, especially outside America.
Mark
You appear to have vast knowledge and great insight in what’s happening in world oil production, the Hubbert curve, water flood and fracking, etc. With all of this wealth of knowledge, i think it is time that you took this knowledge and shared your views on where you think world oil production is headed or any other subject that you think would be more insightful.
How do I submit articles? I would love to.
Just ask Dennis to contact you.
Dennis, if you’re reading this, may I please post an article? My email is on my profile.
I could also just start my own forum if people would use it.
Mark,
[email protected].
Mark,
The data source you gave only has crude data 2016 to 2020, this does not really tell us much.
Bottom line, we don’t have good crude only data for the World.
Mark
I checked out the article on depletion drive reservoirs which are gas cap or solution gas drive. Yes the GOR falls, after peaking early on, but only after the oil rate has fallen precipitously. These, per the article, are the worst performing drive mechanisms. One author contradicts himself in that he suggests recovery of 5 to 30% of the OOIP in one place and 25 to 30% in another. Nonetheless, rock properties likely speak to the low end or high end recovery.
Also, I thought about your comment on water drive gas reservoir exploitation. Quite possibly, one could produce the gas fast enough to outrun the water encroachment into the gas filled porosity thus maximizing gas recovery. The problem that I would fear is being totally wrong and wasting a lot of stranded gas. Thanks for the idea but I’m way too risk averse to try.
Yes, water drive is the most efficient reservoir. It does however have the problem of produced water. If water cut is high then you could lose energy on transporting it. A gas drive is trivial, just flare.
Dennis
Thanks for the reply on GORs. The flat curve for the Bakken was interesting and I’ll have to think way back about our GORs up there. It’ll be a few days before I get a chance to review your data and some other that I have.
One consideration in the Williston is the completion of Three Forks HZ wells along with Bakken wells. We had a Three Forks (Sanish) vertical in the Antelope Field that was higher GOR and was close to the old vertical discovery which had a very high EUR. In my opinion, the Three Forks is conventional and the Bakken is not but I think that the data is conflated. Seems like I’ve read that the Antelope area is a sweet spot and the TF is likely the reason.
Thanks Rasputin.
My humble apologies if I ever seem dismissive. My intent when I ask questions is not to imply that you or any oil professional is incorrect, the questions are to clarify my thinking when the data I see leads me to think A, but oil professionals think B.
I started in mechanical engineering but switched to physics midway through my undergraduate degree, got a double bachelors in physics and economics then later a masters in economics, so I know some thermo and fluid mechanics, and the usual machine design, strength of materials, that an ME would know, though it has been a long time.
There has been some discussion of well spacing in earlier threads.
I had read that for the Permian 1000 foot to 1320 foot spacing between laterals was optimal. LTO survivor mentioned that 4 wells per mile was optimal, I asked for clarification that this meant lateral spacing of 5280/4=1320 foot spacing between laterals, just to make sure I understood correctly. No answer though.
How would you interpret a comment that 4 wells per mile is optimal.
Article linked below was the basis for my thinking, especially the second chart in the article.
https://jpt.spe.org/how-close-too-close-well-spacing-decisions-come-risks
No doubt you would have better insight than me. LTO said the article was wrong and told me 4 wells per mile was optimal in Permian.
Dennis
I apologize if I implied that you were the one to dismiss my challenges or inducements, if you will. There are many folks here that have a lot to say and their engagement was solicited for the good as well. Quite honestly, I am not an expert such as an engineer working in R&D for Exxon or the like. What I offer is general engineering approaches flavored by experience which is miniscule when compared to Mike, SS and myriad others. There must be some real out-of-the-box thinkers at Big Oil E&P who could lend so much here.
Thank you for expounding on your resume. Now I know that you can see that rock and physics matter as well as geopolitical, financial, logistical, pandemic and you name it issues matter in the big picture. In the very beginning of any one of these plays the tangible may not have reflected in the results as much as the intangible. But obviously, as is now evident, the tangible should have been considered more in the upstream than simply ROI, cash flow and magic EURs. In one sentence and in my opinion, these near zero perm reservoirs are a brave new world.
As to LTO HZ well spacing, I do not have the expertise to make any claims there. My insights on interference were qualitative in nature not quantitative. There is much evidence by play and by specific wells/completion techniques of what minimal spacing should be avoided. That backs drillers into the optimum spacing and recovery by default.
There are only a few hundred rig operators in the world, and they would know what the optimal spacing is. Everybody else is just following directions.
Even among those operators it’s just “go build a well here”, there’s a few dozen managers deciding the spacing.
And of those only a few operate in areas where spacing matters, a lot are wildcatters or whatever. So basically you can’t just ask around for the spacing, you have to use common sense like it can’t overlap.
Dennis
I am sorry to have not answered your question more fully. The article is a decent explanation. So much depends on the timing of the Child wells being drilled after the Parents well’s date of initial production, the price of oil and the cost per 1000 feet of later drilled, thickness of reservoir, properties of the rock itself ie…qualitative porosity ( oil accommodation space) and many other factors including frac vintage.
Based on all of this information, a cost allocation model is constructed and we test number of wells per section on an NPV basis. In many instances, we saw that we could drill more wells than 4 per section and see a total NPV increase in absolute terms but the IRR and MOIC ( multiple on invested capital) went way down on a per well basis making the incremental wells less valuable and more risky. However; this is model exercise is also highly dependent on the Price of the product as well as the D&C costs. For example if oil prices rose to $100 per barrel and the D&C / expected operating costs were held constant, then you may see increased IRRs and MOIC with an ever decreasing EURs per well. Our models were run at strip price deck pricing using actual costs. That being said, it is way more valuable and cost effective to do the infill development at one point in time ( multi- well pads) because coming back and drilling these wells one by one after initial production sees diminished pressure and much less IP per well
If we do indeed see $100 oil and flat costs, then we would have left a lot of incremental oil in the ground having drill only 4 wells per bench per section. Companies with the most Undrilled acreage remaining may indeed drill more than 4 per section but only if Prices rise to a higher level (high enough to hedge the per well returns until payout) and costs remain somewhat flat.
in our models were are seeing 70% IRRs per well and a 1.85 MOIC on a 4 well development scenario. It is our hard line to not drill a well with less than 1.75 MOIC which usually equates with IRRs above 50%.
Based on our machine learning and AI we have been able to accurately predict ( within 10%) the performance of Child wells and it is our belief that the more wells per section per bench, the less oil per well on infill development. As in any exercise of this nature a few outlier wells performed much better than predicted and some much worse. Those were the head scratchers and caused us heartburn but really speaks to the issue of very complex fracture systems being developed by the completions and not in a perfect oval like pattern. It also indicates significant heterogeneity within the unconventional rock and the complex nature of these reservoirs. In some of our benches you could see conventional sands intermingled in the shale directly offsetting another well in the same bench that doesn’t possess any conventional sands in the pay column whatsoever. If these zones were entirely homogenous across a large area then predicting returns, frack length, EURs, and well performance would be far more simple.
I believe that the Shale community was learning as they were drilling and all sorts of issues came up and surprised many of us who were used to conventional reservoirs. It’s a shame so much money was lit on fire using conventional-like completion methods in a very unconventional rock. I believe more will be learned and I know companies like Oxy and EOG are working hard to develop secondary recovery methods for the next phase of recovering the vast oil resource left behind due to our best guess practices based on prior conventional practices.
What were the lateral length and benches on those four wells, how was it physically possible for them to not overlap?
Also, most wells are spudders or something irrelevant. 4 wells is one or two real wells.
LTO Survivor
Thank you so much for this long awaited comment. I so wanted to address reservoir rock heterogeneity but didn’t. The thought has often occurred to me that the USGS or whoever makes the resources assessments considers the rock homogeneous due to lack of understanding and actual data. That omission, by necessity, is a serious consideration.
Folks who have not enjoyed the experiences, namely heartburn and expense, of either channeled good rock or layered, lenticular rock of limited aerial extent, might assume the 6th grade model of a dome with oil over gas over water with a straw in it draining the goodies as a true representation. All is fun when the channels are in flush production but the trouble comes later. The next round of service and supply companies to make tons of money from these plays are the guys that come up with the right polymers or conformance modifiers to make effectively sweeping these rocks possible.
Thanks again. I knew there was somebody out there who knew what they were talking about and speak up.
We have taken a ton of sidewall core data and it’s truly amazing the difference we are seeing well to well in such a short distance. I think you are right. I have always said that (AM applied materials) will be the next iteration in coaxing out more oil. Imbition may be one of the ways to coax out more oil. Perhaps filling a depleted Wellbore /reservoir full of water and surfactants followed pumping it all back out dragging the oil with it.
Perhaps filling a depleted Wellbore /reservoir full of water and surfactants followed pumping it all back out dragging the oil with it.
LTO survivor, please help me out here. There was no smiley face after that quote. That confused me. Is that statement a joke or are you serious? Understand, I am totally ignorant of shale oilfield techniques.
LTO survivor,
Thank you. I know you must think I am joking, but I am not, when you say 4 wells per section, you mean the distance between laterals is about 1320 feet, I think. So if the average lateral length was about 8500 feet we would have about 258 acres per well. Am I in the ballpark?
Yes because you don’t know what a spudder is.
Oil Market Report – July 2021
Following two consecutive months of decline, global oil demand surged by an estimated 3.2 mb/d to 96.8 mb/d in June.
Our current balances suggest 3Q21 could see the largest crude oil stock draw in at least a decade.
Something different from a book titled: “The Secret of Sherwood Forest: Oil Production in England During World War II” by Guy Woodward and Grace Steele Woodward. This was published in 1973, and tells the story of American oil men who went to England to bore wells on a secret mission in March, 1943.
So, almost 80 years ago, a Band of Roughnecks went abroad on a top-secret mission into Robin Hood’s stomping grounds to punch oil wells to help fuel England’s war machines. It’s a story that should make any oilman proud.
The year was 1943 and England was mired in World War II. U-boats attacked supply vessels, choking off desperately needed supplies to the island nation. But oil was the commodity they needed most the in the war with Germany. England had but one oil field, in Sherwood Forest of all places. Its meager output of 300 barrels a day was a drop in the bucket of their requirement of 150,000 barrels a day.
A top-secret plan was devised: send some Americans and their expertise to assist in developing the field. Oklahoma based Noble Drilling Company, along with Fain-Porter, signed a one-year contract to drill 100 wells for England, merely for costs and expenses.
Forty-two roughnecks from Texas and Oklahoma, most in their teens and early twenties, volunteered for the mission. The men embarked for England in March 1943 aboard the HMS Queen Elizabeth. Four National 50 drilling rigs were loaded onto ships but only three of them made landfall; U-boats sank one of the ships en-route to the UK.
Jaws dropped as the Yanks began punching the wells in — one week compared to five to eight weeks for their British counterparts. They worked 12-hour tours, 7 days a week and within a year, the Americans had drilled 106 wells and England oil production shot up from 300 barrels a day to over 300,000.
The contract fulfilled, the oilmen departed England in late March 1944. But only 41 hands were on board the return voyage. Herman Douthit, a Texan derrick-hand was killed during the operation. He was laid to rest with full military honors and remains the only civilian to be buried at The American Military Cemetery in Cambridge.
Thanks Doug,
Great to have you back.
Great anecdote.
Here’s another one to ponder. Which USA military regiment had the all-time highest casualty rate?
I heard this on the radio, and Wikipedia backs it up — it’s the 1st Minnesota Volunteer Infantry during the Battle of Gettysburg — 82% killed in one day. The reason it caught my ear as the claim on the radio was that Minnesota saved the Union. And so I find that President Coolidge reportedly said: “Colonel Colvill and those eight companies of the First Minnesota are entitled to rank as the saviors of their country”.
https://en.wikipedia.org/wiki/Surviving_American_units_with_the_highest_percentage_of_casualties_per_conflict
According to the latest DPR, the Permian is adding on average close to 50 kb/d/mth and at this rate will over take the March 2020 peak in December.
123 DUCs were completed in June. Four new wells were drilled and three completed. Looks like it is all about DUCs and getting your cash now since WTI crossed $75/bbl today.
Thanks Ovi,
That seems pretty optimistic, I recently redid my Permian scenario with a limit on completions of 460 per month (this was about the average completion rate in 2018 and 2019) in the previous scenario the maximum completion rate was 624 new wells per month. The peak ends up being about 5050 kb/d in 2027/2028 about 600 kb/d higher than the March 2020 peak (4431 kb/d). Note chart is mislabelled for peak EIA data, I picked the second highest data point in error, just noticed this mistake on my part, sorry.
Difference between peaks is conventional oil included in Permian region for DPR data (about 270 kb/d in March 2020).
Dennis
The DPR states that 123 DUCs were completed and and 4 new wells were drilled and three were completed. There is quite gap between 126 wells completed and the 460 used in your model. Maybe the DPR data is misleading with just four wells drilled while Baker Hughes says there are are 237 rigs operating in the Permian.
The model is showing essentially no production increase in 2021, whereas the DPR is showing an increase. Any idea on the reason for the discrepancy?
The peak I show for the LTO Permian is 4,223 kb/d. This total is from Sprayberry, Wolfcamp and Bonespring. To get to 4,343 kb/d, I have to add in Austin Chalk. The LTO spreadsheet does not contain the word Permian within the brackets for Austin Chalk. Should the Austin Chalk be considered to be part of the Permian?
Ovi, the LTO Permian is somewhat misleading, there are a bunch of fields in New Mexico it drops. The DPR Permian is comprehensive.
DPR also includes conventional output from the region, says so right in the report.
See page 3 of document linked below
https://www.eia.gov/petroleum/drilling/pdf/dpr_methodology.pdf
Although five of the seven DPR Regions are identified by the geologic formation that produces the greatest volume of oil and natural gas within that region (the Permian Region encompasses the Permian Basin, which includes a number of individual formations which produce oil and natural gas), all of these Regions include other geologic formations that also produce oil and natural gas. Some of these other formations have produced oil and gas for many decades and will continue to do so into the foreseeable future. Thus the data used by the DPR, along with the DPR estimates of current and future oil and gas production for all seven Regions, include not only the production from the “headline” formation (e.g., Bakken), but also the production coming any other formations within that region.
Pretty sure tight output has the same problem. Very similar number besides the New Mexico.
Ovi,
No Austin Chalk in in the same vicinity as the Eagle Ford, but a separate formation. The reason for the difference is that the DPR includes all oil produced in the Permian region (both tight oil and conventional oil). Also the EIA data may leave some formations out of its Permian totals, if you compare shale profile date with EIA official tight oil estimates you will find EIA is smaller. The data at shaleprofile is probably most accurate imo. For March 2020 shaleprofile has Permian at 4432 kb/d and EIA at 4223 kb/d. For recent data shaleprofile is a bit less than EIA as it uses RRC data which gets revised over several months before becoming fully accurate, the same may be true in New Mexico, I am less familar with the New Mexico data. The December 2020 shaleprofile estimate is higher than EIA, bet in Jan 2021 and later shale profile is slightly lower than EIA, my guess is that over time the shale profile data will be revised higher than EIA, but probably never reach the level of the Permian DPR.
I realize now I must have used shale profile data instead of EIA data for that peak, that is where the 4332 number comes from, if I said something different it may be from and earlier shaleprofile Permian blog post and has not been updated. Yes the EIA peak is 4223 kb/d. Sorry for confusion, my “data” should say shaleprofile + EIA data, I think I use shale profile until EIA data becomes larger (in Jan 2021) and than use EIA data from Jan 2021 to May 2021, There is not a big difference between the two data sets from Sept 2020 to March 2021.
Dennis, I emailed you my proposed article, please edit as you wish.
Dennis,
I think this is a reasonable attempt to predict but much depends on the tails of these wells and the break even of later life production, price, and costs. Many people believe that the tail production is declines exponentially as opposed to hyperbolic and many wells will be plugged making 25 bopd due to the higher operating costs of lateral wells. Personally I am very concerned about the hydrostatic pressure in the later life of these wells. The 500 feet of curve can not be rod pumped effectively today and you may not have enough oil volume per day to pay the much higher costs of submersible pumps. We will have to see what the price is and perhaps we may see another peak before we run out of suitable drilling locations but I am not as confident about this as your model suggests. Keep in mind that from this point forward each new well per bench will yield less oil. That being said, there are still some benches that based on the lower prices have not been developed due to inferior economics. Those benches will become more viable if prices continue to rise.
In physical terms the produced water disposal is the vast majority of operating cost of a well. But, you’re just talking about drilling.
https://www.woodmac.com/siteassets/campaigns/Upstream/loe-breakdown-permian-water.png
Doubling of water cut = immediate death
Very true
Mark,
No I am talking about all costs when I estimate OPEX, Mike Shellman has suggested $13/b for average LOE, that’s the basis for my estimate for OPEX. Perhaps LTO survivor has a different estimate.
I have suggested no such thing. I have simply pointed out that 8 BOPD divided by $14K a month of fixed OPEX costs equates to an incremental lift cost per BO over current oil prices and therefore cannot equal anywhere close to an economic limit and that its a really dumb way of making yet another meaningless model.
You are not trying to “learn” anything; nobody buys that shit anymore. You don’t listen, not even to people who work IN the oil business out of a checkbook. You are simply looking for relevance, to make a name for yourself, in an industry that you know NOTHING about.
Mike,
Thanks mike.
I thought you had suggested $13/b in the past for Permian average LOE at oily stuff, perhaps I remembered incorrectly. I include revenue for associated natural gas and NGL that is extracted from that gas in my model, as I have explained many times. The OPEX is not fixed it is low (in cost per barrel of oil produced) when the well starts flowing (about $10/bo) and increases to $66/bo by the time the well is producing 8 bo/d. The OPEX model is $6.15/bo times barrels of oil produced for a month plus 14000. So at 8 b/d it would be 14000 plus 1476 or 15476 dollars per month or $65.69/d.
net barrels oil= 172 times 70 =12040, 1699 MCF NG times 2=3398, 143 b NGL times 16.25=2324,
total rev=12040 plus 3398 plus 2324= 17762 monthly revenue,
net rev=17762 minus 15476 = 2286 or 2286/240= $9.5/ barrel oil produced.
I have run the model using an assumed shut in of 20 bo/d as I am probably missing something. The NGL is based on average NGL per thousnad feet of natural gas produced in New Mexico and Texas, although this amount has increased over the 2011 to 2019 period from 47 b NGL per MMCF natural gas in 2011 to 83 b NGL per MMCF natural gas in 2019. I have assumed it remains constant after 2019 (though 2020 increased to 90)
The land cost is roughly equal to the well cost now. But Dennis ignores land cost completely.
LTO survivor
I know LOE for shale wells varies quite a bit, but can you give readers here some cost data for operating a Permian shale well that is 5+ years old?
What is a standard pumping charge, electric, chemicals, etc?
Seems to me that having to pull a submersible would greatly hurt the economics of a low volume horizontal well. I didn’t realize these couldn’t be rod pumped. I had just assumed the well bore would eventually fill up with enough fluid that they could be rod pumped a few hours every so often. I know Mike has mentioned this issue too.
Also, given that everyone seemed to want to set “land speed” records on getting the well bore drilled as fast as possible, are there what I call “crooked holes” out there? Or is the tech on the new rigs so good that there aren’t those issues?
Great questions shallow sand. I had assumed these wells were drilled toe up so the oil flows back up the bend so they can be rod pumped. If we look at older Bakken wells from 2005 there are a bunch of wells that are at 10 b/d or less (look at wells by month of first flow for 2005 wells). Focus on November 2005 wells (only 10 wells, but at 8 bo/d at 187 months). My model assume the wells are shut in at 8 bo/d which may be unrealistic.
Note that I assume $14000 per month for each well is set aside for future downhole maintenance, that would be 500 thousand every 3 years which might cover the occasional pump upgrade etc. I don’t know actual costs to install a submersible pump or how often they need repairs or replacement.
There is nothing “fixed” about lease operating expenses other than administrative overhead, or G&A per incremental BO. $14K per month? An 8 BOPD well in the Permian would net 181 BOPM to the WI/$14,000= $77 per incremental BO, $5/ BO is last, I looked, $82. In this model I see no incremental per BO allocations for interest on long term debt which can run from $2.50 to over $6 per BO. That is not a “fixed” cost either because of revolvers, refinancing, etc.
In the EF, where I have interests, economic limits are closer to 18 BOPD and that is only because we don’t make as much water as the Permian and after year 6 almost everything on rod lift goes to POC and is only run periodically as well bore storage cycles occur, something I discussed, here, five years ago. Pumping rod lift wells at 18 degrees from vertical at the top of a radius is a nightmare and causes untold downhole maintenance problems. 65% of ALL EF wells are now below 25 BOPD and still declining at 10-15% annually.
At $70 I suspect economic limits in the Permian are reached at about 20 BOPD because of water; those cost are set to skyrocket. ALL OPEX is going up, up, and up. There are a lot of reasons operators attempt to get away with producing wells below economic limits, even loan covenants and fake asset to debt ratios; eventually it gets them; lease hold provisions prevent an operator from producing below economic limits.
Proven developed reserves generate revenue, not proven undeveloped and certainly not EURR based on TRR. If those PDP reserves are not replaced with RRR of 100%, incremental lift costs per BO go up and economic limits are reached sooner. The interest meter, for instance, never stops whirling. The two year DUC push that has analysts all in tizzy is about over and what you will see over the next 12-18 months is the ugliness of tight oil decline. Declining PDP equates to less revenue; quite simple, that. Very fundamental. The stuff about self financing because of $70 oil is, well, whatever. So, I will ask once again, where is the money going to come from to finance this miracle of tight oil abundance? $70 does not come close to getting that done.
Dennis.
As an example of Mike’s comment that little is “fixed”, I just looked a some non-operated WI packages for sale. They show 8/8ths of operating costs.
On one, I saw compressor rental was running about $9,000 per month. However, some months it was below $7K, some months over $10K per month. Water disposal was anywhere from $0 to $9K per month. Contract pumping ran from $525-$800 per month. One month had a land damage cleanup charge of over $3,000. One month had engineering consulting services of over $26,000.
Mike absolutely knows what he is talking about. Not only has he operated wells for over 50 years, he lives right in the EFS. He knows the people working in the EFS. He sees what is going on.
I know we try to come up with averages, I do that myself. But the reality is that expenses can vary wildly. Further reality is when looking at company financials, we have no idea how much of these expenses are being thrown into CAPEX.
Upstream is just very risky. Shale is the most risky. Between oil and natural gas price volatility and the myriad of “unexpected” expenses, it is amazing that USA added what it did 2008-2019. It needed a lot of debt to get that done.
Mike,
Yes I realize costs are not fixed. The model uses an average fixed cost per month, the money is put in the bank as a rainy day fund for expenses that are never fixed each month but are lumpy in nature. The model was suggested by someone who claimed he was an experienced petroleum engineer.
A fixed plus variable model accounts for increasing OPEX for older wells.
It is OPEX= variable cost times barrels of output plus fixed cost.
The “fixed cost” number is an estimate to make the model work.
Interest is included in cumulative net revenue, if cumulative net revenue is less than zero (company owes money) then I assume interest is paid on that debt at a 7.5% annual rate, note that for major oil companies this is likely over 2 times the current interest rate (XOM and Chevron likely pay the prime rate of about 3.25%/year). So yes interest is included in my model.
Also note I include revenue for oil, natural gas (at $2/MCF) and NGL (25% of crude price per barrel), it is a 3 stream model. If we assume economic limits are reached at 20 bo/d, the EUR falls from 420 to 390 kb/d, but based on my economic assumptions we leave about 630 thousand dollars (2021 $) of net revenue on the table by shutting down the well at 20 b/d rather than at 8 bo/d.
In any case I can re do my model with assumed shutin at 20 bo/d.
In Eagle Ford, There are wells that started producing in 2008 that are down to 1 bo/d. If we take the average 2013 well completed in Q1 the average output of the 750 wells is 11.4 bo/d at 96 months.
Data from
https://shaleprofile.com/blog/eagle-ford/eagle-ford-update-through-march-2021/
For current model I use $6.15/bo for variable cost and $14000 per well per month for the fixed cost. OPEX curve for the average 2019 Permian well in chart below. Click on chart to make it bigger.
Let me try and help you one last time, Dennis: 8 BOPD is 6 BOPD net to the 100% WI, or 182 BOPM. $14K per month “fixed” OPEX equates to $76.92 per incremental BO. That is above current NYMEX WTI, not Brent! and well below actual gross WH prices in any shale oil basin in the US. $80 is nothing more than speculation and moving goal posts. am not interested in making your model work; it doesn’t. Its flawed. 8 BOPD as an economic limit is wrong.
I am done here. You are helpless. I am unclear why anyone remotely associated the with oil and gas industry would even bother commenting here anymore. Bored I guess. Golf, I’m told, is a nice way to waste time.
Let me try and help you one last time, Dennis: 8 BOPD is 6 BOPD net to the 100% WI, or 182 BOPM. $14K per month “fixed” OPEX equates to $76.92 per incremental BO. That is above current NYMEX WTI, not Brent! and well below actual gross WH prices in any shale oil basin in the US. $80 is nothing more than speculation and moving goal posts. I am not interested in making your model work; it doesn’t. Its flawed. 8 BOPD as an economic limit is wrong.
I am done here. You are helpless. I am unclear why anyone remotely associated the with oil and gas industry would even bother commenting here anymore. Bored I guess. Golf, I’m told, is a nice way to waste time.
Mike,
You are forgetting about Natural gas and NGL. For my model I include all three streams, and yes I deduct royalties and taxes at 28.5 %, so I use 5.72 bo to the WI at $65/bo at wellhead, for a month that is 171.6 bo times 65=11154. Now we add the NG of 1.699MMCF (after deducting R+T) times $2000/ MMCF=$3398, and the NGL of 153 net barrels (after R+T) at $16.25/b for $2486. The total is 11154+3398+2486=17038 dollars.
Then the 14000 is deducted leaving $3038 to pay variable OPEX of $6.15/bo times 240 bo/month=$1476, so net revenue would be $1562. OPEX for the well producing 8 bo/d is $64.24/bo, but the revenue from all 3 streams is $71/bo. That is the basis for an economic limit of 8 bo/d.
Note that I based this on an LOE of $13/bo that you had suggested, though perhaps I did not understand you correctly.
Really just trying to learn something. Sorry you find it frustrating.
For this model the average OPEX over the life of the well is $13/bo.
At this point in time for a 2019 well completed in June we would be in the year 2036 and interest cost would be zero because all debt is paid down by 2024 based on the model assumptions.
Shallow sand,
I agree Mike knows a lot, far more than me. So as I have explained on numerous occasions, when my understanding of what all the oil professionals have taught me leads to conclusion A and then oil pros tell me no that’s wrong it should be B, it leads to questions by me. Obviously the model must be flawed, so I try to figure out where I have gone wrong.
Here are the numbers fo my 8 bo/d (240 bo/month well). It also produces 2376 MCF/month of natural gas and from that natural gas about 214 barrels of NGL can be extracted. I assume for this low level of output that OPEX is $64.24/bo (crude plus condensate only), wellhead crude price is $65/bo, natural gas sells for $2/MCF at wellhead and NGL sells for $16.25/b. Royalty and taxes are assumed to be 28.5%. I get net revenue more than zero for these numbers. Maybe you can explain what I am missing.
Gross revenue=240*65 2376*2 214*16.25=oil rev gas rev NGL rev=23829.5
Royalty Tax=28.5% of gross revenue=6791.4
OPEX=64.24*240barrels crude=15417.6
net revenue=gross-(royalty tax)-OPEX=23829.5-22209=1620.5.
Feel free to correct any errors.
Dennis,
I even gave a breakdown of operating costs and you ignored it. Produced water alone will kill the output of most wells. Permain wells are only profitable for a few months of their twenty year life.
Mark,
Looking for information from professionals, based on your history I don’t believe your cost estimates. We have discussed your water theories before, no evidence that water cut will suddenly double.
https://shaleprofile.com/blog/permian/permian-update-through-december-2020/
From advanced insights water ratio at blog post above we get chart below, click for bigger chart.
Dennis,
Yes, the water ratio spikes when they start interfering. Which will never happen they will simply not drill.
Can you find any instance where I was ever wrong?
Mark,
Yes. You are consistently wrong.
Shallow sand,
The plus signs diappeared from my earlier comment
https://peakoilbarrel.com/march-non-opec-oil-production-recovers/#comment-721180
Gross revenue=240*65 plus 2376*2 plus 214*16.25=oil rev plus gas rev plus NGL rev=23829.5
Royalty plus Tax=28.5% of gross revenue=6791.4
OPEX=64.24*240barrels crude=15417.6
net revenue=gross rev – (royalty plus tax) – OPEX = 23829.5-22209=1620.5.
Mike wrote:
“$70 does not come close to getting that done.’
What would be a reasonable price required?
Would I be wrong to think we will see Oil breaching $100\bbl in 2021? I presume water is going be a major challenge soon as the drought persists?
Thanks
Shallow, thanks, man. LOT’s of OPEX is getting thrown into CAPEX.
If you have any workover rigs up there not doing anything can you send three down here to me, please? I can keep three busy for a month. Our breakfast tacos are better than y’alls, I am pretty sure, and I’ll even put them up in a motel, with HBO. They’ll just need to be pretty heat resistant.
Dennis, SS, Mike,
I’m throwing this out at the last reply button just because.
As I may have mentioned here or on OSB before, operating Bakken HZ wells of only 3,000 ft laterals 20+ years ago was about a nightmare. We had a foreman in ND who was literally a genius and between the two of us burned a lot of midnight oil trying to operate strippers up there. Both of us were way outside of the box thinkers as well.
Simply put, the biggest problem is trying to produce fluids once the static fluid level drops to the kick off point or slightly into the curve. Back then, low volume subs weren’t around (and the cost to replace as standard sub was astronomical), there was insufficient gas for gas lift and jet pumping was not efficient enough. This challenge is not for the faint of heart or someone that expects flat LOEs every month, like bankers.
The factor running a close second is the separation of the oil. gas and water in the HZ section. Unlike with vertical wells, you must deal with the gas flowing across the stratified liquids jacking with whatever pump you have in the hole. Then there is the snot that is produced with the liquids that must be dealt with. In ND it was quite literally shale solids, which when mixed with water, is snot.
While modern, high tech laterals may be pretty flat and toe up, any vertical plane undulations create a series of P trap separators which may or may not slug fluid towards the heal and pump. If not, each successive trap adds a little back pressure to the perfs located ever closer to the toe. Additionally, those traps collect more viscous snot or solids which need to be removed from time to time. Coiled tubing jobs or N2 jobs are not cheap.
So no, there are no easy to pin down opex numbers and the economic limits of BOPD are much higher for these HZ wells which wipe out some anticipated, banked upon EURs. This is not the definitive textbooks for HZ low BOPD wells but it should show you the significant and expensive differences between vertical strippers and low output HZ wells.
Again, the classroom is open so please enlighten me as I’m anxious to learn.
Thanks Rasputin,
Where you operate, what are the economic limits for horizontal tight oil wells, if you assume an oil price of $80/bo.
My analysis for the average Permian well suggests a net revenue of $31/bo ( when looking at 3 stream revenue vs costs) at 18 bo/d for Permian wells. I assume the well operates until net revenue goes to zero.
Mike. There are small workover rigs stacked here all over the place, but nobody to operate them.
We have had a rig sitting on a well we need to produce or plug for weeks, crew finally was able to get there this morning.
It’s 86 and humid here right now, and no doubt you have better breakfast tacos where you are. I did just finish a pretty good homemade cheeseburger for lunch though.
Shallow Sands,
I am not at liberty to discuss specifics but will say in general terms SWD fees, Chemicals, electricity and the inherent unreliability of submersible downhole motors make the breakeven stripper production highly suspect. You can rod pump these wells from above the beginning of the curve but you will always have at least 500 feet of hydrostatic pressure against your formation inhibiting the flow of hydrocarbons to the wellbore. the breakeven number of barrels depends greatly on price and total fluid volumes and chemicals. At 25 bopd with current prices, they are close to breakeven. I am sure many wells are not being abandoned because the total oil volumes coming from the lease mask the uneconomic wells. does this make sense?
LTO. It sure does all make sense.
There are tens of thousands of wells all over the USA, if not hundreds of thousands, still being operated at a loss in hopes of a super spike with a chance to dump them off on someone else.
Shallow sand,
That’s interesting, doesn’t seem to make much sense to operate at a loss in the hope that oil prices will rise.
LTO survivor,
There are over 8000 Permian basin horizontal wells currently producing 25 bo/d or less as of March 2021 according to shaleprofile (this is the average output of these wells) at least half (probably more tahn 50% because the distribution is skewed to lower output wells) will be less than 25 bo/d, about 3600 wells as a group have average output at 15 bo/d or less, again atleast half of these wells (more likely about 63% of them) will have average output less than 15 bo/d.
I agree better performing wells will hide the bad performers, but a good businessman would cut their losses, I would think, and shut in a well that is losing money.
For any oil professional. So it is claimed that economic limit is about 20 or maybe even 25 bo/d, but there are lots of wells producing at 15 bo/d or even 11 bo/d. I wonder if a well that is all paid out will be run until it needs a major repair and then abandoned at that point, I am just trying to wrap my brain around an economic limit at 20 bo/d and the fact that there are many tight oil wells producing at much lower levels. See screenshot from shaleprofile Permian blog post (well quality, all wells).
Note that the wells that have been producing 90 months or more started producing before Jan 2014, in Jan 2014 there were 4394 wells producing in the Permian basin 3414 of those wells are still producing at 15 bo/d or less, that is about 78% of the wells producing in Jan 2014 and this was March 2021 when oil prices were much lower than today. I just don’t get it.
What am I missing? Click on chart for larger view.
Profit doesn’t actually mean anything. Currently there’s a driver shortage so nothing is being priced. Also, pipelines are not being maintained and the entire NM Permain is expected to be declared a waste zone.
Dennis is greatly oversimplifying things, in reality money is meaningless and what matters is it being physically impossible to continue. He’s trying to build a cost model which has nothing to do with reality, in reality it’s about access to resources and the market isn’t functioning.
Mark,
Profits matter, period.
They obviously don’t because the majority of the industry was never profitable. I mean this is obvious, I don’t need to tell you.
If you compare Exxon’s dividends versus debt you see it was never profitable and you just insist on using fake numbers.
Likewise if you held their stock (or anything else) over the long term you’d lose to inflation.
LTO survivor,
You said:
I am sure many wells are not being abandoned because the total oil volumes coming from the lease mask the uneconomic wells.
I imagine you know what each well you have a working interest in is producing right down to the barrel and not just at the lease level.
I would think this is true for every well run oil company.
Is that incorrect?
If not, why operate a well at a loss?
I would think this is not the way most stripper wells are run, perhaps shallow sand can comment, or any oil professional.
The oil industry as a whole was never profitable so yes.
Mark,
There have been good years and bad years, but long term there have been lots of oil industry profits, that might change in the future. If the business was not profitable, people would not be doing it. Mr Shellman has been in the oil business for 50 years or so, I believe he might disagree with the notion that profits do not matter. I think, LTO survivor, shallow sand, and Rasputin might also agree that in the oil business, profits matter. It is the aim of the business, to make money.
It is obviously unprofitable and managers are just embarrassingly stupid.
If you held oil stocks like Exxon in 1970 (or whenever) you would lose to inflation. As usual you’ll just totally ignore this and be factually wrong in ways that anyone can google in five seconds.
Exxon and standard oil issued 100-200b dividends over their entire existence. This is 10b a year for 20 years, and they grow 5% a year. And their liabilities and stock issues are more. This math is really easy to do and people who believe capitalism exists are legit unable to do grade school level arithmetic. It’s not capitalism, it’s just retardation.
Thanks LTO Survivor.
At some point you said optimal permian tight oil well spacing is about 4 wells per mile, it seems obvious that this may mean 5280/4=1320 foot well spacing, but as some have said I have never seen a tight oil well (except in photos) so I am often wrong on these matters. Can you confirm I am correct or correct me if I am wrong? Thanks.
I agree the tail is likely exponential for tight oil wells, for my analysis I assume OPEX increases over the life of the well and use a fixed plus variable OPEX cost model $5/bo plus $14000 per month per well (this model type was suggested by Fernando Leanme an experienced petroleum engineer), for the average 2019 Permian well this works out to an average cost of $13/bo over the life of the well and the well based on economics should be able to fo to about $8 bo/d at an oil price of $65/bo at well head. I assume an exponential annual decline rate of 15% starting at 5 years with EUR of about 420 kbo (excluding NG and NGL) of C plus C over a 214 month well life at $65/bo in 2020$ at the wellhead.
Note that when I do an analysis similar to Patzek’s work I get higher EUR than my hyperbolic plus exponential well profile (around 470 kbo for Patzek type well profile). So my estimates are pretty conservative. This recent model uses the 1320 foot well spacing you suggested and revises the TRR from 75 Gb to 60 Gb (due to fewer wells at the wider spacing vs my original 1000 foot spaced model). When the discounted cash flow model is applied to the 60 Gb TRR assumption for the future oil price scenario I have assumed ($80/b from 2022 to 2033 for Brent in 2021$ and price decreases to $48/bo in 2059 linearly) I get the 37 Gb Permian scenario above (max well completion rate is 460 new wells per month). I appreciate your feedback, it makes my models more realistic, I would be happy to make adjustments based on your input.
Dennis,
Well said. You are on the right path. The confounding factor I mentioned above is at “what volume of boepd will these wells be uneconomic” ? So much depends on price and opex that the curve may fall off faster than expected in a lower price environment.
LTO survivor,
Yes I agree I have a specific price model, but it is just a guess which is very likely to be wrong. I think the $80/bo maximum oil price I use is pretty conservative, but we could see oil prices drop quite a bit more quickly than I have modelled.
Thanks so much for your help.
I assume you have not answered my spacing question because it is proprietary, which I understand. If I was in the business and actually knew something important, I would probably not share it.
Note that you mentioned the wells will become less productive and I have that in my model as also, based on the net acres in the USGS studies of Wolfcamp, Bonespring, and Spraberry, spacing of 258 acres per well (8500 by 1320 feet) and a TRR of 60 Gb.
Of course the 49 million net acre astimate may be bad, and the TRR estimate as well, but that is what I have to go on. When I plug in a shut in at 20 bo/d, the URR falls to 35 Gb, assuming maximum completion rate of 460 new wells per month and 108 thousand total wells completed from 2010 to 2036 (no wells completed after 2036 in scenario).
LTO Survivor,
Does the 20 bopd estimate by Mike Shellman for economic limits for Permian wells seem good to you? At current oil prices, and natural gas prices I would think wells might be economic down to 10 bopd at an oil price of $70/bo at wellhead and $2/MCF for NG at wellhead. I assume about 90 b NGL per 1000 MCF of natural gas and price of NGL is 25% of wellhead price. Royalty and taxes assumed to be 28.5% in my model and OPEX is $52.20 per barrel of oil produced at a 10 bo/d output level. Net revenue at 10 bo/d is about $21.78/bo produced with natural gas output at 2760 MCF per month, oil output at 304 b/month and NGL at 248.4 b/month. At 20 bopd oil daily output level (monthly levels are oil=606 bo, NGL=389.2 b, NG=4324 MCF), OPEX is $29.25/bo (all these numbers are constant 2021 $) and net revenue is $39.61 per barrel of oil produced. In fact for my analysis the well would still have positive net revenue at 7 bopd output when all three revenue streams are included (OPEX at this point rises to $72/b of oil produced), though clearly we are close to zero at this point ( and GOR is around 10 at 7 bo/d oil output.)
Preliminary revised model with oil well profiles reflecting shut in at 20 bo/d as suggested by a professional. I have not yet had the time to adjust the natural gas profiles as well in order to reflect the economics better, when that is done the tail id likely to be thinner due to economics and URR will decrease further.
This assumption scales back the peak by about 70 kb/d to about 498o kb/d and reduces URR from 37 Gb to 35 Gb.
Chart below with preliminary revised model.
That would require the entire permain to produce at the rate of prime acerage. So the only reason people are ok with that TRR is that they have no clue.
https://www.google.com/amp/s/oilprice.com/Latest-Energy-News/World-News/The-Price-Of-Permian-Acreage-Has-Slumped-By-67-After-Oil-Price-Crash.amp.html
The permain costs ten million dollars per square mile which is 200k EUR in prime acerage.
Mark,
Wrong again. The prime acres are currently producing at an average rate of about 390 kbo per well over the life of the well (assumes wells shut in at 20 bo/d). 35 Gb divided by 108 thousand wells is about 324 thousand barrels for the average well completed.
The USGS know what it is doing, you ….
So you’re saying it’s underpriced? Your post is incoherent.
Half the output is condensate which is worthless.
Mark,
Talking about output from the prime acres, I didn’t read your links, prime acres, aka tier 1, currently has EUR of 390 kbo/well. The scenario you say must be wrong has average output per well of 324 kbo/well. The model does not assume all acres are of equal productivity, productivity decreases starting in Jan 2020 up to 2036 when the last well is completed.
If you included land prices in your model it would collapse because those will show you only prime acerage produces at 400k per section. Most of the area are 0-100k.
Mark,
Land prices not a part of the model. Crashes in oil prices will affect land prices, they will increase and decrease, but are a small part of overall cost, not an important factor.
Your model is arguing that Permian land is vastly undervalued, by a factor of ten. It’s a total clown show.
Also,
https://www.americanprogress.org/issues/green/reports/2018/08/29/455226/oil-gas-companies-gain-stockpiling-americas-federal-land/
The oil industry spends 10-20b on land vs 200 b revenue. If you focus on Permian and places with growth they are probably spending 30% of revenue on land.
Preliminary model is unchanged when natutal gas profiles are updated for shut in at 20 bo/d.
Mark,
You are the clown, the model does not focus on land prices, these fluctuate with the market, much of the best acres are leased and not much affected by changing market prices.
So I’m guessing the fact that you’re not buying Permian land proves you don’t believe your model? After all you claim of the 75k sections with 1/3 mattering, there is 60b barrels worth $6 trillion, or $600k per acre. The actual price is a few thousand.
Rystad’s remaining recoverable resources estimate dropped 9% to 1,725 billion barrels:
https://www.rystadenergy.com/newsevents/news/press-releases/worlds-recoverable-oil-now-seen-9pct-slimmer-commercial-volumes-can-keep-global-warming-below-1p8c/
Schinzy
So now they agree with BP.
Oil advances to 33-month high on warning about supply crunch
Oil rose to the highest price in more than 2 1/2 years as prospects of an imminent flood of crude exports from Iran and other major producers waned while the International Energy Agency warned of a deepening supply crunch.
https://www.google.com/amp/s/www.hellenicshippingnews.com/oil-product-tanker-demolition-on-track-to-break-11-year-record/amp/
They are demolishing tankers because trade is declining- countries aren’t exporting if they need to feed themselves.
Dennis
I sure hope you can move these replies to where they should be posted.
Some time ago I moved away from where the DJ Niobrara play is although I operate stripper wells in the area. Subsequently, I divested my ND assets as the LOEs were nuts. Those field guys, although competent, do not know how to operate like stripper operators yet economics mandated economical yet safe practices as stripper guys know all too well.
Currently, in the DJ Niobrara of CO, I do not know one soul that has bought or been given a low output HZ well to operate and I have no idea what the LOE/EUR metrics are for Oxy, Chevron, PDC and others. This I do know, and I’m sure you will likely disagree, is that the economic limits there will be significantly affected by the governor and the COGCC. You cannot give away wells up there and no one that I might know would be foolish enough to write a blank check to the State of CO for the privilege of solving the HZ rubix cube. My guess is that those HZ operators will run their wells into the ground swabbing them occasionally to maintain production, HBP the acreage and keep some reserves on the books and delay the inevitable fun of P&As. Again, that’s just my opinion and an educated guess.
I’ll even double down and suggest that Chevron thought long and hard about the Niobrara assets in CO when they took over Noble.
Dennis and Mike
Forgot to add that the Mercuria posting in NE CO is about $10-12 below NYMEX so that hits really hard for strippers. It’s been that way for years so 8 BOPD HZ is out of the question by a stretch.
Sorry to disappoint you Mike but I’ve not been well so making a dent here seems a good thing to do. Your/our experience is vital to the discussion in general yet the audience has difficulty relativizing and incorporating said experience and cost to the wallet, body and soul. Hell, I talk about farming with my neighbors and I know they think I don’t know crap but I have learned much and that incremental economics applies in both endeavors and that our exchanges help them realize that oil guys like me aren’t rich just because we own wells. Hint: they get RI payments w/o LOEs as you know. They’re oil field experts right up to the bill paying part! BTW, I haven’t figured out how to get my SI leases into the CRP program though.
Rasputin.
We have farm and oil and see both sides.
2019 operators in our area got $50-70 per acre in subsidies due to low grain prices and the administration at that time really wanting the farm vote. I could go on forever about these breaks.
OTOH, percentage depletion is about it as far as it gets for stripper well operators. And you can’t take that deduction below zero by lease. And the Dems keep trying to kill it.
The true beneficiaries of shale have been the mailbox money royalty owners.
Rasputin,
I do agree with you, the GOR is quite high in Niobrara relative to other plays so it will likely be a problem to run these as stripper wells.
Looking at shaleprofile data of 4679 wells producing in August 2016, 55 months later about 4614 of those wells are still producing at 15 bo/d or less (average for the 4614 wells is 15 bo/d, 37% will be higher than this and 63% are likely to be lower output than 15 bo/d.
Agree it’s not a good environment in Colorado, and also agree changing the rules of the game in the middle of the game is unfair to the oil producers.
Democracy can sometimes be a problem, but better than other alternatives imo.
Some confusing info from this morning’s weekly inventory report.
The July 9th daily output is now up to 11,400 kb/d, up from 10,800 kb/d six weeks ago. In the US section in the post above, the STEO is forecasting flat output of 11,200 kb/d until October. Is production really rising in July?
It will be interesting to see who gets it right, the flat production forecasters or the rising ones. Plenty of room for more discussion.
Ovi,
The weekly number may be based on the previous STEO, it seems at the EIA (and any large organization probably) the right hand is not always aware of what the left hand is doing. Both weekly numbers and STEO are often wrong, maybe the truth is somewhere in the middle or both may be way off.
Dennis
It really makes one wonder what their sources are. I wonder if they are looking at the DPR which does show increasing output.
The hands on experts on this site give the impression that increasing production going forward will not be easy. With 125 DUCs being completed each month in the Permian, there is a 20 month supply left. Does production increase start to slow before that as they cream the best DUCs
This is not a production increase, it’s some temporary noise due to prices.
OPEC Predicts 2.1 Mb/d Increase in Non-OPEC Oil Production in 2022.
This forecast is very similar to the EIA’s latest forecast.
OPEC thinks the trend that the weekly report showed will continue into next year and the US will approach its previous high. Interestingly the rate of increase will be close to 60 kb/d/yr. This is 20 kb/d/mth lower than the STEO is projecting.
OPEC predicts that global oil demand will climb by 3.3 million barrels a day in 2022 — about 3.4% — and surpass 100 million barrels a day in the third quarter for the first time since the coronavirus emerged. But before reaching that level, consumption will suffer a relapse in the first quarter, slipping back to 97 million a day.
Much of the rebound in demand will be satisfied by a revival in supplies from OPEC’s rivals. Non-OPEC production will increase next year by 2.1 million barrels a day, or 3.3%, with about a third of the growth coming from the cartel’s long-standing competitor, the U.S.
https://www.rigzone.com/news/wire/opec_projects_mixed_oil_demand_recovery-15-jul-2021-165956-article/
It’s interesting that shell and bp giving lower growth numbers than everyone else, given that they are pushing renewables.
Mark
If I’m not mistaken, Shell has little choice thanks to a well publicized court decision.
Saudi Aramco’s dividend obligations appear to be crushing the company – $75 Billion/yr. they are having to cancel projects and issue poorly received bond offerings to maintain this commitment from their fiasco of an IPO. Swirling around the toilet bowl…
https://oilprice.com/Energy/Energy-General/Huge-Dividend-Cripples-Worlds-Largest-Oil-Company.html
Yes, glad someone finally mentioned this. Saudis are admitting no oil left.
Sounds like ARAMCO, the mightiest of all oil extraction giants, have turned their bonds into junk. How is this going to affect Saudi oil production — it can’t be good.
Why would the Saudis do a Bond deal to pay dividends? Betting on higher prices in the future due to their dwindling reserves. I just dont believe we will see production grow by 2 million barrels a day in the US. The only companies in the US really growing production rapidly are the smaller privates desperate to get out. They need the “ebitda “ higher so they can sell at 4 times ebitda to a public trading at 5 times ebitda. Many of these smaller companies are running out of inventory fast. This is what Double Eagle did and what Colgate is doing. Ramp up production sell at a decent multiple and get out before the SHTF!!!
98% of Aramco is owned by the Government of Saudi Arabia, so 98% of the 75 B USD dividend stays in Saudi Arabia.
India is still in the doldrums .
https://energy.economictimes.indiatimes.com/news/oil-and-gas/indias-june-oil-imports-hit-their-lowest-in-9-months/84468403
High prices are killing , desperation .
https://economictimes.indiatimes.com/industry/energy/oil-gas/hardeep-singh-puri-conveys-indias-concerns-over-high-oil-prices-to-saudi-uae/articleshow/84469265.cms
A revised Permian basin model using the mean USGS TRR of 75 Gb and well spacing of 1320 feet and assumed average lateral length in 2019 of 8500 feet, this suggests an average well of 259 acres which I assume remains the foot print from 2017 until no more wells are drilled.
I also assume wells that start producing in 2018 or later are shut in when they reach 20 b/d.
All three outputs (oil, natural gas, and NGL) are used in evaluating the economics. Oil prices climb to $80/bo for Brent for the 2022 to 2033 period and then decline to about 60/b in 2049 (all costs and prices are done in constant 2021 US$). Annual discount rate is 20%, annual interest rate is 7.5%. ERR for scenario is 56 Gb, all debt paid back by 2024 for assumed costs and prices. Well completion rate reaches a maximum of 624 new wells per month (previous maximum was about 500 and highest 12 month average around 460 completions per month. This scenario is my best guess, obviously if oil prices are higher and/or the mean USGS TRR estimate proves to be low, then output could be higher. Likewise if the actual TRR is lower than the USGS mean and/or oil prices are lower than I have assumed, the output will be lower. The 90% confidence interval for the USGS estimate is 44 Gb to 114 Gb for the Permian basin. Previous scenarios I did on this thread used a lower 60 Gb TRR estimate and lower maximum completion rate.
Wells completed per month is plotted and read this from the right axis scale, Permian tight oil output is read on the left axis. Model is solid line. Click on chart for larger view.
Your model implies Permian land is ten times more valuable than it actually is. So your own behavior proves you don’t believe the model.
Also, you stopped modeling prices. Oil price increased a lot and production did nothing.
Even your own assumptions defeat themselves because you have no concept of diminishing returns. If 10 boe is the cutoff for strippers, then your fourth well will return that. It’s not 4x output for 4x wells.
If you presented your model at a conference you would legit be sent to a mental hospital.
Mark,
You would need to discuss with the geologists and geophysicists at the USGS. The scenario is based on mean USGS TRR and current well profiles as well as economic limits suggested by Mike Shellman and well spacing suggested by LTO survivor. Mistakes are mine alone.
Did a poster at AGU in 2018.
https://agu.confex.com/agu/fm18/meetingapp.cgi/Paper/446221
The poster was an underestimate because the USGS 2018 Permian Delaware basin estimate came out just after my poster had been submitted for printing.
Congrats on your poster but the link isn’t loading. In any case your URR has been falling over time as you admit it’s overestimated.
https://peakoilbarrel.com/oil-shock-models-with-different-ultimately-recoverable-resources-of-crude-plus-condensate-3100-gb-to-3700-gb/#more-8530
I of course welcome you to publish and help other people lose money, I’m not opposed to what you’re doing, just giving you objections you’ll get anyway.
Edit: I got the link to work. So your permian EUR increased despite everything getting worse?
USGS Delaware basin assessment published late 2018. I adjust my estimates when I see new information from a reliable source.
My medium scenario for Permian Basin increased from 30 Gb to 60 Gb on the basis of the assessment see following comment.
https://peakoilbarrel.com/opec-november-production-data/#comment-661641
This completely blows dennis out of the water. The USgs released a report saying 100k per well and not 400k.
https://pubs.usgs.gov/sir/2020/5042/sir20205042.pdf
The calculated mean EURs for each assessment unit ranged from 99,000 barrels of oil in the Wolfcamp C to 142,000 barrels of oil in the Wolfcamp
//
Here’s also a academic paper (which Dennis is incapable of reading) which shows you can’t overlap wells
https://irispublishers.com/gjes/fulltext/optimal-spacing-of-the-wolfcamp-in-the-delaware-basin.ID.000663.php
“The work suggests the higher the overlap (ROA>60%) between wells, the lower expected IP for 150 days and EUR from the well. This leads to a spacing of 10 acres. This leads to a development spacing of 10 acres, This leads to linear spacing between laterals of 1580 feet.”
Most importantly, figure 8, a 10x increase in overlap (bottom axis) yields only 1.8x EUR. In other words going from 15,800 ft spacing to 1,580 spacing is only 1.8x more oil. The difference between one well per mile and more is negligible.
Do not tell people you are using USGS estimates. You are defaming them and lying.
Mark,
Well spacing is 1320 feet (4 wells per section width), average lateral length is 8500 feet. Acres per well is 8500*1320/43560=258 acres. Net acres in Permian for USGS assessments is 49 million, 49 million/258=190 thousand wells, thats the number I start with for my TRR estimate.
Overall undiscovered TRR for Wolfcamp Midland, Spraberry, and Delaware Wolfbamo Bonespring and Avalon formations is 70 Gb.
I use 258 acres per well from 2019 and later wells. USGS uses smaller well footprint of 100 acres per well. Note that the full TRR includes cumulative production plus proved reserves at the end of 2017 which was about 5 Gb so TRR=5+70=75 Gb.
It is you who does not know how to read.
For those that can read the Permian basin assessments can be found at link below
https://www.usgs.gov/centers/cersc/science/permian-basin-oil-and-gas-assessments?qt-science_center_objects=0#qt-science_center_objects
Mark,
Good paper at your second link. Thank you.
Figure 3 of that paper suggests optimal well spacing of less than 900 feet. Initially I used 1000 foot spacing in my scenario, but on the advice of LTO survivor, I increased well spacing in my scenario to 1320 feet (4 wells per section width). Overlap is harder to determine and will vary with well design, and the properties of the geological formation which will vary from place to place.
Note that the USGS is using a very conservative EUR estimate based on 100 acre wells, (probably assumed shorter lateral length that was common before 2016. Let’s tale 140 kb/100 acres, that is 1.4 kb per acre. Now use my larger well area of 260 acres per well, then we get 364 acres per well. Then add the fact that well design has improved and we see the increase to my 390 kbo based on a well shut in at 20 bo/d as suggested by Mr. Shellman.
It’s more like 500 acres without strippers but whatever. If your well spacing is sane then you are closer to the usgs estimate of 10gb Permian ultimate.
You’re also ignoring that only a fraction of that area is productive.
Your 70gb is literally a typo and them not updating the website.
The BOJ was latest central bank to announce it’s going green. 0% loans to approved projects. Not only that but you don’t even have to pay the principle of the loan back. You can just keep rolling it over with the Bank of Japan until the end of time.
I think Japan Inc knows that the barrels of oil flowing their way will be cut off in not too distant future.
You don’t see any central bank saying they will give the oil guys 0% loans and you don’t even have to payback the principle if you’ll just keep the oil flowing.
I’d say we are really close to the oh shit moment. Where you can’t get oil regardless of price depending on where you live.
Yep. Mad Max for sure.
I think the wealthy in Japan and Europe will likely try to front run this lack of oil flow by getting their money out of Japan and Europe and to a certain extent all of Asia will be in same boat. Only one place that can absorb that. US markets and real estate will be bid like never before.
Mad Max for some but not everybody at least not all at one time.
HHH , a good POV . The question is will the US still be in business as a ” going concern ” ? What if it posts ” going out of business ” before this occurs ? I am not US based but very interested in US affairs . What I am reading especially from Hickory’s posts and many others on the non-petroleum thread , it is FUBAR . The system and society is unravelling , the speed is questionable . Yes , the best looking horse in the glue factory but ,but ???
I think when the US Navy no longer provides security for international waters. Shit hits the fan. Imagine trying to ship anything much less oil through international waters without US Navy there. US will be ok at least for a little while. We will have to adjust to a much simpler way of life and less stuff.
Japan and Eurozone have current account surplus since forever, and the US has current account deficit since forever. Oil will flow where the purchasing power is. Japan and EZ can increase theirs purchasing power, because of the current account surplus.
France and UK have the ability to go take oil. Doesn’t mean they will share that oil with the rest of Europe. The rest of Europe and Japan don’t have that ability. And if you were following the conversation. The assumption is exports from oil producers fall off a cliff due to Russia, Saudi, and US production decline over next 3-5 years or so. Due to a variety of reasons. Doesn’t matter if a country has a surplus current account. You can’t get it because it’s just not there.
Which is why central banks in Europe and Japan are going all in on green. They have no other choice.
To rein in some wackoism be aware Saudi Aramco is listed as 98.5% gov’t owned. The IPO was done on the Tadawul exchange and the bulk of buyers were Saudi sukuk banks. The bonds being sold are sukuk bonds and the money raised is from sukuk or other (no scarcity of other) entities for the purpose of paying dividends to Saudi entities.
Way too much waving of hands over heads.
That doesn’t help. Local entities are just less likely to invest in Permian and others.
New posts up
https://peakoilbarrel.com/opec-update-june-2021-2/
and
https://peakoilbarrel.com/open-thread-non-petroleum-july-17-2021/