A post by Ovi at peakoilbarrel.
All of the oil (C + C) production data for the US state charts comes from the EIAʼs Petroleum Supply monthly PSM. After the production charts, an analysis of three EIA monthly reports that project future production is provided. The charts below are updated to April 2021 for the 10 largest US oil producing states.
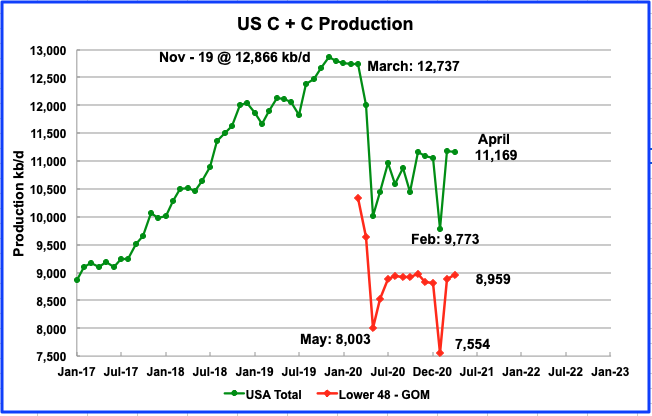
U.S. April production was essentially flat. It decreased by 19 kb/d to 11,169 kb/d from Marchʼs output of 11,188 kb/d. It was also 113 kb/d higher than January’s.
The June STEO report forecasted US April output would be 11,082 kb/d vs the reported actual output for April of 11,169 kb/d, an under estimate of 87 kb/d.
In the onshore lower 48, April production increased by 80 kb/d, red graph. The 99 kb/d difference between the US’ decrease and the On-shore L48’s increase was largely due to the 92 kb/d decrease from the GOM.
Ranking Production from US States
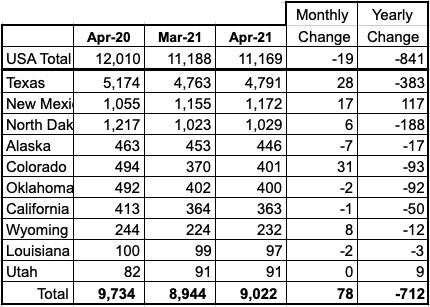
Listed above are the 10 states with the largest US production. These 10 accounted for 80.8% of US production out of a total production of 11,169 kb/d in April 2021.
On a MoM basis, the largest barrel increases came from Colorado, Texas and New Mexico. On a YoY basis, all states except New Mexico and Utah had a lower output than last year. Note also that New Mexico’s output surpassed North Dakota and moved into second place.
Production by State
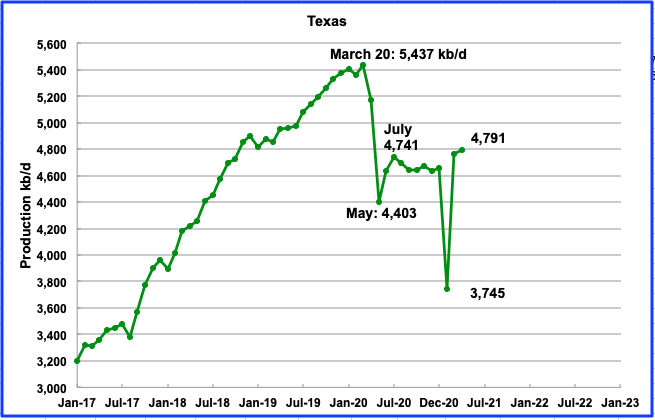
Texas production increased by 28 kb/d in April to 4,791 kb/d. In the EIA’s June report, March’s output was revised up by 18 kb/d from 4,745 kb/d to 4,763 kb/d.
In April there were close to 194 oil rigs operation in Texas. By the fourth week of June 25, 201 were operating. From the end of April to the week of June 25, Texas added 7 oil rigs. It appears that the rate of adding rigs in Texas has slowed. See Rig chart in Section 4 further down.
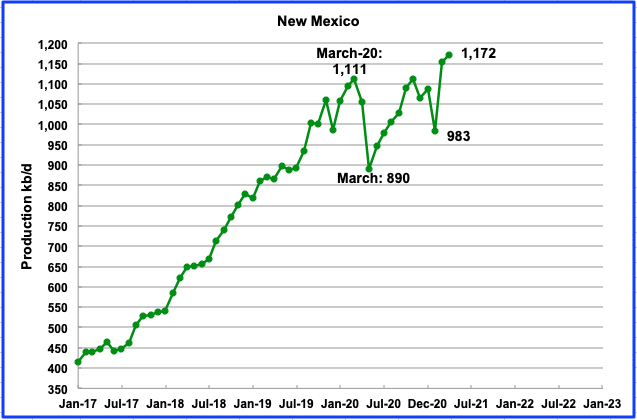
April’s New Mexico production increased by 17 kb/d to 1,172 kb/d. April’s output is a new record.
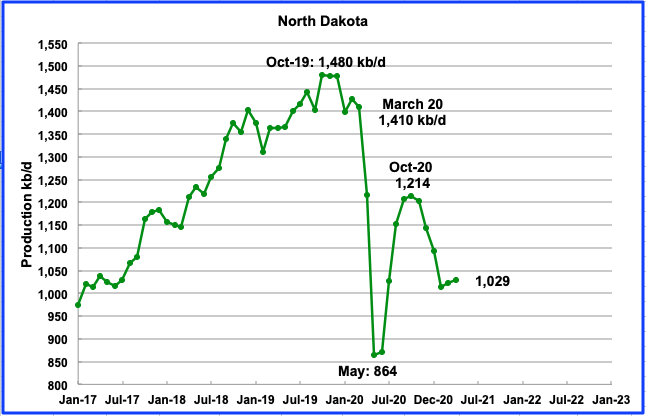
According to the EIA, April’s output was 1,029 kb/d day, an increase of 6 kb/d from March. During April, North Dakota had 15 rigs operating and by the fourth week of June they had increased to 17.

The North Dakota Oil and Gas division reported that April’s output in Only the Bakken was 1,080 kb/d. It is surprising that the EIA reported total April output for North Dakota was 1,029 kb/d, 51 kb/d lower than the Bakken alone. Does ND include NGPLs in their report?
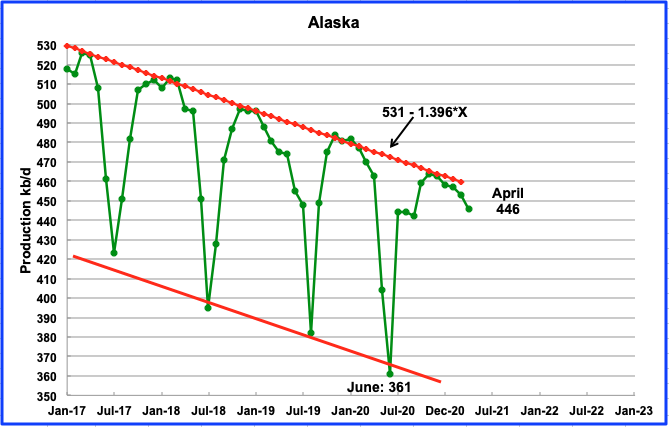
Alaskaʼs April output decreased by 7 kb/d to 446 kb/d.
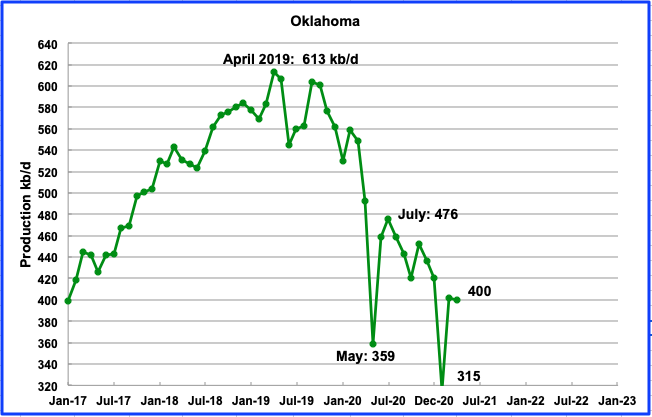
April’s Oklahoma output decreased by 2 kb/d to 400 kb/d. In July 2020, Oklahoma had 10 rigs operating. During April, 21 rigs were operating. By the end of June they had increased to 27. Even though 11 rigs were added from July 2020 to April 2021, production dropped by 76 kb/d.
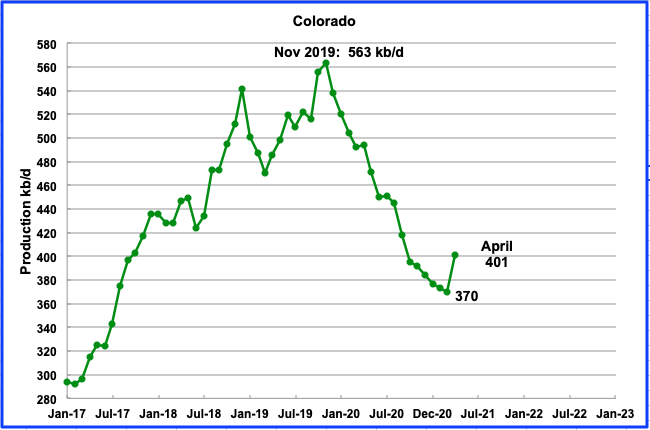
Coloradoʼs April output increased by 31 kb/d to 401 kb/d. From March to April, Colorado increased their oil rig count from 7 to 9.
According to the EIA, most new oil production in Colorado comes from the Niobrara Shale formation located in the Denver-Julesburg Basin in northeastern Colorado, where oil production in one county, Weld, is the source of almost 9 out of every 10 barrels of crude oil produced in Colorado. The Wattenberg field, much of which is in Weld County, is the fourth-largest U.S. oil field based on proved oil reserves and ninth-largest gas field based on proved natural gas reserves. The Piceance Basin in the western mountain region is the other primary crude oil-producing area in Colorado.
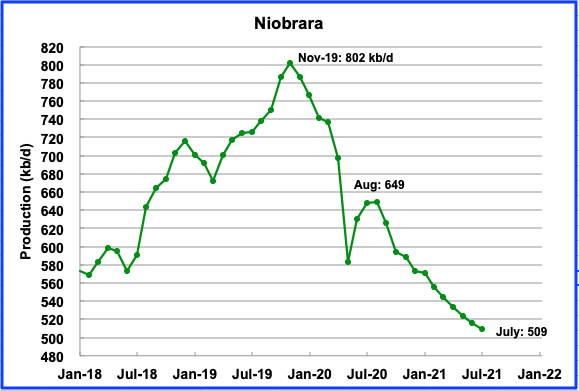
The June DPR shows steadily decreasing production from the Niobrara basin. Could the April increase shown in the Colorado chart above be due to shut wells being brought back on line?
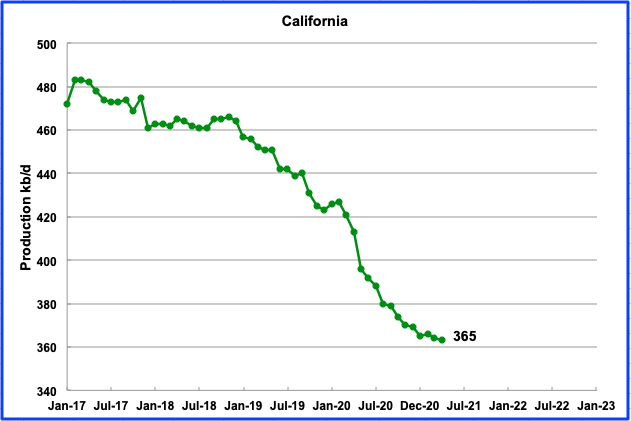
Californiaʼs slow output decline continued in April. Its production decreased by 1 kb/d to 365 kb/d.
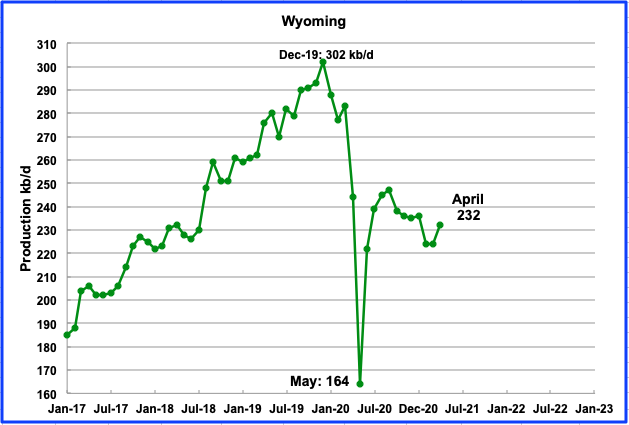
Wyomingʼs production in April increased by 8 kb/d to 232 kb/d. Wyoming had 3 oil rigs operating in April and they were increased to 9 by late June.
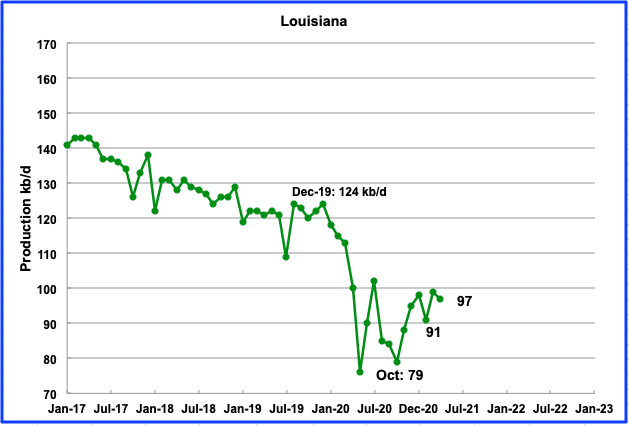
Louisianaʼs output decreased by 2 kb/d in April to 97 kb/d.
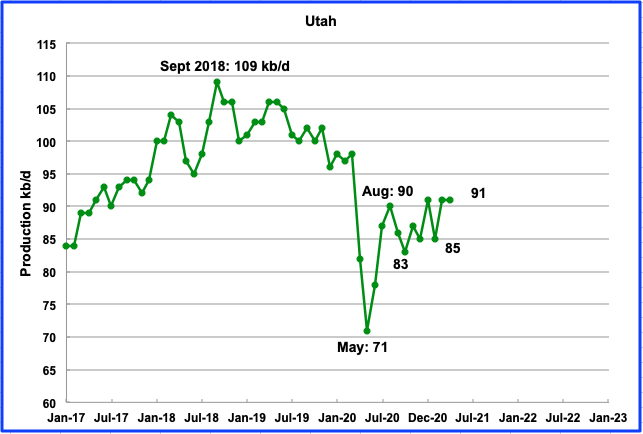
April’s production was flat at 91 kb/d. Eight oil rigs were operational in April and were increased to 10 by the fourth week of June.
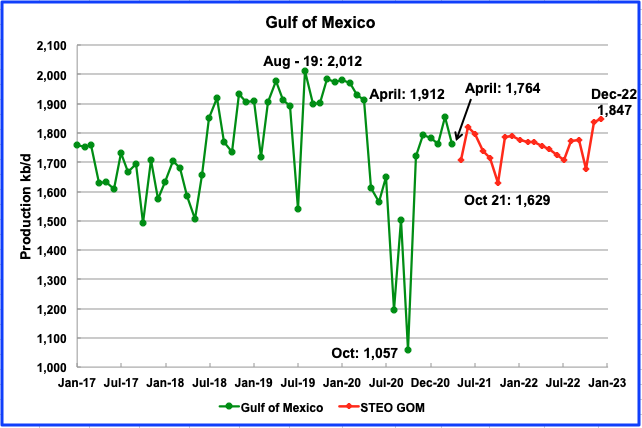
Production from the GOM decreased in April to 1,764 kb/d, a decrease of 92 kb/d from March. If the GOM were a state, its production would rank second behind Texas.
The May STEO projection for the GOM output has been added to this chart and projects output to be 1,847 kb/d in December 2022. This is an increase/revison of 59 kb/d over the previous report.
1) Short Term Energy Outlook
The STEO provides projections for the next 13 – 24 months for US C + C and NGPLs production. The June 2021 report presents EIAʼs updated oil output and price projections to December 2022.
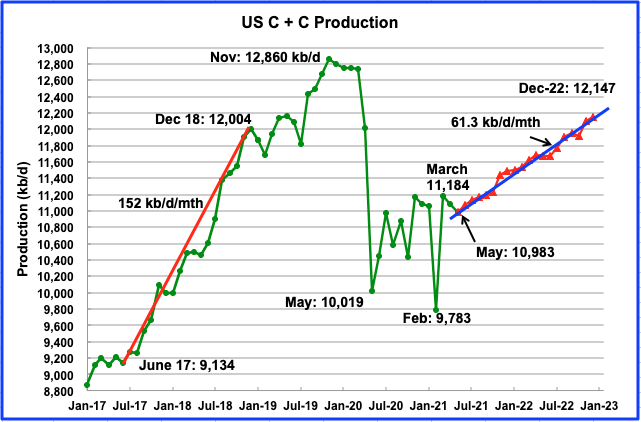
According to the June STEO, US output is projected to decrease in April 2021 to 11,082 kb/d and then drop further in May to 10,983 kb/d before beginning to increase in June.
The June STEO also revised down the December 2022 production forecast from 12,334 kb/d to 12,147 kb/d, a drop of 187 kb/d. Starting in June, the revised forecast drops the average monthly US output increase to 61.3 kb/d/mth from last month’s estimate of 75 kb/d/mth. This rate is less than half the unprecedented rate from June 2017 to December 2018.
This should be welcome news to OPEC. If demand growth were to approach 1,000 kb/d in 2022, this would mean that OPEC would have room to increase their production, depending on what the rest of Non OPEC does, excluding the US.
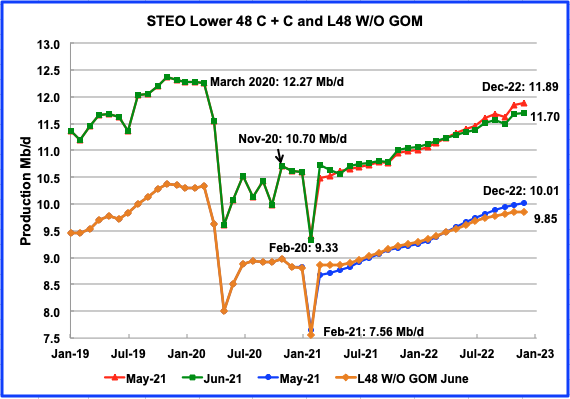
The June STEO output projection for the L48 states is very similar the one provided in the May report except for the output drop of 190 kb/d in December 2022 and the extra 240 kb/d in March 2021 which reached 10.73 Mb/d and exceeded the November 2020 level of 10.70 Mb/d.
The EIA continues to project a significant increase in production in the L48 starting in June 2021. From May 2021 to December 2022, the US will add 1.13 Mb/d by going from a daily production rate of 10.57 Mb/d in May to 11.70 Mb/d in December 2022.
In the onshore L48, L48 W/O GOM, production starts to increase in May 2021 from 8.86 Mb/d to 9.85 Mb/d in December 2022, an increase of 0.99 Mb/d. The average monthly increase in production rate from March 2021 to December 2022 is 47.1 kb/d/mth.
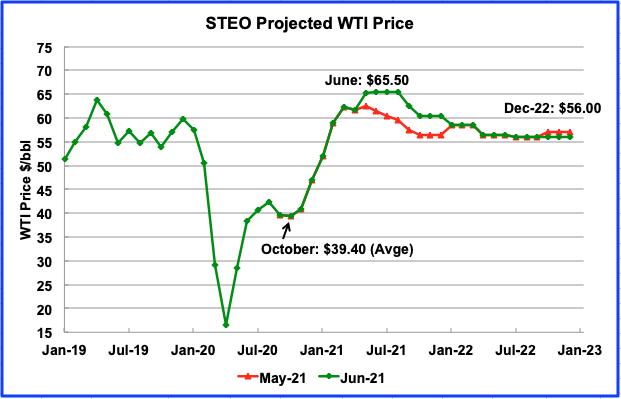
The June 2021 STEO price forecast was significantly revised up from the one in May. From May to August, WTI is expected to average $65.50. It drops to a low of $56.00/b in December 2022.
The August WTI contract settled at $75.16/bbl on July 2, higher than the EIA projection of $65.50. September Brent settled at $76.17/bbl.
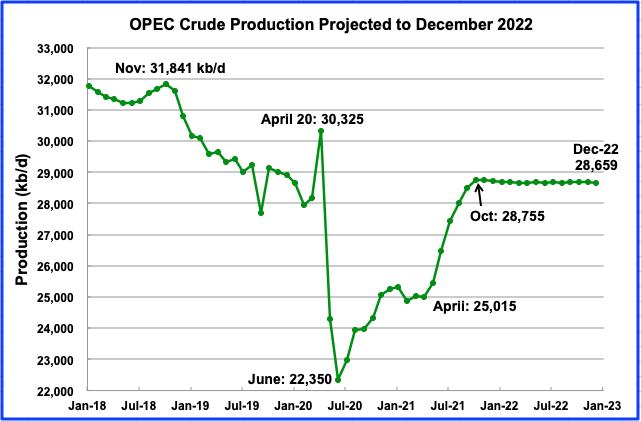
This chart shows the STEO’s forecast for OPEC crude output to December 2022. OPEC’s crude output is projected to increase from April to October by essentially 3,700 kb/d. After October output remains flat. The October output is virtually the same as OPEC’s output on January 2020, just prior to the onset of the pandemic.
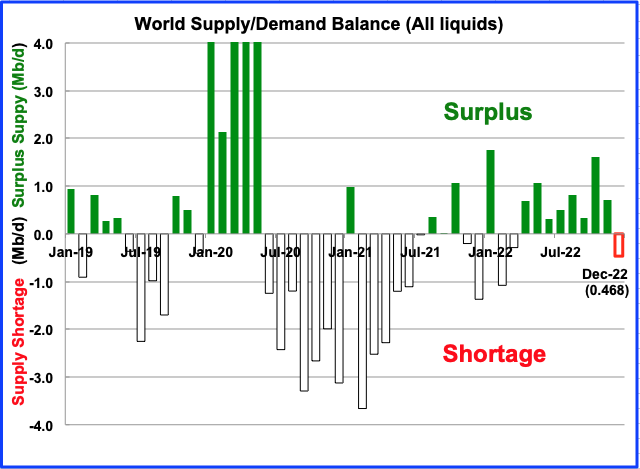
This chart show the historical supply/demand situation up to March 2021 and after that, the EIA’s forecast out to December 2022. After the supply surplus from February to June of 2020, world oil supply was intentionally reduced by OPEC and its partners. The US also reduced its output but the reduction was related more to the low price of oil.
From July 2021 to December 2022, the STEO is forecasting an average surplus of close to 322 kb/d. To get an idea of how this forecast changes, a record will be kept of the December 2022 shortage to see if it rises or falls. A recent report indicates that OPEC is concerned with the surplus shown after July 2022.
In the May report, the December 2022 deficit was 0.88 Mb/d. In the June report it has been reduced to 0.468 Mb/d.
2) Drilling Productivity Report
The Drilling Productivity Report (DPR) uses recent data on the total number of drilling rigs in operation along with estimates of drilling productivity and estimated changes in production from existing oil wells to provide estimated changes in oil production for the principal tight oil regions. The following charts are updated to July 2021.
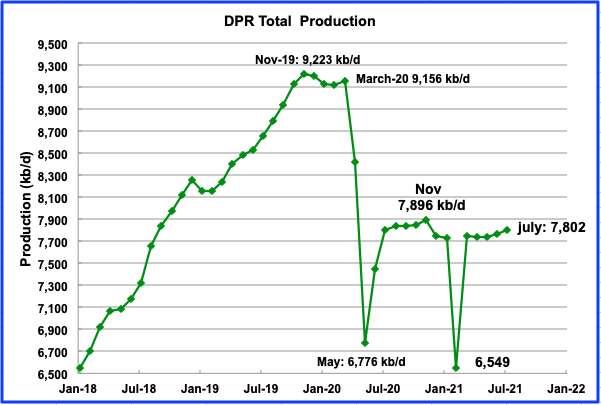
Above is the total oil production from the 7 DPR basins that the EIA tracks. Note that the DPR production includes both LTO oil and oil from conventional fields
The DPR is projecting output for July 2021 to increase by 37 kb/d over June to 7,802 kb/d. From March to July, output in the DPR increased by 51 kb/d.
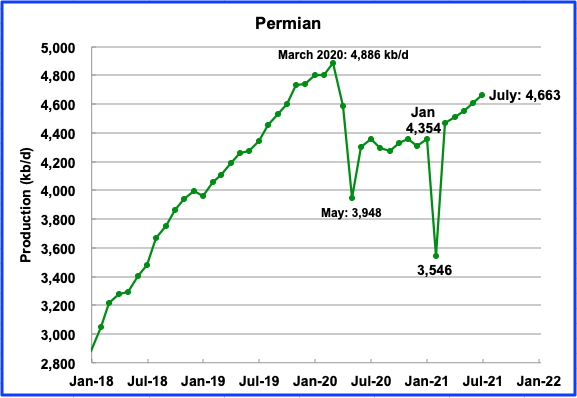
Permian output in July 2021 is projected to be 4,663 kb/d, up by 56 kb/d from June. From January to July production increased by 309 kb/d or approximately 51.5 kb/d/mth.
During June, 235 rigs were operating in the Permian, up from 100 in November. These 235 rigs are clearly sufficient to offset the decline from older wells and are increasing production.
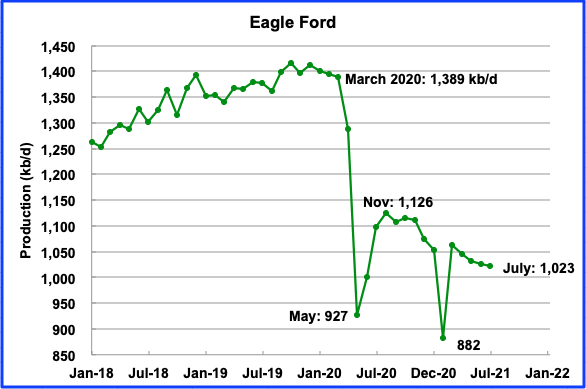
Eagle Fordʼs output reached a recent peak in November after shut in wells were brought back online and then output began to decline. In July, Eagle Ford’s output is expected to drop by 4 kb/d to 1,023 kb/d.
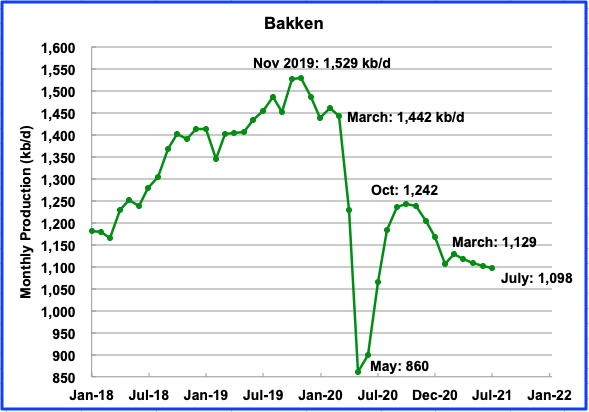
The DPR forecasts Bakken output in June to be 1,098 kb/d a decrease of 4 kb/d from June.
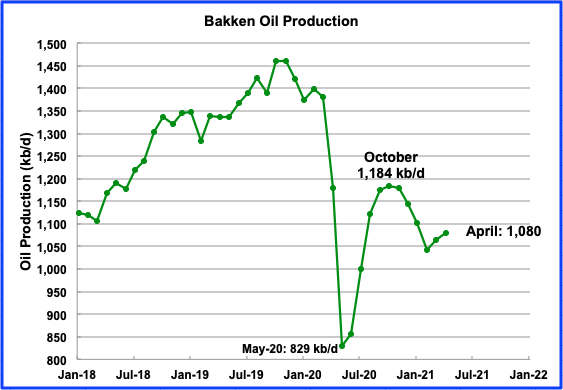
This chart shows Bakken oil production as reported by the ND Oil and Gas division. While the ND O & G division is reporting an increase of 6 kb/d in April, the DPR is projecting a decrease of 11 kb/d in the previous chart.
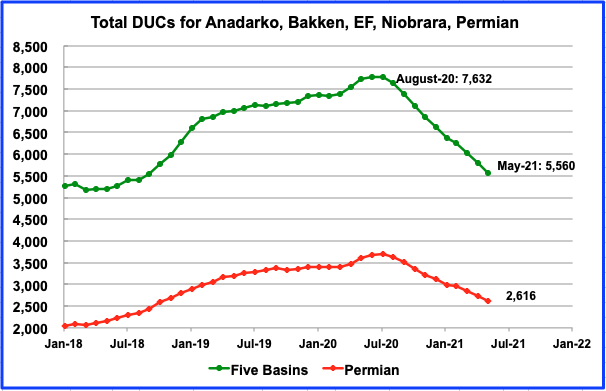
During May, 233 DUCs were completed in the five major oil basins as the DUC count fell from 5,793 in April to 5,560 in May. The average numbers of DUCs completed each month since August 2020 is 230/mth. Of the 233 completed DUCs in May, half, 115, were completed in the Permian.
3) LIGHT TIGHT OIL (LTO) REPORT
The LTO database provides information on LTO production from seven tight oil basins and a few smaller ones. The June report projects the tight oil production to May 2021.
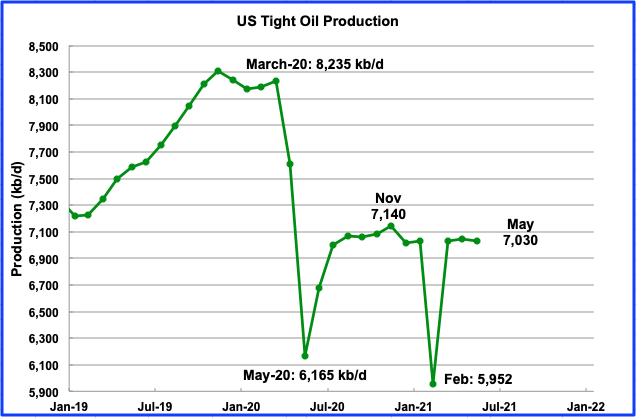
June’s LTO output is expected to decrease by 15 kb/d to 7,030 kb/d. Note that May’s output is still lower than August 2020 output by 41 kb/d. In the June report, April’s forecast output of 6,923 kb/d was revised up to 7,045 kb/d.
The June report revised February output further down from 6,028 kb/d to 5,952 kb/d.
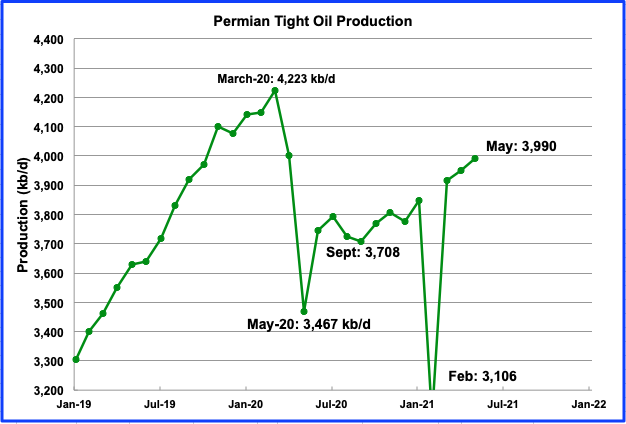
Permian LTO output in June is projected to increase to 3,990 kb/d, an increase of 39 kb/d. From the September low of 3,708 kb/d, LTO output in the Permian is increasing at an average rate of 35.3 kb/d.
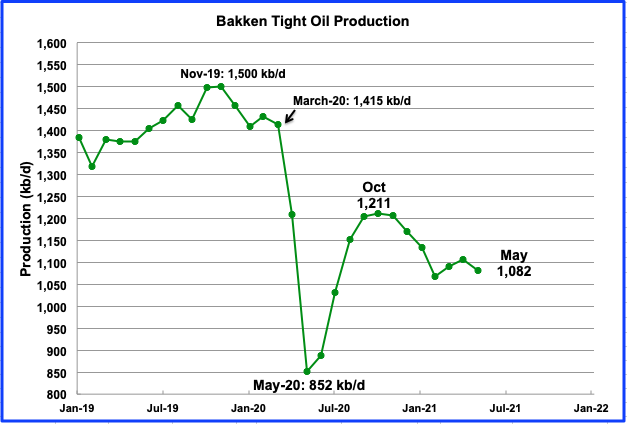
The Bakkenʼs May output is expected to decline. May’s production dropped by 24 kb/d to 1,082 kb/d.
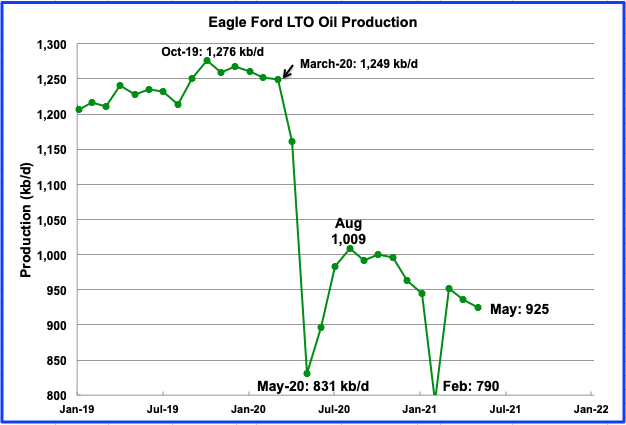
The Eagle Ford basin is expected to produce 925 kb/d in May, a decrease of 11 kb/d from April. May’s decline continues the trend that started in December 2020.
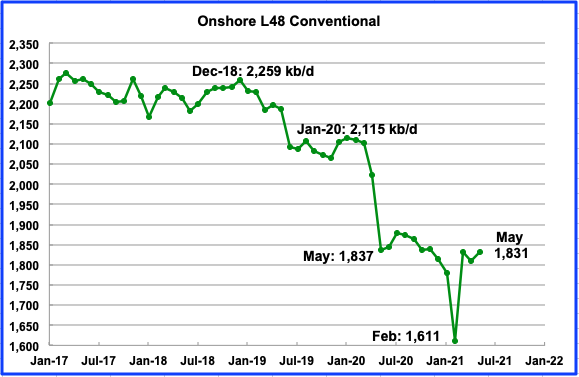
Conventional oil output in the On-shore L-48 is expected to increase by 22 kb/d to 1,831 kb/d in May 2021. This estimate is based on a combination of the May LTO output and the June STEO report that projects US on-shore L48 to May.
On a YoY basis, May to May, production of conventional oil is essentially flat, i.e. just down by 6/kb/d.
4) Rigs and Fracs
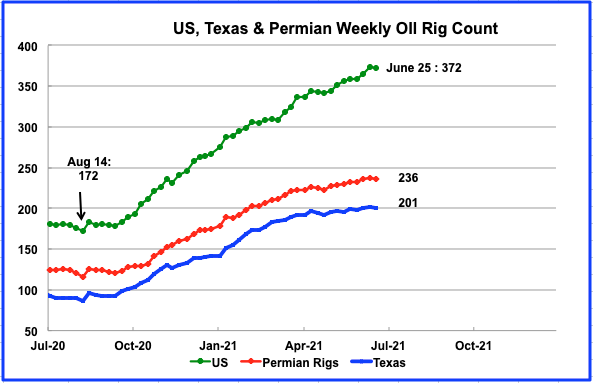
There is a hint that the addition of weekly oil rigs is slowing. It is most pronounced in Texas, from April to June 2021. From the end of April to the week of June 25, Texas only added 7 oil rigs. In the week ending July 1, 4 oil rigs were added in the US to raise the total to 376. The Permian added 1 to 237.
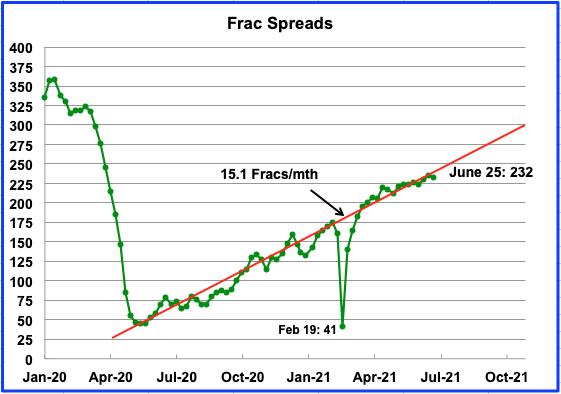
Frac spreads continue to be added at a rate of approximately 15 spreads per month. In the week ending July 2, 2 frac spreads were added for a total of 234.
World Oil Production
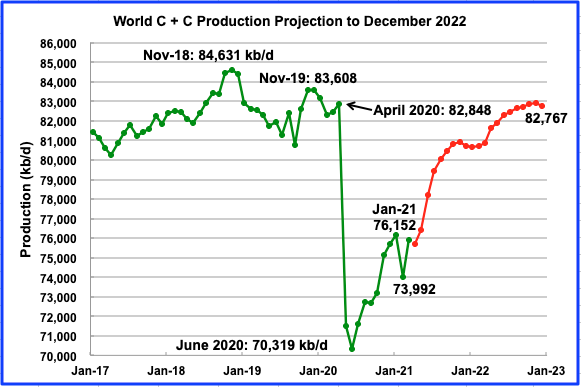
March’s world oil production increased by 1,899 kb/d to 75,891 kb/d according to the EIA. The biggest contributors to the increase were the US, 1,401 kb/d, and Russia, 150 kb/d. The US increase was simply the recovery of oil output from the severe winter storm that affected Texas and other US gulf coast states in February.
This chart also projects world production out to December 2022, red graph. It uses the June STEO report along with the International Energy Statistics to make the projection. It projects that world crude production in December 2022 will be close to 82,767 kb/d.
Note that the December 2022 output was revised up from March’s EIA’s production report by 127 kb/d.
340 responses to “US April Oil Production Flat”
Great post Ovi. You must have put in a lot of hard work creating it. Thanks.
Ron
Thanks.
Yep, thanks Ovi
Hightrekker
Thanks
Great post.
My call , World C+C peak at 84,631 mbpd Nov 2018 . US peak C+C at 12,866 mbpd Nov 2019 . Any dissidents (excluding Dennis ) ?
Hole in Head
How long do we have to wait before we can says those numbers and dates were peaks.
First , as usual great work . Second the answer to your question , MAYBE till Dennis joins our team . 🙂
Hole in Head
Let’s give him one year to come around.
🙂 . 🙂 . ROFL .
Sorry guys, you will have to wait until 2028, unless I get some new peer reviewed information.
I expect the World peak will be 2027/2028 at 84 to 87 Mb/d, best guess 85 to 86 Mb/d.
Just realized I forgot to mention I look at average annual output rather than single months which are less important in my view.
So current World peak is 2018 is 83083 kb/d and US output in 2018 was 10964 kb/d with US peak the following year at 12248 kb/d. Note that 2018 was the first year that the US surpassed the 1970 peak of 9637 kb/d.
We should know for sure sometime between January and December 2022. We will know when it is confirmed that Russia is in decline. That will be the tipping point. Many producers are already in decline but Russia is now the largest. Of course, the US being in decline, the two largest producers in the world, would leave no doubt about it.
Ron,
I just looked up the Vostok project. I put no credence on the numbers but full production is supposed to be 733 million barrels a year.
It’s an if and when thing. I’ve no way to know if Vostok would offset Russia’s production decline to any great extent.
It took me a while but I found it: Russia’s Rosneft Announces Start of Vast Arctic Oil Project
Sechin said the Arctic endeavour would eventually produce 100 million tonnes of oil per year.
Between now and 2024 he said that 30 million tonnes would be sent from the Arctic along the so-called Northern Sea route connecting the Atlantic Ocean to the Pacific.
It will eventually produce 100 million tons a year but in the meantime, they hope to produce 30 million tons between now and 2024. But another link said something entirely different:
Rosneft discovers new oil, gas field at Russian Vostok Oil project
Moscow — Russia’s largest crude producer Rosneft said July 23 that it has discovered a new field containing an estimated 20 million mt, or around 146 million barrels of oil, and 1 Bcm of gas, as part of its Vostok Oil project in Northern Russia.
Oh well, I guess we will just have to wait and see.
Let me remind you that Ugra is Western Siberia.
Yekaterinburg. By the end of 2021, the oilmen of Ugra are expected to produce 215 million tons of oil. This was announced by the Governor of the Okrug Natalya Komarova on the sidelines of the INNOPROM-2021 exhibition.
“In January-May of this year, our enterprises produced 86.5 million tons of oil, which is 8% less than in the five months of the previous year. At the same time, more oil was produced in May 2021 than in May 2020 (according to regional authorities – 18.2 million tons, which is 2.4 million tons more than in May 2020) And this allows us to assume that by the end of 2021 oil workers will produce 215 million tons of oil – slightly more than in 2020. Which is explained provided by the OPEC agreement, a gradual increase in production “, – said the head of the Khanty-Mansi Autonomous Okrug.
She also noted that the revision of tax parameters in oil production from 2021 could lead to a significant decrease in investment activity
—–
Yes, at the peak of production in Ugra (in 2007), 278.41 million tons of oil were produced, which is about 60% of that year.
I was unable to post a mining schedule here ….
Ron,
I expect 2022 output will only be a bit above 2021. New peak in 2024, 2025, 2026, and 2027, 2028 will be about the same as 2027 and then decline.
No doubt each year from 2024 to 2027 people here will say that new peak year is the ultimate peak. They may be right in 2027 or 2028.
What Robert Rapier did not analyze in his OilDrum post was that the logistic model applied to large oil province (say the world) shows empirically that the peak year moves further into the future by 1/4 to 1/3 year as the next years data is available.
By a slight alteration of Zeno’s paradox, peak oil never happen. 🙂
Thanks Ovi. KSA,Russia and US are starting to look like a line of domino’s.
Great post.
Frack spread count with extrapolation, frack spread count reaches 350 in Feb 2022 if current rate of about 179 increase per year continues to Feb 2022.
The frac spreads are producing no incremental output growth whatsoever, so your graph actually means a production decline.
We will see. The frack spread growth arrested the decline in output from the pandemic, there is a lag between frack spread count increase and completion rate of a few months. Permian output has been increasing and this has been offset by decreases in other tight oil basins. Soon this will change to Permian output increasing by more than the decrease in other basins and frack spread count may continue to increase. Eventually we will see growth in tight oil output as the frack spread count continues to increase.
We will revisit in Feb 2022 when frac spread count is 350 and see where US tight oil output is.
Maybe you can give us your guess for US tight oil output in Feb 2022, my guess is 7122 kb/d for Feb 2022, 7918 kb/d for Dec 2022, 8643 kb/d in Dec 2023.
I gave it in the peak oil thread. In the best case production will be flat. The rapid decline will start in late 2023 as the hubbert curves all hit and then it will be rapid collapse.
https://peakoil.com/forums/new-wolfcamp-data-t78034-20.html
https://i.ibb.co/zx2p84N/036-D7590-D188-4-B9-D-BD43-1-B188-E73-FBB2.jpg
This differs from my earlier number because they changed the definition of wolfcamp, but the total production is the same, nothing can stop the bakken collapse.
Dennis
I think the controlling issue is rigs. It looks like Texas and Permian rigs are starting to roll over. Not quite sure what the lag time is between fracs and rigs. If there is a slowing in completing DUCs, I would think the increase in fracs would follow.
Ovi,
Let’s assume your expectation for $85/bo in 2022 proves correct, under that assumption I expect the completion rate would increase rather than decrease, in addition the DUC count will continue to decrease and horizontal oil rig count is likely to continue to increase.
To me the important metric is frack spreads, as DUC count reaches some critical level, more rigs will be needed and rig count will increase. I agree the slope seems to be decreasing at present in the Permian, also for the US as a whole the oil rig count slope vs time has held steady. When DUC count for big 4 tight oil basins (Bakken, Permian, Eagle Ford, and Niobrara) falls to under 5000, we are likely to see an increase in the rate that rigs are added, we will see.
Dennis
I should clarify my slowing remark.
My thinking is the the best DUCs are being fracked now. By best I mean cash flow positive wells. Comments appear every so often regarding dead DUCs. Of the remaining 2600 Permian DUCS, how many are economically fracable or cash flow positive.
Another question I have is, why was there such an increase in DUCs. Did it have something to do with tax losses. Clearly those wells incurred big expenses and no revenue. I can see how this would delay paying taxes.
Ovi,
My guess is DUCs increased as prices dropped in 2019 and from the pandemic, the industry is slow to adjust. Now excess DUCs are being utilized, as to how many are profitable, no idea, the dead DUCs meme may or may not be correct. No doubt there are some that are not viable, as to what pecent, I will not speculate, I will leave that to pros. They have never given a number that I have seen. Perhaps they would guess.
I think the STEO OPEC projection may not take account of a removal of Iranian Sanctions, I would say it could be as much as 1500 kb/d higher in Dec 2022, if Iranian sanction are removed.
In addition the STEO price projection is likely $30/bo too low for Jan 2022 to Dec 2022, if it were adjusted to a more realistic level like $80/bo, then non-OPEC output would also be higher.
Bottom line, the Dec 2022 World C plus C output projection looks very conservative based on information available on July 3, 2021 imo.
Shadow Lenders Take Over In The U.S. Shale Patch
Banks have started to cut their exposure to the U.S. shale patch, seeing more than 100 producers and oilfield services firms go bust last year and feeling the environmental, social, and governance (ESG) pressure to reduce credits to fossil fuels. While traditional lenders are cutting their losses and de-risking energy loan portfolios, alternative capital providers are stepping up to scoop up U.S. energy debt at a discount and take part in debt or equity transactions that could give them returns sooner than a loan would for a bank.
Since the oil price crash in 2020 and the downturn in the U.S. shale industry, banks have been wary of their exposure to the sector. The commodity price slump last year dramatically cut the value of the assets of oil and gas firms, against which they have traditionally obtained loans from banks.
Running for the Exit
Lenders slashed the amounts of reserve-based loans to the U.S. shale firms in the middle of last year.
But it is not only purely financial considerations that are driving reduced bank exposure to the oil and gas industry. ESG lending and aligning loan portfolios to the Paris Agreement goals are now more prominent than ever.
For example, asset manager Schroders, which holds many bonds in the banking sector, is engaging with banks to understand their fossil fuel exposure.
“Banks that are highly exposed to the fossil fuel industry face significant financial, regulatory and reputational risks as a result of the transition to a low-carbon economy,” Schroders said, explaining its rationale to identify the exposure of the banks to oil, gas, and coal.
Increased pressure from the ESG universe, coupled with years of poor returns of U.S. shale firms, have prompted several major transactions in which banks have sold energy debt to hedge funds and private equity firms.
Hancock Whitney, for example, agreed last year to sell $497 million worth of energy loans to certain funds and accounts managed by alternative investment provider Oaktree Capital Management. Hancock Whitney expected to receive $257.5 million from the sale of the reserve-based loans (RBL), midstream, and non-drilling service credits.
Hancock Whitney’s main reason to sell the energy loans was to minimize the risks to its loan portfolio.
“The primary objective of this sale is to continue de-risking our loan portfolio by accelerating the disposition of assets that have been impacted by ongoing issues within the energy industry, and have now been further complicated by COVID-19,” Hancock Whitney’s President and CEO John M. Hairston said.
At the end of 2020, Bank of Montreal decided it would wind down its non-Canadian investment and corporate banking energy business.
Most recently, ABN AMRO announced last week it would sell a $1.5 billion portfolio of energy loans to funds managed by Oaktree Capital Management and affiliates of Sixth Street Partners. The portfolio consists of loans to around 75 companies active in the North American energy markets.
With this sale, ABN AMRO is withdrawing from oil and gas related lending in North America as part of a process to wind down its non-core activities and significantly reducing the non-core loan book.
Overall bank credit is in contraction. And has been for a year or more. That is why I have little faith that this recovery has any legs whatsoever. If you look at the chart on US Bank credit and loans only other time you see even the slightest contraction in bank credit is 2008-2009. And it matters where the money comes from.
When a hedge fund or private equity group buys shale oil debt they are moving dollars that already exist around. When a pension fund buys shale oil debt they are just moving dollars that already exist around. But when a bank loans the money. The money is created via the loan. Money supply is expanded when banks lend.
If banks aren’t expanding the money supply and people and company’s are paying down debts which they usually do on a monthly basis. Which contracts the money supply. There is a dollar shortage coming.
Moving existing dollars around can put a bid under the price of pretty much any and everything for awhile. But over long run it’s not sustainable because the pool of existing dollars to bid up price runs out. And when there is a dollar shortage prices drop in a hurry.
Now if banks decide they want to start lending maybe we can get oil price over $100 and maybe it can be sustained. Right now banks would rather buy government T bills that yield 5 basis points instead of lending to the economy. Think about that for a minute and let that sink in. Most corporate bonds yield 400-500 basis points. And banks would rather own T bills that yield just 5.
Our economy is sick beyond belief.
South Sudan oil output declines as fields reach peak
UBA, July 2 (Reuters) – South Sudan is experiencing a rapid decline in oil output, with its oilfields yielding less crude after reaching maturity, a senior government official said late on Thursday.
At least five blocks “have already reached their peak and are on the decline”, Awow Daniel Chuang, Undersecretary in the Ministry of Petroleum, told Reuters.
From your link: The country’s crude output now stands at 154,000 barrels per day (bpd) compared with 180,000 bpd in 2019.
That works out to be 7 to 10% per year, depending on how many months they are talking about. But it is even worse:
The country, which plunged into civil war from 2013 to 2018, relies on crude sales for revenue but authorities have struggled to return production to prewar levels of 350,000 to 400,000 bpd.
War often causes damage and decline that cannot be recovered. Venezuela, even if they get a country to invest many billions in their recovery, will never return to their glory days, they will never get even close.
And population of 45 million keeps increasing at the rate of 2.2%.
Some news about Iraq:
Iraqi minister says BP mulls quitting Iraq, Lukoil wants to sell up
Iraqi Oil Minister Ihsan Abdul Jabbar said in a video posted on Saturday on the ministry’s Facebook page that BP (BP.L) was considering withdrawing from Iraq, and that Russia’s Lukoil (LKOH.MM) had sent a formal notification saying it wanted to sell its stake in the West Qurna-2 field to Chinese companies.
Iraqi tax commission cracks down on international energy companies
Iraq’s top tax authority has ordered government departments to stop issuing visas and halt imports for nearly two dozen international energy companies whom it accuses of late tax payments.
If enforced, the orders, dated June 27, 2021, could prevent some of the biggest players in Iraq’s oil, gas, and electricity sectors from bringing staff and equipment into Iraq, effectively depriving the country of work that is needed to meet its own production targets at a time when insufficient gas feedstock is causing nationwide electricity failures.
Iraq power cuts stir protests as summer temperatures scorch country
The power cuts have hit the south of Iraq especially hard. In Basra, where Iraq’s oil wells are situated, people have started taking to the streets in protest and main roads had to be shut down.
Gasoline Shortages In Iran As Tanker Drivers Shun Fuel Shipments
An official of Iranian Truck and Fuel Tanker Drivers’ Union said Thursday that drivers were refusing to transport fuel due to low or late payments from the government. There has been a shortage of supply in gasoline stations in recent days in various parts of the country.
In a statement published on social media Thursday, the National Association of Drivers’ Unions expressed solidarity with striking contract oil and petrochemical workers and said drivers would join their strike if the oil workers’ demands were ignored.
The Canadian National Energy Board’s Production of Canadian Crude Oil is out. Seems like they update about once every 2.5 to 3 months. After dipping for seven months due to covid, looks like they are settling out on a plateau of about 4.8 million barrels per day.
Ron,
A 5 month plateau? Over the past 10 months looks different from a plateau. We will see how the next few months look.
No, Dennis, the plateau began in November of 2019, interrupted for seven months because of covid. So overall it is a 17-month plateau. Canadian production could increase slightly in the next few months. But they are not going to save the world from peak oi. Nothing is going to save the world from peak oil Dennis, you need to accept that fact.
We will see. We disagree often, on this point one of us has been wrong. 😉
When shale became the keystone of supply 10+ years ago I predicted that oil would never dip below $75 again. It was as plain then, as it is today, that shale’s heavy capital costs require a logical oil price of +$75. I forgot to consider that the damn shale producers would just kept on borrowing. But I think Dennis does a good job of trying to factor in the psyche. Now or in the near future the dominoes of collapsing Saudi, US and Russian production will leave oil supply well below demand. When that happens folks are going to poke a lot of holes in the ground, and teetering governments will frantically pull levers to pump money into stuttering economies.
In my own little company we’ve been buying rigs and property so that we can double or triple our new well drilling when the price is right. Even if others aren’t similarly prepared, a $100+ oil price will bring old and new drillers out of the woodwork. Over my 30+ years in this business I’ve seen that woodwork explode every time the boom recurs. Here on the bumpy plateau there are still many conventional infill drill sites and second tier shale locations remaining. Dennis isn’t talking about holding off peak forever. But he is talking about the old familiar boom. I think we should assume that frac spreads will climb much faster than current rates. Maybe the heavy decline rates will make the boom a mere pop. But just like most of us underestimated how long the shale fraud could go on, maybe we shouldn’t underestimate how crazy it will get out there when oil prices surge, and the lengths that governments will go to keep economies afloat even in the face of unbearably high oil prices.
This is helpful in understanding what the end might look like. If we see a spike in prices; corresponding to everyone running and pushing every pipe they can find in the ground and all it does maintain a bumpy plateau and then the price falls back, we will know we are there. This exercise may needed to be repeated a few times, just to be sure. I think we are there.
The endgame of all extraction businesses is known. The endgame is financial
failure. That is why there are 60,000 abandoned mines in Australia
(https://australiainstitute.org.au/report/dark-side-of-the-boom/). One
cannot predict exactly how the financial failure will occur. There are two
extreme cases between which the endgame will play itself out. One extreme
case is that lenders cease financing the activity causing the activity to
stop. The other extreme case is that money is created to keep the activity
going until wages drop so low that workers walk off the job. Both cases can
be seen in Venezuela. Foreign investors disappeared and the local currency
doesn’t pay oil workers a living wage. That is why Pollux’ post below
(https://peakoilbarrel.com/us-april-oil-production-flat/#comment-720338) is
significant.
PAOIL.
I have been thinking about this too. However, there has never been a time until now when US and most other Western governments discouraged increased oil production.
There has never been a time when XOM and CVX said they’d hold production flat for ESG reasons. There has never been a time when European majors said they would intentionally allow production to decline for ESG reasons.
Also, how about financing. Is there still bank financing out there for you that is secured wholly by oil and gas assets? I know after prior busts it’s dried up, to come back with the price of oil, but will this time be different?
Finally, are there still enough young risk takers out there to try to finance this and are there enough workers out there to even get the job done? We have had a workover rig sitting on a well of ours for two weeks. Once the crew gets done on another rig, they will work on the rig on our well. The company owner is like you, he snapped up several rigs for dirt cheap during COVID. However, he’s having big trouble finding anyone who can operate them. Can’t even find hands.
I guess that’s my simple question. Is this time different? Or, when oil rockets past $100 will all of those who are discouraging more oil for environmental reasons change their tune?
Well put Shallow Sand.
I’ll re-emphasize the concern over credit cost/availability.
It will very likely become a significant unfavorable ingredient to economic considerations of all sorts of energy production projects.
Shallow sand,
Let’s say it is different this time and supply remains short. What do you think happens to oil prices?
Let’s imagine oil prices go to $150/bo. Does it seem realistic that oil supply would remain short and tbat there would be no increase in supply?
Let’s say that seems reasonable? Increaze oil price assumption by 50 per barrel, repeat until supply increases.
Things never remain tbe same, it is always different.
Dennis , ” Let’s say that seems reasonable? Increaze oil price assumption by 50 per barrel, repeat until supply increases. ”
Challenge , increase price by $ 150 and ask DRC , Equitorial New Guinea , Ecuador or any entity past peak oil to increase output . Your statement ” Things never remain tbe same, it is always different. ” sounds like ” I am a little bit pregnant ” . 🙂
Hole in head,
All that happens is that supply is higher than it would be at a lower set of prices. Not necessary that this be the case everywhere, just for the World as a whole. Also demand decreases as prices increase, along with an increase in supply. If there are wells that are not profitable at $100/b, but are profitable at $150/b then the increase in price means those extra wells will be completed and produce oil, whatever output comes from those wells adds to existing supply and makes it higher than before those wells started producing.
The price of oil does tend to affect oil supply.
Great Post.
Is anyone buying any new pumping equipment for new frac spreads. Most of the good equipment is now
working, and most of the sidelined units are worn out and stripped for parts. Buying new is a long lead-time
proposition. My guess is frac spreads will have a hard time going up more than 10% from where they are now.
I know that here in Canada, only TCW has any idled spreads that can go back quickly–the rest are junk. Unless
a lot more can come back, tight oil production will be stalled, even if prices for WTI go much higher.
Pilot.
Of course, you need people to operate the equipment.
Is finding workers a problem in Canada like it is in the USA?
yes. Canada has the CRB–Canada Recovery Benefit–pays $500/week special unemployment benefit,Scheduled to continue until late September. It has affected all manner of business in
Canada, especially the service industries, Labor supply is a major problem. Most companies
are still repairing balance sheets, so demand for rigs and pressure pumpers is still slow. But
the second half of this year will see increased activity.
Pilot and SS
It seems that I recall a rather serious debate here on POB last year regarding the return of workers after the economy opened back up.
Right now reality validates one prediction of the future. However, wage inflation simply due to recalcitrance is getting to be quite a serious side effect. Imagine a burger franchisee in a small town begging for entry position help for $15 per hour. What would a rig owner or manufacturing company have to offer employees as an incentive to work and what would the price inflation to their customers look like? Based upon the discussions last year I don’t think anybody can claim a good idea of the outcomes because we’re in uncharted waters.
McDonald’s pays $15 an hour in Denmark. Seems to work fine.
Itseems hard to believe that an industry as profitable as the oil industry would go broke if people aren’t paid starvation wages.
I have a nephew who used to be a Motorman in the Alberta oil patch. His last gig was last year in Texas, where he got caught in a Covid quarantine of workers on his rig (IIRC). He is now an apprentice welder in Wawa. Gets to see his kids and wife on a regular basis, works normal hours, and no travel. Also no depression from being separated from his family, or concerns that there will be layoffs.
Unemployment Benefits aren’t the problem: horrible, soul-crushing, dangerous, unreliable jobs are (sorry, oil guys…however, I know you know about burnout and addiction in your workplaces, and the stress of weeks of 12 hour shifts). Workers have just had a one-year reminder that life is short: it’s going to take some time for them to forget. (I do realize that there is a disconnect here in that our civilization needs someone to do those jobs…and I don’t have a snappy answer for the problem.)
I’ve fitted Verhulst curves to the production for each of the LTO basins in the EIA data, as below (apologiesto OVI for taking up a chunk of the comments thread but this seems the most appropriate place to put these). I used three curves in each case though one or two would have been adequate in. most cases. The near term recovery from Covid impacts will have influrnces, but maybe not much for most as productions all may have peaked before the pandemic. The Permian fields are the ones most likely to change but these estimates will be a basis to see how big the effect is. As expected by most the ultimate recoveries are well below initial optimistic numbers.
Austin Chalk
Bakken
Bonespring
Eagle Ford
Niobara
Other LTO
Spraberry
Wolfcamp
George
Interesting charts. What is the data source. Can you add up all of those charts and provide us with an overall picture.
Happy Independence Day to All.
Thanks
Data source is EIA production – I don’t know which of the several different data sets they use, it just gives production to May for LTO each of those basins. The fits give about 13Gb left for the three Permian fields, 2019 figures for EIA gave 17.5, and I expect about 15 -16 when 2020 figures come out. There are no nes discoveries in the LTO fields – no wild cat or extension wells are being drilled so the remainng reserves just change because of a general downward trend because of initial overestimation of technically recoverable reserves with will again increase but not necessarily to 2019 umbers.
For the other basins the ratios of the remaining reserves from the curve fits compared to EIA numbers are much lower, but the fits should be better as the production for the those basins are so much further past their peaks, giving a much better idea of the expected decline trajectory (e.g. EF peaked in 2015, Bakken 2019, Niobara 2019, Austin Chalk – is that Woodford? – 2018/2019). Ratios are EF ) 0.7 vs 5.5, Bakken 1.5 vs 6, Niobara 0.4 vs 1.5, others 0.6 vs 4.
Thank you for this compilation but 2024 became 2025 and so on.
The years are correct, the problem is that the divisions are 15 months rather than 12, but it didn’t seem worth fixing after I’d noticed my midtake as it’s just the general shape of the decline that matters.
Ovi wrote: Can you add up all of those charts and provide us with an overall picture.
Yes, please, I would love to see that chart.
Any idea why the production peaks (except Spraberry) all have strong time correlation with the pandemic oil price collapse?
The coincidence of peak resource with the pandemic recession seems too…coincidental.
It’s a coincidence, shale has only been around ten years and that was enough time for bioweapons to advance.
“bioweapons to advance.”
Mine was a serious question and I was looking for a reality based explanation rather than some Q-spiracy talk.
I gave the serious answer.
The Permian fields peaked in March or April 220 si I can see Covid influence there, but others are earlier. Bakken and Niobara peaed in late 2019 and had steep declines before Covid, maybe the shareholders told the companies to stop spending on the fields where the core was reaching exhaustion, or the lenders told them they weren’t getting any more.
So, in the Permian why would anyone expect peak reserve extraction potential to just happen to be at a similar timeframe as the clearly evident Covid recession pullback prompted by demand collapse?
What I am getting at is that is seems too coincidental to be correct, such as ‘if the deal is too good to be true, it isn’t true”.
I do acknowledge that occasionally big coincidences do occur. Is that the explanation here?
I just fitted the curves, as I said above whatever story they tell won’t come out until it’s shown how close future production matches the extrapolation. I was surprised how close the remaining reserve projection matched EIA numbers for the Permian, and how far away they are for the others, but the curve fits have no others factors than knowing what past production is. I can impose remaining reserve numbers and see what the best fit becomes, but it’s possible to get carried away with this. The fits are intended in no way to be predictions. I assume people understand how dodgy extrapolating fitted curves can be without having to spell it out.
Mr Kaplan , for me you and South La geo were the ” go to ” guys for GOM issues . It is evident that you have talent more than I could envisage . Terrific work on the shale basins . All is crystal clear . The music is playing but the party is over in the shale play . Merci, Bedankt and Shaukriya .
Thanks George.
Some do not realize that these extrapolations may not be correct. So sometimes the obvious needs to be stated. Not all of us have your level of knowledge.
George
Great work. As for that V curve,, there are times when it really nails it. I keep daily track of covid cases in Ontario. Near the end of April , when cases moved up from 3,200 to 3,900, I put a V function through the data starting in mid-February. Ontario was coming out of its second wave and starting into it current one. I have not touched it since then. It has just started to break down at the 200 level. Cases have not dropped as fast as V since mid June as the vaccination rate has slowed.
Thanks for the explanation George.
The Permian and all the shale was starting to tail off at the end of 2019. Companies were going bankrupt and PE was getting out of the business. Right after the huge Oxy mistake of overpaying for Anadarko, we could see the industry was starting to slow significantly. Then the price war at the beginning of Covid was the death nail. When you add ESG, Greta, Tesla, and carbon capture to the mix it was a perfect storm to destroy the industry. The industry may never come back. The futures market while efficient in a way treats oil and gas like soybeans or corn and prices oil as just in time inventory. One drop more than needed and the price gets obliterated. One drop less than needed and the price goes through the roof and unfortunately you go through periods of time where the market needs some stability at higher prices to induce investment. However, without the US shale, I believe we would have seen a market under supplied and probably an earlier and more desperate push for alternative energy. We have seen the peak and we better start conserving and looking for alternatives or we will be in sustained energy poverty.
@LTO survivor : lucid observation.
LTO survivor,
Yes Permian output growth was slowing pre-pandemic and very low oil prices led to low completion rates during the pandemic.
As you have already suggested, the oil is there, higher oil prices are likely to lead to further output increases from the Permian. It will conservatively reach 6000 kbo/d by 2025, if oil prices go to $80/bo and remain at or above that level. Perhaps we will see oil at $150/bo, difficult to know, I think $100/bo is likely, not so sure we get to $150/b.
Looked at cumulative production plus proved reserves for Permian, Bakken, Eagle Ford, Austin Chalk, Niobrara, and Anadarko at the end of 2019. The total is 37.3 Gb. If we add probable reserves (assumed to be 50% of proved reserves) we get cumulative production plus 2P reserves of 49 Gb. This would be the minimum tight oil output I would expect in a low oil price scenario ($75/b or less).
LTO Survivor- “We have seen the peak and we better start conserving and looking for alternatives or we will be in sustained energy poverty.”
As I see it we are very, very far behind in this kind of effort.
We’ve got a mile to travel on the path in this decade, and we have made it less than a hundred feet in the last 10 years. So far its a limp effort by the country.
Most people have absolutely no idea what is at stake.
There is no backup plan.
We will need to go whole hog on all feasible/affordable approaches.
Or else we will burning all the coal and wood we can get our hands on.
The country will be dumbfounded to see how quickly we will log the continent for energy.
Tanker trucks, battery factories, solar farms, pipelines are examples of facilities that will need armed guards/escorts. Robotic or human if any can be hired.
Hi George and Hickory.
I would expand slightly on George’s thought of 07/04/2021 at 11:40 am. I think that these graphs show the results of geology combined with the availability of capital. With the exception of Austin and Wolfcamp (outliers as one is the oldest and the other the youngest), each of these graphs has two peaks: one around 2014-6, and one at 2020-1.
It seems to me that these peaks are too similar for human intervention not to be a major factor. My guess is that the first peak is the result of the price crash around 2014-16. The start of the second peak is the result of drilling programs planned and instituted during the high price environment of 2011-14, and the acme is the result of covid and a changing financial environment.
Thats how it looks to me as well Lloyd.
It will be very interesting to see how things go with production when the next price spike gets real.
While it is basic curve fitting I think there must be something more fundamental involved which produces production curves that follow Verhulst curve shapes. It is an empirical observation that all production curves can be accurately fitted with a series of overlapped Verhulst curves, except where an artificial limit is imposed such as with a cartel like OPEC (and in theory there could be other reasons, Hubbert mentioned environment concerns and pipeline limits as in Canada may be another). The pure Logistic curve, a special sort of Verhulst equation, can be derived theoretically from a birth and death population model, which is conceptually understandable in terms of wells being drilled, producing and eventually getting exhausted.
The more wells there are in a collection (e.g. from platform to field to basin to area to country) the closer the Verhulst fits can be made. Production curves tend to be closer fits than symmetrical logistic curves and usually are skewed to the left with fatter tails (maybe reflecting how wells work – a rapid ramp up, a plateau, an exponential decay tail). But the skew tends to get less as the collection of entities grows in number. I have tried to think how the theoretical model that gives a logistic curve could be adapted to give Verhulst equations but it’s a bit beyond me. There may be geological, technical or economic factors that mean the fit has to be with several curves (e.g. an area with distinct shallow and deep water production, the Piper Alpha break in the North Sea, the price collapses influencing LTO production) but the fits with two or three curves are still fairly good over the whole life cycle.
All that means that the past history of a production entity must give some indication of the future production (and ultimate recovery) it’s just a question of how and how accurate. For a single well there is no doubt that once in a run down stage the future can be fairly well estimated, without any particular physical understanding of what is actually going on. The further past peak things are the better the predictive capabilites
In this I disagree with Dennis’s method, insofar as I understand it. The past production history seems to play very little part in how the future looks in those models. He simply picks an ultimate recovery and then applies some, to my mind unjustifiably complicated, methods to match a profile to that number (ironically a number sometimes generated using logistic curve fitting, as with those from Laherrere). To me this is worse than curve fitting; it is single point fitting. Everything depends on picking the recovery; even with all the expensive super computers and sophisticated models the oil companies still rely on experienced and clever people like Laherrere (and for example SouLaGeo) to put their final blessings on recovery figures. Nowadays a lot of the estimates are expressed as as probabilities and generated with Monte Carlo models which can be an improvement if they are viewed critically properly understood (USGS can get completely carried away with this and seem to me to lose sight of the forest for the trees at times).
Mr Kaplan , not much to add to your explanation . Just two finishing touches :
1. The past is not the future .
2. it is hazardous to drive by looking in the rear view mirror .
Hole in head,
A Verhulst equation uses the past production to predict future output.
Yes one looks ahead, but generally one uses past experience and what one has learned from that to anticipate what may lie on the road ahead. Perhaps it is different for you.
Thanks George,
The model for conventional output uses past output, past discovery, and estimates of producing reserves to estimate average development time from discovery to producing reserves. A range of estimates for URR are used, those for Laherrere, USGS, and others are used to provide a range of URR estimates which gives a bound to the discovery model, which lately I set at about 2800 Gb, but have used a range of 2500 to 3100 Gb for conventional resources, arriving at 2500 using a Verhulst fit to World conventional output and using the USGS 2000 World conventional resouce estimate for the high end (3000 Gb and adding 100 Gb because if it were redone it would likely be higher than 20 years ago).
I focus on my best guess 2800 Gb URR estimate for World conventional output, in 2018 when Laherrere did an update of his estimate it was about 2700 Gb for conventional oil (when I first chose the 2800 Gb best guess, Laherrere’s estimate was about 2400 Gb for conventional oil.
I think Laherrere does great work, his methodology has tended to give conservative estimates in the past and the analysis I do builds on his work and the work of others, USGS, Steve Mohr, to name but a few.
Lots of good stuff from 2014 at
https://royalsocietypublishing.org/toc/rsta/2014/372/2006
Wow Thanks George. This is starting to look like an impending collapse. On a side note the West of Shetland fractured basement play appears to be entering it’s final act.
The charts for the Bakken, Niobrara, Wolfcamp and Eagle Ford implie, that the number of completions is limited to a few more wells in each basin. At the same time we see upticks in production reported by the states and rig counts increasing slowly in all basins. We see that well productivity is declining slowly in some areas but it is not crashing. Are you really serious?
They can spam rigs all they want if they underlying resource is depleted.
It’s not physically possible to fit more wells in Permian at 1 mile spacing. The graphs showing you can space wells 400ft ignore overlap, if you look at overlap it pretty much kills anything below the current lateral length which is a mile.
I get that, but the charts say that there is nothing left to produce but some DUCs and output is going to crash tomorrow. There are more than 500 DUCs and more than 1500 permits in North Dakota and there is a decent amout of tier 1 acreage left to drill. I would agree that more than half of the potential locations in the Bakken are already producing. I also agree that companies dont have a lot of cash flow to spend because a lot of cash is lost to hedging. But I do not agree with chart above. That is only possible if fracking is banned tomorrow except for locations that are already permitted.
DUCs are the worthless wells nobody wants. Rapid growth in drilling activity has done nothing for production no matter how many DUCs are consumed.
You need to ask the spacing on these wells and it’s terrible.
Spacing of DUCs may be too close in the Permian, but not in the Bakken. Many are spaced on 256 to 320 reservoir acres, some a little closer. I dont think there are many dead DUCs in ND.
Mark,
How do you explain the decreasing DUC counts over the past 9 months or so?
Dennis,
DUC counts fell from 7651 in December to 6521 in may, are we reading the same data?
https://www.eia.gov/petroleum/drilling/xls/duc-data.xlsx
It’s a consistent 2% monthly fall and half the DUCs are fake https://www.naturalgasintel.com/lower-48-duc-count-overstated-in-eia-data-says-raymond-james/
So 2 years left before DUCs are completely gone. Rig growth can be excused because it fell a lot, but even then it’s slowing down while productivity is falling faster.
DUCs are ultimately irrelevant because they will just interfere once they run out of land. It would be better to have “DUCs with spacing greater than a mile” or “sections with remaining DUCs” because the raw count includes spudders and useless crowded wells.
If you meant to say drilling has increased, that is futile. The hubbert curve is a physical principle and drilling for oil where it’s already overcrowded will be futile and result in falling productivity as we see.
Mark,
See
http://theoildrum.com/node/2357
Hubbert linearization is a curve fitting exercise which tells us very little. It has about as much physics behind it as astrology.
Dennis,
Again very dumb post, already addressed, hubbert is specific to a grade of resource. Shale and conventional are separate as are vertical and horizontal drilling .
Mark,
Some may find hubbert curves useful, but it is simply a curve fit, no physics to back it up. One can create a set of assumptions for a physical model where the Hubbert curve would be the result of a special case of a more general model. In the real world there is no reason such a set of assumptions would be satisfied except by random chance.
See Chapter 7 pp 85-88 of Mathematical Geoenergy (link below)
https://www.amazon.com/Mathematical-Geoenergy-Discovery-Depletion-Geophysical/dp/1119434297
most university libraries will have a copy of this book.
Dennis,
In this case it does have physics because your estimate requires more oil than would fit. But of course you don’t care and will just keep pleading for production to increase as libs are obviously annihilated.
The model is one of a typical depletion profile per well convolved with expected number over time tempered by a guess on how many more. It’s a much more nuanced model than a Hubbert curve.
Dennis Coyne claims that:
“Hubbert linearization is a curve fitting exercise which tells us very little. It has about as much physics behind it as astrology.”
Here is a thought experiment. The past oil production depends on a multitude of factors, geology, discovery year, past production, wars, price, technology etc. Consider N factors and assume that one can quantify the contribution of each factor in the past production and “plot” how the past oil production has been influenced by each factor. The result is that one gets a unique curve in the N-dimensional space. Now project this curve to the axes Q vs Q’/Q. The curve that tends toward a straight line if the logistic model is valid includes all the information that can possibly influence oil production. Comments are welcome.
Seppo,
Under certain assumptions the Verhulst (aka logistic) equation will describe future output for a physical model of oil depletion. The problem is that it does not work in every case and will often lead to poor estimates of URR. One can easily use historical production from the United states to demonstrate this. Early fits to the historical production data would have lead to severe underestimates of the URR. Data from 1900-2020 at
https://www.eia.gov/dnav/pet/hist/LeafHandler.ashx?n=PET&s=MCRFPUS1&f=A
Or link below has data 1859-2020
https://www.eia.gov/opendata/qb.php?sdid=PET.MCRFPUS1.A
If you use the first link, US cumulative C plus C production from 1859 to 1899 was 943.359 million barrels.
Using HL from 1945 to 1970 suggests URR of 203 Gb see chart.
Click on chart if it is too small.
Seppo,
Here is the US HL using 1905 to 1945 when annual P/ cumulative P was at about 5.4% (in 1945), the HL misses badly, URR=69 Gb, current cumualtive in 2020 is 235 Gb, if we subtract tight oil (19 Gb cumulative at end of 2020) we still get 216 Gb, over 3 times larger than HL from 1945.
For US tight oil the annual production divided by cumulative production was at 17.5% before the start of the pandemic (end of 2019). Based on the US data the annual output divided by cumulative (Q’/Q) needs to be under 7% to get anything close to a reliable estimate using HL (something with a 90% confidence interval within +/-10% of best guess). Perhaps in 2035 we might have the data needed for a reasonable URR estimate for tight oil using a Verhulst fit. For now I would put my best guess at 85 Gb+/-10 Gb for the URR of US tight oil.
sorry forgot chart, click on chart then zoom in for larger view.
Again dcoyne posts the same dumb graph combining shale and conventional, which is like combining oil and coal in the same curve. Just because the data is aggregated that way doesn’t make it right.
In 1945 Louisiana was just starting production. That accounted for half of the production growth. https://www.sciencedirect.com/science/article/pii/S0895717711005140
Spraberry did not exist until 1943.
By the time hubbert made his prediction all the fields were producing and he got a perfect fit. The correct way to use the hubbert curve is per field or when fields are all producing and anything else is a troll.
Mark,
It does not work, certainly not in 1950 or any earlier date you might choose. Late in the game after 1963 or so one gets a pretty good estimate for L48 onshore conventional when annual production divided by cumulative production is around 0.038 and we get a URR estimate of 175 Gb or so. The main point is that early estimates when annual production divided by cumulative production are higher as is the case for tight oil currently, the HL method underestimates output. It is a simple fact, just use the data. It is too early to use a Verhulst equation for tight oil to estimate URR. At the end of 2017, L48 onshore minus tight oil cumulative was 179.6 Gb and using HL from 1981 to 2017 gives a URR estimate of about 190 Gb for US L48 onshore conventional C plus C.
We have no data for early spraberry so you cannot test if it works. But every individual state followed the hubbert curve as far as we can tell, you’re just incorrectly aggregating them.
In fact if we crudely extrapolate the RRC data we get a crazy hubbert curve for Texas peaking in 1996.
https://i.ibb.co/mN1qy57/94243317-2-BB7-4726-868-A-D9-C838-E04-A77.jpg
The curve will over predict production if it’s trying to combine multiple fields that are just starting to accelerate.
If we shift the parameter a bit we get a great fit, the excess being spraberry.
https://i.ibb.co/VgHfPp9/3984-E425-546-C-4-F2-D-A874-F9-E894-B92830.jpg
Dennis, you did not comment on the thought experiment I posed. That thought experiment was to address the claim about other factors than astrology. By the way, it the position of planets influenced the past oil production, that would have been one of the N variables. I hope that you see that this parenthetical remark is made tongue in cheek, but not for the important N-1 parameters.
—–
A number of months ago I asked you and Paul, how many parameters does your model have and how they are estimated. Your and Paul’s responses did not answer this. The more parameters a model has, the more they can be adjusted to come up with a variety of scenarios. I think you have said in the past that you use Laherrere’s estimate of the ultimate, something above 3500 Gb if memory serves.
How did Laherrere come up with this? By the logistic model.
——
Econometric models follow this pattern and need to be restarted every year (or quarter) with new initial conditions. The same is true for weather prediction, but for different reasons.
—–
I also posted a few days ago that the logistic model for the world C&C moves the peak year about 1/4 or 1/3 a year (which I now correct to 0.4 years or 4.8 months) into the future as data for each subsequent year is available. This is based on empirical evidence for the world crude and condensate from data from 1995-2020. The empirical formula is
—–
t_p = 2014 0.4 (t_a – 2005)
—–
If this formula remains valid for the years from 2005 till 2030, it shows that the peak year will have shifted from 2020 to 2024 in 9 years.
The lack of agreement for the logistic model with the actual comes from two sources. The first is clear from all the discussion that have taken place on this forum; namely it requires a long time for the linear fit to develop, if it develops at all. The second is that the oil province may be too small. Whereas the conditions for a tendency to a normal distribution, as the sample size is increased, are not strictly satisfied, they do not have to be for the composite distribution to become near Gaussian.
—–
In addition, the bottom-up analysis by the Uppsala Hydrocarbon Study group predicted about fifteen or so years ago that peak will be 2017, although many of their papers braketed the range to a rather wide interval.
Seppo,
The model uses URR and a single constant for the dispersive discovery model, to create a fit to past discovery data with room left for reserve growth for discoveries of the past 20 years or so, then a single parameter for development time. historical extraction rates are based on past World output data, future extraction rates are a guess based on past extraction rates and expected future World demand for C plus C.
The model is really not that complicated. Note that a single future extraction rate could be used to create a simple future scenario, that would reduce the number of parameters. Basically there would be 4 parameters. Not as simple as the 2 parameters for a simple verhulst model, but if one uses 2 or 3 or more curves in the analysis we get 4, 6 or more parameters for out simple model. Some more complicated formulations don’t have a symmetrical curve and I image that may add another parameter to each curve so it would be 3, 6, 9 or more parameters in that case.
What output level did the Uppsala group predict for the peak in 2017?
Note the decription above that I gave was for the conventional oil shock model only. To this is added a tight oil model which uses a different method using well profiles (three parameters for each to fit output data from shale profile) and past completion data, sveral tight oil plays are modelled separately (5 separate models and typically 4 to 8 well profiles for each play as well as a decline parameter used for decreasing well profiles after some date). In addition there is a separate extra heavy oil model using three parameters, this is based heavily on Canadian Association of Petroleum Producers forecasts, and an assumption that Venezuela might attain half the Canadian level delayed by 15 years, the extra heavy oil model has only a URR of 150 Gb in recent models, with perhaps 100 Gb from Canada and 50 Gb from Orinoco belt. Tight oil has about a 96 Gb URR for my model for a total URR of 3050 Gb.
This assumes there will be transition to electric transport that reduces demand for oil after 2035 so that oil prices start to fall, this leads to falling extraction rates for conventional oil and less extra heavy oil produced.
I have honestly never understood the Hubbard argument.
Consider counting. It is useful at first, but gets less so as the numbers get bigger.
2 ist 100% bigger than 1, 3 is 50% bigger than 2, 4 is 33% bigger than three, 5 is 25% bigger than 4, 6 is 20% bigger than 5 and so on.
Each time you count one step higher, you add a smaller percentage to the total. But that doesn’t mean you will eventually run out of numbers.
Of course the curve isn’t straight, but it’s pretty straight for numbers higher than 15.
“I have honestly never understood the Hubbard argument.”
The Hubbert argument is OK, but the mathematical Hubbert curve (logistic) is primarily a heuristic . People should realize by now that even though it was really designed for ecology and epidemic modeling, it barely even works for that. We discussed this in post from last year:
https://peakoilbarrel.com/the-oil-shock-model-and-compartmental-models/
You cannot find any example of the hubbert curve being wrong.
Mark said:
The derivation of the Hubbbert curve in its form as the derivative of the Logistic S-curve is found in our book Mathematical Geoenergy (Wiley/2018) in Chapter 7. This has nothing to do with the ordinary Loggistic derivation, as it includes the concept of dispersion and a variation of rates and finite volumes to draw from. This is a mathematically exact derivation, so take it in that context.
https://pbs.twimg.com/media/E542pyPWQAAm_-O.png
The hubbert curve was derived from the p/z curve, which is the simple observation that pressure goes down as a well is depleted. Discovery would be relevant in some cases but once discovered the wells will follow p/z. P/z curve originated from craft and Hawkins.
The dispersive discovery model is interesting but it doesn’t tell us when the field will enter production, which has to be determined empirically.
Mark said:
Well, neither does the Hubbert curve which also requires an empirical calibration.
As I said, there is a connection between the Hubbert (Logistic or Verhulst) curve and the Shock Model used in conjunction with a dispersive discovery input, which provides a good calibration for the historical timing.
The result is that the Hubbert curve can be derived from these ideas, making the Shock Model much more generally applicable — and therefore the more practical of the two .
The underlying resource is still there but it is the pressure that is being rapidly depleted. The rock is so tight that it needs virgin type pressure to move to oil through rock to the well bore plus the fracs do heal and close up due to the overburden of sediment. So there you have it tight rock, a sea of oil and no pressure. I suspect it will take re-pressurizing the reservoirs with dry gas and some type of applied materials to coax more oil out of the ground. By the way most companies were producing full out to get enough oil to pay back the costly investment. The resource is there- how to get it out and to surface is the difficult proposition. We squandered the bottom hole pressure.
“We squandered the bottom hole pressure.”
Could you explain what this means? By haste, or by technique?
Thank you.
LTO Survivor
This company tried water flood
https://www.jwnenergy.com/article/2017/4/21/waterflood-technology-advancing-saskatchewans-tigh/
This article is from 2017. If it had worked good, everybody would do it now. So I think it was a dud – shouldn’t pay out much more than it costs.
Both. Haste to get pay back quickly and because of the debt burden and technique by flowing these too hard and too quick followed by submersible pumps required to move the water and oil.
Could CO2 or N2 be used to re-pressurise the rock? Seems a waste to use methane.
LTO survivor,
Have you tried 1320 foot spacing with all wells completed over a short period (within a few weeks of each other) so the 2 sections (2 miles by 1 mile with four 10,000 foot laterals along the 2 mile length) are drained as a single unit? I would think this would eliminate the child well problem and maximize total output per acre.
At some point you mentioned you have about 300 well locations that might be viable, I assume these are not child well locations as you have suggested those would require $150/bo oil prices to be viable and would not be viable at the present time.
Dennis,
The two parameters in the logistic model are obtained from the data and after it has been decided which points to include in the linear trend. Hence they are not adjustable. The only adjustable parameter is the starting year for the linear trend. If this is decided by choosing the points that gives the minimum curvature, or rather in a quadratic fit, by the smallest value for the coefficient of the X^2 term, then one is not free to choose this one at will either. Hence from this point of view the logistic model has no adjustable parameter.
—-
Since you have 4 adjustable parameters, there are plenty of scenarios to plot.
About the EIA OPEC crude oil production projection. They forecast a resumption of the 4 Mb/d cut and an increase of OPEC oil production until October 2021. How can this be possible as there are several countries which are experiencing oil production decline since, at least, 2020 spring and as other are cuting in their oil production. For example, the EAU will decrease their oil exports of 15% in september of this year : something like 396 kb/d less of exportation (production?) in September. If the production decline of Angola follows a linear trend, it gives 95 kb/d less in October. Congo. If the decline of production follows a linear trend, it gives 11 kb/d less in October. Gabon. If it follows a linear trend, 7,8 kb/d less. For Nigeria, I suppose that there will be 70 kb/d less in October. 70 11 95 400 7,8 = 579,8 kb/d less potentially in October for these 5 countries. Unless the rest of OPEC countries is able to increase the production of 4,5 Mb/d from now to October, it is doubtful that the production forecast of EIA will be carried out. And furthermore, imagining that the OPEC countries will be able to maintain their production at the level forecasted for October 2021 is completely fanciful.. Are the statisticians of EIA coming from a magic world?
Yes
For George Kaplan’s estimates for Permian the total URR estimate is about 17 Gb, this is close to the cumulative production plus proved reserves estimate at the end of 2019. Total for all US tight oil is around 31 Gb for Mr Kaplan’s estimates. All plays except Spraberry are past peak so according to this analysis the peak in tight oil is behind us.
It will be interesting to see what happens in the future. I expect all plays except the Permian basin may be past peak (as a group I call non-Permian tight oil), but think we will see significant increases in Permian basin output, with a minimum of 27 Gb and best guess of 46 Gb.
Release Date: November 28, 2018
Estimates Include 46.3 Billion Barrels of Oil, 281 Trillion Cubic feet of Natural Gas, and 20 Billion Barrels of Natural Gas Liquids in Texas and New Mexico’s Wolfcamp Shale and Bone Spring Formation.
source: https://www.usgs.gov/news/usgs-announces-largest-continuous-oil-assessment-texas-and-new-mexico
Dennis,
Ron calculated the Permian basin cumulative production at ~ 7Gb. Which is 15.2% of TRR produced (not including 20Gb NGL). Which implies USGS believes LTO production still has some ways to go. I am assuming you are agreeing with this assessment because it is coming out of USGS right?
I think the USGS is overstating reserves like OPEC does. In any case it will be interesting to see how this plays out.
Iron Mike,
See
https://www.usgs.gov/centers/cersc/science/permian-basin-oil-and-gas-assessments?qt-science_center_objects=0#qt-science_center_objects
The 2016, 2017, 2018 assessments have a total mean undiscovered technically recoverable resource (UTRR) of 70 Gb, the discovered resources (cumulative production plus proved reserves) at the end of 2017 were about 5 Gb, so the total TRR (discovered and undiscovered) is about 75 Gb. Permian cumulative production at the end of 2019 was about 5 Gb and proved reserves at the end of 2019 was 11 Gb, so roughly a total of 16 Gb of discovered resources at the end of 2019. My best guess estimate for Permian URR is about 46 Gb for a maximum Brent oil price of $80/bo in 2021$, a higher oil price assumption (say Brent oil prices rising to $120/bo in 2021 $) would increase the URR to perhaps as much as 60 Gb and a lower oil price (say $60/bo in 2021$) would reduce the URR estimate (perhaps to 30 Gb).
Note that the TRR estimates resources not reserves, I start with TRR, apply economic assumptions (well cost, oil price, natural gas price, LOE, discount rate, interest rate, royalty and tax rates, and transport cost).
See post linked below for a post I did 6 months ago on Permian basin
https://peakoilbarrel.com/permian-basin-the-death-of-tight-oil-has-been-greatly-exaggerated/
Also note there are a range of TRR estimates from 44 Gb to 114 Gb (90% confidence interval), I also used a range of oil price assumptions, though clearly there are an infinite number of possible scenarios of the future that could be done, I picked 9 representative scenarios. Recently I created newer scenarios with different oil price assumptions, with a best guess of about 46 Gb or 40 Gb if wider well spacing is assumed (1000 feet vs 1320 feet), in both cases I assumed a lateral length of 8500 feet. For the USGS mean estimate they assume about 49 million net acres to be developed in the Permian basin at the end of their studies in 2016, 2017, and 2018. So about 250 thousand wells for the narrow spacing and about 190 thousand wells for the wider spacing.
Dennis,
Thanks for the link. That is a lot of oil that is technically recoverable. So your 46Gb estimate seems to peak around 2030 for the ERR~TRR scenario.
You have much more knowledge about this than I do, but lets assume the USGS analysis of TRR is right, do you think banks are willing to finance oil companies to economically recover the oil in place?
Iron Mike, is it likely that the banks that have suffered massive losses on shale oil loans already will be willing to put out millions more? The companies they loaned to have gone bankrupt, so they have no hope of recovering that money. Of course, those same USGS numbers were there before they made all those bad loans. Do you think the banks will say: “But this time it will be different”? 🙂
Ron,
For the Permian basin specifically there were no USGS studies of tight oil (what the USGS calls continuous resources) until 2016 (midland Wolfcamp), 2017 (Spraberry), and 2018 (Delaware Wolfcamp and Bonespring formations). My models assume new wells are finaced from cash flow from 2021 to 2034 (that’s when the last tight oil well is completed in the Permian basin for my 40 Gb scenario based on an assumed 60 Gb TRR, roughly a 68% probability that TRR is higher than this based on the USGS analysis.) The USGS 90% confidence interval for Permian basin TRR is 44 Gb to 114 Gb with a mean (best guess) estimate of 75 Gb.
My models assume new wells are financed from cash flow from 2021 to 2034 (that’s when the last tight oil well is completed in the Permian basin….
Errr… I am a little confused here Dennis. Just how much of a companies cash flow is available to pour back into drilling new wells. How can you just “assume” there will be enough cash flow to pour back into drilling new wells.
But hey, if they can do it why not? Why didn’t everyone just do that instead of borrowing money to drill those wells? Just use cash flow and eliminate borrowing money.
But what the hell do I know? After all, I am no financial expert. But you know what Dennis, I have a sneaking suspicion that you are not either. 😉
Ron,
I am not an expert financial analyst, but the basic analysis is not difficult. See chart below which takes all completed horizontal wells in the Permian basin from 2010 to May 2021 and then makes a guess about future completion rates.
For June 2021 for my scenario, I assume 350 new wells are completed in the Permian basin and use an oil price of $65.56 for Brent in 2021 $ (about $10/bo less than actual). I estimate C C output (3956 kb/d), natural gas output (14.74 Bcf/d), and NGL output (1231 kb/d) for June 2021 using well profiles that are based on a decline curve analysis on 2019 wells from shaleprofile.com, it is assumed that EUR for both oil and natural gas output has declined from the 2019 level (starting in Jan 2020). Payments for the 350 wells assumed to be completed in June 2020 are assumed to be 3.5 billion (wells are assumed to cost 10 million each in 2021 $). Natural gas is assumed to be sold at $2/Mcf, and NGL at 25% of the cost of crude oil. Revenue from all three streams (crude, NGL, and NG) are added and then royalties and taxes, OPEX, and transportation costs are subtracted from gross revenue to find net revenue. The net revenue for June 2021 at the assumed oil price, NGL price, and NG price is 2.097 billion dollars and the cumulative net revenue decreases as a result.
This is what I mean when I say new wells are financed from cash flow.
At lower prices (say $50/bo for oil and $1/Mcf for natural gas) the net revenue would be negative and money would need to be borrowed to finance new wells.
Chart below has cumulative net revenue for tight oil produced in the Permian basin from Jan 2010 to Dec 2024 (the data from June 2021 to Dec 2024 is a guess based on scenarios I have created, clearly there is no data from the future.) All cumulative Permian tight oil debt( from Jan 2010 to May 2021) is paid back in this scenario by June 2023. As always clicking on chart will make it bigger.
Dennis,
many companies are hedged at around 50$ WTI on a substantial amount of production. That is only going to change in the long term as hedges get better when WTI goes up. Also smaller companies have corporate expenses that are very relative to daily production.
Ron,
On that comment you quoted, I stated that very poorly.
The economic assumptions for costs and prices and output in my scenarios lead to the ability for oil companies to finance wells from cash flow, in my view all of the assumptions are reasonable in my scenario, especially the 40 Gb scenario which used the optimal spacing suggested by LTO survivor (1320 feet spacing between laterals and 8500 foot average lateral length which led to a 60 Gb TRR). Others disagree, which is not uncommon.
Interestingly PAoil seems to think my estimates are not terrible, shallow sand has never specifically said he thinks they are crap and a guy over at peakoil.com (AdamB) who seems to know the oil business quite well thinks my estimates are too conservative.
I just do the best I can with the information I have from shaleprofile.com, the USGS and insights gleaned from oil pros. No scenario of the future will be correct.
Toby,
I do not try to account for hedging in my model. Not sure there is adequate public information to get a handle on it, but collecting it and trying to integrate it would be too much work for me.
As to corporate expenses, I am treating Permian basin tight oil production as if it were one large company producing all the oil, so all of these assumptions are guesses at industrywide averages in the tight oil sector within the Permian basin. Some companies will be more profitable than the average and others less so, generally the more profitable companies will grow larger and buy up the less profitable companies (or the worthwhile assets of those companies) as they go bankrupt.
The model is no doubt imperfect.
Iron Mike,
Under the economic assumptions of my analysis all new Permian wells completed after June 2021 are financed from cash flow, cumulative debt since 2010 pays a 7.5% annual rate of interest which is likely much higher than large oil companies actually pay.
So the short answer is that new bank financing won’t be needed.
No. Not true and badly misleading. Remaining EIA PDP from the Permian will not generate sufficient net cash flow to self fund 123,000 wells (your estimate) costing nearly $1T, much less do that AND pay down over $100 B of existing debt in the Permian. That’s using EIA PDP estimates; whack those by 30%. It is not possible to drill $9MM wells for a 135% ROI over 15 years and be financially self-sufficient, service and pay down debt, provide returns to investors and maintain a 100% RRR. The US shale oil model does not work without credit. $70 “assumptions” do NOT solve the issue of where the money is going to come from for your miracle of abundance to actually occur.
Mike,
For my model and the oil price assumptions I have used (oil rises to $80/b for Brent crude in 2021$ by Dec 2021 and remains at that level until 2033 then declines to $50/b by 2050, natural gas a $2/Mcf in 2021$ for entire scenario and NGL at 25% of crude price per barrel) the Permian basin tight oil industry as a single economic project has an average annual return of about 27.5% on average from 2010 to 2047.
Chart below compares cumulative net revenue for Permian tight oil (in Billions of 2021$) versus an alternative investment returning 27.5% per year. A 27.5% annual ROI would result in a 2690% ROI over a 15 year period (10 million would grow to 279 million over 15 years).
I do not assume 100% RRR, that would assume output remains on a plateau forever after reaching some peak level, I have never made such an assumption. I expect a peak around 2030 followed by decline.
Chart below, click on it for larger chart
The scenario upon which that chart above is based assumes a TRR of 60 Gb and URR is 40 Gb with a peak in 2029 at 6300 kb/d. Maximum completion rate is 624 new wells per month and is reached in June 2026, the maximum to date was 521 wells per month in April 2019 (data from shaleprofile.com) and increased to that level from 153 new wells per month 37 months earlier. So we are talking about a 78% increase in completion rate over 60 months vs a previous increase of 340% over 37 months. In any case it is a guess that is likely to be either too high or too low.
Iron Mike,
As far as bank financing, under the economic assumptions for well cost (10 million in 2021 $ for wells completed from 2018 to 2034), OPEX (average of $13/bo over life of well), transport cost ($5/bo), oil price, natural gas price ($2/Mcf in 2021 $), and NGL price (25% of crude oil price), and royalty and tax rate (28.5% combined) none is needed based on these economic assumptions and the future well profiles and completion rates I have assumed for the 60 Gb TRR scenario which leads to a 40 Gb URR when the economic assumptions are applied. Peak for the scenario is 6300 kb/d in 2029 and 120 thousand horizontal tight oil wells are completed from Jan 2010 to Dec 2034 for the scenario. No wells are completed after 2034. The total cost of all wells is about 1186 billion dollars (in constant 2021$). Well cost was assumed to be $7 million in 2010 and was asumed to increase linearly each month by 33,333 dollars (2021 $) until reaching 10 million (90 months or 7.5 years in July 2017). For every future month I assume the real well cost remains constant at $10 million in 2021$.
So very simply bank financing for wells completed after May 2021 for this scenario do not require bank financing. I do not assume 100% reserve replacement, such an assumption would amount to an assumption that tight oil output never decreases, essentially the URR would be infinite.
I have never proposed such a scenario, ever.
An old post by Jean Laherrere on Bakken from 2014. I think often Verlhurst fits to data early, can lead to underestimates of URR.
https://peakoilbarrel.com/bakken-oil-peak-jean-laherrere/
Chart below has cumulative tight oil output on horizonantal axis and annual output divided by cumulative output on vertical axis. Note that an estimate using Hubbert linearization in 2017 would have lead to a URR estimate of about 13 Gb, today the estimate would be 30 Gb, just as the 2017 estimate was too low, I expect the 2021 estimate will also be low as the 2020/2021 crash in tight oil output was due to the pandemic. Tight oil output is likely to increase in 2022 to 2028. The estimate for tight oil URR will change as a consequence, probably to 70 Gb or more.
some time ago it was proposed that the Alaska pipeline would not be able to flow oil under some defined volume. I think that volume was around 400 kb/day, which we seem to be at. Has that number changed or are we about to lose production from the North Slope?
JJHMAN
The rate, as I recall, was 500 kb/d and the issue was related to the cold winters. At the lower flow rates, the oil would cool too much as it progressed down the line. The viscosity would rise to a point that the pumps could not overcome the resistance. I think that I read that a few heated sections were added to allow the line to flow at levels close to 500 kb/d.
In the meantime, ConocoPhilips has been developing a new field in Alaska designed to produce more than 100,000 barrels of oil a day for the next 30 years.
https://www.nytimes.com/2021/05/26/climate/biden-alaska-drilling.html
They have installed heaters to lower the minimum flow rate. Lower flow rates do slow down the oil. See https://en.wikipedia.org/wiki/Trans-Alaska_Pipeline_System
EIA is expecting excess supply in 2022.
Are they smoking some really good stuff to come up with this? I’d like to smoke that too 😉
As I see it, demand will slowly go back up to previous level of 100mmbpd and then resume its slow march upwards. Where is it that EIA are seeing that extra production from that will lead to oversupply 6-7 months down the line? All I see is that various regions of the world are slowly declining in production due to a combination of worsening asset quality and a paucity of capex over the last several years, especially in 2020/21. US Shale, Russia, Offshore, conventional onshore, small members of OPEC and even Saudi… all are experiencing pressure on production.
OPEC seems to be concerned about the possibility of excess supply next year, probably due to this report by EIA. The Saudis are especially concerned and therefore are pushing to extend the supply cut to the end of 2022 which UAE is opposing.
So, am I missing a crucial element or are the EIA on to something here?
Ancientarcher,
Perhaps the EIA does not see demand rebounding to the 2019 level by 2022 and they see output returning to close to the 2019 level. I agree with you that they are likely overestimating suppy and may be underestimating demand as well. Precitions of the future are usually wrong regardless of what one is smoking.
OPEC’s Production Soared By 855,000 Bpd In June By Tsvetana Paraskova for Oilprice.com
As agreed in April, OPEC opened the taps in the second quarter of the year to meet a rebound in global oil demand, boosting crude production by 855,000 barrels per day (bpd) in June, the largest output hike in a year, a Bloomberg survey found on Friday.
The 13-member organization raised its production to 26.47 million bpd last month, up by 855,000 bpd compared to May, according to the survey based on ship-tracking data, information from officials, and estimates from energy consultancies.
Saudi Arabia, OPEC’s top producer and the world’s top exporter, accounted for more than half of June’s production increase as it hiked its output by 490,000 bpd to 8.95 million bpd, the Bloomberg survey showed.
As per the OPEC+ group’s decision from early April, the collective OPEC+ oil production was set to rise by 350,000 bpd in both May and June and by more than 400,000 bpd in July.
Additionally, Saudi Arabia was also gradually easing its extra unilateral cut of 1 million bpd between May and July, beginning with monthly production increases of 250,000 bpd in both May and June.
Overall, OPEC+ will have returned to the market as much as 2.1 million bpd between May and the end of July.
A similar Reuters survey showed earlier this week that OPEC boosted its production by 740,000 bpd to 26.24 million bpd in June. The estimate of Saudi Arabia’s production increase was similar to the one in the Bloomberg survey. According to the Reuters survey, the Kingdom raised its production by 500,000 bpd in June compared to May.
Judging from the re-opening of economies in the second quarter and the increased fuel demand, especially in the United States, OPEC made the right call back in April to gradually boost supply to the market.
The organization, together with its non-OPEC partners led by Russia, was discussing early on Friday how to proceed with the cuts from August onwards. Disagreements over baseline production levels for the future cuts delayed the meetings from Thursday to Friday.
If that number of 26.47 million bpd is correct and if the increase of 854 Kbpd is correct then May’s production had to be revised up by 150 Kbpd. The OPEC MOMR has May’s production at 25.464 million bpd.
Ron
The OPEC chart in section 1 above, STEO, shows that expected production for June is 26.5 Mb/d. So this should not be a surprise.
Oh, I was not surprised, I knew that OPEC would increase soon. I was commenting on the fact that the numbers did not match up unless May’s MOMR production data was revised rather dramatically.
Ron,
150 kb/d would be a revision of 0.6%, I would call this a minor revision, rather than a dramatic revision.
”The 13-member organization raised its production to 26.47 million bpd last month, up by 855,000 bpd compared to May, according to the survey based on ship-tracking data, information from officials, and estimates from energy consultancies.” Your question about the slight discrepancy between the number provided by the Bloomber survey and the number provided by the OPEC MOMR has an answer above.
Natural gas prices have risen a lot, seems to have been somewhat under the media’s radar.
Would make shale much more economic, until they glut the gas market again.
Hi Shallow
Just as a matter of passing interest Whiting have just completed 4 DUC’s
S-Bar 11-7HU and 11-7TFHU also
Feehan 11-9HU and 11-9TFHU all in the Williston Basin. It would be interesting to see the IP rates.
No, in France, the rise of the gas price has not been under the media’s radar. Speaking of which, the gas price depends not on the oil price on the markets?
Natural gas is what I am referring to, not gasoline.
I agree with you but as it has been said by Hans Verbeek, the price of natural gas increased with the increase of oil prices. We are not with natural gas as with oil in a situation of shortage. As far as I know, it is regularly said that the price of gas is pegged to that of the oil, no matter the situation of natural gas supply. Of course, it depends on the contract of oil supply. And there is also speculation about gas price.
Natural gas market is a local market, not global.
In the Netherlands (addicted to natural gas) natural gas futures skyrocket.
https://www.theice.com/products/27996665/Dutch-TTF-Gas-Futures/data?marketId=5285043&span=3
Germany, Belgium, France are in the same market (boat)… I guess the ECB will have to print even more euros to pay for the gas.
i think that WE are going to pay for this before the ECB prints more euros.
Some years ago the asian markets (Japan, Korea, China principally) had contracts that were strongly and directly tied to oil crude price, with very long contract periods (e.g. covering the full life time for whatever LNG plant is the supplier). The increase in LNG supply and volatility in crude prices may have weakened this tie in recent years but I am no longer in the loop. There has been a move for the utility purchasers to partly fund the LNG plants and therefore have a greater say in prices. European markets are more flexible (apparently especially in the UK where prices are set at the National Balancing Point and there is a variety of sources: LNG, Troll, Ormen Lange, UK fields, various continental inter-connectors (some with direct access to storage volumes) – though I don’t think we notice a lot. of benefit in our bills) and were less coupled to crude prices, but the growth of LNG imports may be changing things. The USA price is set at Henry Hub and used to be considered more coupled to crude than European markets but again this may have changed over the last five years.
The growth in LNG supply has made the market more global with some shipments available at spot prices rather than through long term contracts.
Or maybe people will stop wasting so much of it.
Shallow sand,
Yes over $3/Mcf now, I use $2/ Mcf in my Permian models, perhaps shale gas and tight oil producers will be more disciplined in the future. Though high oil and natural gas prices may make it too tempting to expand output and eventually we may see another glut. As for as the World natural gas market, perhaps Middle east producers will start to import natural gas for electric power production and reduce internal use of crude for that purpose and export more crude. This might enable more World demand for natural gas and some US natural gas could be exported, if there was a glut.
Looks like the pressure might be in part voluntary-
LONDON, July 6 (Reuters) – Investors managing more than $6 trillion in assets on Tuesday called for a co-ordinated global price on carbon and said emissions costs would need to almost treble by 2030 to reach the world’s climate goals….whose 43 members include some of the world’s biggest pension schemes and insurers,
https://www.reuters.com/business/sustainable-business/asset-owners-managing-6-trln-call-global-carbon-price-2021-07-05/
When are the US Anti-Canadian oil Advocates going to get the message that Canadian oil supply is more secure and ethical than OPEC oil.
Here we have the Biden administration pushing for ‘compromise solution’ in OPEC+ talks.
Yes, go ahead and push EVs, solar, wind, geo-thermal, etc. But why do these advocates push for no drilling on federal land and no more Cdn oil when the US is still dependent on OPEC oil to keep the price down and flowing to the US.
Somebody in the EIA needs to bring a clear message to Biden and the anti oil crowd that the current US direction needs a course correction. Maybe $4/gal gasoline might start a rethink.
https://www.reuters.com/business/energy/biden-administration-pushes-compromise-solution-opec-talks-2021-07-05/
It doesn’t matter, Canadian production is negligible and low quality. Oil is already 2/1 eroi and Canadian API is half light oil so it’s basically useless.
Mark
Not sure where you get your info but here is a clarification.
Canada is the third largest Non-OPEC producers after the US and Russia at just shy of 5,000 kb/d. Also we have third largest proven reserves behind Saudi Arabia and Venezuela.
The oil sands have an EROEI of 5 to 1. It used to take about 1000 ft^3 to make a barrel of synthetic sweet crude which had a higher quality than WTI. Very low sulphuric and no asphalt bottoms. At times it sells at a premium to WTI.
New extraction and upgrading technology, such as use of solvents has increased the EROEI.
Since most of our oil goes to US refiners, they don’t think that it is useless.
Produced water is transported a thousand miles at fifty miles per ton gallon. A water cut of 10 requires more oil than is produced, which is about where oil sands are.
Just mathematically what Canada is doing cannot be a useful net energy source unless they dump wastewater on farmland or whatever.
Ovi,
Mark posts under mustang19 over at peakoil.com. See the Wolfcamp thread there to get an idea of his knowledge.
https://peakoil.com/forums/new-wolfcamp-data-t78034.html
and
https://peakoil.com/forums/viewtopic.php?p=1468045
Canada is the world’s fourth-largest oil producer. I would not call their production negligible as they are producing 4.8 million barrels per day. However, I would call any potential increase in Canadian oil production negligible. They first hit 3.8 million barrels per day 8 years ago. Regardless of their huge amount of reserves, for the most part, they must heat the sands, in situ, before they extract the oil. That is an extremely expensive and slow process. It will take them at least another 8 years to hit 5.8 million barrels per day… If they ever do. I would not be at all surprised if they peak out at about 5 million barrels per day.
Canada will not save the world from peak oil.
“Canada will not save the world from peak oil.”
Funny Ron.
Canadian oil will be useful to whoever gets to import it.
I must agree with Ovi, in that the US by and large seems to undervalue the product of its neighbor, and will likely learn the hard way about that. Ovi, I think it will take more than $4, maybe $5-6. Already many western states are in $3.75-4 range. As far as I can tell the price is not yet restricting demand.
At this site you can see the average price by county (just click on the state map)-
https://gasprices.aaa.com/state-gas-price-averages/
Hickory, I was not trying to be funny. And I agree with Ovi also. Canadian oil is very important to the USA as well as Canada. But we are talking about two entirely different things. You are talking about how important Canadian oil is and I am talking about Canada’s influence in preventing the peaking of world oil production. They are two entirely different things.
Canadian oil is very important in supplying oil to the USA and elsewhere and controlling the price of oil. But it is virtually of no importance in delaying the peak of world oil production.
Ron all the barrels count towards the World total. There are no specific barrels that delay the peak or not, we just add them up and compare to previous totals.
I know Ron, I just think its funny to imply that anything will ‘save the world from peak oil’.
Good lore Dennis, I know that. I just didn’t fall off a turnip truck. I was talking about Canada’s ability to increase production. I really thought that was pretty obvious.
Ron,
Canada will increase output, along with OPEC, US, Brazil, and Norway, the combined increase will more than offset decline elsewhere and overall World output will increase to a level that is higher than the previous peak. That is my expectation, a new peak by 2025, with the ultimate peak between 2025 and 2030, best guess 2027/2028 at about 86 Mb/d+/1 Mb/d. Possibly there will be an undulating plateau over that 2025 to 2030 period followed by decline after 2030.
“Canada will increase output, along with OPEC, US, Brazil, and Norway”
Especially absurd statement.
OPEC seems to be cutting. UAE peaked years ago, ghawar capacity was admitted overstated in the ipo.
America cannot grow even if wolfcamp does.
Brazil Libra field is like 100kb per day for ten years. They have no other prospects.
Norway peaked years ago.
Nobody said previous peak will be surpassed, only that output will increase from the current trailing 12 month average output of C plus C in those nations. OPEC output has been increasing and will continue to do so. The World peak was in 2018, output for nations at the previous peak in 2018 is likely to be surpassed for US, Canada, Brazil, Norway, and OPEC compared to annual average output in 2018. We will revisit in 2025 and see if I am right about World annual average C plus C output in 2024 having surpassed 2018 average annual C plus C output.
Dennis,
Ok fine, you keep lowering your predictions which is a start.
Mark,
I have never said that output will not peak, my guess remains a peak in 2027/2028 at about 85-86 Mb/d for World C+C output, not every nation will achieve its previous peak (Norway and US for example I expect to remain below previous peak C plus C output), I do expect that OPEC may come close to its previous peak and I expect Canada and Brazil to climb beyond previous peak output, but the main point of reference is output levels in 2018 as that was where the current World peak occurred, also note we are not talking about a big increase from the previous peak, just a couple million barrels per day.
Dennis wrote: Nobody said previous peak will be surpassed,…
Oh give me a break Dennis, you have been saying exactly that for years. On almost every thread you post something claiming that the peak will be in the late 2020s. Just today you wrote: my guess remains a peak in 2027/2028 at about 85-86 Mb/d for World C+C output,…
He is saying production will recover to 85. He has a complicated loopy loop model.
I don’t think the hubbert curve is appropriate for forecasting world production because there’s so much unconventional and no field level data, however, it’s likely production will just go straight down 5-10 MMb/d per year from here as it already is.
In the past production fluctuated due to OPEC manipulation and peaking of various countries. Now that nearly the entire world is past peak, and OPEC has already made a sizeable production increase, there seems no way to slow the fall.
Ron,
The point is that individual nations do not have to reach their previous peak in order for output to increase. I look at where nations were for their annual average output in 2018 and whether that level can be surpassed at the World level. Claiming that this or that nation is past their peak has little bearing on that question.
Let’s take the US as a simple example. I think it is likely the US may never reach it’s previous average annual peak output of 12248kb/d. The important fact is that 2018 was the peak in World output, with average annual output that year of 10964 kb/d, the US exceeded the 2018 level in 2020 and output is likely to approach the previous peak over the next few years, though my guess is that it may fall short. By 2023 or 2024 the US might produce at an average annual output of close to 12000 kb/d in my opinion.
Mark,
We will see. So 66 Mb/d in 2022 for average annual World C plus C output? Average World C+C output was 76 Mb/d in 2020, so 5 Mb/d each year would give us 10 Mb/d in 2 years, if we took your average prediction of 7.5 Mb/d decline each year we would be at 61 Mb/d for average annual World C plus C output in 2022. Do you want to stick with that estimate? My guess is a minimum of 79 Mb/d in 2022, and my best guess is 82 Mb/d in 2022 for World C plus C average annual output.
The point is that individual nations do not have to reach their previous peak in order for output to increase.
Dennis, I know that. I have been thrashing this peak oil straw for just under 20 years now. I know how it works. I am a little shocked that you think that, from time to time, you must explain the basic concepts to me. When the peak hits or did hit, some nations will still be increasing production and some will be decreasing. But the volume produced by those decreasing will be greater than the volume of those decreasing. But hell Dennis, you already know this shit. So why am I wasting time explaining something to you that you already know? Now ask yourself that same question.
Claiming that this or that nation is past their peak has little bearing on that question.
Now you are talking bullshit. If the USA and Russia have reached their peak, two of the three world’s largest producers have a tremendous bearing on the question. That is the question: “Has the world reached peak oil?” And if the third, Saudi Arabia has also peaked, then “game over”.
Dennis, most of the world’s smaller producers are already in decline. Just look at OPEC’s eight lowest producers. That is all of them except Saudi, UAE, Kuwait, Iran, and Iraq. Dennis, that is what virtually all the world’s small producers look like. All that peak oil has been waiting for is one or two of the giant producers to top out.
That has now happened! End of story.
Dennis,
World production has been something like this:
2018 95m
2019 95m (93m without us growth)
2020 85m (87m without us decline)
So production is in a 2-4m per year accelerating fall. Let’s say 1m to be generous.
That gives production without covid, ignoring US, as
2019 82m
2020 81m
2021 80m
2022 79m
2023 78m
2024 77m
2025 76m
2026 75m
2027 74m
2028 73m
2029 72m
2030 71m
Then it will start accelerating in most countries as the hubbert curve rolls over. Maybe 3m per year.
2031 68m
2032 65m
2033 62m
2034 59m
2035 56m
2036 53m
2037 50m
2038 47m
2039 44m
2040 41m
2041 38m
2042 35m
2043 32m
2044 29m
2045 26m
2046 23m
2047 20m
2048 17m
2049 14m
By 2050 Iran, Iraq and Canada will be the last producers. Iran doesn’t export much, Iraq will be similar and Canada has tar sands that are useless.
Oil trade will fall faster. The useful oil supply might be something like
2019 82m
2020 79m
2021 76m
2022 73m
2023 70m
2024 67m
2025 64m
2026 61m
2027 58m
2028 55m
2029 52m
2030 49m
2031 40m
2032 31m
2033 22m
So by 2030 pretty much the entire world is starving.
Mark,
I focus on World C+C output, this seems to roughly match your “useful oil” number, I have never seen oil categorized that way (useful is a very subjective term and thus not all that useful).
So you predict about 55 Mbo/d for average World output of “useful oil” in 2028, can you clarify what “useful oil” is, it seems to be pretty close to World C+C output in 2019 which was 82360 kb/d. I expect that in 2028 World C+C output will be at least 83083 kb/d, about 28000 kbo/d higher than your estimate. It will be interesting to see who is correct on this point.
Useful oil is what’s being traded. This isn’t tracked anywhere but at least in the US imports are declining rapidly.
https://unctad.org/system/files/official-document/rmt2020ch1_en.pdf
https://unctad.org/system/files/official-document/ditcinf2021d1_en.pdf
You can see here that oil trade fell 30% in 2020 while production fell 10%. Trade falls faster than production because countries feed their own population.
The real measure here is calories per capita falling below 2000 and causing ww3.
For the anti-canadian-oil people gulf oil is more ethical than canadian – it’s generated by people of color, and the candadian from white, which are evil by nature. So the left speaking.
Here alle the left and green political womans like to make state visits in Iran, wearing the scarf proudly to show they are emancipated and political correct.
In the local news here my town rejects a nat gas pipeline – they say they don’t need a gas backup plant they want to stay CO2 free. There is literally no storage for electricity here – they even prevented a pumped hydro plant in the Schwarzwald because the builder could not guaranty it won’t store atomic energy. So they have to fire up the coal and gas plants at evening… It’s a green government here.
The builder tried even a golden bridge – said the pipline can transport green gas and hydrogen once they build the facilities- no chance. So it will take years at the courts.
It’s such an odd debate when civilization is collapsing and none of the countries mentioned have worthwhile oil reserves.
Mark , you are being too cautious in factoring in a decline of 1 mbpd . Even the most conservative
analyst factors in a 2% decline rate which would mean 1.75 mbpd on a base of 85mbpd . Decline rates I agree are difficult with new shale at 50% and the old conventional at 1to 2% . However the average rate will accelerate in time as shale dies and also as the horizontal (infill) wells reach their expiry date . HZ drilling was started if I am correct 10-15 years ago and those wells are now in their sunset years . Since they all started as a lumpsum they will die as a lumpsum . From 2021 starts the pain and it will increase as the screw is tightened .
I know. I expect it to fall a lot faster. But even a 1% decline leads to ww3 in a few years.
That leads to the question, how will the world handle the decline ? From 84 mbpd to 76mbpd has meant the annihilations of the travel, tourism , hospitality and airline industries and many others . Who will be sacrificed every year as we go down the ladder of energy poverty ? When do we go from cutting limbs so that the body can survive to being in a state of coma because all the cutting caused extreme blood loss . I compare the human body to the planet. Airways ,shipping lines , highways , roads as veins and arteries and oil as the blood running thru the vascular system that keeps the body alive . If the blood is lost then all is lost .
” You can see here that oil trade fell 30% in 2020 while production fell 10%. Trade falls faster than production because countries feed their own population.
The real measure here is calories per capita falling below 2000 and causing ww3.”
Mark , an interesting observation . This is termed as ” resource nationalism ” .
Ovi. I mentioned $4 gasoline losing the House and Senate for the D’s awhile ago.
Maybe part of the debt we are piling on as a result of COVID will end up going towards the drilling of more shale wells once Biden Admin sees polling on what $4 gasoline does for it.
Shallow sand,
It’s likely the order for no new leases on Federal land and water will be revoked in time. They will study it and decide, not a problem and resume permitting.
The oil comeback ? Where ? All is Ponzi .
“This has real-world consequences… orders for oil- and gas-mining equipment languish at about a third of the mid-2010s level. US oil production, as I’ve noted in the past, continues to fall, and oil prices continue to rise.”
https://asiatimes.com/2021/07/the-great-federal-debt-ponzi-scheme/
Courtesy OFW .
Reuters:
BRASILIA, July 5 – Brazilian oil producer Enauta Participações S.A. (ENAT3.SA) said late Monday that it halted production at two of its three wells in the Atlanta Field, while a failure in their pumping system was also discovered.
One well is expected to resume production in the second half of this month, and the second well by August, Enauta said.
Now Biden wants more oil:
https://www.reuters.com/business/energy/biden-administration-pushes-compromise-solution-opec-talks-2021-07-05/
But not from Canada – no love for oil pipelines.
So much for the green agenda – when the midterms get nearer, it’s drill baby drill again. But please not in the own country – others should do it.
Could be one from our politicans.
No, when the shortages begin it won’t be “drill baby drill” … it will be, “Let them burn hydrogen” 😘
Could even change his mind and re-issue the presidential permit for Keystone XL.
Pollux had posted this link ,
https://www.reuters.com/world/middle-east/uaes-adnoc-deepen-crude-oil-term-supply-cut-sept-sources-2021-06-28/
So they want to cut exports but increase production ???? What do they plan to do with the extra output ? What is the game plan ? Any thoughts ?
The decision-makers of UAE must have been informed that it was ”la fin des haricots” for their domestice oil production. As a result, they decided to reduce their production in order to spare what it is left to produce. By the way, it’s the representatives of UAE who raised a point (increase of the quota to determine the level of cut in oil production), wich had the effet to postpone the decision about the volume of oil to add on the market. I suppose that they don’t want to appear as people in oil production decline.
How high petrol prices lower demand . Petrol is now $ 1.35 per litre in India .
https://www.telegraphindia.com/west-bengal/calcutta/motorists-opt-for-smaller-refills-because-of-steep-rise-in-petrol-and-diesel-prices/cid/1821343
Real life
https://www.telegraphindia.com/west-bengal/calcutta/covid-pandemic-fuel-past-rs-100-expenses-shoot-up-in-calcutta/cid/1821481
From The Atlantic
The Energy Revolution Is Tweaking OPEC Out
https://www.theatlantic.com/newsletters/archive/2021/07/energy-revolution-tweaking-opec-out/619372/
Interesting discussion of the forces at play in opec supply decisions.
Shifting forces under consideration.
I do not see global energy demand declining anytime soon, beyond pandemic.
The author of this paper has managed to take the fact that “the UAE wants to increase production more than 400,000 barrels per day” and extrapolate from that:
– OPEC is scared of the energy transition.
– The energy transition is well under way.
– The energy transition is a driving factor in realpolitik strategy.
– Electric transport is going to very soon drive down the price of oil.
…and more. All from the UAE wanting to increase production… Something which most OPEC countries have ALWAYS wanted to do during a high price environment. Whether or not any of the above conclusions are true, basing those conclusions off this single fact is ludicrous. This article is hilariously out of touch.
Electric cars are hitting the vehicle manufacturers hard, but the oil industry will cushioned for years by the existing fleet of oil burners.
It’s hard to watch the carnage in the car industry without imagining its effects downstream, but it will take time.
IRAQ DATA: SOMO says oil production falls in June amid tighter quota compliance
Total oil production fell to 3.862 million b/d in June, down from 3.879 million b/d in May, SOMO figures showed.
Iraq, whose quota rose to 3.954 million b/d in June from 3.905 million b/d a month earlier, improved its compliance in May, according to SOMO figures. Iraq’s quota rises to 4.016 million b/d in July.
In other words, Iraq produced 92 000 bpd below its quota in June.
Saudis Raise Oil Prices After OPEC+ Fails to Add Supply (bold mine)
In its main market of Asia, Saudi Aramco increased the official selling price, or OSP, for Arab Light crude by 80 cents a barrel to $2.70 above the regional benchmark. That’s the biggest month-on-month increase since January, and suggests the oil giant won’t raise supply next month even as it sees the market tightening.
Comments have been made above on the cost of extracting oil sands synthetic crude and the low EROEI. Since many of the producers are swimming in cash flows, their operating costs must be well below WTI. With an EROEI around five, their energy costs, primarily NG, are not significant. Oils sands crude known as Western Canada Select (WCS) is heavy and is a preferred feedstock for diesel and jet fuel, whose demand will fall much slower than gasoline.
“With crude prices soaring, analysts expect Canadian oil sands producers to churn out substantial free cash flow in 2021. Canadian Natural Resources Ltd. CNQ-N -1.17%decrease
alone is expected to produce nearly $8-billion in 2021, according to a May estimate from RBC Dominion Securities – and that’s after paying $2.2-billion worth of dividends. Suncor Energy Ltd., meanwhile, is expected to produce $6.4-billion after paying its own dividends.”
But some counterarguments could tempt investors to reconsider. For one, oil sands producers are swimming in free cash flow, and the expectation is that they will use the money to boost their dividends. Suncor has targeted increasing its own dividend to around $2 a share in 2025, more than double the current level of 84 cents.
CIBC analysts also stressed that oil sands production is “cost competitive in a world where focus shifts away from supply growth.” Oil sands producers were once seen as uncompetitive relative to rival shale oil producers in the United States, but CIBC estimated that the all-in sustaining costs of the oil sands have fallen to US$25 to US$35 a barrel, compared with U.S. shale at US$25 to US$32.
Over time, the cost of producing a barrel of oil sands crude dropped – and the fervour for U.S. shale oil producers also faded. The new-found American oil attracted scores of producers, and within a few years the market was oversupplied. Many funded their growth with debt, and their highly-levered balance sheets were incompatible with volatile crude prices, leading to multiple waves of bankruptcies.
But CIBC’s analysts believe oil sands crude might actually be a relatively safe harbour.
“We view there to be a general misunderstanding of the relative supply/demand for the various grades of crude globally,” they wrote in a recent report, adding that there is “a global undersupply situation in heavier grades with declining volumes from Mexico and Venezuela.”
Although oil demand is likely to fall as the adoption of electric vehicles accelerates, the analysts noted that refiners are likely to retool and hunt for heavy oil to maximize production of jet and diesel fuels. A number of airlines have acknowledged they won’t be able to use biofuels for many years.
Full article here.
https://www.theglobeandmail.com/business/article-canadas-oil-sands-producers-are-awash-in-cash-flow-again-but-esg/
Ovi,
I have been looking forward to an updated CAPP oil forecast, was hoping it would be out by now, maybe August. Found oil sands data through 2020 from CAPP, over 2008-2020 period the trend has been about a 155 kb/d increase each year, though it looks like it slowed quite a bit since 2016, perhaps it will increase yet again if oil prices remain above $70/bo. Based on your comment above I would think so, but I am often wrong. It will be interesting to watch, I think there is room for Canadian output to grow.
Dennis
The impression I had was that oil sands output, while prices were right, could grow at about 100/ kb/d/yr from early projections. The combined max with other oils would peak at 5,500 kb/d. As costs have risen, plans to open new fields have been put on the shelf.
See attached
https://www.ctvnews.ca/business/dozens-of-new-oilsands-projects-have-been-approved-but-don-t-expect-them-to-be-built-anytime-soon-1.4833848
Ovi,
Yes the CAPP forecast from 2019 has the increase at a slower rate than in the past, no doubt the easiest stuff was developed first, new projects will likely be more challenging. Much will depend on future oil prices. At $100/bo development might be more rapid than at $70/bo.
Difficult to predict the rate of development, I just use the CAPP forecasts and then assume it gradually slows down to zeo beyond the end of the CAPP forecast and starts declining after 5 years or so. A guesstimate at best.
The discussion over the precise timing of Peak Oil seems to gloss over the fact that not all oils are created equal. Oil is unique amongst fossil fuels in being the source of transportation fuel. And the real goods part of the transportation system, the part that matters most to human prosperity, runs overwhelmingly on diesel power. It is diesel, not oil, that is the key enabling resource for the globalised transportation systems that underpin the real goods economy. It is for this reason that NGLs are not oil. NGLs go into polymer production or heating. Not much NGL is used in transportation. Condensates are not oil. Refinery gains are only relevant if they increase the quantity of middle distillate diesel available to the customer at the refinery gates. Tight oil is light relative to most conventional oils and needs to be blended with Canadian syncrude to have the right viscosity and heat capacity to be processed in most refineries. The Biden administration have seriously damaged prospects of lifting US liquid fuel production to previous highs, by blocking the flow of syncrude.
Whether or not Peak Oil has passed, Peak Diesel almost certainly has. And it is Peak Diesel that matters. We should probably say ‘Peak Surplus Diesel’ as I would suggest that a lot of diesel is used moving shale drilling rigs around the country and transporting the resulting tight oil, often by road tanker.
It would be interesting to see an article on how global diesel production has fared since 2000. This will give a better indication of how much time we have left than focusing on C&C volumes that are increasingly light and increasingly superfluous.
Tonyh,
Note that we focus on crude plus condensate (C plus C) at this blog, so NGL is not really considered “oil” by most of us, note also that tight oil is a small proportion of overall world C plus C, about 7 of 83 Mb/d at the World peak in 2018 or a little over 8%. The rest of the crude oil supply is mostly getting heavier.
About 74 thousand barrels per day of light distillates, middle distillates, and fuel oil were consumed in 2019 by the World based on BP regional oil data, about 35 kb/d of this total was middle distillates. Chart below shows how this total has changed from 1965 to 2019 for middle distillates (diesel and jet fuel).
TonyH,
Updated chart from BP stats 2021, I leave off 2020 data which was 30500 kb/d (about the 2009 level) in order to show the trend from 2000-2019. About a 450 kb/d increase on average over the 20 year period.
Many thanks.
TonyH,
You’re welcome.
Ovi.
Do you have a chart of world oil production less USA from 2005 to current?
If not, is there anyone who could post that or refer me to where I could find that?
Thanks!
Shallow Sand
I will put it together for you in about two hours, unless someone does it before that.
Shallow Sand
Three charts
As requested World C Plus C W/O US 2005 to March 2021.
Peak November 2016, 73,678 kb/d
Ovi.
Thanks so much!
To me, this data is most important to the big picture regarding future world oil supply.
Shale was almost the sole driver of worldwide supply growth during the above period. Only high prices from 2007-14 (absent the short GFC drop) were able to cause worldwide minus USA growth (2015-16) and this growth couldn’t be maintained.
The only US shale basin with even the potential to grow significantly is the Permian. Can it get USA back to growing 1 million plus a year? Everything I am reading now is doubtful.
Is there any reason to think worldwide less USA can get back above 72 million BOPD?
An alternative way to look at this is to consider annual average output, my guess is that the World less US can return to 72 Mb/d of C plus C output with higher output from OPEC, Canada, Brazil, and Norway relative to the 2018 level. I also expect the US can reach close to 12000 kb/d in the future, less than the 2019 peak, but more than output in 2018 at the peak. For annual average World less US C plus C output the peak was 2018 at 72119 kb/d.
Chart below is for World C plus C less US C plus C output.
Dennis,
Please can you show the same chart without OPEC
We all have our own views about OPEC and it would be great to see how WORLD ex US ex OPEC has behaved over the last 15 years. Then we can make up our minds about whether US is going to go back to its previous peak and whether OPEC (or its large constituents) can go back to their prior peaks. As Ron had already shown, the smaller OPEC members have seen a significant decline in production since 2005 but that seems to have been more than made up by the bigger players, especially Russia.
Thanks in advance for the World ex-US ex-OPEC chart.
Dennis. Do you agree that high oil prices 2005-14 were a key driver of worldwide less US growth 2015-2016?
My view is that worldwide requires higher prices than 2015-2021 to date to go above 72 MBOPD and likely needs higher just to get back to 72 MBOPD.
It wasn’t long ago that most were calling for oil prices to never be much higher again due to “peak demand.”
“It wasn’t long ago that most were calling for oil prices to never be much higher again due to “peak demand.”
Perhaps I missed it, but I haven’t seen any good explanation of peak demand in this decade [other than the claims by Hole in Head that the economy of the world will never recover from depression].
It will take a followup catastrophe to create a demand peak, as I see it.
I don’t think there are enough plug-in vehicles on the global road yet, to create peak oil demand.
Shallow sand,
I agree we will need higher oil prices than the 2015-2020 average (about $58/bo for Brent in 2020 $) to see output increase. I expect Brent average price aver the 2022 to 2027 period to be $80/bo in 2020 $ at minimum. I do not expect peak demand will become a factor until 2033 at the earliest, up to that point oil prices will need to be high enough to destroy some demand to keep the oil market balanced.
I also agree that high oil prices from 2005-2014 (about $101/bo for Brent in 2020$) were a major driver for the expansion of tight oil output and perhaps oil sands output as well. Tight oil also expanded quite a bit in the 2017 to 2019 period (average price for Brent was about $65/bo in 2020$) even with relatively low prices compared to 2005-2014.
SS , there is no oil and if it is there the pressure is gone . Prices will have to go to infinity to build back pressure . Hey a new slogan ” build back pressure ” . 🙂 . Pass it on to Biden & co : .
Ancient archer,
Chart below. Seems a rough plateau from 2010 to 2019 around 38000 kb/d. Peak was 2015 at 38760 kb/d only 34 kb/d less in 2019, about 0.09% less (34/38760 times 100).
Ancientarcher,
Realized I didn’t do what you asked. Redid World C plus C ex OPEC ex US with 2005 to 2020 data and added trendline using all data (2005-2020).
Dennis,
Many, many thanks for the charts!
I wanted to see what the world ex-US, ex-OPEC will look like because I thought all the increase in global C&C production from 2010 onwards came from either OPEC or US Shale. And it seems that the thesis holds true – World ex-US ex-OPEC plateaued between 2010 to 2020 with production between 37.5mmbpd and 38.5mmbpd. The degree slope of the slope in your chart is really tiny close to zero i.e. 1mmbpd increase in production over 15 years.
World ex-US ex-OPEC represents 46% of global production. And that has zero chances of going up.
So, all depends on the US and OPEC .
In the US, it all depends on US Shale. Some life left there, you say and I think possibly. Enough to reach a new peak in US Shale productioin – possibly, but conventional US production will also start seeing the effect of the reduction in capex over the last 7 years. A new peak in total US production seems unlikely.
So all depends on OPEC
And within OPEC it all depends on Russia, Saudi and the Gulf OPEC states (including Iran) – the rest are all declining. Of these 3 groups, I think the gulf OPEC states are going to see an increase in production going forward. Russia and Saudi – I am not so sure they will be able to sustainably produce above their prior peak going forward.
And remember, everyone else except the Gulf OPEC states are either holding steady or declining.
What happens to global production in that case? Down, down, down I think
Ancient archer,
I agree that World C plus C will eventually decrease, but I think the World will either stay on a plateau around 83 Mb/d or (more likely imo) increase output slightly to 85 to 86 Mb/d by 2027/2028.
Remember that US was 1.3 Mb/d below it’s peak in 2018 when the most recent World peak in C plus C occurred, I am confident that OPEC will be able to return to it’s 2018 average level of output.
The World C plus C ex US ex OPEC increased at an average rate of 300 kb/d on average from 2005 to 2018, even if this slowed to a plateau, I believe OPEC and US output combined can increase to a higher level than achieved in 2018. Oil shock model below uses 2 parameters for a 6th order power law dispersive discovery model of the form
cumulative discovery= U/(1+(k/t)**6), where t is years after 1870 with t=0 being 1870, U=2800000 million barrels is the total discovered oil and k=98.9714 determined by fit to discovery data cumulative discovery is in millions of barrels per year. The average time spent in fallow, build, and maturation stages is 13 years used for a maximum entropy probability distribution, so a single parameter used for each of these stages of development, the last parameter is future extraction rate, held constant at the 2019 rate of 5.6657% from 2021 to 2294. Extraction rates from 1871 to 2020 are based on historical output and simply match model and data.
Model is below, note that I was trying to reduce the number of parameters to a minimum and by doing so I get a big jump in output in 2021 that is not realistic, I expect the extraction rate in 2021 to be lower than shown in this model, but by simplifying the model it becomes less precise. In any case the future is unknown so I simply picked a past extraction rate and assumed it would remain unchanged in the future, probably incorrect.
Saudi Arabia alone is falling 1mb per year. That’s the main problem with your model. ROW minus Saudi might be pretty flat for a few years.
During the Aramco IPO they said ghawar was overstated and that was three years ago.
Mark,
Saudis cut production to support prices in 2019 and then due to the pandemic in 2020, they will increase output going forward. If not oil prices rise and some demand is destroyed, there are other producers besides KSA, but it is quite doubtful that Saudi output will fall below current levels any time soon and much more likely that KSA returns to around 10 Mb/d when oil prices reach $85/bo in 2022.
OPEC already made a large production increase. It was its largest increase ever, 2.1 million barrels, compared to 2 million in 2004. They have no spare capacity. Even in 2008 when oil was $120 they were unable to increase capacity.
Global oil production is where it should be after the recent increase, something radical would have to happen for opec to grow more.
https://www.google.com/amp/s/www.forbes.com/sites/michaellynch/2019/04/05/declining-production-at-saudi-arabias-largest-oil-field-is-not-cause-for-concern/amp/
“The other item that created at least a few headlines was the table on page 88 which referred to production capacity by field, showing that the supergiant Ghawar field has a capacity of “only” 3.8 million barrels per day, down from the conventional wisdom of 5 mb/d. ”
This was in 2019. At a typical decline rate of 8% that means ghawar peaked in 2015 or so. They delayed the decline a little by fracking. And even by 2015 they were in tertiary recovery at 90% water cut so it actually peaked a lot earlier.
Think of what you are saying at a field level. So far your model is abstract but what does this mean for ghawar, are you saying there is going to massive offshore growth out of nowhere or discoveries in a country that has had none for 70 years?
So once you just look at the actual fields you are talking about you see the absurdity.
Saudi production followed a curve over the 2010s as fracking, manifa and various offshore fields were added. It peaked in 2009 from a safaniyah expansion, 2005 from south ghawar fields discovered in 2003, and in 2000 north ghawar, which was the real peak of Saudi conventional oil.
There’s no other lower resource grade for them to tap. They’ve already got everything so where is the growth going to come from? Name a field or something, not just a guess based on reserve estimates they already apologized for to investors.
Dennis,
You look at things from a TOP DOWN perspective. Now that your modelling methodology is a bit clearer, I can understand where you are coming from. Your modelling methodology tends to give disproportionate weight to the TRR. And then you fit the curve.
Most others on this board think from a BOTTOM UP perspective. We look at individual fields if possible but if not, then countries, regions etc.
Thing is, all oil fields decline. So, it is natural that the bottom up people including myself have been shouting peak oil for the last 15 years. But the top down people have been correct – oil production has kept going up. But that has been achieved because of new extraction methodologies (mostly to do with EOR), technologies (US Shale) and not much because of a vast number of new fields (conventional).
I think we are currently at an inflection point. The bottom-up people are gaining ground and will be proven right because of (1) not much discovered resources in the last 20 years, and (b) not enough capex in greenfield projects.
Take for example, offshore. Production has been flat at 27mmbpd for the last ~10 years, now comprising 1/3rd of global production capacity. We know that not many new discoveries have been made in the last 15-20 years except for Guyana. Greenfield offshore capex has come down from $160bn in 2014 to $58bn currently. Now, tell me is this sustainable? Production has been held up due to EOR (sidetracks, water injection and such) but it can’t hold on for ever without a higher level of greenfield capex.
If you have the data, what does your model say about offshore production? A top down analysis might very well say that production will be flat but today’s discovered fields and capex are tomorrow’s production. The bottom up people like myself will disagree. I see no way offshore production being flat in a 3-4 year horizon, it most probably will see annual declines 1mmbpd or more starting very soon.
Mark,
Saudi reserves were audited by outside experts, conclusion was that proved reserves were at least 270 Gb.
See article linked below including links to two other posts by Robert Rapier. I agree with Rapier.
https://www.rrapier.com/2019/02/saudi-oil-reserves-growth-has-lagged-the-rest-of-the-world/
Saudi reserves were audited by outside experts, conclusion was that proved reserves were at least 270 Gb.
That audit was about as legitimate as the Cyber Ninjas audit of Arizona’s voter ballots. But of course, Saudi has 270 billion barrels of reserves because they have magic oil. Every time they pump out a barrel of oil another barrel magically appears to take its place. It has been doing that for over 40 years.
The collapse of liberalism is not controversial, saudis are continually hinting at collapse and what you are arguing is just a confused attempt to make it look like libs will survive.
Mark, what the hell are you talking about. What has liberalism got to do with Saudi or their reserves? Just what kind of liberalism are you talking about? If you are talking about US political liberalism, as opposed to Trumpism, it is one hell of a long way from collapse. The exact opposite is true.
Ancient Archer,
For conventional oil production and extra heavy oil, the analysis is top down, for tight oil I analyze by play so I have a Permian Basin, Eagle Ford, North Dakota Bakken/Three Forks, Niobrara, and “other US LTO” (US tight oil not included in the previous 4 plays) models.
See link beliw for my earliest work on tight oil
https://oilpeakclimate.blogspot.com/2012/10/using-dispersive-diffusion-model-for.html
You can follow along in that old blog for the development of my thinking.
My most comprehensive post (explained in great detail) was at link below
https://peakoilbarrel.com/oil-field-models-decline-rates-convolution/
For a bottom up analysis for the World, such as those done by Jean Laherrere, I see no reason to reproduce his work. Using a top down World conventional oil HL, I get a URR of 2400 Gb, the USGS estimate for conventional crude plus condensate (excludes extra heavy oil from Canadian and Venezuelan oil sands and tight oil) was about 3200 Gb in the World Assessment in 2000. My best guess scenario for conventional oil uses the average of these two estimates at 2800 Gb URR for conventional crude plus condensate.
It is far from clear that everyone else is holding steady or declining. Consider chart below which looks at the OPEC5 large producers (Saudi Arabia, Iraq, UAE, Kuwait, and Iran) and World C plus C excluding OPEC5.
World ex OPEC5 increased output at an average rate of 322 kb/d from 2004 to 2018 while OPEC5 increased output at an average rate of 405kb/d over the same period. The future might be different, in fact it is likely to be different, but whether peak and decline has arrived or not is far from clear. My guess is that peak oil (CplusC) is 5 to 10 years in the future or at minimum we will see a bumpy plateau in output around the 2018 level over the next 5 to 10 years. Simply an alternative view point from the prevailing sentiment here at POB.
I know just as little about the future as anyone. My expectation about the future is based on modelling of past output and a set of assumptions about the rate of development of resources, future discoveries based on past discoveries and a discovery model fit to those past discoveries (and accounting for future reserve growth) along with bottom up estimates of World resources by Jean Laherrere, Steve Mohr, and the USGS to estimate eventual crude plus condensate URR. Historical extraction rates based on this modelling can be estimated and a range of future extraction rates can be assumed to model future output. Actual future extraction rates, development rates, and discovery rates (reserve growth is considered a part of discovery in my model) are of course unknown.
Dennis ,the audit was done just prior to their desire to do the IPO on NYST . It was shredded to pieces by all financial analysts as being bogus . Result Saudi Aramco listed itself on the Jeddah stock exchange . I take evaluations by auditors with a pinch of salt . I can tell you stories galore . My son works at Ernest and Young (over 15 years) and i get a front view seat of their shenanigan’s . You are not at fault as that is the way the system is designed , just like EIA forecasts ,always off the mark but that is all that we have to work with .
Dcoyne,
Saudi admitted that it’s reserves are fake.
https://ourworld.unu.edu/en/wikileak-cables-saudi-arabia-oil-reserves-overstated
Is the number you’re using the one after they admitted it being fake?
Regardless the hubbert curve points to about 200gb Saudi EUR which means 600 gb reserves, double your estimate. Saudi has already produced 200gb so your estimate implies production needs to crash into the dirt right now.
Hole in head,
I am not convinced, I found Robert Rapier’s arguments convincing, you can read them and tell me specifically where he got it wrong.
Dennis , you are at liberty to believe Rapier , however if the Saudi’s themselves admitted it was bogus then I rest my case . When a confession is made under no duress , then it holds good even in the court of law .
Hole in head,
A lot can change in 10 years, that article is from 2011. I remain unconvinced. Perhaps Saudi reserves are overstated in terms of proved reserves, when they reported proved reserves at 166 Gb in 1982 that was likely accurate, the bump up was probably a switch to reporting 2P reserves and 2P reserves might have remained at the 260 to 270 Gb level from reserve growth. Note that reserves have also grown in the US even before the start of the tight oil boom.
In a paper on peak oil by the Royal Society in 2014, it was stated that World proved reserves as reported by BP in 2011 was about equal to 2P reserves, so OPEC nations and perhaps others, may indeed be overstating reserves. Typically we would expect proved reserves to be about 67% of 2P reserves for the World.
Ancient archer,
I do not have data for offshore output at the World level. I have estimates for tight oil, extra heavy oil (Canadian and Venezuelan oil sands) and Conventional (which I define as all CplusC that is not in the tight oil or extra heavy oil category) oil. Just three pieces to the model.
Dennis, your own numbers refute your point and you don’t even care. You pretend to argue from authority without understanding your own authorities. The collapse of liberalism is not controversial, saudis are continually hinting at collapse and what you are arguing is just a confused attempt to make it look like libs will survive.
From Mark’s link:
“In a presentation, Abdallah al-Saif, current Aramco senior vice-president for exploration, reported that Aramco has 716 billion barrels of total reserves, of which 51% are recoverable, and that in 20 years Aramco will have 900 billion barrels of reserves.
That was written in 2011 so Saudi should be halfway to that 900 billion barrels of reserves. They should have at least 450 billion by now. And their reserves will just keep growing, and growing, and growing. You must know, Saudis do not exaggerate!
And anyone who believes a damn word the Saudis claim about their crude oil proven reserves should have their head examined. I simply cannot believe, that at this late a date, a lot of otherwise very intelligent people still believe the bullshit they continually spew out. And that includes Robert Rapier.
Mark,
You would need an argument rather than word salad. No idea what you are talking about. Be specific.
His comments must be taken in context. He said he was privy to secret scientific information indicating that Covid-19 was a fabricated bio-weapon, or some such belief.
Dennis, the specific problem is that ghawar has peaked. Furthermore, there’s no other major fields coming online. If oil production is already nearly stagnant without the largest field in the world declining 8% a year then production will go down.
Canada, Iraq and Iran are growing but those are negligible factors.
The only variable in your model that needs to change (not that you have it) is ghawar.
If we consider annual World C plus C output excluding US output from 2005 to 2018 (before OPEC cut output in an attempt to raise oil prices in 2019 and the pandemic), the trend is an average increase of about 300 kb/d each year. Over the long term (1982-2019) demand for crude increased at a rate of 800 kb/d each year on average. This suggests that if US output can no longer increase and the trend for the rest of the World (excluding US) cannot increase from the 2005-2018 trend, we would expect rising oil prices if demand returns to the long term trend.
In terms of a hubbert curve a straight line is the start of a decline. So, unless that line continues forever it’s a bad sign.
I was so bored I made a hubbert curve for all 25 top producers minus the growers. That’s 99% of global oil production. The bump in 1992 is USSR.
https://i.ibb.co/wwry3KG/925-CDCE3-39-B7-43-EB-A5-EA-197-BA05-AE447.jpg
https://docs.google.com/file/d/1J3e6ExhJGJdfjL6i7Don_q0bBd0aASfQ/edit?usp=docslist_api&filetype=msexcel
Every single one of them is in decline.
Mark,
The problem is the estimate moves over time, if you are going to do an HL for the World then do the World, I have done it for World excluding tight oil and excluding extra heavy oil, it suggests at present about 2400 Gb for URR for conventional (using 1992 to 2018). In 1997 the World HL estimate would have been 1700 Gb, the curve is concave up and the slope changes over time. In a little over 20 years the conventional URR estimate has increased by about 40% (700/1700), if fom 2018 to 2028 we see a 20% increase in the conventional World HL URR estimate (2400 times 1.2 is equal to 2880) we would be at close to 2900 Gb for conventional oil (my estimate is 2800 Gb).
Real onshore conventional oil peaked in 2000. The curve is working as intended, it’s tracking the resources which mattered at the time.
Once again you excessively aggregate production and don’t separate it out into different fields and grades. Right now, after conventional oil peaked in 2011 the hubbert curve is pretty accurate because nothing else is happening.
I’d also like to point out these shifting peaks don’t even matter. The unconventional resources which delay the peak just collapse faster, so regardless you get catastrophe around 2030.
World C plus C HL excluding tight oil and extra heavy (XH) oil using 2011 to 2019 data, URR=2600 Gb, this will likely increase in the future just as it has in the past.
Tight oil will decline quickly, but oil sands are likely to be slower to decline, there is a lot of undeveloped oil sands resources, slow to ramp and slow to decline.
I dropped the three growing countries (Canada, Iraq, Iran) from all my predictions because they seem to dominate production.
If we drop those then your estimate pretty much matches the hubbert curve at 1-1.5TB ultimate recovery. You are still forecasting a fast crash you just don’t know it, and those three producers having all the growth are basically unstable or useless.
The EUR has never increased, you are simply aggregating fields and being lazy.
Of all the things I might expect Dennis to be called, “lazy” is not one of them.
Mark,
And you are cherry picking, by pulling nations out of your analysis until you get the result you want. Laherrere gets (in October 2018) about 2800 +/- 200 for World C plus C less extra heavy oil, If we assume tight oil URR will be 100 Gb, then the estimate would move to 2700+/-200 Gb for the URR of World conventional C plus C. Now you can argue that Mr. Laherrere is too optimistic, but I am not buying it.
I am not an authority and have never claimed as much, so the argument from authority meme is BS.
Notice that you claimed after 2011 give the result you want, but not if we do not cherry pick. I use World C+C minus tight oil output minus extra heavy oil output, which is how I define conventional oil output (this is consistent with the USGS definition of conventional oil).
For Laherrere analysis see pp 15-16 and page 115 at link below
https://aspofrance.files.wordpress.com/2018/08/35cooilforecast.pdf
Perhaps because I mention Laherrere you are talking about argument from authority, I am just pointing out his analysis which is excellent in my opinion. If you disagree, you would need to be specific.
Never did I cherry pick, I simply described what I was doing.
Your estimate is almost totally in agreement with mine, it’s a fast crash, the only difference is that you see the peak in a few years whereas in reality it already passed due to ghawar peaking as aramco acknowledged. This doesn’t even mean anything to you because you aren’t modeling individual fields.
Production outside the top 8 is lower than it was in 1996. You don’t have to be that lazy, you can just discuss the four growing countries (US, Canada, Iraq and Iran) versus the rest (Russia, China, Saudi and uae).
The US decline will easily wipe out the rest. Russia is unclear. China has no particular new fields. Ghawar is in decline and UAE is the only one claiming to be able to grow.
You see, it isn’t that hard.
Jan 10 to present. Just before Shale started its rise.
US Jan 10 to present so you can see the beginning of the Shale revolution
Ovi.
Also, thanks for all of your contributions to POB! I think you really have a feel for this topic and I know you put a lot of time into it.
I also agree with your views on Canadian production and the present USA administrations seeming dismissal of it. Huge mistake.
USA needs to work harder on decarbonizing because shale is going to likely hit a wall and start tanking at some point. But decarbonizing is very hard.
I think a lot of people have very short memories. I remember how dependent USA was on OPEC. Shale has made us cocky but that was always going to be temporary.
In any event, again thank you very much for putting the charts together for me. I hope they stoke some good “big picture” debate!
Shallow Sand
Thanks and glad I could help.
I think what the Permian and the US can do will be known in about 3 to 4 months. The STEO is predicting that US oil output will begin to increase in June. At the current time, we only have the weekly report for July which reflects the STEO forecast, 11,300 kb/d, up 200 kb/d from last week. In September, we should get the first real production numbers from the 914 report.
The other info we don’t have is the question of the “New Management Think”. Is management in the larger oil companies really going to slow their drilling rate and return more to investors as the price of WTI increases?
We will continue to look to the rig count and frac spread trends for early clues before September.
“Shale has made us cocky”
Absolutely.
Ovi, Dennis and Mr Kaplan , many thanks for all the graphs you have put together for the blog . More appreciated that you do it without getting any remuneration .
Thanks Hole in head,
All of us prefer that the money aspect is no longer discussed, we are happy to do it.
Of course . Appreciated .
Hole in Head
Much appreciated. I/We appreciate the professional discussion and information sharing.
SS , ” I hope they stoke some good “big picture” debate! ”
I will give it a go . The first question is, will the countries go to war or will they sit round the table and work out rationing . My call is war . Survival of the fittest and Darwin prevails .
Second will there be hysteria like we have had in the case of Covid ? Currently very few are informed about peak oil , when ( and it will ) it goes mainstream and is hammered 24/7 how will the general public react ? The media needs a story that will bring viewers . Anything will do , Trump , Russiagate , insurrection and then what better than peak oil . Dog bites man is not news , man bites dog that is news . If hysteria then what , panic buying ,shortages ??
Big picture is that we need to transition to something other than fossil fuels starting now, it will take a few decades to accomplish and time is short.
A good discussion of this in the BP Stats presentation, worth watching in my view. Not posted quite yet, I watched it live.
Dennis , here on this forum we all know that even a lot of people not here know that . The question is , too what ? Second do we have the time ? Hirsch said 20 years needed for transition . We have neither the new energy source and nor the time . What is sad is that we were warned about this ages ago but did nothing .
“What is sad is that we were warned about this ages ago but did nothing .”
Most people did nothing,
but in the last decade you might not have noticed that one energy production source went from among the most expensive electrical source to the least expensive in the USA -due entirely to work and support of a relatively small group of people.
Solar.
And electrical propulsion for vehicles has gone from essentially zero to a fully viable alternative to oil combustion engines.
Way behind schedule, but still most of the country are naysayers on these efforts.
” We have neither the new energy source and nor the time . ”
Energy Source = natural gas (for the US at least…)
Time = in progress (off to a turtle’s pace start)
T Boone was right years ago when he said we should be burning NG in our cars. There’s a few NG fleet vehicles around … I expect to see a lot more starting in 2022.
Roger, too little and too late .
“too little and too late”
We hear this excuse every time an innovation or alternative is mentioned.
I suppose it means that the specific item brought up wont ‘save the world’.
As if that is something that matters, or that is even feasible.
Nat Gas as transport fuel isn’t as easy/strong as petrol but it certainly works. It could work for hundreds of millions of vehicles. Even better- nat gas hybrid vehicles.
But according to the ‘oil only’ mantra- enabling transport for hundreds of millions is too trivial to be acknowledged.
Currently there are about 30 million nat gas vehicles in the world.
https://www.iangv.org/
And Texas based Hyliion Trucks-
https://www.hyliion.com/erx-page/#/find/nearest?fuel=CNG
Hicks , 30 million . Wow . Total vehicle population worldwide is 1.42 billion . This is not counting ships, planes , heavy earthmoving etc which all use crude oil . I will make it simple ” One can’t make a swimming pool salty by pissing in it ” . We have crossed the Rubicon .
Hole- thats 30 million vehicles in a world where there has been lots of petrol at great price, thus far. Could be 300 million vehicles in a world where petrol was in short supply/expensive.. btw- Europe had 292 passenger cars at last count. Not trivial.
Try to imagine that economies do adapt a little when under stress.
And once again you are thinking in an all-or-none mode. Its not going to work like that.
There are various pieces of the puzzle. It will be a smaller puzzle one way or another (population is peaking this century), but there will be pieces.
Hicks ” Could be 300 million vehicles in a world where petrol was in short supply/expensive. ”
Could be any figure 500 million ,1 billion . Immaterial . We have to face the facts that exist . As to adaption under stress , agree but only for slight events and for short period of time . Look at the anti mask , anti lockdown protests after prolonged shutdowns . There was no real stress , food was available ,communication channels were open, income guaranteed by the govt and still people could not take it for a long time . Guess , current mankind has become soft with all the comforts that FF have provided . Peak oil is not going to be a short term problem , it will be ” The Long Emergency” . Mankind is not prepared even mentally to deal with this . To prepare you must be aware and that is the crux of the issue . Lack of awareness . I am not so hopeful ( this sounds better than saying I am hopeless ) .
Hole in head,
I agree that skepticism is warranted.
Yeh, you guys may be right.
If people didn’t have enough petrol,
why would they bother switching to nat gas powered engines.
Too much trouble.
Better to walk.
but if you do happen to need refueling of your nat gas vehicle when out and about in Utah- here is the utility link to the map of nat gas filling stations
https://www.dominionenergy.com/our-company/moving-energy/natural-gas-vehicles
Hicks , looking up google maps to find a highway from Brussels to Utah . Can’t find one .
Just joking , don’t take me seriously . But on a serious note as Clint Eastwood says in Dirty Harry ” Man’s gotta know his limitations ” . Already confessed that “Limits to growth ” and ” Overshoot ” have greatly influenced me . Relax , smell the coffee and be well .
Shallow Sand —
Decarbonizing isn’t very hard, because the country is so far from ideal.
Also The US has huge oil resources that it basically squanders. It’s been a net importer of oil since the late forties. The industry needs to focus on export so the country as a whole (I’m not talking about the government) can pay off its huge foreign debt. Opposing higher taxes at the pump domestically doesn’t help the oil industry, it just bankrupts the country.
And the idea that cheap energy helps poor people is very doubtful indeed, at least in a rich country.
BP stats is out
https://www.bp.com/en/global/corporate/energy-economics/statistical-review-of-world-energy.html
High points of BP report
2020 Global Production 88 mbpd, down only 7% in a rather extreme scenario. US down 3.5%. Russia down 8.7%
China UP 1.7% (!!)
2020 Global Consumption 88 mbpd, down only 9%, US down only 12%, India down 9%, China UP 1.6% (that’s now 14.2 mbpd)
Almost as if they were prepared.
But wait, there’s more.
China is the ONLY COUNTRY in the world to increase oil consumption last year. How delightful. What a coincidence!
UK -22% we’ll give that a !
“We believe every American should have access to medical-grade face masks at a great price.
Designed, developed, and manufactured at our Texas facility, each mask is rigorously tested for quality and safety.”
https://www.armbrustusa.com/products/usa-made-surgical-masks-1?variant=34596435099781
Coincidence is correlation with mask wearing percentage of the population. The facts arn’t complicated. no matter what Tucker wants your belief system to be.
Wonder what a pin cushion looks like ? . Checkout this post and photographs of wells in the shale play . I understand why some ” folks’” are agitated .
https://www.oilystuffblog.com/single-post/four-seasons-spraberry?postId=1d8c5878-605b-4057-b9a1-3d025b3c3c54
” Smartest men in the room ” or ” Monkeys throwing darts ” . Take your pick .
https://www.oilystuffblog.com/chart-stuff
The July STEO was posted yesterday and they are now predicting essentially flat output from March to October. It is not clear why output begins to climb almost linearly after November. I think they know more than they are letting on.
In a post further up, https://peakoilbarrel.com/us-april-oil-production-flat/#comment-720666, I stated, “The STEO is predicting that US oil output will begin to increase in June.” That was before I saw the latest report. Now production is flat to October. The July STEO is beginning to add more weight to the flat output projections shown in the DPR and LTO charts in the original post above.
The July STEO has added 166 kb/d to December 2022 from the previous June report which was 12,147 kb/d.
Ovi,
There are a couple of things at play here:
a) Hedging: Most of the Shale players have hedged a lot of their production at around $50/bbl. So, they are not getting much benefit of WTI at $75. However, as we move forward in time, their hedges will tend to drop off and they will start making more money, even at a steady oil price. Their effective selling price will go up. That will lead to higher cash flow and hence more cash to plow into wells and fracks.
You can take an educated guess that this inflection will happen in Q4 of this year. It might move either side by a couple of months but, the shale oil cos should have more money to invest in capex leading to higher output going forward.
b) DUCs: Now, DUCs are reducing at the rate of 250 a month. There are still a ton of those out there – enough to last 18 months. But not all DUCs are created the same, some are great, a lot of others are good but I guess most (no way to prove it either way) will be sh!t. It makes sense for the shalers to complete the good DUCs first. Who knows how close they are to finishing the inventory of good DUCs – maybe they themselves don’t know exactly.
But when the good DUCs are gone, more money will be needed to get the same output increase. With DUCs, they can spend money for just fracking. With good DUCs gone, they will have to spend on drilling and fracking – a much more expensive proposition.
If, on the other hand, you expect the inventory of DUCs to last 18 months, then I can very easily see increasing output due to point (a) above.
How will those two elements interact and in what magnitude, I don’t know. But those might be two factors that are behind the expectation of higher output starting Nov’21.
Having said that, I think it will surely be weird if output starts moving higher in November. The last time Shale output peaked was in Nov’19. I think there are seasonal reasons behind them as well. Oct – Jan/Feb will be flat at best. But, might see increases starting in March 2022.
Ancient Archer
I have been hearing more about Cdn oil companies that have hedged 50% of their output and are not benefiting from the rise. Eventually the hedges will run out or they could have been sold.
Interesting thought combining hedges comes off and DUCs.
Ancient , your comment is good . The only problem is that all shale companies have one foot out of the exit door . All surplus will be looted ( dividends , bonuses , golden parachutes etc ) . Nothing goes back into the industry . The players know this is the “end game ” . First out of the door wins , the others will be trampled .
Ovi,
The STEO has a very conservative oil price projection with WTI prices falling to about $65/b by the end of 2021 and to about $61/bo by the end of 2022. I think a bad pricing model may be messing up their output model or perhaps it has to do with hedging by tight oil producers. I think we start seeing some increase in tight oil output in July, based on the level of frack spreads, though if most DUCs are not very productive, then we might see little increase in tight oil output. The 1140 kb/d increase they forecast over 14 months (Oct 2021 to Dec 2022) seems doubtful to me.
Dennis
With the reduced price forecast they have from $70 to $60, it difficult to see how this results in increasing output. I agree the 1,140 increase is a bit of a stretch.
I still think that output will remain flat because a significant number of oil executives will sit on their cash and limit the amount of drilling to show the pitfalls of Biden and friends oil policies. I think they need to drive a two prong approach. Encourage drilling to limit dependence and push more green projects. Somebody then has to clearly explain why the two prong approach is necessary.
Ovi,
I still think your price forecast of about $85/bo in 2022 seems reasonable. If that prediction is correct, I am doubtful that tight oil output will not ramp up. If you are correct about oil output in the US remaining flat throughout 2021 and 2022 (I think that is what you are implying), then I believe your oil price prediction will be too low, in that case I believe we see $100/bo+/-$10/bo. However I think rising tight oil output in late 2021 and in 2022 makes more sense, but at about half the rate predicted in the July STEO from Oct 2021 to Dec 2022 (an increase of perhaps 500 to 600 kb/d over the 14 month period for tight oil) based on an assumption of $80/bo or higher for Brent crude in 2021 US$.
Dennis
On the US side, I am betting on geology. By US production being flat, i would consider the US adding 200 kb/d to 300 kb/d as still flat. It’s all relative to what they did in 2018.
When oil gets to $85/bbl. I think OPEC and Russia will step in. We won’t know if the oil is coming out of the ground or from inventory.
Ovi,
Over the course of 12 months we will know. Oil stocks are not unlimited. Roughly 4.7 billion in OECD stocks in March 2021, the World consumes roughly 2.5 billion barrels per month, so oil stocks would last at most 3 months (assuming zero output). You are correct that would be flat relative to 2018 which was one of the most rapid rises in annual oil output in US history (1950- 2020) only 2014 was larger (17.3% vs 17%). I surely do not expect that rate of increase will be repeated.
As to geology, I was looking at a paper by Patzek and his students on the Bakken, for wells completed through May 2019 they expect output of 4.5 Gb. my less sophisticated model gets about 4.7 Gb, clearly the more advanced model will be a better estimate, but it is encouraging that my analysis is not that far off (about 4.4% too high assuming Patzek’s model is correct).
If the analysis by Patzek is correct (an I expect it is) and the Verhulst fit by George Kaplan leads to a good estimate of Bakken URR (approximately 5.5 Gb) this implies about 3300 more completions in the Bakken/Three Forks after May 2019 at roughly 300 kb per well (Patzek estimate for average well EUR to date) for a total of roughly 18 thousand total wells completed. Note that Patzek did not speculate on URR or potential for further completions, they reported on expected EUR for wells completed through May 2019.
For my model of Bakken/Three Forks, I get about 5.4 Gb URR, if no wells are completed after May 2021. The model may be 4% too high (based on my understanding of Patzek’s work which is very limited) so a better estimate might be 5.2 Gb. This is just slightly under a Verhulst equation estimate (approximately 5.5 Gb).
Dennis
When I spoke about OPEC and Russia using some of their inventory oil to meet demand, by dumping extra crude into the market, I realized that this could only be a temporary situation for two to three months to limit price increases. However, SA crude inventories seem to be in a slow and steady long decline.
In the SA chart below, one can see the steady decline in SA inventory since 2019. Why is this happening? Was their extra cut of 1 million barrels a few months back related to giving some of their fields, in particular Ghawar, a rest? Are they meeting their crude oil contractual commitments by drawing down inventory? I am trying to understand the reason and implication of this behaviour.
As for your models, I think that they are great as long as our readers understand that are only as good as the assumptions. What I wonder about going forward is whether/how the “New Management Think” of returning more to investors will impact your models. Returning more dividends to investors means less for new drilling.
As a sidebar, I see that again no new rigs were added in Texas and the Permian this week. Fracs aren’t out yet.
” As a sidebar, I see that again no new rigs were added in Texas and the Permian this week. Fracs aren’t out yet. ”
What happened ? Only two explanations (1) Not enough Tier 1 ground to poke a hole in (2) Not worth the effort going thru the hassle just to loose money .
Anyway , another nail in the coffin for shale .
Rigs will be added as needed. If management at tight oil companies maintain discipline then oil prices will rise, it may be the hedges that are limiting the completion rate.
Frack spreads increased by 4 for week ending 7/9 currently at 238 up from 64 one year ago (an increase of 174).
https://www.aogr.com/web-exclusives/us-frac-spread-count/2021
For past 3 months the average rate of increase in frack spreads has been about 9.5 per month (0.316 per day). If the trend continues we would be at about 292 frack spreads on Dec 31, 2021, about the same level as March 2020 (near the peak in tight oil output). I do not expect the previous tight oil peak will be reached until 2023. I expect a 500 to 600 kb/d increase in tight oil output in 2022. It is likely that average annual tight oil output for 2021 will be about 7000 kb/d, about 7550 kb/d in 2022 and about 8300 kb/d in 2023. I expect the peak will be about 9600 kb/d in 2026 or 2027 (it will be about the same level those 2 years peak might be either year).
I agree the assumption may well be wrong about the future. Particularly completion rates are likely to be different than I have assumed. In the past my assumptions about the future have consistently been conservative relative to reality, this time may be different. Certainly if the EIA’s short term price expectations are correct the completion rate will be lower than I have assumed.
The completion rate guess for the future is based on $85/bo Brent price in 2022 and does not consider hedging, though the companies currently losing big time on their hedges in 2021, may be less likely to make the same mistake in 2022.
The statisticians of EIA are funny people. As things process they are lowering their fanciful oil forecasts. But they are sticking to it. Adorable.
A few other bible observations.
Ya China increased consumption. Only ones. But who in a less sensational way had tiny decreases in consumption?
KSA -2.5%
Norway -2.5%
Romania and other Eastern Euro -4ish%, includes Russia and the ‘stans
The smaller Pacific islands -1.7%
KSA and Norway interesting
KSA is trying to switch to natural gas for in country power generation.
Green, last I recall they were importing gas from Qatar to build pressure in their fields . Anyway in the last thread was a gentleman who said they were going solar to produce electricity . One word ” pie in the sky ” .They can try for all they want . In school there was a story about the 3 pigs and the wolf . The wolf would “huff and puff”” but he could not bring the house down . The Saudis can “huff and puff ” all they want .
They have launched a plan to reduce their oil domestic consumption of 1 Mb/d in march of this year.
Best of luck to MBS . See Watcher’s post for explanation .
Anddddd the brand spanking new updated list of who burns:
US 17 mbpd
China 14 mbpd blah blah
Here is where it gets interesting
India 4.7 mbpd no surprise
this next one was where the snickers arrived
KSA 3.6 mbpd (down only 2.5%, 225 virus croaks/million pop)
Japan 3.27 mbpd (down 11%, despite a microscopic 118 virus croaks/million) (US/UK 1800 dead/million, Peru 5000 )
So yes, sports fans, we have KSA with a population of 35 million out burning Japan’s 126 million pop.
This year they swapped 4th and 5th places. Good year to do it. People looking elsewhere.
(Russia will catch Japan soon)
To all concerned
Update on US shale play papers by Patzek et al.
https://patzek-lifeitself.blogspot.com/2021/07/update-on-us-shale-play-papers-by.html?m=1
You can imagine a person who wants to keep driving their pickup all around the ranch or city even though oil supply is well into decline and the price of a fill up is off the charts high.
And they can. even ‘filling up the tank’ entirely from their own personal supply.
And cheaper/mile than they used to pay for diesel or gas.
Or, maybe use horses. It would take 563 horses to equal the power of the F-150 Lightening, but the horses would cost about $1.7 million and you would have to have some water and a hell of a big pasture. The horses aren’t fast and they have poor range. And it takes all day to rig them up. By that time they are exhausted.
https://www.caranddriver.com/news/a36433090/2022-ford-f-150-lightning-specs-revealed/
This is enough power for the truck, when its sunny.
Nice fossil fuel extender.
Biden now wants Cheap Canadian Drugs but not our Cheap Oil. Wish we had the clout to say NO!! It’s the classic heads I win, tails you lose because I’m bigger.
Don’t get me wrong, I am not anti Biden. My thinking is if we are friends and are helping each other let’s have a consistent policy that better reflects the friendship and inter dependance.
President Joe Biden will direct the Food and Drug Administration to work with states on developing a plan to import cheaper versions of prescription drugs from Canada, a controversial move that fizzled under the Trump administration.
https://www.washingtonexaminer.com/news/biden-canadian-prescription-imports-drug-price-executive-order
The United States have been a net importer of oil since the late forties. The reason is because the economy is so oil inefficient. The solution to the problem is not pumping more oil.
Biden is simply legalizing free trade in drugs, so don’t shed too many crocodile tears about that.
Uh oh
https://www.spglobal.com/platts/en/market-insights/latest-news/oil/070921-slow-us-shale-recovery-throws-doubts-over-sectors-price-responsiveness
Lightsout.
From the piece you linked above.
Platts Analytics expects US oil production to end 2021 some 360,000 b/d higher than the 2020 exit rates with production to add a further 940,000 b/d in 2022.
The exit rate for 2020 was 11088 kb/d, so Platts forecast is 11448 kb/d for Dec 2021 and 12388 kb/d for Dec 2022, peak was 12860 kb/d in Nov 2019, I doubt the US reaches that monthly peak, but we might approach the annual peak of 12248 kb/d in 2019, probably not until 2024 or 2025, imo.
You said the recovery would be in June 2021, now you pushed it back a year, this time that won’t work because bakken decline will speed up.
Bakken alone is destroying around 5% of LTO output per year. As that accelerates to 10% its virtually impossible for other fields to grow fast enough.
Shale companies are selling everything which is pretty much an official acknowledgment that there’s no hope.
I disagree. Tha Bakken is pretty flat with 44 completions in May 21. XOM, EOG and COP are not investing right now but these companies have plenty of DUCs and permitted inventory. There is no permanent decline, not yet. I expect production in the Bakken to go back when the bigger players start investing again.
Why was bakken already declining in 2019 then?
Prices determine where oil companies invest, not whether they invest or not. The current oil price is on paper profitable but it’s having no effect on production because there’s no oil left.
Companies already are investing, completions are growing 10% a month and production is still flat. If completions kept growing at that rate bakken would be the largest field in the world in two years which is absurd.
The peak in the ND so far was Nov 19 at 1.475 mbo/d and WTI in late 2019 was at or below 60$. Also note that oil production in ND often decreases in the winter because the weather is too bad to complete wells.
Production in ND increased from less than a million bo/d in early 2017 and it took three years and around 3400 completions to get to 1.475 mbo/d in late 2019. Well productivity is not declining. There are a lot of DUCs and permitted inventory.
Nobody said that the rate of completions is going to increase for many month at a rate of 10% per month. But there is no reason to think that the Bakken will crash immediately.
Toby , not an oilman but an observer . What is termed as a “decline ” in conventional oilfields is a ” crash” in shale . 50% decline rate in the first year and 80% in 3 yrs ( tks Mike S ) is not a feature of conventional oilfields . By the way , Mark is correct and I have already posted on the industry now playing “the endgame ” . Nothing surprising . It has occurred earlier in history .
I know what the decline curves of shale wells look like. As I said, it took 3400 complations to increase output in ND by 500 kbo/d. The claim that production there can only go down no matter what the price of oil is, sounds absurd to me. We will see where the Bakken goes.
US gasoline stocks move sharply lower as demand hits all-time high
Total product supplied for gasoline, EIA’s proxy for demand, was up more than 9% on the week to 10.04 million b/d, an all-time high in records dating back to 1991 and the first time ever above 10 million b/d.
Ron
This is very good piece on Russian production, you might have already read it.
Quote. Russia now has about 130.000 producing wells. In the West we tend to under-estimate the magnitude of the herculean effort that was needed to bring Russian oil production back to a level in excess of 10 mb/d. The successful management of the oilfields in the Western Siberian heartland is the success story of the Russian oil and gas industry of the last two decades.
https://hcss.nl/report/russias-unsustainable-business-model/
Thanks, Lightsout, no I had not read this piece. It is an excellent article on Russian oil production. Quote, bold mine:
Oil production per well is not particularly high in Russia and only a fraction of that in Saudi Arabia. It is the dogged continuation of infill drilling (at a relatively low cost) that has kept production going here. Production levels from the early 1980’s Soviet period (13 mb/d) are no longer within reach. A field like Samotlor will not be able to reach the recovery factor[2] of about 60% for a comparable field like Prudhoe Bay in Alaska and is likely to reach about 40% only (still significantly higher than the 25% it would have reached with Soviet era field development). Water cuts are still relatively high and oil production is relatively energy intensive, relying on cheap electricity from natural gas to run ESP’s (electric submersible pumps), which are widely applied, or to provide power for steam injection.
What is not realized by most people who still see Russia as producing massive amounts of oil, far into the future, is what a herculean effort Russia has put into keeping oil production high. They have been drilling massive amounts of infill wells in all their old Western Siberian fields. They have been creaming the tops of these reservoirs for almost two decades. Now they are starting to peter out. Water has hit those horizontal wells at the top of the reservoir and production in those fields is starting to drop fast.
Russian oil production will drop dramatically in the next few years. Russian production alone will likely drop faster than the combined gain of Canada, Brazil, and Norway. The combined production from the declining nations has now overcome the combined production of the increasing nations. It’s all over. Peak oil is now in the rearview mirror.
Ron,
Question. Is the Russian Infill drilling similar to what they are doing in Ghawar or other fields in Saudi Arabia? By that, is the Russian Western Siberian oil depletion occurring from the bottom-up?
steve
Steve, although I don’t have any data on exactly how their old brownfields are depleting, I am sure it is from the bottom up, exactly how Saudi fields are depleting. When you waterflood from the bottom and cream the oil from the top, that is just what happens.
Ron,
So, this is the reasoning that you have stated that Russian production is going to decline considerably soon because they are running out of Cream at the Top? Correct. I’d imagine the Saudi’s are in a similar pickle.
steve
Russia’s brownfields are already in decline. So far the decline has been slow enough that new production from Eastern Siberia has been able to make up the difference. Eastern Siberia’s largest field, Valtor, peaked in the last couple of years. But now that Eastern Siberia has plateaued, and Western Siberia is now in a steep decline, it’s all over. Russia will stop preventing peak oil and start assisting in the decline on the downslope.
And yes, the exact same thing is happening in Saudi Arabia and coming soon to the rest of the Persian Gulf area.
Ron,
Thanks for your replies. This seems to fit with my analysis on the coming ENERGY CLIFF. I believe we are going to experience “CLIFF LIKE” declines on global oil production as these dynamics play out over the next 5-10+ years.
steve
See page 14 of following paper (Dec 2019)
https://www.ifri.org/sites/default/files/atoms/files/mitrova_yermakov_russias_energy_strategy_2019.pdf
Basically about flat Russian output to 2024 and then decline to 2035, average of high and low scenarios in 2035 is 522.5 million tonnes compared to 556 million tonnes in 2018 and 558 million tonnes in 2024 (average of high and low scenarios), this ammunts to a decline rate of 0.6% per year from 2024 to 2035 for Russian output for a “medium scenario” that is the average of the high and low scenarios. Output would be roughly flat over the 2018 to 2024 period (with obvious drops during the pandemic).
Dennis, this document, based on ES-2035, was produced in mid-2019, submitted to the government for approval by the Minister of Energy in October 2019, and published in December of 2019. A lot has happened in the two years since it was produced by two hopeful Russian energy researchers. I found it hopeful but pessimistic. That is, what they hoped for is betrayed by several pessimistic paragraphs in the article. I could not copy and paste from this PDF file but the snipping tool quote is posted below.
Dennis, this is not an optimistic article. Obviously, the authors were trying to put the best possible face on it for the Russian Government. But they were clearly covering their ass as well.
Ron,
I agree, they seemed to think it would be a challenge to reach the high estimate and it does read as though they think the low estimate is more realistic, especially if Russia continues to have sanctions imposed by the west.
“Wow, pretty much everything looks to be going down. It’s the fossil fuel energy era of the dead-cat bounce.
This is Caelan MacIntyre reporting to you from Peak Oil Barrel. Back to you Bob…”
Interesting article: Regional Report: Russia
Rosneft may be particularly vulnerable, said Shagina. The company incurred a $2.1-billion loss during first-quarter 2020 and expected a 10% decline in oil output. “Oil cuts and well conservation will be particularly painful for Rosneft, bound by long-term supply obligations under prepayment contracts with China,” she wrote. “Many Russian brownfields are overflooded and after their shutdown, 50% may never resume production, making the decision about which wells to close especially challenging.”
Rosneft, Russia’s largest producer, produces about 40% of Russian production. The second-largest producer, Lukoil, produces about 17% of total Russian prodution.
Article on tight oil from July 8
https://oilprice.com/Energy/Crude-Oil/US-Shale-On-Track-For-One-Of-Its-Best-Years-Ever.html
Article notes $10 billion expected losses on hedges, but note this is out of expected revenue of almost $200 billion, so roughly 5% of revenue lost to hedges. So the hedges might be less of a problem than I had believed, if Rystad’s analysis is correct (they usually do good work in my opinion). The average WTI spot price for the first 26 weeks of 2021 was about $62.36/bo, the Rystad estimate assumes an average WTI price of $60/bo for 2021 (all 52 weeks) for its 2021 revenue estimate. This is a conservative estimate in my opinion as currently WTI is over $70/bo and is likely to remain over $70/b for most of the next 26 weeks.
Chart on prehedge revenue estimates from Rystad in article linked above attached.
A new thread on Non-OPEC production has been posted.
https://peakoilbarrel.com/march-non-opec-oil-production-recovers/
A new Open thread Non-Petroleum has been posted
https://peakoilbarrel.com/open-thread-non-petroleum-july-10-2021/
Mark Ingraham said:
Well, neither does the Hubbert curve which also requires an empirical calibration.
As I said, there is a connection between the Hubbert (Logistic or Verhulst) curve and the Shock Model used in conjunction with a dispersive discovery input, which provides a good calibration for the historical timing.
The result is that the Hubbert curve can be derived from these ideas, making the Shock Model much more generally applicable — and therefore the more practical of the two.
Can we get a concrete example? The empirical calibration part would probably just explain everything.
For example 20th century Texas follows the hubbert curve really well if we add one discovery (spraberry). I can show.
I see that the dispersive and hubbert curve are the same model in many cases, the hubbert curve just doesn’t require calculus.