A guest post by Ovi
All of the oil (C + C) production data for the US state charts comes from the EIAʼ’s Petroleum Supply monthly PSM. After the production charts, an analysis of three EIA monthly reports that project future production is provided. The charts below are updated to July 2021 for the 10 largest US oil producing states.
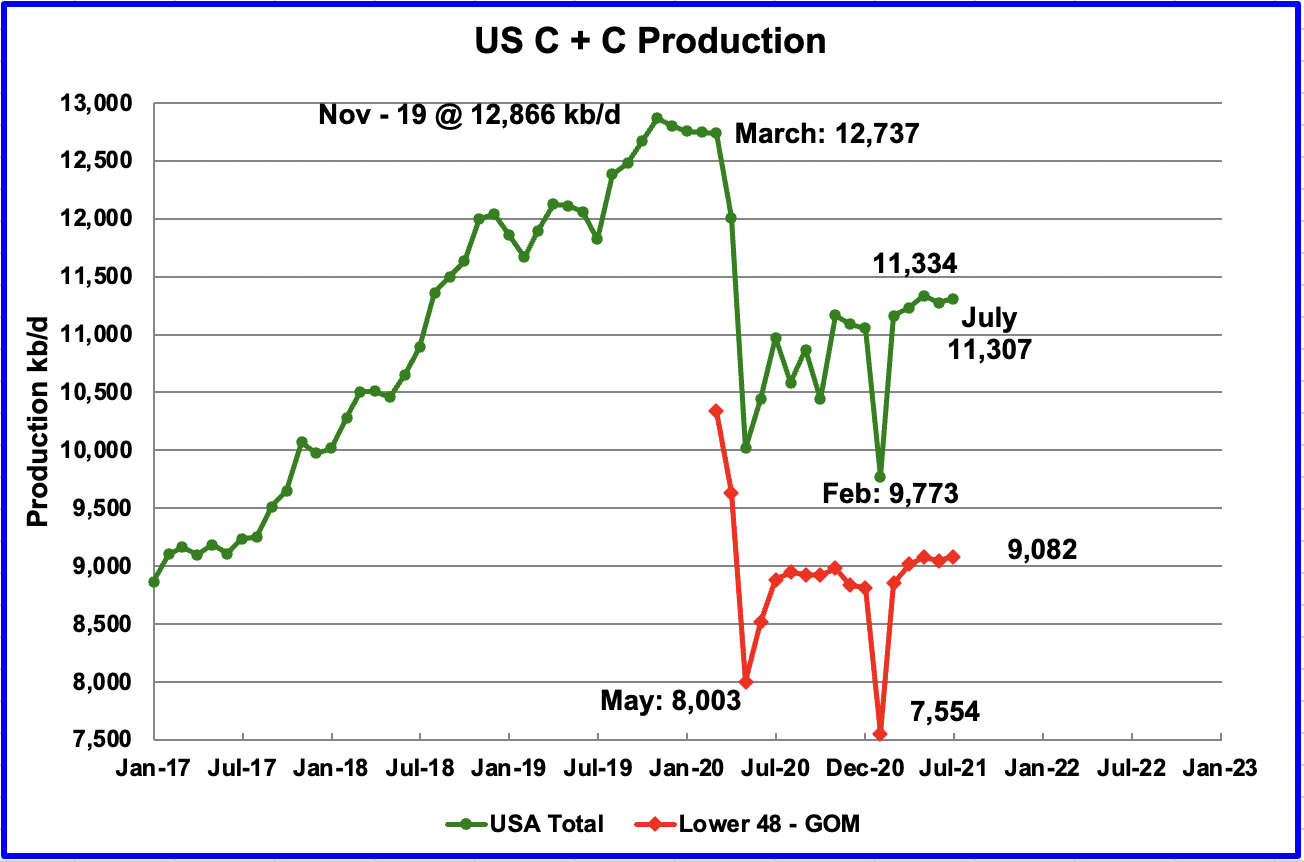
U.S. July production increased by 31 kb/d to 11,307 kb/d from June only because June was revised down from 11,307 kb/d in the August report to 11,276 kb/d in this report. From March to July, production increased by 147 kb/d or 36.8 kb/d/mth on average, down from 49 kb/d/mth in the previous report. July production is still lower than May’s output of 11,334 kb/d.
The September STEO report forecast US July output would be 11,347 kb/d, a reasonable forecast, high by just 40 kb/d. August is forecast to drop due to hurricane Ida.
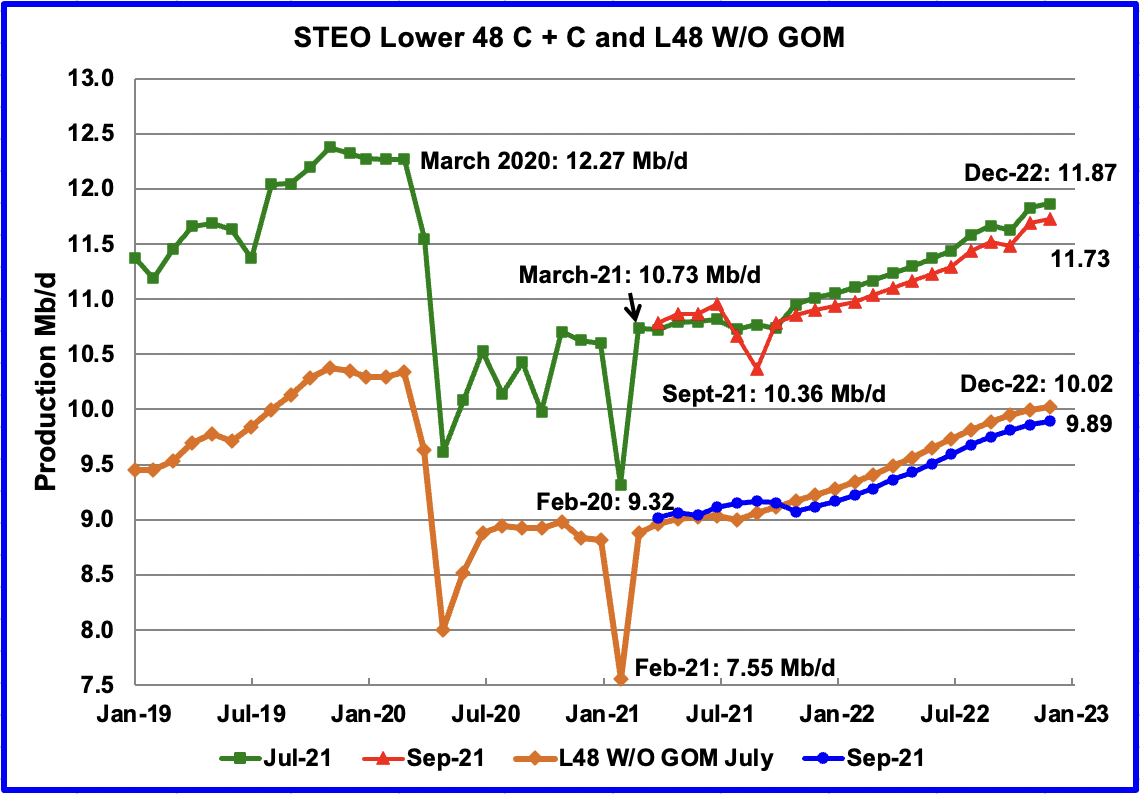
In the onshore lower 48, July production increased by 35 kb/d to 9,082 kb/d and is 5 kb/d higher than May which was 9,077 kb/d, red graph.
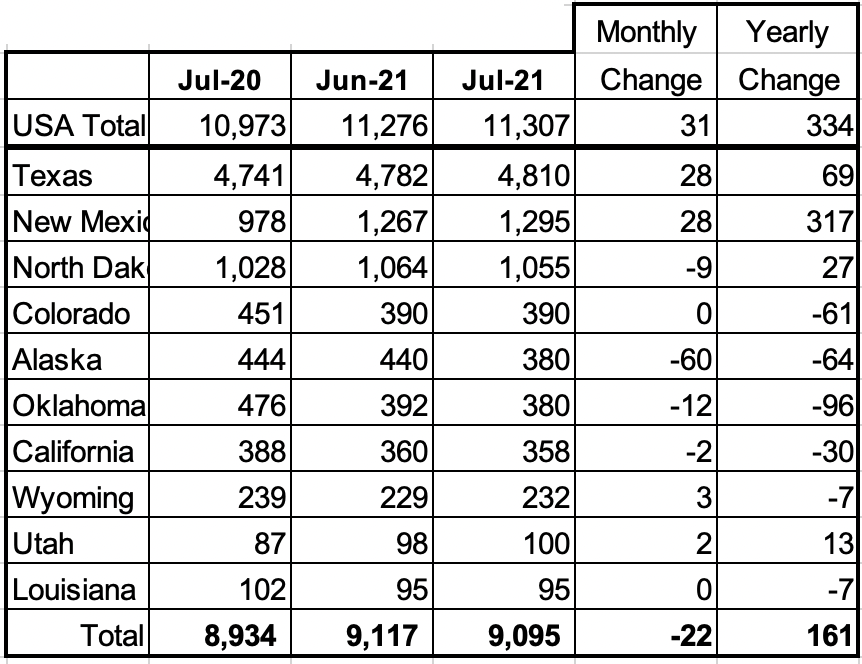
Listed above are the 10 states with the largest US production. These 10 accounted for 80.4% of US production out of a total production of 11,307 kb/d in July 2021.
On a MoM basis, the largest increases came from New Mexico and Texas, both with 28 kb/d. The combined gain from Texas and New Mexico was offset by Alaska’s drop of 60 kb/d due to summer maintenance.
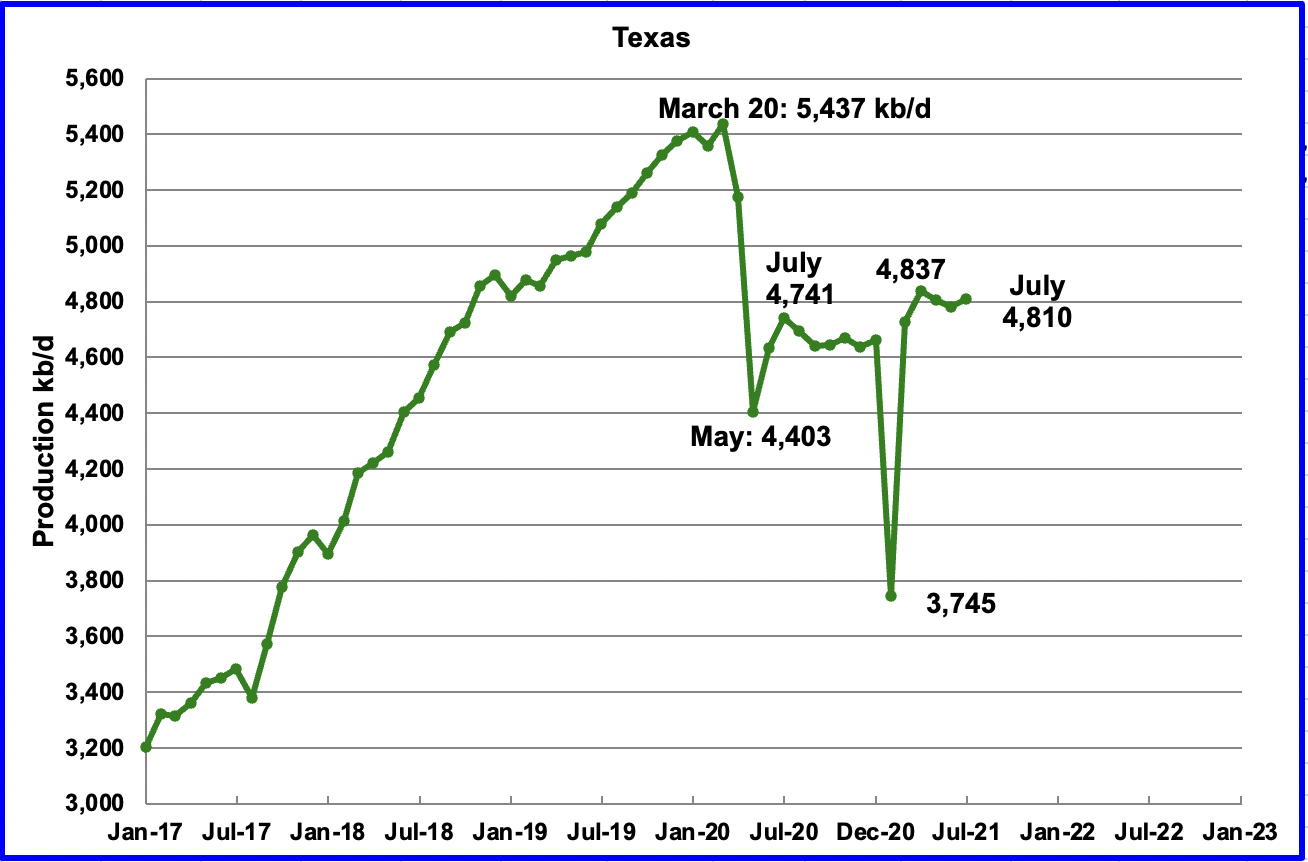
Texas production increased by 28 kb/d in July to 4,810 kb/d. In the EIA’s September report, June’s output was revised down by 9 kb/d from 4,791 kb/d to 4,782 kb/d. Note that Texas production decreased for two consecutive months, May and June and is still lower than April which produced 4,837 kb/d.
In July there were close to 203 oil rigs in operation in Texas. By the week of October 1, 226 were operating and production is slowly beginning to increase.
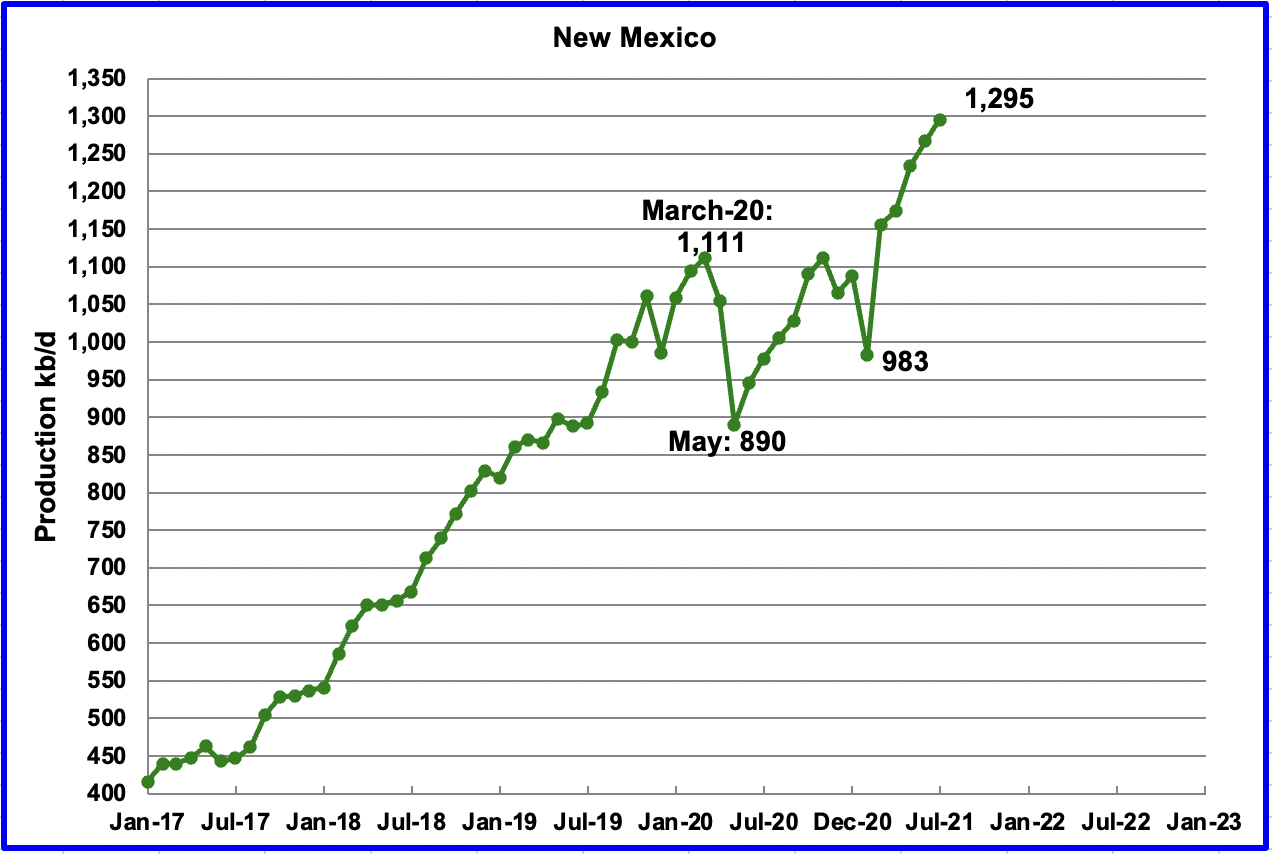
July’s New Mexico production set another new record and increased by 28 kb/d to 1,295 kb/d. The increase can be attributed to New Mexico’s Permian which is favoured over North Dakota, where higher production costs have curbed profits.
New Mexico had 75 rigs operating in the Permian in July and they increased to 83 in the week of October 1.
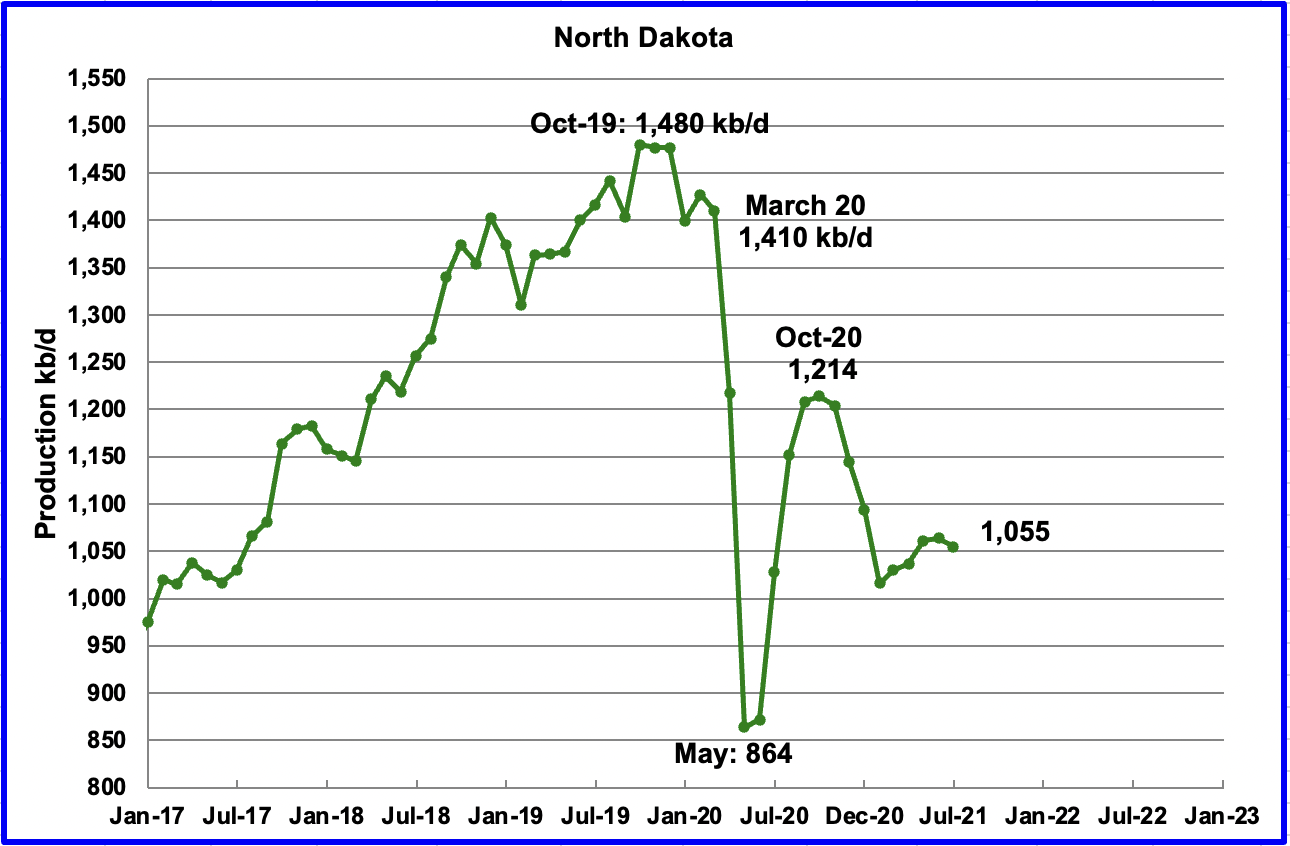
According to the EIA, July’s output was 1,055 kb/d, a decrease of 9 kb/d from June.
Data for the Bakken from the North Dakota Oil and gas Division indicates a much larger drop in July. According to the ND O&G division, output dropped by 55 kb/d in July to 1,037 kb/d. See the DPR section further down.
Note that output for all of North Dakota for July was 1,078 kb/d according to the ND O&G division, a drop of 55.7 kb/d from June. Not clear why the EIA reports lower output than North Dakota for July.
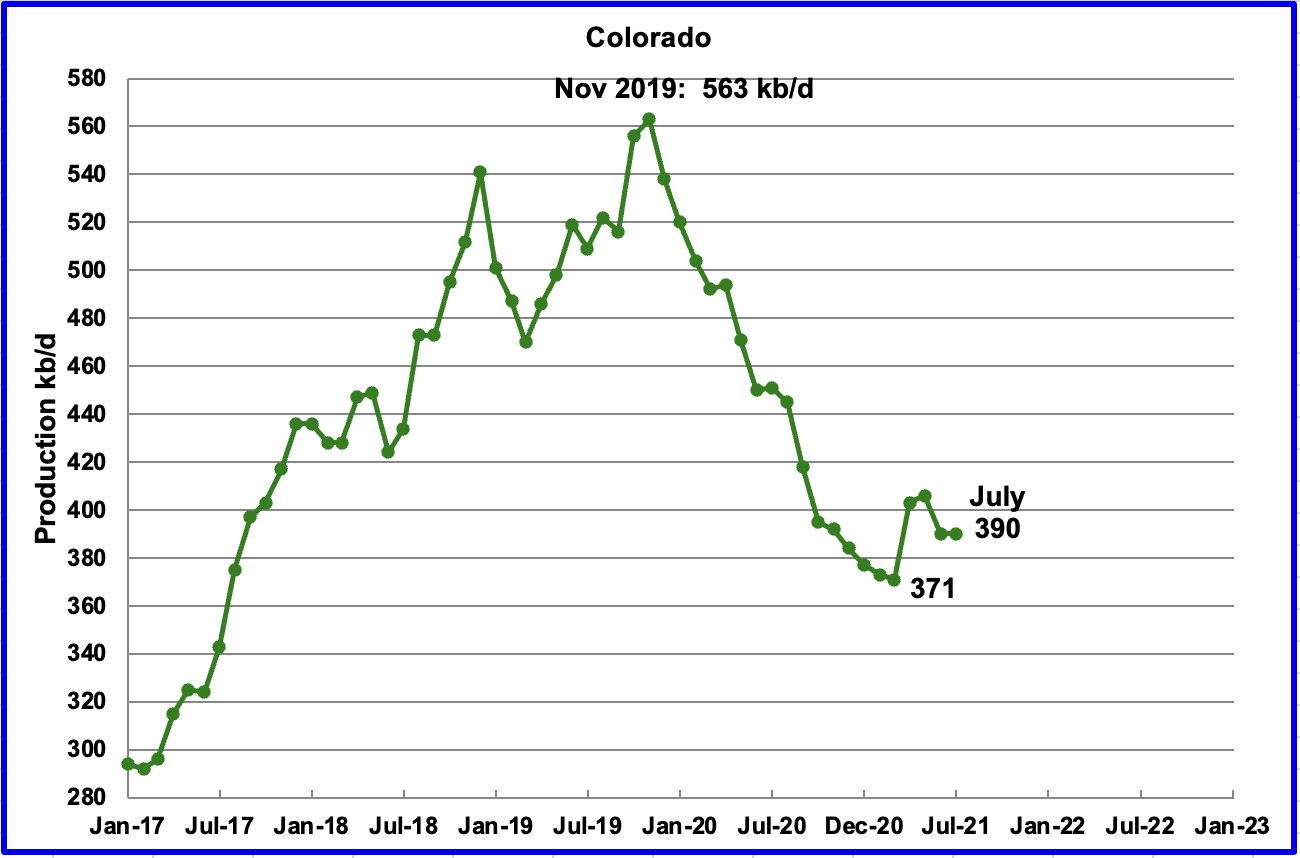
Coloradoʼ s July output was unchanged at 390 kb/d.
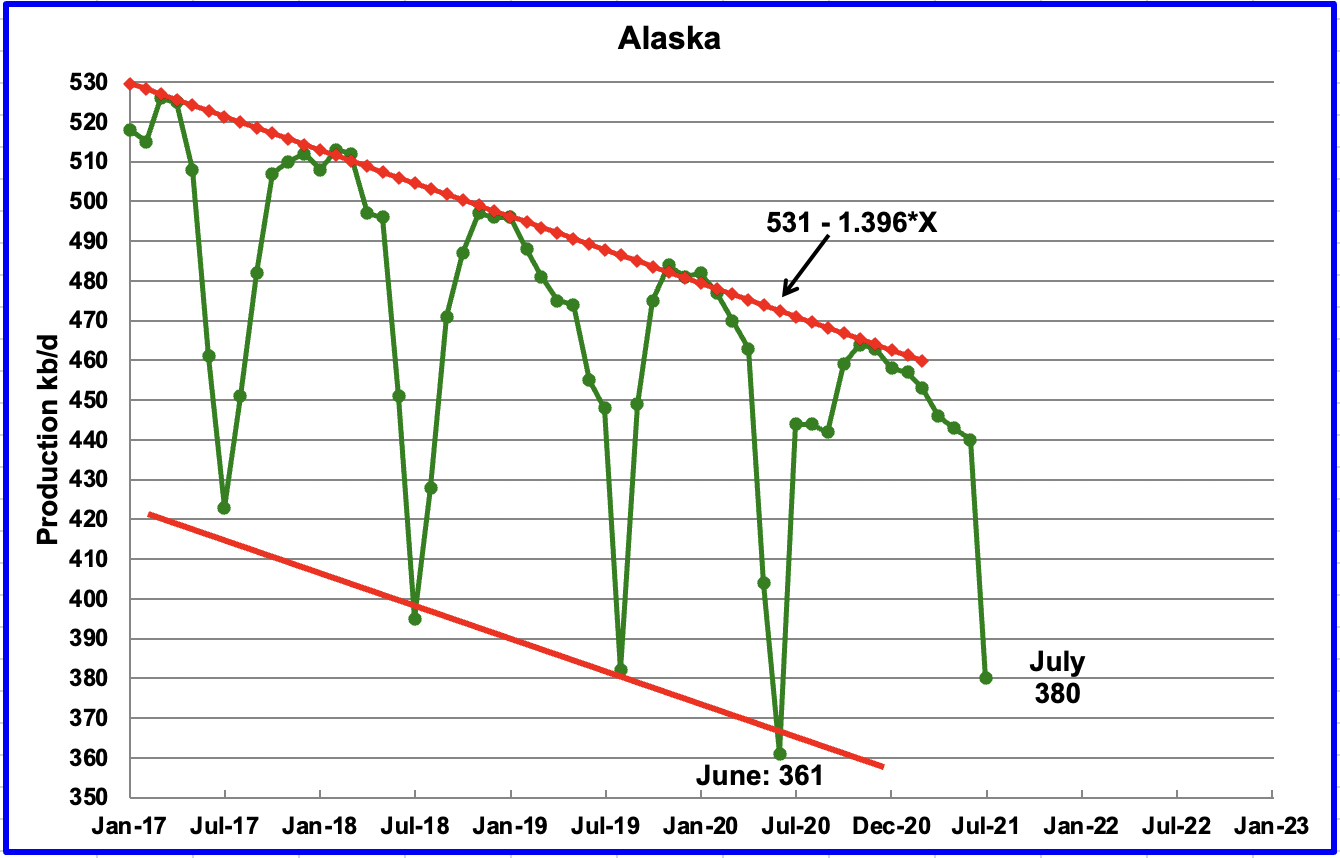
Alaskaʼ s July output decreased by 60 kb/d to 380 kb/d due to maintenance.
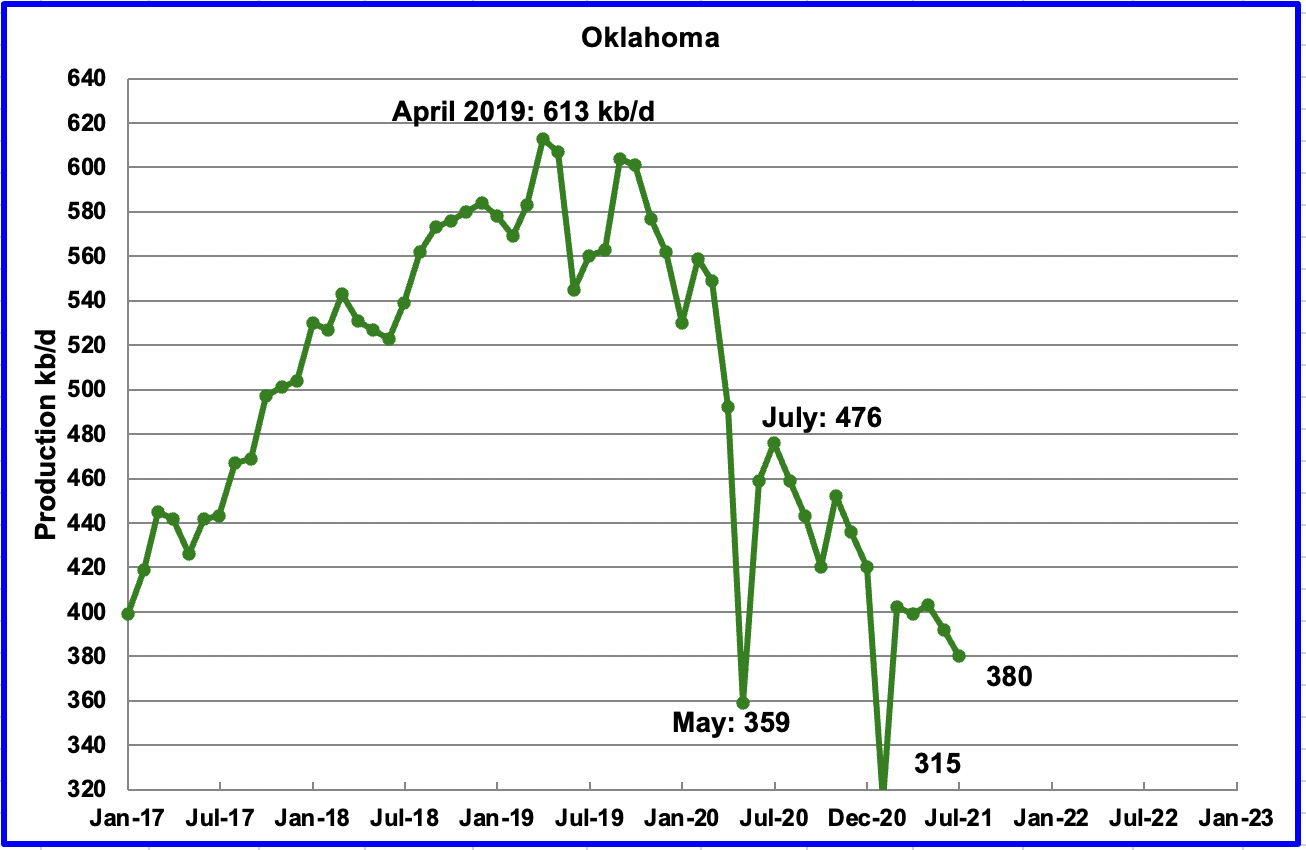
Oklahoma’s output in July declined by 12 kb/d to 380 kb/d.
For the week ending October 1, 39 rigs were operating in Oklahoma. From the end of May to the end of July, the rig count increased from 28 to 30. Oklahoma’s increasing the rig count is not offsetting the decline rate.
Difficult to explain increasing rigs and decreasing production
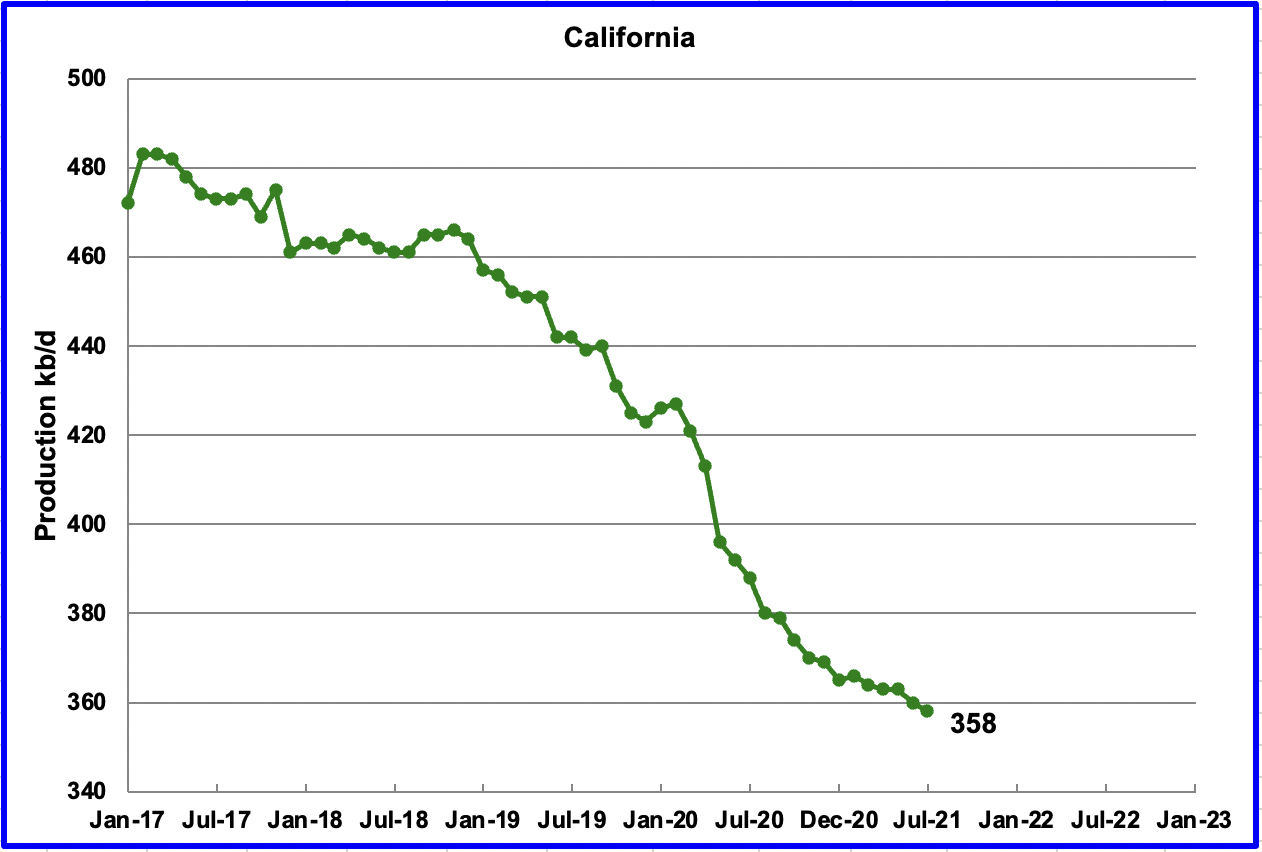
Californiaʼ s slow output decline continued in July. Its production decreased by 2 kb/d to 358 kb/d.
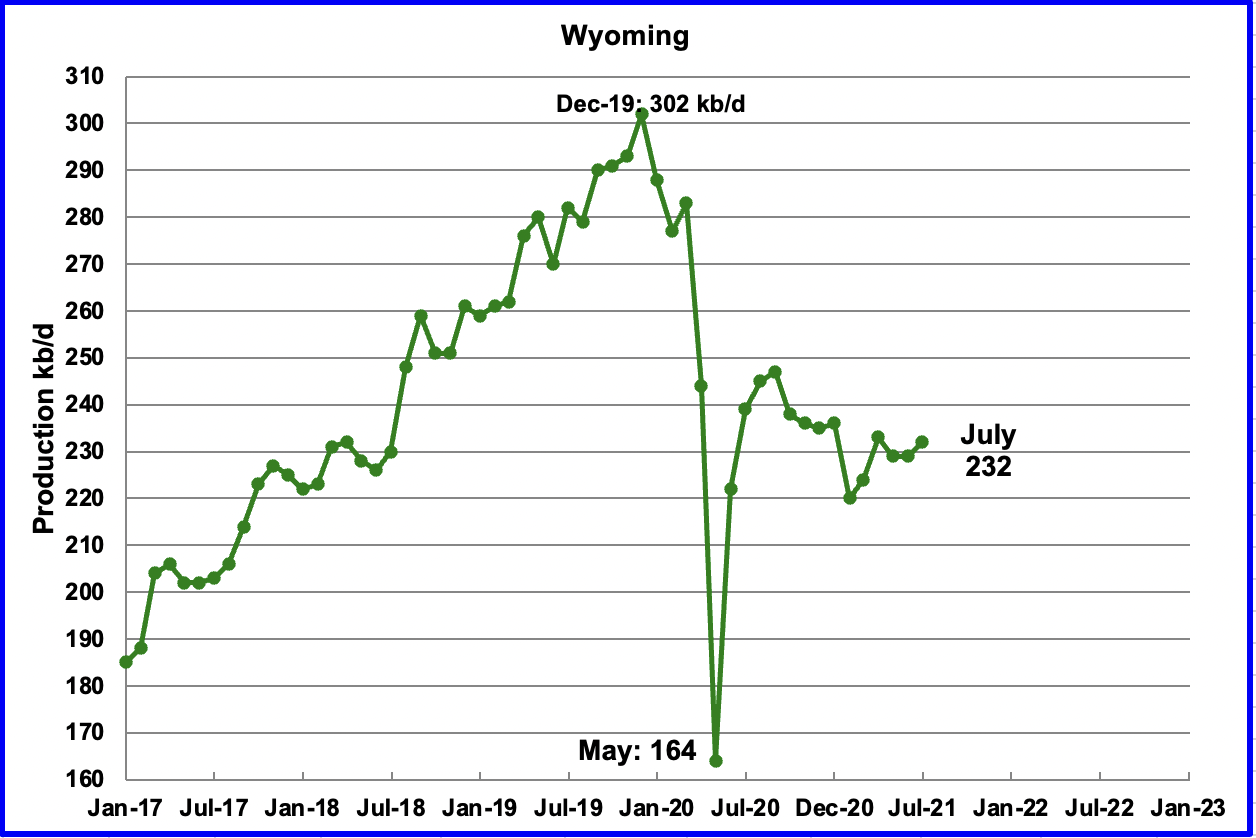
Wyoming’s production in July increased by 3 kb/d to 232 kb/d. Wyoming had 3 oil rigs operating in May and they increased to 17 by late September.
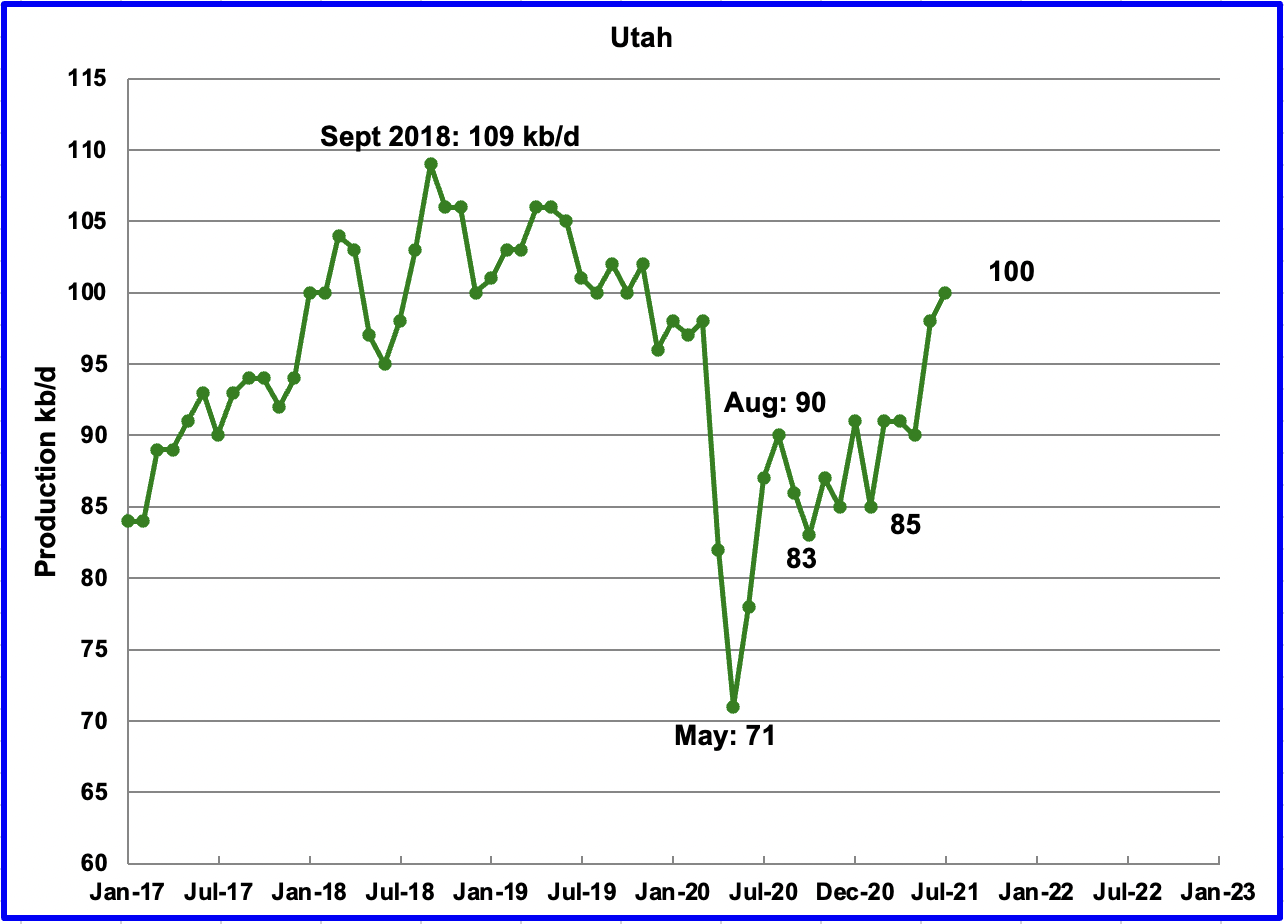
July’s production increased by 2 kb/d to 100 kb/d. Ten oil rigs were operational in July and were unchanged at 10 by the fourth week of September.
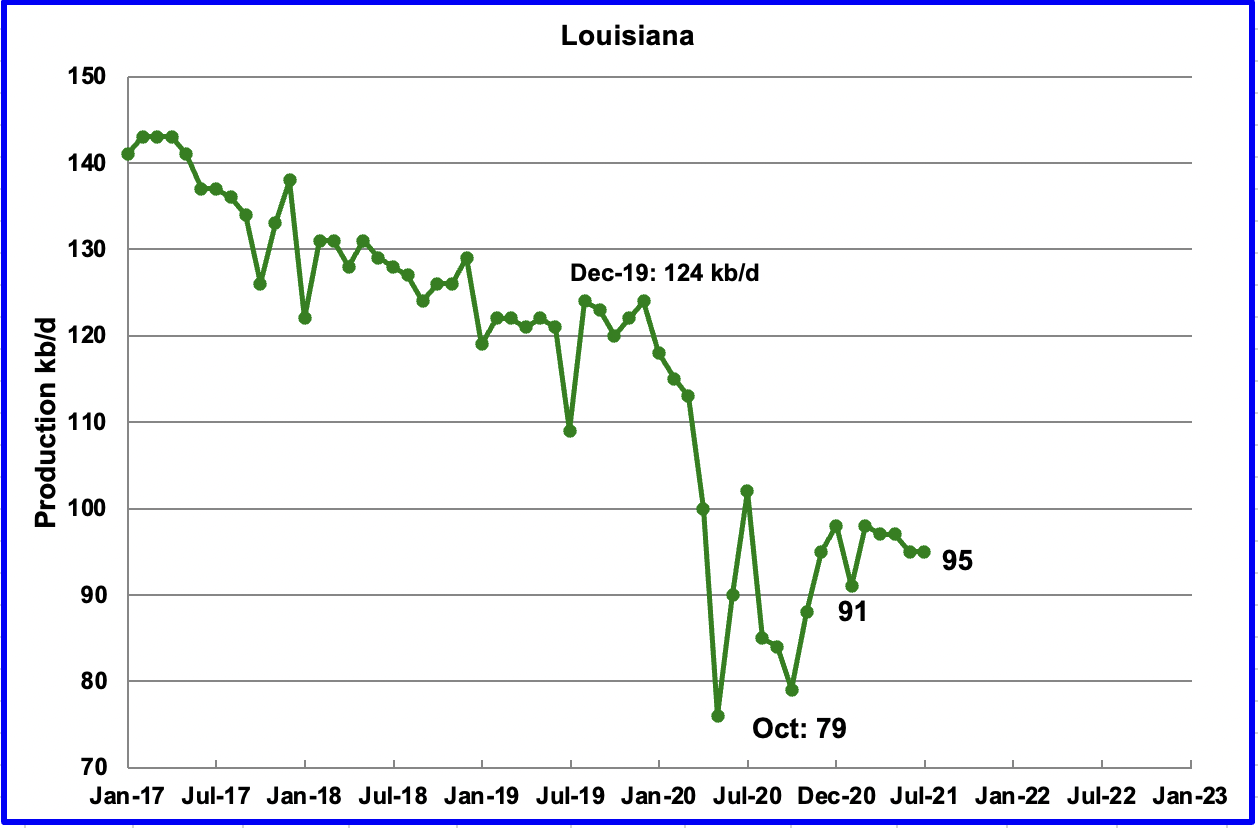
Louisiana’s output was flat at 95 kb/d.
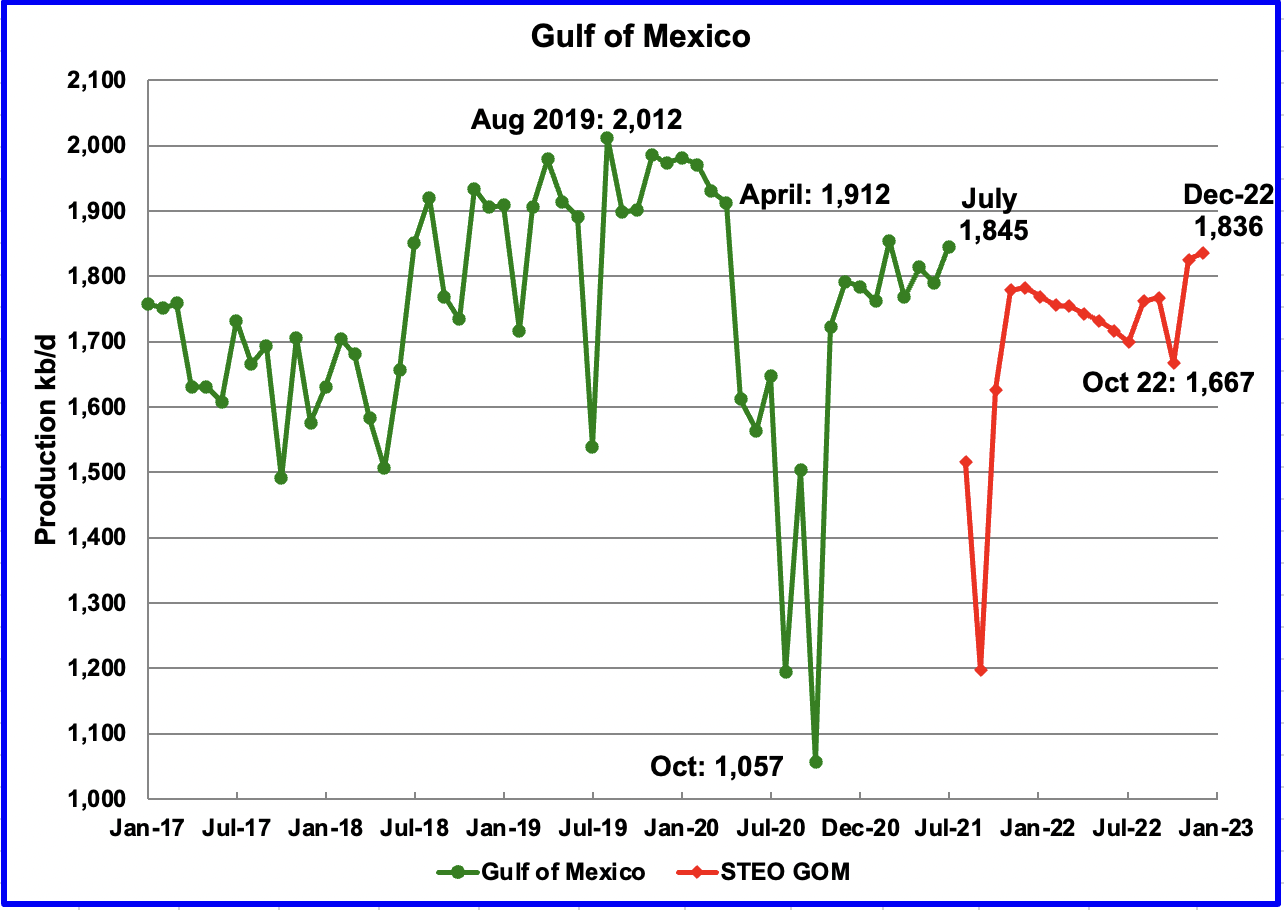
Production from the GOM increased in July by 56 kb/d to 1,845kb/d. If the GOM was a state, its production would rank second behind Texas.
The GOM increase is relatively large because June’s output in the September report was revised down from 1,825 kb/d in the August report to 1,789 kb/d. In other words 36 kb/d of the 56 kb/d are due to the revision.
The September STEO projection for the GOM output has been added to this chart and projects output to be 1,836 kb/d in December 2022, little changed from the previous August report. However due to hurricane Ida, August, September and October output have been revised down drastically.
1) Short Term Energy Outlook
The STEO provides projections for the next 13 – 24 months for US C + C and NGPLs production. The September 2021 report presents EIAʼ’s updated oil output and price projections to December 2022.
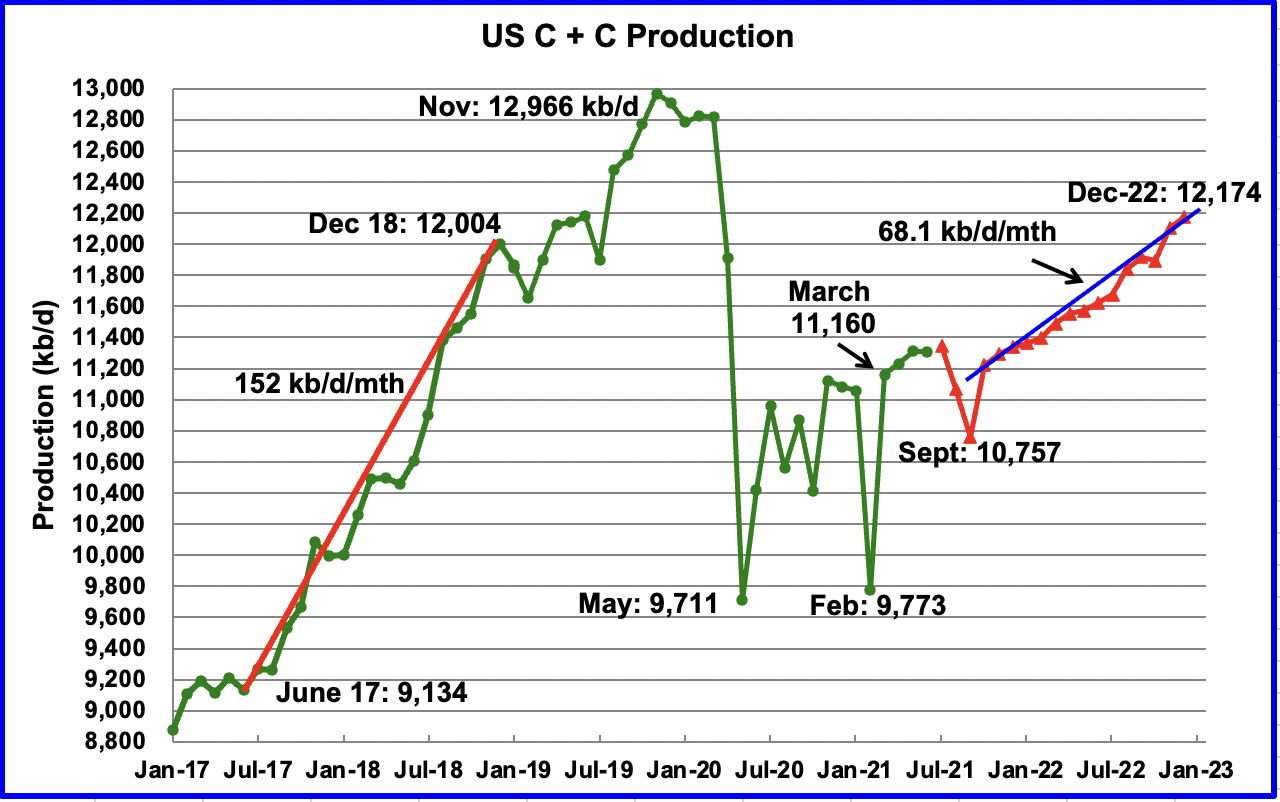
There has been a major revision in the September STEO relative to the August STEO due to hurricane Ida which struck Louisiana. While U.S. May and June production are essentially flat at slightly over 11,300 kb/d, August and September are forecast to plunge.
The July forecast output of 11,347 kb/d turned out to be 11,307 kb/d.
September is projected to hit a low of 10,757 kb/d due to hurricane Ida. The weekly estimates for September issued by the EIA give an average of 10,600 kb/d.
The December 2022 output has also been revised down by 57 kb/d from 12,231 kb/d to 12,174 kb/d. The expected monthly increase in US production from October 2021 to December 2022 is now 68.1 kb/d/mth, down from 72.8 kb/d/mth last month. It is still not clear where this increase will come from. This monthly rate, if correct, is less than half of the rate in 2017 to 2018 and is music in OPEC’s ears.
The September STEO output projection for the L48 states is very similar in shape, but lower, to the one provided in the July report. The output decrease forecast in the September report is roughly 130 kb/d from late 2021 to December 2022.
Similarly for the lower 48, the September projection for December 2021 is 110 kb/d lower while the December 2022 is 130 kb/d lower.
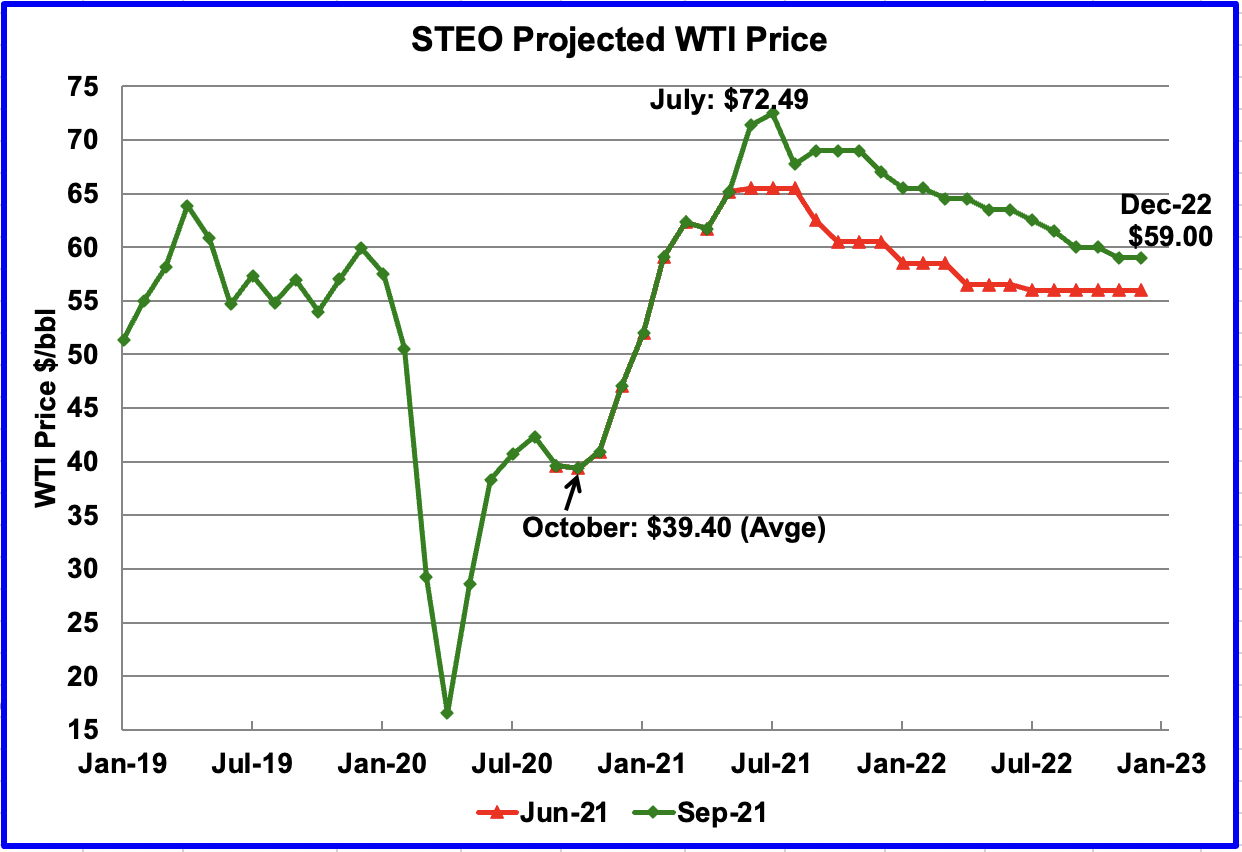
The September 2021 STEO oil price forecast shows a steady decline from the peak in July, $72.49, to $59 in December 2022 and is little changed from the August report. The big change occurred in moving from the June report to August report.
The November WTI contract settled at $75.88 on October 1, $7 higher than the EIA projection of $69.00.
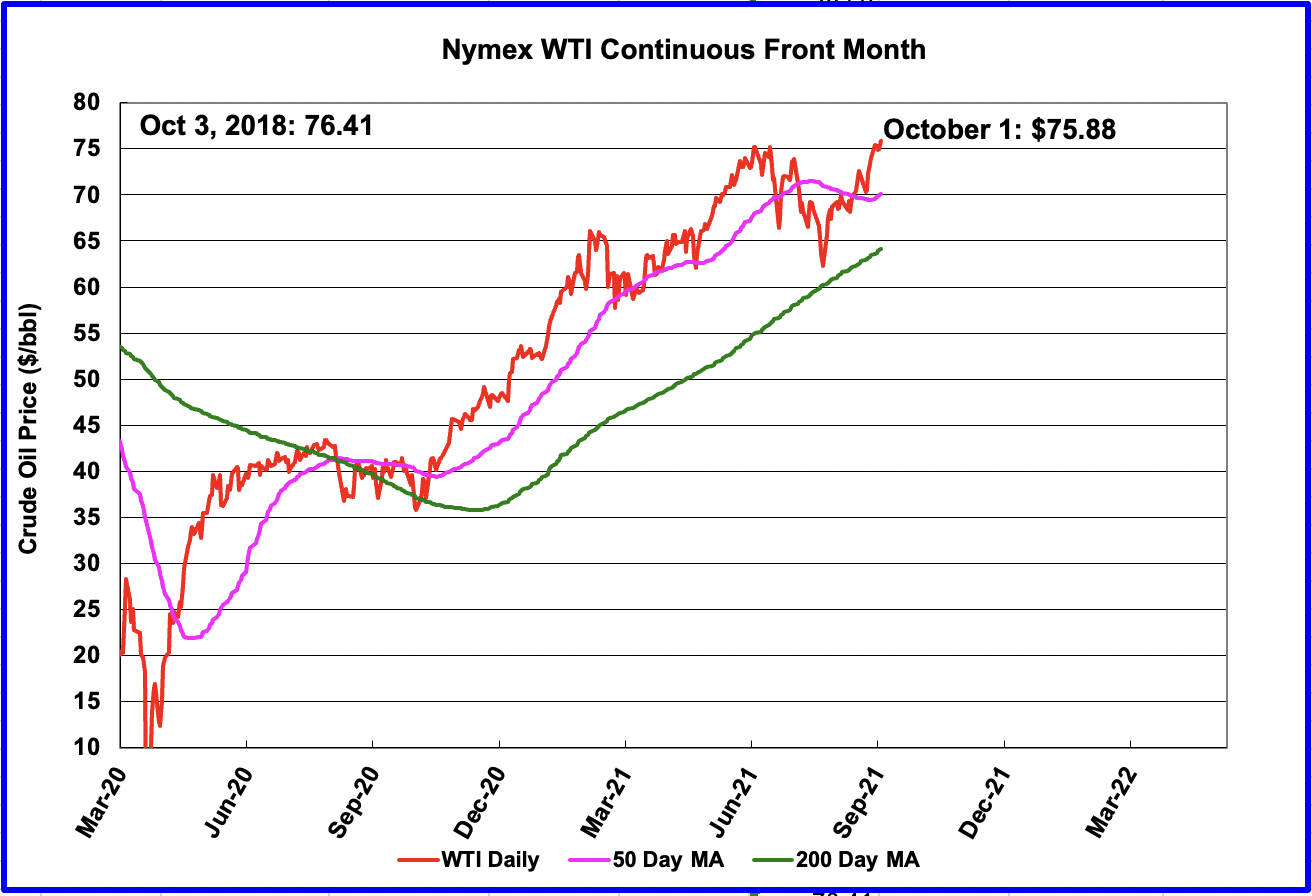
Front month WTI settled price. Previous recent high, October 3/18, $76.41.
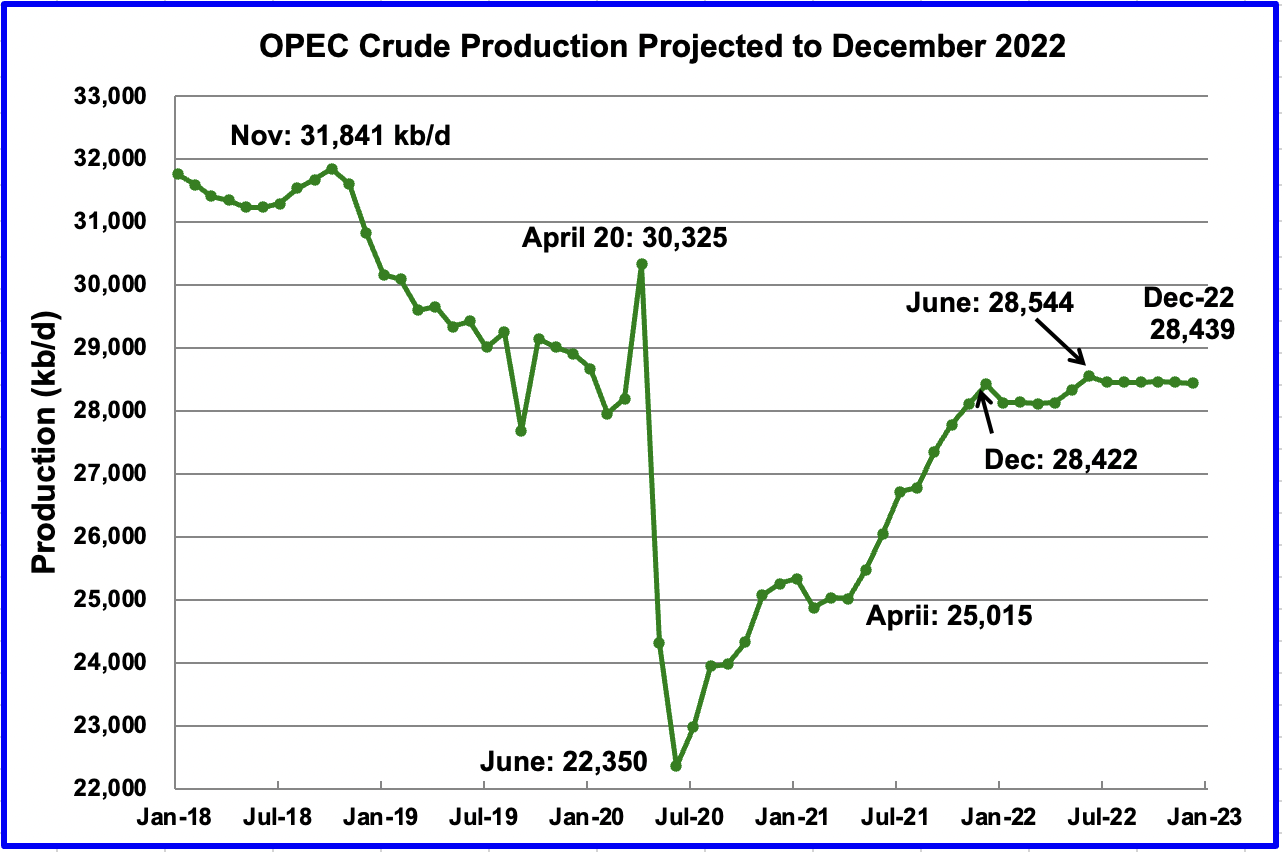
This chart shows the STEO’s September forecast for OPEC crude output to December 2022. OPEC’s output is projected to increase from April 2020 to December 2020 by close to 3,400 kb/d.
For August 2021, EIA forecast production to be 26,775 kb/d. Actual production as reported by OPEC was 26,762 kb/d. Amazingly accurate.
In July, OPEC + announced they will add 400 kb/d/mth from August to December for a total of 2,000 kb/d. Of the 2,000 kb/d, OPEC will add 1,712 kb/d according to the EIA. The EIA’s projected OPEC monthly increases for August to December are, 65, 575, 425, 329, and 318 kb/d, respectively.
OPEC’s production for the second half of 2022 is projected to be flat and close to 250 kb/d lower than OPEC’s output on January 2020, just prior to the onset of the pandemic.
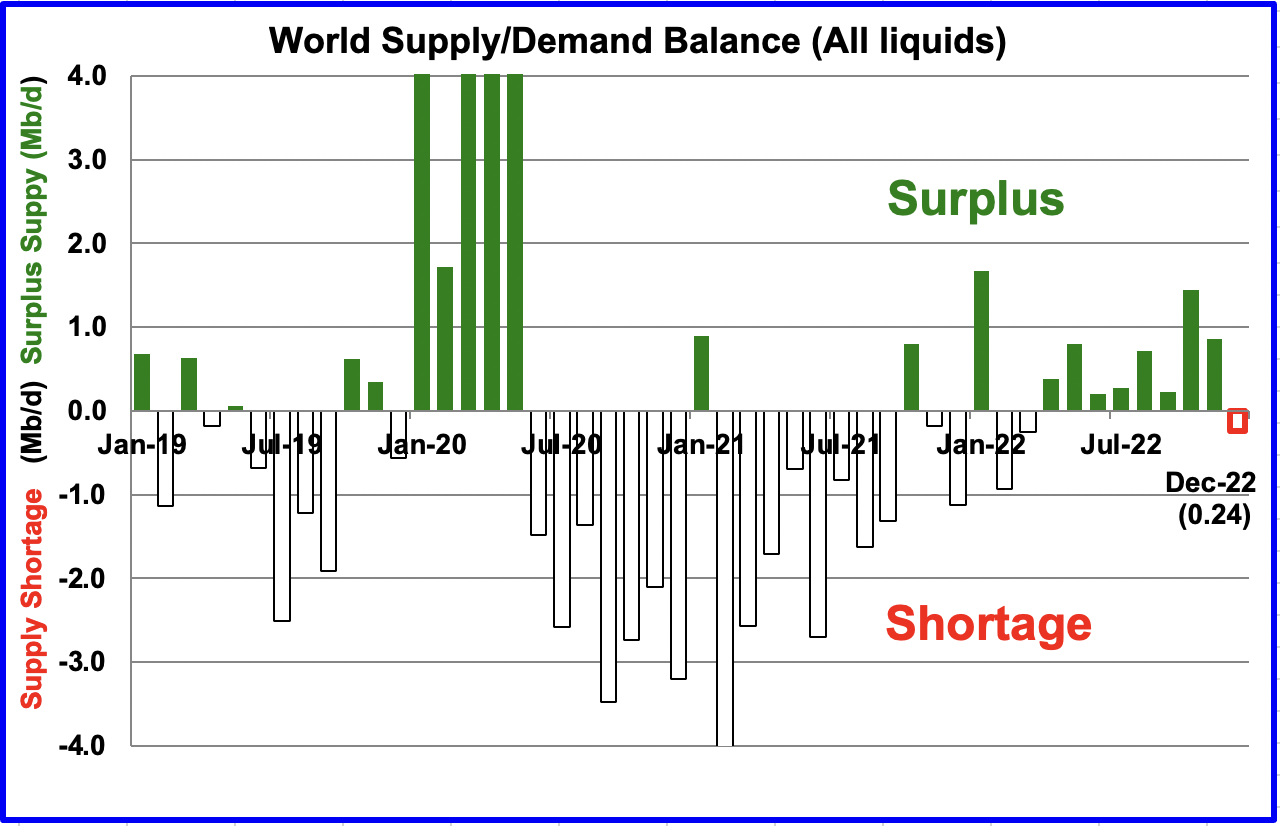
This chart show the historical supply/demand situation up to August 2021 and after that, the EIA’s forecast out to December 2022. After the supply surplus from February to June of 2020, world oil supply was intentionally reduced by OPEC and its partners. The US also reduced its output but the reduction was related more to the low price of oil.
From April 2022 to November 2022, the STEO is forecasting an average surplus of close to 610 kb/d.
2) Drilling Productivity Report
The Drilling Productivity Report (DPR) uses recent data on the total number of drilling rigs in operation along with estimates of drilling productivity and estimated changes in production from existing oil wells to provide estimated changes in oil production for the principal tight oil regions. The following charts are updated to October 2021.
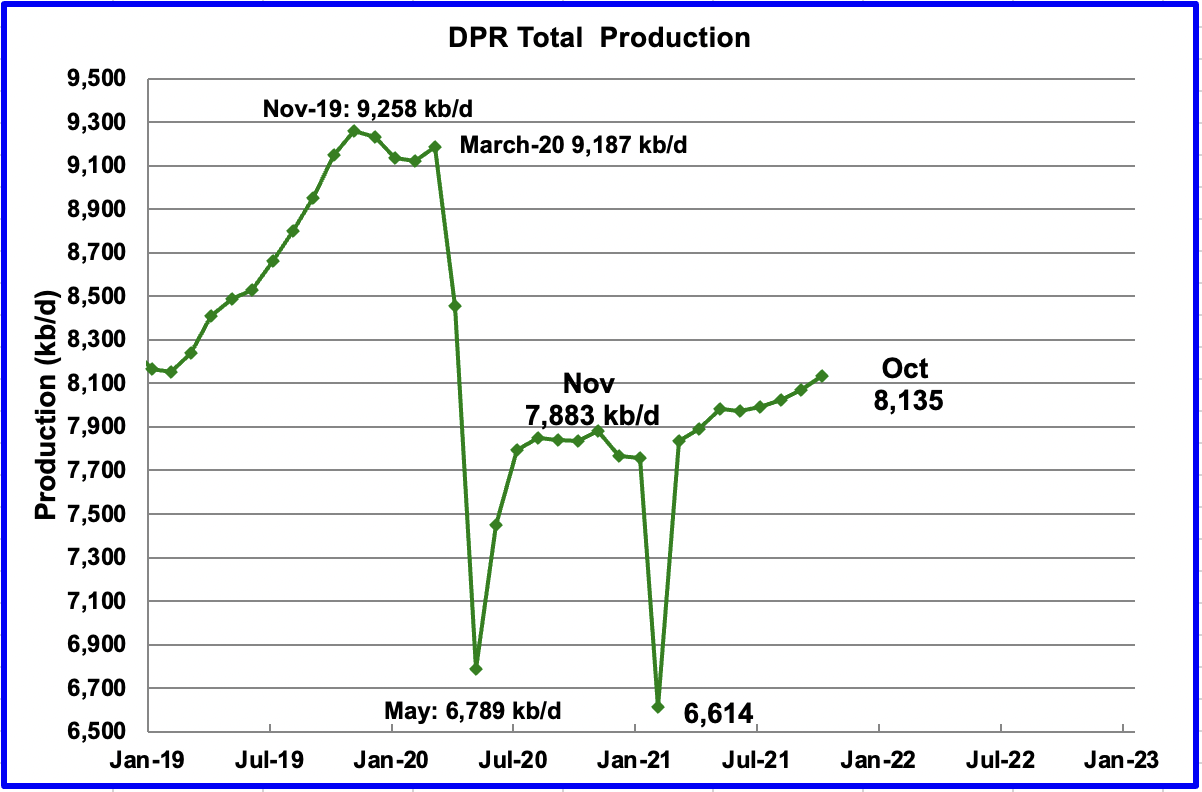
Above is the total oil production from the 7 DPR basins that the EIA tracks. Note that the DPR production includes both LTO oil and oil from conventional fields
The DPR is projecting output for October 2021 to increase by 67 kb/d over September to 8,135 kb/d. From March to September, output in the DPR is forecast to increase by 298 kb/d or close to 42.5 kb/d/mth and appears to be accelerating.
The September output in the August SPR report was revised down from 8,085 kb/d to 8,068 kb/d in the September DPR report.
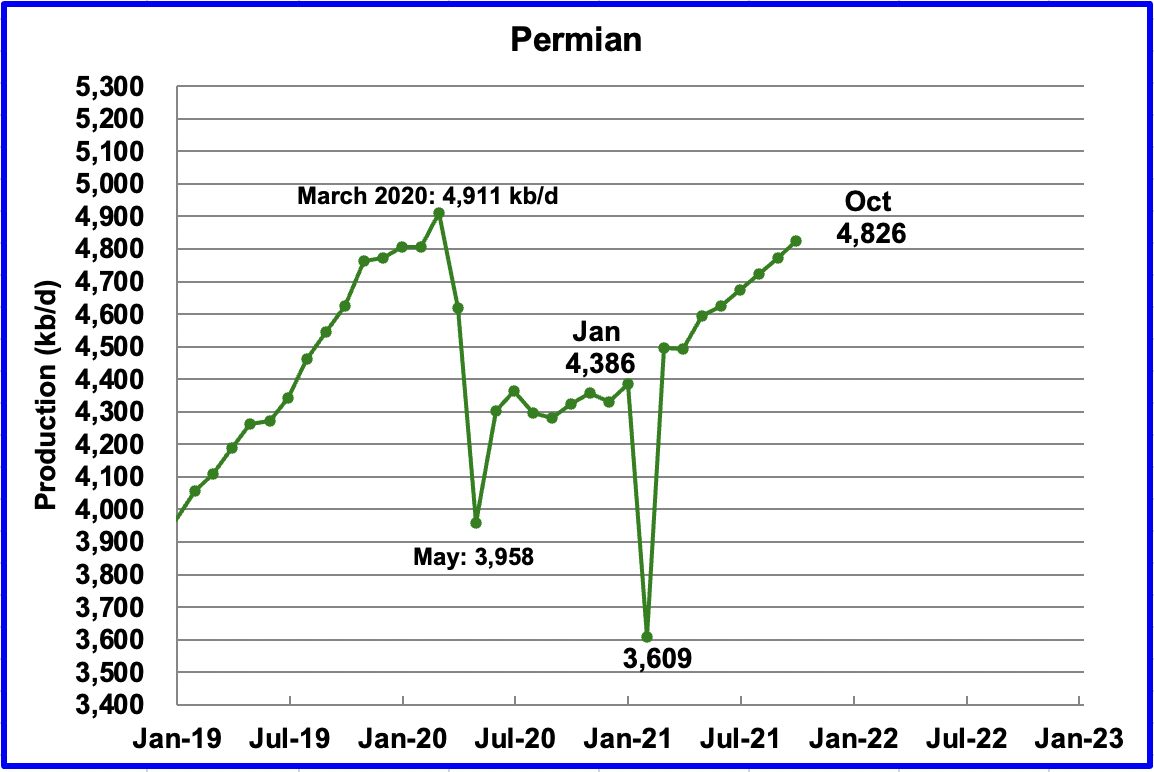
Permian output in October 2021 is projected to be 4,826 kb/d, up by 53 kb/d from September. From March to October production increased by 331 kb/d or approximately 47.3 kb/d/mth. At this rate, Permian production will exceed the March 2020 peak of 4,898 kb/d in December.
During July, 263 wells were drilled and 393 were completed. The completed wells added 286 kb/d to the forecast July output. The decline was 238 kb/d which resulted in a net increase of 48 kb/d. If no DUCs were completed, output would have been close to 191 kb/d. (263/393*286 = 191). This would have resulted in a decline of 47 kb/d rather than the 48 kb/d increase. Note that this is just a one month estimate. As time goes on and fewer wells are drilled and completed, the decline rate would also drop. The point being made here is that it’s the completion of the extra DUCs that is increasing production.
At some point more drilling will be required as the number of Prime/Sweet DUCs diminishes.
Shale profile has an excellent long term projection for the Permian.
https://shaleprofile.com/blog/permian/permian-update-through-june-2021/
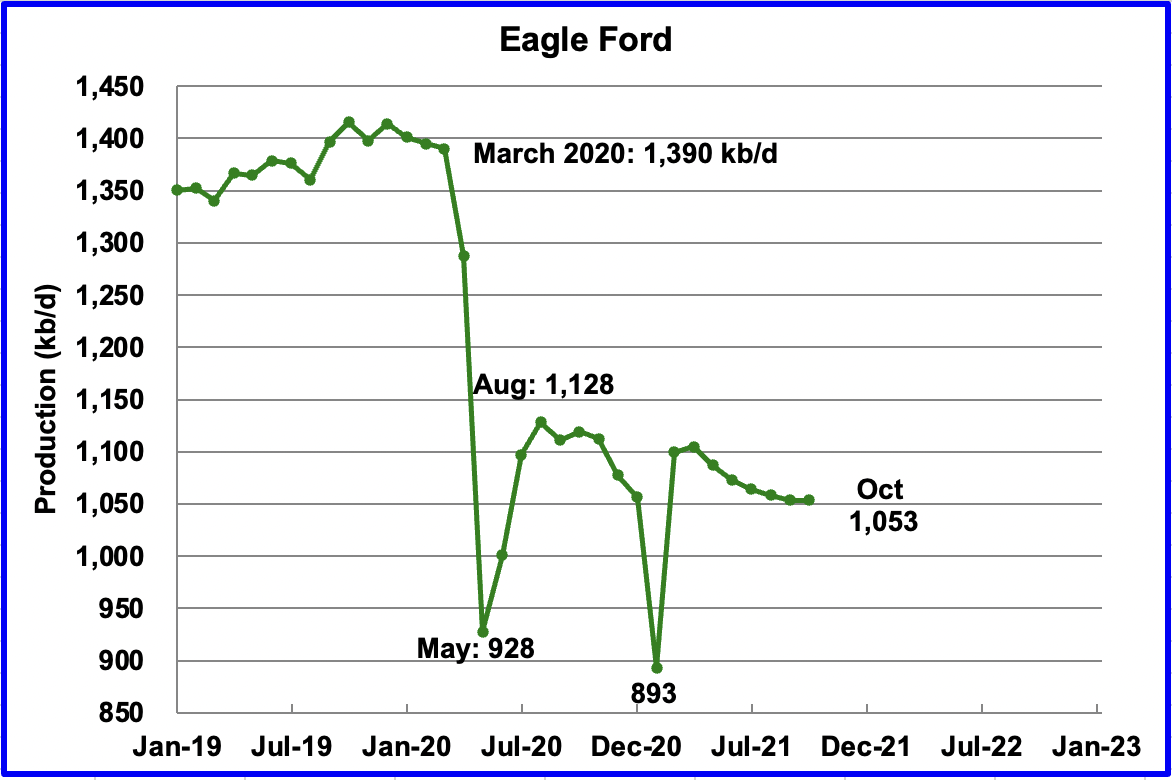
The forecast for the Eagle Ford basin has shown a dropping but slowing output for six consecutive months. Output is expected remain unchanged in October at 1,053 kk/d.
In July, 57 wells were drilled and 101 were completed. The completion of 44 DUCs was required just to hold output flat. In July, EF had 912 DUCs remaining. How many of those are dead DUCs, 1/2? Anybody willing to venture a guess?
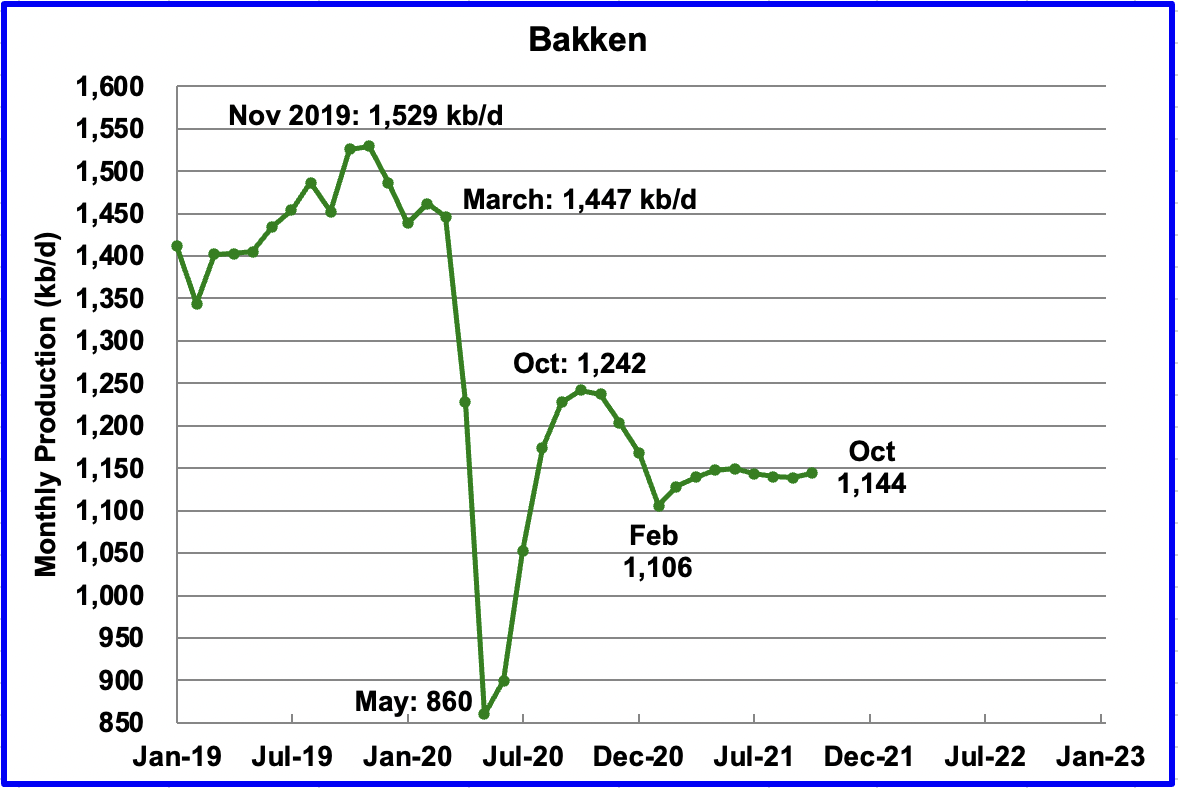
The DPR forecasts Bakken output in October to be 1,144 kb/d an increase of 5 kb/d from September.
Bakken data from the North Dakota Oil and gas Division looks different. See below
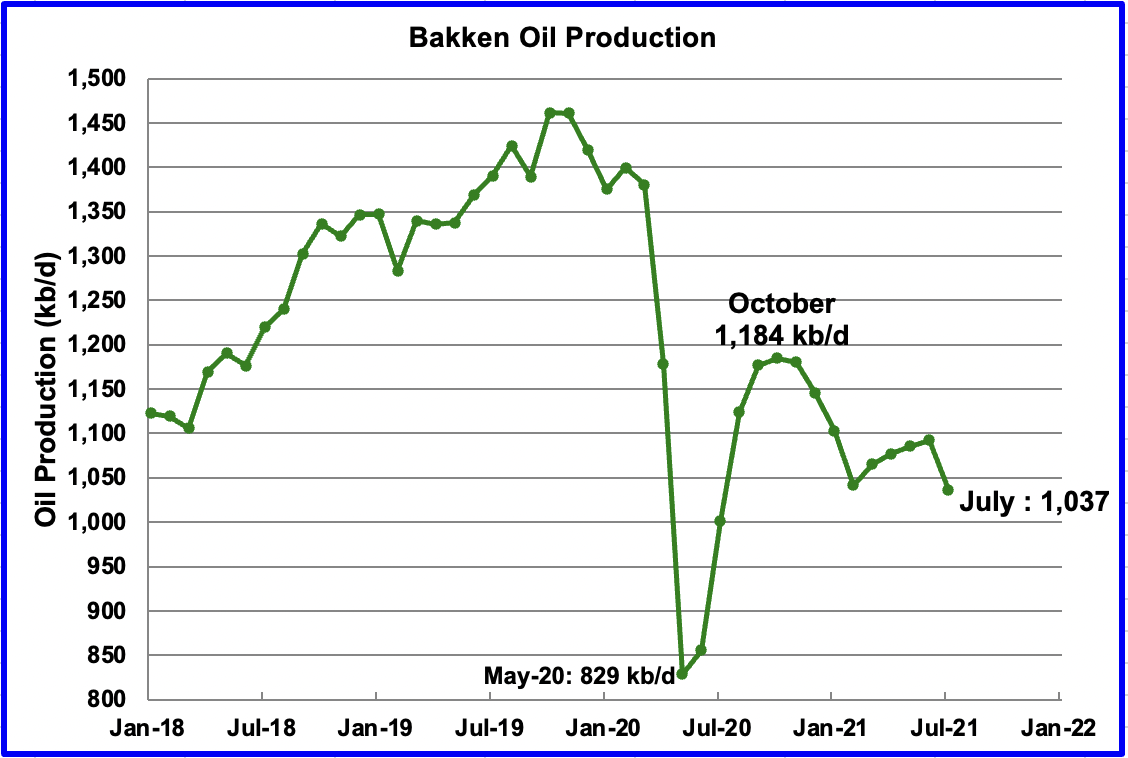
Output dropped by 55 kb/d in July to 1,037 kb/d. Only 14 producing wells were added in July instead of the more typical 150 to 200.
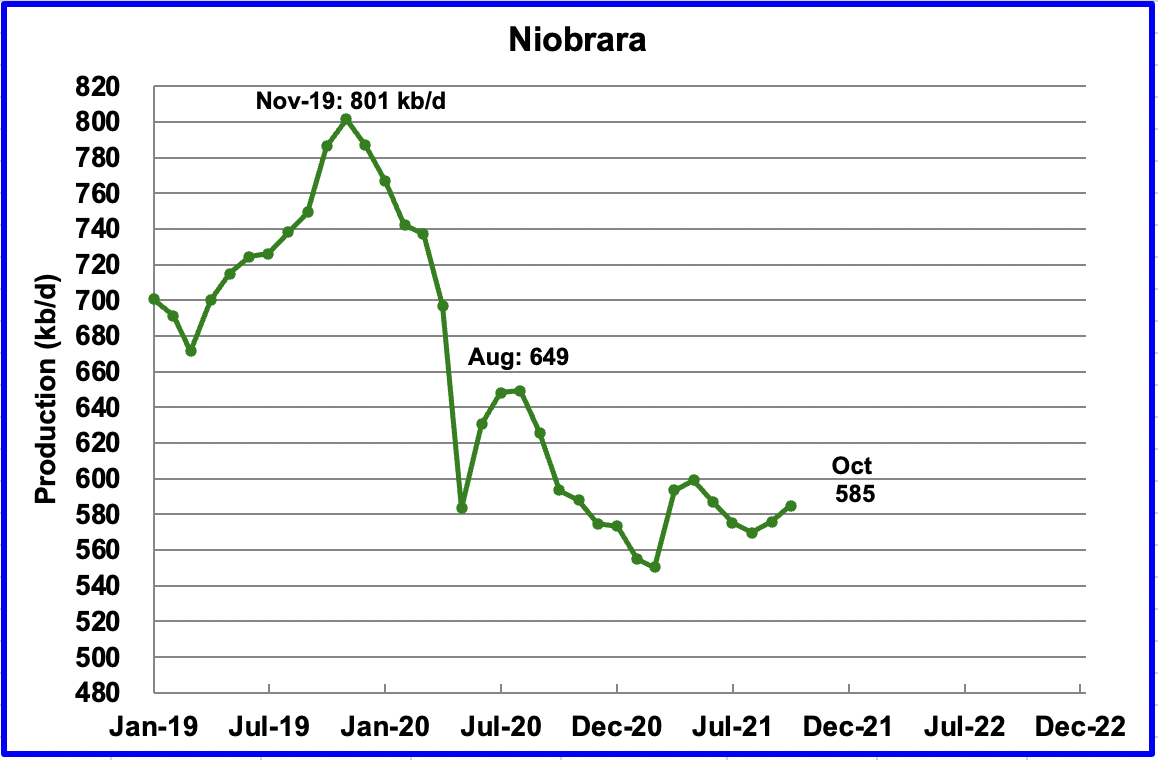
Output in the Niobrara reached a new low in August 2021, 570 kb/d. However, September and October are forecast to increase.
The Niobrara is spread over Wyoming and Colorado. In June, 7 oil rigs were operating in the Niobrara. By September, they had increased to 12.
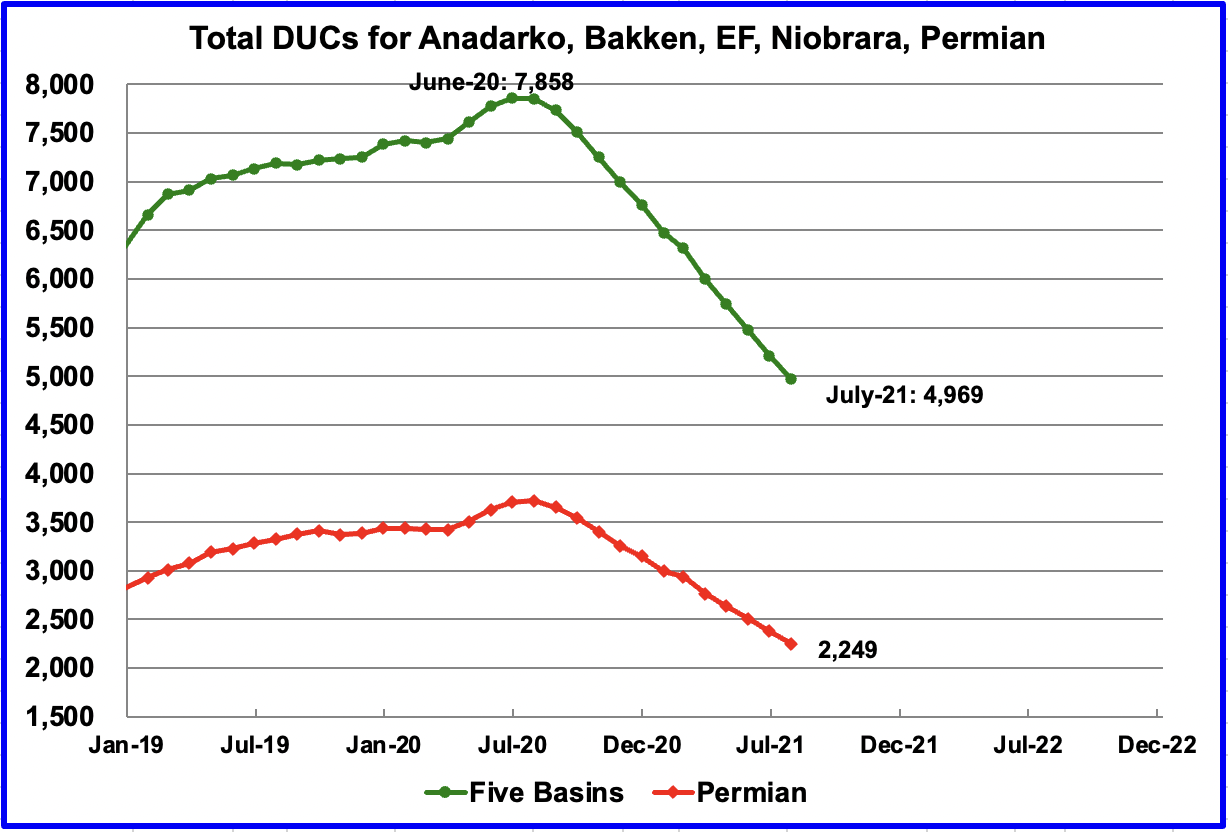
In these five primarily oil basins, DUCs are being completed at an average rate of close to 270 DUCs/mth. In total 243 were completed in July, according to the EIA. In the Permian, the completion rate is close to 135 DUCs per month. In July, 130 were completed in the Permian.
The monthly completion of DUCs accounts for the increase in production in the Permian and the other oil basins.
3) LIGHT TIGHT OIL (LTO) REPORT
The LTO database provides information on LTO production from seven tight oil basins and a few smaller ones. The September report projects the tight oil production to August 2021.
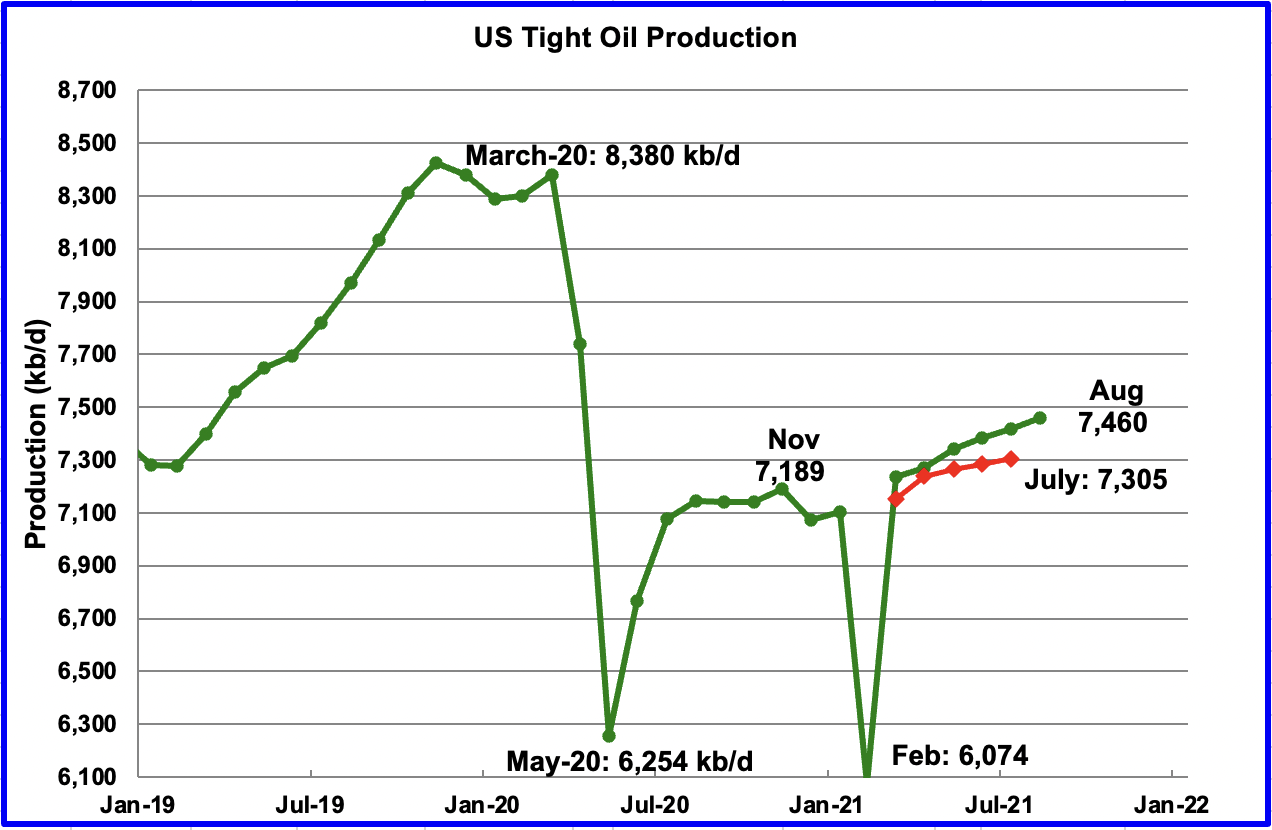
August’s LTO output is expected to increase by 42 kb/d to 7,460 kb/d.
In the September LTO report, July’s forecast output was increased from 7,305 to 7,418 kb/d, an increase of 113 kb/d. It appears that the early estimates are always on the low side. The red markers represent LTO output as reported in the August report.
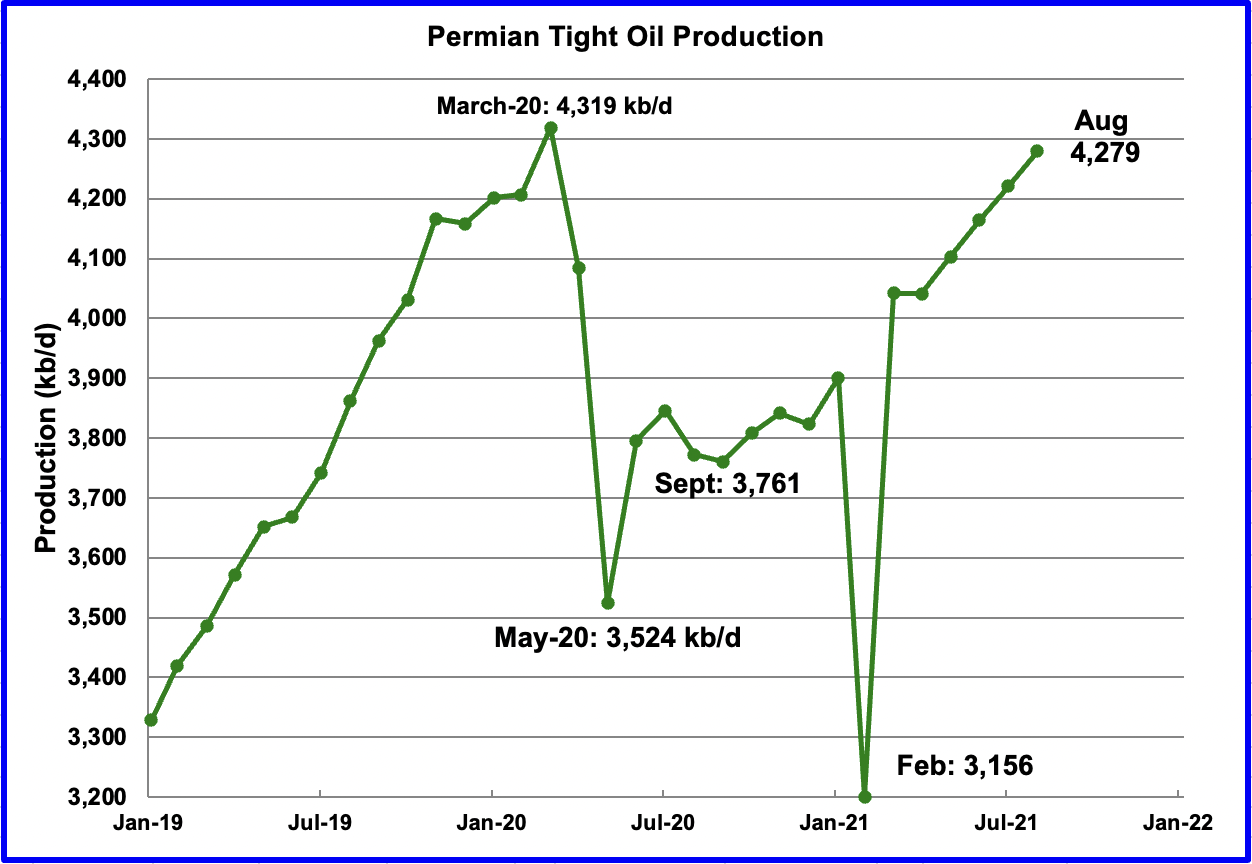
Permian LTO output in August is projected to increase to 4,279 kb/d, an increase of 58 kb/d. Production in the Permian continues to rise at an average rate of 60 kb/d/mth since April. At this rate, it could almost equal the March 20 high of 4,319 kb/d by September.
It should be noted that Permian DUCs are being completed at an average rate of close to 135 DUCs per month and contribute to the rising production.
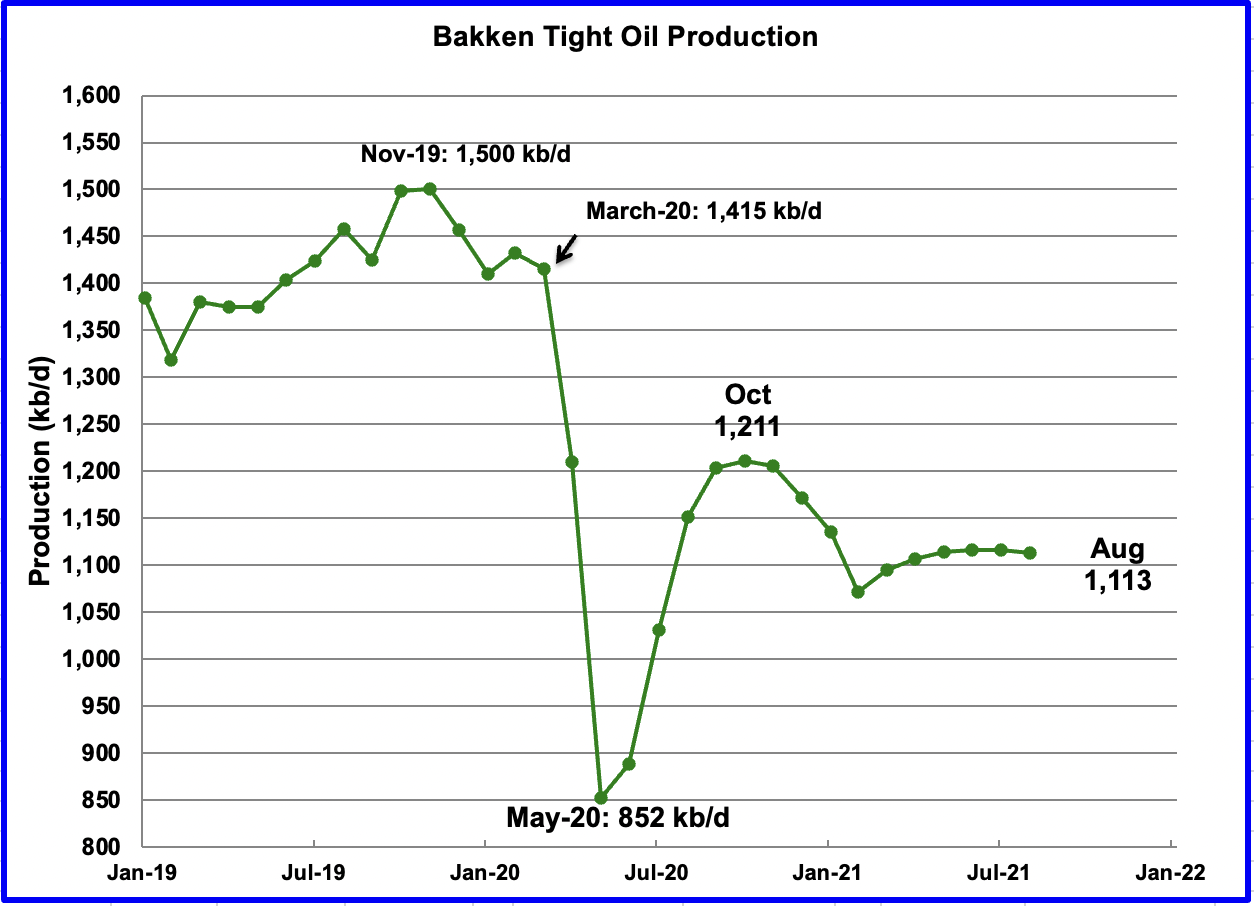
The Bakken’s August output declined by 3 kb/d to 1,113 kb/d.
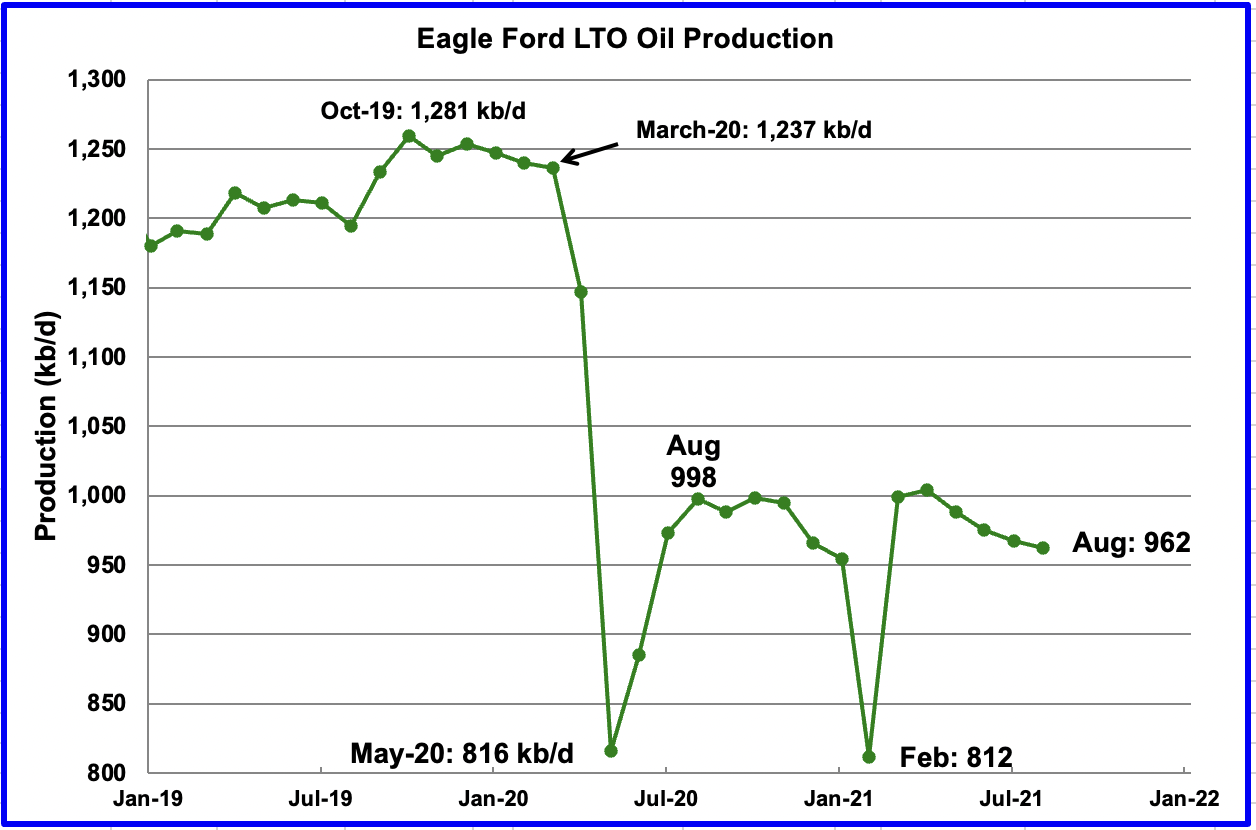
The Eagle Ford basin is expected to produce 962 kb/d in August, a decrease of 5 kb/d from July.
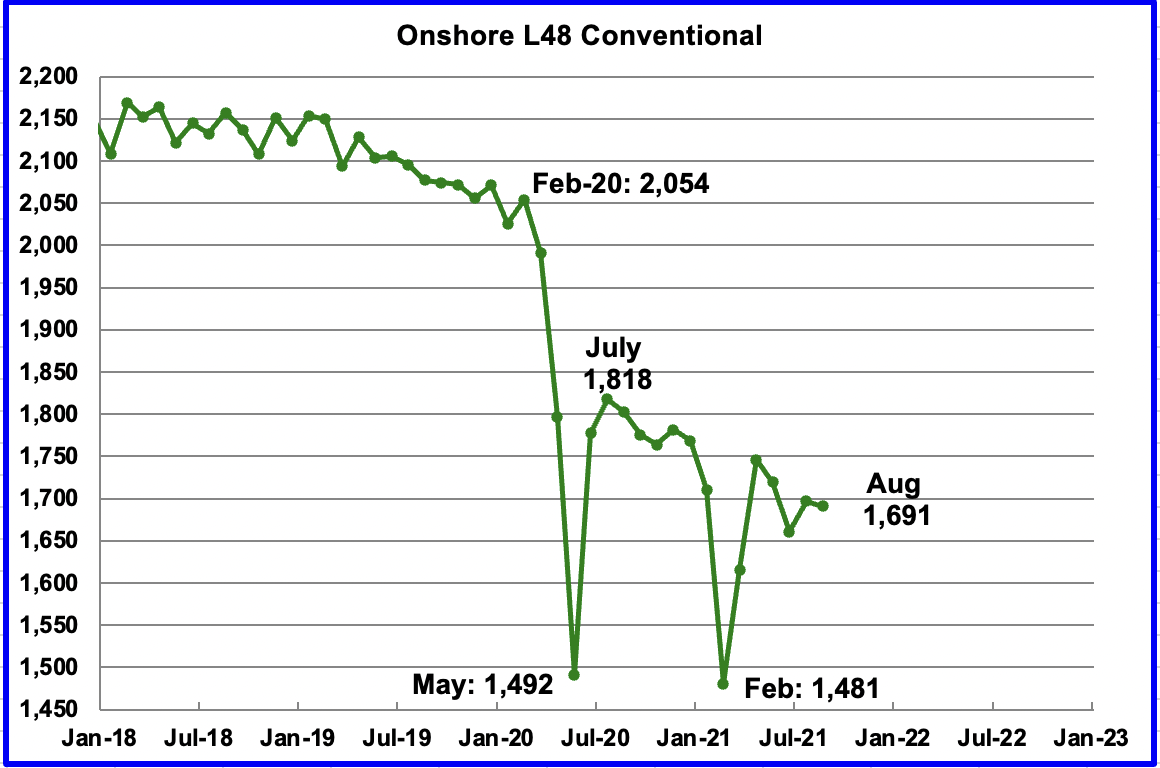
Conventional oil output in the On-shore L48 is expected to decrease in August by 6 kb/d to 1,691 kb/d. This estimate is based on a combination of the August LTO output and the September STEO report that has a projection for the US on-shore L48 output for August 2021.
In the September LTO report, LTO output was revised up by close to 100 kb/d. This revised output resulted in a decrease in conventional oil output. The July conventional output of 1,794 kb/d in the August report has been revised down by 127 kb/d to 1,697 kb/d in the September LTO report.
4) Rigs and Fracs
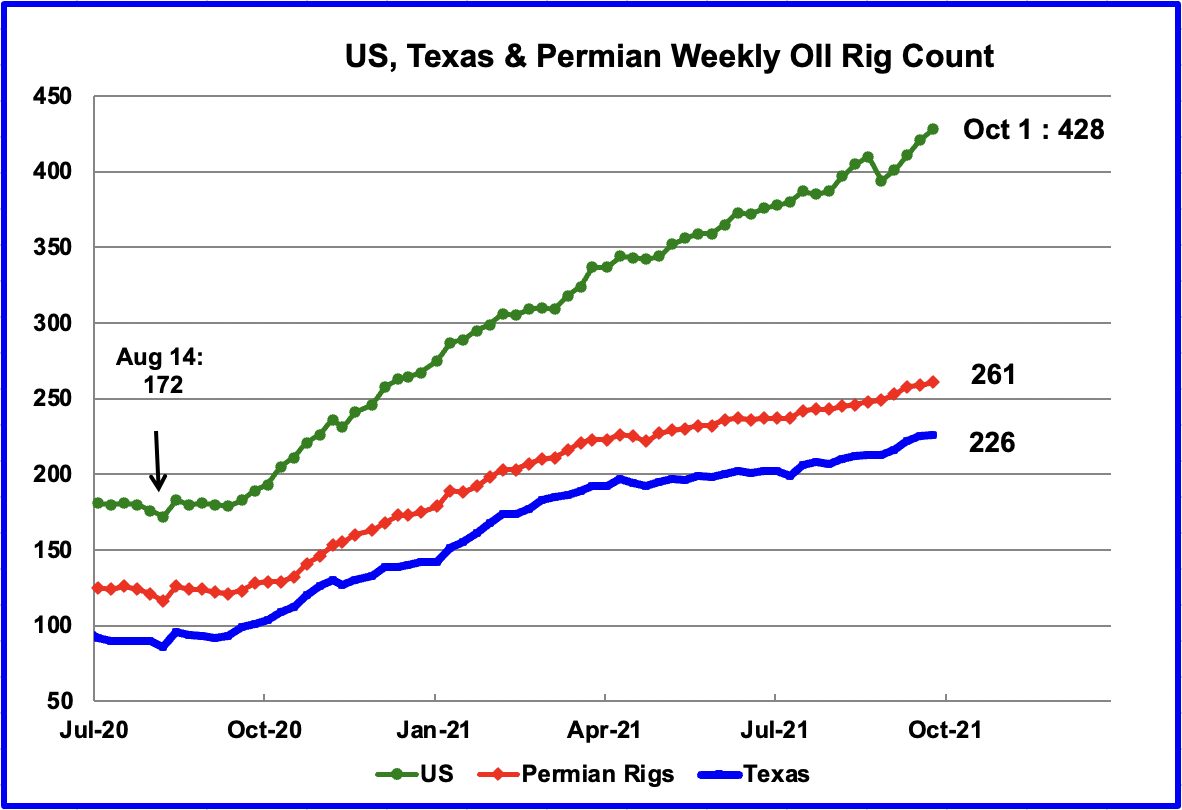
Since the end of August to the end of September, the US added 18 oil rigs for an average rate of 4.5/wk. Of the 18, 5 were added in New Mexico, 8 in Oklahoma, 13 in Texas and 6 in New Mexico. Six were decommissioned in Louisiana due to hurricane Ida, and 1 each in Ohio and Utah.
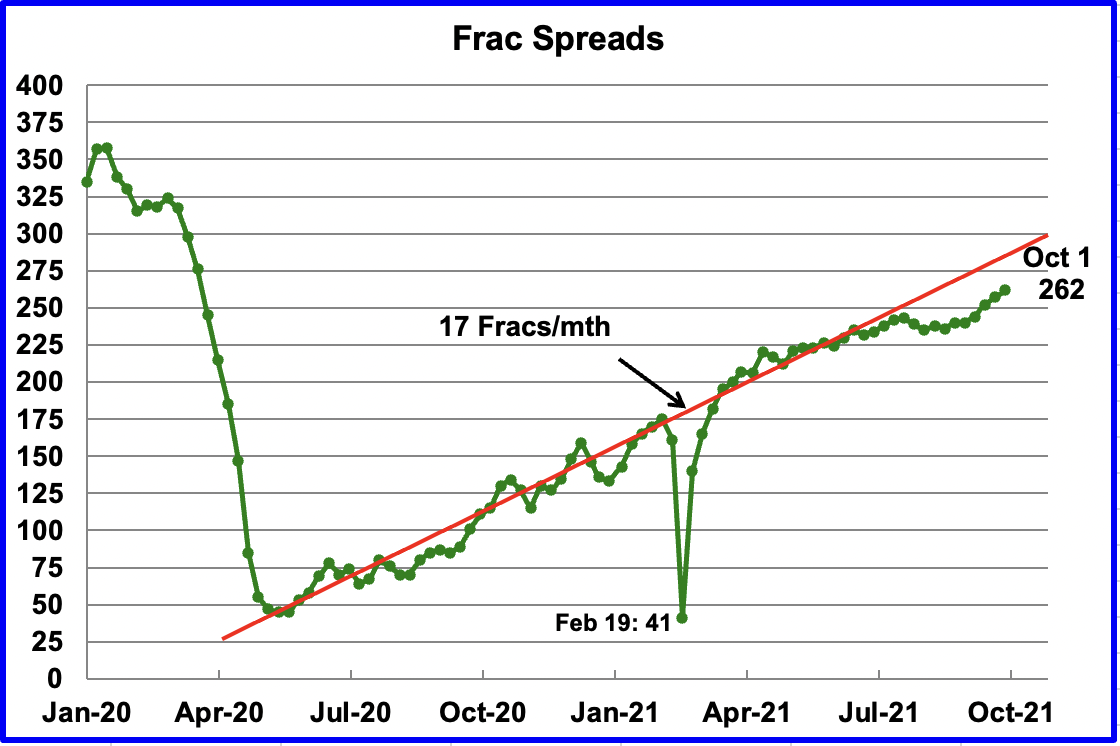
Since the week of July 23, frac spreads were not beeing added at the previous rate of approximately 17 spreads per month due to hurricanes. However, for the past few weeks, frac additions have been back to the previous rate of closer to 17/mth. Note that these 262 frac spreads include both gas and oil spreads, whereas the rigs are strictly oil rigs.
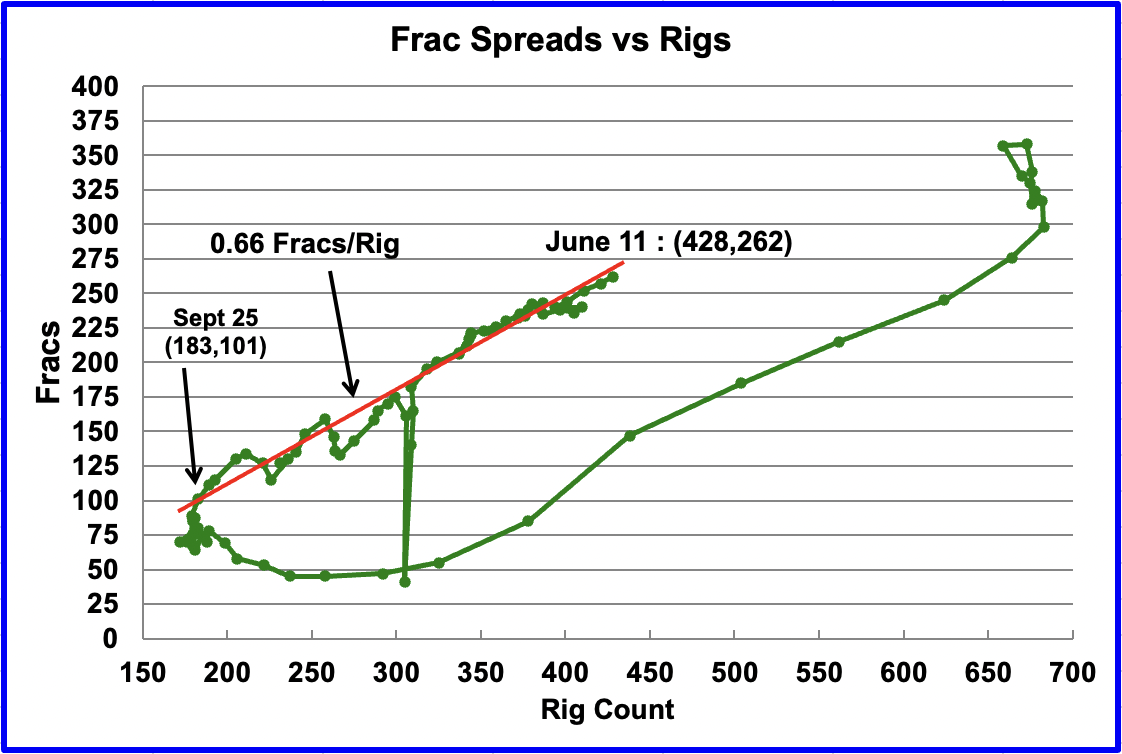
This chart shows how Frac spreads are added in proportion to rigs. Over the last three weeks, Frac spreads additions are back to the previous rate of roughly 2 Fracs spreads for every 3 rigs.
211 responses to “July US Oil Production Growth Slows”
Here are some graphs by John Kemp on the European natural gas situation.
https://fingfx.thomsonreuters.com/gfx/ce/zjpqkjzympx/EUROPE%20GAS%20AND%20ELECTRICITY%20PRICES.pdf
As mentioned in link and far below, NS2 is reported to be beeing partially filled/tested.
We´ll see how that plays out, depends on what the russians want to put in it, and when, at what price, if that´s not been set already obviously.
The impact on US and Quatari LNG exports to Europe will also be interesting to follow of course.
https://www.reuters.com/business/energy/nord-stream-2-starts-filling-pipeline-with-gas-tests-2021-10-04/
Laplander , I don’t know about USA LNG exports but Qatar is ” Housefull ” . Prebooked by Japan , South Korea , Taiwan and India under long term contracts . A little maybe leaking off to Europe but 70-75% s the four countries mentioned . Europe buying from USA doesn’t make sense considering the freight .
Just eyeballing but it looks like on average ~2-3 BCF/day to Europe from the US from 2019 and up to July 2021, but with quite large variability, current volumes/prices unknown to me, but likely possible to find.
https://www.eia.gov/todayinenergy/detail.php?id=48876
Laplander , I will not argue over what I don’t understand/ don’ t know , so I will stick to what I do know . The Baltic states + Poland wanted to stop NS 2 because that would by-pass them . So they announced ” We are going to boycott ” Russkie” gas and we will import LNG from USA to show we are energy independent . Understand this decision was when Trump was POTUS and not under Biden . Problem was as I mentioned “freight costs ” . Solution . Traders like Trafigura . Glencore etc come into the picture . They loaded LNG at Yamal (Russia ) on LNG carriers flying under flags neutral( Panama , Liberia etc ) delivered it to the stupid (intelligent) Balts + Poles and labelled it as US origin . They creamed the freight arbitrage from USA to Europe + profit . This was labelled as a US import in the Balts + Poland . Winners were Trafigura , Glencore etc and the looser was Balts + Poland . The Balts and Poles boasted ( 6-7 months ago ) we are going to be the one’s going to break the Russkie monopoly on gas supplies to Europe . Well , to cut a long story short Europe zonder (without ) Russkie gas is FUBAR . Europe is FUBAR without “Don ” Putin . You need their oil , gas and coal . All in Europe should ” Hail Putin ” otherwise buy yourself blankets ,quilts and start eating potatoes to survive . I am not joking .
https://www.youtube.com/watch?v=bBtW9uGjd8U&t=3s&ab_channel=RT
Don’t mess with Putin .
Quite interesting, will try to find out more about that, but if there is a buck to be made, someone will, one way or another. I have no agenda for/against Putin/Russia, but at the moment their NG is quite valuable for Europe (since the continental part of it has a one brick / one glazing window insulation strategy in housing and a lot of industral efficiancy gains to be made)
So like it or not, they affect the energy situation in Europe quite heavily, and from what I´ve read, the transit losses through mainly Ukraine were big, hence the bypass, so business related again.
(Of course Estonia, Latvia and Lituania were really badly treated by USSR before, and after WW2 by Sweden in Baltutlämningen but that is another question)
Edit: Since there is EIA US LNG export data and quite likely import data for Europe, these could then be compared if you could get hold of them.
Not that I don´t think it´s been done, but how much, and by whom? and sadly, provable in courts…
Edit again, good video : )
In GoM 250kbpd o so of Shell production is still out because of structural damage to one of their pipeline transfer platforms and might be fo another couple of months. And, like last year, the late season conditions in the Caribbean and Gulf will be highly conducive to storm formation with convective and moist air, very warm waters with high heat content to low depths and low wind shear, so the second half of October through maybe to early December could see plenty more deferment.
George
Thanks for noting that. I intended to mention that in the GOM comments but forgot.
I expect to see this reduced GOM production show up in the next STEO.
Ovi,
GOM light production peaked in 2018. Any growth now is stuff that isn’t oil. The api 30-40 has been declining for years.
I made a GOM reserve estimate to show how depleted it is.
GOM is 160 million acres at 30% porosity. The productive layer is about 300 meters. This comes to 500 trillion barrels of rock.
Assuming a high TOC of 5%, 10% soluble, and 5% light that’s 125 billion barrels oil in place or 37 billion at 30% recovery. Half of that is federal GOM or 19 billion.
Current cumulative production in federal is 19.5 billion barrels. As you can see they have blown past the reserve of light oil and are now using other products. It’s physically impossible to get more out, even under generous assumptions of hydrocarbon generation.
Tks Ovi . So 12,893 kpbd still remains king , inspite of all the huff and puff .
HIH
It will take a while.
Ovi , want to make a bet it will not be breached ?
Ovi: How far back date wise can you go on lower 48 conventional?
Again, much thanks for this!
Shallow Sand
With a bit of work, I can get it back to 2010. Appreciate that back then, LTO was just starting and US production was just above 5,200 kb/d. Will post chart later.
Ovi, you appear to be including the shale boom as conventional production. Nothing grew after about 2000 besides tight fields. To the extent it’s not included as EIA LTO it’s because EIA substantially changes their definition, just last year they doubled their Wolfcamp production for example.
Conventional production is the pre-2000 trend line and it is basically zero by now.
Shallow Sand
Attached is the L48 conventional starting in 2010. It is US total minus Alaska minus GOM minus LTO. It peaked in Dec 2014 at 2797 kb/d.
The graph below shows the yearly lower-48 over a long period. Note that it is in exponential decline.
Seppo.
Thanks for this!
This graphic should be generating a lot of discussion here!
Excellent graphic showing the effects of price on production. From 1/10 to 1/15 a 12% increase at basically $100 oil. Then a 30% decline from 1/15 to 1/20 at about $60 oil. Followed by a larger decline with $20 to $40 oil.
Yes.
Remember prices in the decade prior to 2010. 1998 saw $8-12 well head prices. Early 2000 was $15-30. Then came the Iraq war. $40s in 2004. $50s in 2005. $60s in 2006, $70s-$90s in 2007. Peaked at $140s in 2008, crashing all the way into the $20s in late 2008, early 2009. Then ramping back up 2010 into the $70s, followed by $85-105 2011-14 until the late 2014 crash.
But wow, has inflation hit us like a ton of bricks. Just got the bill in the mail for a couple of tubing jobs. Over $1K each, we were paying as little as $550 just last year.
We are plugging low volume wells to have enough down hole equipment to keep the good wells going.
I don’t think people here want to admit how things are right now supply chain wise and inflation wise.
Labor wise, those two wells I refer to don’t get pulled if a guy who works a full time factory job had not helped out on his days off.
I drove 2 hours S through countless little stripper fields Friday. Still many SI wells with weeds growing up around them, same with tank batteries. Many had that abandoned look.
Long term this “energy abundance” from US shale is going to be one huge head fake.
We need to ramp the renewables quickly, but we also need to get a clue and understand that it’s not going to happen overnight and also not without tremendous economic cost.
The Congressional progressives have no clue about the starvation and suffering premature “leave it in the ground” will cause. We are so far away from being in a position to do that, based upon recent energy events in UK, Europe and China.
Completely agree SS, including those last 3 statements
SS- really appreciate your first hand insight on what is happening on the ground.
Thanks
Shallow sand,
What were the prices in 2018 or 2019 for similar work, last year I imagine demand was low and prices might have been low.
Thanks Ovi!
For US L48 onshore conventional from Jan 2000 to Dec 2019, the exponential trendline (using ordinary least squares regression) has an average annual decline rate of 1.24% per year.
Chart below, with logarithmic vertical axis (to show decline rates more clearly).
Dennis, you decline rate might be too low. For 2020 your equation gives 2058 kb/d and for 2000 it gives 2629 kb/d, but your data appears to be around 3000 kb/d in year 2000.
From the peak of lower 48 to 2020, I get 3.4% decline rate. For a large oil province such as lower-48, the decline rate is usually in the 5% range, as it will be for the world. Smaller regions such as Norway have decline rates of 10% in the exponential decline part of the curve.
Seppo, it’s because America has very generous policies for stripper wells, those wells are producing 15 boe/d at some pitiful eroi.
America has 7 million barrels per day production below api 45, and a million wells. The average well in America produces seven barrels per day. At that pitiful rate you could produce for a long time.
EG
From https://nswa.us./stripper-wells
USA has about 400,000 stripper wells with less than 15 b/d and these account for 7.4% of oil production. There are some 360,000 natural gas wells with production less than 90 Mcf/d and these account for 8.2% of the US production.
Decline rate, lambda, for exponential decline is given by lambda=q(t)/(Qf-Q(t)), where q is the yearly production and Q is the cumulative production and Qf is the ultimate.
Seppo,
I was referring to why the decline was slow, and it’s because stripper wells.
That 1 m bpd production is basically all the “conventional” oil. You can see https://www.eia.gov/dnav/pet/PET_CRD_API_ADC_MBBLPD_M.htm , although this data is somewhat convoluted. Diluent artificially moderates api by averaging grades even though it’s useless when input to a refinery.
If we take the API 30-40 as the definite oil then America only produces two million bpd onshore. Half if not all of this is stripper wells.
As for the non-stripper production, you’re not seeing it decline because heavy and condensate are being produced at a loss. You’re not seeing a decline rate, you’re seeing these otherwise useless oils becoming popular due to ethanol, plastic and other interest group uses.
The actual decline rate of American wells is pretty much globally average and we can’t see it because all the real, conventional, non stripper production is dead. Conventional drilling died by 2000 and there are no conventional wells left, so that’s close to the decline rate you gave. You can ask AdamB on peakoil, he was drilling conventional wells in the nineties which were probably the last ones.
You can look up decline rates on GOM projects and those are extremely steep, most wells die after 3 years and then get water flooding or heavy oil. GOM requires a treadmill of new rigs replacing the entire production every 3 years.
Seppo,
Slope based on ordinary least squares regression on natural log of lower 48 onshore conventional c plus c output from Jan 2000 to Dec 2019.
From 1986 to 1999 the rate of decline was about 3 to 4% per year, perhaps due to lower oil prices and less investment by producers.
Dennis,
No, that was just the actual decline, the 1-2% decline later was because everything was reduced to stripper wells.
https://www.eia.gov/todayinenergy/detail.php?id=24932
Once it becomes a stripper well the decline becomes extremely slow. Mclintock well continues to produce after 160 years.
Seppo,
The URR is unknown, I define decline rate as a function of time, not as a function of output. We are defining things differently, usually when we define a rate for something it is with respect to time and in general the quantity in question (in this case US L48 onshore conventional C plus C output) is plotted on a semilog chart with time on the horizontal axis and the quantity in question plotted on a log scale vertical axis. The exponent of the exponential function fit to the data gives the annual decline rate when we use years as our unit on the horizontal axis.
Dennis:
I plotted the data according to the suggestion of Arps in “Analysis of decline curves”. Transactions of American Institute of Mining, Metallurgical and Petroleum Engineers, vol 160, pp-228-2147, (1941). This comes to the same result as plotting the solution for an exponential decay on a semi-log paper, and gives a quicker eyeball estimation by examining the slope. It also gives a quick estimate for the URR. Of course URR is not static and is modified as new data is recorded year after year, but the URR does drift much and for the lower-48 appears to come close to Hubbert’s 1956 estimate (tight oil making a separate category).
Seppo,
Problem with the solution is it depends on URR, the way I do it gives us decline rate directly without any assumptions about URR, seems a better method as there are fewer unknowns (just slope and intercept), though I suppose the URR is dependent in the intercept so simply two different approaches that give the same result.
Using US L48 onshore conventional C plus C output data from the EIA over the Jan 1981 to July 2021 period, my method gives an annual decline rate of 3.11%. If we do a rough calculation from 1970 peak to end of 2019 (10000 to 2000 kb/d over 49 years) we get about a 3.2% average annual decline rate over a 49 year period.
Dennis
What I got was stated above “the peak of lower 48 to 2020, I get 3.4% decline rate. For a large oil province such as lower-48, the decline rate is usually in the 5% range, as it will be for the world.”
So the same as you!!
Look at the graph, I also use only the slope and intercept. It turns out that the intercept can be interpreted meaningfully.
best Seppo
Seppo,
Yes I realized later that the URR estimate is based on x-intercept, so you simply used slope nd intercept just as I did, the two mthods are equivalent, but my method does not require knowledge of Arps equations it simply looks at output over time so anyone who understands mathematics would follow the analysis without further knowledge. I tend to assume people have at least a knowledge of high school level advanced algebra, but not necessarily any knowledge of petroleum engineering.
“The Budget Bill Could Place A Fee On Methane, And Big Oil Is Lying Like Hell To Stop It
In public, industry officials say companies have has an “economic incentive” to curb methane releases. In private, they have acknowledged that isn’t true.
The $3.5 trillion budget reconciliation package at the center of a heated congressional debate this week represents a unique opportunity for Democrats to advance ambitious climate policies. Among its provisions is a fee on methane, an extremely potent greenhouse gas released from a number of sources, including oil and gas operations.
The oil and gas industry is desperately fighting this proposed fee by reupping old, disingenuous claims about having an “economic incentive” to curb methane, since it is the main component of natural gas and supposedly valuable to fossil fuel producers. In other words: Don’t worry about our emissions, we’ll take care of them ourselves.
But in closed-door meetings, industry leaders have admitted the opposite: Methane gas has very little value. That fact undercuts the idea that it’s in the industry’s best interest to capture that gas and sell it rather than vent and leak it into the atmosphere.
Sen. Sheldon Whitehouse (D-R.I.) and other progressives introduced a provision in March that would assess a fee of $1,800 per ton of methane pollution beginning in 2023, with a 2% increase above inflation each subsequent year. In September, the House Energy and Commerce Committee voted to include the methane fee in the reconciliation bill, despite vehement Republican opposition.
Methane is 86 times more powerful than CO2 over 20 years in the atmosphere and accounts for approximately one-fifth of human-caused planetary warming. Atmospheric concentrations have spiked more than 150% since 1750.
Over the last three months, Exxon Mobil, the American Petroleum Institute and other fossil fuel interests have flooded Facebook with ads opposing the budget bill and its climate provisions. Exxon alone has spent $2 million on Facebook ads over the last three months, CNBC reported this week.”
https://www.huffpost.com/entry/fossil-fuel-industry-methane-fee-reconciliation-package_n_6157410ce4b075408bd6eb58
Agree that leaking methane to the atmosphere is a very bad idea. I do not know what the reserve levels are in the US but in the rest of the world it is far from valueless and no methane (the primary constituent of natural gas) is wasted. NG is currently trading in the UK at the energy content equivalent of $180 per barrel of oil. Of course, even at that price there will be a few oil wells where the cost of collecting producer gas exceeds its economic value.
NG reserves in Europe are 20% below 5 year averages, and in the typical winter fall from their current level to 10% remaining by march. (as shown in the link from the OP above).
Global oil supply may have peaked, but outside of the US, it is NG which may have permanently fallen behind global demand first.
Ralph
“Methane gas has very little value”.
“Methane gas has very little value”.
Putting aside any ideological filters, that article from yesterday from Huffpost can offer SO many lessons in information management, presentation, and the consequential world views of so many observers.
The article highlighted comments made almost 2 1/2 years ago by Ron Ness, head of the ND Petroleum Council.
The at-the-time pricing delivered at the Northern Border pipeline (takeaway for the Bakken) was $1.98 /mmbtu … essentially 1 M (thousand) cubic feet of natgas.
As per the Director’s Cut from 2 weeks ago, the Northern Border pricing was $4.77/mmbtu.
Big Difference.
Applying current pricing to most recent published gas output of ~2.6 Bcfd, shows gross revenues of ~$360 million for the month of September.
$360 million. One month. “… very little value”.
There is so much more to this gas flaring story if people were genuinely desiring to be informed, rather than having pre-held biases confirmed.
In North Dakota’s case, the running of gathering pipelines across the Fort Berthold reservation has been stymied by extraordinarily high demands for ROW compensation.
In ‘shale’ wells everywhere, the high decline of initial oil output is accompanied by a similar drop off in gas.
This makes for financially questionable build out of gathering lines absent a firm future trajectory of sufficient natgas production.
P.S. The Bowland and Weald basins contain a century’s worth of British natgas consumption.
Had Cuadrilla’s efforts not been thwarted in recent years, the UK wòuld be on its way to a drama-free energy situation.
Coffee , “P.S. The Bowland and Weald basins contain a century’s worth of British natgas consumption.
Had Cuadrilla’s efforts not been thwarted in recent years, the UK wòuld be on its way to a drama-free energy situation. ”
Yes , but what was the cost of extraction ?? The project was abandoned because it was uneconomical . Period . Shale is an exclusive US phenomenon . Of course the locals were protesting ,but when has an O&G company bowed to pressure from protesters ? Shell is extracting oil in the Niger delta from last 30 years inspite of agitations .
HIH
I do not know why you make the statement that extracting natgas from the Bowland was deemed uneconomical.
The first few stages that Cuadrilla was able to frac (out of the several planned) actually showed very promising results.
The explicit regulation limiting seismic readings during frac’ing to .5 on the Richter scale is what ended the operation.
This, despite readings of foot stomping football fans routinely registering at 2.0 or higher. (Some of the math whizzes here can calculate the percentage difference between .5 and 2 on the Richter scale. Big, big difference).
As regards shale being exclusively a US phenomenon … surely you are not lumping our Canadian neighbors in as part of the US, eh?
The Argentinian government may finally be surmounting topside obstacles to further unleash the vast potential of the Dead Cow.
The current 20,000 bopd output from the Bezhenov is rapidly increasing with Gazprom Neft alone projecting a tenfold increase (from their current 2,000 bopd) by 2025. The crippling technological sanctions are being overcome with typical Russian tenacity and creativity.
The Chinese shale gas output has been stymied as much by surface machinations as by the challenging geology and location. Do not be surprised if the current drama incentivizes increased output.
The Beetaloo Basin has ~half dozen exploratory shale wells with very positive results so early in the program.
The employment of American experts will greatly accelerate efforts there.
The analogy you present with Shell in the Niger delta is an interesting one.
I s’ppose that mercenaries roaming northern England, armed with automatic weapons to protect drill rigs is not a completely impossible-to-imagine scenario … but I suspect our British friends would not take too kindly to that situation.
Coffee, what a piece of BS . Let me dismantle most of them one at a time .
Bowland :Seismic was the excuse to get out . The fact was there was not enough to justify the CAPEX . Cost is not only extraction , it is also pipelines , pumps etc to get it to the customer . If the oil in KSA does not get to the tank of Six Pack Joe in Montana it ‘s value is the same as the sands of Sahara . This is a problem with gas . The only way on land is pipelines . Ever think why are they flaring gas in shale oil plays ?
Vaca Muerta : It was locked out and now we come to the interesting part . Argentina defaulted and it was locked out of the FX markets which meant no dollars for imports . Solution : The govt offered a guaranteed buy at $ 70 (Could be less , not sure of the price but was more than the prevailing WTI price ) but payment was to be in Argentinian Pesos . So yes it was expensive but the govt was running the printing press and the operator was having to pay the expenses in pesos , so no problem . Of course anything in excess was skimmed off by the politicians and the bureaucrats ,but that is standard practice . At least the govt did not have to go to Washington with a hat to beg for dollars .
Gazprom Neft + Vaca Muerta + all others ; I am going to use your terms ” unleashed potential ” and “future projections ” to explain .
My tennis coach says I must work on my ” unleashed potential ” so that I can defeat Roger Federer , he further ” projected ” that I could win 3-0 against Nadal at Roland Garros . All your other examples of Chinese shale and whatsoever are what in school was called “Bullshit in gravy ” . Suggestion , put your money where your mouth is and let me know how you made out . Adios .
P.S ; 2000 bopd to 20,000 bopd by 2025 . Hold my beer .
Methane has huge value – just as Putin. Look at the pricing.
The energy to compress gas is
W = nrt ln (v1/v2)
Lng is a thousand times denser so the last term is 30. 1 kg of gas is 3kwh, or 1,000 mols. R is .1 liter atmosphere per kelvin mol. Temperature is 300 kelvin so the constants multiply to 10 million atmosphere liters. Thats 1 trillion pascal liters or, since a liter is 1 thousandth if a cubic meter and a pascal is 1 n/m, that’s 1 billion Newton times square meter, giving a work per square meter of a billion Newtons. The 1 kg gas occupies a square meter so you need approximately a gigajoule or 300 kw hour to compress it to NGL. In other words the EROI of natural gas is around 1:100. Some of the energy to pressurize it is regained in use. If this process is 90% efficient the eroi improves to 1:10, if we only need to pressurize it 10x lighter than solid it’s 1:1.
Natural gas is a virtually useless energy source when derived from gas, but once already pressurized its a sunk cost and can be used like any fuel.
Ethanol guy
Not sure exaxctly what you may be trying to achieve/to convey with your postings on this site, but the untethered-from -reality nature of several of your comments reminds one of that ‘short on oil/mustang 19/Ingraham’ (?) character who posts/posted on both this site and the peakoil site.
LNG is methane reduced in temperature to ~ minus 162 degree Celsius/-260 Fahrenheit.
The only compression used in the process is pre rapid expansion which greatly reduces the gas’ temperature before entering the liquefaction phase … generally through the coil wound or brazed aluminum methods.
To describe the production of LNG in terms of extreme compression is beyond bizarre.
Coffeguyz,
The entire point of flaring is that it’s not actually rational to use natural gas. Natural gas has a density of .68 kg per m3. Ngl is 468. Getting natural gas to a usable form requires a thousand fold compression.
Even if we phrase it as cooling it’s the same problem. The specific heat of natural gas is 4 kJ per per kg k. Cooling it 200 degrees is 800 kJ per kg. But since it exchanges 1 kw per square meter per degree a cube of it will regain all its heat in five minutes. A 99% efficient insulator will keep it cold for about a day. The pipelines move fast, about 30mph so that’s enough time to get it to most places. Whether you phrase it as cooling or compression is almost irrelevant, it’s just a difficult material to work with.
Natural gas pipelines themselves don’t bother with keeping cool, they have compressor stations, and compression is a losing game.
http://naturalgas.org/naturalgas/transport/
Natural gas that is transported through interstate pipelines travels at high pressure in the pipeline, at pressures anywhere from 200 to 1500 pounds per square inch (psi). This reduces the volume of the natural gas being transported (by up to 600 times), as well as propelling natural gas through the pipeline.
Great info Ovi.
Dennis- does the chart of
“Tight oil outlook in the Permian, based on current drilling activity & well/rig productivity” out to 2029
from Enno Peters site (linked by Ovi) align with your projections for permian?
Pardon me if that has recently been addressed.
Thanks
Hickory,
No. The projection at shaleprofile.com assumes no change in well productivity, no change in rig efficiency, and no change in rig count. The first two assumptions match my own roughly, but I assume rig count will increase from current levels, if oil price increases to $95 per barrel by 2030.
Dennis,
The oil price is already 150 or so, considering half of shale is condensate frauding as oil.
Also why aren’t you including carbon credits? Those are the big driver of real energy prices.
Ethanolguy , I am following your posts with interest . I am confused so I am looking for some answers .
1. Oil price is already $ 150 ? I don’t get the connection with shale condensate masquerading as oil .
2 . The total US production is 11.700 kbpd .
a) Conventional from stripper wells 1,700 kpbd
b) Alaska 450 kbpd
c) GOM 1,550 kbpd
d) Shale 7.000 kbpd
e)Others 1.500kbpd ( bio fuels+ whatsoever )
Please assign API value according to your viewpoint for (a) to (d) .
Total production figures may not tally as are rounded for convenience .
Your posts on Natural gas transportation and also on Uranium are also eye openers and informative . Just like to add that for many years the uranium in the US power plants was being imported from Russia , a product of the dismantled nuclear warheads under the START treaty until Bush II refused to extend it .
The 150 comment is tongue in cheek but it’s not totally absurd. The eia table I keep posting
https://www.eia.gov/dnav/pet/pet_crd_api_adc_mbblpd_m.htm
Shows up to 70-90% of New Mex production may be condensate despite eia claiming around 5% in C C. The eia more or less directly contradicts itself or is using a conservative definition.
Condensate forms a mile or so deep, see https://www.offshoreengineering.com/oil-and-gas/petroleum-geology/1-hydrocarbon-formation
Tight fields are also light fields because depth, temperature and porosity correlate. Thus tight oil is almost synonymous with light products.
As for the second question
A) Strippers is going to be the older, good wells producing 30-40 api. Deeper, expensive, newer wells are lighter, there’s probably also an increase in heavy production but EIA does not even go back that far.
The problem with strippers is EROI. It takes a gallon of gas to move a ton of water. That’s 100:1 eroi. A normal well makes 1k bpd and similar water. A stripper does 15 barrels per day and the same water. Produced water kills EROI.
B) Alaska north slope is API 32. It is probably some decent oil, but production is obviously declining and it’s also not going to save things. California is unique in introducing thermal EOR to extract heavy oil. Most states are a lot of stripper wells, tar and condensate, the best oil is GOM.
C) GOM is pretty accurately recorded in EIA. It’s about half tar (heavy oil) and half oil. “Averages” to 30 but is really half light oil and tar each. Nothing fishy going on there. I gave the volumetric reserve estimate and it’s already been blown past. The initial ultra deep water boom was around 2010 and presumably by the time EIA starts recording API in 2015 they already depleted some of the early projects and have an increasing share of tar.
If you use only the GOM api 30-40 you get a very nice hubbert curve that peaked in 2018. The total collapse of the car industry and all these catastrophic events going on for years that everyone ignores stems from this and import quality declining.
D) Ethanol is the original, organic structure which created oil and now stabilizes tar and the corroded, biodegrarded heavy products. Shallower oil has worse biodegradation.
On an unrelated note the northern hemisphere has more salt domes because heat moves stuff north, to cold areas and salt helps protect oil in places it would otherwise degrade. Inert minerals like copper and gold stay put, but that’s another story. Europe has all the resources because heat moved heavy elements there and it helped to create the North Sea salt dome to prevent biodegradation. Correct me if I’m wrong but the North Sea has among the largest salt domes in the world.
Back to ethanol, it has 47 api, while gasoline is 55-60. Ethanol is slightly heavier than gasoline but can still be used more or less directly because as explained it is the basic, undegraded, organic progenitor of all oil. Thus the refining need is minimal.
Heavy oil is undesirable because large share of residue. A petroleum molecule has about 10 atoms and refining breaks one or so, raising specific gravity 10%. Thus 40 API oil becomes 55 api gasoline, and so on. Light oil is undesirable because refining things makes them lighter and thus you never get gasoline. Also as an aside the aromatics of oil are what matter because you get energy breaking the aromatic ring. Extremely light products are also undesirable due to their tendency to boil and temperamental behavior. You can use natural gasoline- drip gas or 55 api condensate- out of the ground but it will trash your car.
So if you combine ethanol with tar even in a relatively low percentage you get something sufficiently stable to be called gasoline. Because America hasn’t built a single refinery for decades and doesn’t maintain its existing infrastructure, if you cut all the corners, use ethanol and every desperate thing you can get usable gasoline out of tar. America consumes 9m bpd of gasoline. 4m from light oil and 1m from imports. That leaves 4m barrels, and because combining 47 api ethanol with 25 api Venezuelan tar gives something you can pretend is a 36 API normal refinery input. You can mix approximately 1 part ethanol and 4 parts tar and still get a reasonable input.
Of course the EROI of ethanol becomes low, half of all corn production goes into it, and even if ethanol is only waste parts like the stem, that waste is supposed to build topsoil and loss of it will impair future farming. Furthermore the cost of transporting and storing corn is high. Nevertheless in the short term it does allow more oil to be superficially useful.
I don’t like focusing on America but it has the best statistics so you can extrapolate to the rest of the world.
Thanks for your reply . When you say mixing tarsands oil to LTO and use this mixture for refining ,the resulting output will be what Jeffery Brown called ” Dumbell effect ” which was high in gasoline and bitumen but low in the intermediates . Please correct me if I am wrong . So much yet to learn . The US is acceptable as a sample since other nations don’t have this variety ,all they have is conventional crude and can be easily classified .
Hickory,
My best guess for Permian basin below, I assume the completion rate will increase from about 350 per month currently to a maximum of 525 new wells per month in 2025, the previous maximum was 521 wells per month in 2019 and the highest 12 month rate was about 460 in 2019, the average 12 month completion rate increased from 343 in Oct 2017 to 460 in March 2019 (in 18 months), or an increase of 6.5 wells each month on average.
My scenario assumes an increase from 350 wells per month to 525 wells per month over a 46 month period, and increase of 3.45 wells per month, so very gradual compared to 2018 (nearly half the rate of increase).
I am told this is impossible, but if current high oil and natural gas prices continue for a couple of years this seems a reasonable scenario to me. In fact it may prove to be conservative.
Dennis, the area under the red in your above chart, is about one-third, perhaps one-fourth, the area under the rest of the dotted line. And if you extended it out to 2040 it would be about one-tenth.
Nah…. that is just not possible that the Permian has only tapped one-tenth of its oil. That is just my opinion, however.
Ron,
https://i.postimg.cc/MHH2Qp60/DBB3-E30-B-9893-4-D85-921-E-7-F2-F105-D3-D04.jpg
New Mexico will peak in 6 months.
Texas already peaked. Permian will die soon.
Dennis model is only correct because nothing happened. If you break it down by states it has obviously peaked with New Mexico lagging.
Ron,
The URR for the scenario is 44 Gb, cumulative production for the scenario is 7.85 Gb in August 2021, about 18% of the URR. 50% of URR is reached in late 2028, but peak output is not reached until 2033 at 73% of URR, in late 2028 output is 6500 kb/d and output continues to gradually rise to a peak of 6800 kb/d in 2033, but perhaps there will be a plateau or a slight decline after 2028, I used a rather unusual flat topped completion rate capped at 525 new wells per month from 2025 to 2032. That scenario is not likely to be correct.
Dennis, your model is basically a flat line.
It would be interesting to predict specific fields (phantom, bakken) which are being absolutely obliterated by the hubbert curve.
The URR for the scenario is 44 Gb,
I understand that Dennis. But the part I do not understand is why do you believe that shit. 44 Gb is absurd, totally absurd. Yet you accept it without a moment’s hesitation.
Damn Dennis, wake up and smell the coffee. All your predictions are so way, way, off because you accept all those really stupid absurd URR numbers. Do you never have a moment’s doubt? You seem to believe those numbers like a fundamentalist believes the Bible. People who believe bullshit live in a dream world.
Ron,
The USGS TRR estimate for the Permian basin has a 90% confidence interval of 44 Gb to 114 Gb with the mean (best guess) estimate by the geophysicists at the USGS for Permian TRR at 75 Gb. The model I use has eliminated the lower productivity benches of the Permian basin and uses a TRR of 50 Gb. It is an extremely conservative estimate with a likelihood of about 80% that the TRR will be higher than I have assumed.
The URR depends on economics (future oil prices and costs to produce the oil), these are quite uncertain, but for the costs I have assumed (I assume they are similar to 2019 costs adjusted for inflation, that is real costs are constant for capital with OPEX costs rising as the field depletes) and the oil, natural gas, and NGL prices I have assumed the scenario is reasonable.
Note that you always have thought every scenario I have proposed is wildly optimistic and they have consistently have been a bit on the pessimistic side.
Perhaps the odds are on your side. 🙂
Ron,
Also as a reminder the USGS in 2013 estimated about an 11 Gb TRR for North Dakota Bakken/Three Forks, my scenarios for the Bakken suggest an ERR (economically recoverable resource) of about 8 Gb. At the end of 2019 proved reserves for North Dakota Bakken/Three Forks were about 5.5 Gb and cumulative production was about 3.3 Gb, suggesting an ERR of about 8.8 Gb. Undoubtedly you believe the proved reserve estimates for the Bakken are too high, but note that my scenario for the Bakken is almost 1 Gb less than proved reserves plus cumulative C plus C output from the Bakken/Three Forks.
Note also that for the Bakken/Three Forks the ERR is 7.9 Gb and mean TRR is 11 Gb, so ERR/TRR=72%. For Permian Basin mean TRR is 75 Gb and 72% of 75 Gb is 54 Gb, my Permian Basin medium oil price scenario has an ERR of 44 Gb. Bakken medium oil price scenario below.
Thanks for the followup Dennis.
As we have expected, higher prices for oil are going to be the driver of renewed incentive to sustain production. The common estimates of oil price will likely be conservative, as I see it.
Even as some great new electric vehicles are coming to market, it will take a long time to shift the landscape.
Hicks ” it will take a long time to shift the landscape.”
With due respect ,do we have the time ? You think so seriously ? My contention
1. Bob Hirsch in his report said 20 years to transition and he included replacements which included nuclear energy on which nothing has been done ( let us not argue why ) .
2. NG was supposed to be the bridge for this transition . Current events show that this bridge is not in for completion .
Sorry , higher prices will not bring on to market sources that do not exist . Personal experience I posted on the other thread . During the peak of the Covid 2 wave in India there was an acute shortage of oxygen . A $ 30 refill was going at $ 300 , but that did not mean that more oxygen was available , it only meant it went to the higher bidder . Current example , thermal coal . China is outbidding India so badly that in India power plants have a supply of only 4 days . Price is up 260% from $ 57 to $206 in one year . Where is the coal ?
Hickory,
Talking about prices is silly when everything is already drilled, and it’s impossible to change production. You can’t stop oil coming out of the ground once it’s drilled so the fact that debate even exists is proof that those people don’t actually matter.
If you look at permian all the important eases like Texas ten Y were drilled before 2015. Any drilling now is just screwing around, there are no new productive leases.
In Saudi there are no significant new oil projects for years and Aramco is firing people. Nowhere in the world seems to have any real chance of drilling a significant number of new wells. The oil industry is dead, it just takes another 3 years for people to die physically.
Of course price matters.
Unless you are just self-funded like yourself and are producing oil just for the pleasure of it.
Capitalism was never profitable https://desuarchive.org/his/thread/11943043/#11943043
Ovi, you do good work, thanks.
With regards to shaleprofile.com supply predictions I have addressed that, posted here by someone else; a miniscule change in well productivity (already occurring in ALL shale basins), a change in rig “efficiency” from 1.2 wells per rig per month to 1.0 wells, shows shale production declining to 2029, even in the Permian, and particularly in the Texas part of the Permian. Once DUC’s have run their course, soon, the tide will be out on shale oil.
The conjecture that rig rates will continue to rise, because they have the past few months, or because of higher prices, also occurring the past few months, is just an uneducated, inexperienced guess. It helps to understand all the ramifications of oil and gas development in the world if you started before 2008 and shale oil.
Respectfully, people believe too much of what they read on the internet. Two wrongs don’t make a right; folks need to think for themselves, as you have regarding DUC’s. The future of unconventional shale oil and shale gas in the US is far too important to let the need to be right, and others wrong, be important. We’re all in this together, even, particularly, our neighbors in Canada.
Mike
Thanks.
Could you explain why the rig “efficiency” has gone from 1.2 wells per rig per month to 1.0 wells. Is this because they are drilling longer laterals or is a real reduction in productivity?
Ovi, some of Enno’s tools have the ability to input ‘what-ifs,’ when we make minor changes in some of the metrics, future supply projections change; all that gentle slopping “growth” reverses to decline. They change rather significantly even for rig efficiency, or the number of wells one rig can drill in a month. The difference in 1.2 wells per month to 1 well per month is just a few days. Using Enno’s tool I input that change from 1.2 to 1.0. I don’t know that has happened yet, it certainly might.
Longer laterals might have something to do with it, employment problems will, supply chain disruptions regarding pipe, cement, sand, etc. Longer rig moves as core areas are drilled up. The shale sector is stressed at the moment for services. There is a lot of waiting going on. There are a host of extenuating circumstances that always make past results not indicative of future performance. The produced water problem in the Permian, for instance, WILL eventually lead to a slow down in how quickly remaining drillable locations can be developed. Rig efficiency is a poor metric; until 7 years ago, and shale, I’d never even heard of it.
To assume consistent well performance (productivity) this late in any Basin’s development is a stretch.
The point I wish to make is that predicting the “rate” of development of an oilfield is fraught with real life delays. And disappointments. Nothing EVER works out like you hope in the oilfield. Making guesses about oil prices has never worked. Ask anybody if they saw $38 oil coming in 2015, or -$38 oil in 2020, or $75 oil today. They didn’t. Nobody can.
There will be tens of billions of dollars borrowed for more gas pipe stuffed in the ground, more LNG ports built, all because of $6 natty, now, and about the time that all gets done the shale gas sector will have driven the price of gas back down to <$2.25.
Predicting my industry's behavior over the past century has historically proven to be like herding cats.
Mike
Thanks for the detailed explanation. The operational issues you mentioned in the second paragraph never crossed my mind.
The well productivity what if that Mr Shellman used was about 5.5% decrease each year in average well productivity.
In the past when duc count has fallen to where the E & P companies desire the count to be, they have increased the rate thet new wells have been spud.
As to what will happen to these rates in the future we can only guess.
LTO survivor has suggested perhaps 5% annual rates of growth, Mike might disagree with that guess.
Both of these men and shallow sand, Rasputin, George Kaplan, SouthaGeo, or anyone else with actual oil field experience would probably make better guesses than me.
I expect the rig count will continue to increase and rig efficiency will be roughly unchanged, generally with pad drilling and other recent changes the rig efficiency has tended to increase, labor shortages might lead to more intensive use of technology which tends to increase rather than decrease rig efficiency.
We will see.
Also DUC count (for big 4 tight oil basins, Permian, Bakken, Eagle Ford, and Niobrara) went down from 2015 (peak of 5117) to 2016 (to 3699) then reversed peaking in June 2019 (at 6005) then it decreased during the pandemic (to 4180 in May 2021)and is likely to reverse again in my opinion. Estimates from shaleprofile
https://shaleprofile.com/blog/us/us-update-through-may-2021/
Ovi,
If we combine Baker Hughes Permian basin horizontal oil rig count data with DUC data from EIA’s DPR for wells drilled in Permian basin (with the assumption that most of the permian basin wells drilled are horizontal tight oil wells from 2017 to 2021) we find an average rig efficiency of about 1.27 wells drilled per rig over that period (Jan 2017 to August 2021). Enno Peters uses an estimate of 1.2 wells completed per rig. If we assume eventually a steady state is reached where the DUC count is relatively stable and wells drilled is roughly equal to wells completed, then the efficiency in wells drilled vs wells completed will be the same.
Perhaps rig efficiency will decrease from 1.27 to 1.0 as Mr Shellman assumes, but my guess is that we are unlikely to see such a large decrease, especially considering that over time we have seen rig efficiency increase from the Jan 2014 to Dec 2016 period (based on shaleprofile spud data the rig efficiency was about 1.09 wells drilled per rig). If we combine the two data sets over the Jan 2014 to Aug 2021 period we get an average rig efficiency of 1.21 wells drilled per rig (this might be the basis for Enno Peters’ estimate).
In any case future rig efficiency is unknown (like all things about the future).
If we focus on times when rig count was high (330 to 440) from mid 2017 to mid 2019, the rig efficiency was about 1.3 wells drilled per rig.
The axes on th chart above are mislabelled, horizontal axis is rigs and vertical axis is wells drilled. Correct chart below.
Not an expert but it looks like the US will have plentiful Natural Gas Liquids for decades.
Therefore the feedstock for many products (ex plastics etc) and propane for heating will be readily available.
Where NGLs’ are relatively weak is for liquid transportation fuel- its going to be refined crude oil and electricity.
Good summary-
https://www.kindermorgan.com/getAttachment/babe6db9-ba7a-4f51-a100-5fd46b944540/White_Natural_Gas_Liquids.pdf
https://www.energy.gov/sites/prod/files/2017/12/f46/NGL%20Primer.pdf
What are the stocks of depleted uranium in USA? In France, we have 300.000 t of depleted U 238 which could be used along Pu 239, coming first from the PWR in service in France, into a Molten Salt Reactor. A scientist, Joël Guidez, of the CEA (Commissariat à l’Energie Atomique) explained (conference of 03/02/2021, University of Marseille with the Sfen) that with a scientist of the CNRS (Centre National de la Recherche Scientifique), they simulated (icapp 2019, Molten Salt Reactor to close the fuel cycle. Example of MSFR multi recycling applications, Joël Guidez et col.) the functioning of a 1 GWe MSFR (Molten Salt Fast Reactor) using a mixture of NaCl/UCl3/PuCl3 and they stated that to function regularly, they needed to add 1 t of U 238 per year. Perhaps, you should consider developing MSFR instead of using your reserves of NGL.
Du is not tracked. Total American uranium inventories are 50kt plus nuclear weapons. That’s about two years of consumption. Also mine production is falling pretty fast, Canada closed some mines.
A nuclear reactor needs to remove 300 Celsius heat from two thousand square meters per second. At a concrete specific heat of 1 kJ per kg per degree for a 1gw you need 1,000 tons to hold that heat for a second. The heat transfer coefficient of concrete is around 10 joules per square meter second kelvin. That means our concrete puts out around 6 mj, so we need about 500,000 tons of concrete. For perspective a nuclear plant costs a billion dollars and concrete is $100 per ton, so the concrete is 5% of the price.
Concrete needs approximately two tons of water per ton. At 1000 degrees it loses approximately 1 mj per second. Heating it for three hours is 12gj, with water 36 gj per ton. The reactor concrete comes to 36 terajoules per thousand tons. Steam has a hundred times more area so 3.6 petajoules or 1,800 petajoules for the entire thing.
The reactor produces 600 petajoules over its life, so eroi is 1:3. Nuclear doesn’t work.
The earth has e18 tons of dirt to a depth of a mile. E12 is uranium and e10 is useful isotope. 10% each is at correct temperature, depth and geography. That’s an e7 uranium reserve which is nothing.
Hickory , the reports by you are past expiry date (2016 ) . Here is the latest . I had posted the links earlier but at that time NG was not an issue . Just for your info , American Chamber of Commerce has asked for a ban on export of NG on the grounds that exports are causing a domestic shortfall and leading to higher costs to industry .
http://resourceinsights.blogspot.com/2021/09/its-all-connected-natural-gas-market.html
https://energybulletin.org/the-energy-bulletin-weekly-13-september-2021/
Apparently you didn’t see that the info I linked was not about the current economic status of the natural gas market.
Rather those postings were about the nature of Natural Gas Liquids.
Sorry Hicks , my error . Should have differentiated between NGL and NG .
In 2000, America imported 3m bpd of api 30-40 oil, compared to 1m now. It produced a little from Gulf of Mexico. The 2m gap was made up by Gulf of Mexico growth and ethanol. Ethanol is the waste parts of corn, which fertilize the soil, so this isn’t apparent yet because fertilizer is overapplied.
The light oil imports of America are starting to turn over, presumably like in the rest of the world, and at current rates America won’t import any light oil by 2024. The entire growth is heavy oil, condensate and other marginal fuels. Wolfcamp is a mile deep for example, which is where condensate forms. Because mixing averages api it’s safe to say api 30-40 is the useful oil and the rest is condensate or tar.
Society is collapsing extremely fast, everything is in deficit.
Ethanolguy , I think your calculation/ information is incorrect , but I will let others who have a better grasp of this chip in . Agree with your last sentence .
Here is the relevant data, you can see light oil imports are falling fast.
https://i.postimg.cc/15hz6MZM/CB74-DC03-7-F9-F-453-F-9-C0-D-384-C0-E80-AD39.jpg
https://www.eia.gov/dnav/pet/PET_MOVE_IPCT_K_A.htm
“Ethanol is the waste parts of corn,”
You don’t know what you are talking about (on all sorts of topics).
It is made from the starch in the endosperm of the kernel, which comprises about 80% of the kernel.
In this world easily digested carbohydrate is not waste by any measure.
Hickory it’s pretty obvious you’re a troll but I’ll cite it.
https://www.usnews.com/news/articles/2014/08/13/corn-waste-enters-the-renewable-fuel-fight
Cellulosic ethanol is a fuel made not from corn kernels, but instead the husk, stalk, cob and other waste parts of corn.
//
Now go to whine to the mods that you were caught being a troll.
Okay, guys, you are both right and both wrong. Just do a little googling and you will get the straight story. Corn ethanol is indeed made from the kernel of corn. From Ethanolguy’s link:.Cellulosic ethanol is a fuel made not from corn kernels, but instead the husk, stalk, cob and other waste parts of corn. However, How Corn is Processed to Make Ethanol Corn ethanol is made from the kernel of corn. I drink a little of it almost every day.
I think you will find that, by far, most ethanol is made from the kernel. However Cellulosic ethanol looks promising. But I have a question. If it turns out that you can get a lot of ethanol from the stalk, leaves, and husks, why cannot you get it from weeds or any other kind of cellulose? Just how economical is cellulosic ethanol?
Ron
Cellulosic ethanol production depends on special enzymes that can convert the cellulose into, I think a type of sucrose. The great hope in Canada was that wood waste could be used aa a source of cellulose. They never found the enzyme that had an economic yield.
Rather, I am interested in reality. Reality is fact based.
” Ethanol, made mostly from corn starch from kernels, is by far the most significant biofuel in the United States, accounting for 94 percent of all biofuel production” USDA (date of data not included)
“Cellulosic ethanol feedstocks are abundant and include corn stalks, plant residue, waste wood chips, and switchgrass. Making ethanol from these sources is more difficult because cellulose does not break down into sugars”… [without energy intensive and expensive processing]
On a related note- the US produces enough ethanol to provide roughly the equivalent fuel used by all on-farm liquid fuel consumption
So Putin now has not only Europe but also China by the balls . All hail “Don Putin ” . I am repeating myself ” Don’t mess with Putin ” .
https://tass.com/economy/1344259
What caused the massive oil spill off Huntington Beach? Here is what we know
Elly is fed by some 70 oil wells. The processing platform separates oil from water. “It’s just crude oil that’s sent to the shore,” Willsher said.
Amplify Energy has divers inspecting the potential source of the leak and investigating its cause. Willsher said his company notified the Coast Guard on Saturday morning about the spill after its company inspectors noticed an oily sheen in the water, and the flow into the pipeline suspected of leaking was shut down Saturday night.
Does anybody know the daily production rate of Elly.
https://www.latimes.com/california/story/2021-10-03/what-caused-the-massive-oil-spill-off-huntington-beach-here-is-what-we-know
Ovi.
I looked at Amplify’s website. It says 53 offshore wells in Beta field producing 3,600 BOPD as of Q2, 2021.
It appears almost a whole day’s production.
I am very interested in what kind of spill protection measures were in place and what one’s failed. Seems like this should have been noticed much quicker than it was.
We have sensaphones on all of our tank batteries that process significant amounts of water. (We are more concerned about produced water spills, as we process a lot more water than oil) Our pumpers have them dialed into their cellphones. The pumpers can call in and run through diagnostic checks and can hear the pumps. If there is an issue, the sensaphone calls the pumper and alerts him/her of it. If the pumper doesn’t answer, it calls the next pumper programmed in, and so on. If nobody answers, there is a field kill system that shuts all of the wells down and soon thereafter shuts the plant down. We have earthen dikes around all of our plants. They are supposed to hold 2 1/2 times the volume of all tanks within the dike. The dike walls are measured annually by well inspectors. We also have spill prevention plans that for each battery that were developed by an engineering firm. The spill plans are an EPA requirement.
We are required to do the above for our small onshore operations. Would think there would be significantly more required for offshore CA.
Leak detection on off shore pipelines is difficult to provide and more so as the actual flow becomes much less than the design flow. I doubt if any automatic system was incuded when.the pipeline was built. At best there would be regular pigging inspection for pipeline thickness. B`y BOEM site it looks like Beta operations only took this over in 2017, I’d imagine it’s a bit of a marginal operation especially after the last couple of years of low prices. It is fairy heavy oil and water cut is 80% so operating costs offshore are liely quite high.
I think this will be more common as infrastructure offshore ages, in some cases beyond its original desgn life, and operations have to be strealined more and more if they are to remain viable.
George.
I know almost nothing about offshore operations.
What types of pipeline leak detection devices are employed offshore?
Mostly just mass balance checks – measure what goes in and check against what comes out. They need a real time communications link between the two ends of the pipeline. For multiphase pipelines complex models have been tried but I don’t know if they have ever detected a leak, but have certainly generated plenty of false alarms. On shore there have been developments for acoustic detection for gas lines but I don’t know of anything like that off shore, but presumably a gas leak would make a noise which would travel well underwater. I doubt a liquid leak would be detectable like that though.
Amplify’s is struggling with bankruptcy.
Shallow Sand
67.9 barrels per day on average per well. Is this flow from natural pressure or through some enhanced recovery technique?
Oil prices on both WTI and Brent broke through the top of the spinning top candlestick that formed on September 28. Spinning top are indecision usually a reversal but not always.
Have to look higher in price now.
OPEC+ Choice to Drip-Feed Oil Supply Sends Price to 7-Year High
OPEC+ agreed to maintain its schedule of gradual monthly production increases, triggering a surge in crude prices.
Ministers ratified the 400,000 barrel-a-day supply hike scheduled for November after a short video conference on Monday. Going into the talks, there had been speculation that they could opt for a larger supply increase, but no such proposal was made, delegates said, asking not to be named because the meeting was private
George Kaplan
An update on GOM.
Meanwhile, Royal Dutch Shell Plc resumed production at one of its main U.S. Gulf of Mexico offshore facilities, more than a month after Hurricane Ida brought production in the area almost to a halt. Service was restored at Shell’s 100,000 barrel-a-day Olympus oil and gas platform.
https://www.rigzone.com/news/wire/oil_surged_to_2014_levels_monday-04-oct-2021-166616-article/
The Dutch TTF gas benchmark trades up 12% on the day at €106.3/MWh or $36/MMBtu or $205 per barrel.
[source] [Dutch TTF gas]
Aramco Says Gas Crisis Raises Oil Use by 500,000 Barrels a Day
The world’s biggest oil company said the global natural-gas crisis has boosted demand for crude by 500,000 barrels a day.
It looks like there may be unusually cold weather coming to the western USA and more supply disruptions in the GoM so US natural gas prices may just keep on climbing.
Pollux
Virtually all the world’s ships that run on dual fuel (LNG or ULSFO) are switching to the now much cheaper fuel oil.
This bodes very poorly for lower electricity generation prices as the back up fuel oil stocks are stocks are also being rapidly depleted. Areas that rely upon ULSFO for back up generation fuel (looking at you, New England) are entering precarious times should this be a very long/cold winter.
You may have the wrong conversion. The most recent one I have found says 0.59 bbl per MWh which is about US$67/bbl. Still a good price of course
Yes, 0.59 barrels of oil per MWh, so one barrel is 1.69 MWh. So you multiply MWh price by 1.69 to get barrel of oil. Then you multiply this by eur/usd rate.
Name , sorry to bother . Can you do the calculation figuratively ? Who is correct David or Pollux ?
Gas Prices In Europe Are Now The Equivalent Of $230 Oil
The benchmark European gas prices continue their rally this week, surging to new record highs on Tuesday to an equivalent of $230 a barrel oil, amid a wider energy commodity rally driven by supply concerns ahead of the winter.
Will be interesting to see the development when NS2 and Melkoya is operational, read that they have started to fill a part of NS2 for testing a couple of days ago, but depends on what the Russians want to export of course.
(Sweden has been exporting, as normal, during the last week at between 1,5-6 GW including whatever the 600 MW Karlshamn oil plant has produced, had negative electricity prices for some hours during the weekend)
https://www.nordpoolgroup.com/Market-data1/Power-system-data/Exchange1/ALL/Hourly1/?view=table
Pollux is correct. MWh is energy equal to 0.59 barrels of oil. Current Netherlands natural gas exchange price is 118 euros per MWh. 118 euros divided by 0.59 = 200 euros, which is now 232 dollars. So 118 euros per MWh = 232 dollars per boe (at current eur/usd rate).
ZeroHedge: “Gas Prices In Europe Are Now The Equivalent Of $230 Oil”
https://www.zerohedge.com/energy/gas-prices-europe-are-now-equivalent-230-oil
Up another 38% so far today (above 160 euros per MWh):
https://www.theice.com/products/27996665/Dutch-TTF-Gas-Futures/data?marketId=5285051
An article on oilprice.com that supports my suspicion I’ve written here often this year:
https://oilprice.com/Energy/Natural-Gas/The-Real-Reason-OPEC-Refused-To-Boost-Production-Further.html
The Opec has no more spare capacity, it has to be rebuild from the scratch.
My opinion was the paper shuffler from financial controlling cut all budget not necessary to support the current, voluntary cut, production. So no spare capacity after a year of cuts and a year of decline – and a lot to do to drill these infills and tap these side pockets (and do all the other stuff our oil men know about and I not). Work that should have been done last year in a normal time.
In the mean time power plants in Europe ordered less coal – because price was sky high. Now it is even higer. In some regions burning oil is now cheaper than burning nat gas.
If this continues this winter, times will get very interresting. As in the old chinese curse – may you live in interresting times.
Eulenspiegel, I agree. The whole natural gas, coal, and oil shortage are about to blow up in everyone’s faces. Yes the world MSM seems to be almost totally ignorant of what is happening. The winter of 2021-22 will be the winter of our discontent. The world will emerge a totally different world in the spring of 2022. It will be a colder, hungerer, and far more violent place. Covid will still be around but it will be far from the most serious of the problems we will face.
Ron, Eulen and many others , we are on the same page . We are now at “peak energy” but the MSM and many others don’t recognize it . All sources are peaking at the same time (Oil,gas,coal ) . We are going into a permanent decline in prosperity . Big problems up ahead .All take care and be well .
P.S : Actually we are at “Peak Everything ” as Steve had mentioned .
Not peak energy – there’s more gas here than oil, and even more coal.
It’s “just” the corona-chaos. Wrong planning, and China is on a feud with Australia boycotting everything from there – including coal. So supply chains are in a chaos. It takes time to redirect australian coal to India, and indian coal to China because of some politicans.
And here in Europe they close perfect working power plants and are expecting everything works fine. It does, until there is a day with low wind…. It’s all home made stew here – virtue signalling over everything. In Hamburg they dynamited a new coal power plant because of CO2 – so the old plant 10 miles away, with a much lower efficiency has to work on. And they close nuclear hoping it will be replaced with wind and solar (no storage in sight, not even on a plan).
This combined with chaotic supply chains gives more chaos.
EULENSPIEGEL,
You do realize that coal and natural gas are not extracted and transported by ENERGY TOOTH FAIRIES or made in STAR TREK REPLICATORS? Correct?
There is no coincidence that coal and natural gas production has surged the past 50 years along with the increase in oil production. Most coal is extracted and transported by diesel-powered machines and trucks-trains-barges-ships. These run on diesel for the most part.
This idea that we can just SIDESTEP OIL and produce all this wonderful natural gas and coal, suggests that many in the world believe in the ENERGY TOOTH FAIRY.
steve
Sorry, there is enough Diesel left for mining. Coal production does not fall now because someone not gets his truck filled up.
Before this happens, I think some texan man will have to buy a smaller car and some salesman here takes the train. Long before some industrial machines and ships can’t be refueled. Shipping is 5%? of global oil usage.
It would be easy to increase coal production over some years – but there has been no demand. In the USA nat gas was cheaper, so coal mines (with lots of reserves left) closed.
In 30 – 50 years this is another story – but until then we should have moved to renewables and new gen fission / fusion energy. And geo energy.
But all this changes are slow, because this is huge machinery. What we tried during corona is to drive the big oil tanker of energy production like a small speed boat. That doesn’t work.
PS: You can drive trucks and cars with propane gas from gas production – with a cheap addon. A collegue did this, for saving money. No oil needed.
Eulen , in disagreement with you .
1. The problem with coal is not availability but quality . India has the second largest reserves ( could be largest ) but is an importer of thermal coal and coking coal . Of course the major use of coal is electricity production but mines are always a distance from the power plants (they are always built next to a water source for cooling towers) . The coal must be transported . How ? By trucks (diesel) or locomotive (diesel or electric ) . So we need electricity and diesel to produce coal which we need to produce electricity . The snake eating its tail .
2. Natural Gas : Yes , more gas but again it is all stranded . Unfortunately over land pipelines is the only cheapest , safest method to transport gas . I don’t think that the guys in the shale oil plays flare the gas for the fun of it and prefer paying a fine . As I have said to Coffee ” If the crude in KSA does not get to the tank of Six Pack Joe in Montana the value is that of the sands of Sahara ”
The rest of your post is just conjecture ” this can be done and that can be done ” , I assure you nothing will be done .
Oil : The peak was in 2018 . That is history now .
P.S ; Of course trucks and cars can run on propane , CNG , LNG(have been so from as long as I can remember ) but then you need the infra to see that these resources are available on demand . Care to explain why the changeover did not materialize in spite of Carl Icahn who bet big on CNG, LNG in future transportation ? In Netherlands CNG cars are quite a few ( not innumerable ) but then NL is not the world . Transporting low energy density CNG by trucks to the frontcourt using high energy density diesel is like using cavier to make a fish stew .
Coal is viable in mechanical terms but is not worth the effort. A large share of the healthy labor force goes to coal mining.
US industry employs 10 million men. Coal indirectly employs 1 million people. That’s 10% of industrial labor producing a similar share of energy. If productivity goes down a little bit then workers aren’t producing enough to support themselves.
Ethanolguy , I agree with you . If we look at electricity and consider the EROEI after all the transmission losses plus pollution costs it would not make sense ,However we cannot discount the fact that electricity is a versatile resource and that society is willing to pay the price for want of a better term the “negative EROEI” . The three legs of the stool we call industrial civilisation are oil, electricity and metals . Even if one goes it will be Adios Amigos . You are correct mathematically but reality is different .
EULENSPIEGEL,
With all due respect, you proved my point. You believe in the ENERGY TOOTH FAIRY.
steve
@SRSrocco
So Oil has negative EROI, Coal has even more negative EROI, and gas, too. Nuklear is completely out of question.
So you proved it, industrial civilisation runs on fairy dust, since all other sources don’t deliver energy.
Spiegel, oil is the only thing with a good eroi, it comes out of the ground on its own. Everything else is a house of cards balanced on oil.
Eulen/HIH
While electric vehicles seem to garner all the attention, at ~6 million vehicles worldwide, they are only one fourth the number of CNG/LNG vehicles on the road.
The technological advances are ongoing at blinding speed. One large shipper claimed he would remove all 4,000 diesel fueled Class 8 trucks off the road in California immeiately if the new Cummins Westport 15 liter natgas engine were available in the US.
A research team based out of Texas A&M developed an adsorption agent that enables large methane storage at sub 500 psi … the so-called Holy Grail threshold by which standard vehicles can travel ~ 500 miles on one tankful.
Not only will sub 500 psi natty enable at-home fill ups (over 50 million US residences have supplied natgas), virtually every ICE engine can be economically/quickly reconfigured to run on natty (as Eulen described and numerous petrol-starved Venezuelans have been doing for years).
New Day arisin’.
“Spiegel, oil is the only thing with a good eroi, it comes out of the ground on its own. Everything else is a house of cards balanced on oil.”
No. Oil is transportation, but not energy. As you need copper or steel or rubber.
You know oil has the WORST eroi of the fossil enery today?
The days of spindletop where you make a shallow hole and get an oil fountain are 150 years in the past. They are past as the days of sacramento where you found a fist size gold nugget just in the river.
New big oil projects are double digit billion $ projects – the one or other million ton concrete and steel is sunk there. Just for fun?
Or look at fracking – hard to believe this is energy positive at all when you don’t have the best acres.
For deep sea oil you need giant platforms with own harbors as support base, undersea piplines, helicopters and support ships – hardy “just comes out of the ground on its own”.
For example, even the gas fracking delivers triple or more energy value from one hole than fracking oil.
Here in Germany we have brown coal in open pit mines. It’s a dirty energy, but very efficient. It kept the DDR working – and the socialism there was chronical inefficient. The DDR got it’s oil delivery from the sovjet union cut dramatically in the 70s. They converted most things to brown coal. With no enviromental filters, as it is done today. Everything was very smelly.
Most of the resources will be kept in the soil – it’s better.
Eulen, it is impossible to stop oil coming out of the ground. The fact that debate even exists proves nothing like that is actually done. Opec does it to annoy people, you cannot stop oil flowing because it is not airtight.
But as for the preparation of the well, as I already said 90% of the oil industry is condensate and other fraud. The actual oil is a handful of shallow water or onshore wells and those are nearing death. Only 15% of American imports are even a reasonable api (30-40). The vast majority of oil is fake at this point.
By 1970 primary recovery had peaked and by 2000 virtually all the onshore wells were dead. There is not a big difference between a near shore and a onshore well, it’s just slightly more expensive, and offshore developed later because bureaucracy delayed it. Without bureaucracy everyone would already be dead. Norway and GOM would have depleted before 2000, as would shaybah and Sakhalin. It’s just that the added complexity of doing this offshore caused more paperwork and that kept everyone alive.
The import quality is falling extremely fast, car production is collapsing- https://i.ibb.co/NTXJVQ3/3-D9-B0452-A62-D-4-CD8-947-E-D2-BDC5674999.png an example including Germany- and everyone will die soon. Or at least the majority of the population, the rest will subsist on soylent green and slowly die as the remaining topsoil goes away.
There is no solution, the time to do something was years ago. Now that peak oil is actually happening nobody is paying attention to it.
Coffeeguyzz,
Over the past 5 years NGV fleet grew by about 36%, for comparison plugin vehicle fleet grew by a factor of 5.6 over 4 years (2016 to 2020).
https://www.statista.com/statistics/270603/worldwide-number-of-hybrid-and-electric-vehicles-since-2009/
OMG!
Coal does not employ a large percentage of the US workforce!
“By the end of 2016, the coal industry employed approximately 50,000 miners. US employment in coal mining peaked in 1923, when there were 863,000 coal miners.”
https://en.wikipedia.org/wiki/Coal_mining_in_the_United_States
The US workforce is about 165M, so 50,000 divided by 165M is about .03% of the workforce.
https://en.wikipedia.org/wiki/Labor_force_in_the_United_States
You might be able to get up to .1% if you included an allocation of rail employees for coal trains, and then added coal generating plant employment.
Dennis
Not gonna delve into the subsidy quagmire as that is a contentious, non productive topic, IMHO.
However, seeing as today’s national (USA) average retail price for CNG is $2.26/gallon of gasoline equivalent (60 cents per liter of petrol for the non Yanks), the economic impetus to use CNG is very strong. (Dozens of stations around Oklahoma City sell at/below $1.50 per, with a couple selling under a buck. Your empty F 150 can top up completely for $48.)
Shoot, Dennis, New England has many stations offering CNG today at $2.60 or lower.
When commercial entities such as taxis, delivery outfits, high mileage sales/service techs see these enormous savings, the trend toward CNG adoption will accelerate. The Asian market will continue to lead the way.
Coffeeguy,
Two thoughts:
Electricity is about $1 per gallon equivalent. And,
The average US gasoline price appears to be about $2.70 without taxes. (We’re seeing retail prices of about $3.20 and taxes are about $.50. Also the RBOB futures price is about $2.10), CNG doesn’t appear all that cheap.
This idea that we can just SIDESTEP OIL and produce all this wonderful natural gas and coal, suggests that many in the world believe in the ENERGY TOOTH FAIRY.
The speed that EVs and hybrids are taking over the European car market is really remarkable.
https://insideevs.com/news/536942/europe-plugin-car-sales-august2021/
Sales are up nearly two thirds year on year In Europe. Plugins are now 17% of the market. This doesn’t include hybrids that don’t plug in which is nearly as big a market.
The Germans bought more pure EVs than diesel cars in August. Hybrids and EVs together were almost 30% of units sold.
Meanwhile, in China EV sales have hit 14.4% of the car market.
https://asia.nikkei.com/Spotlight/Electric-cars-in-China/Surging-EV-sales-put-China-ahead-of-government-targets2
So a lot of side stepping does seem to be happening. This won’t hurt oil demand much for a couple of years, but if these trends continue it should start being noticeable.
Coffeeguyzz,
Soon EVs will no longer need subsidies as fossil fuel powered (whether CNG, diesel, or petrol) will no longer be able to compete in the passenger vehicle space, and no doubt this will also be true in the large truck space within 5 to 10 years, in the mean time perhaps large trucks might switch to CNG if it is cheaper to do so than BEV. Also note that rising natural gas and coal prices Worldwide will tend to accelerate the switch to EVs, wind, solar, geothermal, hydro, and nuclear power. Though natural gas and oil will be needed while the transition occurs over the 2021 to 2035 period.
On peak energy, here is the data from BP, peak in 2019, clearly 2020 fell because of the pandemic, 2019 may be surpassed in 2022, 2023 at the latest in my view. I show both fossil fuel energy (oil, gas, and coal) and total primary energy in Exajoules (EJ). As fossil fuel peaks (around 2030-2035) it will become expensive and growth of wind, solar, nuclear, hydro, and geothermal is likely to accelerate as they will become more competitive with high cost fossil fuel sources of energy.
This all rings true.
And there are area some inevitable implications-
1. Shortfalls in supply, such as we are just starting to see in the past month.
2. Shortfalls of energy supply will be episodic, and highly variable depending on what country or region you are in.
3. Energy prices at the retail level will get much higher on average over time.
4. Increasingly, there will be energy haves and have-nots, at both the national level and at the level of families. Whole histories will be written on this aspect.
There are lots of more specific implications to acknowledge, of course.
Ron,
Civilization is collapsing in a pathetic way. Utilities die first because they’re in elastic. As a result we will see seasonal blackouts and everyone will assume things will go back to normal. This will happen for 3 years until it starts affecting food and it’s obvious that oil is a problem.
Even when gas stations and stores run out of products it will be attributed to some spurious reason like driver shortage. People will never realize the reason they are dying, they will just attribute it to vague factors out of their control and accept their fate. All the previous civilizational collapses were attributed to god, the Jews or whatever and this one will be no different.
Ethanolguy , I couldn’t have put it better .
Don’t agree at all!
Keeping the grid at a reasonable capacity is priority nr.1. Oil can be stored, natural gas can be stored and coal can be stored. The main benefit with the “expensive” (as of now) energy transition is that the baseload of the energy grid can be generated by wind, solar, hydro. More questionable by nuclear and geothermal power. Supported by pumped hydro, gas storage, coal storage and hydrogen storage. Long distance high voltage electricity cables can be used to stabilise the electricity grid. There are some intermittency issues, but nothing that can not be tolerated. Electric cars can in a very efficient manner be another leg to stand on, when it comes to personal transportation. Some countries 80-90%, other places 20%-50% or less. The efficiency means that each EV’s use 1/3-1/2 of the energy compared to the combustion engine, because it used in most cases it is directed towards motion energy. And even with a heat pump/AC installed it still is twice as effective as a combustion engine (that has a lot of heat loss). In addition: Heat pumps, together with insulated buildings is a way to use electricity efficiently and also sacrificing fossil fuel use in the process. At least in the northern hemisphere. In the southern hemisphere electricity to AC use is more critical. What part of this energy transition is so hard to understand? It is expensive, but I think we all have to get used to it.
Hydro is also bad. The Columbia river has 30m 10kg fish. If they eat 2% their body weight a day that’s 100kg of biomass generation or at 10mwh per ton that’s 30 twh. Then doing that artificially is ten times more.
Hydro is 90twh. Hydro kills fish therefore dams are being closed.
Those other things were already addressed. Renewables are fail.
Yes, hydro is not all equal. Some places are ideal. Places where you can have a high waterfall towards the turbines with enough rainfall. In Norway, the rock is hard enough to drill through it and the tunnels can withstand the water mass. Other places it is not the case. The latest rebuilds in one of the most important hydro facilities in Southern Norway (not far from the place of origin connection to the Norway-UK cable) has a lifetime of 60 years. Which is very good considering the costs. I agree that hydro some places with steep falls and hard rock are better. Norway.. maybe New Zealand, Japan, Chile and a lot of more places probably selectively in China, Russia, Asia Interior, Ethiopia etc. Canada can cope with less fish some places. Most probably. There is no black/white perspective on this. The amount of concrete to build dams and replace it all is also an issue.
Kolb,
There’s also sediment. Washington traps 3,000 tons of sediment a day. It’s the same math as for salmon, the erosion due to hydro makes it futile.
Colombia is a low sediment river. Everywhere else in the world is going to be worse. The glomma (Norway) has something like 500 tons of sediment per day and 1/10 the flow rate of Colombia. I would be impressed to find any hydro project not torn asunder by fish kills and erosion.
Sediment might be a big problem in some areas, but Porjus hydro ( in a neighbouring village in the north of Sweden) has been producing for 110 years now, likely mostly bedrock and not a lot of soft soil in the basin though, but the same in much of Norway. Three Gorges, Hoover/Mead etc. might have bigger problems but still no excuse not to use them.
https://en.wikipedia.org/wiki/Porjus
Edit: Carl-Henric Svanberg, (in)famously known for his “we care for the little people” remark to Obama as BP chairman after the Deepwater Horizon disaster was apparently born in Porjus, little did I know… (CEO Tony Hayward´s remark was, as you might remember. “I want my life back”)
Edit 2, to EthG below, from Akkats and Ligga it´s quite flat and softer ground around so yes, a bit of an issue perhaps, but still quite small in comparison.
The Lule river tributaries are pretty sediment rich, and the dams are probably contributing to erosion, which is a problem in Sweden. But yes it’s a cute tourist attraction. The wilderness there is nice.
The MSM do all to make people believe the energy transition will work very well and BAU can go on. That’s completely wrong. The main reason is that the harvest of sun energy by PV and wind energy by wind mills needs a huge lot of resources which will not be available. Its a little bit of fun that people believes peak oil is here or will be here soon and believes on the other side that other resources will be plentiful available. A Swedish, Norwegian-Icelandic research group developed a complex world model named WORLD6 and WORLD7 to simulate the availability of resources in the future. You can download the report
“The WORLD Model Development and The Integrated Assessment of the Global Natural Resources Supply”
from the page from the page of the Federal German Environment Agency
https://www.umweltbundesamt.de/publikationen/the-world-model-development-the-integrated
The main results are seen on pages 407 to 409:
Most important mineral resources will have the peak production between 2030 and 2080 in case of BAU. And these scenarios are done all without the energy transition taking into account. The authors write
“Not shown here, but this also applies to energy conversion technologies like fuel cells (Use of platinum group metals, nickel and cobalt) or new battery technologies (lithium, cobalt, nickel and Rare Earths). For such technologies the material availability would quickly become limiting when such items would go into mass production. It appears from the numbers that while fossil hydrocarbons have largely sustainable energy production technology in terms of material requirements, they do not have a sustainable source of the actual energy.”
And they forgot to write that one of the biggest limited factor will be copper. Read here the study from Simon Morris Vice President Research, Metals & Mining Global Metals Wood McKenzie. He is convinced that the resources required for the energy transition cannot be extracted for the 2°C scenario until 2070. Therefore he assumes a warming of at least 3°C.
https://www.woodmac.com/horizons/champagne-supercycle-taking-the-fizz-out-of-the-commodity-boom/
For some of your points – there is a thing like ongoing process optimization and scientific progress.
Batteries: If you don’t need a Tesla S with 2.0 seconds 0-100 speed – the trend is LiFePO. You need only Lithium and copper for the interconnectors – no cobalt, no rare earths, no nickel.
Even newer, and if it may be a bit more heavy: Catl ramps up the sodium battery. Here you need no rare elements at all, its sodium carbon iron and aluminium as interconnector. All these materials are really abundand – even the copper interconnectors are removed. That’s all needed.
All these batteries will be build more compact in future – this is ongoing, too. Ask the oil people here: A drilling rig from 1980 isn’t the same as one from 2021.
For wind: The technology is flexible here, too. You don’t need a generator with rare earth, it’s a bit more efficient. If it’s too expensive, the old machine will do. Copper and steel can be recycled.
For fuel cells: They start phasing out platinium and replace it with organic material.
https://source.wustl.edu/2020/12/new-catalyst-resolves-hydrogen-fuel-cell-cost-longevity-issues/
The trend is always cheaper – and cheaper always means less rare materials.
It’s like in the development of cars: Just because Ford Model T was a huge success, development didn’t stop here.
One big thing we don’t notice in the west: China started with a small thorium reactor prototype last month. This is really big – There is enough thorium, and they plan to use small reactors that can be build in a factory and transported to the plant. So much faster deployment than conventional nuclear tech with has to be assembled in place.
Ramp up time matters. And when you have enough energy, recycling of rare elements gets possible. Most things are an energy question.
This doesn’t appear to be a prediction of The End Of The World As We Know It. From the summary:
” This will lead to some of the most serious industrial, political and social challenges of our times and will require careful preparation and research in order not to disrupt the functioning of society. Substantially better degree of recycling offers a long term sustainable and secure supply of most resources.”
That old Chinese curse is actually a quote from Poor Richard’s Almanac, which was written by Ben Franklin.
They are an OPEC member .
https://www.primebusiness.africa/opec-nigerias-petroleum-imports-exceeds-exports-by-43-56bn/
Saudi Arabia To Boost Oil Production Capacity To 13 Million Bpd in 2027
https://oilprice.com/Latest-Energy-News/World-News/Saudi-Arabia-To-Boost-Oil-Production-Capacity-To-13-Million-Bpd-in-2027.amp.html
If they’re working so fast, how come their rig count keeps falling?
Saudi Arabia’s state oil giant Aramco continues to see healthy global oil demand ahead and expects to have boosted its oil production capacity to 13 million barrels per day (bpd) by 2027 from 12 million bpd now, Saudi Aramco’s chief executive Amin Nasser said on Monday.
I have a different prediction: Saudi Aramco will decrease its production capacity from 9 million barrels per day to 7 million barrels per day by 2027.
Saudi Arabia is basically dead. I posted this
https://i.ibb.co/NTXJVQ3/3-D9-B0452-A62-D-4-CD8-947-E-D2-BDC5674999.png
It’s a production decomposition for ghawar. It’s a simple idea, production is stable as long as projects are done. Since there’s no new projects since 2015 the production will die. Even 2015 was just tertiary, GOSP in 2005 was the last thing.
Saudi production will collapse, furthermore the light oil is presumably being used domestically. Half of Saudi production is light according to a 1999 estimate so it’s less now.
I used the wedge between light oil production and domestic consumption to show exports will die around 2024-26, which lines up with the falling API grades of US imports.
Now that peak is happening nobody has any idea what is going on, however, at least now we have the correct way to predict field production. Just draw a triangle whenever a project starts, assume it lasts 20-30 years and piece together the production. It’s as good as any other method and there’s really no way it can fail.
Thermal coal price quote $270 this morning.
Isn’t that by far a record price? Hard to find a long term coal chart, and cannot find one that factors in inflation.
Here’s prices back to 2000:
https://www.bp.com/en/global/corporate/energy-economics/statistical-review-of-world-energy/coal.html.html#coal-prices
On the other hand, I believe that most coal is sold on long-term contracts, not on the spot price.
I post this here because the implications for Russian Oil and Gas production in the next several decades could be very large.
Interesting reading. Its just one region of the world where infrastructure is in for dramatic challenges.
‘Climate Change Is Melting Russia’s Permafrost—and Challenging Its Oil Economy’
https://daily.energybulletin.org/2021/10/climate-change-is-melting-russias-permafrost-and-challenging-its-oil-economy-wsj/
full article at WSJournal
FAO food price index continues up: http://www.fao.org/worldfoodsituation/foodpricesindex/en/
I’ve heard that some European fertilizer producers are off-line now due to high nat gas prices. How is the global situation and how much of the global fertilizer production is affected? Will it impact fertilizer prices next year?
It’s true that fertilizer producers are cutting production despite rising fertilizer prices. BASF is an example. I guess farmers will have to stop wasting so much of the stuff.
https://news.mongabay.com/2021/09/nitrogen-the-environmental-crisis-you-havent-heard-of-yet/
A lot of the blame goes to governments that subsidizer overuse of fertilizers instead of paying farmers to improve soil quality and raise profits by cutting inputs.
The production of hydrogen by electrolysis or by extraction of natural hydrogen is becoming urgent!
I have no idea! But to use less gas based fertilizers per acre is to be expected, and more crop rotation. At least that is the direction and the policy that many governments follow. Food is so tightly linked to energy, that it not easy to say how this will pan out. Heavily fertilized and pesticide based agriculture as opposed to low energy use (grazing probably with crop rotation probably) agriculture. In the first case more automation will save the day some claim. The signal of high cost energy is all over the place (natural gas, coal prices and oil somewhat).
Moody’s: Oil Industry Must Spend $542 Billion To Avoid Supply Shock Bold mine
Global annual upstream spending needs to increase by as much as 54 percent to $542 billion if the oil market is to avert the next supply shortage shock, Moody’s said in a report on Thursday carried by Bloomberg.
Currently, oil exploration and production (E&P) companies around the world are underinvesting in supply as they continue to keep capital expenditure (capex) low after the 2020 price crash and crisis, Moody’s notes.
Annual upstream investment crashed by around 30 percent in 2020 and has only slightly recovered since, according to the credit rating agency.
Most producers continue to stick to conservative capital budgets for 2022, but slight growth can be expected as commodity prices jump, Moody’s analysts say.
Yet, “Our analysis demonstrates that upstream companies will need to increase their spending considerably for the medium term to fully replace reserves and avoid declines in future production,” Moody’s Vice President Sajjad Alam said in a statement.
This year, spending is expected at $352 billion, while medium-term annual investment has to grow to $542 billion to keep with the demand returning from the pandemic slump, according to Moody’s.
“The industry will need to spend significantly more, especially if oil and gas demand keeps climbing beyond pre-pandemic levels through 2025,” Moody’s analysts wrote in the report, as carried by Bloomberg.
Underinvestment in upstream projects is a major wild card for oil markets going forward, analysts and industry officials say.
The oil industry is “massively underinvesting” in supply to meet growing demand, which is set to return to pre-COVID levels as soon as the end of 2021 or early 2022, Greg Hill, president of U.S. oil producer Hess Corp, said last week.
Last year, global upstream investment sank to a 15-year low of $350 billion, down from around $600 billion before the pandemic, according to estimates by Wood Mackenzie from earlier this year.
By Tsvetana Paraskova for Oilprice.com
My opinion: If demand returns to pre-COVID levels as soon as the end of 2021 or early 2022, supply will not be there to meet it.
Hmm. That’s $190B that’s needed. That would buy very roughly 400GW of solar capacity, which would probably power about 200M EVs, which would reduce oil demand by about 7M bpd. Eliminates depletion worries, provides domestic supply security and creates far less pollution.
I’d guess that solar would be a much better investment.
Ron, this article is nothing but the author trying to justify his salary . $ 542 billion . I like the sense of surety in that figure . How did he arrive at it ? Probably threw a dart at a board . Why not $ 555 0r 550 . Analysts always prefer to think in round figures . Anyway what will $542 billion bring online ? Nothing , nul , nada , zero , nulla . There is nothing left , the world has been fully mapped using 3D seismic and satellites . Yes , let us drill some dry holes for the fun of it . Your opinion is correct about pre COVID .
He is a she. And she is not the author of the data in the article, Moody’s Investment Service did the math. They reported it to Bloomberg and Tsvetana Paraskova was just reporting what she saw in the Bloomberg article.
Bloomberg: Oil Market Needs Half Trillion Dollar Injection to Ensure Supply
Ron, got it . Suggest Moody’s buy a new calculator or change the batteries on the one they are using now . 🙂
The question is why underinvest in oil exploration and extraction: (1) no profits expected from the investing , (2) no profitable oil fields left, (3) worries about another oil price crash because of economic collapse.
We aren’t going to drill.
Way, way too expensive.
Plus, we are supposed to be in wind down mode.
We will keep putting money in the plugging fund and will keep taking cash distributions.
Demand for oil in the future is much too uncertain.
So we will enjoy the current respite from the mostly lousy 2015-2020 oil prices.
Shallow sand,
Interesting, if this is the general consensus in the oil industry it won’t be long before we are back at $100/bo in 2020 US$. How many wells did you complete from 2011 to 2014? These are the kind of oil prices ($110/bo) we are likely to see from 2023 to 2033. A lot of money may be left on the table it seems, but the investment is very risky. How long does it take for a well to pay out at $100/bo?
An important question would be the cost of hedging, to reduce risk. I’d guess that it would be less than $10 per barrel…
I don’t think the question is can oil reach $100 or $120 or $150. I think the question is at what price does the debt that supports the price of everything start to implode. Is it $80 is it $90 is it $120.
The inflation we have isn’t monetary based. Not due to expansion of money supply. As bank reserves created at the central bank never leave the banking system.
We have inflated prices in real economy without expansion of money supply. We’re having to pay more for everything with pretty much the same amount of dollars.
How much longer this can continue is anybody’s guess but my timeline is 12-18 months before debt implosion. The higher prices rise the shorter the amount of time it will take.
Dennis.
Not saying never. Give it a year or two.
Casing is very expensive. Work over rig cost has increased greatly. So assume drilling rig cost has too.
We have converted three production wells to injection this year. Cost almost double what it used to. Lined tubing over $8 per foot. Then there is the injection line cost, plus rig time, trencher time.
We reactivated one production well we have that had been temporarily abandoned. Total cost just to do that was over $20k. The wells we are plugging are costing $3-5k to plug. But the equipment on the injectors is worth $10k and the producers worth close to $20k right now.
We used to drill, complete and equip infill production wells for $60-70k. We think it would cost around $100k to do that right now.
Finally, we have to think about adding wells in terms of adding plugging liability. If oil crashes, the well equipment won’t be worth much. So do we want to add plugging liability?
From 1986 to 1997 we drilled four wells. From 1998 to 2006 we didn’t drill a well. We drilled two a year 2007-2014, except we did drill four one year 2011-13, can’t remember which year, and we didn’t drill a well in 2009.
I suspect many more shale wells will be drilled at prices over $100, but I suspect they will cost a lot and it may take awhile to get the labor and materials.
We might just sell out too, if prices stay high for awhile. We aren’t getting any younger. But I think we might have missed the best time to sell (2011-13).
Thanks shallow sand,
Future prices might be quite a bit higher than 2011 to 2013, likely 2030 to 2033 will be the peak, maybe sell out in 2028/2029, in the mean time $100/bo or higher will become the normal oil price from 2024 to 2030, also supply disruption are likely to ease in 2022 and costs may return to normal levels. Obviously the oil price in the future is not known, but there is the fact that oil price has doubled in the past 12 months and there has been a serious lack of investment by the oil industry for the past 6 to 7 years (since the price crash in the third quarter of 2014). The World economy will recover from the recession and demand for oil will grow at least until 2030. Those who see these trends and are willing to take on some risk (as the E&P space is very high risk) may see very high rewards.
Best of luck.
“in the mean time $100/bo or higher will become the normal oil price from 2024 to 2030,”
I think that is highly likely.
So things are a whopping 50% more expensive than they used to be.
I don’t see a big shale drilling boom on this background – when things are already very scare, big new demand will send prices to the sky even more. Literally making bidding wars over the last available pile of tubing and the last free hand. Capacity – more raw material, more manpower, more euqipment – has to be increased before shale can go into another boom.
And with the current logistical nightmare – international container chaos – there is no fast switching of capacities now when every needed part can get stuck in a container not unloaded the next 3 weeks.
Frugal,
If the price of oil, natural gas, and NGL is high enough, oil companies will be willing to invest, for now they are happy to see their profits increase. What they are missing is that the higher prices go the quicker the transition to electric transport will happen. By 2033 it is likely (using a conservative EV adoption model) that World demand for oil will fall below World supply and the problem will become worse (prices and profits will decrease) with each succeeding year. Oil producers may be left with stranded oil that will never be profitable to produce. From a pure business perspective this is a mistake, though from an environmental perspective it is good as it speeds the transition away from fossil fuel.
As an oil producer who believes the transition to EVs is a threat (as it will remove oil demand from the market) it would be better to produce the oil from now until 2033 while oil prices are high, especially in the case of tight oil where costs are relatively high, but also for deep water and Arctic projects, after 2033 new investments in this type of oil will no longer be viable.
Agree.
Dennis , “If the price of oil, natural gas, and NGL is high enough, oil companies will be willing to invest,”
In what ?? Oil and gas fields don’t exist ??
Hole in head,
Both LTO Survovor and Shallow sand have said there are wells that could be drilled and completed, but they are not profitable at current oil, natural gas, and NGL prices, there is too much risk and too little reward. Shallow sand and LTO Survivor might both agree that the calculus would be different at oil price of $100/b, NGL at $35/b, and natural gas at $5/MCF. The oil is in the ground, if it is profitable to produce because demand has driven prices of energy higher, it will be produced, just the way capitalism works.
Dennis , $ 100 oil ? Who will buy ? The world is poorer . Yes , the 1% are richer but how much oil can Bill and Jeff use ? You will argue that the world did buy + $ 100 oil for a period of time . Emphasize ” period of time ” which also means ” unsustainable ” . Since the period of time the world has added trillions + trillions of debt and a few billions in population . You view price from the prism of supply and demand , unfortunately their are other factors at play and until you are able to connect the dots you will arrive at an incorrect answer . HHH has the problem in the correct frame . Capitalism failed when the state intervened . If QE , ZIRP, NIRP , cash for clunkers ,PPP, free stimmies etc are capitalism , well who am I to argue . I think I will go back to school and read Adam Smith , Marx etc .
Hole in Head-
People will pay more for energy for important uses.
After all, there isn’t any good alternatives (other than to grow potatoes in the side yard).
For frivolous or optional uses, yes people will cut back.
And there’s a lot of consumption of marginal value: half of oil consumption is for light passenger vehicles, and that could be reduced dramatically with very little loss of value to consumers.
Average MPG in the US is only about 23. Average number of people in the vehicle: about 1.2.
Eventually, of course, we’ll go to electric transport.
In the meantime, carpooling…the horror…
Hicks , it does not work that way . If you can’t afford it ,you can’t have it . Real life examples .
1 . The Indian govt issued 20 million cooking gas cylinders free to the poor . When the cylinders were issued the price was $4 for a cylinder . Today the price is $ 9 . Result 90 % of the recipients are back to cooking on wood or cow dung flats .
2 . Price of petrol in India is $ 1.40 per litre or $ 6 (approx) for a gallon . Consequence my very close friend who had five cars (one for each family member) got rid of 2 cars .
3 . The largest supplier of lobster ,shrimps mussels and shelled seafood in Netherlands filed for an equivalent of Chapter 11 . Reason cited is that the prices are now unaffordable and consequent lack of demand .
There is nothing like ” gotta have it ” . No sir, if you can’t afford it you CANNOT have ” gotta have it ” . The public is going to learn some harsh lessons in the near future .
Yes – prices can go high, but can they stay high?
I think the math will work out such that prices can only stay high so long as the total amount of energy consumed by the economy continues to rise. If high prices of total energy create demand destruction, they won’t hold.
Frugal , bullseye .
Energy price spike in Europe, coal shortage in India: Are we seeing a global energy crisis?
An extra 28 million electricity consumers in India this year. Nobody talks about population control.
Sure they do. Fertility rates in India have plummeted in the last several decades, in part due to deliberate public policy.
Hint:
India has a population of 1.38 billion in 2020.
1.36 billion in 2019.
Can you do the math?
Its population increased 20 million people.
A little less than the population of Canada, a larger country.
That’s normal: when you dramatically reduce how many children you have, there’s a transitional period when the society is young and the death rate is still very low. The population still grows for a while until deaths rise to a normal level.
“In demography, demographic transition is a phenomenon and theory which refers to the historical shift from high birth rates and high infant death rates in societies with minimal technology, education (especially of women) and economic development, to low birth rates and low death rates in societies with advanced technology, education and economic development, as well as the stages between these two scenarios.[1] ”
https://en.wikipedia.org/wiki/Demographic_transition
What’s Musk up to now for kids, seven ish? He seems kinda needy.
“A red herring is a piece of information that’s meant to distract people from something important in a misleading manner. Red herrings are usually used either as a literary device, such as when an author uses a side character to divert attention from another character, or as a rhetoric technique, such as when someone responds to a question with unrelated information in order to hide their refusal to answer the original question.”
https://effectiviology.com/red-herring/
As optimistic as ever I see. Who’s you’re hero now Nick; who will turn this cornucopia of solutions that you envision into being a reality? You?
For quite some time, before COVID, the non petroleum side cornucopian crowd here was quite into peddling the “but Amazon!” methodology of future trends analysis. Now it’s all jerkoffs in space. Way to save the the planet. Embarrassing, as usual.
I hope to make a difference. Along with everyone else.
No one accomplishes anything meaningful all alone.
My heroes are the two great Josephs: Jenkins and Országh. Here is a link to a very good 55 minute video on the Kailash Ecovillage in Portland. The Kailash Ecovillage is interesting because it is a mature (started in 2008) urban permaculture design. Shows what can be done with today’s technology: https://www.youtube.com/watch?v=iCGXVk-cBVk
Survivalist “Now it’s all jerkoffs in space.”
Thanks , you saved me the trouble .
I’m puzzled. Why ask about heroes?
I think we’re all way too oriented towards thinking about “great leaders”. It’s true that smart leaders can make a difference, but that’s only because too many people abdicate responsibility to those leaders.
Fox News likes to focus on personalities and attack personal flaws. That’s only because they have no genuinely good ideas or public policies of their own, so they have to attack the person, not the programs/ideas.
Let’s talk about the important stuff.
Nick G , ever learn about the ” base effect ” . A company makes 1 tractor and the next year 2 tractors . 100% growth . A company makes 100,000 tractors and next year 10,000 . 10% growth . Where will you put your money ? Stop muddying the water .
It doesn’t matter how large your population is, if women have less than roughly 2.1 children each, eventually the population level will stabilize and fall.
India’s fertility rate was about 6 children per woman in 1960, and now it’s 2.18 and still falling. That’s a dramatic reduction. There’s no question that population and family planning has gotten a lot of attention in India (which is where this discussion started).
Good article (from 2019 so perhaps a bit dated) on Indian population, I had not realized there was a history policy of sterilizations of women especially in poor areas of India, rather than widespread availability of modern birth control methods. Hopefully this has improved over time.
https://e360.yale.edu/features/why-india-is-making-progress-in-slowing-its-population-growth
Nick G and Dennis , locking the gates after the horses have bolted . Simple . Keep on with your statistical stuff . Might give you a fuzzy , warm feeling but you cannot turn back the clock . There are 1.3 billion hungry mouths to feed and there is not enough to go around . A perfect combination of ” Overshoot ” and ” Limits to growth” is the reality of the subcontinent .
HiH,
It seems like poverty and income inequality are the problems, not resource limits. Indian farmers could produce far more, but they’re poor and their production is less than others because their farms are so small. And even with low farm productivity there’s enough food in India. Obesity is far more prevalent than malnutrition:
“Prevalence of obesity in India is 40.3%.”
“14% population estimated to be undernourished”
https://journals.sagepub.com/doi/full/10.1177/0972753120987465#:~:text=Prevalence of obesity in India is 40.3%.,than rural (44.17% vs.
https://www.firstpost.com/india/india-ranks-94th-among-107-countries-in-global-hunger-index-14-population-estimated-to-be-undernourished-8924501.html
That is a good article:
““We don’t support policies that are against human rights or directed at particular communities,” says Maynard. Countries that have stabilized their populations such as Bangladesh and Sri Lanka, he adds, “have implemented programs that empowered women and gave them safe family planning choices. They are meeting rights and also meeting planetary needs.”
Societies generally experience falling fertility rates as incomes and education improve, child mortality declines, and more women work, a demographic transition captured in the saying, “Development is the best contraceptive.” India’s experience largely supports this. The states with the highest fertility rates – Bihar, Uttar Pradesh, Jharkhand, Rajasthan, and Madhya Pradesh – also have the lowest socioeconomic indicators, especially with regard to women. Bihar, for instance, which has India’s highest fertility rate (3.2), has the largest percentage of illiterate women (26.8 percent). By contrast, low-fertility Kerala has a literacy rate of 99.3 percent, the result of decades-long state focus on basic education and health care. Fertility declines have been especially sharp in India’s cities and towns — where women are more likely to marry later, go to school, and work — and in southern states, which include the IT hub of Bangalore, where education levels and age of marriage are generally higher.”
Nick G , obesity ??? Did you read the article . Here is the sample size from the article .
Data for 1,00,531 adults from a nationwide randomized cluster sample survey (Niyantrita Madhumeha Bharata 2017, phase 1) were analyzed.
100000 from a population of 1300000000 . Consider population of Delhi itself is 20000000 . Give me a break .
As to malnourishment again read your own link ‘ India is 94 in a list of 102 . Below it are countries like Chad, Mali , Burkina Faso
It also showed the country recorded a 37.4 per cent stunting rate among children under five and a wasting rate of 17.3 per cent.
I will stop arguing because your information about India is miniscule . You know nothing about what the reality is on the ground .
Yes, India still has a lot of malnutrition. But it’s not a problem of not enough food, it’s a problem of deep poverty side by side with growing affluence.
“ India is on track to own the unenviable title of diabetic capital of the world as soon as 2025 with more than 65 million Indians already suffering from the disease. Sadly, “diabesity” has become a common term in the Indian vocabulary.
Chowbey says he was shocked when he first discovered how widespread obesity had become, especially among young people. He warns that India will soon end up as not only the world’s most populous nation but also its fattest.
“Obesity,” he says, “is the mother and gives birth to so many children who are sinister for longevity. We have gone from under-nutrition to over-nutrition.”
https://www.cnn.com/interactive/2017/10/health/i-on-india-childhood-obesity/
if women have less than roughly 2.1 children each, eventually the population level will stabilize and fall.
lol!
20 million added to the population last year
Pakistan and India are Failed States, with Indonesia not that far away.
Pakistan will probably be the first over the falls.
An updated Non-OPEC report is expected to be posted between 8 PM and Midnight October 8.
WTI just punched an $80 ticket
Looks like Russia had another fire. This one effecting natural gas to China.
Interesting chart for natural gas prices in Netherlands and LNG prices in Asia. I would think LNG exporters are working overtime to ship supplies to Europe and Asia, at $40/ MMBtu, there is a lot of money to be made, this price is about 8 times higher than a year ago.
Russia excepts Euro’s as payment for natural gas. Those Euro’s lose value if Putin fails to deliver needed natural gas in quantities that keep price affordable. Money will leave Europe if shortage is lasting. How many Euros is Russia sitting on at the moment is a good question.
Dennis
US LNG export terminals are running flat out at ~10.5 Bcfd.
Both Train 6 at Sabine Pass and Calcasieu Pass are in the commissioning phase (starting actual production) and by next spring should be at 100% adding an incremental ~2 Bcfd export capacity.
Bangledesh just purchased a cargo at about $53/mmbtu.
D COYNE,
Indeed. FREE MARKET CAPITALISM AT WORK. We are also seeing this with U.S. Propane. The U.S. Energy Industry is taking advantage of higher foreign Propane prices by exporting more Propane than it supplies to our domestic market. Thus, U.S. Propane inventories are below 5-Year Lows.
So, Americans better get ready for higher Winter Heating prices because your DOMESTIC ENERGY INDUSTRY has sold you out to the HIGHEST FOREIGN BIDDER…
GOD HATH A SENSE OF HUMOR…
Steve
OBESITY Okay, I am not joining this argument on either side. But someone needs to explain why so many people become obese. I am going to shock everyone with this statement: Obesity is a Darwinian adaptation. Well, largely that is. There are some occasions where obesity is just the result of gluttony, but that is by far from the primary cause of obesity. But largely obesity is a cultural phenomenon that occurs in cultures with a history of famines every few years. Those who have the ability to store fat in years of feast have a far better chance of surviving the years of famine. They simply live off their fat while the skinny, who have no fat, just die. So the fat genes are passed on while the skinny genes meet a dead end. That is why so many native Americans are obese. That is especially the case with those who were primarily agricultural. I have no doubt that this is the primary reason that so many Indians are obese as well.
Inuits, among other peoples, are famously likely to out on weight with modern Western diets because of their previous adaptations to harsher, low calorie conditions.
The abundance of calories, especially in the form of processed sugar, tend to not be good for a great many people who are now maladapted to a world of plenty.
I agree. In fact, I suspect that’s true for everyone. I, for instance, can’t have sweets just sitting out in easy reach: I’ll eat forever. I have to put them out of sight, out of mind.
I don’t think humans are “designed” to be around lots of easily available, easy to eat food.
I’ve found walnuts are a pretty good food for this problem: very low carb, very low glycemic index, very high nutrition density.
Lots of people are getting excited about raw foods. I suspect that they’re harder to digest, and so you get fewer net calories than the food label would indicate. Calories are still what make you overweight…
An interesting part of this.
Article dates from 2016
What’s on your table? How America’s diet has changed over the decades
https://www.pewresearch.org/fact-tank/2016/12/13/whats-on-your-table-how-americas-diet-has-changed-over-the-decades/
Broadly speaking, we eat a lot more than we used to: The average American consumed 2,481 calories a day in 2010, about 23% more than in 1970. That’s more than most adults need to maintain their current weight, according to the Mayo Clinic’s calorie calculator. (A 40-year-old man of average height and weight who’s moderately active, for instance, needs 2,400 calories; a 40-year-old woman with corresponding characteristics needs 1,850 calories.)
Nearly half of those calories come from just two food groups: flours and grains (581 calories, or 23.4%) and fats and oils (575, or 23.2%), up from a combined 37.3% in 1970. Meats, dairy and sweeteners provide smaller shares of our daily caloric intake than they did four decades ago; then again, so do fruits and vegetables (7.9% in 2010 versus 9.2% in 1970).
A new thread Non-OPEC June Oil Production has been posted.
https://peakoilbarrel.com/non-opec-june-oil-production-has-small-increase/
A new Open thread Non-Petroleum has been posted.
https://peakoilbarrel.com/open-thread-non-petroleum-9/
Surprised nobody here bothers to follow the corporate bankruptcies, which are the key indicator for the future of US (and other capitalist-country) oil production.