A guest post by Ovi
The EIA has reported that their site experienced technical problems last week and that they have not been able to update their weekly and monthly data. Since we do not know when they will publish the April U.S. oil production report, this short different post will fill the gap.
The answer to the above question is clearly No. However that does not prohibit one from doing some exploratory analysis.
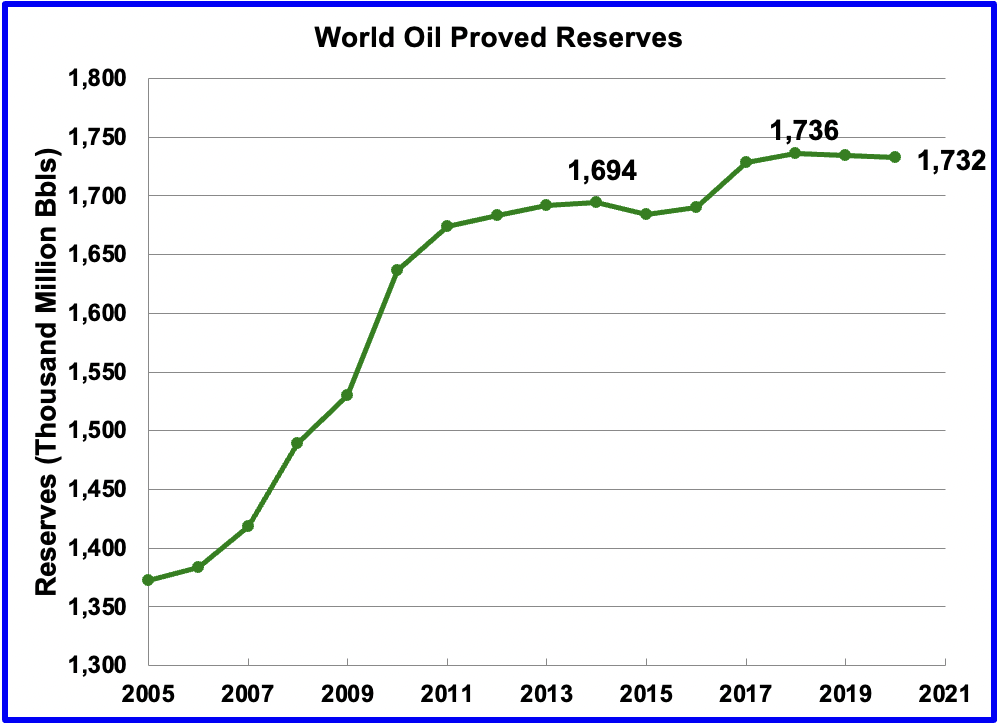
Recently BP issued their annual Statistical Review. While most of it was updated to 2021, the world oil reserves were not and the same 2020 reserves were reported again. The following note was provided to explain why the reserves were not updated: “Please note that due to process improvements for the Statistical Review these reserves tables have not been updated this year.”
Looking at the last two years of the BP reserves data, one can see the reserves have not increased and could possibly be in decline.
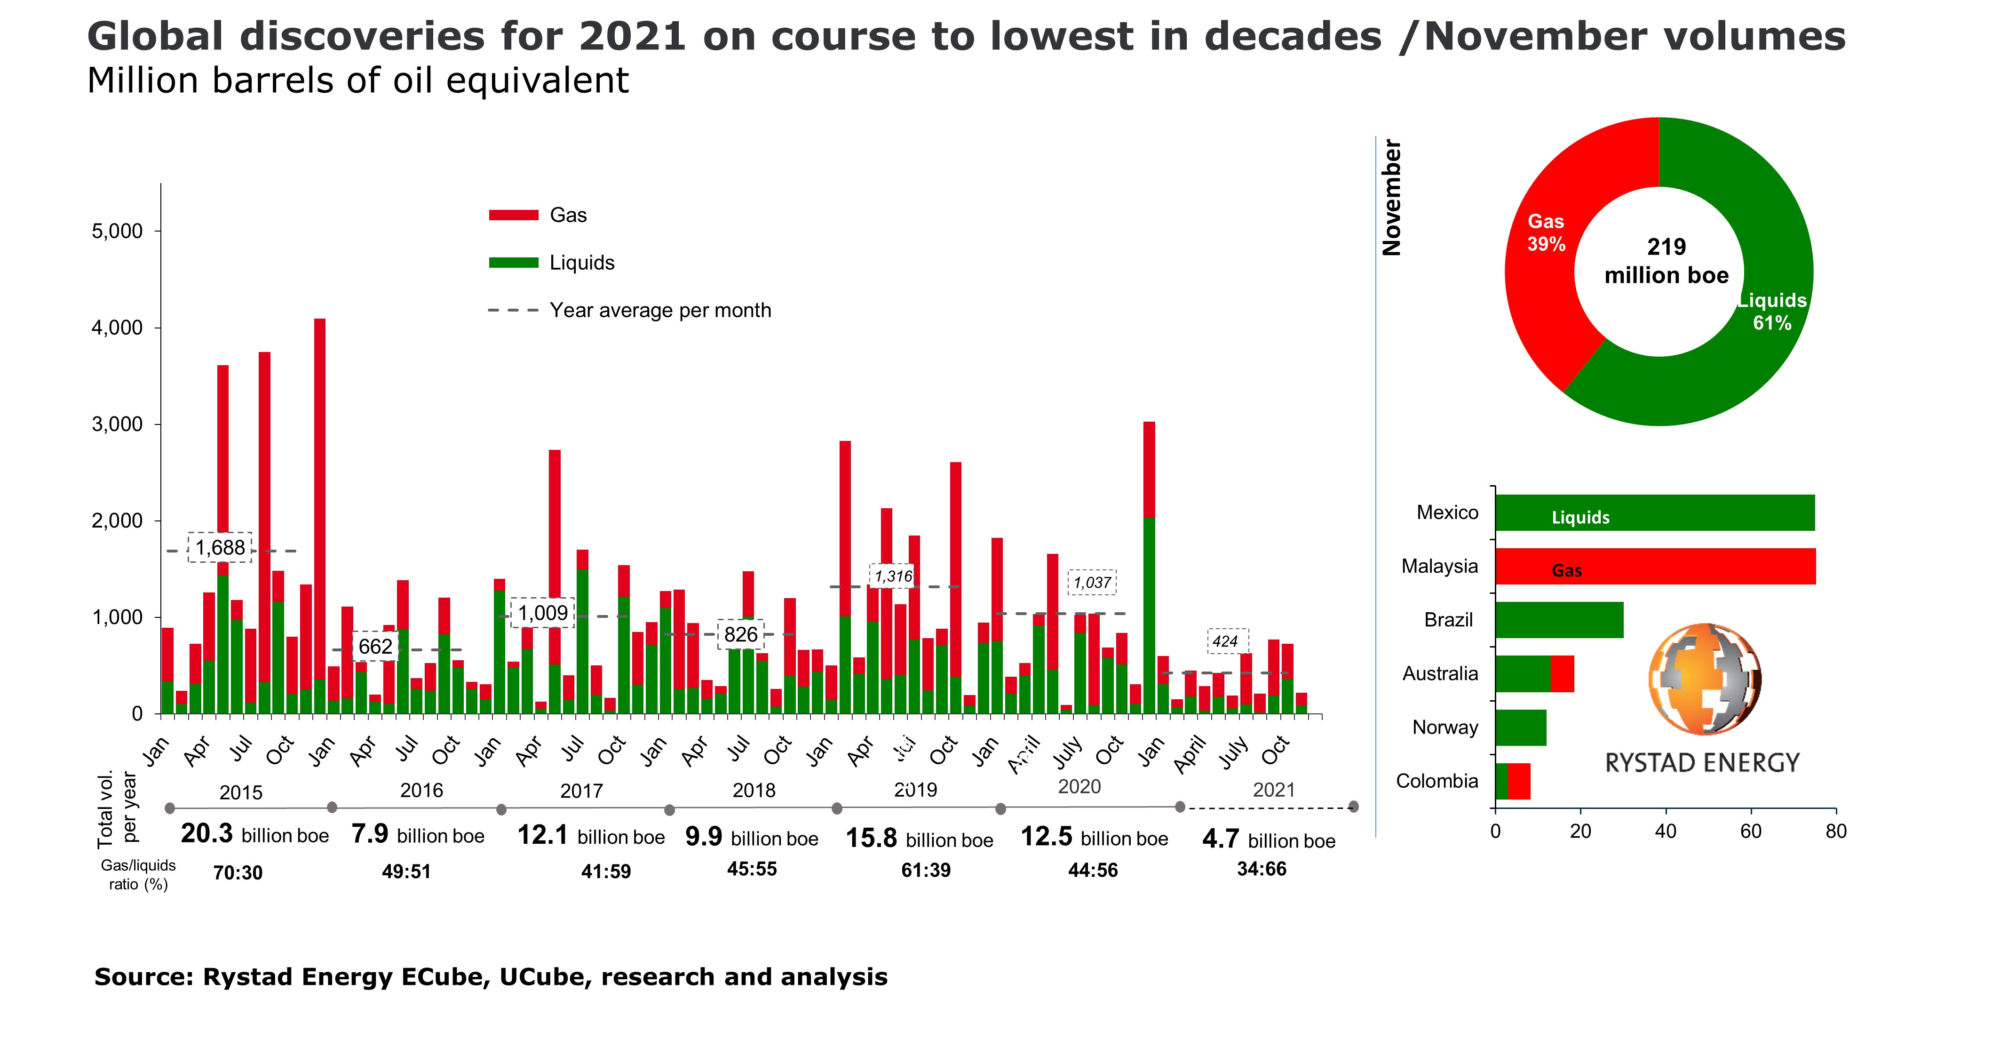
In late 2021, Rystad released the oil discoveries for 2021. Only 3.1 B barrels of liquids were discovered up to the third week of December 2021. While oil reserves in some countries were updated during the year, Rystad has revised their estimates and published a report indicating that reserves are nine percent lower than previously thought. This could also explain why BP did not update the reserves in their report.
This led to the thought that generated this post, “Can we use past production to explore future production since the likelihood of a major new field being found is low?”
Below are charts that use the logistic function to model past production to estimate future scenarios.
The logistic function for cumulative production is given by:
Q(t) = Q0 / (1 + exp(-a(t – Tp))) (1)
Where:
Q(t) = Cumulative production to the year t
Q0 = URR or ultimate recoverable reserves
a = constant affecting the height to width ratio of the logistic function
t = calendar year
Tp = peak year, production peak for each individual logistic function
exp = the exponential function
The annual production rate P is the differential of (1) and is given by
P = dQ(t)/dt = a*Q0* exp(-a(t – Tp)) / (1 + exp(-a(t – Tp)))^2
Two sets of data were used to model future production.
OPEC recently published their updated yearly World Crude production for the years 1960 to 2021. Only data up to 2019 was used since 2020 and 2021 are atypical.
The EIA yearly crude plus condensate world production for the years 1960 to 2019 was used for the second analysis.
Each of the data sets was modelled using two and three logistic functions to assess how the production outlook changed as the third logistic function was added.
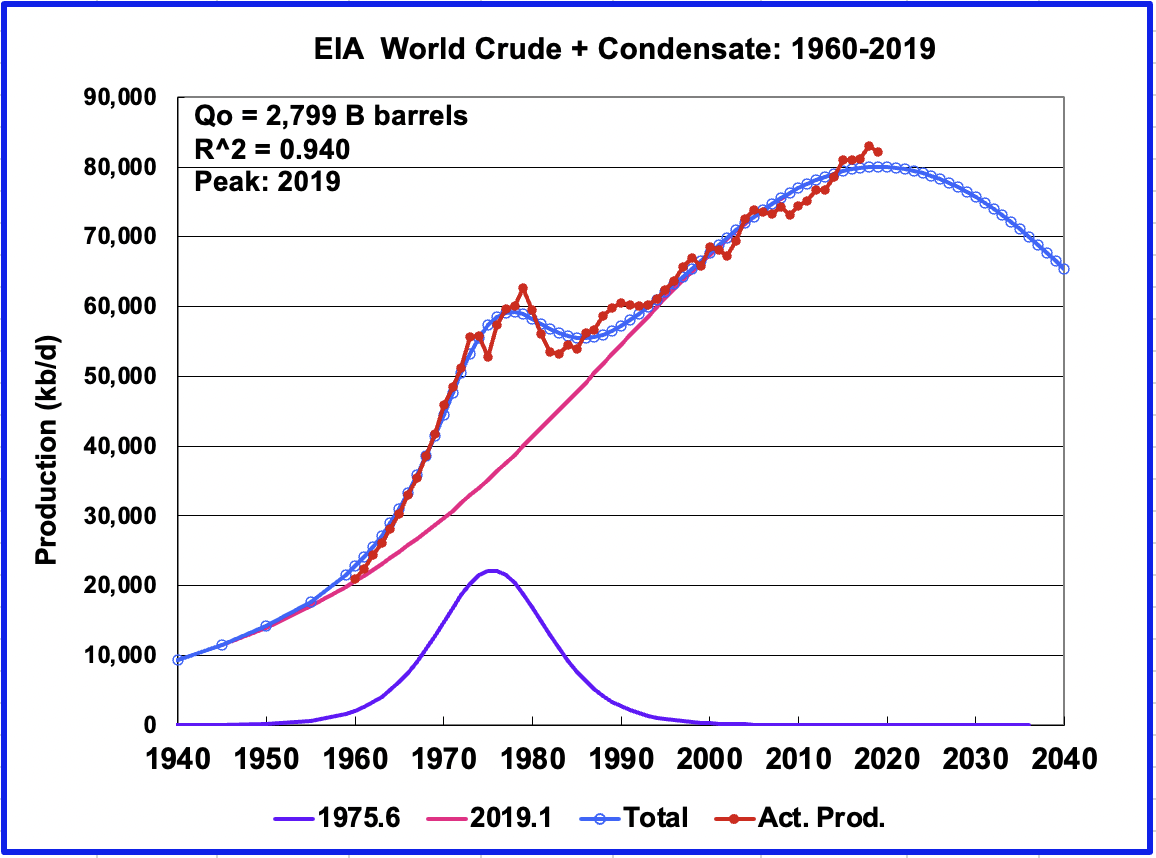
OPEC Crude World Production Data
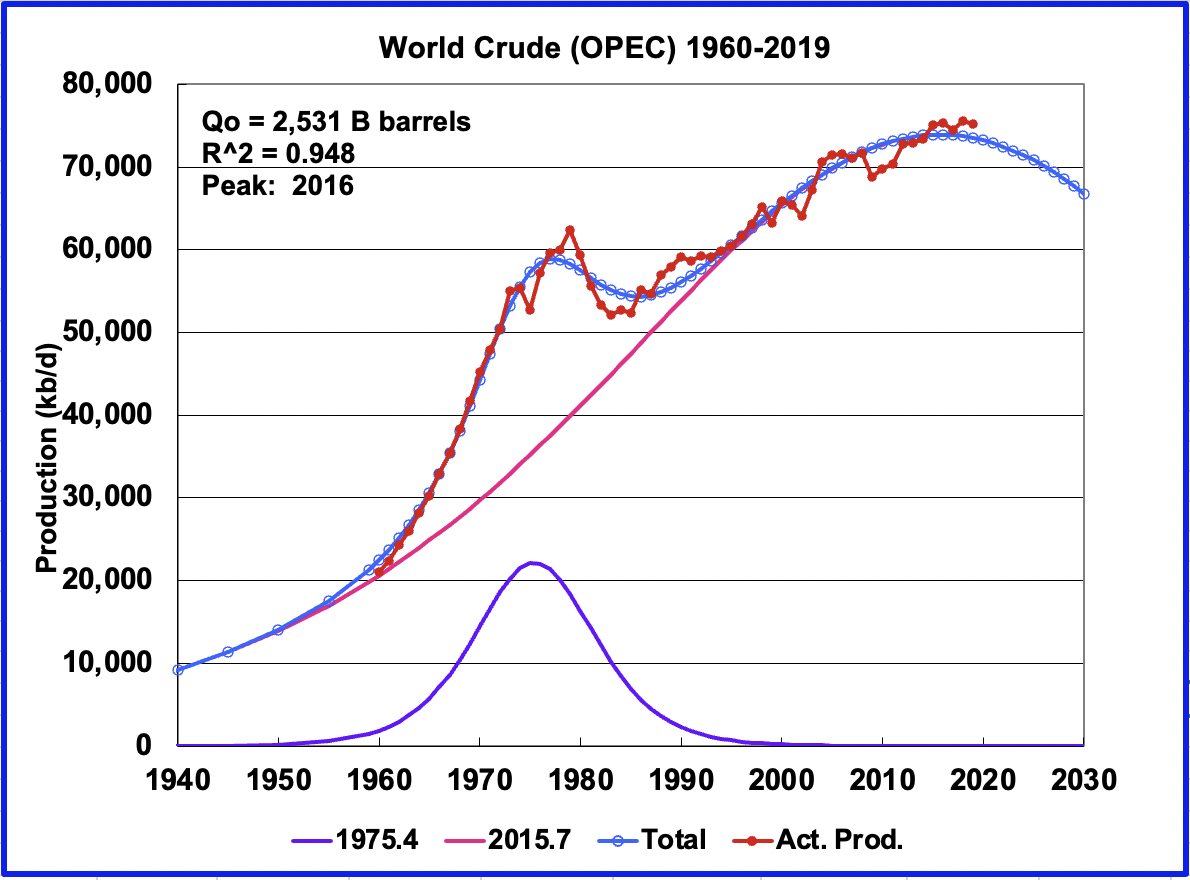
This is the OPEC crude data modelled using two logistic functions. The smaller one has a 1975 peak while the main one peaks in 2015. The overall peak is in the rear view mirror, 2016.
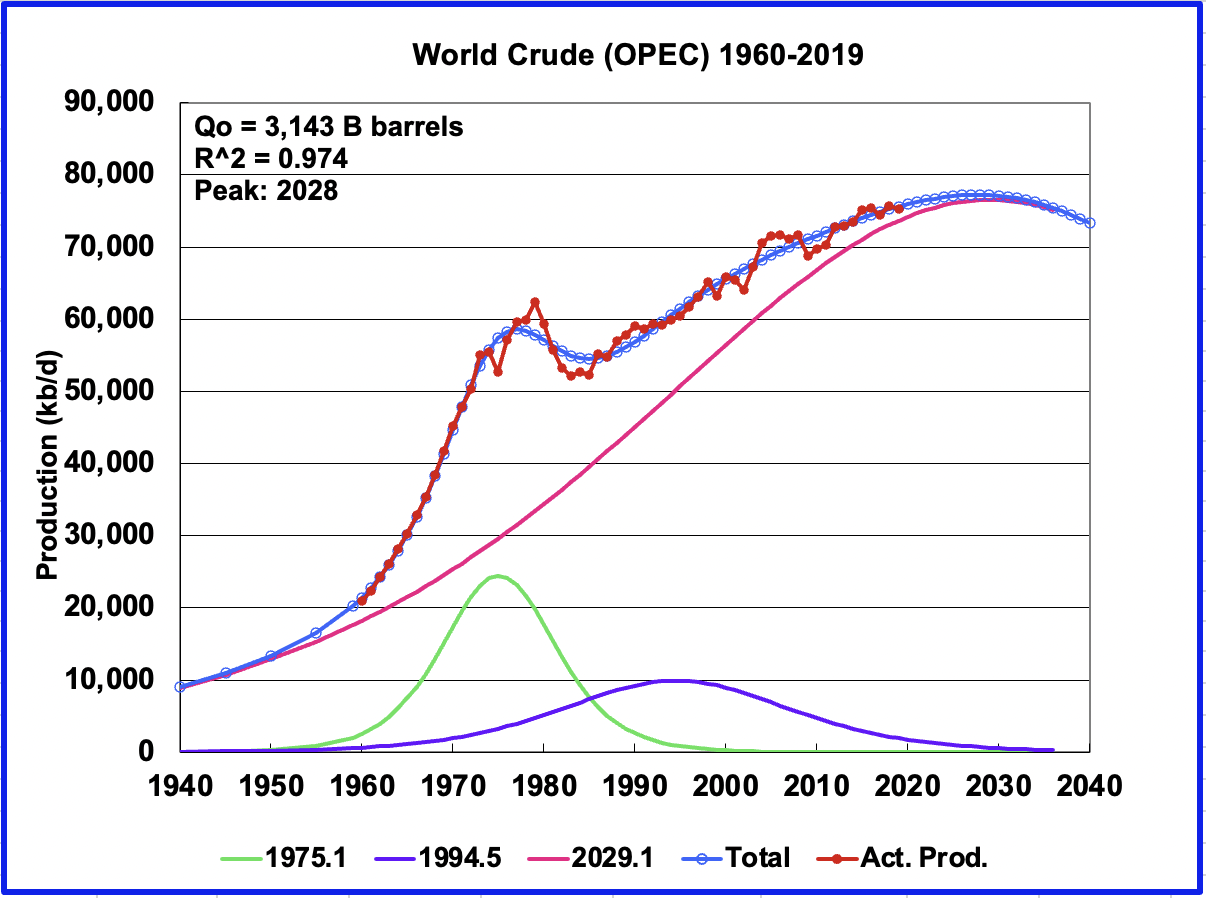
To improve the model over the years 1980 to 2000, a third logistic was added. This model forecasts the World could potentially add an additional 2,000 kb/d over the 2019 production of 75,243 kb/d. Peak production of Crude is projected to be 77,214 kb/d in 2028.
EIA Crude plus Condensate Production
This is the EIA Crude plus Condensate data modelled using two logistic functions. The smaller one has a 1975 peak while the main one has a 2019 peak. Again the overall peak is in the rear view mirror, 2019.
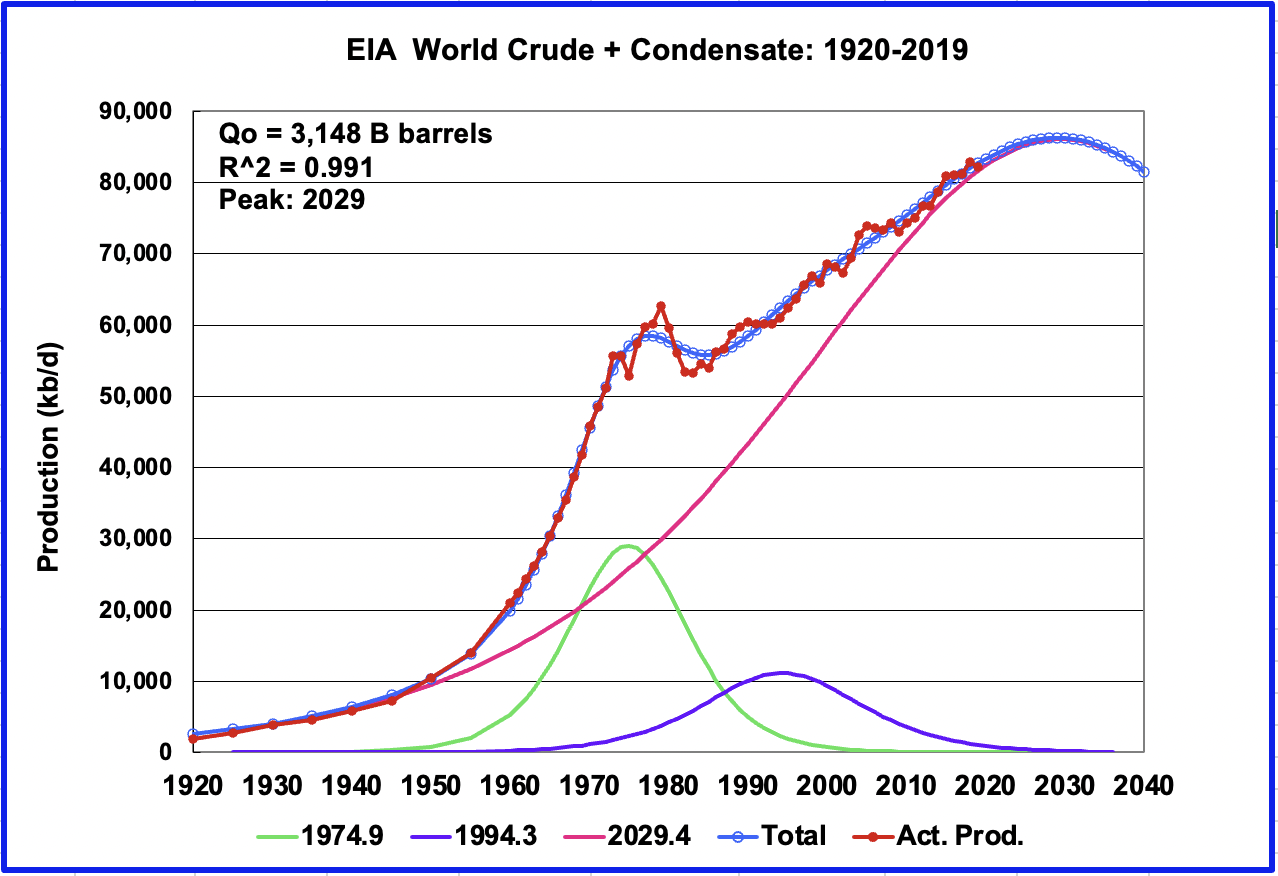
Adding a third logistic to the EIA data has the same affect to production as occurred with the OPEC data. Also the data range was expanded from 1920 to 2019. While actual production peaked in 2018 at an average rate of 82,952 kb/d, the model forecasts that peak production will occur in 2029 at 86,056 kb/d, an additional 3,100 kb/d over the 2018 rate.
My thoughts on this analysis are two fold. I think the peak is in the past as indicated by the two function charts. I also think the three model charts are correct in saying that modestly higher production could coming over the next few years and that the second peak oil is close.
Rigs and Fracs
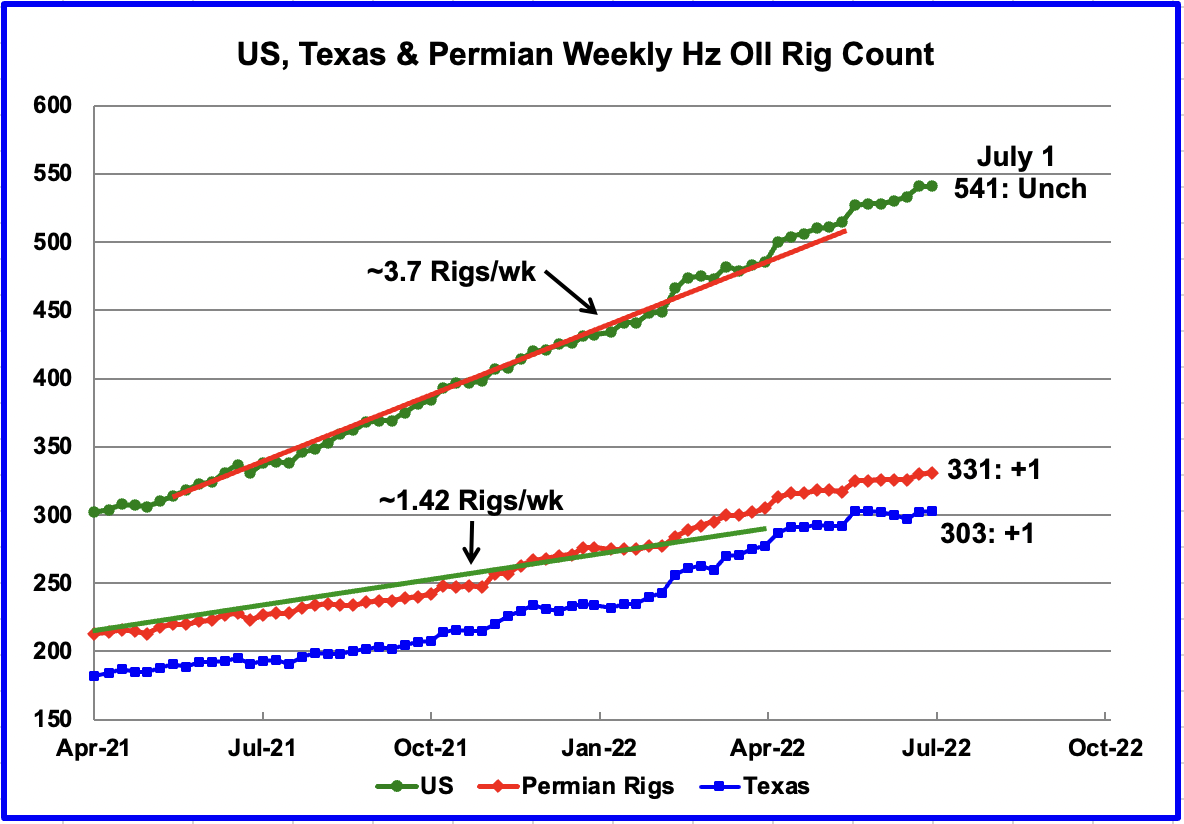
For the week ending July 1, 2022, the number horizontal oil rigs was unchanged at 541. One was added in the Permian and one in Texas.
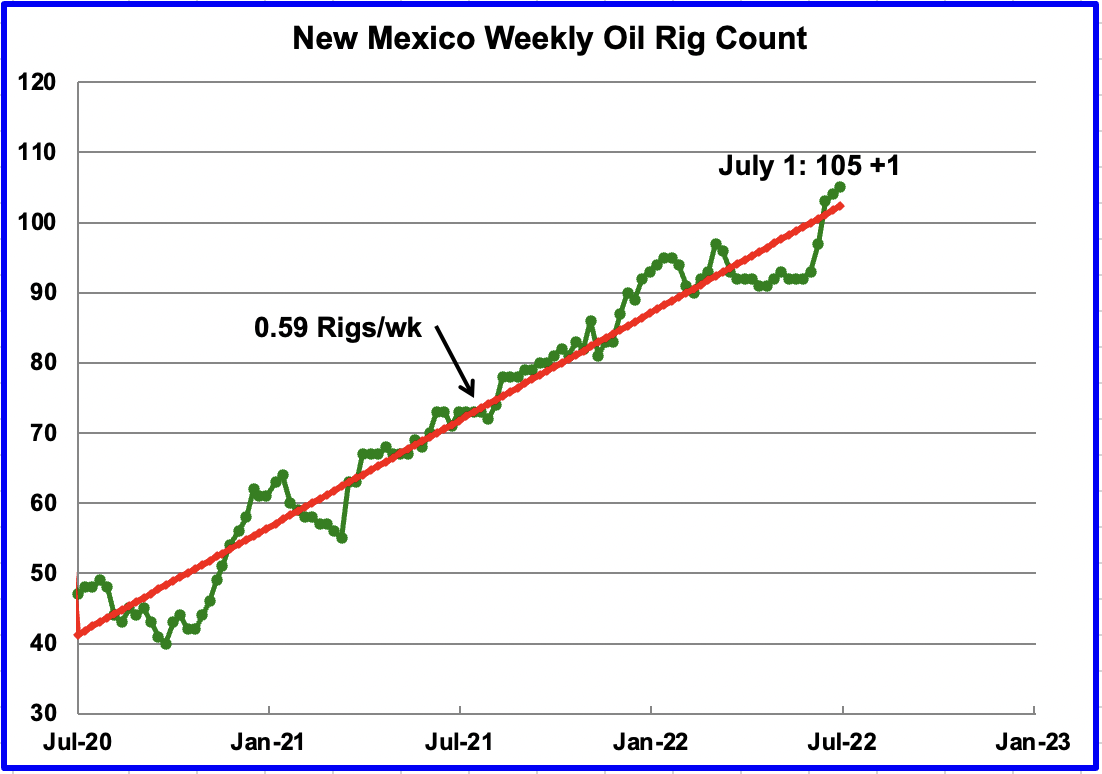
The New Mexico Permian added 1 Horizontal rig in the week ending July 1.
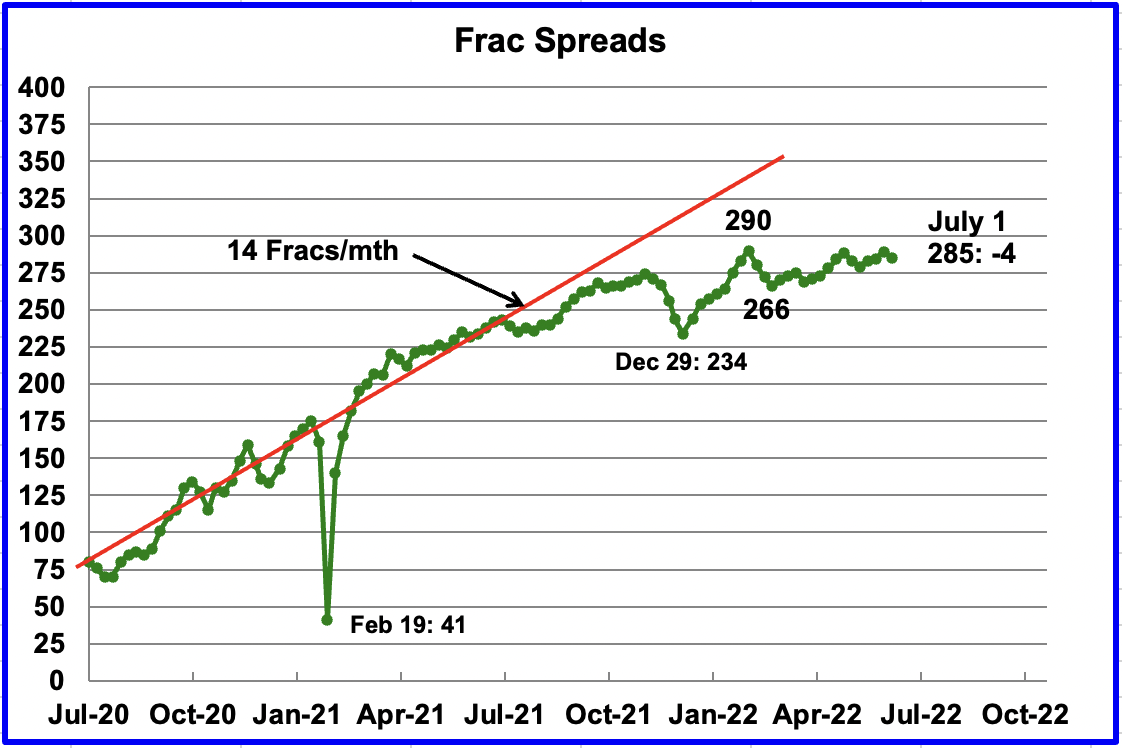
Frac spreads dropped by 4 in the week ending July 1. Frac spreads typically drop on long holiday weekends.
An article in Reuters reports that “U.S. shale oil producers are returning to existing wells and giving them a second, high-pressure blast to lift output for a fraction of the cost of a finishing a new well.”
“Re-fracing can be something of a booster shot for producers – a quick increase in output for smaller investment than a new well. While some producers have dabbled in re-fracturing wells in the past, the technique is winning broader adoption as technology improves, aging oilfields erode output, and companies try to do more with less.”
“Shortages of steel, diesel, frac sand and workers have doubled oilfield inflation since January, making this discount method of boosting output even more attractive.”
“A re-frac can be up to 40% cheaper than a new well, according to experts. More importantly, it can double or triple oil flows from aging wells, said Garrett Fowler, chief operating officer for ResFrac, which helps producers optimize the technique.”
I wonder if this accounts for the STEO’s optimistic increase in US production, reported in the previous post, for the upcoming year.
How big an issue is this for the drillers of new wells. Will this result in more frac spreads being assembled or will their assembly be limited by personnel and equipment? Also this could result in an increase in the DUCs’ inventory as opposed to the current decline.
169 responses to “Can Past Oil Production Predict the Future?”
Ovi,
Great job!! Much needed discussion on this. I had a few comments, but wanted to know what is the total Global Cumulative Crude Oil & Condensate Production as of Dec 2021?
steve
Steve
Here is the number you are after
1395 Gb
At the end of 2021, I have
1451 Gb
Seppo,
Thanks… that matches up closely with Jean Laherrere’s figure of 1439 Gb for 2020. I get 1467 Gb for 2021, but what’s a few billion barrels between friends??
I believe the real issue is the QUALITY of the remaining Reserves. Likely only half of the supposed 1,500 Gb reserves are of higher quality to be extracted, but even then I doubt all of these will be extracted.
As we head over the ENERGY CLIFF, and the global supply chain begins to break down, we will have serious problems with extracting the remaining high-quality reserves.
steve
Ovi –
Great charts that actually have a decent shot of matching reality. Take home is that we can expect a loss of 1 million barrels per day (annually). If the system runs flawlessly (fat chance) we might maintain current levels for 3-5 years. Since we are already seeing major underlying issues (supply chain, refining issues, etc), I think a loss of several percent annually is entirely reasonable. What’s not reasonable is to project the past 30 year average (1-2% growth) over any timeframe into the future…The Russian situation alone will most likely eat up 2-3% easily…Dennis, I’m sure there’s a rosy side to it though, right? My chart below, capturing upside and more likely downside:
Kengeo,
My best guess model has World URR at about 3000 Gb, Ovi’s excellent analysis ha URR somewhat higher at 3140 Gb. In addition his peak for C plus C is somewhat higher than mine (which is 85 Mb/d in 2029). see chart below for C plus C less extra heavy (XH) oil with URR of 2860 Gb (XH URR is 120 Gb for my model), this can be compared with charts by Jean Laherrere. Not clear why you believe my analysis is unreasonable (though output is less than what is presented by Ovi).
To compare with Ovi’s models I present a C+C model below scaled similarly. Note the difference in 2040.
Cumulative C+C production is 101 Gb at the end of 1959 and 264 Gb at the end of 1972.
Dennis – For the simple reason that your graph shows production growing by 2 MBpD annually for the next 5 years, that just doesn’t pass the test…at this point it will be impressive if production doesn’t fall 2-3% each year. The charts Ovi presents shows this clear decline. Hope this answer makes sense.
Happy 4th of July!
KenGeo,
My chart shows actual output in 2020 and 2021, Ovi only show the data through 2019. In 2020 output fell by 6 Mbpd, so if Ovi’s scenario proves correct output would need to increase from 76 Mb/d in 2020 to 86 Mb/d in 2029 (one million barrels per day higher than my scenario.) Ovi’s scenario implies about a 1.1 Mb/d increase in output from 2021 (77 Mb/d) to 2029 (86 Mb/d). If the peak output were reached that his scenario suggests in 2029. Also notice that his scenario suggests about 81 Mbpd in 2040, my scenario has World output at 69 Mb/d in 2040.
Ovi’s model seems fairly reasonable, though I expect decline from 2030 to 2040 to be faster than suggested by the logistic function.
Keep in mind that currently World output is about 80.5 Mb/d (May 2022). I have output increasing by 4500 kb/d over the next 7 years, about 640 kb/d annually on average from 2022 to 2029. That is slightly less than 1% per year and is likely to be a conservative estimate.
Ovi’s C plus C scenario has output increasing from 2019 to 2029 and ignores the big drop in output in 2020 and 2021. My scenario includes that dip in output.
Dennis – Recap/Food for thought:
For 67% of the worlds oil supply (Africa+Asia+Europe), there is a potential pattern:
1965-1977 – Annual growth rate of 2.9 MBpD/year.
1985-2008 – Annual growth rate of 1 MBpD/year.
2008-2018 – Annual growth rate of 0.3 MBpD/year.
(seems like some kind of trend here?)
27% of the world supply peaked in 2006-2007 timeframe (Africa + Europe), 40% of supply peaked in 2016 (Asia), and remaining 33% (Americas) has been flat since 2018.
Asian countries (40% of world production [WP]) down 5 MBpD since 2016.
Americas (33% WP) essentially flay since 2018.
European countries (19% WP) essentially flat since 2004.
African countries (8% WP) down 40% since 2008 peak.
Since 2016, Asian countries have dropped from a peak of 40 MBpD to ~35 MBpD in 2020 and 2021 (only growing 1.3 %).
Since 2018 Americas have stayed in a range of 30 MBpD +/- 1 MBpD, essentially flat.
Since 2016 European countries have stayed in a range of 17.8 MBpD +/- 0.5 MBpD. However, 15 year average for European countries of 17.6 MBpD indicates a long drawn-out plateau, production in 2020 and 2021 are the lowest values since 2003.
Since 2010 African countries have lost 3.0 MBpD, producing only 7.3 MBpD in 2021 (increasing 5.1% from 2020 level of 6.9 MBpD).
Putting this all together, doesn’t look like there’s any growth left in at least 2/3 to 3/4 of the proven reserves.
Seems like covid came along at the perfect time when production was hitting growth limits…
If by your own estimates of remaining reserves you place us at 50%, isn’t that by definition ‘The peak’? I would suggest your charts try and reflect that reality…worst case they are off slightly…but I think the odds are very much against any type of new world production peak, ever…
Thanks for putting up with my scrutiny!
Here’s data:
Ken Geo,
I model conventional oil separately from unconventional oil (which I define as extra heavy oil plus light tight oil). For extra heavy oil (Orinoco belt an Canadian Oil sands), I use historical production estimates and assume Orinoco will remain at the 100 kb/d rate of the recent past and use the Canadian Energy Regulator’s estimate for future Canadian Oil sands output (so not really my analysis). For tight oil I use my own analysis which you have likely seen more than you are interested. Much of the increase in output I expect will come from increases in tight oil output from 2022 to 2028. Chart below has my conventional model (World C plus C minus LTO minus extra heavy (XH) oil).
The peak is in 2016 at 73.45 Mbpd with cumulative output at about 1300 Gb, the URR for conventional is assumed to be 2800 Gb so the peak for conventional oil is reached prior to the midpoint of the URR (46.4%).
If output followed a single logistic function then output would peak at 50% of URR, this is rarely true in practice. I use a different type of model developed by Paul Pukite.
At link below look at posts by me, start with older posts.
https://peakoilbarrel.com/category/shock-model/
Also your local University may have a copy of a book that has more detail, see link below
https://www.amazon.com/Mathematical-Geoenergy-Discovery-Depletion-Geophysical/dp/1119434297
As to whether there is a new production peak rests primarily with tight oil output in the US particularly in the Permian basin. My tight oil model has tight oil output increasing from 7.27 Mbpd in 2021 (annual average output) to 11.47 Mbpd in 2029, an average annual increase of about 525 kb/d per year. I expect extra heavy oil output to increase by 87.5 kb/d annually from 2021 to 2029 on average. For conventional oil, I expect an increase from 66.54Mbpd in 2021 to 69.54Mbpd in 2029, an average annual increase of 375 kbpd.
Kengeo,
Look closely at those curves, they have had decreasing trends over several periods over the past 55 years, what happened next?
I think we learn more by looking at the trends for 100% of World output. World C plus C output grew by about 1% annually from 2000 to 2019, an annual rate of increase of about 777 kb/d (average output over the period was roughly 76500 kb/d).
Dennis –
Africa and Europe had a minor decline from 1990 to 1993.
The current decline for 15 years seems noteworthy.
Americas had a brief step down from 1973-1976, likely a response to steep production increases in Asia (incl. Middle East). Asia had a major drop from 1979-1985, then a solid 30 years of growth. Asia in decline for 5 years is also noteworthy.
What do you make of the Rystad revision from 1 trillion to 350 million? Paul brought this up yesterday…a couple posts below:
Also, do you believe adequate investment is being made for future discoveries?
This article seems relevant even though it’s a couple years old:
“The world will not have enough oil to meet demand through 2050 unless exploration accelerates” 9-Dec-20
https://www.rystadenergy.com/newsevents/news/press-releases/the-world-will-not-have-enough-oil-to-meet-demand-through-2050-unless-exploration-accelerates/
Kengeo,
I have thought for many years that past Rystad estimates were too optimistic, now they are a bit closer to reality in my opinion. Potentially high oil prices could lead to a revision in the future, but my expectation is that by 2035 at the latest and a best guess of 2030 that demand for oil will start to fall faster than the decrease in supply after the 2029 peak in oil output due to a transition to electric transport. That may lead to a rapid drop in oil prices and even the 3000 Gb URR for World C plus C currently estimated by Rystad may prove too large.
Oil companies will invest what they believe is reasonable. It may be that reserve growth, possible reserves, and contingent resources will be enough without a lot of newly discovered resources. My model has 2600 Gb of conventional discovered resources through 2021, with another 100 Gb discovered through 2041 and 100 Gb discovered from 2042 to 2294. The 2600 Gb includes future reserve growth for all fields discovered from 1870 to 2021. Unconventional resources add another 200 Gb (XH=125 Gb and LTO=75 Gb) for a total of 2800 Gb of discovered resources (including future reserve growth) as of Dec 2021.
I think we will be able to meet oil demand, but oil prices will need to be high form now until 2030 to match demand and supply of oil.
World C plus C and C plus C minus LTO, shorter time scale.
Good chart Dennis. I think your charts are getting a little more realistic these days. Interesting that you show US LTO as the only thing keeping peak oil in the future.
I tried to figure it out from your chart but it is still not clear. That is just how much increase, in barrels per day, do you expect US LTO to increase from where it is today?
Hi Ron,
My tight oil scenario below. Click on chart to make it bigger. Peak is about 11476 kb/d in June 2029, EIA estimate for April 2022 is 7705 kb/d, so an increase of 3771 kb/d from April 2022 to June 2029. Looking at annual averages (which is what I use for my World C plus C scenarios) 2021 US annual average tight oil output was 7286 kb/d and my scenario has 2029 annual average output at 11469 kb/d, so the increase in annual average output from 2021 to 2029 (the peak year) is 4183 kb/d.
So if we call today April 2022 (the latest monthly estimate I have available) , the peak in tight oil would be about 3800 kb/d higher in 7 years time, if my scenario is correct. Note that about 99% of the increase in tight oil output over that period is from the Permian basin.
Thanks, Dennis. Eyeballing your chart you show USL LTO at about 8.5 million b/d currently, increasing to 11.5 million b/d by 2029. That’s an increase of 3 million b/d.
That is not very likely but nevertheless possible. However, that will not be enough even if that is the case. The World less USA is clearly in decline.
Ron,
You’re welcome.
We will see what happens, you may be correct due in part to decline in Russia which will be difficult to overcome, much depends on whether high oil prices leads to more rapid development of discovered resources, as well as greater exploration, and reserve growth.
I realized the x-axis on my previous chart had a strange scaling of 3 year major intervals. Corrected chart with 2 year major intervals attached.
On this chart it is a bit clearer that the increase is 4000 kb/d rather than 3000 kb/d (7500 kb/d in mid 2022 to 11500 kb/d in mid 2029).
Dennis- “demand for oil will start to fall faster than the decrease in supply after the 2029 peak in oil output due to a transition to electric transport….I think we will be able to meet oil demand, but oil prices will need to be high form now until 2030 to match demand and supply of oil.”
It will be incredibly interesting, to say the least, to watch this dynamic play out.
It looks to me like most of the world is waking up to the reality of the mandatory and extremely rapid transition from ICE to EV transport in slow motion, as if running through jello. China and many places in Europe are acting the most alert to this challenge. Things are changing rapidly however, as you can see by keeping track of the global auto industry.
Dennis, though Russian oil is not falling as fast as predicted, it is actually up since that huge drop in April, but the long-term trend is down. No one is denying that.
Russia’s oil is in long-term decline – and the war has only added to the problem
The IEA duly scaled back its forecasts. In its April report it expected Russian oil supply that month “to fall by 1.5 mb/d [million barrels per day]”, adding that around 3 mb/d would be off the world market from May. But in its May report, the agency estimated that Russian oil production declined by nearly 1 mb/d in April and that “losses could expand to around 3 mb/d during the second half of the year”. According to Russian sources, the country’s oil output rose 5% to 10.7 mb/d in June compared to around 11 million in January/February.
That June recovery will be short-lived, at least according to the majority of analysts who have studied the situation.
Dennis –
I think the big disconnect is in the different reserve types (1P-2P-2PC-2PCX).
1P – Existing fields conservative estimate (Proved). ~300 billion barrels (<10 years supply at current production level). 90% confidence level, very unlikely there is less oil remaining than this estimate, right?
2P – Existing fields most likely (not conservative; 'probablly'). This number is a coin flip right? 50/50 chance it's close to being correct. ~550 billion barrels (<17 years at current levels).
2PC – This is essentially a WAG (includes noncommercial volumes, also includes projects under assessment). ~1,200 billion barrels. Provides around 30 years of production. (maybe a 10% chance of being correct?)
2PCX – This is the complete BS number, it includes 'undiscovered fields'. ~1,600 billion barrels. <50 years production. <1% chance of being correct, or something similar…<0.1%…
For the purposes of short term trends (next 5-15 years), using 2P values makes the most sense, some additional assumptions could be made to include a portion of 2PC, maybe half? An average of 2P/2PC (2PC*) yield 900 billion barrels remaining. This works out to roughly 25-30 years and seems like a more realistic value (note that it's still 3 times the 1P value!).
Values above need to be reduced by ~15 billion barrels to account for 1st half of 2022.
Globally, as far as EVs go, the numbers point to around 10 MBpD decrease in oil demand by 2030 (is that what you project?). The question though is where will the 6 x 10^14 watts come from? If it's oil powering the generators then not much really done there. If it's oil making all the solar and wind generating equipment then need to factor that in.
Recommend modeling 1P (300), 2P (300), and 2PC* (300) as separate functions with assumptions on timing and max. annual production contributions (I don't imagine 2PC* will be as abundant as 1P/2P… 1P would likely occur over next 15 years or so, 2P would start in ~10-15 years, and 2PC* would start in 15-20 years…
2P life would be stretched over 20 years and 2PC* life would be stretched over 30 years…my guess is these assumptions don't require any new peaks in global supply…
Let me know if I'm missing some key aspect about the different reserve estimates, or maybe there's some really good reason to forget about 1P/2P and just focus on 2PC/2PCX?
Kengeo,
The 2P estimate is the best guess estimate for discovered resources that are either in production or are expected to be developed in the next few years. If these were the only resources that existed, you would be correct that it would be about a 50/50 chance that actual output would be either above or below this number, but this is not the case. There are also possible reserves with between a 5% to 50% probability that they will be produced and there are contingent resources which either are not commercially viable at oil prices of December 2021 or they are known but have not been fully evaluated (these are the C part of the 2PC estimate and it is the best guess or mean estimate for contingent resources). There is also reserve appreciation which occurs as resources are developed and more knowledge of existing fields is gained and as better techniques and technology is developed, in the US this accounted for a 63% increase in 2P reserves from 1980 to 2005. Finally there could be new field discoveries of oil as has been the case lately on the Atlantic coast of South America and could potentially occur elsewhere.
Note also that 3000 Gb for World C plus C lines up pretty closely with Jean Laherrere’s August 2018 estimate (did you look at his paper?) of about 3000 Gb, his estimates have tended to be pretty conservative in the past, likely this is still the case.
The minimum I would expect (with likely a 68% probability this estimate will be too low) for World C plus C URR is 2700 Gb.
I don’t see much need to divide things up as you suggest, but feel free to create your own analysis.
For my current conventional model, I have about 1443 Gb of cumulative production at the end of 2021 and 476 Gb of producing reserves at the end of 2021, just a bit less than the Rystad 2P estimate of 548 Gb. Cumulative production plus 2PC is about 2660 Gb, close to my 2700 Gb minimum estimate(included in the 2700 Gb is 200 Gb of unconventional resources), this 650 Gb of contingent resources is likely to be added to producing reserves over time as resources are developed. The extra 300 Gb that is my best guess comes from a combination of new field discoveries and reserve appreciation. Note also that my model has 2700 Gb of conventional resources discovered by 2040, if we assume all exploration for oil ceases after that date because oil demand plummets as I assume, the model changes very little up to 2040, though URR drops to 2886 Gb. Chart below has cumulative World output for my shock model where I assume new field discoveries of conventional oil stop at 2700 Gb in 2040.
Chart below has Cumulative C plus C for both conventional and unconventional oil.
Dennis, there is something wrong with those last two charts you posted above. A chart of cumulative production should not look like that. I take cumulative production to be the sum total of all oil ever produced. If so, then that last curve should increase by about 28 to 30 billion barrels every year for the last decade or so, less before that but increasing every year by the amount of oil produced that year.
EDIT: Sorry I completely missed the time scale. I just just naturally assumed that “cumulative” meant how much oil had been produced to this datae. I had no idea one could the term could be associated with a future date.
Hi Ron,
For a scenario of the future we guess at future output that has not yet occurred. So the cumulative chart I present simply assumes that my guess about future output is correct. Clearly that will not be true, but if it were, cumulative output would look like the curves I presented.
Sorry Dennis, but I misread your chart. I just assumed you meant “cumulative’ instead of “projected cumulative”. My bad. I should have read your text a little closer. But I have been quite busy these last few days and have neglected following your posts as I should have been.
However, I still find the chart rather amusing. You have cumulative production, in130 years from Dec 2021, exactly doubling. Normally that would put the peak at Dec 2021, exactly half of what had been produced at that time.
That being said, I find the idea of current recoverable reserves being almost 1.5 trillion barrels mind-blowing. No, no, no, mind-blowing is the wrong term. “Absurd” is a far better term.
Please note, it is my contention that infill drilling in all the giant fields ,with horizontal wells, creaming the top of the reservoirs, has put the peak well past half of recoverable reserves. That is the reason for my outlandish language concerning your estimate. And I must add that I am more convenced than ever that this is the case.
Ron,
We will see if Rystad and Jean Laherrere are correct, each has URR at about 2900 to 3000 Gb. My cumulative output projection has total output at about 2750 Gb in 2100 and about 2850 Gb in 2150. When the peak occurs in 2029, projected cumulative output will be 1676 Gb with URR for scenario at 2878 Gb, so we would be at 58% of URR at my projected peak of 84.9 Mbpd in 2029. After that the projection is for fairly rapid decline (2% average annual decline rate from 2030 to 2040) from 84.9 Mbpd in 2030 to 68.9 Mbpd in 2040.
Updated forecast with some decline scenarios:
Doesn’t seem like US tight oil to the rescue anytime soon…
Correction on cumulative C+C.
I have 107 Gb at the end of 1959, 270 Gb at the end of 1972, 1387 Gb at the end of 2019 and 1443 Gb at the end of 2021.
Steve
Great question, not an easy answer. However I can tell you what the model tells us up to 2019.
Oil production data for the years prior to 1960 is difficult to find. However I have two numbers for 1930 and 1940. A NY Times article from 1930 says that production in that year was 3,860 kb/d. Another source provided production for 1940, 6,301 kb/d. For these years, the model estimates production of 5,700 for 1930 and 8,438 kb/d in 1940. So the model is on the high side, 48% for 1930 and 34% for 1940. Not until 1960 does the model follow world production fairly accurately.
According to the model, C plus C production up 2019 was 1,451 B barrels. For 2020 and 2021 add in an additional 55 B barrels, total. The URR, Qo, is as shown on the chart, 3,382 B barrels.
To put the model error in the early years into context, it shows that world oil production up to 1940 was 77.9 B barrels, roughly 5% of the total up to 2019.
Steve
On account of your question, I have dug deeper to find earlier data and just happen by fluke to find it in the 2022 BP report. I have replaced/updated the second EIA chart in the post and will revisit/update my response to you tomorrow. It is very late here.
Happy Independence Day to all.
Steve
According to the model, C plus C production up 2019 was 1,409 B barrels. For 2020 and 2021 add in an additional 55 B barrels, total. The updated URR, Qo, is 3,148 B barrels.
Up to 2021, production is 46.5% of the URR. Using Dennis’ estimate of URR of 3,000, production to 2021 would be 48.8% of URR.
Ovi,
Thanks for your time and reply. I had an email exchange with Jean Laherrere on this subject matter as he has provided a different chart on Global Reserves. I also included a link to this new post, which I believe he follows.
Jean states that total cumulative global oil production as of 2020 was 1439 Gb, which confirms your data of 1409 Gb for 2019. If we assume another ~28 Gb for 2021, we are now at 1467 Gb.
Jean (and I) don’t give much confidence in the 1739 Gb of Reserves or Rystad’s newest revision down to 1572 Gb. Rystad has the United States at 193 Gb… LOL. The real question is, what are the folks at Rystad SMOKING to come up with 193 Gb of U.S. oil reserves??
I have been discussing oil reserves with someone in the Shale Oil Industry (Oil Reservoir Engineer), and I can tell you, that they believe Shale Oil Reserves are a COMPLETE MESS and are overstated. When we add this to the knowledge from retired Petroleum Reservoir Engineer, James Dietrich’s book: TOO MUCH BY HALF: The Coming Cut In Proved Oil Reserves, he said that when he worked in Russia, “One Barrel of Oil Reserves Counted as Three,” you know the world has been totally misled to the reality of how BAD the situation is.
So, we can continue to put out these ROSY estimates to make us sleep better at night, but I look forward to the time when the RUBBER HITS THE ROAD and we find out we have been HOODWINKED… LOL.
steve
Steve,
You want to make sure you compare apples with apples. Jean Laherrere focuses on 2P reserves (what he calls technical reserves, currently Rystad estimates about 550 Gb of 2P reserves for the World, when mean contingent resources are added (discovered resources that have not yet been added to probable reserves) the estimate is called 2PC (where C stands for Contingent) an increases to 1200 Gb. The 2PCX Rystad estimate includes all 2PC resources and adds roughly 400 Gb of new field discoveries and reserve appreciation. The Rystad estimate for 2PCX of 1570 Gb and cumulative C plus C output of 1440 Gb at the end of 2021adds to about 3010 Gb for World C plus C URR.
In August 2018 Jean Laherrere estimated about 2600 to 3000 Gb for World C plus C less extra heavy oil and about 215 Gb for extra heavy oil. See pages 15 and 16 of paper linked below for World C plus C less extra heavy oil estimate and page 115 for Orinoco and Canadian oil sands URR of 215 Gb.
https://aspofrance.org/2018/08/31/extrapolation-of-oil-past-production-to-forecast-future-production-in-barrels/
If we take the mean of the C plus C less XH URR estimate (2800 Gb) and add extra heavy oil URR estimate (215 GB) we get about 3000 Gb for World C plus C URR.
Note however that an HL analysis of World C plus C minus unconventional oil (XL plus LTO) for 1993 to 2019 suggests a URR of World C plus C minus XH minus LTO of 2350 Gb, far less than the 2800 Gb estimate that I use. My estimate for unconventional resources is about 200 Gb so this low estimate suggests a URR of 2550 Gb for World C plus C URR. I doubt this is correct but might define a lower bound for World C plus C output for the 95 % confidence interval with a secondary peak lower than the 2018 peak at perhaps 81 Mb/d in 2028.
Is this the reference for Rystad?
https://oilprice.com/Energy/Crude-Oil/Total-Global-Recoverable-Oil-Reserves-Are-Falling-At-An-Alarming-Rate.html (Jul 03, 2022)
Continuing to overlook non-US/Canadian unconventional hydrocarbon production will perpetuate ongoing underestimating of future oil/gas output.
Examples …
A new takeaway pipeline from the Vaca Muerta will boost that region’s viability enormously. With the strides made in water re-use for frac’ing and the growing use of non dried, local sand sourcing, the economics for that region have been greatly enhanced.
If the social/economic pain is especially severe in the UK this winter (a likely scenario), Cuadrilla’s stymied efforts in the Weald Basin could be revived.
If the Port Kembla terminal happens to be supplied by US LNG (as is possible at the moment), outraged Aussies might be spurred to boost the very promising Beetaloo Basin.
India just announced a $2 billion investment to kick start unconventional gas development in West Bengal.
China is making steady progress in boosting Fuling output.
The Bazhenov continues to progress in output, with future potential virtually unfathomable.
Different world we are living in, folks.
Old ways of ‘looking at things’ just ain’t gonna cut it.
(Ovi, re-frac’ing with expandable liners is growing and increasingly successful in use. A company just re-lined 27,000 lateral feet in 3 wells in Ohio … a record. At $100/bbl, a 100,000 barrel bump per well grosses over $10 million additional revenue.
Lottsa potential business there, all the moreso as diversion/completion technologies have greatly improved the past few years).
Squeezing the last drops out of the sponge. While very interesting, the hyperbolic declines once predicted for the shale plays have actually turned out to be exponential declines. It is great to get the extra barrels but you can’t defeat physics and you cannot pump these lateral wells sideways to over come the 500 hundred feet of hydrostatic pressure which ultimately kills the production of these wells prematurely. I give the companies credit for thinking creatively to squeezed out the last drop. It also tells me one significant fact. the Shale Companie’drilling inventory is dwindling rapidly.
On a more pleasant note: Happy July 4rth to all and I hope those on this site who celebrate the Holiday have a fun,safe and relaxing time.
Do you have any reference material on horizontal shale wells now (or ever?) declining exponentially? Comparisons between vintage decline paramteres in wells of the same formation (through the present) would appear to indicate a change in profile, but continuing use of a hyperbolic (with a transition into a exponential tail) still being the most reasonable method to forecast. Work released as far back as the a PTTC conference in Morgantown WV in the early days of large scale shale development demonstrated that across multiple natural gas producing shale formations at that point in time. Including the transition from infinite acting to finite drainage acting behavior (hyperbolic to exponential). I haven’t seen any work of substance contradicting that analysis to date, hence the question as to the source.
Reservegrowthrulz.
I think LTO survivor may be referring to early predictions of hyperbolic decline for 30 years or so, the data suggests that many tight oil wells transition to exponential decline at about 7 to 8 years. The old hyperbolic assumption for 30 years leads to inflated EUR estimates (roughly 13% larger than what is realistic by my estimate for 2019 Midland basin Wolfcamp wells).
I agree that using a hyperbolic fit for the early part of the well’s life (month 4 to 85 or so) with a transition to exponential decline at around 12.5% per year gives a reasonable estimate for the Spraberry, Bonespring, and Wolfcamp formations of the Permian basin.
The work presented in conference back in 2011 had already quantified the switchover from hyperbolic decline to exponential, and quantified it. I haven’t been paying as much attention as I should since back early in the secondary phase of shale development, and thought maybe something new and exciting had happened that I missed.
Correct Dennis. I do have some proprietary information but cannot share. The older wells are experiencing exponential decline mainly due to the lower pressures and the inability to pump these wells from TVD (true vertical depth). Hopefully in the future I will be able to share more definitive numbers.
I have also experienced the re-fracing of certain reservoirs and I agree that the older wells lend themselves to this application in “some” instances as they had been under-stimulated. I still think it ultimately comes down to bottom hole pressure and I have seen several ideas recently where some highly qualified innovators are beta testing some applied materials through injection. They are seemingly working in some reservoirs but have been tested in vertical wells only at this time.
The transition between hyperbolic and exponential is described by Ornstein-Uhlenbeck random-walk diffusion process.
Thanks LTO Survivor and Reservegrowthrulz,
Great to get insights from those who are involved in the oil industry.
LTO Survivor,
Aren’t the horizontal wells drilled toe up so the wells can flow by gravity to the bottom of the bend, not sure if it is possible to get the well lifted from the bottom of the bend, but I assume these wells have some kind of lift (hydraulic or otherwise) near the end of life.
It seems some of the older Bakken wells (first flow 2005) are still being pumped at less than 8 bopd. Though this may be the way shale profile does its numbers where even plugged wells are included in the denominator. About 20 of 29 wells were still producing in July 2021, if we assume about 7.5 bopd for the 29 well average, the the average output of the 20 producing wells would be about 11 bopd at 191 months from first flow (15.9 years).
Based on comments by you and Mr. Shellman, I have used 20 bopd as end of life for Permian wells, I wonder if $100/bo changes that calculation?
Coffeeguyzz
Thanks for confirming the re-fracing info. Where is the extra oil coming from. Does the refrac open new pools or does it enlarge the previous pathways that the original frac created or both?
Ovi,
The info that is out there strongly implies that refracs are targeting under stimulated regions along the wellbores.
Up until about 5 years ago, fully 30% of the perforation clusters produced virtually no hydrocarbons. While that number is now probably under 5%, there still exists a wide range of productivity amongst the clusters due to many technical, non geologic (primarily) reasons relating to effective fluid/proppant distribution.
A trend of single entry clusters – situated at the 12 o’clock position – seems to be gaining in industry acceptance.
That this is an ongoing issue – after 20 years of frac’ing a hundred thousand wells – should display the extent of the technological complexity in these matters.
Relining can bypass/isolate sections that have been effectively stimulated – originally – while exposing hydrocarbon-rich rock to newer stimulation processes.
Ovi We believe we are able to stimulate parts of the wellbore that were never stimulated in the first place. We feel like you will get incrementally more oil but it is a shot live production increase ultimately lower bottom hole pressure takes over.
LTO Survivor,
Is the refrac profitable at current oil prices? Do you see much of this in the Permian basin?
https://www.market-ticker.org/akcs-www?post=246265
The often overlooked aspect of our energy predicament. Refineries, Pipelines, Wind Turbines, French Fry oil, etc require long term investments and paybacks.
If you start telling investors that “we are running out of oil” or “we are converting to solar panels”….are they going to invest in the long term?
“If you start telling investors that “we are running out of oil” or “we are converting to solar panels”….are they going to invest in the long term?”
We already know the answer, and it is-
Yes, but at a very underwhelming rate thus far.
It will pick up late in the game, as the peak oil shortfall becomes more serious/obvious.
Once all other options for short term gain are exhausted.
If you have to invest for over a decade, you have to cross your fingers that some YAHOO doesn’t get elected and change the rules.
Politicians across the “democratic’ nations have consistently incoherent strategies that change every election cycle.
Much of the big investment decisions in the electric space are being driven by utilities, who have very long project investment horizons and a solid customer base.
The grid interconnection queue backlog for electrical generation projects is very long.
The government has been slow to grab the bull by the horns in order to streamline and upgrade national grid policy- in this county. History of poor national sense of purpose/vision on energy policy.
I noticed over the years of looking at reserve figures for countries and companies that where the numbers were fairly reliable, such as UK, Mexico, Brazil, western IOCs, revisions have been tending to be slightly negative in more recent years. Prices have an effect but the reserves lost during low price years are not fully restored as the price recovers. The price effect is less and less as reserves mature. LTO and shale gas reserves all seem to have been overstated originally and are gradually being revised downwards as more full life cycle operational data becomes available.
Ovi – I may have missed something but your link to Rystad is to last year’s report in which reserves also dropped 9%, the reason given was a switch from field based to well based analysis. The report from June 30th this year is here:
https://www.rystadenergy.com/newsevents/news/press-releases/total-recoverable-oil-worldwide-is-now-9-lower-than-last-year-threatening-global-energy-security/
I’m not sure where they are getting their climate science from but CO2 is not removed from the atmosphere in 80 years as they state.
George
Thanks for the latest update. I have updated the post to refer to the latest report.
Unfortunately the readers of the post on other sites, such as seeking alpha, will not get the update unless they come to POB.
G. Kaplan,
I like this format of reserves being presented from Rystad, and the feel that the number crunching guys are doing their best putting numbers into the “data cube” based on the facts they can gather. The conclusion that the energy transition is not going fast enough, given all the warnings, is hardly surprising. The 35 billion barrel a year consumption figure globally is very high indeed; just look at Continental Europe currently for how a scramble for fossil fuels in a (potential for now) crisis looks like.
George you are right. The half life of a CO2 molecule in the atmosphere is only five years. After all CO2 is highly soluble. Witness the soda water you drink without any guilt. But the atmosphere is only in equilibrium with the top 100 metres or so of the 3,700 metre average water depth of the oceans.
Dammit, Archibald, this is the age of the internet where stats on just about anything is just a few clicks away. You cannot just make up shit and get by with it.
Greenhouse Gas Lifetimes in the Atmosphere
Carbon dioxide has a half life of about 120 years, methane 10.5 years, nitrous oxide 132 years, and the CFCs 16 to more than 500 years, as shown in the accompanying table.
Apparently you missed the entire peak oil movement if you think that folks can’t just make shit up and get away with it. Peak oil #6 in 2018 being proof of exactly that among the claimants of the first 5.
Adam, oil peaked in 2005. https://web.archive.org/web/20210714083822/https://peakoil.com/forums/the-world-outside-america-has-been-in-peak-oil-since-2005-t78054.html
Of course peak oil happened in 2005. After Colin Campbell and Laherrere said it would happen in 2002. And then the IEA decided it was 2006. And then TOD called it for 2008. I believe Ron himself called the 2015 peak oil. And then the most recent of this century was in 2018. I’m still a big fan of the global peak in 1979 myself, that was a humdinger, and lasted for like 15 years. All of the peaks this century, claimed or actual, have been lightweight nothing burgers.
Pointing to the oil industry circa 2022 and saying “this is fine” is a major source of copium. Ask your medical professional for ways to quit.
I don’t recall anyone saying that the oil industry circa 2022 is fine. Certainly I haven’t, although it is operating from a different financial perspective than it did during the ramp up in US oil and gas production. The industry loves the high prices. We always have.
Ron,
A good paper on this at link below
http://climatemodels.uchicago.edu/geocarb/archer.2009.ann_rev_tail.pdf
Of the carbon emitted by burning fossil fuel, about 65% to 80% is removed by the carbon cycle of the planet over about 200 to 2000 years, the remaining 20% to 35% of carbon remains in the atmosphere for about 10,000 years. This long tail of carbon does not follow the exponential decay model with a half life of 120 years.
Archibald,
Nonsense. You expose your ignorance with such a comment.
Not wanting to add too much to what should be in the other thread, from Skeptical Science which is run by climate hysterics: https://skepticalscience.com/co2-residence-time.htm
The first sentence: Individual carbon dioxide molecules have a short life time of around 5 years in the atmosphere.
Archibald, You have no expertise in statistical physics. A non-sequestering molecule such as CO2 has an incalculable half-life, due to the nature of diffusional random walk.
And zero interest in statistical physics whatever that might be. Are your saying that Skeptical Science is wrong? Meanwhile CTL is coming: https://www.spectator.com.au/2022/07/climate-change-a-religion-built-on-blind-faith/
And Paul you have no expertise in geology. Where the nature of diffusional random walk wasn’t used by Fetkovitch to explain or demonstrate the transition from infinite to bounded radial flow in a reservoir. Do you still pretend to know anything about reserve growth? 🙂
Archibald
Your views on Climate Change are preposterous. I could not imagine lying to myself like that.
However, I agree in USA and Australia things are going to go to Coal to Liquids.
Australia needs the USA military to avoid being organ donors to the Chinese Communist Party.
USA would become a SUPER DUPER Energy Powerhouse with Australia as the 51st state, in a world of declining resources
The USA Navy picked up on this several decades ago. That is why the HMAS Sydney and HMAS Melbourne are a part of the US Naval 7th fleet.
You heard it here first!
Reservegrowthrulz,
See
https://www.researchgate.net/publication/280326123_A_simple_model_of_gas_production_from_hydrofractured_horizontal_wells_in_shales
Where an equation similar to Fick’s First Law is used. Paul did his PhD in electrical engineering studying semiconductors and is very familiar with diffusion processes. The Ornstein-Uhlenbeck (O-U) diffusion process applies quite well to tight oil and shale gas well profiles, though an Arps hyperbolic with a transition to exponential decline also works well. Note the O-U process has a similar analytical form to the function used by Patzek with a reciprocal of the square root of time decline rate.
Reserve growth is discussed in detail on pages 69-84 of Mathematical Geoenergy (Pukite et al, 2019).
Archibald has zero credibility in the world of reality/science.
He has beliefs which interfere with vision.
The motivation- its called vested interest.
His beliefs are akin to someone who does not acknowledge the finite nature of oil, despite all the evidence.
David Archibald,
Here is the rest that you left out (which follows that first sentence):
However, when they leave the atmosphere, they’re simply swapping places with carbon dioxide in the ocean. The final amount of extra CO2 that remains in the atmosphere stays there on a time scale of centuries.
Some analyses find that a significant fraction (20 to 35%) of carbon emissions remains in the atmosphere for 7000 to 10000 years (about 70 to 100 centuries).
My question is, what countries will go into serious decline that will cause the curve to bend down? I tend to think Kuwait and UAE may be candidates for OPEC (of the big five). For Non-OPEC, I speculate that Mexico will continue it’s downward curve after a decade of flatlining. Maybe Columbia and China will go back to their decline phase as oil prices drop. But also consider this, were about to go into a recession starting 2023. This will bring down oil prices by October. I’m thinking $80 would be the first breakdown marker. Then eventually $60 by June of 2023. This de-incentivize Permian tight oil companies from during further into New Mexico and letting the gains of shale oil flatline. Thus America, will lose another 1/2 mmbls/day by 2024. We should consider that Russia, with the lack of investment by both government, private enterprise and sanctions will be following that down curve for a while. They may be able to flatten it once the Ukraine war ends someday, but it will years or decades to build the good wlll they need to bring investment back in.
Why oil prices should crash to 60$ when you loose millions of bpd production in just one year?
We’re running on SPR oil already, so a few million bpd less doesn’t matter?
In dollar terms oil is going to crash. However in say euro terms which is sitting at 1.03 to the dollar this morning. Down another 100 points over night oil is going to be more expensive.
I’m expecting the Euro to dollar exchange rate to go to 0.80 or below. Not in a straight line but over next year or so.
Nothing the ECB can do about it. Because it’s not about interest rate differentials. It’s about actual dollar bank deposits on balance sheets not the laundry tokens created at central banks.
Is there a carry trade possible now?
Lending € for low interrest rates, swap into $ and buy bonds with higher interrest?
That would sink the €, no matter what the ECB does besides raising interrest rates into instand depression level. And it would give your 0.80 fast.
Swaps and derivatives and all that kind of stuff require collateral. Which is why when there is a dollar shortage. Like there is currently. T-bills are bid below FEDS funds rate.
Because you have to have good collateral to borrow dollars. Collateral is in high demand.
You see crypto blowing up because lack of collateral to roll positions.
Same thing coming to the oil market.
And currency or FX markets.
Lack of dollar funding.
I think the oil turbulences are on the same mechanism – speculators blown out of their positions. It’s still a speculation market, other than the natgas market. There are some regions with: No matter how much money you put on the table you won’t get any gas.
These price regions will be round about 300$/barrel with oil, when I just compare the heating value to nat gas and the price paid here in Europe.
2yr is at or above the 10yr
https://home.treasury.gov/resource-center/data-chart-center/interest-rates/TextView?type=daily_treasury_yield_curve&field_tdr_date_value_month=202207
Currently the curve is down, up, down and up from 3 Years to 20 years, then down again at 30.
see screenshot below (click on it to enlarge)
chart for July 6, 2022 treasury yield curve
click on chart to enlarge
Eurodollar is a derivative of Libor 3 month interest rate, Libor 3 month rate was very low while oil prices were very high from 2011 to 2014. When oil is short, oil prices will be high regardless of what happens with Libor rates.
IMF April 2022 World economic outlook expects World real GDP Growth of about 3.6% in 2022 and 2023. The World Bank Global Economic Prospects from June 2022 forecasts 2.9% growth in 2022 and 3% growth in 2023. Like all forecasts of the future, these will likely be incorrect, often they are not far form the mark, typically within plus/minus 1%.
Just for thought:
When in the winter nat gas is still on short supply, many countries will de- mothball their old oil burning emergency power plants. Especially when oil crashs. There will be a lot of new demand.
Eurodollar was in expansion during 2011-2014. You had a upward sloping yield curve. That’s not the case today.
Today the yield curve is inverted 3 years out.
Speaking of yield curves treasury yields. The 2’s and 5’s have now inverted again.
Oil is going to get slammed.
By a lack of supply of dollars.
All ok – there are still enough $s to bid up the multi trillion NASDAQ air market.
And still no relief to natgas and electricity prices here in Europe. That’s where prices go when there are supply problems and not just speculation as in the oil market. Oil at 60, then at 300. And then 80 again… I think we’ll see much volatility.
HHH,
Eurodollar is best represented by 3 month Libor rate as I imagine you know.
Here is the 3 month Libor from Fred using link below
https://fred.stlouisfed.org/series/LIOR3M#
Covers 2011 to 2015. The upward slope that you claim (I guess from 2013Q2 to 2015Q2) is from 049% to 0.57% so technically an upward slope, most would call this flat.
Of course there was also a drop from 1.09% for 2012Q2 and over the entire period the trend for libor was down not up. Click on chart to enlarge.
Ovi, why is diesel consumption falling?
Ovi,
My thinking is that adding loglets to fit past production only produces nice looking graphs of past production, but does not add anything to predicting future production. Dennis some time ago said that Robert Rapier’s analysis shows that the logistic model has not been able to predict the peak before it arrived.
https://en.wikipedia.org/wiki/Hubbert_linearization
See the link to oildrum post by him.
I was aware of this drift in the peak date already in 2003 and had an email exchange with Michael Lynch on it, as I recently wrote here. In my February 2022 presentation, I showed that the peak data moves into the future some fraction of a year as we progress through each year and by this method one could predict when the peak year will be.
Let’s say the formula gives 1/4 year advance for each year, then if the prediction in 2005 is that the peak will arrive at 2015, the actual arrival is obtained from
P= 2015 0.25 (Y-2005)
Setting P=Y gives P=2018.75. The actual drift is not 1/4, but was slower in the early part of this century and rose quite a bit as the fracking started, as I demonstrated in my video.
This kind of drift has also been noted by David Rutledge and is documented in his book, Energy, Supply and Demand. He likes to use the logit transform (also called the Fischer-Pry transform), but this does not seem to have any advantages to the traditional method of Hubbert, who also discussed the logit transform in his 1982 report.
I will add that the use of loglet analysis is appropriate when there exists a separate set of data in the various oil provinces of a region, such as Alaska, GOM and tight oil in the USA and conventional and tar sands in Canada.
George Kaplan split the GOM production to shallow, deep and ultra deep water. Perhaps they exist somewhere but I have not found the separate data for each part of the Gulf of Mexico.
Finally my view is that there is no point in trying to predict what will happen by 2040 or so (even if I have done that also) as the world will have changed greatly as we move into energy scarcity and that is happening right now. The same is true in my view on the prediction of natural gas peak, as there will be concerted attempts to replace oil with natural gas and coal in the near future.
And another final comment. Michael Klare wrote the book Resource Wars and I read it when it came out in 2001. I tend to view the present war in Ukraine in this broader perspective. Namely the neocons in the USA want a regime change in Russia in order to get access to Russian natural resources (in the same way as what happened in Iraq) and Kremlin tries to conquer the mineral riches on Donbass and the fertile land of southern Ukraine. Getting the Black Sea ports is a plus.
I don’t think Dennis gave any real objection to the hubbert curve, he found one case it was wrong because spraberry was discovered. It’s hubris to claim the hubbert curve is wrong or whatever this website does is better.
Modeler, the about discussion of Robert Rapier was over a year ago, before the time you have been posting here at least to my knowledge.
Modeler is most likely ShortOnOil, the pseuodym he stuck with for year at peakoil.com before infiltrating this place under various names. I think he was Mustang or something most recently. He’s the ETP halfwit who got laughed out of technical review, and then erased his entire website when the laughter grew too loud for him to ignore.
Shortonoil is dead they say.
Seppo
There are people who disparage analysis and there are those that do it to better understand what is happening. I belong to the latter group.
I think that Hubbert would disagree with you. He did a pretty good Job of predicting the first US peak. I think what most people do not understand is that Hubbert’s theory had a lot of embedded assumptions that may not still be understood.
I understand that he collected a lot of discovery and well profile data and then rationalized their typical shape as being close to a logistic function and that there was a delay between discovery and the peak. So what were the assumptions that made his prediction come true, 15 years later.
Vertical drilling would continue, large pools of oil with a steady rate of drilling new wells, natural pressure decline and similar geology. I am sure there are others. We now live in a world of horizontal drilling, water flood, fracking, etc., etc. Throw in Canadian oil sands which are more closely related to a mining operation. When one of those basic underlying assumptions change, you can forget Hubert.
Above you note “I will add that the use of loglet analysis is appropriate when there exists a separate set of data in the various oil provinces of a region, such as Alaska, GOM and tight oil in the USA and conventional and tar sands in Canada. This statement is essentially saying what I have noted above, the assumptions/characteristics within each region are the same.
I do not that think that Hubbert can be applied to the Canadian oil sands because they are not pressure driven fields. The oil sands are primarily an investment decision. More investment, more mining, more production. Surface mining is the ultimate Seneca cliff. Already a number of fields were mined out and refilled with the original sand, having been cleaned by removing the oil.
A little known fact of the oil sands is that each particle of sand has a layer of water that separates the bitumen from sand. That is why the oil sands are dropped into hot water. The bitumen melts, the sand drops to the bottom of the pot and the bitumen floats. That may be a bit of an over simplification but it is close to what happens.
The main thing to understand when doing an analysis is to understand its limitations.
To prove your point that predicting the peak using loglets is difficult, with which I agree, I attach the same chart as in the post for the EIA data. However in this case, I just use the data up to the year 2010. In other words, the year is 2011 and the latest 2010 data is published, analyzed and back then we would be saying that peak oil will occur in 2017. I have left the real data up to 2019 in the chart.
Also on Sunday morning I woke up and said to myself, we need to update this site. Presto an analysis to fill the spot and get some updated comments from our great participants.
😄 😄 😄 😄 😄
Ovi, here’s a better graph.
https://iili.io/j7ImbI.jpg
Ovi, my aim was to point out some issues with the hope that open discussion would bring to light the weaknesses and strengths of these models. I know that Jean Laherrere also uses loglet analysis to smoothen out the graphs. I have done the same, but avoided putting them to the net. There are technical papers written by people from Iran that have used multicycle logistic model to segregate the separate time periods when Iran’s oil production dropped and subsequently rose. That is, the war between Iran and Iraq and the sanctions. Why would they be better that the logistic method based on all the data? I do not see what such multicyclical models add to the effort.
I agree with you that the logistic model may not apply to tarsands, but my aim was to stress that the data in Canada is segregated and this is a necessary (but may not be sufficient) condition to apply the method. You said:
“Vertical drilling would continue, large pools of oil with a steady rate of drilling new wells, natural pressure decline and similar geology. I am sure there are others. We now live in a world of horizontal drilling, water flood, fracking, etc., etc. Throw in Canadian oil sands which are more closely related to a mining operation. When one of those basic underlying assumptions change, you can forget Hubert.”
“More investment, more mining, more production. Surface mining is the ultimate Seneca cliff. Already a number of fields were mined out and refilled with the original sand, having been cleaned by removing the oil.”
This may be a good place to discuss secondary, tertiary, and advanced oil recovery. My understanding is that water flooding is the primary secondary recovery method. To keep up the pressure of the gas cap falls into the same group. Tertiary methods might include the use CO2 to reduce the viscosity and surfactants to reduce surface tension. Often these are also called enhanced oil recovery methods, so the line between these two categories is not clear. I disagree that these will invalidate the use of the logistic model, since there has been a continuous development of these methods over a very long time. They are indeed the reason the peak date has been moving to the future. The last rabbit that has been pulled out of the hat is to use horizontal drilling in conventional reservoirs. Jean L. and Colin C stressed that this only makes the decline faster when the water oil interface reaches the well bore. But, if the drill bit can be guided with precision, then why not drill another horizontal well and abandon the first one. My guess it is this that has led to reserve growth more than any other factor, but I am happy to be corrected on this point, if my suspicions are wrong.
Finally people are taking about the present oil crisis being the result of under-investment. I have not read many discussions about what kind of investment is lacking. I suspect that it is exploratory drilling. Remember when Shell drilled a dry hole in the Chukchi Sea to the tune of 7 billion dollars. Quite soon after that they reduced the staff of their exploration department and previously BP had reduced theirs from 700 to 100.
Back to tarsands, only 10% of the oil from tarsands is produced by mining. The rest is by SAGD. Ovi, I know that you know how the tarsand oil is produced and wrote a sentence that lumped many things together. In the link below is the SAGD operation at Christina Lake. Not much environmental damage as the water to make steam is recirculated https://www.megenergy.com/operations/christina-lake/
Great post Ovi. Great topic. Can’t wait to peruse the comments on this one.
FWIW- By this account “Approximately 80% of oil sands are recovered through in-situ production.”
https://www.alberta.ca/oil-sands-101.aspx
I believe in-situ is SAGD. And I assume the other 20% is mined.
Energy Recovery from Oil Sands Reservoirs
https://prism.ucalgary.ca/bitstream/handle/1880/112959/ucalgary_2021_wang_jingyi.pdf?sequence=4&isAllowed=y
Enhancing the evaluation of Energy Investments by supplementing traditional discounted cash flow with Energy Return on Investment analysis
https://www.sciencedirect.com/science/article/pii/S0301421522001781
As we get further and further into this post-peak oil era, the truth begins to slowly creep out.
Is Saudi Arabia Exaggerating Its Oil Production Potential?
For many years now, Saudi Arabia has been wildly exaggerating every metric connected to its oil business, from how much crude it can produce to its level of reserves and everything in between, as analyzed in depth in my first book on the oil sector in 2015 and the latest one in 2021. Why does it lie so much and so often about these figures? Because without the power it has in the world directly associated with its crude oil production, spare capacity, and reserves it has no real power at all, so enormously exaggerating each of these figures is geared towards puffing itself up in terms of its geopolitical importance. The problem Saudi Arabia has right now, however, is that the U.S. and all other developed market countries whose economies are suffering under the weight of ongoing high oil prices are pressuring Riyadh to deliver on these claims, in order to bring these oil prices down. If Saudi Arabia had not been lying all these years about the amount of oil it can produce then it will not have a problem, but it has been, so it does.
To the figures themselves, then, and firstly, Saudi Arabia’s crude oil reserves figures. At the beginning of 1989, Saudi Arabia claimed proven oil reserves of 170 billion barrels, but only a year later, and without the discovery of any major new oil fields, the official reserves estimate had somehow increased by 51.2 percent, to 257 billion barrels. Shortly thereafter, it increased again to just over 266 billion barrels, a level that persisted until a slight increase in 2017 to just over 268 billion barrels. On the other side of the supply-demand equation, from 1973 to the end of last week, Saudi Arabia pumped an average of 8.192 million barrels per day (bpd) of crude oil. Therefore, taking 1989 as a starting point (with 170 billion of crude oil reserves officially claimed in that year), in the subsequent 32 years Saudi Arabia has physically pumped and removed forever from its oil fields, a total of 95,682,560,000 barrels of crude oil. Over the same period, there has been no significant discovery of major new oil fields. Despite this, Saudi Arabia’s crude oil reserves have not gone down, but rather have actually gone up. This is a mathematical impossibility.
Secondly, Saudi Arabia’s spare capacity figures, which are a function of Riyadh not just lying about the numbers outright but also engaging in semantic trickery involving the use of various oil market terms interchangeably, despite their not meaning the same thing at all. To be clear here: the official Energy Information Administration (EIA) definition is very specific about what constitutes ‘spare capacity’ in the global oil markets, and it is as follows, directly quoted from the EIA rules: “Spare capacity is production that can be brought online within 30 days and sustained for at least 90 days.” That is it; that is what spare capacity is, no more and no less. However, Saudi Arabia includes within its own use of the term ‘spare capacity’ every drop of crude oil that it can get hold of: including oil supplies in storage, supplies that can be withheld from contracts and re-directed into those stored supplies, and any oil that it can buy through brokers in the spot market and then sell on as its own. Exactly this semantic trickery was used to cover up the actual supply shortfalls in the aftermath of the September 2019 attacks by the Iran-backed Houthis on Saudi’s Khurais and Abqaiq facilities and later attacks.
In reality, as written in the 2015 book: “The country has often stated that it has a spare capacity of between 2-2.5 million barrels per day (mbpd), with the capability to ramp up its production to about 12.5 mbpd in the event of unexpected disruptions elsewhere. However, it is very unlikely that it could pump at these levels for a sustained period of time, and this idea has been supported by comments from Gulf officials at OPEC, which stated in the midst of Iraqi supply fears that Saudi Arabia could ramp up output by another 1-1.3 mbpd in a best-case scenario. Officials also mentioned that production of 11.5 mbpd is untested and could only be maintained for a very short period and that, in any event, higher production would be very difficult and would require producing heavy crudes.” Nothing meaningful has changed since then.
Some have claimed over the years that we already know this. Interesting.
So what would be a more realistic current “reserve” number for KSA? (I put “reserve” in quotes to acknowledge its virtual meaninglessness.)
Is it just 170G minus 96G? 257 (or 268) minus 96?
Any signs that those horizontal bottlebrush wells are getting flooded out?
for what its worth
Saudi Arabia had approximately 266 billion september 10, 2014. apparently , However Iworked this out and havent looked at it since because , well , why ? We all know what the score is .
data is ofcourse incomplete and for oil not eqv.
feild name 2015 2019
prod res prod res
Abqaiq Field 0.43 12 0.15 5.5
Ghawar Field 5.0 71 3.8 48.3
Khurais Oil Field 1.5 19.4 1.45 20 ?
Qatif Project and Abu Safah field 0.8 6.1+ 0.15 ??
Safaniya Oil Field 1.2 37 1.3 33.7
Shaybah Oil Field 1.0 14 1.0 13.7
9.93 159.4 7.85 106.7 incomplete data
yealry production of 7.8 with predicted reserve of 106.7 = 14 years ?
it seemed at the time a little too low , you guys are much better at this than me , I’m just a student here.
Forbin
Some interesting features and terrible ironies, should Fall 2018 turn out to be peak:
1. No one predicted that particular year that I can remember. 2005. 2008. 2010. Etc. My own geology professor had 2013 as his absolute limit. But 2018? A fitting surprise.
2. Simmons’ claim “When Saudi Arabia peaks, the whole world has peaked.”
3. His other claim–an important one–that peak would ONLY be recognized in the rear view mirror.
4. Hubbert’s recognition, a long time ago, that his prediction “assumes an orderly evolution,” meaning without above-ground issues interfering, which he recognized would put off the peak for a few years. So he was off by 18 years, then. But maybe Dennis is right, who knows.
5. Colin Campbell’s repeated insistence that the actual year of peak “doesn’t matter,” that “the vision of the long decline afterward” is what matters.
6. That the so-called shale fracking revolution has simply scraped the bottom of the barrel long enough to put the public to sleep, “discredit” the peak oil crowd, and therefore make the decline afterward that more abrupt and surprising and catastrophic.
Woe is us.
Hubbert was fully aware of, and specifically excluded oil sands and shale oil. He also recognised that anything that artificially restricted production, like a cartel such as OPEC or environmental. restrictions such as offshore drilling moratoria, would skew results to give a later peak than a logistic fit.
Could you point to the reference where Hubbert laid out these specific exclusions please? And I presume you aren’t talking about his 1950 US peak oil call, but a later one?
“Colin Campbell’s repeated insistence that the actual year of peak “doesn’t matter,” that “the vision of the long decline afterward” is what matters.”
Yes, yes, and yes.
We are effectively at peak (unless perhaps you are concerned about the betting line detail).
Product output per capita, and product available for export
are more important than global peak production, when it comes to the effect on pricing and economy.
How the world adapts to the decline in energy per capita is the big issue.
And that will be variable…extremely variable in effectiveness and outcome.
Ron
I recall reading a Saudi Arabian comment many years ago that a typical oil field only yielded 33% of its actual reserves. It then carried on by saying that with a combination of water flood and horizontal MRC wells that they expected to increase that percentage to over 50%. In the meantime could they have learned more tricks to get higher than 60%. I assume to get to these higher percentages, the water/oil is also higher than 50%.
Could this account for the increase in their reserves even though no new fields were discovered.
US April Production is Down.
Overall production is down by 60 kb/d. Onshore L48 is down by 134 kb/d. GOM is up by 72 kb/d and ND is down by 214 kb/d.
Overall March production was revised up by 33 kb/d from 11, 655 kb/d to 11,688 kb/d.
WTI is down $8.36/b to $100.07/b at 11:27 Est. A lot of recession talk this morning. Bears in control.
Full US update later this week.
11:34 A.M. Est
WTI down $9.24/b to $99.19/b.
Euro/US 1.0247
Gold $1,765/oz
Silver $19.12/oz
Copper 3.44/lb
All pushing new recent lows.
Its a sign of waning global prosperity.
The Covid response stimulus tap being closed down. Trade wars in various forms rolling back the stimulus effect of globalization.
The extreme concentration of wealth among the thin top crust of the world population means that a big portion of the worlds capital/assets are sequestered behind fortress walls and does not circulate in the real economy.
Energy costs have been high enough to leave less in the coffers for other forms of economic activity (purchase of fertilizer, putting on new roof, replacing an older vehicle, etc). Early stage of this phenomena. More as the decade unfolds.
Dennis,
WTI currently below $100. Dollar is up big against pretty much every currency.
I can kinda see why Mike S. Just stopped trying to educate you.
HHH,
I believe I said recently that a World Recession that is mild (say 1% annual growth rate) might reduce oil prices to $80/bo.) Yes Fed raising rates as well as increased US natural gas exports would increase demand for US dollars and drive up the exchange rate so increased dollar strength is expected and will of course reduce oil prices in US dollars. You have focused on the eurodollar, looking at futures quotes, the market expects rates for Eurodollar loans will rise through Dec 2022 and then start to fall through Dec 2023. The increase is not that great increasing from 2.5% (July 2022) to 3.6% (Dec 2022) and then falling to 2.86% in Dec 2023.
https://www.cmegroup.com/markets/interest-rates/stirs/eurodollar.quotes.html
More oil scarity, at least ?temporary?
https://www.euractiv.com/section/central-asia/news/russia-shuts-down-terminal-after-kazakhstan-offers-to-send-more-oil-to-the-eu/
As long there is enough free oil in the system, the price is somethat independend on supply/demand – no problem to be as low as 60 to 80 in a recession, just because traders think it has to be there in a recession.
Things start going ugly when the orders aren’t filled anymore.
Eulenspiegel,
The assumption that there is a lot of “free” oil in the system may not be a good one. World petroleum stocks (which is the best measure of “free” oil) are near historic lows relative to consumption.
At the moment, when you order oil you can get it. So there is free oil. Not as much as usual, but enough. Prices then can float around – when expecting a recession oil can fall to 50$ or less. Even when storage levels are falling. Even when Kazakhstan get’s cut off from exporting for an unknown time – doesn’t matter. Traders can do their games.
This ends suddenly, when demand can’t be filled. Then the bidding starts – with nat gas we are at more than 200$ oil equivalent in Europe at the moment.
Eulenspiegel,
There are many expecting a recession, perhaps if most believe it will be severe we may see $60/b. Note that I focus on monthly average oil price, a one day dip to $60/b is possible, a monthly average price of $60/b much less so unless things deteriorate much more severely than most market participants expect, even Ed Morse only expects perhaps $75/b, others expect $140/b, my guess is $100/bo with a ten dollar range above and below.
Eulenspiegel
A lot of sense in those comments. In the short term oil can go down to 50 dollars or up to 150 dollars. I doubt there is much to gain by the oil price getting too low; we have already had a lot of volatility hindering investment in oil the last few years. Quite a few oil producing countries would dislike this kind of instability, as they try to budget their income and expenses. And if we are talking about 150 dollars+ oil prices. The whole economic system is not built for it primarily, and if it happens too fast it is just bad for everyone. Cost of living being a too severe problem. I am more thinking of rationing and a lot of other forms of demand destruction are considered before allowing the oil price to go too high. It is just to destabilising altogether. So in the end, the oil market is a global market that probably is functional. But a strange one, since there are so many interests due to its importance.
Eulenspiegel,
Good luck ordering some oil at say $60/bo. Oil is available, but the only bid that gets a barrel is over $90/b, which is due to more buyers than sellers at oil prices less than this at present. I am less interested in paper barrels on futures markets.
Why would you assume any recession will be mild?
It’s not capital flows driving dollar higher although there is some. It’s lack of dollar liquidity. As in bank deposits or loans created by commercial banks that’s is driving dollar higher.
Bank reserves created at FED via QE don’t really matter. That’s interbank money that doesn’t even matter. I focus on Eurodollar market because what going on in it is what actually matters. It’s where bank deposits are created.
Eurodollar curve is deeply inverted because no one is willing to take the other side of the trade.
Eurodollar market is going to have meltdown. This won’t be a mild recession.
HHH,
Currently there is lots of market turmoil, the actions of central banks will influence interest rates and it is difficult to know in advance what policy actions will be taken by cental banks. The expectations indicated by futures markets of the path of interest rates in the future suggests a relatively mild recession based on analysis by the Bank of International Settlements (BIS). If we see a more substantial tightening of monetary policy than the market expects(as of May 2022), then the recession would be more severe.
I don’t know what the future will be, perhaps you will be correct.
When do you expect oil price to be $25/bo and do you expect this will be the monthly average price?
You should be able to make a lot of money on that trade if you believe it.
Dennis,
You are correct a lot of money can be made on that trade if it plays out.
Personally I can’t see oil prices hitting $25/b. That is more like a depression with all economic activity grinding to a screeching halt. Very unlikely. Or another supply glut which is again very unlikely in the current environment.
$65/b is the lowest i can see it going with a severe financial crisis, with asset bubbles unwinding. And following a loosening of monetary policy we can see commodities increasing in price again including oil.
Right now USD is in high demand i suspect margin calls might be part of the reason for the strength in the USD, DXY will probably continue its bull run i suspect as monetary policy is tightening.
Iron Mike,
I agree mostly. Your last paragraph may be right, but I don’t follow currency markets very closely so I don’t have a strong opinion on whether margin calls are part of the story. I agree about high demand for US dollar both due to increased energy prices and exports and higher interest rates in the US and also agree monetary policy is tightening. Your 2nd and 3rd paragraphs I agree 100%.
Iron Mike
Don’t higher U.S. interest rates attract foreign cash into short term treasuries which in turn requires US$.
Ovi,
That is correct and is one reason there would be an increased demand for dollars which would increase the dollar index. In addition higher oil and natural gas prices and increased US exports of petroleum products, crude, and LNG will also increase demand for US dollars. All of this is an obvious explanation for increased strength of the dollar. On top of this the Fed may be reducing money supply by selling treasury bills and notes. The M2 money supply in the US did decrease in May 2022, no data yet for June 2022.
See not seasonally adjusted M2 at page linked below
https://www.federalreserve.gov/releases/h6/current/default.htm
Dennis
Thanks
Ovi,
It does. One of the interesting things about the current environment is whats happening to precious metals.
Typically gold is seen as a hedge against inflation. And inflation is what the world is experiencing. However gold prices are falling. Hence my guess that part of the reason for the rush to USD is margin calls. So usually institutional investor (and some retail) have part of their portfolio in gold, as they get margin called on riskier bets they will sell their gold (or other precious metals) to get USD to pay for margin calls.
Of course this scenario might not be playing out atm I am speculating.
Another reason for the fall in gold prices could be the market is smelling a recession as the market is forward looking. Again speculation on my part.
Iron Mike,
Thanks. I understand better now why you think margin calls may have been part of the rise in demand for dollars. Sounds reasonable given the fall in Gold prices, which is unusual as typically one would think Gold price would increase due to inflation.
Dennis/ironMike.
I have lived with gold all of my life as I was born in a gold mining town and worked in the gold mines during summer breaks from University. I have never really understood the gold movements.
More recently I have come to the conclusion that it’s movement changes with the times. Sometimes it is an inflation protector. Sometimes it raises with the DXY and sometimes it goes down as the dollar rises. The talking heads put out the latest best theory to explain what gold is doing.
If you go to this site you can enter a comparison of the DXY against GLD.
https://www.bloomberg.com/quote/DXY:CUR
Ovi,
Interesting history, thanks. I also do not understand the attraction of gold, though I have never mined any gold (my wedding band is gold, that’s about as close as I have gotten to gold.)
Dennis
My dad lived through the recession of the 1930’s. I asked him what it was like during the recession. His response was “What recession”? The gold mines had to work 24 hrs a day, 3 eight hr shifts to mine the gold. It had to be sent to Ottawa, Canada’s capital where the mint was, so that the bank could print Cdn dollars.
Basically our town boomed during the depression.
My dad lived through the recession of the 1930’s.
Ovi, it was not a recession but a depression, a very serious and even horrible depression in most parts of the USA. In your dad’s neck of the woods in Canada, it probably was not so bad. My dad was a poor dirt farmer, a sharecropper, and for him and our family, it was horrible. He had very little money, just enough to buy closes and a ltiitl food for the family. But we were lucky enough to live on a farm where we could grow most of our own fod. A lot of people were not nearly so lucky. It began in 1929 and lasted until the early 40s. Only full employment because of WW2 brought us out of it.
There were no goldmines in Alabama.
Iron Mike
Also there are gold holders, especially those that don’t believe in a particular fiat currency, that buy gold on margin as a real inflation hedge when interest rates are low. With rates climbing, this strategy gets turned on its head and they may also be selling gold.
Ron
I know it was a depression and how bad it affected most Canadians and Americans. At the time of writing, I could not remember the word depression with all of the current talk of recession. Chalk it up to another senior moment.
As for how the depression was turned around, I thought that Franklin Roosevelt introduced the great new New Deal that started to turn the depression around. I understand that his administration commissioned the building of roads, airports, bridges and the Hoover Dam and this got the US started on the road to recovery. I also saw a program recently that said his administration funded the building race tracks and movie theatres so that people could take a break from all of the misery. Not sure what the state of the economy was when the US entered WWII.
The Great Depression officially lasted for 10 years. The unemployment rate was above 15% until the early 40s when some of Rosevelt’s programs started to kick in. It was about that time when we started manufacturing war equipment to support the war in Europe even though the US had not yet entered the war.
It was 25% when he got elected and started dropping after launching his new deal.
Data for US GDP can be found at link below back to 1929 (annual data only)
https://apps.bea.gov/iTable/index_nipa.cfm
I used data to find real GDP in 2012 $ for US from 1929 to 1940. US real GDP went fro 7 Billion to 3 Billion in 2012 $ from 1929 to 1932 and did not recover to 7 Billion until 1939.
World War 2 saw a huge increase in real GDP (rising to 32.7 billion by 1945).
I don’t have unemployment data before 1948.
Back to the Gold Discussion.
Saw this headline this morning.
Steep outflows could trigger a substantial downside for gold in coming sessions – TD
“A major capitulation event may be unfolding in gold…We see evidence that the steepest outflows from broad commodity funds since the Covid-19 crisis may be catalyzing a series of cascading liquidations from various speculative groups. This argues for substantial downside for gold in coming sessions as participants are forced to sell in a vacuum,” TD notes
“Indiscriminate selling by broad commodity funds has now sufficiently weighed on price action in gold to catalyze a break below a critical threshold for a change in gold’s trading regime,” TD adds.
https://www.forexlive.com/news/steep-outflows-could-trigger-a-substantial-downside-for-gold-in-coming-sessions-td-20220708/
Dennis
There is an unemployment chart in this link. Covid got unemployment back up to 14%. Unemployment is nearing Great Depression levels. Here’s how the eras are similar — and different.
There is a picture in this article.
https://www.google.ca/url?sa=t&rct=j&q=&esrc=s&source=web&cd=&ved=2ahUKEwjAkvy52-n4AhVUkWoFHftNBOgQFnoECA4QAw&url=https%3A%2F%2Fwww.cnbc.com%2F2020%2F05%2F19%2Funemployment-today-vs-the-great-depression-how-do-the-eras-compare.html&usg=AOvVaw1v1BsOC6ZLMB3bY6wNCIrz
Ovi,
A few talking points. Gold and other precious metals as I am sure you are aware have certain chemical properties which make us humans call them ‘precious’.
* Lack of reactivity to acids and other solvents.
* They are general great conductors of electricity and heat.
* Rarity
I agree with you though, for the general population it is more of a psychological awe to precious metals than a logical one.
Regarding the DXY vs GOLD.
If you plot a historical chart of DXY vs GOLD you can see a ‘general’ inverse correlation. If i get around to it I might do a plot to see the R^2.
My prediction is gold will continue the downward trend. The eurodollar indicator estimates a fed funds rate of ~ 4% in December. Which may imply inflation will continue or stay more or less steady until years end. If we do get a GFC style recession you can expect USD to go even higher until the Fed decides to loosen monetary policy, then we may see a reverse in gold (which is historically counter intuitive). Chances of me being wrong is close to 100%
https://www.dailymail.co.uk/news/article-10982609/Supply-chain-truck-chaos-ahead-AdBlue-shortage-comes-Incitec-Pivot-close.html
Australia diesel problems
https://www.youtube.com/watch?v=ehHibdfvSqM
Chris Martenson, who used to post here, back to doing what he does best.
Great charts in this one!
As I suggested yesterday, it starts. Europe will be using oil instead of nat gas for thermal use:
Just a small country, but other will follow. So we will see 60$ oil and great increased demand:
https://oilprice.com/Latest-Energy-News/World-News/Austria-Plans-To-Power-Industry-With-Oil-Instead-Of-Gas.html
At current prices oil is round about 7 cents / Kwh and nat gas 20+ – much incentive to burn some oil.
Thanks for the info, what are the factors used to convert oil barrels and gaz units traded on the markets to Kwh ?
(even if it can vary from one barrel to another).
http://WWW.GOOGLE.COM
Type in “Oil in KWH” or similar. Gas is accounted in Kwh in Europe, so it’s more easy. It’s different for oil based on gravity, so I said “round about”. The exact value doesn’t matter.
OPEC plus seaborne exports.
U.S. Oil Production Hits New 2022 Peak, but More Runway Ahead for Growth
Domestic crude output reached a new high for the year as producers continue to gradually ramp up to meet summer demand, the U.S. Energy Information Administration (EIA) reported Wednesday.
Production climbed to 12.1 million b/d for the week ended June 24, up 100,000 b/d week/week, according to the EIA’s Weekly Petroleum Status Report (WSPR).
That’s up almost half a million barrels per day above April production of 11.628 million b/d. I find that a little hard to believe. Production was up 100,000 barrels per day just last week. Hell, at that rate we will flood the world market in just a couple of months.
Ron
I have just looked up the week of April 15. The weekly output was 11,900 kb/d. That is 272 kb/d higher than the official monthly output of 11,628 kb/d.
Tokayev orders to develop oil export routes bypassing Russia
“The Trans-Caspian international transport route starts in China, runs through Kazakhstan, reaches the Caspian Sea and then goes to Azerbaijan, Georgia, Turkey, allowing transportation of goods to Europe. This route will allow Kazakhstan to supply oil and other products bypassing the territory of Russia.”
https://m.akipress.com/news:673202
Might be time to start keeping a long term eye on Argentina.
Vaca Muerta shale development slowly ramping up.
https://oilprice.com/Energy/Crude-Oil/Could-Argentinas-Dead-Cow-Shale-Patch-Help-Solve-The-Energy-Crisis.html
Of note is that the same region has excellent solar resource on par with Abilene or Sacramento, and wind resource on par with many good spots on the US high plains. Energy infrastructure money will likely be concentrated there, despite other wide areas of Argentina having even much better wind and solar resource.
If they can manage themselves well, they have very strong energy and food prospects.
Hi Ron,
Replying to your much earlier comment about Dennis’ cumulative C C production charts. Maybe you missed the time scale? It goes from 1900 to 2150, so each minor tick is a decade.
Clicking on the chart so I can read the axes, in the minor interval from 2010 to 2020, cumulative production goes from 1100 GB to 1400 GB, 300 GB in the decade, or 30 GB/year as you say it should. The chart looks ok to me. Cheers, Phil
(P.S. Is there a maximum width to the number of nested replies – I don’t have a reply button on Ron’s comment)
You are correct Phil. I just assumed that the word “cumulative” meant cumulative, I had no idea he meant “projected cumulative”. 😫
I have posted a correction along with another comment.
Thanks for the heads up.
Ron,
Yes after 2021 it is projected cumulative, where it adds up my guesses for future output in my Oil shock model.
Ron – Great comment above about infill production pushing the peak way beyond where it should be, I have a schematic chart that reflects this…will post it shortly…also agree completely agree with the comment on 1.5 trillion barrels of reserves…it’s ludicrous that 1P = 0.3 T yet somehow consensus is that 1.2 T will pop up out of thin air…I’d be comfortable with 3x (0.9 T), but 5x, really!?!
Kengeo,
See
https://peakoilbarrel.com/us-oil-reserve-growth-2/
The US has the most mature oil basins in the World where we would expect reserve growth to be lower than elsewhere. The average annual rate of reserve growth in the US from 1980 to 2005 was about 1.97%. The figure to focus on is 2P reserves not 1P which Rystad estimates as 572 Gb at the end of 2021.
Also the claim is that there are 1.45 Tb of resources, not reserves. The Laherrere paper is at link below, you should read it if you have not already. His estimate is 2800 to 3000 Gb for World URR (ultimately recoverable resources).
Paper below was published at ASPO France on August 31, 2018, see pp 15-16 and summary p115
https://aspofrance.org/2018/08/31/extrapolation-of-oil-past-production-to-forecast-future-production-in-barrels/
Dennis and Ron –
I did look at Laherrere’s estimate (2018), maybe it was the presentation but it was hard to glean much from it (but it looks hyperinflated for numerous reasons). I didn’t see a clear distinction in the quality of the oil reserves (that has to play some role, right?).
Not sure that using anything beyond 2P (0.55 Trillion barrels) makes sense, see reference below:
Energy
Volume 47, Issue 1, November 2012, Pages 262-270
A review of the uncertainties in estimates of global oil resources, C.E. McGlade
“The 2P (P50) is equivalent to a median estimate of reserves using this interpretation, and it is the 2P reserve estimate only that is suggested should be used when examining the global endowment of conventional oil [21]. This sensible recommendation was based on concerns that 1P reserve estimates did not correspond to the precise statistical definition of P90, and because of the common, yet statistically flawed, practice of aggregating 1P estimates from the field to country to regional level.”
So if there’s an argument against using 1P, then surely there’s an argument against using anything above the 2P level? Unless one believes in crude oil unicorns and coal fairies???
Still looking for a schematic I made couple weeks back, will add it shortly…
Here it is, schematic in nature, meant to be qualitative, from what Ron said, I think one could surmise that the 2006 timeframe was in fact the true peak (primary), however, Saudi Arabia and U.S. were able to ‘over-extract’ the remaining reserves at a rapid pace. The net effect is that instead of having a plateau, we have a secondary ‘artificial’ peak and a much more intense decline following the secondary peak. I’d be curious to know what the URR for this scenario is…it obviously misses some of the early production…
Kengeo,
Jean Laherrere does excellent analysis in my opinion. In 2008 he had World C plus C less XH URR at 2100 Gb using HL. In 2015 he had World C plus C less XH at 2200 Gb, but also showed an alternative (better) estimate for 2500 Gb using 1993-2014 data. In 2016 the estimate increased to 2500 Gb and in 2018 to 2600 Gb (1992-2016) or 2900 Gb (2006-2016). If we take the average of these most recent estimates (2750 Gb) and add XH oil URR (215 Gb) we get 2965 Gb for World C plus C. My guess is that Laherrere’s estimate from 2018 is excellent and not hyperinflated as you claim.
Another good paper for you at
https://royalsocietypublishing.org/toc/rsta/2014/372/2006
The future of oil supply intro is very good, but there are a bunch of good papers in this theme issue of The Royal Society
Ballpark estimate for scenario above looks like 0.5 trillion less than ~3.0 trillion URR that Dennis oftern refers to…seems pretty reasonable if that’s the case…
Kengeo,
You should use data from EIA at link below
https://www.eia.gov/international/data/world/petroleum-and-other-liquids/annual-petroleum-and-other-liquids-production?pd=5&p=00000000000000000000000000000000002&u=0&f=A&v=mapbubble&a=-&i=none&vo=value&&t=C&g=none&l=249–249&s=94694400000&e=1640995200000
Cumulative World C plus C output to the end of 1972 is about 264 Gb and to the end of 1964 is 145 Gb. If you use BP data use the crude plus condensate data, EIA data is better because it goes back to 1973.
Attached is a Hubbert Linearization for World C plus C using 1998-2019 data, URR is 2918 Gb. Note that many authors believe the HL method tends to underestimate the URR.
Kengeo,
Chart below has a parabolic model fit to 1955 to 2019 World C plus C data (red diamond markers), the model cumulative output is fairly close to correct at the end of 2019 (1333 Gb model vs 1381 Gb data), peak is 2029 at 79.75 Mbpd and URR is 3200 Gb in 2111.
Note that my scenario is shown for comparison after 2021, URR of my scenario is about 2900 Gb, or 300 Gb less than the parabolic scenario, which I do not think is realistic.
Here is something that must be said, something that is being overlooked by all those who think we are approaching only 50% of ultimate crude oil production. This is important!
World distribution of oil
Although the semantics of what it means to qualify as a giant field and the estimates of recoverable reserves in giant fields differ between experts, the nearly 3,000 giant fields discovered—a figure which also includes the supergiants—account for 80 percent of the world’s known recoverable oil. There are, in addition, approximately 1,000 known large oil fields that initially contained between 50 million and 500 million barrels. These fields account for some 14 to 16 percent of the world’s known oil. Less than 5 percent of the known fields originally contained roughly 95 percent of the world’s known oil.
80% of the world’s oil is produced by the world’s giant and supergiant fields. The overwhelming majority of these fields were discovered half a century ago or more. Most of these giant fields have, over the last 20 years or more, been creamed. That is there have been thousands of infill drilling in them with horizontal wells creaming the oil right off the top of the reservoir. Near 80% of the world’s oil is coming from these fields that are way past 50% depletion. Most are well past 75% depletion.
Also over half of the 20% of the oil that does not come from giant or supergiant fields still comes from large fields. Most of these large fields have been producing for decades. The idea that we are only at about 50% of ultimate oil production is absurd beyond belief.
Ron – Excellent point(s) above, we’re focusing on these teeny tiny fields for growth when the entire larger (and much much older) group is crashing…there’s a breaking point between being optimistic and completely missing the boat…entropy comes for us all. big fields, little fields…
For these larger & older fields, why the heck would anyone use anything other than 1P to estimate future production?????????? That I think is the 800 pound gorilla…
In 2022, are we really still expecting a future oil peak???? Mind-blowing if that is in fact the consensus…
Dennis –
Here’s something I can certainly agree with Laherrere; from pages 117-118 (do you agree????? 5% seems really high, that would put us below 50 MBpD by 2030!):
Page 117:
“2P reserves were in the past reliable but the pressure of clients on scout companies are such that present data is unreliable, demonstrated by the discrepancies between different sources.
To get the truth, older edition of scout data should be used.”
Page 118:
“The main conclusion of this study is:
-only 6 countries have not yet reached peak: Brazil, Canada oilsands, Kazakhstan, Iraq, UAE, Venezuela Orinoco -19 countries (out of 35) have or will have a decline rate of 5 %/a It means that, excluding the 6 countries before peak, the best and the simplest way to forecast future production is to decrease present production by 5 % per year.”
Kengeo,
No I do not think 5% decline in output is likely at the World level. For some smaller producers this might be true, as to 2P data, I do not have access to any of it, but note that at the time Laherrere wrote this Rystad’s estimate was far higher than in 2022 (around 1750 Gb for 2P reserves). Laherrere’s estimate seems in the ballpark.
In schematic below, I try to match Dennis’ ‘Skys-the-limit’ approach for his URR=2860 Gb for the post-2030 data, I think we’re all in consensus for what happens after 2030 (only 7.5 years away!). It’s highly unlikely that Dennis’ or my guesses on future production are correct, but even with this hybrid approach we can’t possibly get another peak between now and 2030…no way! Schematic below puts a line of best fit peaking in 2010. This may fit better with the early (primary) peak in 2006 and a latter (secondary) peak in 2018. At this point, I put Dennis’ chances of a tertiary peak in late 2020’s at a 50%). Huge decline of 5% also seems unlikely…but much higher probability than any growth scenarios (so maybe 25%?).
I appreciate all that everyone on here does, my grandparents taught me from an early age about the world energy predicament. My grandfather was a nuclear engineer (energy) and had a lot of regrets about being a part the industry. With whatever is coming in the next 10 years for world oil, I hope that the estimates can start bettering matching reality…we know that the past 50 years of oil growth ended long ago, painting rosy pictures of future growth does nothing for the discussion, we need to focus on the next 5-10 years, that’s the key to understanding how bad the next 20-30 years will be.
All of the symptoms in the world energy market are pointing to sickness and possible failure. The progress and prosperity of the past 70 years has felt to me like it started unraveling almost 20 years ago (Iraq war, high oil prices, climate tipping points, and so many other things)…
I’ve paid attention to Gail Tverberg (https://ourfiniteworld.com/) for a very long time, her insight is so valuable! And it’s been shockingly on point as well!
Cheers everyone, have a great weekend!
-KenGeo
Kengeo,
Can you clarify what you are plotting (blue dots). My charts are always crude plus condensate (EIA data). You seem to be plutting maybe all liquids or including NGL, not really clear.
Many think my projections are quite conservative, and my 2900 Gb scenario is indeed quite close to that of Jean Laherrere from August 2018. Even Ron recently said my scenario looked realistic, which clearly means it must be too low 🙂
” we need to focus on the next 5-10 years,”
That is certainly the immediate challenge.
Just what will the global C +C be in 2030, and which countries will have access to it, and be able to afford it?
And which countries/companies will have done the hard work to keep moving with less oil- [electric generation and vehicles for those who might not have been paying attention]?
I expect that as oil supply/capita drops that certain countries will have trouble securing or purchasing enough oil to keep from dropping into failed state status.
https://www.bloomberg.com/news/articles/2022-06-06/oil-shock-is-proving-far-more-devestating-for-poorer-nations
But the troubles with fuel affordability or restricted access are not likely to be limited to just places liked Sri Lanka or Ethiopia. Its going to be sectors and neighborhoods of all just about all countries.
Its a horserace between depletion and replacement/downscaling.
We were all very lucky for the grace period provided by shale oil.
Too bad we didn’t use the time more wisely.
Dennis –
I drafted a response and lost it. Plots to 2021 are BP data, (2022 and forwarded is a WAG) not sure what their crude barrels consist of, prob. in their report…
I don’t think an estimate can be conservative if it’s 4-5 times higher than proven reserves, seems fundamentally flawed.
What do you think of pages 117-118??? Do you agree (2P no longer appropriate for future production)? He seems to think 5% decline is the simplest answer for future production…
Kengeo,
I don’t agree 5% decline is likely at the World level. His complaint was that 2P was too high in 2018, that was before they were revised lower. Also his estimate for World C plus C less XH is 2600 (though in his chart on page 16 he also shows an estimate for 3000 Gb, if we take the 2600 Gb estimate (likely at least 200 Gb too low) and add his estimates for Canadian Oil sands (115 Gb) and Orinoco (100 Gb) from page 115 we get at least 2815 Gb, though 3015 Gb is likely a better estimate imho.
A new post on April US production has been posted.
https://peakoilbarrel.com/north-dakota-sinks-us-april-oil-production/
A new Open Thread Non-Petroleum has been posted.
https://peakoilbarrel.com/open-thread-non-petroleum-16/