A guest post by Ovi
All of the oil (C + C) production data for the US state charts comes from the EIAʼs Petroleum Supply monthly PSM.
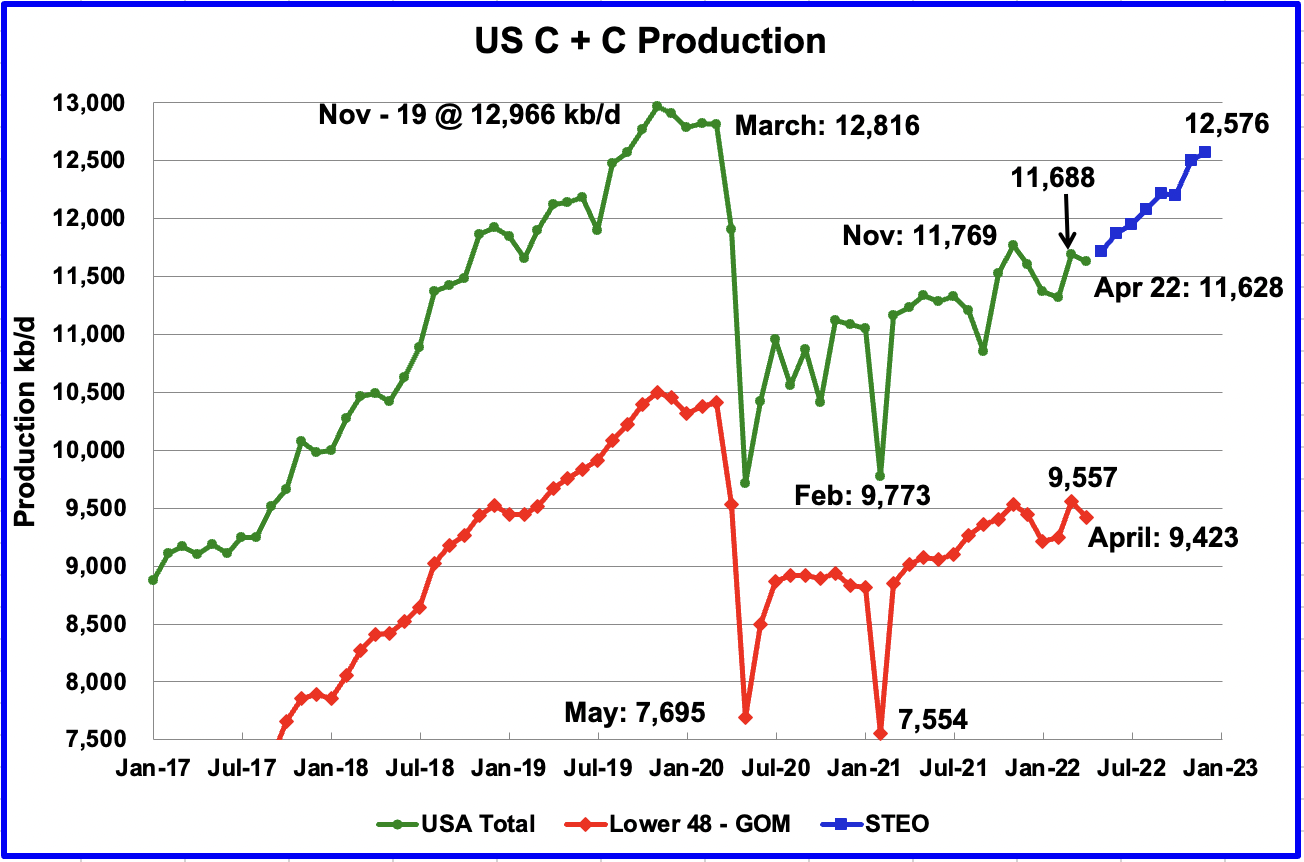
U.S. April production decreased by 60 kb/d to 11,628 kb/d, after March was revised up from 11,655 kb/d to 11,688 kb/d. The largest production increase came from the GOM while North Dakota dropped by 214 kb/d.
While overall US production was down, a clearer indication of the health of US onshore oil production can be gleaned by looking more closely at the On-shore L48 states. In the On-shore lower 48, April production decreased by 134 kb/d to 9,423 kb/d.
The blue graph, taken from the June 2022 STEO, is the production forecast for the US from May 2022 to December 2022. Output for December 2022 is expected to be 12,576 kb/d, a revision of 108 kb/d higher than was forecast in the May STEO report. From May 2022 to December 2022, production is expected to increase by 863 kb/d or at an average rate of 123.3 kb/d/mth.
It should be noted that the STEO did forecast a decline of 137 kb/d for April.
Oil Production Ranked by State
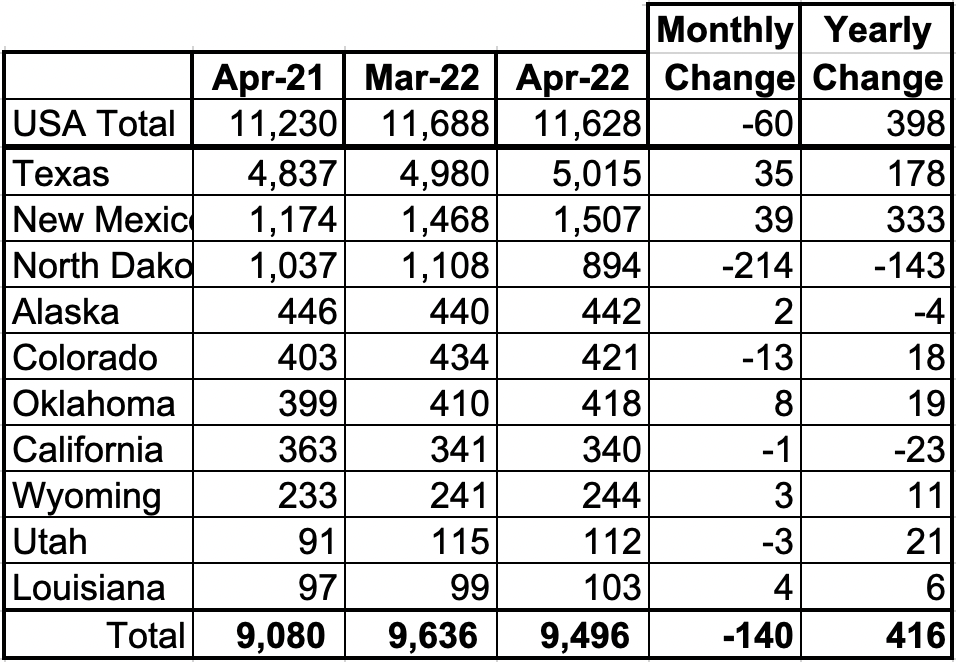
Listed above are the 10 states with the largest US production. These 10 accounted for 81.7% of all US oil production out of a total production of 11,628 kb/d in April 2022.
On a YoY basis, US production increased by 416 kb/d with the majority having come from New Mexico.
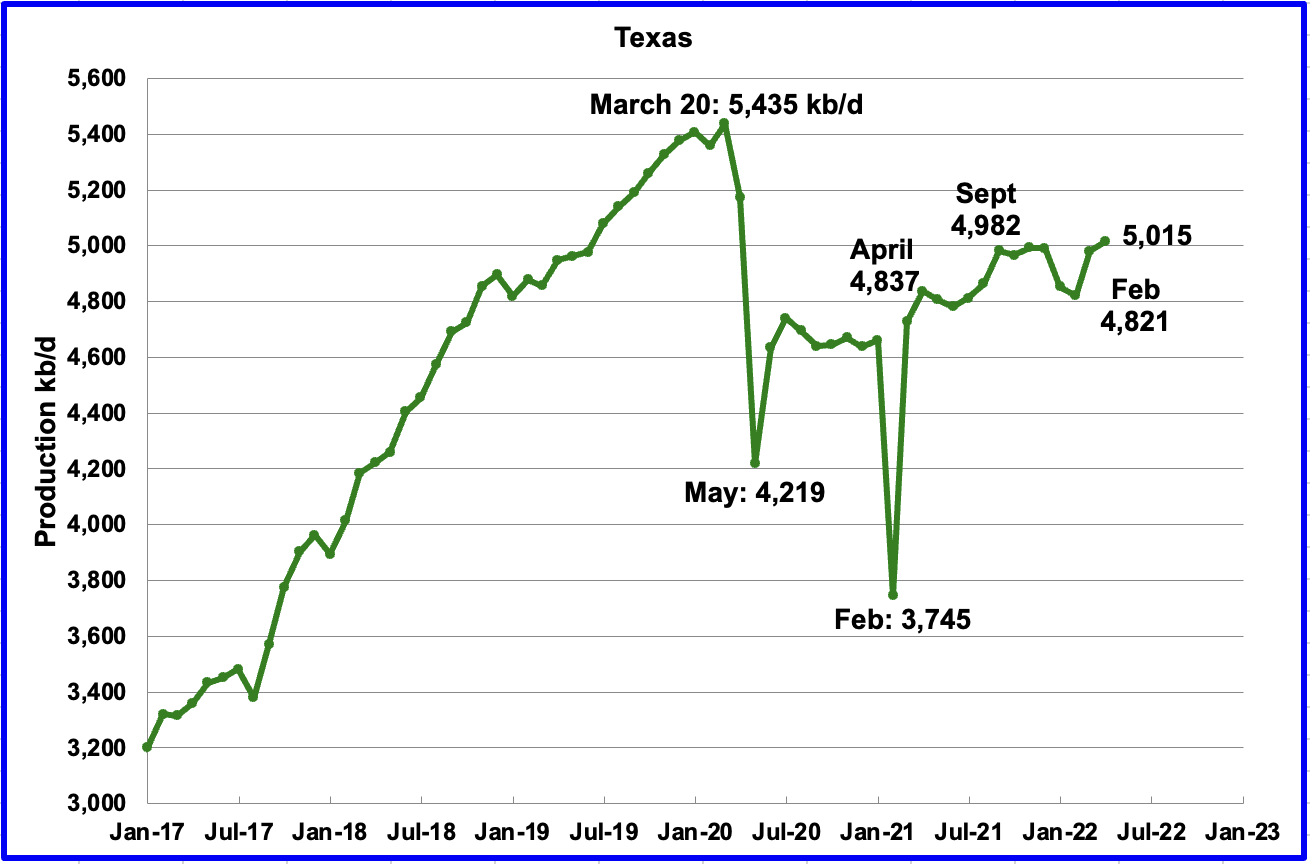
Texas production increased by 35 kb/d in April to 5,015 kb/d from 4,980 kb/d in March.
In September 2021 there were 204 Hz oil rigs operating in Texas. By the last week of April 2022, 293 oil rigs were operating, an increase of 89 rigs and production just increased by 33 kb/d.
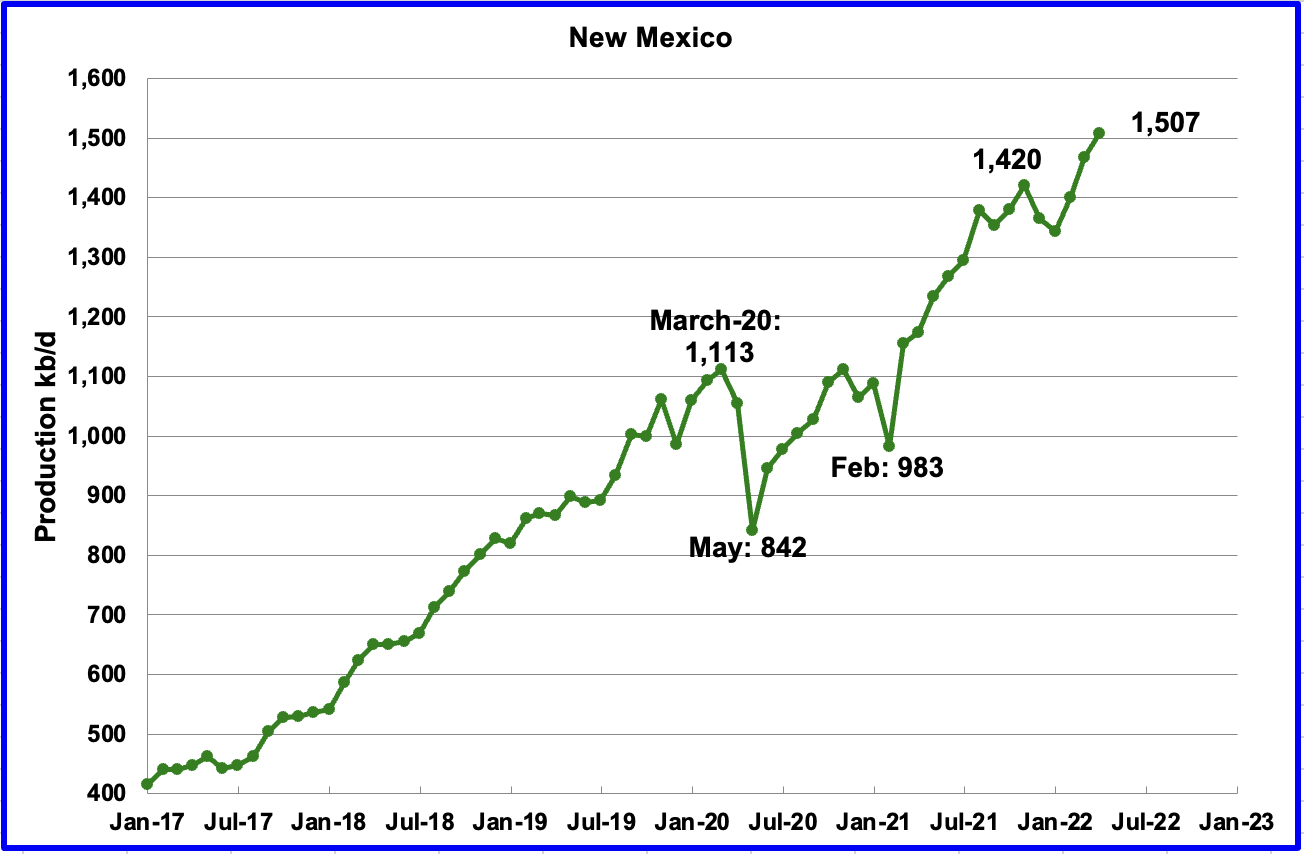
April’s New Mexico production increased by 39 kb/d to another record 1,507 kb/d. Through December 2021 to the end of April, close to 90 rigs have been in operation in the New Mexico Permian. However in June, operational rigs exceeded 100. The recent production increase is due to more wells being completed than drilled.
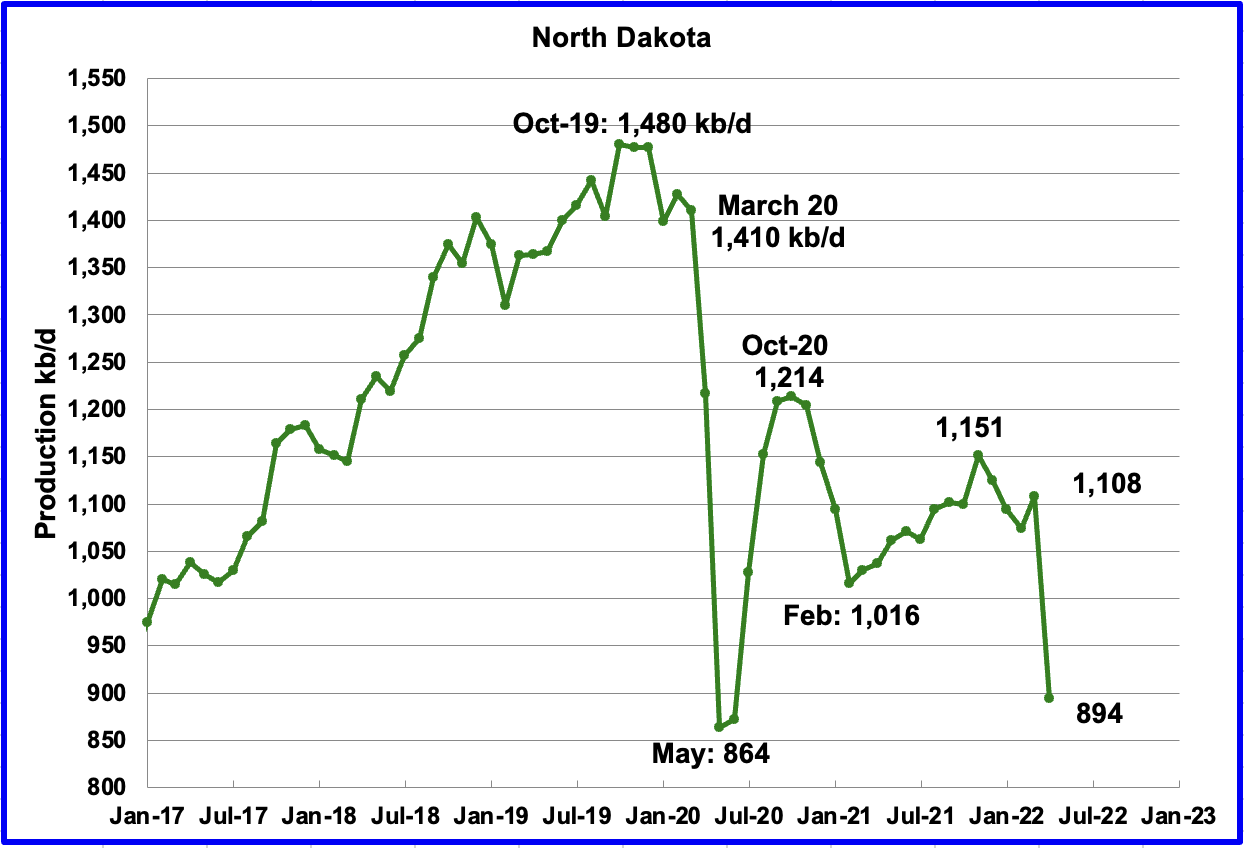
North Dakota’s April output was 894 kb/d, a decrease of 214 kb/d from March. According to this source the drop was due to a severe cold winter storm.
“Back-to-back blizzards in April led to significant drops in energy production. Helms says the industry is only now just starting to recover from the blizzards, meaning production numbers in May won’t see much change.”
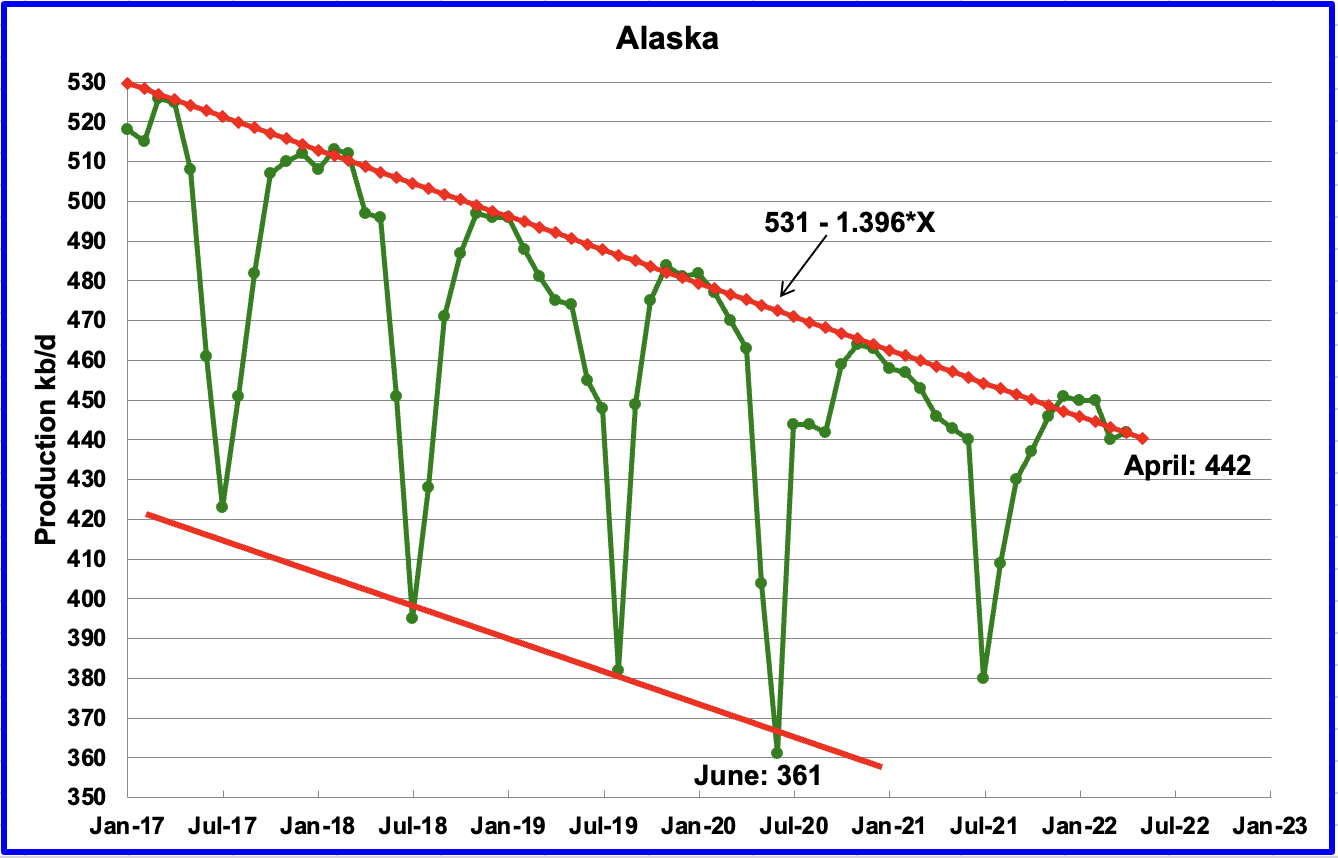
Alaskaʼs April output increased by 2 kb/d to 442 kb/d.
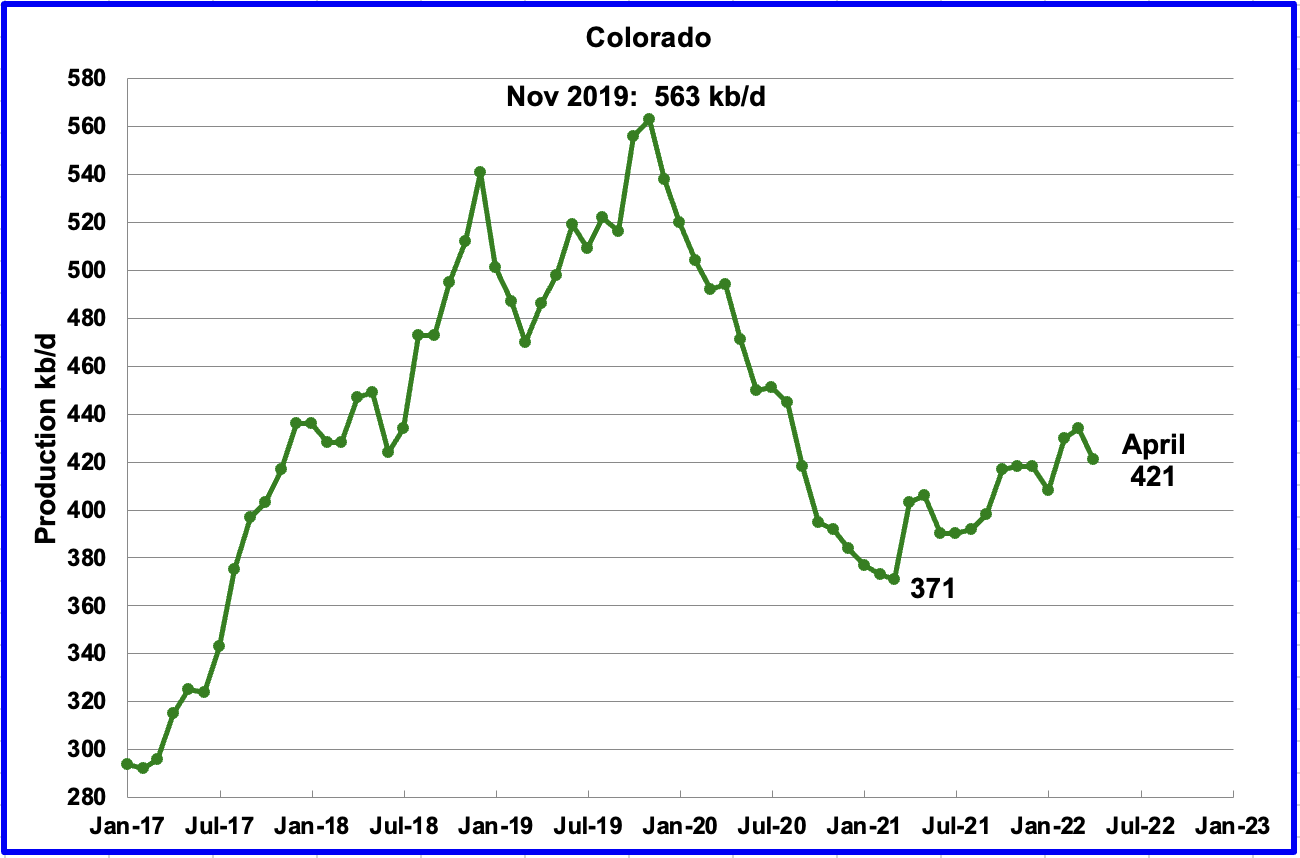
Coloradoʼs April production decreased by 13 kb/d to 421 kb/d. A recent Colorado report estimates little growth likely in Colorado for 2022.
“Oil and gas drilling activity has inched upwards in Colorado since the Russian invasion of Ukraine sent prices soaring earlier this year, but investor demands and supply constraints — not state or federal policy — will likely limit production growth through at least the end of the year, a new Colorado School of Mines analysis concludes.
The quarterly report on oil and gas markets from the school’s Payne Institute for Public Policy found that little has changed since the weeks following Russia’s invasion, when multiple large producers operating in Colorado assured Wall Street investors they would use high oil prices to increase dividends and stock buybacks, not expand production.
“The top priority for the U.S. public oil and gas companies remains to deliver higher financial returns to shareholders,” read the report released last week.”
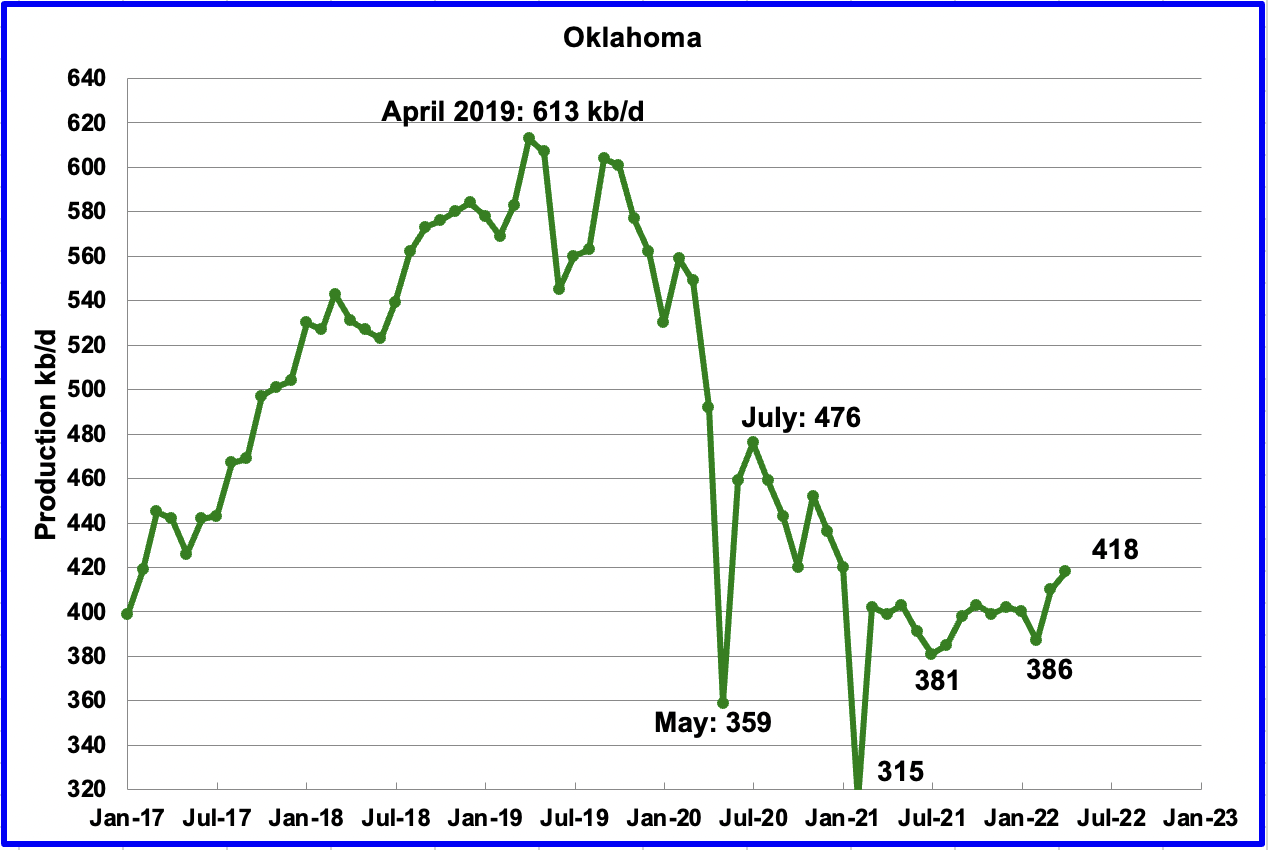
Oklahoma’s output in April increased by 8 kb/d to 418 kb/d. April’s output broke out above the 400 kb/d level it has been struggling with since September 2021. From January to April, close to fifty rigs have been operating in Oklahoma.
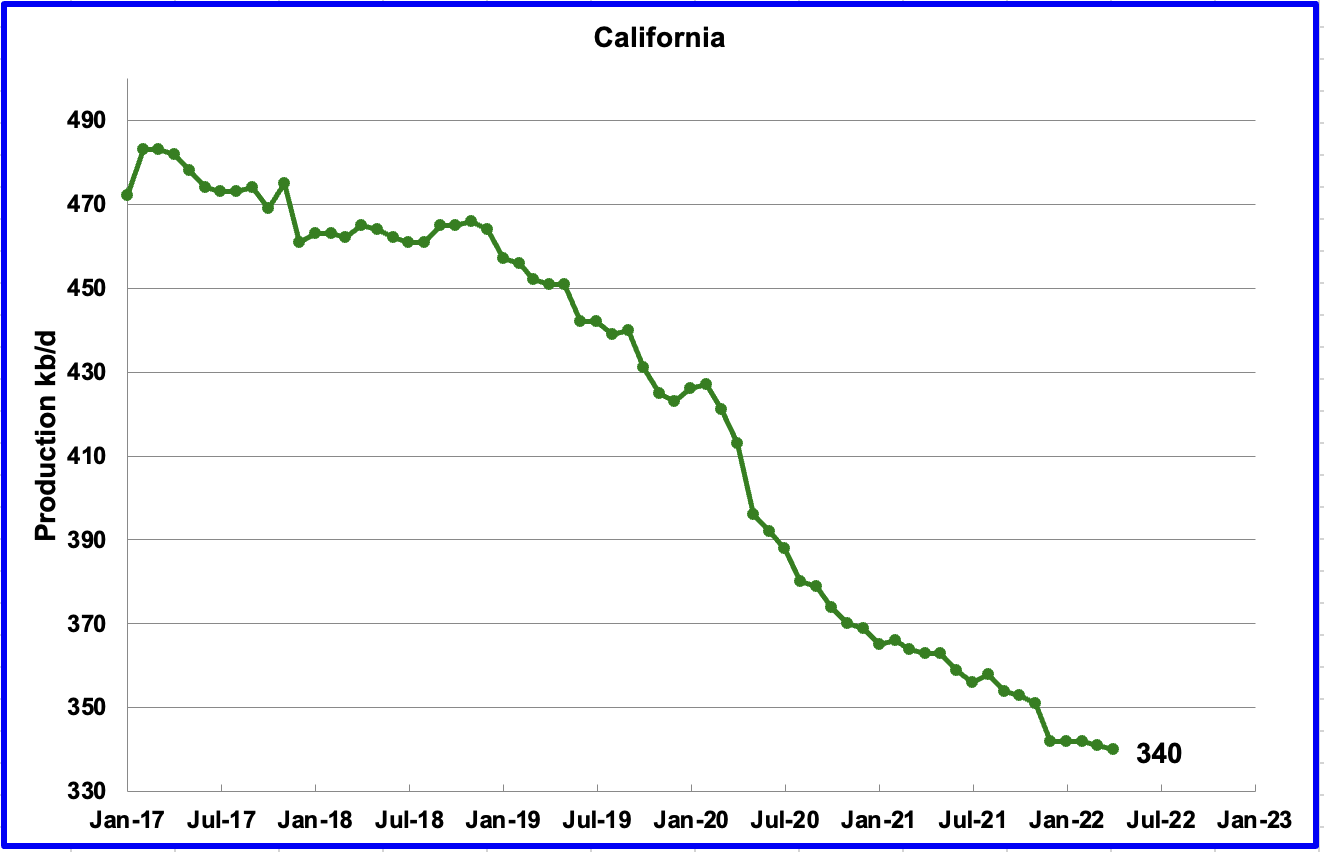
Californiaʼs slow output decline continued in April. Output decreased by 1 kb/d to 340 kb/d.
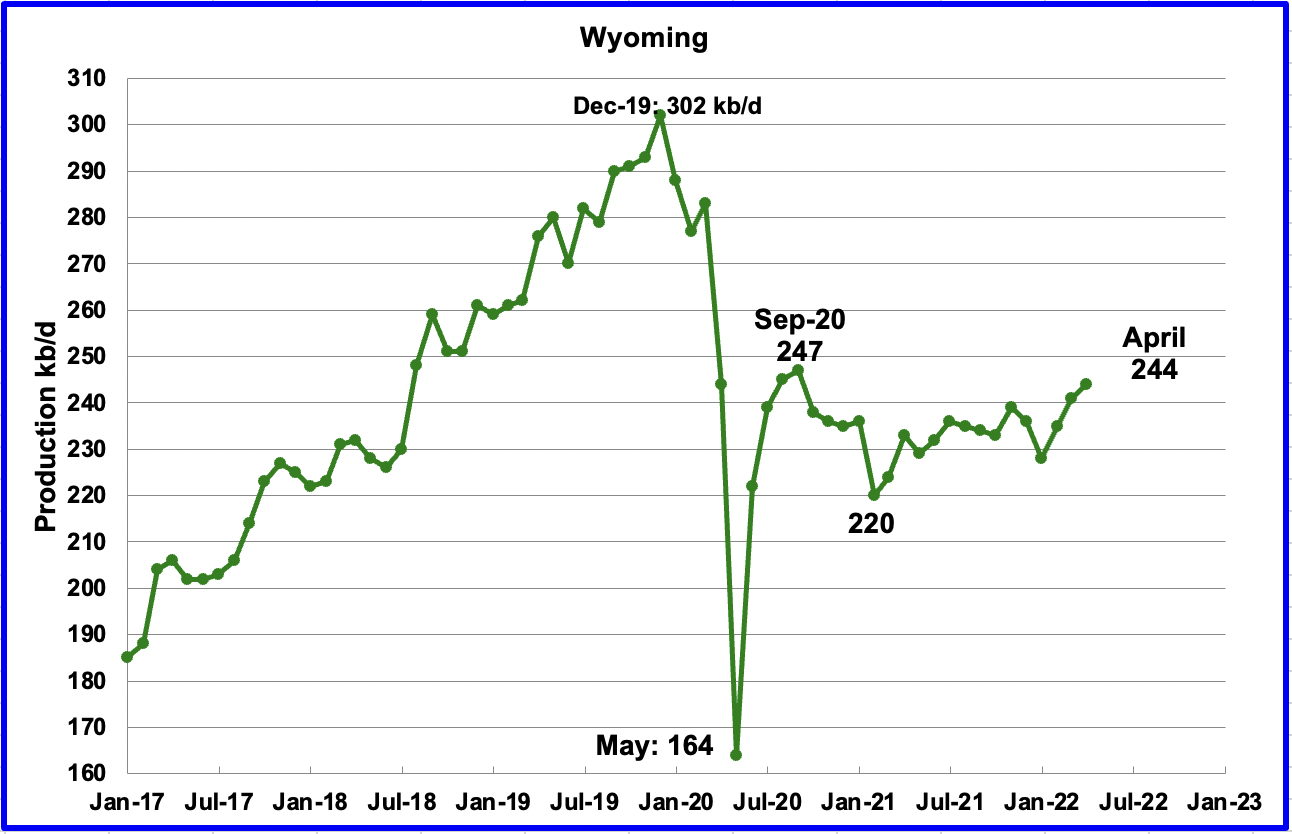
Recent revisions to Wyoming’s oil production by the EIA show that it has been on an uptrend from the low of 220 kb/d in February 2021. According to this source, the increase is related to increased drilling.
“Pete Obermueller, president of the Petroleum Association of Wyoming, told the Joint Minerals, Business and Economic Development Committee on Monday that the state’s drilling rig count is slowly increasing and reached 21 this week. (Baker Hughes, which tracks rigs differently, reported Friday that Wyoming had 18.)
The current rig count “obviously is better,” Obermueller said. “Still not where we’d like to be, but we’re moving in the right direction.”
In April Wyoming’s output increased by 3 kb/d to 244 kb/d, up 24 kb/d from February’s 2021 output of 220 kb/d.
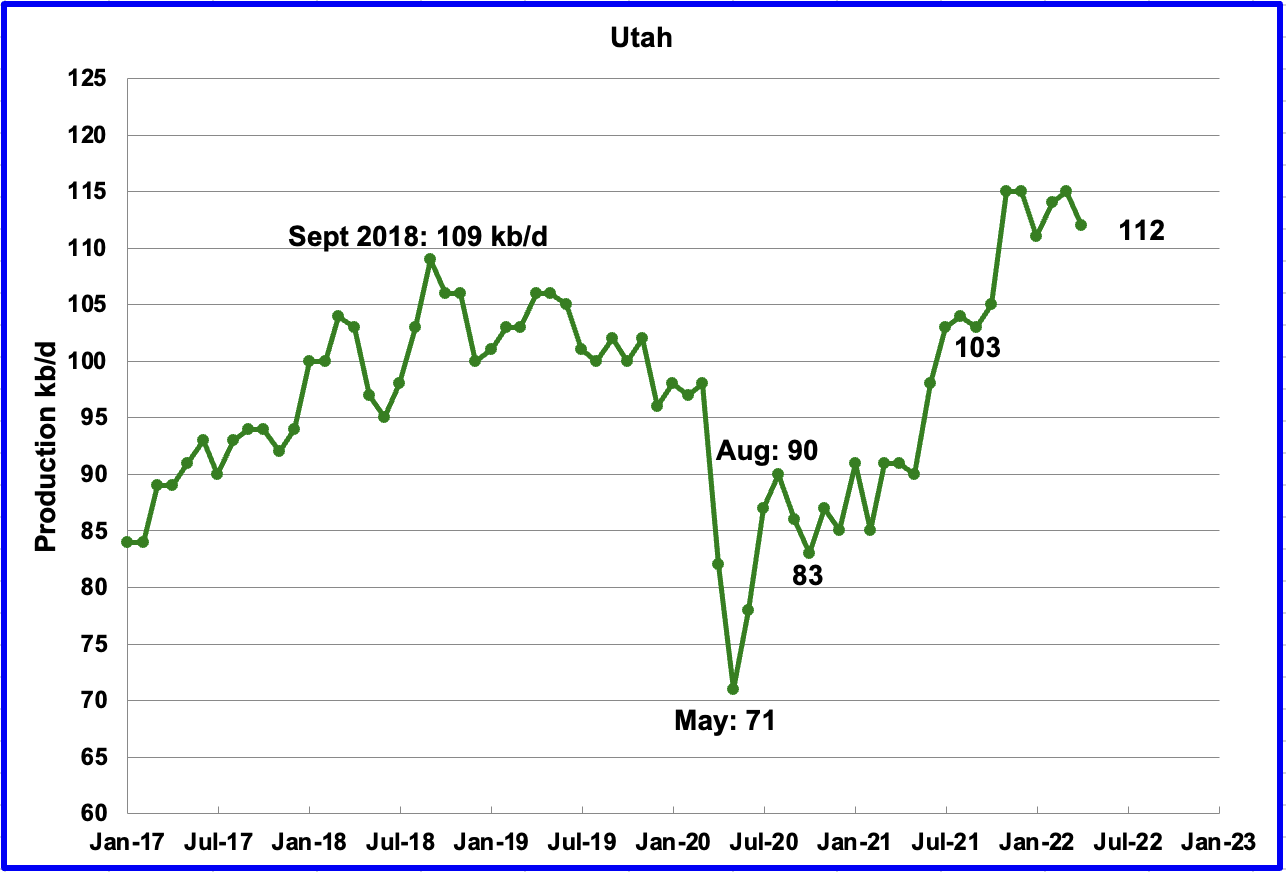
Utah’s production increase from the low of 71 kb/d in May 2020 appears to have stopped in December 2021. April’s production decreased by 3 kb/d to 112 kb/d.
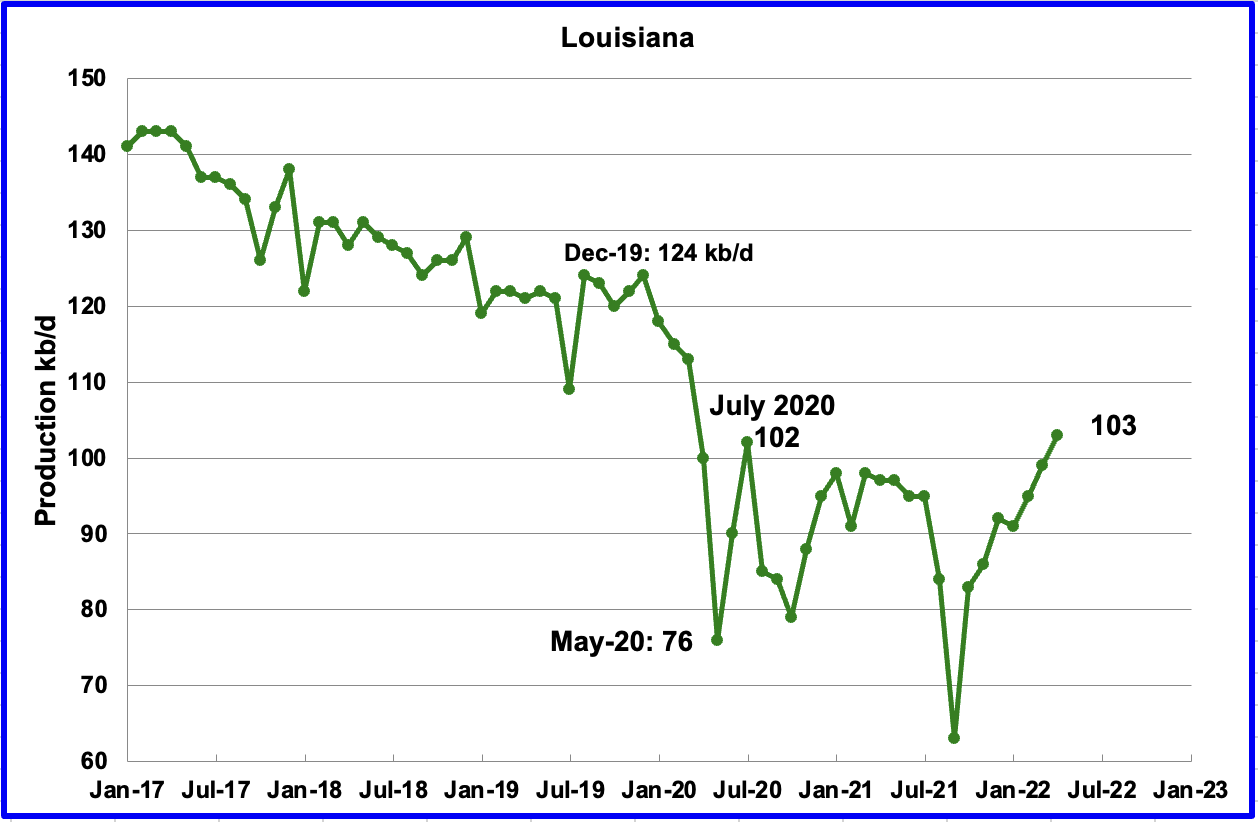
Louisiana’s output increased by 4 kb/d to 103 kb/d in April. Louisiana, one of the hardest hit states by hurricane Ida in late August 2021 seems to have fully recovered from the inflicted damage since production has increased every month since then.
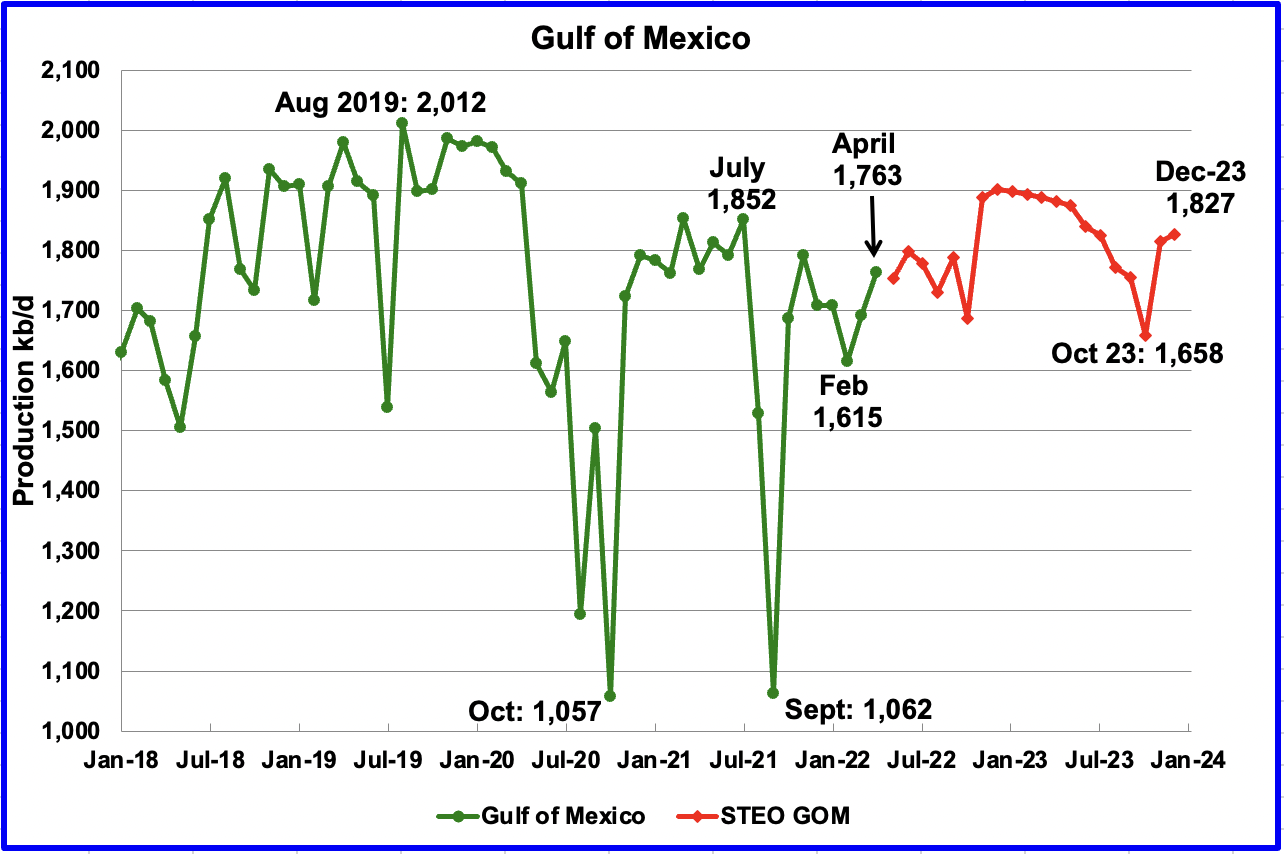
GOM production increased by 72 kb/d to 1,763 kb/d in April. If the GOM was a state, its production would normally rank second behind Texas.
The June 2022 STEO projection for the GOM output has been added to this chart and projects output will be 1,827 kb/d in December 2023. This is 29 kb/d higher than projected in the May report. For May 2022, the STEO is projecting little change in output.
The increase in the GOM output near year end is due to Shell’s Vito platform coming online.
https://jpt.spe.org/shells-vito-on-track-for-year-end-startup
Vito is expected to come on line prior to year-end. The project as sanctioned calls for delivery of a peak 100,000 BOPD via eight subsea production wells tied into a single manifold. However, a second chapter to the Vito story is already well underway.
In order to capture all it can of the expected 300 million bbl of reserves at the field, Shell is planning a waterflood project for Vito that should take final investment decision (FID) roughly a year after the field comes on stream. The water flood not only calls for additional topsides equipment to be squeezed onboard the smaller host, but three additional wells are also planned. The current plan has these wells being initially used as producers before being converted to water injectors, according to Stacy Fresquez, Shell’s Vito waterflood project manager.
A Different Perspective on US Oil Production
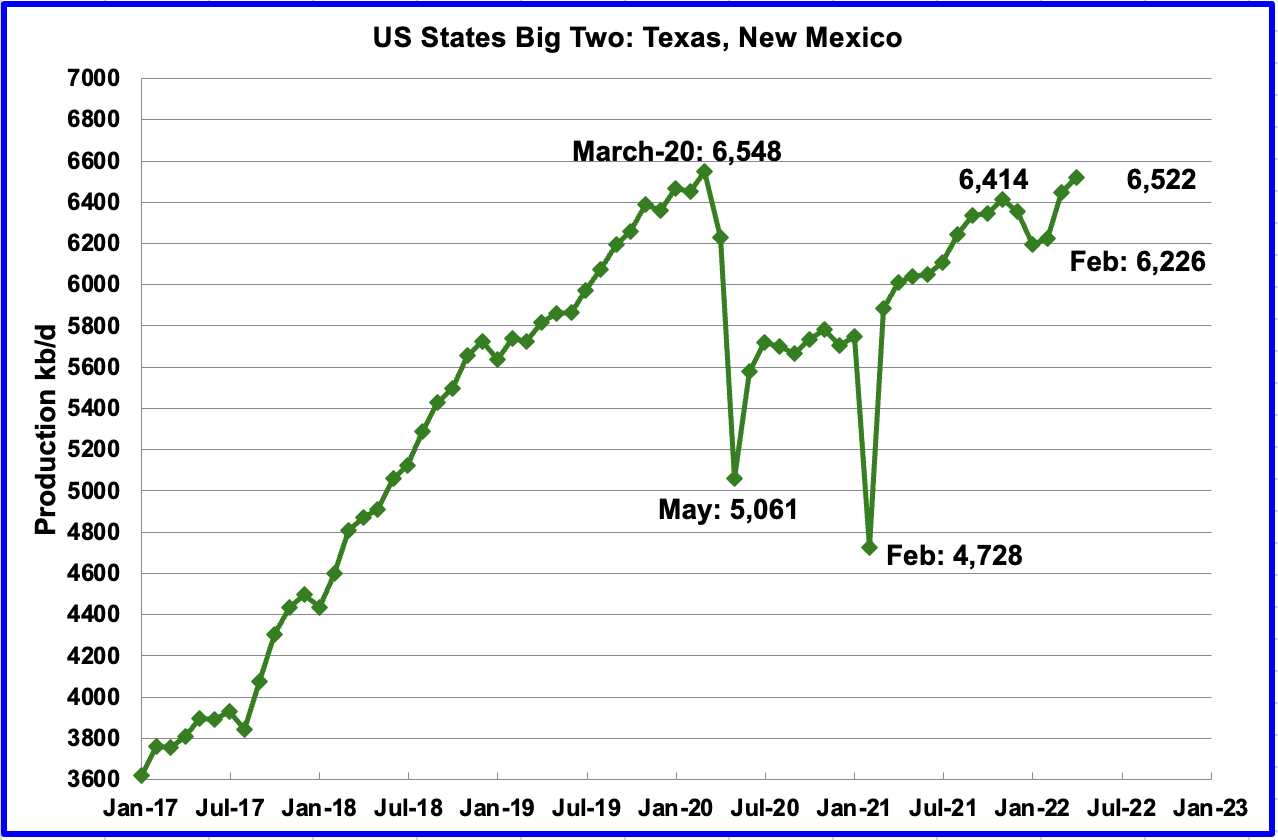
The Big Two states, combined oil output for Texas and New Mexico.
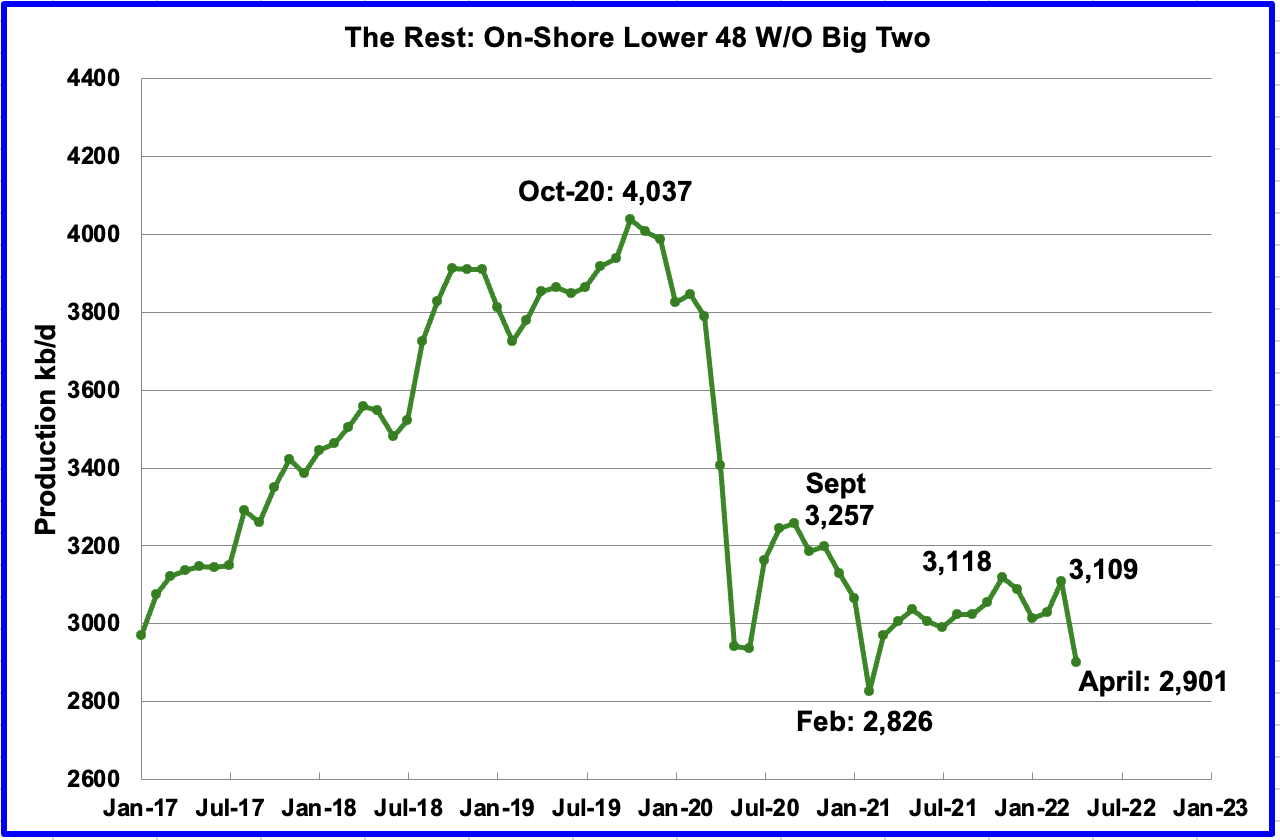
Oil production for The Rest
To get a different perspective on US oil production, the above two charts have segregated US state production into two groups, “The Big Two” and the “On-Shore L48 W/O Big Two” or The Rest.
April production increased in the Big Two states by a combined 74 kb/d, with Texas adding 35 kb/d and New Mexico adding 39 kb/d.
Over the past year, production in the Rest appears to be holding steady at close to 3,000 kb/d. However in April production decreased by 208 kb/d to 2,901 kb/d primarily due the 214 kb/d decrease in North Dakota.
Frac Spreads
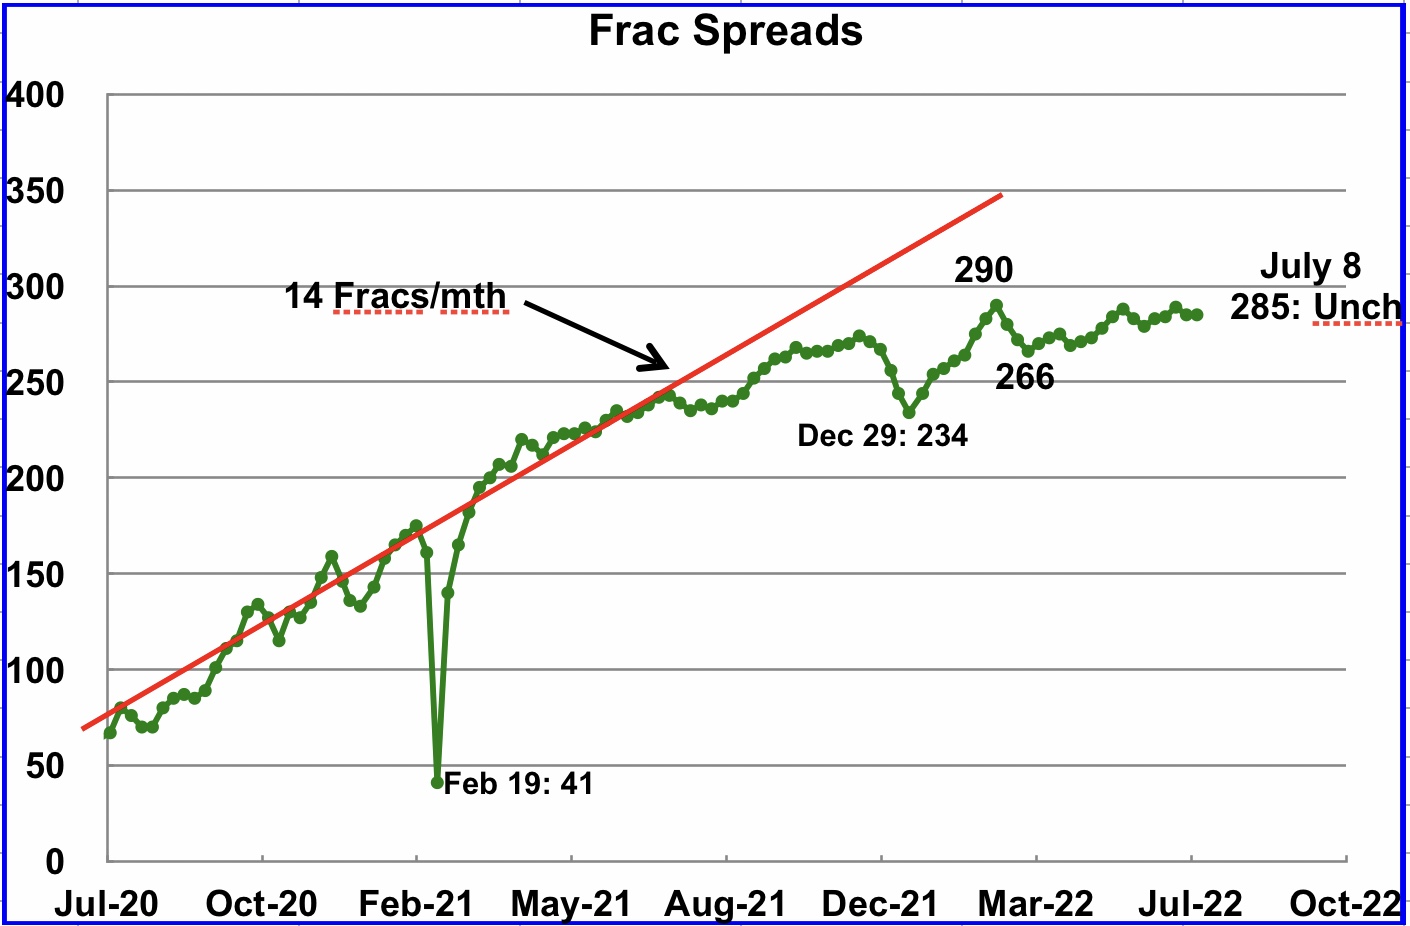
Frac spreads were unchanged at 285 for the week ending July 285. Frac spreads typically do not change much on the week following a long weekend.
Note that these 285 frac spreads include both gas and oil spreads.
The oil rig count for the week ending July 4 increased by 2.
LTO May Update
The EIA’s LTO database provides information on LTO production from seven tight oil basins and a few smaller ones. The June 2022 report updates tight oil production to May 2022.
Due to technical difficulties the EIA just released the June LTO report on July 8, 2022.
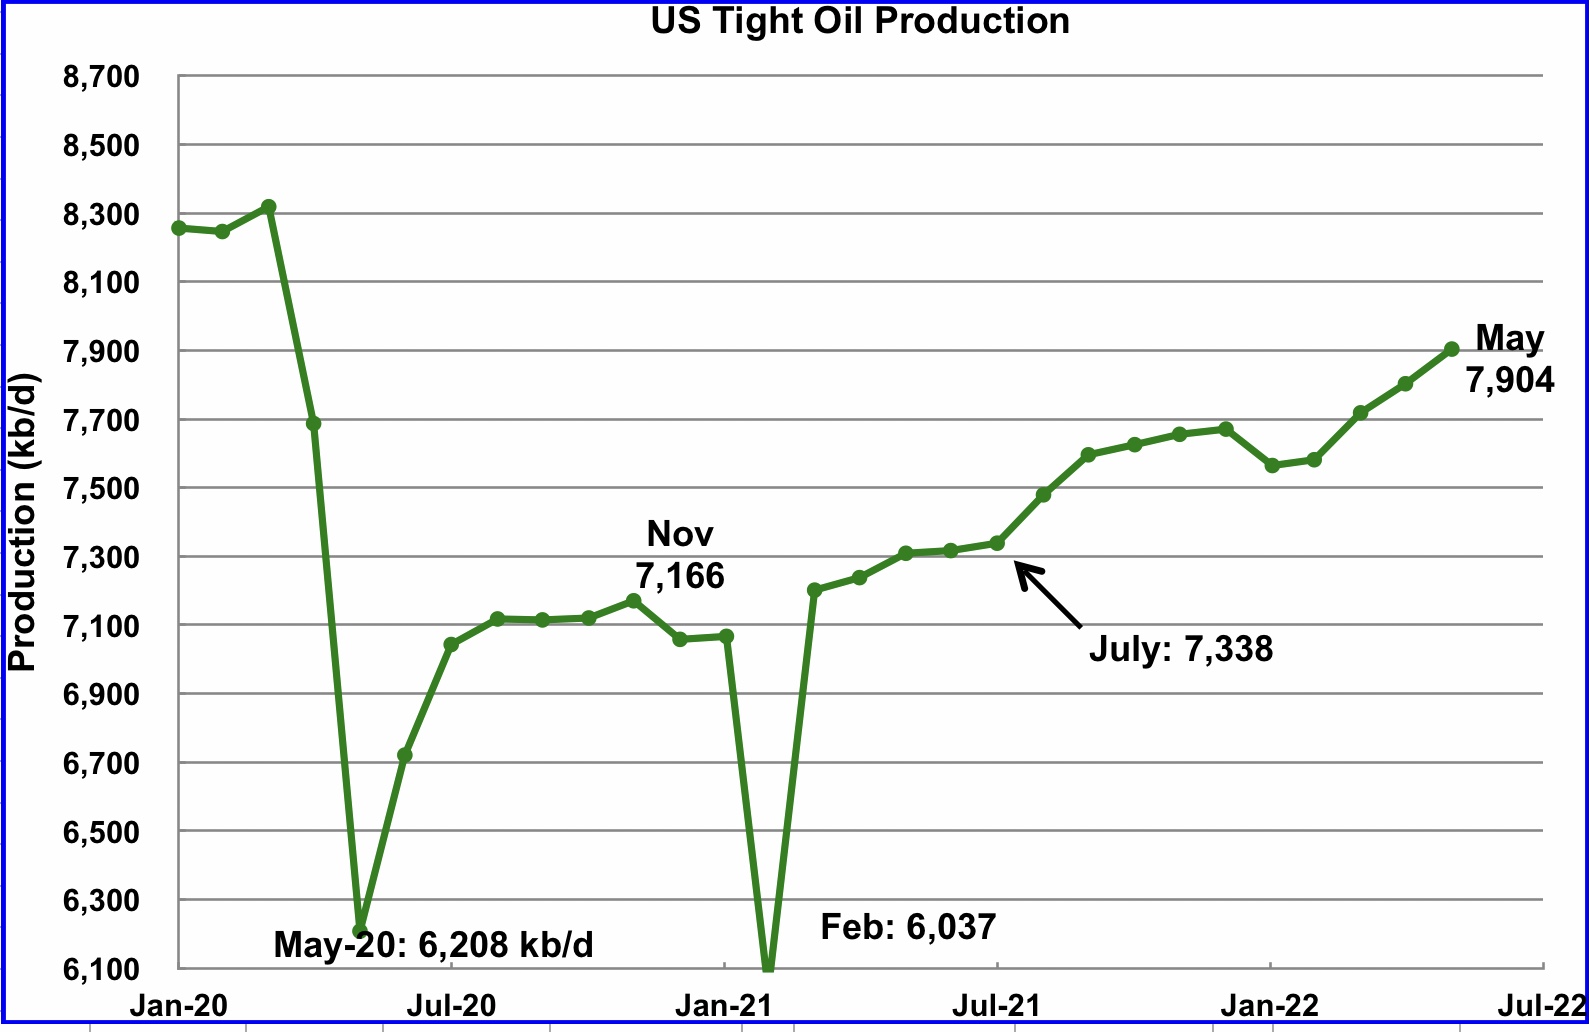
The EIA’s June LTO report made upward revisions to the May production forecasts reported in the previous post. The biggest revision in output occurred in the Permian from January to April 2022 in the order of 100 kb/d.
May’s LTO output increased by 101 kb/d to 7,904 kb/d. April’s output was revised up by 98 kb/d.
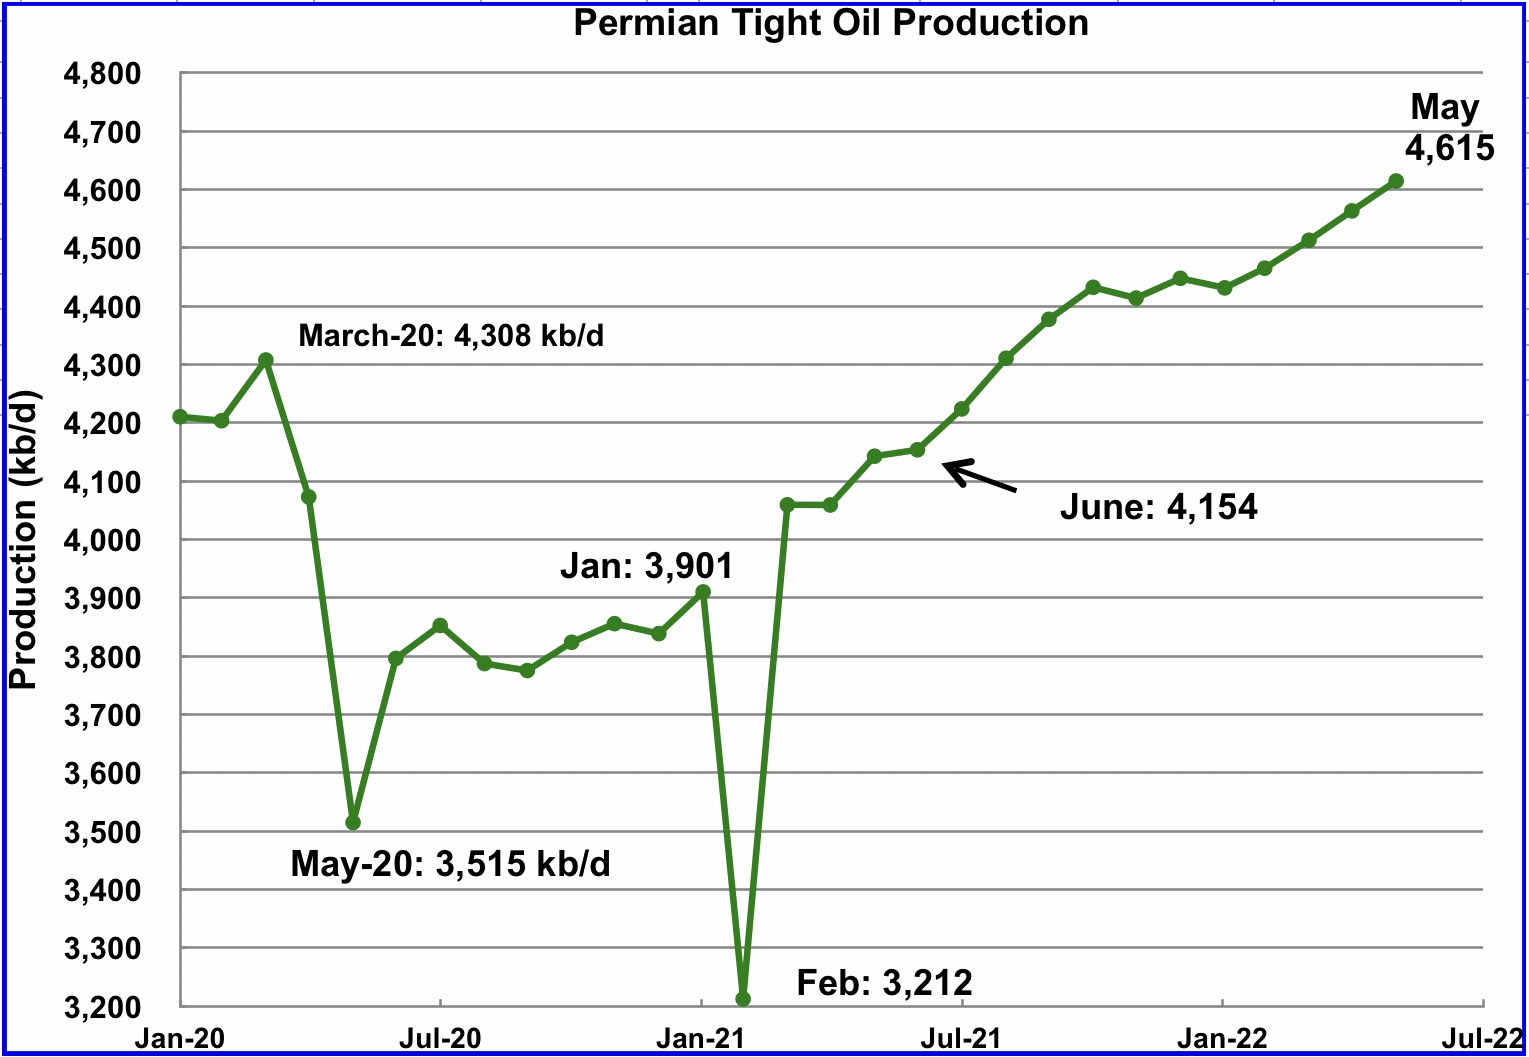
May’s output increased by 52 kb/d to 4,615 kb/d and is 307 kb/d higher than the high of 4,308 kb/d recorded in March 2020. April’s output was revised up by 92 kb/d.
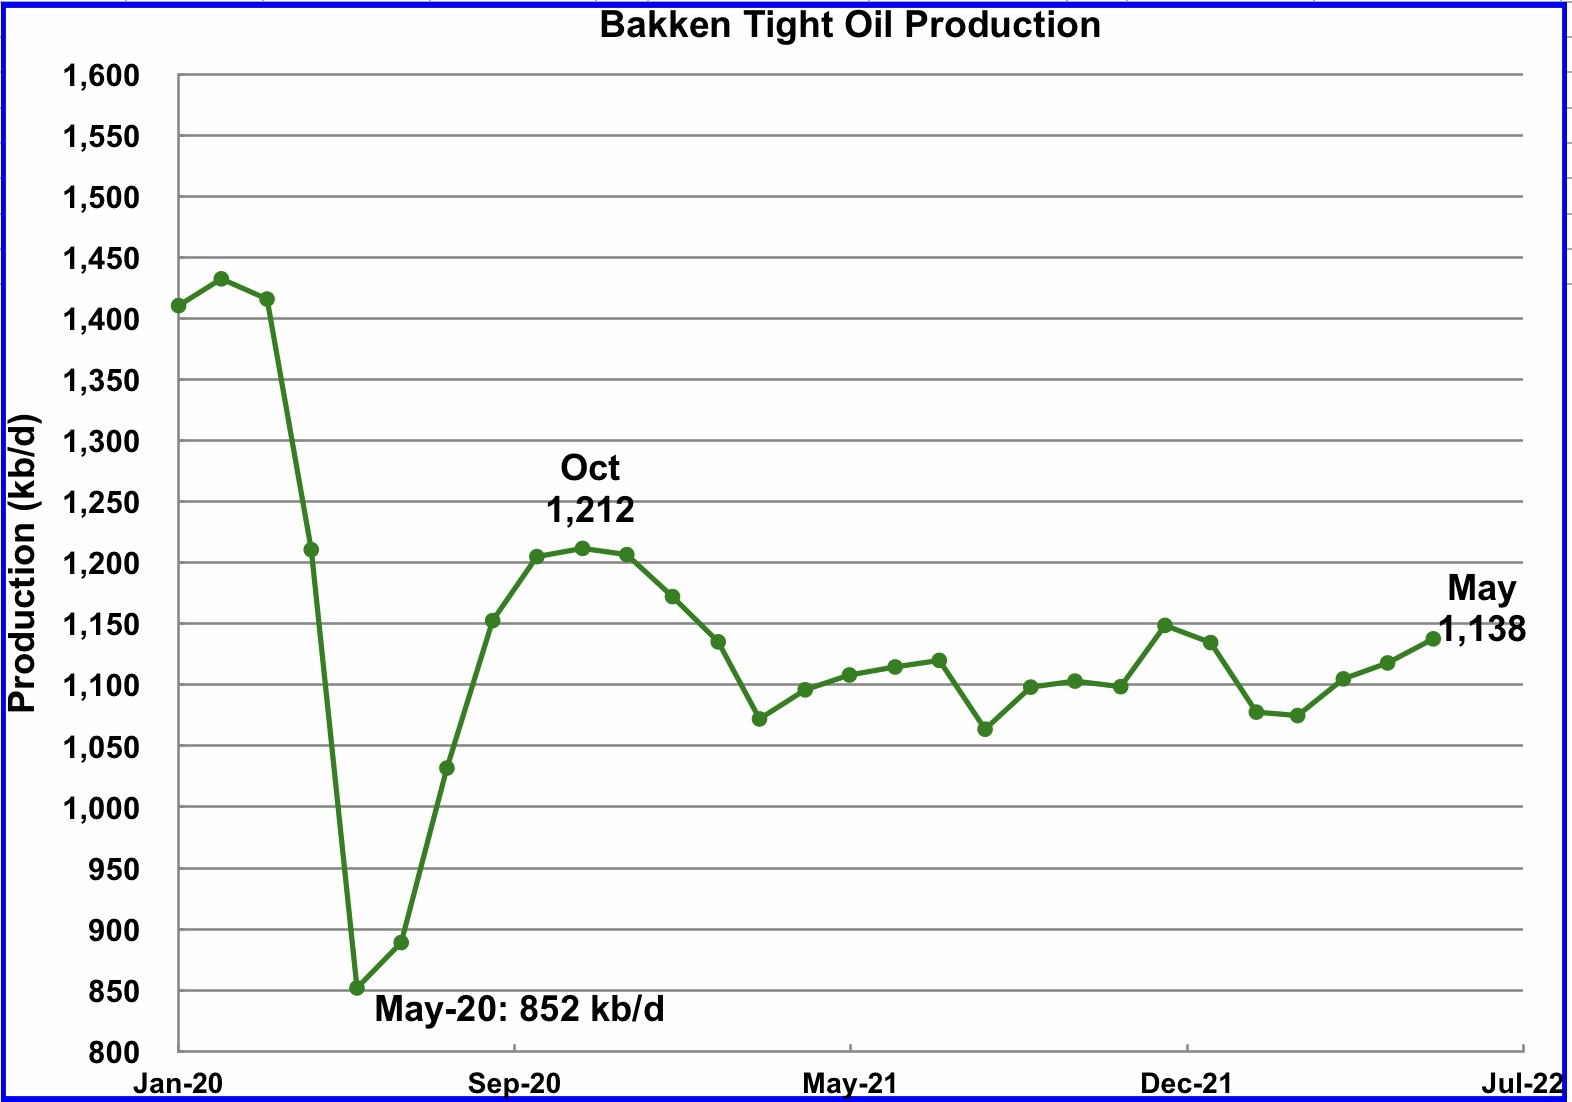
The Bakken’s May LTO output increased by 20 kb/d to 1,138 kb/d. Note the EIA reported a drop of 214 kb/d in April for North Dakota in the production charts above. Will the April drop show up in the July report.
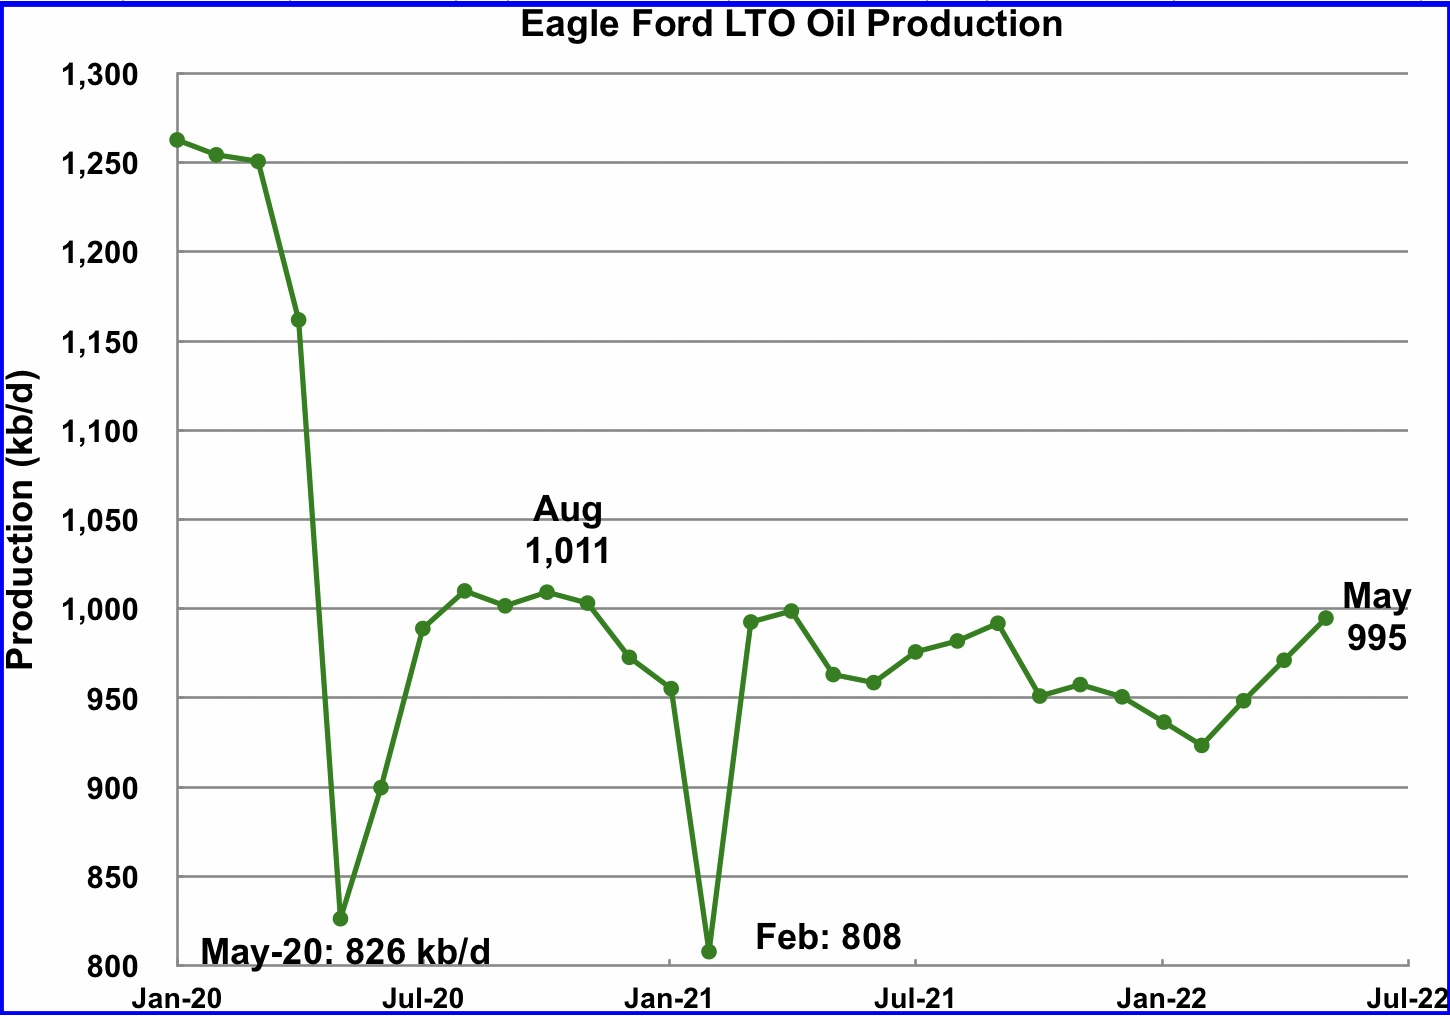
The Eagle Ford basin production increased by 24 kb/d to 995 kb/d in May.
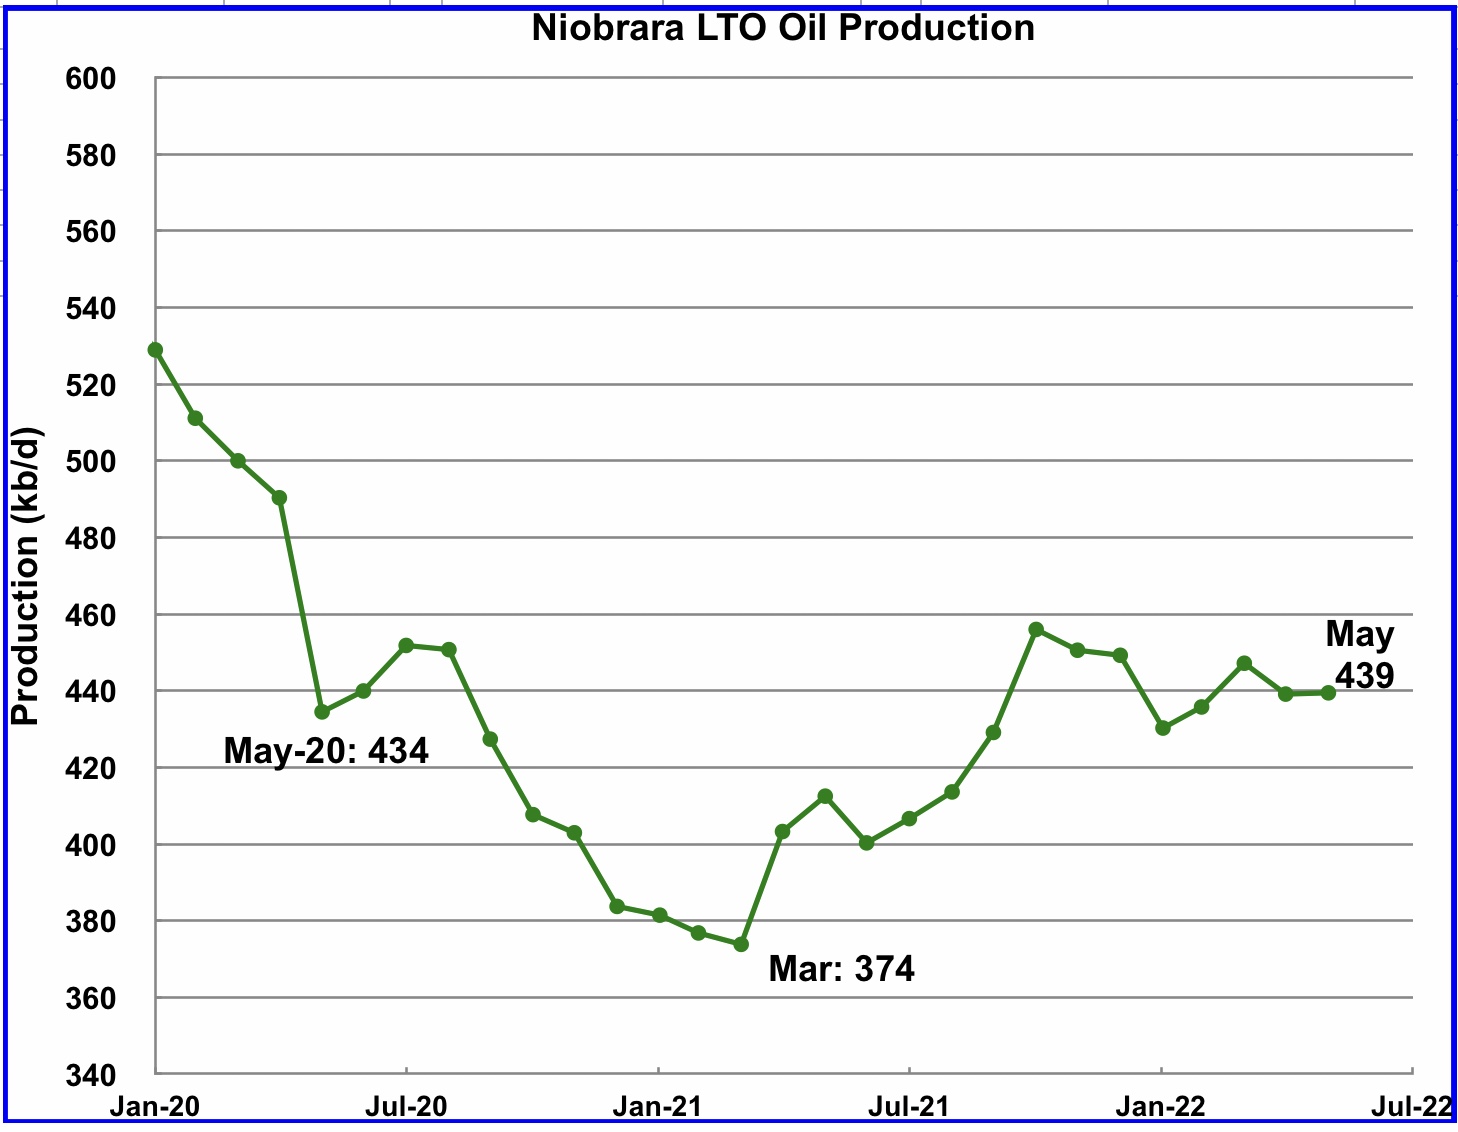
After increasing production from March 2021 to October 2021, output in the Niobrara began to drop in November 2021. May’s output was unchanged at 439 kb/d.
256 responses to “North Dakota Sinks US April Oil Production”
Ovi.
Is there data on how many horizontal rigs and horizontal frac spreads are still stacked?
Also wondering if service companies have plans to build more. I would think labor issues could limit building more.
As always, thank you for all of your contributions!
Shallow sand,
One way to estimate stacked rigs is to look at current rigs vs previous peaks, some rigs may be taken out of service completely and there is no data on that as far as I know.
Similarly for frac spreads we could look at peak vs current (though for frac spreads we do not have a breakout of vertical vs horizontal or even oil vs gas, just total frac spreads operating.
My impression is that not many new vertical tight oil wells are being drilled any longer in the Permian, but my guesses are often incorrect. Maybe someone in the oil biz can correct me, if I am wrong on this.
In October 2019 there were about 382 frac spreads operating in the US, in June 2022 there were 289 frac spreads operating, so at most there would be 93 frac spreads stacked if we assume no frac spread equipment was scrapped and no new frac spead equipment was built (or that number scrapped is equal to nuber of new spreads built). If we go back to 2018 the maximum number of frac spreads operating that year was 508 (I don’t know how long this equipment lasts or the vintage of the equipment running in 2018). Using that metric (and the same assumption as befor that frac spreads scrapped is equal to new frac spreads built) we would have 219 frac spreads stacked in the US (both oil and natural gas).
For horizontal oil rigs the maximum rigs operating in the US in 2018 and 2019 was 786 rigs and the recent number was 541, so about 245 rigs stacked if scrapped rigs is equal to buit rigs over the Jan 2019 to July 2022 period. The high point for horizontal oil rigs from Feb 2011 to July 2022 was November 2014 at 1115, I imagine rigs from that era might be obsolete (again I may be wrong), if not there could be as many as 574 horizontal oil rigs stacked (I doubt the number is this high). Note that the high point for frac spreads was 2018, not 2014 or 2015 as it was for rigs, though we only have frac spread data back to Jan 2014.
Data on rigs from
https://bakerhughesrigcount.gcs-web.com/na-rig-count
Frac spread data from
https://www.aogr.com/web-exclusives/us-frac-spread-count/2022
I agree labor, steel, and other supply issues may be limiting any new build of rigs and/or frac spreads, though public oil companies are not ramping very aggressively, so there may be no need to build new rigs or frac spreads if there are as many stacked as my rough estimate suggests. It is not clear how long the equipment can remained stacked and still be serviceable. You would know better than me.
You’d have to be formation specific with what you call “tight”, but there looks to be 70 formations as distinct targets (including named benches of a overarching formation) and maybe 100 V and 1500 H coming online through April. The last time I checked the ratio was for 2015 to present, and across that timespan the Permian ran about 1/3 V and 2/3 H. The world has changed across that timespan of course. In 2021 exclusively, the ratio was about 10% V, 90% H. Oftentimes there are yearend catchups in vertical well information, so reporting might cause them to be low throughout the year, and true-up around the end of the year. If the 2021 ratio holds, there are 50 unreported verticals already out there.
Reservegrowthrulz,
For the Permian basin, there have been a lot of vertical wells drilled, but if we use drilling rigs as an indicator, it seems lot fewer vertical rigs are operating. on a percentage basis than in the past.
As far as specific formations in the Permian, I focus on the Wolfcamp, Spraberry, and Bonespring formations (those are the three reported by the EIA that aren’t lumped into the “Rest of US tight Oil” category for the official EIA tight oil estimate. When the EIA data for these three formations is compared with the shaleprofile.com data (which includes horizontal tight oil output only) the difference is about 225 kb/d (Jan 2021 to June 2021 data to avoid under reporting by RRC.) So roughly 95% of output is from horizontal wells, as of June 2021. Much of this may be from older wells, the contribution is fairly minor and I tend to ignore it.
I have assumed that most horizontal oil rigs are used for tight oil wells, the chart below indicates this might be a correct assumption for the US. US horizontal oil rigs (left vertical axis) and US tight oil output in kb/d (right vertical axis).
Reservegrowthrulz,
Also the fact remains that I don’t have a way of distinguishing vertical frac spreads from horizontal frac spreads, I simply have a number on all US frac spreads operating in the US (oil, gas, horizontal and vertical). My guess is that most (95% or more) of the vertical wells drilled are conventional oil wells and that most tight oil wells completed these days are horizontal wells, is that not the case?
Dennis.
Bloomberg had a couple of good articles you might want to link here.
One was about the frac sand shortage. Prices have jumped from $22 per ton to $55 per ton.
The other was a looming shortage of petroleum engineers. In 2017, over 2,300 graduates with that degree in the USA, this year about 400, ten year projection 200-400 annually.
Super-cyclical nature of upstream plus ESG.
Cry me a river, poor petroleum engineers. 1986 had plenty of us walking the streets, and by 1987 the continued consequences of Yamani’s instilling discipline in OPEC decimated the BSPE graduating classes as well. Either you’ve got what it takes to be oilfield, or you don’t. Downturns are quite efficient at sorting this one out.
Not sure I understand your comment.
Apparently there will be a permanent shortage of petroleum engineers. That is good if you are a petroleum engineer, and not good if you need them.
If 1986 affected you in a big way, you are definitely no kid. I’m not a kid either, and I was in high school in 1986, lol.
Our biggest concern with continuing to own our stripper wells is labor. I have posted that numerous times.
Surely you see the same labor issues we do?
We have owned stripper wells (family) since the 1970’s. Only in the past 5 years or so did we find it difficult to find workers. Post Covid, they really disappeared.
A factory in our county seat is expanding and will be looking for over 100 more blue collar workers soon. That’s going to decimate out little 2,500 production well stripper field that still has less than 10 WO rigs running and zero drilling rigs running with $100 oil.
Recent comment from one of the owners of a service firm in our field is he is hostage to his employees. The will not work any day except M-F, will not work OT, want all government holidays off paid, and call in sick frequently. Greenhorn hands are now commanding $22 an hour, was $15 pre-COVID and was $12 during the 2016 down turn. I’m talking someone who has zero experience.
I’m not saying that’s good or bad, it’s definitely a switch for unskilled blue collar workers, who haven’t had this much power in decades. It merely is the reality, meaning to me the chances of some great future boom in production in the USA won’t come easy.
Looks to me it’s all on the Permian, and low “break evens” won’t be happening there. I assume any greenhorn warm body can command close to $30 and hour in the PB and other shale fields?
Many ignore the shale boom was built on the backs of cheap, transient labor that came out of the Great Financial Crisis. The cheap transient labor is no more in my view. Maybe I’m wrong?
I am familiar with stripper well companies that absolutely cannot replace field personnel, well tenders being the most basic, and hard to find. Once upon a time, farm boys who liked hunting and fishing were the most likely candidates to replace existing personnel. They can’t be found now. And the service rigs sit idle for lack of operators.
Your experience tracks exactly what I’m familiar with at the least 3 different smaller operators.
Shallow sand,
I found this on sand, seems mobile mining may be a solution in the Permian
https://www.worldoil.com/news/2022/7/6/the-price-of-frac-sand-has-spiked-150-for-permian-oil-producers/
I found Bloomberg article but it is behind a paywall, interestingly I found many articles from 1965 to 2022 claiming that there was a looming shortage of Petroleum Engineers.
Dennis.
Who knows, maybe there won’t be a labor shortage forever.
Maybe 200-400 PE grads will be plenty?
But the demographics aren’t favorable in the USA at this time.
As for oilfield work, where we live it has kind of been a family affair, especially after the larger companies sold out in the late 1980s and early 1990s. The number of families still in the oilfield has dwindled, and there are no new entrants. Similar to farming here.
Shallow sand,
Difficult to say, I imagine oil field work is pretty tough, more so than a factory job, so it may be necessary to pay people more, etc to attract good workers, not sure that this would be enough. Probably if there were a simple answer you would have implemented it. I hope at least your making some money. What kind of price per barrel did you get for your June production, if you care to reveal. I would think you get about $5/bo less than WTI so maybe $99/bo, that would be nice after the lean years from 2014 to 2021, though increased costs obviously hurt the bottom line.
Dennis.
Oilfield work is no picnic.
But there are benefits to it over factory jobs.
For oil sold in June, which will be paid in July, we got a little over $110, which is the highest we have received in many years.
No complaints at all on that, and no doubt now the cash flow is strong. Even the current pull back, we are still doing very well, best in about a decade.
Just looking in the future trying to figure out what happens down the road.
Always have some complaint, even during the good times, lol.
I do think the labor market is completely different than it was post 2008. That’s not just in upstream E & P.
Upstream E & P is located in rural areas primarily. Populations are rapidly aging and are declining there. The enrollment at my high school in 1969 was over 800. When I graduated almost 20 years later it was about 620. It is now about 400. The smaller high schools have seen steeper declines, and several have consolidated in recent years.
A lot of people moved from urban areas to the Bakken in search of work post GFC. I have read labor shortages are most severe in the Bakken compared to other shale basins. Not an easy place to live and work for sure.
Shallow sand,
Awesome. I hope things continue to go well for you and other oil men (some of whom would rather not be associated with POB in any way so I will not mention any names), my guess is that oil prices will remain in the $80/bo to $120/bo range for at least a couple of more years and likely may move higher from there as we approach peak oil. You guys should be in the high cotton, or that is my hope.
For an oil field hand what are the benefits you refer to relative to a factory job, fresh air and sunshine?
Dennis
Many posts past, an oil field expert pointed out that a vertical drill is often used to start the well before swapping in the horizontal drill. At this time I cannot see why anyone would use a vertical we’ll for production unless the pay zone was very deep and very narrow.
Maybe someone can confirm that or update us with the new thinking on vertical wells.
Ovi,
I would think it would be simpler logistically to use the same rig for the whole job and not have to move one rig in and then out and then move a different rig in to finish the job, perhaps an oil man will set us straight. I thought I remembered hearing two different stories. I guess I don’t remember.
Dennis
As I understood it, the vertical drill just drills one vertical well. The hz rig then drills multiple wells/laterals from that single vertical.
Ovi,
I think they just have several wellheads on the same drilling pad, again I will let oil men correct us.
I am familiar with people having done this. I’ve always found managing multiple production streams from a single top hole to be a pain in the ass, and best avoided.
Reservegrowthrulz,
Do you know if using a single top hole is common practice for tight oil multipad setups?
Also is it common practice today to use a separate vertical rig to do the top hole and then bting in a second rig to do the bend and lateral? Currently there are 16 vertical rigs running in the Permian and 331 horizontal rigs, seems logistically this would be a nightmare and simpler to use the same rig to do the entire drilling job.
Your insight is appreciated.
Ovi,
You might be surprised by the activities described in the May issue of aogr.com (Mid Continent Operators Firing Up …) of smaller operators currently drilling vertical wells, many right in Kansas.
Vertical rigs are also still used to drill ‘top holes’ where casing is placed down 2,000 to, I beleive, 9,000 in different formations.
There may be 3 to 5 top holes prepared on a pad by these smaller, less expensive rigs, which are then followed by the big rigs that will drill the curves and laterals.
This is one reason why it takes only about 5 days to drill a Bakken well. (Early wells routinely took 50/60 days.)
Fastest lateral drilling of which I am aware is the ~11,300 feet that Antero has drilled in 24 hours in the Marcellus.
Coffeeguyzz,
In the most recent week reported there were 16 vertical rigs operating in the Permian basin and 331 horizontal rigs. There may have been a time when a vertical rig drilled the vertical section of the well and then a horizontal rig was brought to the site to finish the bend and lateral, but I doubt this is still the case in the Permian basin for horizontal tight oil wells, the numbers semm to suggest that I may be correct, but I will let someone more familiar with the process correct me.
Coffee.
There have been around 50 rigs drilling mostly vertical wells in Kansas in 2022, per the Independent Oil & Gas Reporter. There have been 10-12 rigs running in the Illinois Basin in 2022 (which includes SW IN and W KY), per the Illinois Oil & Gas Association. Some of these are horizontal wells.
In fact, in White County, IL, and across the Wabash River near Griffin, IN, there has been success with horizontal wells for several years. I’m not sure of the economics, but operators drilled them even during much of 2015-2019.
This doesn’t surprise me given oil prices. However, looking at these State’s monthly production, this isn’t enough to move the needle on anything.
Also, have to think these wells are costing a lot more. I assume the companies drilling them have mostly used up their steel inventory and are now having to buy casing at the market.
Our most recent 2 3/8” tubing purchase was 14 joints at $7.50 per foot, which plus tax was over $3,600.00. Ouch!
In all of these states they are targeting zones mostly less than 5,000’. Cheaper wells but also less productive than in the major shale basins. And I’m positive they are costing way more than pre-COVID.
We might actually consider drilling if we could do it for close to what it cost in 2014. But I’m sure we’d be looking at close to double now, as we have no casing on hand and contract everything.
Lease holding. Reservoir delineation. Logging. Water disposal. There will always be reasons to drill vertical wells.
I remember back when <6000' TD verticals were the game into the Clinton-Medina in Ohio, when working for the consulting company I would refer to them as "barber and dentist" wells, because I was pretty convinced I could either of them how to drill them. Not too worried about petroleum engineers being needed much for those types of wells, unless the barber or dentist gets into a bind.
A few comments to help clarify.
Vertical wells are extremely efficient at draining reservoirs with adequate permeability, such as conventional sandstones. Where reservoir quality is poor, hozontal wells are required to establish adequate contact. With permeability, the quantitative differences between conventional and unconventional reservoirs are orders of magnitude. For example, I have worked 100 milliDarcy sandstones and single digit microDarcy shales. The sandstones simply require running casing and perforating to initiate production. The shales will often not produce any hydrocarbons at all if not fraced.
The horizontal rig and vertical rig verbiage is a bit of amisnomer. A standard rig can drill one well at a time but must be rigged down to move to the next. Newer skid style rigs can drill multiple wells on a pad without taking down the mast by simply skidding over to the next well, which may be as close as 5 feet away.
https://youtu.be/D6M1mTl80MI
We wouldn’t drill multiple straight vertical wells from one pad, but we do use the same rigs to drill S shaped wells in some reservoirs. So at surface we typically have 6-24 well slots, vertical wells for the first 1000 feet or so, angles out to the targets, and then vertical wellbores through the pay. Depending on reservoir characteristics, bottomhole spacing might be in the 20-160 acre range.
The reservoir characteristics determine the optimal well types.
Either the rig capabilities or likelihood of well type determine the classification of horizontal or vertical.
Quite a bit of simplification here, but hope it helps. Glad to add more if anyone has interest.
El Dano,
Sorry about not typing your name correctly, I don’t know how to do the tilde on my laptop.
Thanks. I understand the differences in permeability between conventional and tight oil reservoirs and the need for fracking the tight oil wells to create some flow. There are two questions specific to tight oil wells drilled from a single pad (I have read that 3 to 5 wells per pad is optimal in Permian basin so let’s picture such a setup).
1. Is the typical setup a single vertical top hole with multiple horizontal wells drilled from that single top hole? (based on your comment I believe the answer is no this is not typical).
2. If a top hole is drilled for each well on the pad, does a different vertical rig drill several top holes and then a different “walking horizontal rig” is brought on site to finish the drilling job?
I think you would say it depends, but I am wondering what covers about 75% to 95% of the tight oil wells drilled. It seems from your comment that the skid type (or walking ) rig would usually do the entire drilling job from start to finish, but I may have misunderstood.
1. What you are referring to is a multilateral wellbore. These are engineering feats but are primarily applied in offshore applications, and even there they are not common. The standard unconventional well is one surface hole with one lateral.
2. The same rig drills the vertical section and the lateral. The very first tool to show up has various designs but installs a large diameter, typically 16″ to 24″, conductor pipe to a depth of around 100 feet to hold back loose surface sediment. Then the drilling rig moves in, rigs up, and gets after it. The first string of pipe is called the surface casing and is typically set to regulatory mandated depths to protect fresh water aquifers. Normalish depths are 500-3000 feet depending on the area. Because the Permian has older conventional zones to drill through, another string of “intermediate” casing is likely set to isolate those zones while drilling the horizontal section. Deep (vertical wells) can have multiple intermediate strings. Once the vertical section is cased and cemented, the rig picks up the directional (MWD/LWD) tools and gets after the horizontal section. As others have mentioned, the mobilization overhead would be greater with having a separate rig drill the vertical sections first.
El Dano,
Thanks.
SS
Dennis has provided a good answer and I don’t have a good source of data.
I am not clear on how much management decisions in big companies make in deciding how many wells to drill. I would think that Frac spreads are more a question of customer demand. Since late November, frac spreads have only increased by 10 while rigs have increased by close 125.
A while back I heard a commentator say that half of the frac spreads are in the Permian and that they don’t need anymore. He also said that most new Frac spreads are going to the other basins. Maybe that is why the frac spread count is going up so slowly. Wish there was more/better info available on frac spreads.
SS,
Finally got around to (re)reading some of the companies’ recent conference call transcripts that somewhat address your questions.
As per Helmerich and Payne’s CEO, they have ~171 Super Spec rigs working, with another ~60 stacked.
Industry wide, about 150 Super Spec capacity rigs are idle.
They feel that there is very little incentive for new builds, but a great deal of ‘wrangling’ continues around contract terms with existing and potential customers (~$35k/day rate seems to be what they want).
Chris Wright from Liberty said that virtually all pumping capacity on the completion side is being utilized, with minimal new building taking place. Most of the new hardware is geared towards electric frac’ing.
Big emphasis on shortages of parts, supplies, and qualified labor (along with increasing costs) that prompt high degree of cautious planning right across the board.
Permian Basin Horizontal Oil Rig Count, annual rate of increase for past year about 114 rigs per year. If that trend continues for another 12 months the horizontal oil rig count in the Permian basin would reach 445 by next July. The peak Permian basin horizontal oil rig count was 443 in Jan 2019 (Feb 2011 to July 2022) and the peak 52 week average was May 2018 to May 2019 at 430 rigs.
Other GOM projects set to come online in 2022 include Murphy’s King’s Quay, LLOG’s Sprouse, and BP’s Mad Dog 2 (officially named Argos), and two other tiebacks – Dome Patrol and Taggart. None of these are reflected in the April numbers. Some may get pushed out to 2023.
Here is a link to a recent EIA writeup on these projects.
https://www.eia.gov/todayinenergy/detail.php?id=52819#
Thanks Bob.
Does the crude oil projection look reasonable on that EIA page? You follow this more closely and would catch poor projections better than most of us (with the possible exception of George Kaplan who follows offshore stuff as well).
Dennis,
I’m a little surprised they drop production off as much as they do in late 2023. I can see a down month for hurricanes, but with all these fields coming online, and three of them having +/- 100 kbopd capacity, I would have kept the production higher.
In their writeup, they say 2023 production will be the same as 2022 – I have 2023 higher than 2022.
thanks Bob, interesting.
Using the average annual increase in Permian rigs for past year extended for next 12 months (9 rig increase per month) and then assuming that rate drops to 4 per month in July 2023 and then to 2 per month in July 2025 with wells drilled per rig at 1.17 based on the correlation between rig count and wells drilled from March 2021 and May 2022. The completion rate for my low Permian scenario (ERR=43.5 Gb) is also shown, DUCs increase to 3415 by Dec 2026 for this scenario.
The Permian basin output for this scenario (maximum completion rate is 650 wells per month from Sept 2026 to Sept 2028 and completion rate then decreases gradually to zero by April 2034. Peak is in 2029 at 8580 kb/d, ERR is 43.5 Gb, total wells completed from Jan 2010 to April 2034 is 103,752. Through May 2022 about 35,773 wells have been completed in the Permian basin, with about 5400 wells completed from May 2018 to April 2019.
If Permian production ramps up like Dennis postulates over the decade,
will there be enough capacity to move it towards the refineries, and enough capacity once it gets there?
Hickory,
No the refineries are already maxed out on light inputs, the oil will be exported and we will import oil that has the correct API gravity for current refinery setup. It is not worth the money for the refineries to change there setup. If the US decides to restrict crude exports as some people favor, then this ramp up in Permian output will not occur and after 2030 the oil is likely to become a stranded asset.
In addition the US will see increased oil prices as a result because World oil supply will decrease and the price of imported oil will increase. The basic argument for free trade is correct, the Republicans (the sane ones) are right on this point.
As far as pipeline capacity, there is plenty at present and the ramp occurs over a 6 year period in my scenario, plenty of time to build pipelines if needed, though a good point, the pipelines are expensive to build and the peak will be short lived so that is a consideration that I had not included in my analysis, thanks for pointing it out.
Some quick research shows about 14 Mb/d of expanded crude pipeline capacity has been added in Texas, New Mexico, and Lousiana (included because oil often flows from Texas to Louisiana for export). Not clear which pipelines specifically target the Permian basin as I don’t know Texas geography at all.
I uses pipeline projects spreadsheet from page below
https://www.eia.gov/petroleum/data.php#movements
There has also been 32 BCF/d of natural gas pipeline capacity added in Texas from 2013 to 2021. Total natural gas pipeline capacity outflows from Texas and New Mexico are about 48 BCF/d. In April 2022 Texas and New Mexico produced about 35 BCF/d of marketed natural gas (dry gas and NGL that is sold on markets).
In the recent past natural gas pipeline constraints were more of a problem in the Permian basin.
Article linked below claims there is about 7.6 Mb/d of Permian crude outflow (or take-away) capacity.
https://seekingalpha.com/article/4479394-permian-pipeline-problem-fixes-on-the-way-in-2022
Hickory,
Perhaps a more realistic scenario would assume no more crude pipeline capacity is added in the Permian basin and the scenario would be limited to a maximum output of 7600 kb/d rather than the current scenario that peaks at 8600 kb/d. Also Permian wells will produce higher gas oil ratios over time so more natural gas pipleine capacity may be needed. Also there is the possibilty that some crude oil pipelines could be converted to natural gas or other products over time.
I’m wondering if there was no restriction on the import of various grades of crude [heavy] for optimizing refinery input, would the domestic refineries be able handle an additional 1,2,3 or 4 Mbpd crude from Permian sources. Or would refinery capacity be a constraint to production?
“US Utilization of Refinery Capacity is at 94.50%…This is higher than the long term average of 89.59%.”
“After more than two decades of growth in which the United States became the world’s largest refiner by volume, our industry has contracted. We’ve lost 1.1 million barrels of daily refining capacity over the course of the global pandemic with at least seven facilities shuttering, closing units or beginning the transition away from petroleum processing.”
more details here- https://www.afpm.org/newsroom/blog/refining-capacity-101-what-understand-demanding-restarts
Hickory,
I don’t think US refineries will be able to handle more than about 5000 kb/d of tight oil unless there are major refits to existing refineries, these are expensive and the short term nature of tight oil output (it will be declining rapidly after 2030) makes it a bad investment. Either the tight oil will be exported or it won’t be produced in my opinion.
As always I am often wrong, we will see.
” Either the tight oil will be exported or it won’t be produced in my opinion”
Thats what I was thinking.
Which does change the trajectory for US and thus global oil output this and next decade somewhat.
“Global refinery utilization as of June 2022 was about 79% (≈80 million barrels/day [MMBD] throughput out of 101 MMBD total capacity), much lower than utilization in the United States for some of the reasons stated above and also because many of the world’s refineries are facing significantly higher operating costs with the global surge in natural gas prices. Of the countries with the most refining capacity—the United States, China and Russia—only the United States is currently operating refineries above 90%. Russia has cut refinery utilization this year in the wake of its assault on Ukraine and resulting embargoes on Russian energy and refined products, and China is operating its significant refining capacity well below 80%.”
https://www.afpm.org/newsroom/blog/refinery-utilization-101-other-half-capacity-story
Hickory,
My guess is that US tight oil will continue to be exported, those who think stopping tight oil exports will reduce prices at the pump have it backwards, it will reduce global supply, increase World oil prices and the price of oil imports and lead to an increase in gasoline prices.
If we want higher prices at the pump, we will stop crude oil exports, not a policy that is likely to be chosen imho.
“those who think stopping tight oil exports will reduce prices at the pump have it backwards, it will reduce global supply, increase World oil prices and the price of oil imports and lead to an increase in gasoline prices. ”
Perhaps, but the domestic resource would last longer (without exports).
Currently, it appears that China has enough spare refining capacity to import US crude that exceeds our refining capacity, but I think that they will get a better deal on Russian or Iranian crude.
Maybe others like Korea or Japan would have spare refining capacity.
Hickory,
Yes the domestic resource would last longer, that is true. Note that there may be as much as 75 Gb of technically recoverable resources in the Permian basin (that is the USGS mean estimate). If we include only the most productive benches (or horizons) evaluated by the USGS and assume the less productive benches produce no oil, the TRR is reduced to 55 Gb. The F95 TRR estimate by the USGS is about 45 Gb for the Permian basin.
Note that my scenario assumes that oil prices start to fall from $100/bo (2021$) in 2031 to $65/bo (2021$) in 2037 and to $60/bo (2021$) by 2042 and then to $30/bo (2021$) by 2046 and then remains at that price. If the oil price scenario is roughly correct no new wells will be drilled after 2035, so any domestic oil resources saved for the future will remain in the ground forever. This is good from a climate change perspective, but the high oil prices that are likely to result might lead to a recession which than slows the transition to alternative to fossil fuel.
In my view free trade makes sense, but I do not rule the world, thank goodness. See yet another scenario downthread, URR=36 Gb.
I suspect that a country like the US will still have a big (>5Mbpd) demand even if 100% light transport was electric, for all the other applications such as petrochemical stock.
btw- I personally don’t have a big opinion on the export question. I don’t know all the aspects of the issue well enough to have earned one.
Hickory,
The oil industry pushed for allowing exports because there was little likelihood that refineries would be reconfigured to handle more light tight oil and maximum capacity to utilize tight oil output domestically was fast approaching.
I assume that this is still the case, that only about 4500 kb/d of tight oil can be handled by US refineries.
I also assume World supply will continue to be tight from now until 2030 at least, possibly longer. Anything that removes oil supply from the World market will tend to raise the price of oil assuming the demand curve for oil does not shift (transition to EVs tends to shift the demand curve to the left gradually).
Shutting down US exports of crude takes about 3000 kb/d off the World market and results in an increase in the World price of oil. It also hurts all tight oil producers in the US.
I agree the US will continue to have demand for oil after the EV transition as oil is used for farms, aviation, shipping, mining, rail, petrochemicals, and heavy duty trucks (though I think much of that may move to EVs eventually, in my model I have the start of that transition beginning in 2023 (it will start with short haul trucks and may eventually move to longer routes).
for the US crude inputs to refineries is around 16 Mbpd so if your guess of 5 Mbpd is correct (sounds reasonable to me), that would be 11 Mb/d of demand removed from the market, let’s say for the World that crude oil demand is cut in by 25% to 60 Mbpd by 2040, supply is likely to be about 70 Mb/d at $100/bo, it might take prices falling to $40/bo to remove expensive oil from the market, of course the adjustment will occur gradually over the 2030 to 2040 period with oil prices falling by $6/bo each year (94, 88,…,46,40).
Dennis, it might have been discussed, but what is the ratio of oil consumption for personal travel, i.e cars, planes, and cruise ships etc. versus other uses?
My point being, even if personal use is reduced substantially, total use might still be quite high?
Laplander,
I don’t have statistics handy, I focused on all use of petroleum liquids for land trnasport, my estimate for that is about 75% of World use, with about half used for light vehicles and half used for heavy vehicles (so 37% each of total crude oil use).
Hickory,
Scenario below assumes the pipeline capacity for crude in the Permian is not expanded further and that currently it is about 7600 kb/d and thus output maximum should be around there. About 1000 kb/d lower output at the peak compared to previous scenario.
Hickory,
A more conservative scenario below where completion rate remains at 400 wells per month (currently it is around 436 per month for Permian basin in May 2022). URR is about 36 Gb about 7 Gb less than the previous scenario. If my oil price assumption is correct, this 7 Gb is conserved forever, it will never be produced because oil prices will be too low for it to be profitably produced.
That may be good for the environment, if oil prices don’t rise so high that the transition to alternatives is slowed. It is not so great for tight oil producers and it seems unfair to change the rules in the middle of the game.
Dennis
Why do more and more wells get drilled in your scenario? Is it because WTI keeps increasing or is it to offset the increasing decline?
With efficiency increases in number of days to drill a well and number of days for completing a well, can the past be an indicator for the required number of rigs and frac spreads going forward?
Ovi,
It is just the assumption I make. Note that the rate stops growing at 650 wells per month. There have been several cases in the history of the Permian Basin tight oil era where the completion rate doubled in a matter of a few years. The DUC data has the completion rate in the Permian in May at 436 ( my scenario is lower at about 405). From 436 to 650 is about a 50% increase an this happens over 4 years (about an 10.66% annual rate of increase) vs 100% over 2 years (about a 41% annual increase).
The basis of the assumption is that oil prices will remain high until 2030 and it will be very profitable to raise output over the 2022 to 2029 period so oil companies will invest, the more they invest the more profits they will rake in. In addition some of these oil companies may see the writing on the wall and as EVs start to gain market share, the smart companies will realize that eventually demand for oil will start falling faster than the decrease in supply (which starts around 2029 in my scenarios) and oil prices will start to fall. If my scenarios are roughly correct, now is the time to invest rather than after 2030 when oil prices may be falling and oil investments will become less and less profitable. This lower expected future profitablity is the reason that fewer wells are completed starting in September 2028 and by Sept 2030 the competion rate has fallen to 545, by Sept 32 to 185, and by April 2034 the completion rate has fallen to zero.
Basically there may be a short window to take advantage of high oil prices from now until 2030, those who wait will miss the boat (or will forego boatloads of profits).
The past will never predict the future accurately, but if efficiency etc improves, then my scenario would simply be too conservative.
Despite claims to the contrary my scenarios tend to make conservative assumptions, that is likey the reason that most of my past scenarios (especially my best guess) have tended to underestimate future output.
For those who might believe that the rig count cannot continue to increase at 9 per month as I assume in my scenario. The chart below shows the trend in the Permian basin horizontal oil rig count from June 2016 to June 2018. Over that 2 year period the average rate of increase in horizontal oil rigs in the Permian basin was about 149 rigs per year or about 12.4 rigs per month. Things might be different today as oil companies are being less aggressive with their investments, thus the 9 rig per month increase is assumed despite the fact that real oil prices are over $100/bo (in 2021$) vs about $55/bo (2021$) over the earlier (June 2016-June 2018) period.
Dennis
Sometimes I wonder if we are getting too deep into the weeds of rigs, fracas and completions. From Jan 2021 to March 2022, I’m ignoring April, production was up close to 720 kb/d in the lower onshore 48, or slightly more than 50 kb/d/mth. In the first chart in the post, for all of the US, the STEO is projecting a growth rate of over 100 kb/d/mth.
The LTO chart above shows an increase of 650 kb/d from January 2021 to March 2022, or 46 kb/d/mth. Reasonably consistent with the onshore L48 trend. What has happened recently that makes the STEO forcaste that the overall US production rate per month will double over the next 6 to 8 months
Ovi,
One thing that has changed since Jan 2021 is in the chart below, it takes some time for the oil industry to react to changes (true of every industry imo), so there would tend to be a lag between decisions to increase completion rate and actual increased output. I do think the STEO is likely optimistic and not reflectig the reality that many large oil companies are choosing not to increase their completion rate very much. My scenario has Permian output increasing by about 600 kb/d from May 2022 to May 2023. My US tight oil scenario has output increasing by 615 kb/d, the rest of US output (non-tight oil) I expect to remain relatively flat over the next 12 months, perhaps at most an increase for all US C plus C of 700 kb/d (30% probability), my best guess is 615 kb/d for the US C plus C increase over the next 12 months.
Dennis
I think that your numbers are in the right region, a bit higher than in the past with the higher oil price.
I think six months from now the outlook should be much clearer. We will know if the higher oil prices were successful in inducing a higher monthly production rate in the US. On a world scale, and possibly more important, we should know if OPEC is tapped out.
The EIA STEO utilizes a relationship between expected future (and recent past) oil and gas prices and future activity. If the EIA forecasts a higher oil price, their domestic system will begin trending oil development and production higher. Unlike their AEO product, area available and whatnot are not a concern, just price and the resulting activity, and production at the well level from the recent past multipled out to match that activity.
Reservegrowthrulz,
Obviously my guess for the ramp rate in drilling is a guess where I have assumed the future will look like the recent past, the future could see the drilling and completion rate in tight oil basins increase or decrease depending on oil price and decisions by oil company CEOs, lately they seem to be ramping investment levels rather slowly relative to the increase in oil price in the tight oil sector of the business. This could change and likely will change in the future.
Dennis.
Above you asked about benefits of oilfield work compared to factory work.
Does depend on oilfield position as there are many, of course same as there are many in a factory.
I suspect some like to work indoors with a lot of people and others like to work with few people outdoors.
I was thinking primarily of pumpers, those who check the wells and other facilities daily. Pumpers tend to have more freedom than most other blue collar jobs. It can be lonely, but where we are pumpers have a lot of contact with service company personnel and also a lot of contact with neighbors. It seems so many want to live out in the country near oil wells these days in our neck of the woods.
I think it’s just personal preference. I know people who liked one over the other, and also thought both were ok.
I hear a lot of complaints about politics and gossip in factories. But there is some of that in the oilfield too.
Shallow sand,
Got it thanks. I don’t really know what a pumper does, but my impression is that oil field work is pretty strenuous. Some people like that kind of work (particularly younger folks), but usually factory jobs are not as strenuous, though they might be pretty boring, working in the oil field may be far more interesting and it is nice to be outdoors or out and about in the work truck.
My second job in industry (as one of those BSPE’s who couldn’t find BSPE work) was as a weltender. I loved it. As you say, it was outdoors, covering a large area, fixing what needed fixing and running my own FERC approved utility class pipeline. it took a year to get good at it, and then it was just a job, and I moved on to some bigger and better with directional drilling companies in the GOM.
Above you referred to pumpers (or well tenders – haven’t heard that term as much) as being big on hunting and fishing.
I will say that is spot on, especially the hunting. Trading days off during deer season is a big deal in our little part of the oilfield.
When I was a greenhorn and shipped off on my first week of training, the guy training me had two guns behind the seat back of the Toyota. A rifle and a shotgun. Whatever was in season didn’t seem to matter, if he could find dinner while out and about, that was a good deal. He had the most irritating work habits I’ve ever seen, he screwed around from 6:30AM when we left the yard until lunch time, just lolly gagging around and doing chickenshit little stuff. Slowly. And then at lunch he checked his watch and did an OMG!! and from then until like 7PM when he dropped me off it was 2X fast forward on a video. Once I was on my own I started off at the local truck stop at 6:30AM with a breakfast of chili and a hamburger while parked at my first well, and just start working smart. I could be done by 3PM on a non rainy day or if something hadn’t broken since I last visited. I left after about a year or so because they gave the job I wanted chasing service rigs to some other hard up BSPE with nothing but office experience.
“Will the Permian become a denuded landscape of poisonous ponds and toxic geysers, capable of sustaining intensive oil and gas activity but little else?“
Texas Monthy article about a west Texas rancher’s experience with Chevron. Learned a few things like the industrialization of ranch real estate.
“Charles Gilliland, a research economist with the Texas Real Estate Research Center, at Texas A&M University, said these transactions are a one-way street. After oil companies buy such acreage, they tend not to sell it. Parts of the Permian Basin are slowly transforming from being wide-open ranchland that hosts some oil activity to being an oil-industry fiefdom with islands of ranchland. No one seems to be tracking how much land across the Permian is now owned by oil companies, so I pulled land records from eight counties. (Several counties with significant oil activity make it difficult to access their tax rolls.) Among those, I tallied 370,395 acres—larger than several Texas counties—and I expect that’s an undercount.”
https://apple.news/ATmKXH7I9QyO1YYP_rxaCCQ
Much of that area is going to be heavy with photovoltaic production in the next decade or two.
Its a rich territory for that production.
Take a peek for a glimpse of the early days-
https://wellssolar.com/news/solar-farms-in-texas/
Hickory.
Where I live many landowners are receiving offers to rent their farmland for solar. These are 30-40 year leases, with rent offers of 3-4 times current cash rents for row crops.
There have been some projects built. Most have merely received option payments, as it seems the current solar firms are mostly akin to oil and gas landmen. They are small, new companies with not much of a track record. Tend to have urban addresses, many in Washington, DC.
The primary concern is the offers either have no COLA or maybe a 1-2% annual rent escalation. Given rampant inflation, there is a concern about such a long term lease.
The other issue is the overall idea of taking solid crop land out of production. Would seem non-productive areas would make much more sense, but those places tend to not have the infrastructure close by.
One would think encouraging solar above the aquifer in the OK/TX panhandle, and Western Kansas and Nebraska would be something maybe the feds should get involved in? Plenty of Sun, and a real need to slow depletion of the water there.
On another note, should landowners look at operating solar farms themselves?
If you can point me to the economics, I’d be interested in that.
Is there a reason why I can’t build my own solar farm on my land and sell the electricity to the utility?
I’m not at all surprised to hear that solar developers are starting to poke around your area. Its the beginning of a long long wave.
I would like to see the big solar put on land that is unsuitable for row crops or healthy forests. Sparse grazing land would be better, and as you know the southern great plains and on towards the west has plenty of that.
Its up to the states to take on that land use issue if they want to.
The long leases make sense because they roughly match the life of PV, with 30-40 yr residual capacity generally over 80%.- Example Sunpower- >92% residual capacity at 25 years
As far as taking the initiative and setting up your own power generation at scale there are many challenges. The big two are
-getting the utility to approve your permit for interconnection to the grid. Its a complicated process and the queue is now very long in much of the country, with big backlogs. It varies by utility and how much spare capacity is available on your local grid network.
-getting a purchase agreement [PPA] for the power produced. A book could be written on this (not by me), and its a shifting landscape.
For those reasons I would rely on an experienced project development team to get the job done since they can navigate these and the other challenges best.
It may be useful to team up with other local landowners to form a bargaining/contract group.
I think lots of people who have had wind installed in their area have done this.
It maybe a useful project to start small scale with you own installation, or at least go through the motions of researching it.
A few notes on that for OKlahoma
-“In May 2019, the Oklahoma Corporation Commission adopted new net metering rules raising the system size limit to 300 kW, removing the 25,000 kWh annual generation limit, and requiring utilities to compensate net excess generation at their avoided cost rate.”
https://programs.dsireusa.org/system/program/detail/286
That is favorable. [for reference- a 20 kW capacity system in a sunny area is big for home. Maybe enough for home plus 10,000 miles of a Ford-150 Lightening]
-you can initiate a quote process with this national group that has good reputation- Energy Sage
https://www.energysage.com/
You can search OK Solar installation to get all kinds of more info.
This atlas is an excellent tool-
plug in your spot and see the output potential, and its relative resource compared to the rest of the country/world.
And you can then do a site specific- “Choose PV system to calculate energy yield”, down at the bottom right corner.
https://globalsolaratlas.info/map?c=37.002553,-102.150879,5&s=35.675147,-98.964844&m=site
There should be enough land from the type “Half desert” or “Can sustain one cow per square mile with big problems” in the USA.
That’s much better for solar than converting valuable farm land. Especially there will be much less problems by gras and weed overgrowing the cells – and most times there are more sun hours there, too.
Shallow Sand-
I don’t know if this particular outfit is solid or will get traction, but if you browse the page you can see the kind of background work organizations are putting to the task-
https://solarcollab.com/community-owned-solar-farm-program-for-landowners-in-fargo-oklahoma/
I’m pretty sure that these kinds of platforms will become common as the decade unfolds.
To put things into perspective
-One acre of corn ethanol from Iowa can offset 3.06 barrels of oil/yr [on a net energy yield basis] when the ethanol is supplied for gasoline extender.
-One acre of Photovoltaic can offset 440 barrels of oil/yr [using the average actual output of US utility scale PV facilities 2020], when the energy is used for light transport (cars, SUV, pickups).
Note that this comparison does not take into the account the fact that EV has a higher energy efficiency than ICE vehicles. I have not included this factor since a firm number is not available to be applied across the board. The efficiency gain is roughly 3 to 1, which makes the advantage much more heavily skewed toward solar over ethanol for transport. It is notable that roughly 30 million acres of prime farmland in the US was devoted to corn for ethanol production 2021, despite the very marginal net energy yield of this energy production mechanism.
On a cost basis/mile the analysis is also very heavily skewed toward the solar/EV landuse option rather than corn.
You mean there’s unanticipated consequences to this whole shale boom thingy? Whodathunkit.
Want $380/bbl oil? This is how you get $380/bbl oil: https://www.manhattancontrarian.com/blog/2022-7-8-the-administrative-state-moves-to-show-whos-boss-on-energy-policy
David Archibald,
Government regulation can be overdone, for oil and gas producer trade groups the only good regulation is no regulation, government regulation can also be underdone.
There hasn’t been a new lease slae of the US Atlantic or Pacific coast of the L48 for many decades, this is nothing new, probably nothing since 1970. Everything has been GOM or Alaska and this will continue. Any new regulation in the Permian will get tied up in court.
North Dakota Oil Production Almost Back to Normal After April Blizzards | State and Regional
State Director of Mineral Resources Lynn Helms estimated Friday that the state’s oil production had recovered to about 1 million barrels a day after falling as much as 300,000 barrels a day during the second blizzard in late April. She told reporters “we’re bouncing back” as oil patch crews work to bring the remaining 10% of idled wells back online.
Forty drilling rigs were operating Friday, up from the low 30s in early 2022. Helms said 15 frack rigs were operating in the state, completing work needed once a well is drilled to produce oil. That’s more than 11 at the start of the year and more than just one that traded at the height of the recession in 2020.
The shortage of workers continues to hamper the oil industry’s ability to drill more in North Dakota, Helms said. He added that companies have moved a lot of oilfield equipment to the Permian Basin of Texas and New Mexico, where oil production is strongest.
“It takes about two months to train and deploy a drilling rig and crew,” he said. “It’s coming back very, very slowly.”
Note the date in the article is May 13.
https://6park.news/northdakota/north-dakota-oil-production-almost-back-to-normal-after-april-blizzards-state-and-regional.html
Ovi,
Lynn Helms is a man not a woman, like the Johnny Cash song about the boy named Sue.
Not your mistake, a direct quote from the article, sorry.
Next Director’s cut will be July 19 at 4 pm, not sure what time they release the new data, but probably some time that day, we will know then what May production was in ND.
Dennis
I was a bit surprised to see the first pronoun but then I realized that Lynn is a common female name these days. The second pronoun then straightened things out. The contact person for the article is Amy. Maybe that explains it.
Oklahoma ONECK Gas Plant Goes Up In Flames…
Add this one to the list of plants going offline due to explosions and fires… a bcf here and a bcf there, and it begins to add up.
Fire at ONEOK gas plant near Medford forces evacuations
A fire at a ONEOK-owned gas plant near Medford has forced evacuations of people who live in the surrounding area.
Fire and emergency crews were responding Saturday afternoon to the site of the plant. Anyone within a two-mile radius of the plant was asked to evacuate, according to the Grant County Sheriff’s Office.
steve
Chart exploring real WTI oil prices in 2021$ and horizontal oil rig count in US from Feb 2011 to June 2022. Noote that with real oil price in the $100 to $125/bo range in 2011 to 2014 that the horizontal oil rig count grew from 360 to 1100. Also note that the rate of increase in horizontal oil rigs in the most recent period has a much flatter slope than in the past, especially considering the steep increase in oil prices, this is unusual, but perhaps reflective of uncertainty about the future.
Opec+ crude output jumped 730,000 b/d in June
London, 8 July (Argus) — Opec+ crude production rose at the fastest pace in nearly two years last month as Russian output rebounded, but the group was still way below target.
The lion’s share of the June hike came from Russia, where output rose by over 550,000 b/d as higher domestic refinery runs offset a decline in seaborne exports. Russian refinery runs increased by nearly 500,000 b/d last month, figures reported by state news agency Tass show. A jump in refinery-level fuel oil stocks suggests the return of some of Russia’s less complex capacity.
Opec’s two largest producers, Saudi Arabia and Iraq, also increased output sharply as direct crude burn at power plants rose on the back of rising seasonal demand for air conditioning. Analysts estimate Saudi crude burn reached or exceeded 600,000 b/d in June, not far off last year’s peak of 691,000 b/d in July. Iraq’s crude exports went up by 124,000 b/d to 3.76mn b/d in June, according to Argus tracking, in line with oil minister Ihsan Ismael’s 3.8mn b/d target for the month.
https://www.argusmedia.com/pages/NewsBody.aspx?frame=yes&id=2349038&menu=yes
I had no idea Russia’s production was as low as 9,230,000 barrels per day in May. I had them almost a million barrels per day higher. That was from the best data I could glean from the net. The below figures is what I had them for April and May in thousand barrels per day.
Feb-22 11,080
Mar-22 11,010
Apr-22 10,050
May-22 10,200
Hi Ron,
This is what I had for Russian C plus C in kbpd
Jan-22—-11,002
Feb-22—11,055
Mar-22—11,010
Apr-22—–9,693
May-22—10,203
It might be the graphic you show is an estimate of crude output rather than C plus C.
May output from link below
https://www.themoscowtimes.com/2022/06/03/russias-oil-output-up-5-in-may-vedomosti-a77880
Unfortunately the data on Russian output is not very good lately.
The IEA reported a 1000 kb/d drop in Russian output in April, I have them dropping by 1300 kb/d in April. We only have EIA data through March 2022, which seems to be about 400 kb/d less than other data sources, possibly due to the way the EIA counts C5 plus from NGL (most nations include pentanes plus extracted in NGL processing plants as condensate as chemically it is exactly the same as lease condensate, the EIA counts this separately which is probably what the 400 kb/d difference is). A similar thing happens with Canadian output where they include all pentanes plus in the C plus C total.
I just absolutely love these types of on-line discussions – super insightful.
I wish I had something to add but don’t, but thank you very much for sharing all your knowledge.
rgds
WP
Dennis et al –
Really nice analyses and interesting, the great US oil re-resurgence is starting to sound like a bet with a 40-1 payout. So many conservative estimates and assumptions but it also sounds like there are many many interdependencies…from comments above, a major stipulation of this continued growth is a balanced global oil market (export LTO to external refineries?!?)…with the situation in Europe, a conservative forecast is that the market will continue to be unbalanced…what that means for prices is unclear, but much likelier to be higher than lower…
To Ovi’s point, “A while back I heard a commentator say that half of the frac spreads are in the Permian and that they don’t need anymore.” – Does this bode well for continued production increases? I understand that it does not, but maybe I’m off?
Maybe a chart with production, rigs, and frac spreads would be useful? Could offset production ~3-6 months into the future?
Dennis – From an infrastructure and investment perspective, wouldn’t it make more sense to produce Permian and other LTO at a lower production rate? Maybe this is what is going on? Or maybe there’s intrinsic reasons why producers only know how to do it 100% or 0%?
Shallow sand makes an important point on “Cheap transient labor”…maybe your higher oil prices offset that issue?
Complexity of well installs sounds like it’s changed a lot in the past 5-10 years…Added complexity means added days and crew time…this from my experience can start multiplying well cost 2,3,4 x’s…or more…
A conservative approach is that past well/rig counts don’t translate into the future the same way they did 5-10 years ago…for the Permian a more detailed analysis of well/rig counts versus production might be useful (and frac spread). Comparison of oil price may be less important, seems like a binary relationship, price too low stop drilling (80).
All in all, I think we all can agree that relatively high oil prices are needed for continued Permian (and other) LTO growth…unfortunately this is devastating to the economy…most people can’t afford to drive around using >$5 per gallon fuel…
I think the truly conservative estimate is that half of all oil everywhere stays in the ground, for one reason or another…maybe a future civilization in several hundred/thousand years will find it useful…
Kengeo,
My scenarios use actual well profiles to project future production. We can only guess at future completion rates, and I have done the analysis on recent rig counts vs completions in the Permian basin (see my chart upthread), basically in the recent past (past 12 months) about 1.17 wells drilled per operating rig in Permian basin, completions have been more than wells drilled recently, but higher rig count will allow drilled wells to be more than completed wells in next few months and then DUC inventory can be replenished.
https://peakoilbarrel.com/north-dakota-sinks-us-april-oil-production/#comment-742563
The complexity has not changed markedly in the past few years as far as I can tell, but there are many more knowledgeable than me.
Producing at a lower rate may mean leaving oil in the ground, if that is the objective, then it is a good idea.
If I was CEO of an oil company, I would see a narrow window of opportunity in front of me from 2022 to 2030 where oil prices might be high, after that the transition to EVs may lead to demand falling faster than supply after 2030 and oil prices will start to fall, by 2033 it may no longer make any sense to complete new wells in the Permian basin, oil prices may fall too fast for the wells to pay out. Right now it makes sense to produce all I can to rake in the profits while oil prices are high. Waiting to ramp up is just leaving money on the table.
On the complexity of the wells and increasing well cost. The total cost of the well has increased but output per well has also increased so that cost per barrel produced was decreasing prior to the pandemic, the supply chain issues likely have reversed this trend, just because the cost of sand, water, steel pipe, pumps, and probably toilet paper have all gone up. Based on comments by Shallow sand and looking at recent 4Q reports the bottom line has improved.
Chart below shows Permian model vs data from 2012 to March 2020, correlation is pretty good.
See post linked below for explanation of the model.
https://peakoilbarrel.com/oil-field-models-decline-rates-convolution/
Forgot chart for correlation of Permian model with data
Dennis – the chart you provided is very telling. Shows the moderate ramp to ~2017, then steep increase 2017-end of 2018. Slope then levels in 2019, then COVID. The late 2018 inflection point should coincide with the peak in production.
I think some of your more recent production forecasts are starting to look more realistic. I don’t think there’s any way 7 gb is left in the ground. I also do t think you should have production above 5 mbpd, I think the best scenario for US is a long 10-15 year plateau/moderate decline.
For the next 5-10 years, EVs will be for the rich. People all over the world will still need oil for many reasons…
Maybe EVs will play some role in 20 years, not likely before then…
Kengeo,
From a total cost of ownership perspective at $5/gallon for gasoline, a Tesla Model 3 costs about 48,440 for model with 270 miles of range and RWD, the Camry XLE V6 with similar options to the Model 3 costs 38615. The Camry gest about 26 MPG, at $5/gallon over 150,000 miles that is $28846 fuel cost. For the Model 3 the efficiency is about 4 miles per kWhr and at 13 cents per kWhr over 150000 miles, that is about $4875 for electricity cost over an assumed 150k miles of travel. The difference in cost for fuel or electricity is $23971.
Let’s say we invested the 10k difference in the original price of the car (we will assume cash is paid for vehicle in both cases for simplicity) and got a 7% annual rate of return for 10 years (we assume here that the car is driven 15k per year on average for 10 years). The 10k grows to $19303 over 10 years, if we deduct this from the 23971 paid for gasoline we get a net cost of $4667, and we save $207 by getting the Camry, if gasoline prices average $5/gallon over the next 10 years and electricity prices don’t rise. Note that I have owned both the Model 3 and the Toyota Camry and the Model 3 is a far nicer car. There are othe EVs that are less expensive, like the Hyundai Kona (258 mile range) which is about 37k after Federal rebate.
I expect EVs to gradually increase market share over the next 20 years and as they do they gradually reduce the demand for oil, the momentum will really pick up from 2030 to 2040 as most of the ICEV fleet gets replaced.
Dennis – Don’t forget tire cost, I’ve noticed that’s a fairly significant cost in the $0.03 – $0.05 per mile range…funny since I wasn’t expecting tire cost to be nearly equal to charging cost, but it is…I’m at at about 145k miles in a 2018 Model 3. EVs can chew thru tires due to weight and torque…tires tend to cost more than an ICE since they have to be built heavier duty…if you want better performance characteristics then price reflects this as well…
@Kenego
And don’t forget: When you have a long range M3, you have a potent sports/muscle car. That uses up tires on another rate than a base engine Toyota. You’ll have to drive all the time in ECO or be very very calm when driving to avoid tire wear.
With a Porsche 911 tire costs are always higher than gas cost if you drive it like a Porsche… The same with motorbikes.
And even my electric bike with German electricity prices – a full charge of 1 Kwh is 30 cents and goes for 60 miles. A set of good tires is 100$….
People are focused big on gas prices, but tires are forgotten most times. Winter tires come on the top (if you don’t live in California beach), you have to replace them after 5 years anyways.
@Dennis
You are being a little generous with ICE costs versus EV costs since you are not including maintenance costs which are significantly less for an EV as for an ICE vehicle. Not only the raw cost of the maintenance is higher for oil changes, more frequent brake wear, radiator flushes, PCV valves, transmission fluid et al, but also the wasting of the owners time just have all of that maintenance done. The older I get, the more I value my time and sitting in an auto repair shop for anything, wastes my time. As to tires, I am on my second set with my Model S. The original set went to 27K and my second set is now at 45K and looks like I might get to 60K miles with those. Not outrageous. At least to me.
Songster,
The S may be set up better than the 3, the three wears the tires on the inside edges and there is no way to adjust the alignment to correct, I have a 2018 M3, it may have been improved on newer models, I run winter tires and have about 68k on the car, the winter tires have been ok only one set so far, but on 3rd set of summer tires so not good on those. Have moved to a different brand, hopefully they will wear better. Agree maintenance will be less for Tesla, but Toyotas are not bad, mostly just oil changes.
Ken Geo,
Yes the Model 3 does chew tires, I think the set up is not good for tire wear, more important to rotate than on my previous cars and they may come with more performance oriented tires that wear quickly. In any case good point, that does add to the TCO.
Ken Geo,
Rates of growth are seen better using a logarithmic scale. My scenario with 7600 kb/d peak shown with a log vertical scale. Growth from 2022 to 2027 is much more moderate than 2012 to 2019 (slope is much less steep).
The great debate. What will be the primary driver of oil prices for the next 5 years?
1. Rising Production
2. Falling Demand
Either equal falling prices
3. Falling Production
4. Rising Demand
Either equal rising prices
My opinion: Number 3 is by far the most likely, followed by number 4. Numbers 1 and 2 are equally unlikely.
However, there is a serious possible caveat in this scenario. A very severe recession would mean that both 2 and 3 are likely. It could be far worse than what happened because of the pandemic. The bottom could fall out of both demand and production. But either way, recession or no recession, production will fall.
Ron,
Over the next 7 years World oil output is ikely to be higher, but demand will rise just as fast at current oil prices so oil prices will either remain around $100 to $110 per barrel or will rise to balance demand with available supply. After that we might see enough EVs on the road to start to reduce demand at current prices, but output will also be falling and the question is which falls faster demand or supply at prevailing oil prices? If it is supply that falls faster then oil prices will rise and if demand falls faster than supply at prevailing prices then oil prices will fall. I expect the latter after 2032.
Dennis – Since January, lithium prices have gone up 6-fold, I imagine that unless this is a short term event it will likely impact EV sales (already has, down 35% in one source), and Nickel prices are also considerably higher than a year ago…https://www.spglobal.com/commodityinsights/en/market-insights/latest-news/metals/060722-high-battery-metal-costs-add-to-electric-vehicle-sales-slowdown
Even if all the batteries get produced, is natural gas, coal, and nuclear up to the task of powering all of the EVs you imagine responsible for this large decline in oil demand? I think the covid pandemic provided us with a very useful data point, it shows the world economic engine has a baseline requirement for at least 88.5 MBpD for a world population of 7.75 billion (11.4 MBpD per billion people). At the other ends of the spectrum, in 1965 only 31.8 MBpD were needed to support 3.3 billion (9.6 MBpD per billion people), and when the oil was really flowing in 1977 a whopping 62.7 MBpD were split with 4.2 billion people (almost 15 MBpD per billion people). From early 80’s to present average has been 12 MBpD per billion.
Country to country, it’s daunting. The US consumes around 60 MBpD per billion, China is much more efficient consuming 3 MBpD per billion, and India consumes 100 times less than US (0.6 MBpD per billion).
Death rate of 15/1000 in 1960’s is likely to return soon, currently it’s 7.5/1000 and coincidentally it rolled over in 2018…https://www.macrotrends.net/countries/WLD/world/death-rate
Deck is clearly stacked against endless growth models…can forget about EVs making any difference anytime soon too.
Realistically, the only hope is a transition to natural gas and I have no idea what that entails.
KenGeo
The hard work, and the analysis in so much depth when it relates to the oil industry by Dennis is quite impressive. But when it comes to EV,s all of that great intellectual ability evaporates. He believes so no amount of reason and facts will change his mind. The modern world cannot prosper on wind and solar energy. Case in point, 50% of the worlds fertilizer is made from natural gas.
Ervin – It’s certainly strange, near term annual production declines of 2-3% are unavoidable…but we’ll see, Biden is on his way to Saudi Arabia this week, maybe he’ll convince the Saudi’s to add that extra 1-2 MBpD they have stowed away…when you dig into the data, it’s crystal clear that peak oil has come and gone, all of the key indicators are pointing that direction…the travesty is that countries, bodies of knowledge, individuals have all known about this since the 70’s (more than 50 years). And sadly a lot of it comes down to partisan politics, we’ve had 30 plus years that could have been spent so much better, now we’ve been watching 20 years of continued senselessness. Peak oil was really a 10 year period more or less from 2008-2018 (Obama will be the Peak oil president, and Trump in some way the result of Peak oil).
Kengeo,
In the near term World output of oil and natural gas will be increasing, decline probably won’t start before 2027 (I consider near term the next 5 years, you may define it differently). Note that if we use a Hubbert linearization on data from the EIA for World C plus C from 1999 to 2019 the result is a URR of 2980 Gb with a peak year of 2022, the low output during the pandemic will push that peak to the future.
Dennis –
I really hope you realize that the pandemic had almost no effect whatsoever on peak oil date, right?!?
For every week of the pandemic where oil production was slightly reduced (70 vs 80), the net result is to push out a peak oil date by 1 whole day! If you’d like to allocate a full 2 years then you could push the hypothetical peak oil date by 90-100 days! That’s completely negligible, and actually incorrect since peak oil was November 2018…
Ervin and Kengeo,
EVs require about 25% of the energy of an ICEV to operate, much of the electricity to run them will come from non-fossil fuel energy (wind, solar, hydro, and nuclear power).
Just like oil output, lithium output will be affected by prices, price goes up, more profit, more investment, and more supply. Sales of plugin vehicles have been growing at an average annual rate of 40% since 2014, I have run the numbers, EVs are likely to be over 75% of the light vehicle fleet in 2040 and the same may be true for the heavy duty vehicle fleet by 2050.
Who is making the replacement batteries and stockpiling them? I think that many vehicles in the 8-12 year old range will need new batteries. Reading about E-V’s, it seems that there are hundreds of different batteries. Even changing significantly with “the same model” thru the years. Probably, in some cases, it will cost more than the original total car cost. But, who is making them and keeping them in inventory? My brother has consistantly driven 30+ year old cars. But, none of them required a totally new engine. I am guessing that if you look at the history of the top 10 EV manufactures, even now there are over 100 unique batteries required to fit in their vehicles.
Maildog,
Supposedly the EV battery will last quita a while maybe Kengeo can tell us what the range is on his M3 at 145K, I am at about 68k and range is down to about 280 from 310 when new. I have read the curve flattens over time (less range loss per mile driven later in the life of the battery) maybe Kengeo can confirm.
Americans could just… stop driving so much.
EVs are not your saviour. EVs are “let’s keep being idiots about resources”.
Look at how America handles high temperatures. Build better housing? No. Throw more A/C at the problem.
Speaking of, I wonder if ERCOT will collapse their grid again this week. Buncha people with EVs will find it’s much harder to drive when you have rolling blackouts, I should think.
Dennis –
I can confirm, just unplugged at 85% with range at 242 miles. This is only an estimate of degradation (I haven’t done the charge to 100% drive to 0% yet – don’t really plan to…) I keep tabs on it for curiosity, tends to change (drop) in Dec-Jan with colder temps (but by cold I mean average of 45-50 instead of 63).
Here’s a couple over time:
4/27/2018 – 310 miles (new)
10/10/2019 – 301 miles (didn’t log miles but guess they were ~40k)
3/17/2020 – 298.8 miles (@72k)
12/19/2020 – 292.9 miles (@87k)
5/15/2021 – 295.0 miles (@99k)
11/29/2021 – 290 miles (@123k)
1/4/2022 – 288 miles (@127k)
7/13/2022 – 281 miles (@145k)
Chart below:
Trend since November is a little concerning, but it does have almost 150k (no repairs or maintenance yet! – 1 exception – paid $200 to replace a “smart” belt buckle – Tesla replaced it with the wrong one! )
So looks like the battery pack is at 10% degradation
I did learn a trick with the tires too, run a slightly larger and wider tire on rear and it holds up better (also protects the rim) and performs better and lasts longer.
I like the 245-45-R18 Continental Purecontact LS (~$250 ea.):
Load Index: 87
Speed Rating: V
Tread Wear: 700
Traction: A
Temperature: A
Warranty: 70k (35k since I run them staggered – don’t rotate)
Right now I have 7k on them and they are around 80% (so maybe get 25-30k total). Tires inflated to 44-46 depending on outside temp (4x, where x is the first digit of the outside temp: if 50 degrees then 45 psi, if 80 then 48 psi…if really hot then adjust so they don’t go over 50 psi)
So prob. per mile it’s $0.02 for rears and $0.01 for the front tires. But it took me awhile to learn this so I would guess my average is a bit higher, maybe $0.05/mile (same as average charging cost).
Ron –
For #2, we know that covid only had ~10% reduction in consumption (lot of people stayed home but had to eat and spend all their stimulus $ on Chinese crap). BAU was still in full control (increasing CO2 levels didn’t flinch), just a bunch of commuter cars were not buzzing around (I think this was really clear in big cities/metro areas). With this in mind, EVs really only address (if at all) a very small part of oil demand… Because of #2, #3 is also difficult, right? Bottom line is rising prices, the world is the worst junkie and the drug of choice is oil, die before we give it up (literally)…
If 2005-2015 price movement is any indicator, then 10-15% annual price increases might be expected…
But what about inflation?????
Since oil is the ultimate example of inelastic demand, tiny under/over imbalances can have massive price action (20 April 2020), or the 2008 bubble that went pop: “$90 a barrel in January 2008 to cross the $140 a barrel mark in June, finally hitting a record high of $147 a barrel on July 11, 2008 before collapsing to less than $40 a barrel in December.” https://www.piie.com/publications/policy-briefs/2008-oil-price-bubble
Supposedly, speculation was the major factor in 2008…
Maybe you need to add #5 – price instability which results in #3…
Maybe it’s written in the whale oil?
https://oilprice.com/Energy/Crude-Oil/What-Can-We-Learn-From-Peak-Whale-Oil.html
Funny, just realized it was 14 years ago to the day when oil hit $147…
Coincidentally that would translate to 2022 $’s as $200/barrel…
Oil is dirt cheap!!!
$200 is coming soon (less than 12 months):
https://www.reuters.com/business/energy/with-world-energy-shock-saudi-oil-cushion-gets-very-thin-2022-07-08/
Time surely flies!
Have been following the issue from -06 or so, we might have seen the undulating plateau without knowing/realizing…
But Dennis might be right, but I would surely prepare for plan B (have been personally, actually)
So, Texans, drill, baby drill! And then frac, of course!
Edit, just happily paid equivalent to 8 Usd/g to fill up the old Volvo, still really cheap, compared to walking, and strangely enough, cheaper than taking the bus.
The world’s top 10 oil producers peaked in 2018 and are today, about 1 million barrels per day below that peak level. They may get a bit closer but I do not think they will exceed that point. But even if they do, it will not be nearly enough. Because the combined oil production less the top 10 producers has declined by 3 million barrels per day since that point.
All data is of March 2022.
Ron.
Can you post this chart removing the United States and Canada?
Seems to me those two country’s bailed out the World post GFC.
Who would have thought in 2008 USA would go from 5 to almost 13 million BOPD from 2009-2019? Now add Canada during the same time frame. That’s the whole ballgame post GFC, and it couldn’t cash flow well without high oil prices. Now, with supply chain issues and labor issues, those prices need to be higher yet.
We have discussed at great length future projections for US shale. I haven’t seen many arguing lately it will be able to grow by about 1 million BOPD indefinitely, compared to pre-Covid shale fan boys.
There really needs to be another US shale growth story somewhere in the World this decade, or the World will need to live with less oil.
Dennis, I know you think World demand will soon be in permanent decline. That may be true, but I have a feeling that isn’t going to be pretty.
How much debt can governments issue? Didn’t they already shoot their wad in 2020-2021?
Right now EV’s and US shale seem to have something in common. Both look like the Dutch boy with his finger in the dike.
World population growth is the real story, isn’t it? The UN has been ratcheting down it’s numbers, but still sees 10.4 billion peak in 2080, with growth until then.
That’s a pretty large food requirement. I won’t be around then, and maybe won’t be around in 2050, when the projection is 9.7 billion. I’ll be 80-81 in 2050. But I’m not seeing renewables being able to feed, clothe, house and otherwise support that many people Worldwide in the coming decades.
But who knows? In 2008, EV’s and US shale were both a pipe dream. Maybe the needle will be thread?
Sure, here it is. It looks like that the top 10 less USA and Canada yearly average peaked in 2017, six years ago.
Click on graph to enlarge.
Thanks Ron!
Where is the oil production growth coming from once USA lower 48 goes into permanent decline?
There will be no production growth after the US goes into permanent decline. In fact, world production growth has already ceased. What is happening right now is just the world recovering from the demand destruction due to covid. All nations except the USA have already recovered from that production cut or very nearly so.
Ron –
I would argue that US has also recovered, just compare NM to Texas…
NM is 30% above it’s pre-covid level, but Texas has remained flat since, maybe it’s facing natural decline at all/most wellfields…I think there is secondary data to back this up…
Shallow sand,
For my scenarios the peak in World output coincides with peak unconventional oil in 2029. Only way decline is not steep is if oil prices remain high and this is anticipated so investment starts in 2025, it may not occur if people believe EVs will hurt oil demand, most in the oil industry don’t buy that story, so the investment mght occur. A lot of people don’t buy the idea of peak oil by 2029 either, so there may not be a rush to invest, though if oil prices are $130/bo or more maybe there will be some FIDs on oil projects.
Agree with those notions Shallow Sand.
And that is why I believe that lack of energy will accelerate the timing of population peak, and then decline.
Downsizing will mostly be involuntary.
“I have a feeling that isn’t going to be pretty.”
Of course, some places much less fortunate than others.
btw- the OK payment for residential net excess electrical production is not such a good deal. ‘Avoided cost’ payment from utility is only something like 2-3 cents/kwh. So producing excess to turn the meter backwards and get paid shouldn’t be a significant part of any personal business plan.
WoodMac: Seven giant oil players have what it takes to keep up output for 40-60 years. [QUITE A CLAIM, WE SHALL SEE!]
https://www.offshore-energy.biz/woodmac-seven-giant-oil-players-have-what-it-takes-to-keep-up-output-for-40-60-years/
That whole article is nonsense. Almost all of these “barrels of oil equilevant” comes from Saudi Arabia, Russia, Venezuela, and Qatar. Qatar has only gas and we know what the other three can do. They are all blowing smoke.
World oil producers, less the top 10 producers, have declined 8 million barrels per day in the last 11 years, from 2011 to 2022. More importantly, they have declined by 3 million barrels per day since the world peaked in 2018. And of course, that decline will continue.
All data is of March 2022.
Ron,
It looks like the world less top 10 dropped about 2200 kb/d from the 12 month trailing average peak in May 2019. My guess is we will see a new peak in 12 month output, if oil prices remain over $90/bo for most of the next 7 years or so, if we have a severe recession between now and 2029 (with negative growth in World GDP similar to GFC) then perhaps not. My guess remains 85 Mb/d in 2028 or 2029 for 12 month average World C plus C output.
The world oil monthly peak was November 2018. World oil production less Top 10 is now 3 million barrels per day below the point they were in November 2018. That decline will continue and they will be at least 4 million barrels per day below that point if the Top 10 producers ever reach the point where they were on November 2018. 12 month averages will have a different time frame but the results will be no different.
Nuff said.
Ron,
The monthly peak is not important in my opinion it is the 12 month average that matters, for the trailing 12 month average that you prefer, that ends up being May 2019. Oh and are we looking at the same chart, how much has World output declined since June 2020? To my eye the slope of that output curve looks positive for the past 21 months. I expect the slope may flatten soon, we will see.
Dennis, all this stuff about monthly peak versus yearly peak is just noise, it really makes no difference. I don’t see that slope you are talking about. I do see that the world’s top 10 oil producers seem to have run out of steam toward the end of 2018 while the rest of the world kept the steam going full blast in their downward trajectory. My point is, even if the top 10 break through their previous peak, month, or yearly average, it makes no difference, they would still have to make up for the 3 million barrels per day decline of the rest of the world since the world peak. That plus their further decline in the meantime. Dammit, Dennis, you know that is impossible, you must know that.
Dennis, I think it is really quite obvious that world oil production is about to begin a steep decline. The news folks just call it “the coming energy crisis”. They will be calling it something else very soon.
Ron – Exactly, see the 1.5% annual decline scenario below, it’s a production ceiling that we can simply no longer pass thru, if/when we do it’s guaranteed to be a short term increase that will have to drop back down below…at some point 1.5% turns to 2%, then 3% and so on…
Ron,
Just as I don’t pay attention to single month peaks for OPEC producers, I don;t pay attention to single month peaks for World output. The 12 month centered average peak peak for World output was 82998 kb/d in August 2019. For the World less top 10 the decline from the 12 month average in Aug 2019 at peak to March 2020 is about 2400 kb/d and the decline rate was about 622 kb/d per year over the Jan 2011 to Dec 2019 period.
The big 10 increased output by 1600 kb/d over that same period. Yes output slowed in 2019 because Saudi Arabia, Iraq, UEA, and Kuwait decreased output based on an OPEC quota agreement by 1074 kb/d from Dec 2018 to Dec 2019. In addition Iran’s output went down due to tightening sanctions by the US by 630 kb/d. Basically the 5 OPEC producers in the big 10 saw a decrease in output of 1704 kb/d due to quotas and sanctions from Dec 2018 to Dec 2019 and that accounts for the decreased output in 2019 (627 kb/d) for the big 10, basically the non-OPEC 5 increased output by 1077 kb/d, not enough to offset the OPEC cuts. Then obviously output was cut due to Pandemic.
In March 2022 World output was about 80.5 Mb/d, roughly 2.5 Mb/d below the World 12 month peak. Can the big 10 increase output by 1200 kb/d on average and will the rest of the World continue to decline at 622 kb/d per year when nations like Norway, Guyana and Argentina might increase their output? If we see the 1200 kb/d annual increase in the big 10 on average with 622 kb/d annual decline for the rest of the World, that’s a 578 kb/d average annual increase, over 5 years that gets us to a 2890 kb/d increase, add that to 80500 and we get 83390 kb/d.
Just one possible scenario, obviously increases will not be linear.
Chart below shows the annual decline rate for World less top 10 producers is about 709 kb/d, which is an annual decline rate of about 2.8%, different from the 5% decline rate you have latched onto from Laherrere’s 116 page paper. US conventional onshore L48 C plus C output has also declined around 3% per year. In addition, most of Laherrere’s World charts have decline rates at about 2.5% to 3.5% (see page 16 of the paper and note the Hubbert model has slower decline over the 2018 to 2070 period than either the 2.5% or 3.5% decline curves shown in his figure with the logarithmic vertical scale where the slope of the curve indicates the rate of decline.
The big 10 need to increase output by about 1.2% to offset this decline, I expect World C plus C output will grow about 1.5% on average from 2023 to 2027.
Dennis –
I looked at the top 7 “losers”:
Saudi Arabia – Peaked in 2016 at 12.4 MBpD, in 2021 they reached 10.95 MBpD, this is annualized decline of 2.3% (however; using 2018-2021 values this jumps to 3.7% since production was flat from 2016-2018…
Kuwait – Also peaked in 2016 at 3.15 MBpD, in 2021 they reached 2.7 MBpD, a decline of 2.9%.
Algeria peaked in 2005 at 1.99 MBpD, in 2021 they were 1.35 MBpD, annual decline of 2%.
Angola peaked in 2008 at 1.9 MBpD and in 2021 they were 1.2 MBpD, annual decline of 3%.
India peaked in 2011 at 0.94 MBpD and in 2021 they were 0.75 MBpD, annual decline of 2%.
Indonesia and Malaysia have been declining rapidly since 2018 at a rate of ~5%.
Looking at all seven in this “losers” group, the key take away is that cumulative production in 2018 was 20.7 MBpD but in 2021 it dropped to 18.2 MBpD, so for the group annualized decline is 4%. Prior to 2018, the losers group had been growing 1.5% annually since 2010. See chart:
I get the feeling that you like to cherry-pick the data, I believe that’s a pretty typical approach for most people, we are looking for data/info to support our arguments. Maybe try and stand back and look to the big picture…ask yourself:
– Is total cumulative world production of oil at or near 50% URR? What is your error of margin 0.1%, 1%, 5%?
– If total CWP is near 50% then is there a likelihood that peak oil is already in the rearview?
– If so, is 2018 the year? If the year was 2018 average growth prior to 2018 since 1994 was 1.4% (2004-2006 was ~1%).
If 2018 was not the peak, then continued growth of 1.4% should be possible:
2018 (Nov) = 84.5 MBpD
2019 (Nov) = 85.7 MBpD
2020 (Nov) = 86.9 MBpD
2021 (Nov) = 88.1 MBpD
2022 (Nov) = 89.3 MBpD (currently at <81, why are we 10% lower?)
2023 (Nov) = 90.6 MBpD (why is the Jan 2024 forecast not even 82????, still 10% lower)
2024 (Nov) = 91.9 MBpD
2025 (Nov) = 93.1 MBpD
NOTE: For these 7, March 2022 production is still below 2021 total!
Is covid the only explanation for this, or is it maybe peak oil 2018?
Kengeo,
Use the EIA data for C plus C so we are comparing apples with apples. BP data has several different “oil” data sets with different units, the bdata in exajoules or tonnes is better than barrels because NGL has lower energy content, “bottled gas” such as butane, propane, or ethane can be useful for cooking or heating, but not so much for transportation which is the main use for crude oil in most places (middle east is an exception where they use oil for electricity production in summer.)
A Hubbert linearization (HL) for World C plus C results in 3000 Gb (1999-2019) to 4000 Gb (2010-2019) for URR. Note the the famous Campbell Laherrere paper in 1998 (The End of Cheap Oil) had conventional oil at about 1800 Gb, if we go back and look at the data (virtually all output through 1997 was conventional oil) we find an HL for 1990-1997 conventional crude (excludes Canadian oil sands and Orinoco output) gives a URR close to 1800 Gb as estimated in that 1998 paper.
The important number is World output, the data I “cherry picked” was the group of countries covered by Ron (World C plus C minus top ten producers), the years I “cherry picked” were the same as those included in Ron’s chart (Jan 2011 to March 2022).
I used the same cherries as Ron did, rather than drawing an arbitrary line I used ordinary lest squares to fit the best trend line to the data (which is fairly standard statistical practice). The decline rate is 2.8% over that period for that group of nations.
Also note that for the 3000 Gb Hubbert model fit to World C+C data from 1999-2019 the peak is 2022/2023 at about 1500 Gb cumulative output. Actual cumulative output at the end of 2021 was about 1437 Gb (due to lower output than the Hubbert model during the pandemic). My scenario has World cumulative C+C output reaching 1500 Gb in 2024 and at the peak in 2029 cumulative output is 1676 Gb or 56% of URR. The difference is that I model conventional oil separately with a URR of 2800 Gb and do not use a logistic function for my model, my model for unconventional oil has a URR of 190 Gb which is very conservative (116 Gb for extra heavy oil and 74 Gb for tight oil). My model for conventional oil peaks in 2016 at 1267 Gb at 45% of URR, my unconventional oil model (oil sands plus tight oil) peaks at 82 Gb cumulative output or 43% of the URR.
Chart below has decline rate for a Hubert model with URR=2982, x-intercept=0.03991046 and Peak year=2022, based on HL on EIA C plus C World annual output data from 1999 to 2019. Cumulative World output of C plus C at the end of 2004 was 957.756 Gb.
Chart below compares annual decline rates for Oil Shock model vs Hubbert (both with URR of about 2980 Gb).
@D Coyne
You can used bottled gas in any gas engine car with only small modifications. In East Europe this was normal because of low wages, high gas prices and low propane prices.
All Taxis in Sofia have driven with a 33 KG Propane bottle in the trunk – been there seen that. The more proffessional refit here costs round about 1500€ (with a certified tank and being able to refill at gas stations). You keep your normal tank as “range extender”.
https://www.rac.co.uk/drive/advice/emissions/what-is-lpg/
Eulenspiegel,
Perhaps more of this will be done in the future, the fact remains the amount of bottled gas used for transport is tiny compared to liquid fuel (at STP). I expect this is likely to continue.
Do you have an estimate of what percentage of miles driven either in Europe or worldwide is powered by LPG as compared to petrol and/or diesel(gasoil)?
Kengeo,
No reason to assume exponential growth rates, from 1982 to 2019 growth of World C+C output was linear at about 800 kb/d. No reason why this cannot change, from 1960 to 1973 output grew at an exponential rate of roughly 7%, then output fell due to Iranian revolution and Iran-Iraq war from 1979-1982. Obviously output fell due to lack of demand during the pandemic and very low oil prices which resulted. The transition to EVs may reduce demand so that demand does not continue to increase as fast as it has in the past. Let’s take 12 month average peak of about 83 Mb/d in 2018, there was a glut of oil on the market at that time so OPEC cut output in 2019 so output fell in 2019 to about 82.2 Mb/d. Scenario below assumes output grows at about 800 kb/d from 2021 to 2030, it may be conservative as output might reach 80 Mb/d in 2022 (annual average output) and the scenario does not reach that point until 2025, also posible growth rate will slow from 2023 to 2029 as the transition to electric transport proceeds.
LPG is a small percentage of the energy mix: about 2.06%
https://ec.europa.eu/eurostat/statistics-explained/index.php?title=Oil_and_petroleum_products_-_a_statistical_overview#Final_consumption_of_petroleum_products_for_energy_use
Rgds
WP
Ron – thanks for this, I made a chart of recent “biggest losers”, if I remember correctly I think it’s Saudi and Kuwait plus Algeria and Angola. Also India, Indonesia, and Malaysia…not nec. by volume but more related to steady decline rates of between 1-8% annually…kinda gave up on it but will post it just for kicks…Saudi and Kuwait are more recent peaks but the others have been in decline for 15-20 years…I think they all add up to nearly 20 mbpd, not insignificant…
Here’s chart of Saudi Arabia, Kuwait, Angola, Algeria, India, Indonesia, and Malaysia…all in steady decline…
Also, looking only at 2018-2021…the overall decline rate for the group jumps to 0.9 MBpD annually…pretty significant for only 7 countries…which is approximately 5.5% (-0.9 / 18.2) for the group…this correlates well with Jean Laherrere’s simplest estimate of 5% annual decline rate from his 2018 work that Dennis refers to.
Guess we should look at the top 5 who are holding their ground and keeping the decline rate from being much higher, overall they account for ~31 MBpD…looks like the losers outweigh the winners 2-1 and together they account for well over half of all oil production…
Chart of 5 winners
That’s an annual growth rate of only 1.9%…
However, if we exclude 2018 data and only look at 2019, 2020, and 2021 we get growth = 0.05%…but covid likely impacts that analysis…will need 2022 data to really know what’s going on…
Kengeo,
Plenty of data at link below
https://www.eia.gov/international/data/world/petroleum-and-other-liquids/monthly-petroleum-and-other-liquids-production
Thanks Dennis – The monthly data confirms an overall decline rate of 1.5% annually since 2018, right around a decline of 1 MBpD each year since then (84.5 in October-November 2018 and 80.7 in February 2022) [-3.8 MBpD / 3.3 years]. I believe world production growth will meet/has met serious resistance, see chart below (note this trend was established prior to 2020 covid situation):
Kengeo,
OPEC plus cut output starting in Jan 2019, that is the reason for the decline in 2019.
If you fit an ordinary least squares trend line to the EIA data from Jan 2018 to Dec 2019 the annual decline rate is 0.224% or 183 kb/d per year. The pandemic should be ignored, that’s a 1 in 100 year type of event.
Dennis –
I took a closer look at the monthly data…the next 5 years is not great, everything points to continued loss of 1 MBpD every 10 months until 2027…
After 2027 the average decline rate jumps considerably about 6 fold (7.5% annually) for the next 5 years (thru 2032)…this is even including a 10 billion barrel buffer…
By 2032 production is ~50 MBpD…going to 2040 puts production <10 MBpD…
KenGeo,
There are a lot more reserves than you believe and reserves appreciate over time which you are not accounting for. A Hubbert analysis points to a URR of at least 3000 Gb, but a problem with Hubbert analysis is deciding what range of data should be used. The 3000 Gb estimate seems reasonable, but an optimist would choose only the most recent 10 years and could get an estimate of 4000 Gb for World C plus C URR.
A better method is to look at conventional and unconventional separately, we get about a 2500 Gb URR for conventional oil by this method, but my guess is that this underestimates URR (as in 1998 when it pointed to 1800 Gb for conventional oil, about 700 Gb too low at least). So I add 260 Gb (a guess) to conventional URR to account for the tendency for HL analysis to underestimate resources.
In chart below I present a very pessimistic model with World C plus C URR of 2700 Gb (I expect this will be 260 Gb less than my best guess model). The Oil shock model barely reaches the previous peak of 2018 and the Hubbert Model (for conventional oil only) combined with my unconventional oil scenario- I call this Hubbert on the chart. The Hubbert conv plus unconventional scenario peaks in 2019 at 83.75 Mb/d (more than actual output to date) and has a secondary peak in 2027 at 83.49 Mb/d, the oil shock model peaks in 2028 at 83.03 Mb/d only 50 Kb/d above the 12 month average maximum. Note that I expect there is a 70% probability this URR of 2700 Gb will be too low, I believe there is an equal probability that the World C+C URR will be above or below 2960 Gb.
In 2018 Jean Laherrere’s best guess was 2700 Gb for World URR, though he presented models suggesting 2965 Gb was also a reasonable guess (215 Gb for extra heavy oil and 2750 Gb for C plus C less extra heavy URR
Kengeo,
A good way to think about proved reserves is that the probability that the amont produced will be less than the proved reserve estimate is 10% and the probability that more will be recovered than the proved reserve estimate is 90%. (This is what a P90 estimate means.)
The engineering best estimate is the 2P reserve estimate which has a 50% probability that actual output will be either higher or lower than this estimate ( a so called P50 estimate.) This is the reason we should use the 2P estimate at minimum. A better estimate accounts for future reserve appreciation and discoveries.
“And of course, that decline will continue.”
Yes….just like it did after all the other peak oils this century. 🙂
Or….not. 🙂
OPEC’s First 2023 Outlook Shows No Relief From Oil Squeeze
https://www.bloomberg.com/news/articles/2022-07-12/opec-s-first-2023-outlook-shows-no-relief-for-oil-market-squeeze#xj4y7vzkg
“OPEC has just released its first 2023 supply-and-demand oil balances forecast. It anticipates very strong oil consumption growth (2.7m b/d) on the back of covid recovery and pent-up demand and despite recession fears. Non-OPEC supply will lag (1.7m b/d). As a result, OPEC anticipates it will need to boost its oil production a lot next year to balance the market (so-called ‘Call on OPEC crude’) if it’s to avoid massive stock-draws in the second half of next year. OPEC forecast for next year is, in many ways, impossible: it won’t happen. By 4Q 2023, the cartel sees it needs to supply the market 32m b/d, up from June’s output of 28.7m b/d. Even assuming Saudi hits 12m b/d, and UAE goes to 4m b/d, the group would be short” ~ Javier Blais via Twitter
From your link:
OPEC’s first oil-market outlook for 2023 suggests no relief for squeezed consumers, with more crude needed from the group even though most members are already pumping flat out.
Flat out, imagine that! What happened to all those millions of barrels per day of spare capacity?
Wow, Saudi Arabia would need a 10% production increase over 2021…they are fighting average decline rates of 2.5% since 2016 (3.6% from 2018 – but covid may cause that % to be high)…I believe they acknowledge that if they could hit 12 mbpd it would be for a very short period…I imagine just hitting 2.5% decline rate requires a great deal of fine-tuning and work…they have no interest in speeding up their decline rate with temporary spikes in production…Ron’s charts tell us everything we need to know. As for Dennis, denial – it’s not just a river in Egypt :^)…
Update for the March EIA World Production and the STEO forecast.
Below is an updated chart which shows actual World C + C production up to March 31, 2022, 80, 040 kb/d. The STEO contains information on projected production out to December 2023. This is shown in the chart in red.
It should be noted that the STEO world output is for all liquids. By comparing the EIA’s past C + C production with the all liquids production, a procedure was developed to project C + C output to December 2023.
Also attached is the February version to show the change. The biggest change occurs in the rapid rise in production from April to September from 79,152 kb/d to 82,187 kb/d, slightly greater than 3,000 kb/d. Of that 800 kb/d comes from the US, 940 kb/d from OPEC and around 800 kb/d from other OECE and Non-OECD countries. September 2022 is the peak out to December 2023. The latest December 2023 output is 313 kb/d lower than projected last month.
Ovi – Strange that there would be a +2 MBpD increase in 2-3 months, then a 1 MBpD decline over next 6 months, then go back up 1 MBpD the following 6 months…average that all out and it’d be more believable…I suspect we will be down an additional 0.5 MBpD within the next 3-6 months…the long term average is a loss of 0.1 MBpD each month…
In fact the change from February to March was just that…
Equation is y = -1.2x + 2507, where y is production and x is the year (2019 = 84.2 MBpD; 2023 = 79.4 MBpD)…
Might be counting on spare capacity (might put some ” ” on that) and/or storage drainage for 90 days while hoping for drilling ramping up?
Edit: expected drilling might also be for more water floods…
For comparison, the February chart
Ovi,
In February nobody expected the turmoil from the Ukrainian invasion so we would expect the two forecasts to be very different due to more severe sanctions on Russia and its affect on Russia’s crude oil output. In addition the oil price forecast is very different in July 2022 than it was in February 2022 (in part due to expected lower output from Russia as of July 2022).
In any case, I agree the current forecast looks odd, the forecasts are often not correct in the fine details.
My current forecast for World C plus C is for 77.9 Mb/d in 2022 and 79.17 Mb/d in 2023, perhaps reality will fall somewhere between my fairly low estimate and the more optimistic estimate of the EIA. What are the annual averages for 2022 and 2023 for STEO World C plus C based on your analysis?
A rough estimate from your chart might be 80.2 Mb/d in 2022 and 81.5 in 2023. So an average of my guesses and those of the STEO would be about 79 Mb/d in 2022 and 80.3 Mb/d in 2023.
-1.5 % annually since November 2018:
Kangeo
Agreed, difficult to explain the trend after September 2022. Assuming the World output is 81, 958 kb/d in December 2023, which is possible, but could be 500 kb/d to 1,000 kb/d to high because OPEC (SA and UAE) will have to produce at levels they have not done in the past.
That decline rate to December 2022 is 513 kb/d, or closer to 0.62%. Also attached is a decline chart for world minus Big 11. (Brazil, Canada, China, Iran, Iraq, Kuwait, Norway, Russia, SA, UAE, US.) The decline rate for the remaining countries is 625 kb/d. The OLS line was based on data up to January 2020. It does not use the drop. Note that March 2022 production has just touched the OLS line. So for me, these two decline rates indicate that world oil decline is somewhere in the range of 575 kb/d ± 50 kb/d.
Appreciate this is a net decline rate because new drilling is masking the real decline rate with no drilling.
Ovi, I don’t understand why you left out March 2022 data from your chart. World less Big 11 was down 326,000 barrels per day in March 2022. That is worth a notice.
Ron
I left it out to show the production in the remaining countries had returned to the OLS line that had previously stopped at the start of the pandemic. Adding in the single March data point to the sum of least squares is not sufficient to meaningfully change the slope. The slope increases from 625.5 kb/d/yr to 627.4 kb/d/yr. February was essentially on the OLS line.
I don’t know what OLS is but the slope just may be increasing. Or you could just push the line down a bit and show that it returned to the slope in March. Anyway, any line only shows what past production was. It is not an accurate predictor of future production, just a suggestion. Anyway, it held that line for over 10 years. That is far longer than I have ever seen production hold a line.
Ron
OLS line is an Ordinary Least Squares line. It is the line that minimizes the sum of the squared error of the data points used. Due to the discontinuity associated with the pandemic, I just used the data from December 2009 to January 2020 to calculate the line.. As of February and March 2022, production returned to the level projected from the previous period. Fluke maybe. We will need another twelve months of data to see if production continues to follow that line.
I should note that in the decline line shown below for 52 countries, this is what I consider to be the lowest possible decline rate for World oil production. I will analyze your World minus Big 10 tomorrow to estimate that decline rate. It seems to be higher than the one above.
Ovi,
For the World less big 10 I included the pandemic, if I do the OLS from Jan 2011 to Dec 2019 the slope of the decline curve is -622 kb/d per year, very similar to your analysis.
Dennis/Ron
The big 10 I have for January 2020 are: United States, Russia, Saudi Arabia, Iraq, Canada, China, UAE, Brazil, Kuwait, Iran. I dropped Norway for my Big 10. Are we on the same page?
The reason I ask is that my chart is very close to yours but with some slight differences.
Ovi,
My Big 10 are
United States
Russia
Saudi Arabia
Iraq
Canada
China
Iran
United Arab Emirates
Kuwait
Brazil
I use monthly EIA data from Jan 2011 to Dec 2019.
Dennis, I simply picked the 10 highest producers as of March 2022. They are listed in the chart below, along with their March 2022 production data. The next four are listed also.
Ron I did something similar, but picked the largest producers when the World was at its 12 month peak in 2018 (the list is the same for the top 10).
Ron
This is another group of 52 small countries that are in decline and they continue to track on the OLS line right through the pandemic because most of them did not cut production. Their decline rate continues at close to 100 kb/d/yr lower than the World less Big 11.
Ovi – That’s interesting, for that group decline is 2.6% in 2012 and now it’s 3.5% in 2022…guessing it should increase to 5% pretty soon…maybe in next 2-3 years?
Kengeo
Both graphs above, as best as can be seen, are linear declines. Attached is a graph of Denmark. Denmark’s production is an exponential decline with a decline rate of 8.693% per yr. The Ln of Denmark’s production vs time yields a line.
Ken Geo,
It would reach 5% annaul decline in about 6.5 years if the linear trend continues.
Roughly 1 Mbpd export from Kazakhstan at risk of shut in-
https://www.euractiv.com/section/central-asia/news/oil-majors-face-output-slump-deep-losses-if-russia-stops-kazakh-pipeline/
Hickory
Note this line.
“A Russian court on Monday overturned the ruling against CPC and instead fined it 200,000 roubles ($3,300).”
Thanks for pointing that out.
I suspect we haven’t heard the end of this story.
Lest you all forget, I never see mention among the charts that trump sanctioned away 2-3mmb/d Iran and Venezuela were producing at the so-called “peak” in 2019. RU is another couple million barrels down now. Don’t know how they count but Iran is probably exporting to Venezuela and RU is shipping to China. Is it peak if you can’t or refuse to count all the oil produced? Or are they?
I’ve been a “geologic limits” peaker since the Sci-Am article (in spirit for much longer) and I have gone to extremes to prepare in the past. But combine sanctions with ongoing pandemic induced supply line and labor constrictions, add in growing social anxiety about GW, AND the potential for RE and efficiency gains (or not) AND the economic wobble… politics…
… and for probably the first time I’m pretty sure any estimate about the mid term (10 year) future is just wool gathering— as they used to say. Not that geologic peak could not happen in the dark of political sanctions but how would one know or why would they care?
But carry on, I still read every word, LOL
https://www.newsweek.com/iran-venezuela-could-help-bidens-gas-crisis-if-he-lifts-us-sanctions-1719888
Pops,
Yes the sanctions matter, but they may remain permanently, politics and other “above ground factors” will always be a reality and they do indeed make for a woolly analysis.
I recently reread the 1998 Campbell/Laherrere piece in Scientific American. They had 1800 Gb for their conventional oil estimate, but I had not remembered they suggested about 700 Gb of unconventional resources for a total of 2500 Gb. A problem with the analysis is they never define conventional oil very precisely (they call it readily accessible). They discuss unconventional oil on page 82 (see link below) and seem to define it as Orinoco belt and Canadian oil sands and shale deposits in Canada and former Soviet Union (they don’t mention US tight oil), so I assume coventional would be everything except tight oil and extra heavy oil. Their estimate for conventional oil URR is 700 Gb over the next 60 years (1999 to 2058) out of a total resource of perhaps 1500 Gb (I believe this is original oil in place rather than technically recoverable resources).
https://www.ocean.washington.edu/courses/envir215/endofcheapoil.pdf
Twenty years later (August 2018) Laherrere has estimated conventional oil at about 2600 Gb to 2900 Gb and unconventional oil at about 215 Gb. The peak is likely to fall in the range of 2018 to 2030 imo, my guess is 2028 or 2029. We probably won’t really know until 2035 or so, high oil prices from now until 2030 will be a hint especially if output starts to fall while oil prices remain high.
Of course they “may” remain. But when prices rise to say US $200/bbl on short supply I doubt it. What POTUS can resist? The point isn’t academic for folks who still think timely transition isn’t a given. Those three countries hold what percent of world reserves? and spare capacity? How does one calculate spare capacity when millions of barrels can be tapped at the stroke of a pen?
Lots of people were fooled over the peak oil hand waving in the oughts, lots of people who made big changes because of it.
Thanks for the info on Laherrere. I’ve always thought his comment that attributing too much precision to any estimate is foolhardy.
Pops,
You may be right. I am not sure how much prices will rise. I think the sanctions on Venezuela and Iran are silly, though I am in support of sanctions on Russia.
I know it’s not at close today yet. But the 2’s and 30’s yields inverted today. Think about that for a minute. 2 year treasuries yielding more than 30 year treasuries.
I think we are headed straight into a depression. Not a recession.
1 2 and 3 year yields are all higher than the 30 year.
6 months yields are higher than the 10 year.
CPI might be at 40 year highs. Not going to last much longer though.
HHH,
That is possible. I think we are in stagflation which might be followed by a big recession.
Speculating of course.
That’s funny Dennis…
“…if output starts to fall while oil prices are high”:
Just look at Texas, year-over-year it’s flat (5 MBpD)…All time peak was January 2020 (5.6 MBpD)…we are still ~12% below that level, this is natural decline rate, not a result of covid…wouldn’t you expect Texas production to be up significantly a year later with prices much higher (>$100 vs. $63)???
Globally speaking, February output was 80.67 ($90) and March was 80.55 ($100)…
…which countries are you speaking of? Most are already falling regardless of oil price. Oil has been above $80 since first week of January, for past 6 months. Saudi Arabia for example had 0 growth between January and March…per EIA the US continues to be flat since November 2021 (Nov. crude was $80 and Mar. nearly $120)…
Canada is the same, flat since November…
Same story for Iraq, no change 4.4 in Dec. and 4.4 in Mar.
If there are so many more reserves than I believe, how is it that so many countries are in serious decline? How do you get around Laherrere’s estimate of 5% decline? And more importantly why are you a lone voice? Also how do you have production essentially right at 50% URR yet continuing to increase for 10 years???
US inflation hits 9.1%:
“The all items index increased 9.1 percent for the 12 months ending June, the largest 12-month increase since the period ending November 1981.”
-https://www.bls.gov/news.release/pdf/cpi.pdf
Germany is even worse, 12.7%, Food Price Inflation, highest ever since that statistic was formed…
At a certain point you have to look at the numerous lines of evidence that do not point to continued growth of 1-2% annually like we’ve seen for more than 30 years…that all ended 4 years ago…
The next phase is steeper decline, not the 1.5% we’ve seen recently…I think that could happen sooner than later but definitely not beyond 2027…
Just remember that no matter what Canada and US do, there’s a global deficit of 0.1 MBpD increasing every single month…
I think you are giving covid way too much credit, overall the world economy continued to produce and burn thru oil at a rapid pace.
Kengeo,
Jean Lahererre also says he expects World URR to be at least 2700 Gb, though he says different things in different parts of the paper.
If you use a logistic to model output then annual output never reaches a 5% annual decline rate. The maximum decline rate is 3.91% per year reached about 80 years after the peak. From page 16 of the Laherrere paper “35cooilforecast” from Aug 2018 we have chart below which shows he uses either 2.5% decline (for 3000 Gb model) or 3.5% decline for 2600 Gb model and note his estimate for XH oil (extra heavy oil) is 215 Gb. The curves marked U 3000 and U 2600 are logistic functions. On a chart with a log vertical scale the slope of the line indicates rate of increase or decrease.
Thanks Dennis –
What is the reason we expect 7% growth yet only 2.5-3.5% decline?
To be fair, shouldn’t you add 5% (Lahererre even says so) and 7% decline rates as well?
Either way, the charts above all show decline around 2015-2020, right (including U=3000 Gb)?
My take home is the URR be damned, peak was at least 4 years ago…(more likely the average peak fell somewhere in the 2005-2015 time frame, a couple late/unexpected guests had their own party in the 2015-2020 timeframe…).
I guess we are splitting hairs in the end, rapid decline is months/a few years away at most…
Maybe we have a couple years to get our plans together…
But really, why do you think New Mexico weathered covid so much better than Texas? Maybe there’s a simple explanation other than the natural decline in Texas??
ken Geo,
In 2018 Laherrere assumed 2016 would be the peak, so far it has been 2018 due to OPEC cuts and pandemic. It will take time to recover from the big drop in 2020, supply chain problems make this more difficult sanctions on Venezuela, Iran and Russia, along with production problems related to politics in Libya, and Nigeria make it more difficult to increase World output levels, even so World output has increased at an annual rate 5359 kb/d over the June 2020 to March 2022 period.
As to 7% increase meaning a 7% decrease, many fields tend to show a rapid increase and a slower rate of decrease, there are exceptions such as US L48 conventional onshore where a 3% increase was followed by a 3% decease, but this seems the exception rather than the rule. Doubtful we will see World decline rate over 3 % before 2070 and more likely never.
Entire conclusion from Laherrere’s paper below (p.138)
-only 6 countries have not yet reached peak: Brazil, Canada oilsands, Kazakhstan, Iraq, UAE, Venezuela Orinoco
-17 countries (out of 35) have or will have a decline rate of 5 %/a
It means that, excluding the 6 countries before peak, the best and the simplest way to forecast future production is to decrease present production by 5 % per year. It is simpler and better than using published data.
Outside the political statements, future production is forecasted using the estimate of remaining reserves or future drilling with the present EUR per well. It appears that using the past production data is a more reliable way.
The extrapolation of the annual production versus cumulative production is good only for country with declining production.
The extrapolation of the percentage aP/CP versus CP is only linear for the last years and the reliability of the estimate depends upon the length of the last linear period.
The extrapolation of aP versus CP works only after its peak.
Annual production growth in volume or in % allows to forecast coming peak.
No one method is perfect.
It is why several methods should be used and the choice of the ultimate could be a straight average or a weighted average depending the quality of each approach.
This is not quite the same as using 5% decline everywhere. Also a carefula look at the analysis ahows most of the larger producers are expected to decline at 2 to 4% per year. One exception is Russia, though my guess is that Laherrere might be underestimating Russian URR.
Kengeo,
The reason for the difference between Texas and New Mexico is twofold. First there is considerably more conventional output in Texas which is declining than in New Mexico and second the Eagle Ford has peaked and is in decline (EFS is down about 281 kb/d from recent 2019 peak). It does look like the Permian basin in Texas has not been doing as well as in New Mexico, particularly the Wolfcamp formation.
Chart at link below shows Permian Wolfcamp for Texas and New Mexico. The Bonespring and Spraberry formations are doing ok in Texas, but it looks like much of the growth is coming from the New Mexico Permian basin. From March 2020 to Nov 2021, Texas Permian down about 100 kb/d with New Mexico Permian up by about 240 kb/d based on Novilabs (formerly shaleprofile) data.
https://public.tableau.com/shared/9YDND7X22?:toolbar=n&:display_count=n&:origin=viz_share_link&:embed=y
Kengeo,
Explained already. Two models, conventional (2780 Gb) and unconventional (190 Gb), Conventional model peaks in 2016 at 1267 Gb cumulative output or 46% of URR, unconventional model peaks at 82 Gb cumulative output in 2029 or 43% of URR, the peaks do not happen simultaneously. Unconventional output increases from 7.6 Mb/d in 2016 to 15.4 Mb/d in 2029, while conventional output decreases from 73.5 Mb/d in 2016 to 69.5 in 2029. Also keep in mind that the peak can occur before reaching 50% of cumulative output or after, the output curve need not be symmetrical and typically is not.
Peak diesel in China?
Global efforts to get rid of the combustible engine have weakened the historically tight relationship between GDP growth rates and demand for crude oil, noted Ed Morse, Citigroup’s global head of commodity research. “We’re quite confident in our view that China has peaked in terms of diesel demand, and is peaking in terms of gas demand,” Morse told CBS MoneyWatch last week, citing China’s high proportion of electric cars or hybrids. The world’s appetite for oil will peak by the end of the decade, he added.
https://www.cbsnews.com/news/electric-cars-mass-adoption-in-u-s-bloomberg-finds/
Just compare to Texas to New Mexico and it’s incredibly clear that Texas peaked and is in serious decline…
Kengeo,
The RRC production statistics for the most recent 12 to 18 months are not accurate. In April 2022 Texas output was over 5000 kb/d.
Starting with October 2021, below is the monthly data in kb/d up to April 2022.
4967
4994
4991
4853
4821
4980
5015
This has been discussed many times in the past, the Texas data gets revised monthly and eventually output for recent months increases to the level estimated by the EIA, usually the EIA is off by no more than 1% and typically within 0.5% of the final reported State data from the RRC, but it takes about 18 to 24 months for all RRC data to be properly updated (they have about 500,000 wells to keep track of in Texas, not an easy task.)
Kangeo
Compare your Texas chart with Texas chart in the post above.
Oil prices could surge above $150 if Russian supplies can’t be replaced, says Truist analyst
Oil prices could surge as high as $150 per barrel if Russian supplies can’t be replaced, an Truist analyst said.
Top oil producers like the US and OPEC have no spare capacity for ramping up output further, Neal Dingmann said.
“The only true spare capacity, unfortunately out there, prior to all the issues, was in Russia,” he said.
Ron/Dennis
I thought that it would be worthwhile to take a look at a longer time frame for oil production from the World W/O the Big 10. I was interested in seeing if those countries had a peak. It occurred in 2005 in May and December at 31,704 kb/d and 31,711 kb/d, respectively. A fairly rapid decline then started in Jan 2011. There is quite a difference in slope between the slow climb to the peak and the rapid drop off starting in 2011. Not sure what this is telling us.
The second chart is the OLS line using date from December 2009 to January 2020. Into the least squares total, the February 2022 and March 2022 data points were added. The decline rate for the World W/O the Big 10 is 655 kb/d/yr. If this decline rate continues, it means that in addition to supplying the yearly increase in demand, the big producers have to produce an additional 655 kb/d of oil every year.
Thanks Ovi.
We can substitute the Former Soviet Union (FSU) for Russia (and include those nations as a group after 1991 for consistency.) So big 10 substitutes FSU for Russia in Top 10 producers and World less top 10 looks like this from 1983 to 2019. On ramp up (from 1983 to 1997) the annual rate of increase is 3.3% per year and on the ramp down(2010-2019) the annual rate of decrease is 2.8%. Note that there is nothing natural about symmetry in this case, for most places the ramp up slope is different from the ramp down (in most cases a faster ramp up and slower ramp down).
Dennis
Going further back adds more insight. Definitely a difference in slope between 1987 to 1996 and from where my chart started in 1996 to the peak in 2005. I think the two main countries you added were Kazakhstan and Azerbaijan.
I wonder if the decline in the declining countries is related to the inability to use EOR techniques. In other words, the only way to offset their decline is to drill more wells.
Ovi,
I imagine all nations have access to the needed technology, just some areas are more attractive for investment than others is my guess. Also added were Turkmenistan, Uzbekistan, Belarus, Ukraine, Lithuania, Kyrgyzstan, and Georgia, though the first two you mentioned are the most important besides Russia. I actually forgot Belarus, Ukraine, Georgia, and Lithuania in first chart, corrected chart below. Increase from 1981-1997 is 3.2% per year on average (using slope of nat log curve) and decrease from 2010 to 2019 is 2.8% per year.
Dennis
I wasn’t thinking of technology as the limiting factor. I was thinking lack of water and gas to maintain pressure.
Chart with OLS line
WTI under $94 this morning. It’s just starting to roll
over. Price has a lot of room to fall.
As I see it market participants are having collateral scarcity issues. Dollar funding available to China which a lot comes via Japanese banks is drying up.
Mainstream narrative is the FED is hiking and interest rate differentials. That’s bullshit. What we are seeing in currency markets is a collateral issue.
We are in a larger repeat of 2008.
Yes, paper markets are selling everything now. Stocks, gold, oil, bitcoin and even long term bonds.
And they will sell more when more and harder margin calls are coming in – then things will start rolling again, until the FED steps in as in Lehman and COVID crash. I think we are on a tipping point for this to happen now.
The Euro Dollar is clinging itself on this symbolic 1:1 barrier at the moment, dragging the Euro a bit higher in all this Dollar surge. Let’s see if this holds.
At least one good thing of the oil price crash for Europe: They will burn oil for heat everywhere the equipment is installed this winter. When the stuff gets even cheaper as much as possible. The gas price is that sky high here so cheap oil is welcome.
I think Germany alone has old 4 GW oil burning emergency power plants left. They’ll run this winter…
Edit: As I wrote this, the first € dip below parity.
FED has no political cover while CPI is at 9%
Markets and prices have much further to fall.
And in my opinion a FED pivot doesn’t matter unless it coincides with a large amount of government deficit spending.
This will be together I think.
A FED pivot of 180 degree, and a trillion $ spending program. Social security, infrastructure, military spending. This is the mechanism of getting the FED money into the economy.
But not yet.
What’s the level of margin dept at the moment? For a margin cascade we’re still too high, most stocks have 50% security value only.
But another thing will push stocks down: Less saving and more account pulling for paying elevated prices – only the top 1% has more extra spare money now. And companies now have to pay real interrest rates for buying back stock on debt.
USA unemployment rate is only 3,6%
Everyone who wants to work can and is, although the labor participation rate is declining meaning that more and more people are not in the labor pool.
Most sectors are having a very hard time getting/keeping enough employees, and that is contributing to big inflation here.
The remedy is to increase the labor pool by enabling big targeted worker immigration, and providing a citizen path to all the undocumented workers who are here and doing the job.
Or get used to high labor cost and shortage, and thus high inflation and high interest rates.
Hickory,
The unemployment rate may rise as growth slows due to higher interest rates and a poor economic outlook leading to less investment spending and lower overall aggregate demand. The Fed is likely to continue with 0.75 to 1% increases in the Fed Fund rate until they see better inflation numbers. The economy will likely take a hit over the next 6 to 12 months.
OPEC Faces a Near-Impossible Production Task in 2023
Combining the demand and non-OPEC supply outlooks, the 13 members of OPEC will need to deliver more than 30 million barrels a day on average in 2023, according to both OPEC and the IEA. The EIA outlook puts the figure at 29.4 million barrels a day.
The last time the current members of OPEC collectively pumped more than 30 million barrels a day, the combined output of five of them — Algeria, Iran, Libya, Nigeria and Venezuela — was almost 2.75 million barrels a day higher than it was in June. Just three members — Iraq, Saudi Arabia and the United Arab Emirates — pumped more last month than they did on average in 2018.
OPEC producers’ inability to raise production rates with oil prices above $100 a barrel and soaring demand for their crude doesn’t bode well for the future. The group will need to pump about 1.36 million barrels a day more on average next year then it did last month.
https://www.bnnbloomberg.ca/opec-faces-a-near-impossible-production-task-in-2023-1.1791865
OPEC and maximum production: What is sustainable?
Here is their opinion on SA capacity.
Saudi Arabia’s current OPEC quota is 11.00 mmbopd. The country has reached this production target only twice in the last four years, in November 2018 and April 2020. The April 2020 volumes were the result of a production and price war launched between Russia and Saudi Arabia, wherein the Saudis attempted to press the Russians into OPEC+ production compliance. Shortly thereafter, production (and the crude price) plummeted due to the COVID-19 pandemic and remained in the 8.50-9.25 mmbopd range. In October 2021, with the global economy recovering from the effects of the pandemic, the Saudis commenced a gradual production increase to 10.00-10.50 mmbopd.
Interestingly, the current OPEC quota may be out of reach for the country as it struggles to deliver a consistently high production rate of around 11.00 mmbopd. While Saudi Arabia has reached the 11.00 mmbopd production level in the past, it is a significant challenge to sustain it owing to operational challenges, regularly planned maintenance, and the need to supply the country with sufficient fuel to power the necessary summer-time air conditioning. Only with infrastructure expansion can the kingdom maintain an 11.00 mmbopd or higher production level. The investment and project execution will take time and requires long-term, consistent capital investment. For domestic oil production projects, Saudi Arabia has a track record of staying the investment course; but the same cannot be said for other businesses. In the near term, however, OPEC’s most powerful member will struggle to deliver on its oil production quota, as it may well have reached a maximum sustained production level until new infrastructure can be built.
https://www.mei.edu/publications/opec-and-maximum-production-what-sustainable
Ovi,
A recession might keep demand at a lower level, the economy does look pretty bad right now with high inflation and likely central bank rate increases leading to a likely slow down in growth in an an attempt to reduce the rate of inflation. I think it may not be enough to bring down oil prices as much as the futures market indicates, there is a pretty large spread between futures and spot prices (about $5/b for Brent on July 11). Sometimes the futures market gets things wrong. The strong dollar will increase the price of oil in other nations (in the local currency) and may curb demand for oil at the World level. Always difficult to foresee how it will go.
Dennis
The large spread between the front month and the next month, $3 for WTI, is an indication of refineries saying “We need crude and we need it now”. Current demand must be good. WTI was as low as $90.50 this morning and is now back to $ 95. Difficult to understand that range of volatility on such a heavily trade commodity. Also the WTI Brent spread has opened up to $6. Can’t recall seeing it that high. Is this the result of Brent shortage or US selling from the SPR or both.
WTI Sept $92.13.
Brent Sept 98.24
Any idea on how good the inverted yield curve is predicting recessions?
Ovi,
I think it is one of those things where a yield curve iversion overpredicts recessions something like 20 of the last 10 recessions (I am making that up). Nobody can predict a recession in advance. What we have is people who always say a recession is around the corner, eventually they are correct, because if you always say a recession is coming, you will be right. The broken clock (analog) is correct 2 times per day.
I will chuckle when I see the responses that say “so you think there will never be a recession?” Sometimes reading skills are not very good.
Somewhat trivial, but I get a range of decline rates depending on which data are used all pretty close though…650 +/- 25…(~2.7%)…
And some of the more recent data might indicate considerably higher decline rate of 850 (3.7%)…
Chart below is 1970 hubbert curve overlayed with 2005 peak for world less top 10:
Here’s a mix of World Top ~14 (Ron’s list above), the others, and total all together with some hypothetical hubbert curves…
Added oil price and x axis = 1980 – present:
Ken Geo,
What is y intercept (determines the peak of hubbert curve) and URR?
Chart below has a Hubbert curve (logistic function) with URR=2800 Gb and y-intercept (b)=0.385, peak is 73.8 in 2018. Data is World C+C.
Damn Dennis, have you been taking smart pills? This chart actually looks realistic. 🤣
Ron,
The Hubbert curve represents only conventional oil, when unconventional output is added to the conventional we get the following, with a URR of 2990 Gb consisting of 2800 Gb conventional crude plus 190 Gb of unconventional oil (tight oil plus oil sands). Peak is about 87 Mb.d in 2027, the oil shock model is different and peaks at 84.5 Mb/d in 2029.
Dennis, so far the peak was in 2018-2019. I will begin to take your charts seriously when world production surpasses that peak. It’s been over 3 years and not looking like that will happen any time soon.
Ron,
Hmm, did anything happen after 2019 that might have affected World C plus C output?
What has World output been doing since June 2020? The average annual rate of increase in World C plus C output from Jun 2020 to March 2022 has been 5359 kb/d.
In June 2020 output was 70291 kb/d and in March 2022 output was 80552 kb/d an increase of 10261 kb/d over a 21 month period or an average monthly increase of 488.6 kb/d. I expect in 4 to 5 more years we may return to the previous peak of 83 Mb/d (12 month average peak), this assumes an annual rate of increase in World C plus C output of 800 to 1000 kb/d over the next 4 to 5 years. The only thing that is likely to curtail this rate of growth would be a lack of World demand either due to high oil prices and the pressure to transition to electric transport due to those high fuel costs or due to a severe recession, either is possible, but I expect this won’t affect the scenarios much until 2028 or later.
Ron,
Slightly revised scenario so that conventional cumulative matches with my shock model for conventional oil in 2021 at about 1400 Gb cumulative output, the horizontal scale is a bit shorter and vertical scale is no longer starting at zero.
Dennis, OPEC Less Saudi Arabia declined almost 3 million bp/d before the pandemic. Now they have fully recovered from the pandemic but stalled out at about three-quarters of a million bp/d below their pre-pandemic level.
The world less the big 10 give almost the exact same profile. It’s over Dennis.
Click on graph to enlarge.
Ron,
Are all of the big 10 oil producers in OPEC? I agree OPEC big 5 and Russia have stalled, we still have US, Brazil, Canada, and China, probably there won’t be much of an increase from China, but I expect the other three, especially US and Canada may increase output over the next few years, there may also be increases from Norway, Guyana, Suriname, and Argentina and potentially Libya, Iran and Venezuela, over time OPEC big 5 might expand capacity. Much of the decrease in your OPEC less KSA chart is from Venezuela and Iran over the 2017 to 2019 period.
Dennis –
Good news is that the next 6 months of data should tell us plenty, either world continues growing annually 1-2% (as you believe), it stays flat, or it continues decline somewhere between 1-5%. Based on multiple line of evidence, we can pretty much count on it dropping 1.2 MBpD every year, right about 1.5%. Then soon after increasing to 3%. After that the only question is when it will increase to 5-7%, my guess is around 2025-2026…
Kengeo,
We will see. Most of the evidence I see suggests about a 1% or lower probability your forecast of World C plus C declining at 6% per year by 2026 will be correct, by 2033 we might (50/50 chance) see World C plus C declining at a peak of 2.9% due to rapidly decreasing tight oil output, but this will be very short lived. The average World annual decline rate for C plus C output from 2031 to 2040 will be about 2% per year. Then decline rate decreases to 1.8% the next decade, then rises to 2.7% from 2051 to 2060 and peaks in the decade ending in 2120 at 3% per year.
If we have a Great Depression 2 at some point we might see a big drop like we did in 2020 (7.68%, the biggest one year drop in World C plus C output from 1900 to 2021, the biggest annual drop in crude output during Great Depression was 4%).
You seem to believe there must be symmetry in the rate of increase and the rate of decline, not really very likely.
Dennis –
Something I’m having great difficulty understanding about your analysis WRT URR:
Overtime it seems you have revised your estimate of URR DOWN (looking at past 5 years). Remarkably, at the same time you have pushed an additional peak further out…this is strange…see post below:
In a separate post you mention 3200 URR, you also mention “Saudi Amerika” and at one point you even say shale will peak in July 2022…
“Hi Ron,
From 2003 to 2018 Non-OPEC minus US, Russia and Canada fell by about 1% per year. If we assume the decrease is linear, it has averaged about 235 kb/d each year over the past 15 years. At some point US, Russia and Canada and OPEC will not be able to make up for this decline, my guess remains 2025+/-2 World C+C output begins permanent decline, about a 68% probability it falls in the 2023-2027 range with a 16% probability it occurs before 2023 and a 16% probability it may occur in 2028 or later”
Ron – Dennis believes he’s been talking the ‘smart’ pills all this time, but it appears they were mislabeled at the pharmacy…you know what they say about idiots: “they drag you down to their level and beat you with experience”, obviously Dennis is not an idiot…
I think at some point soon Dennis will be able to reconcile the differences and come to a better conclusion about the current status of both US and world oil production and growth/decline.
Right now I think what everyone wants to know is what is going on with Saudi Arabia, maybe Biden will figure it out today!
Kengeo,
I adjust my analysis on the basis of the data in hand, much has changed in the past 5 years. At one point I suggested a peak in 2023 to 2027, this was before the pandemic. World output was lower in 2020 and 2021 than I expected in 2019 before the start of the pandemic by about 2 Gb each year, that oil remains to be produced in the future, every barrel not produced is a barrel that might be produced later.
In short, the pandemic delayed the peak by a couple of years. I have adjusted my expectaion of extra heavy oil output from 500 Gb in 2015 to 115 Gb in 2022, so that reduced the overall URR estimate by almost 400 Gb. I also now include an expectation of lower oil prices starting in 2032 due to the EV transition, that is something new that I have added trying to include demand along with supply to improve the model. This reduces model output after 2030 relative to earlier models along with less extra heavy oil output after 2040 compared with earlier models.
Kengeo,
The model below is my current best guess, as I get more historical data I revise.
Click on chart for larger view.
Dennis – How could 2 Gb per year (4 Gb total) shift the peak by two years!?! That could shift it by 2 months at most!!! 4/27 = 0.15 years
So forgetting about peaks in oil production, do you believe there’s more recoverable oil in the ground than has been produced? Or do you think we hit 50% and every year the ratio climbs? This is the peak oil debate, not exactly when a maximum production value is reached (currently November 2018…over 100 Gb in the rear view ). Placing us 7% beyond a Hubert curve centered at 2018…I believe it’s more likely a Hubert peak exists in 2009 timeframe, this means we are 37% beyond that peak…just as you said the actual production peak and Hubert peak don’t have to align…
Ron – Don’t tell Dennis his graphs look realistic, he prefers to live in fantasy land…
Kengeo,
Try doing a Hubbert Linearization for World C plus C.
Use EIA annual data and C plus C cumulative output in 1972 of 263.75 Gb, for data from years 2000 to 2019 the URR is about 3000 Gb, y intercept about 0.04 and peak year is 2023 with output at 81.6 Mb/d.
You will find this simple Hubbert model does not match past data very well indicating it is far from a perfect model. During many historical periods output was either higher or lower than the Hubbert curve and no doubt this could occur in the future.
Not much point in discussing further. Jean Laherrere shows that World crude output is likely to be 2700 Gb. He does very careful analysis, but assumes always that there is no reserve appreciation when the historical data suggests this is not a good assumption.
This is in part why his estimates of World URR have mostly grown over time (2200 Gb for C plus C less XH in 2014 and 2800 Gb for C plus C less extra heavy in 2018) especially for conventional oil. Jean Laherrere has reduced his estimates fro XH oil from 500 Gb in 2014 to 215 Gb in 2018.
Time will tell who is correct.
Kengeo,
The URR remains the same. If 4 Gb is not produced now, it remains in the ground to be produced later.
Hypothetically, with no change in URR lets say we had a scenario with 27, 27.5, 28, 27.5 Gb/y and then a pandemic occurs reducing demand and output to 25, 25.5, 26, 26.5.
So far in the first 2 years 4 Gb less output has been produced and over the next 2 years another 3 Gb less output is expected than the original scenario for a total of 7 Gb. This does not reflect a change in URR, the URR remains the same, but there are 7 Gb more remaining reserves in the revised scenario after year 4. The original scenario expected the peak in year 3, the revised scenario might see a peak in year 6 as in 25, 25.5, 26, 26.5, 27.25, 28 and note the original scenario had output of 27 and 26.5 in years 5 and 6 so cumulative output would actually be 5.75 Gb lower in the revised scenario with a peak that is 2 years later. This is pretty straightfoward arithmetic.
In March the EIA has Saudi Arabia’s C+C down by 250,000 barrels per day. The OPEC MOMR had them virtually flat. I think the EIA is probably in error and it will be adjusted next month. That just has to be an accident in copying the data from wherever they got it.
The average difference between the EIA’s C+C and the OPEC MOMR crude only has been 253 K barrels per day. (Not including March 2022.) That is not much difference. Apparently, Saudi does not produce a lot of condensate.
Make no mistake, OPEC is in serious decline. Only Saudi Arabia is managing to keep this obvious fact from becoming common knowledge. They are the king of OPEC and without their input, it becomes obvious what is happening.
The data for the chart below is through June 2022 and is from the OPEC Monthly Oil Market Report.
I wonder where the extra Saudi production came from this year. The Neutral Zone?
Dennis – I just plotted them visually…
I have a very hard time getting anything more than 2200 Gb to fit…
At the low end it seems that anything below 2000 Gb isn’t very believable…
Using a mid-point of 2100 Gb results in a peak date of 2009.
If I use 2800 Gb, it results in a peak date of ~2020… but visually it seems way off…peaks do not match up…ultimately it’s a tale of multiple peaks in different locations.
It’s really all for nothing, since production is around +/- 27 BbpY (and cumulative is ~1,000 Gb in 2007), all it means is that if URR=2000, then peak was 2007; if URR=2200, then peak was 2011; if URR=2400, then peak was 2014; if URR=2800, then peak was ~2020.
Every 4 years we burn thru ~100 Gb [between 3.5% (2800 Gb) and 5% (2000 Gb)].
I think we can calculate the worse case scenario which is cumulative of 1500 to date and only around 300 Gb of 1P remaining. This results in a hubbert peak in 2004. It’s worth noting that we had some 10-year high price movements in late 1900’s to early 2000’s which could coincide with peak. Again, in the 2008 timeframe there was more extreme price movement culminating on the peak oil price of ~$147 reached in July 2008. For this reason the best fitting URR is 2000 Gb, which means actual pumpable reserves in place are approximately 500 Gb (~25-30 years supply).
Bottom line is peak oil is in the past…nowhere to be found in the future…unless URR is 3000 (2023) or 3200 (2026)…
Since we are so close (or past peak oil), the URR plays almost no role.
Regardless of the remaining reserves, we know we’ve already burned thru between 50% (if peak in 2020) to 75% (if peak in 2007). Between 2007 and 2020 we produced 420 Gb (15%-21% of URR). For the prior 13 years (1994-2007) we produced 358 Gb.
Focusing on growth in production over 10 year periods, we find that the maximum was centered between 1999-2004. Coincidentally, production growth between 2004 (~81) -2008 (~83) was minimal while prices increased significantly over that period (35-53 in 2004; 47-66 in 2005; 65-75 in 2006; 60-95 in 2007; and 95-135 in 2008).
Ultimately, I think we can’t ignore the 2004 peak, the LTO plays simply shift the 2004 peak slightly, maybe about a year into the future for every 27 Gb (2014 if LTO=270 Gb; 2024 if LTO=540 Gb; 2034 if LTO=810 Gb)
I believe US has less than 50 Gb proven reserves, so that pushes the 2004 peak to 2006, some similiar adustments can be made to get the average peak to 2009 timeframe…
Kengeo,
Keep in mind that the BP data is C plus C plus NGL, better to use EIA annual data which is C plus C.
In the real world output does not follow a hubbert curve. Peak conventional was 2016 and peak C plus C so far has been 2018, you seem stock on the notion that peak occurs at 50% of URR. Read the Laherrere paper in full and it will be clear this is not the case based on history. There was a time when it was believed that URR was 1800 for conventional and then 2000 Gb and 2200 Gb and then 2500 Gb etc. Laherrere makes very conservative estimates and in 2018 his best guess for World C plus C URR was 2700 Gb (though he presented estimates that were as large as 3210 Gb, which even I believe is optimistic). He presented a scenario with C plus C less extra heavy oil at 3000 Gb and his best guess estimate for extra heavy oil was 210 Gb.
Note also that proved reserves are a very poor way to estimate reserves, it is actually not correct to add up a bunch of P90 estimates, it is not the proper way to do things. Only P50 estimates can be added together to get a meaningful estimate. The proper number to use would be the Rystad 1200 Gb estimate at minimum, but this makes the mistake that Laherrere has made for many years, ignoring reserve appreciation. Reserve appreciation is real as in the US from 1980 to 2005 when 2P reserves grew by about 63%, There also could be more oil discovered.
Data for World C plus C from EIA 1960 to 1972 in Mb/d below (use EIA C plus C data from 1973 to 2021):
20.990, 22.450, 24.350, 26.130, 28.180, 30.330, 32.960, 35.390, 38.630, 41.700, 45.886, 48.518, 51.138
Cumulative output of World C plus C at the end of 1959 was 100.58 Gb. Cumulative output of C plus C at the end of 2006 was 1011.59 Gb.
Dennis –
How quickly can all this mythological oil move from p50 to p90??? Does this happen overnite? Do you feel like p50 is adequate for relying on near term future production? I wouldn’t want to wake up each morning with a 50% chance my car starts…in fact I’d prefer p99.99 much over p90…
At a minimum I would model p90 and p50 separately, a barrel in the hand is worth 2 in the bush type of approach…
World oil production for sake of argument really took place simultaneously across the globe…there have been a couple late plays: shale and tar sands but their overall numbers are pretty small compared to conventional (I think you have them at 10-20% URR?).
Kengeo,
If you talk to a Petroleum engineer, they would assure you that the P50 estimate is the best estimate.
Let’s say you have a jar of jelly beans and you want to make your best guess of the number in the jar (without dumping on the table and counting). The closest guess to the correct number wins the jar (whether above or below the correct number), the spread of guesses by a group of 100 people is likely to hone in on the correct number if we average the guesses. Now let’s change the rules of the game so that the guess that is closest to the correct number, but does not go higher than the correct number wins the jar of jelly beans. This skews the guesses to the low side an is less likely to give a correct estimate. A P90 estimate is essentially an estimate that says, I am sure that reserves are at least this large. You have it backwards in the sense that a P90 estimate is mythical, it is the P50 estimate that is real and in fact the historical reserve appreciation suggests that by their nature petroleum engineers are conservative in their estimates and even the P50 estimate is likely to to prove too low. The Rystad estimates from July 2022 (for year end 2021) look very reasonable. The 2PCX estimate might be 60 Gb too high, but it is in the ball park (around 3000 Gb URR).
2P=548 Gb
2PC=1218 Gb
2PCX=1572 Gb
In the oil shock model discoveries move through a fallow, build, and maturation stage to become producing reserves, each year some new reserves reach the production stage as resources get developed, this is on the order of 26 Gb in 2021 of new producing reserves added to the pool of producing reserves Worldwide. The total pool of producing reserves at the end of 2021 was about 476 Gb in my model, fairly close to the Rystad 2P estimate, which suggests that about 75 Gb of reserves are in the process of being developed World wide or have reached FID and are expected to be developed. These resources are conventional only in my model so some of the 74 Gb of 2P reserves in the Rystad estimate might be unconventional oil, in fact looking at the numbers it is likely that at least 60 Gb of 2P reserves in the Rystad estimate is unconventional oil in the US and Canada so my model estimate of producing conventional reserves is about 14 Gb less than the Rystad 2P conventional oil estimate of 488 Gb. If it makes you more comfortable we could think of the 1P reserves being produced first over the next 10 years or so and then the probable reserves after that, in my model about 250 Gb of conventional reserves are produced between Dec 31, 2021 and Jan 1, 2032. This pretty much matches the Rystad 1P conventional reserve estimate (I assume about 50 Gb of unconventional 1P reserves in the US and Canada at the end of 2021.) Note that more producing reserves get added each year so that conventional producing reserves fall to 459 Gb at the end of 2031in my model. Over the next 10 years some of the 650 Gb of contingent resources will move into the 2P reserve category as development of resources proceeds.
See page below and oil shock models presented there (start with simplified shock model from 2015).
https://peakoilbarrel.com/category/shock-model/page/2/
See
https://www.rystadenergy.com/newsevents/news/press-releases/total-recoverable-oil-worldwide-is-now-9-lower-than-last-year-threatening-global-energy-security/
\lim_{t \to \infty) P1(t) = \lim_{t \to \infty} P2(t) = \lim_{t \to \infty} P3(t) = URR.
By 2100 all this will be clear!
Ken Geo,
Yes unconventional is quite small in my opinion roughly 200 Gb out of 3000 Gb total URR (about 7%).
The resource is large (especially for extra heavy oil) but the amount that will be economically recoverable may be small.
“… output does not follow a hubbert curve…” Doesn’t that depend on the horizontal scale? Regardless of decade-long subtleties, the fossil fuel production chart that matters globally WILL be just that short blip on Hubbert’s original /- 1000 year chart centered on around now.
Hubbert is useful; Seneca is truth: Slow up, unexpectedly fast down.
Its kinda like we are on the wet ride at the amusement park, all fun and games, but we are about to emerge through the final waterfall to face reality again,
IMHO there won’t be enough renewables in place to sustain the production of the stuff needed to keep the renewable energy sources running in perpetuity, and it will all gently go quiet.
I see this factoid today:
“Saudi Arabia, the world’s largest oil exporter, more than doubled the amount of Russian fuel oil it imported in the second quarter to power power plants
This was necessary to meet the demand for summer cooling and free up the kingdom’s own oil for export, according to Reuters.”
Kinda ironic really: Oil that could be stockpiled to keep cold Europeans warm in winter is instead being used to keep hot Arabs cool in summer.
It’s a zero sum game. Otherwise, they would have burned own oil as in every summer.
I just think they got the russian oil by a big discount, so selling the own oil and buying the russian to burn is a good deal.
Seppo posted an interesting headline above at this link.
https://peakoilbarrel.com/north-dakota-sinks-us-april-oil-production/#comment-742893
Offshore magazine and Rested offer a diferent perspective,
Recoverable oil in downward spiral, report claims.
The volume of global recoverable oil now totals about 1,572 Bbbl, according to Rystad Energy, down almost 9% on the estimate for 2021.
Recoverable oil corresponds to “remaining technically recoverable crude oil and lease condensate” and includes risked future discoveries.
Main reasons for the decline are the 30 Bbbl produced last year and a reduction in undiscovered resources of about 120 Bbbl.
The situation “could further destabilize an already precarious energy landscape,” per Magnus Nysveen, Rystad Energy’s head of analysis. “Energy security is a matter of redundancy; we need more of everything to meet the growing demand for transport and any action to curb supply will quickly backfire on pump prices worldwide, including large producers such as the U.S.”
He added, “Politicians and investors can find success by targeting energy consumption, encouraging electrification of the transport sector and drastically improving fuel efficiency.”
Rystad Energy’s latest estimate put the total of undiscovered oil worldwide at 350 Bbbl, down from 1 trillion bbl in 2018, the chief cause being the collapse in investor appetite for exploration exposure, which has led to fewer government leases.
https://www.offshore-mag.com/business-briefs/article/14279045/recoverable-oil-in-downward-spiral-report-claims
Ovi,
Yes I am aware the reserves have been revised lower, the 2PCX number of 1570 Gb plus 1430 Gb of cumulative production adds up to about 3000 Gb which is similar to estimates that you and I have both done using different approaches. Jean Laherrere’s estimate is 2700 Gb. My best guess is 3000 Gb, 2700 Gb would be the lower end of a one sigma confidence interval, with pehaps 3300 Gb for the upper end of a one sigma confidence interval for URR. With a very fast transition away from oil we might see 2700 Gb and with a very slow transition, perhaps 3300 Gb. From an environmental perspective the 2700 Gb would be far better, but I am not that much of an optimist.
Dennis
I find this statement interesting: “these giant NOCs can continue to produce at their current rates for another 40-60 years from existing resources, explained Wood Mackenzie,”
First off I don’t believe the statement, produce, OK, but at their current level, No. Also it implies that output cannot grow to meet increasing world demand, So these countries may not be in a position to generate a new peak.
For such a respected company, I can’t understand why they are making such a statement. I think that what comes out of OPEC in theie November and December reports will reveal whether OPEC really has any spare capacity to tap into.
I agree that reserves are close to 3000 Gb +/- 300 Gb.
Ovi,
I tend to agree, perhaps the believe the inflated reserve numbers from OPEC, but even if they did, it seems unlikely they could produce at currnt rates for 40 years. keep in mind that 30 Mbpd for 40 years is roughly 440 Gb, Rystad has 2PC resources at 630 Gb for OPEC, but one would expect output would ramp down.
US car sales as a function of oil price, price in % BOE.
The sales decrease permanently, ROW is similar.
According to the diagram, they can increase only if the oil price falls below 6 % BOE, which is about 60 USD now.
If i use the thermodynamic model, the price today must fall below 5% BOE, before the sales numbers can increase.
Each year the car sales limit drops by 1 %BOE.
Dennis – Take a look at Brian Gallagher’s 2011 analysis: https://www.sciencedirect.com/science/article/abs/pii/S0301421510008049
“The IHC model data show that idealized peak oil production occurred in 2009 at 83.2 Mb/d (30.4 Gb/y). IHC simulations of truncated historical oil production data produced similar results and indicate that this methodology can be useful as a prediction tool.”
From 2009 to 2019 approximately 27 Gb of proven reserves were added to US, this does nothing for the 2011 analysis except possibly shit the peak by a maximum of 1 year (2010 instead of 2009). In fact, proven reserves for US are likely to be below pre-2009 levels within the next 2-3 years…
This would result in URR of approximately 1,100 x 2 = 2,200 plus any new proven reserves added, so maybe 2,250 or so? While it’s possible so addition reserves could graduate from ‘undiscoverd’ or ‘possible’ to proven, the outlook is not bright…
Shale game is nearly over, maybe around ~3 years before the fields all entering steep decline.
If you can point me to 1,000 Gb of oil discovered between 2009 and present then I’d be happy to review…
I’m going to build a nice stacked graph of the top producers plus ‘others’, I think this will really help to illustrate the situation…(maybe you can point me to one that already exists?).
Thanks Dennis!
Kengeo,
An analysis from 2011 is quite old, none of these methodologies will predict future output accurately. In 2012 I did an analysis using 2500 and 2800 Gb.
https://oilpeakclimate.blogspot.com/2012/08/i-noticed-that-compared-to-model-by.html
Peak was around 2015 at about 74 Mb/d for my best guess case. We seem to be using different data sets, in 2009 output was 73 Mb/d, so the idealized Hubbert curve gives an output which is 10 Mb/d too high, not really very useful. A proper Hubbert analysis suggests a 2015 peak, but only based on data through 2010, in 2015 output was cumulative of 1260 Gb, suggesting perhaps a 2520 Gb URR. Later data (through 2021) suggests a URR of 3000 Gb.
fitting Hubbert curves to past data does not predict future output. Using data available to the end of 2010 (as might be available for a Feb 2011 article. Would give us a URR of 2500 Gb with a peak in 2015 at about 75 Mbpd. Actual output in 2015 was about 81 Mb/d, so the Hubbert curve underestimated output.
Not familiar with idealized Hubbert curve, I only have access to abstract, not enough info.
Older analyses will be wrong, including my own analyses which proved too low, mostly because I assumed too low a URR.
Ron – While I agree that a peak in global oil production occured in November 2018, I believe that an idealized hubbert curve which best describes global production for the past hundred years is centered around 2009, plus/minus a couple years…focusing on actual production misses the ‘big picture’. I see 2018 peak as a ‘dying breath’ of sorts.
At this point every month we lose 100,000 barrels. That’s around 2.3 barrels of oil lost every single minute of every single day. To simply stay in a steady state of production, we need discoveries of 0.5 Gb every year. This would result in no growth whatsoever. More importantly, proven reserves are shrinking and not growing, so another way to think about it is we need 5-10 Gb added in chunks every 5-10 years. In the US, approximately 25 Gb of reserves were added between 2009 and 2019, this was the sole reason that world production was able to creep up from 2009 to 2018 or so…but since that time more than 50 Gb of oil have been produced, erasing any benefits to be carried into the future.
The chart below should help to illustrate the important peaks between 2008 – 2015:
Excluding US, annual growth between 1990 and 2005 was approximately 1.88%.
Following the first global peak in 2004, annual growth for the next ten years was only 0.52%.
Production in the US partially masked this event, which is now becoming clearer to see as the US shale growth slows down.
From 2016 to 2019, the world less US declined at an average annual rate of 0.95%.
Focusing on more recent datasets, between 2018 and 2021 the decline rate was higher at 3.23%, suggesting that we could expect a future decline rate excluding US to be between 1-4% annually.
Here’s diesel price to put it into perspective…
New posts up.
https://peakoilbarrel.com/opec-update-july-2022/
and
https://peakoilbarrel.com/open-thread-non-petroleum-july-15-2022/