A guest post by Ovi
All of the oil (C + C) production data for the US state charts comes from the EIAʼ’s Petroleum Supply monthly PSM. After the production charts, an analysis of three EIA monthly reports that project future production is provided. The charts below are updated to August 2021 for the 10 largest US oil producing states.
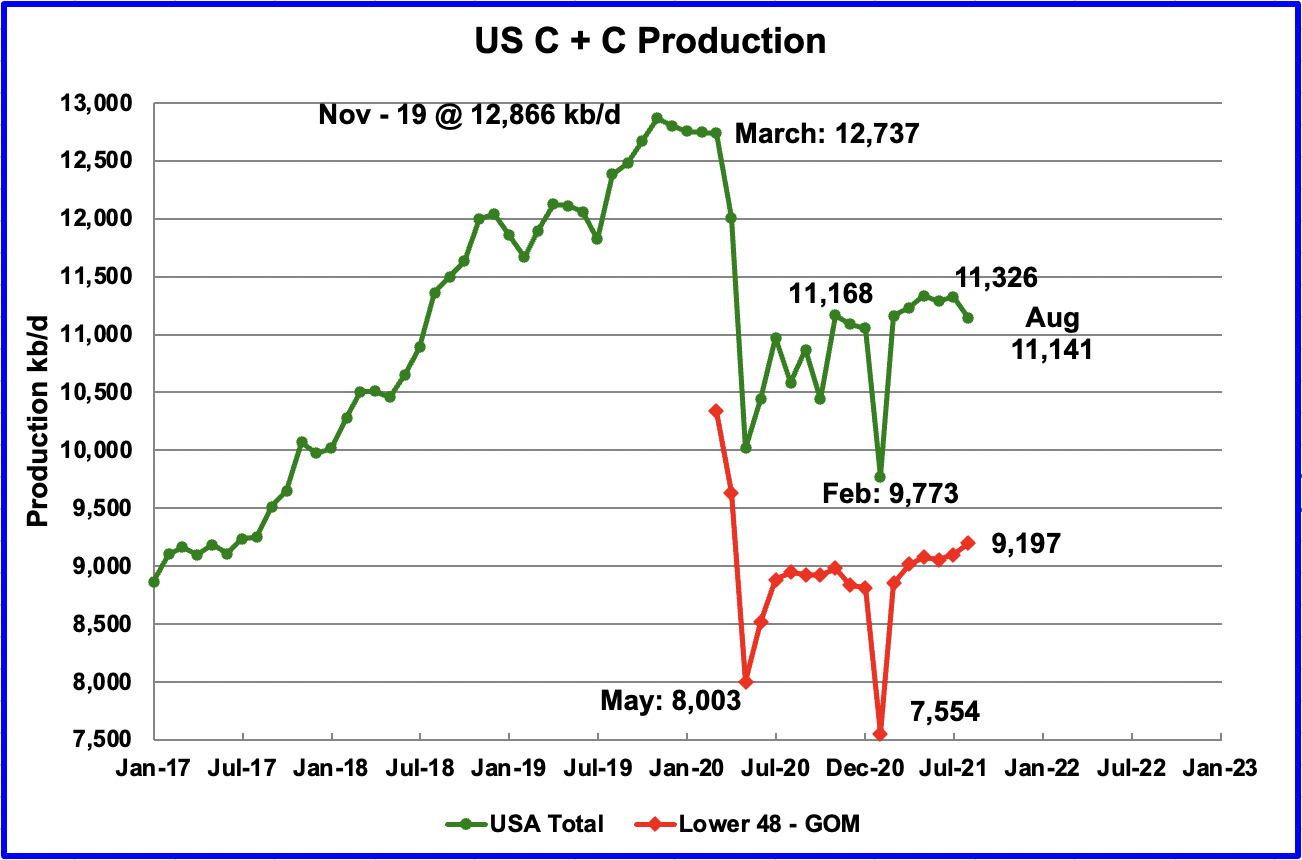
U.S. August production decreased by 185 kb/d to 11,141 kb/d. July was revised up from 11,307 kb/d to 11,326 kb/d in the October report. Note that August production is lower than November 2020, which was 11,168 kb/d, primarily due to Hurricane Ida’s impact on GOM production.
The October STEO report forecast US August output would be 11,060 kb/d. The EIA’s first estimate for August production in the October report is 81 kb/d higher. September is forecast to drop further since the impacts of hurricane Ida lasted longer than expected. Unexpected and extensive damage to platforms was done in the GOM.
While overall US production was down, a better indication of the health of US oil industry can be gleaned by looking more closely at the onshore L48 states.
In the onshore lower 48, August production increased by 98 kb/d to 9,197 kb/d. The main contributors to this increase were New Mexico, 50 kb/d, North Dakota, 29 kb/d and Texas, 18 kb/d for a total of 97 kb/d. This is a staggering increase since, if it continued at this monthly rate, it would translate into 1,164 kb/d/yr. This is a remarkably different picture for US oil output than many participants paint/forecast on this website.
Based on the DPR section below, it is forecasting that output in North Dakota will slow from the 29 kb/d increase posted in August. A better guess for future monthly growth according to the DPR is closer to 5 kb/d. Regardless, that would still leave the Big 3 producers increasing monthly production at a rate close to 70 kb/d/mth.
To get a better understanding of how long this rate can continue, it will be necessary to fully understand the contribution to output that the completion of DUCs is making, especially in the Permian/New Mexico. Also rigs are being added at steady rate in the Permian/New Mexico, more so than other basins/states. See New Mexico output further down.
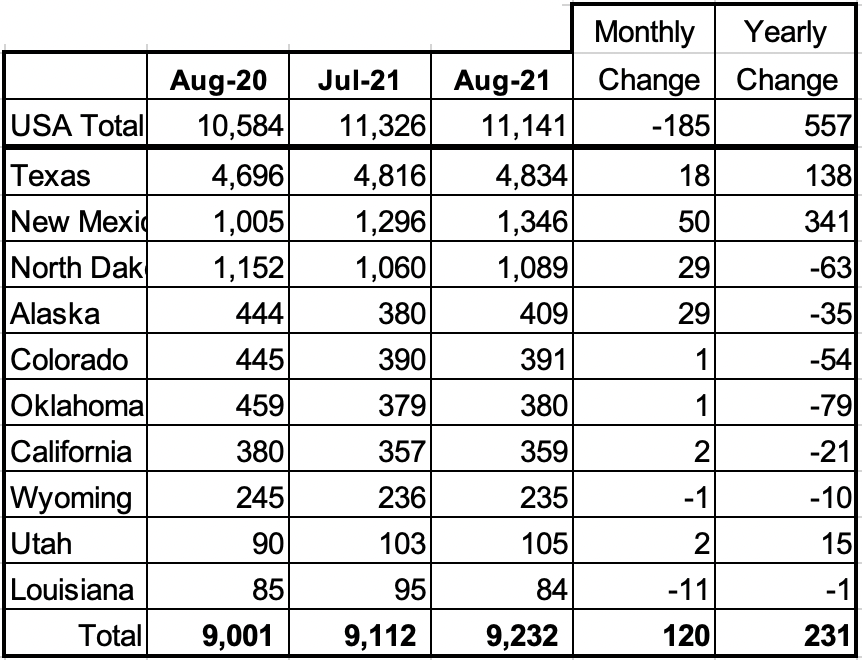
Listed above are the 10 states with the largest US production. These 10 accounted for 82.8% of US production out of a total production of 11,141 kb/d in August 2021.
On a MoM basis, the largest increase came from New Mexico with 50 kb/d. On a YoY basis, US production increased by 557 kb/d.
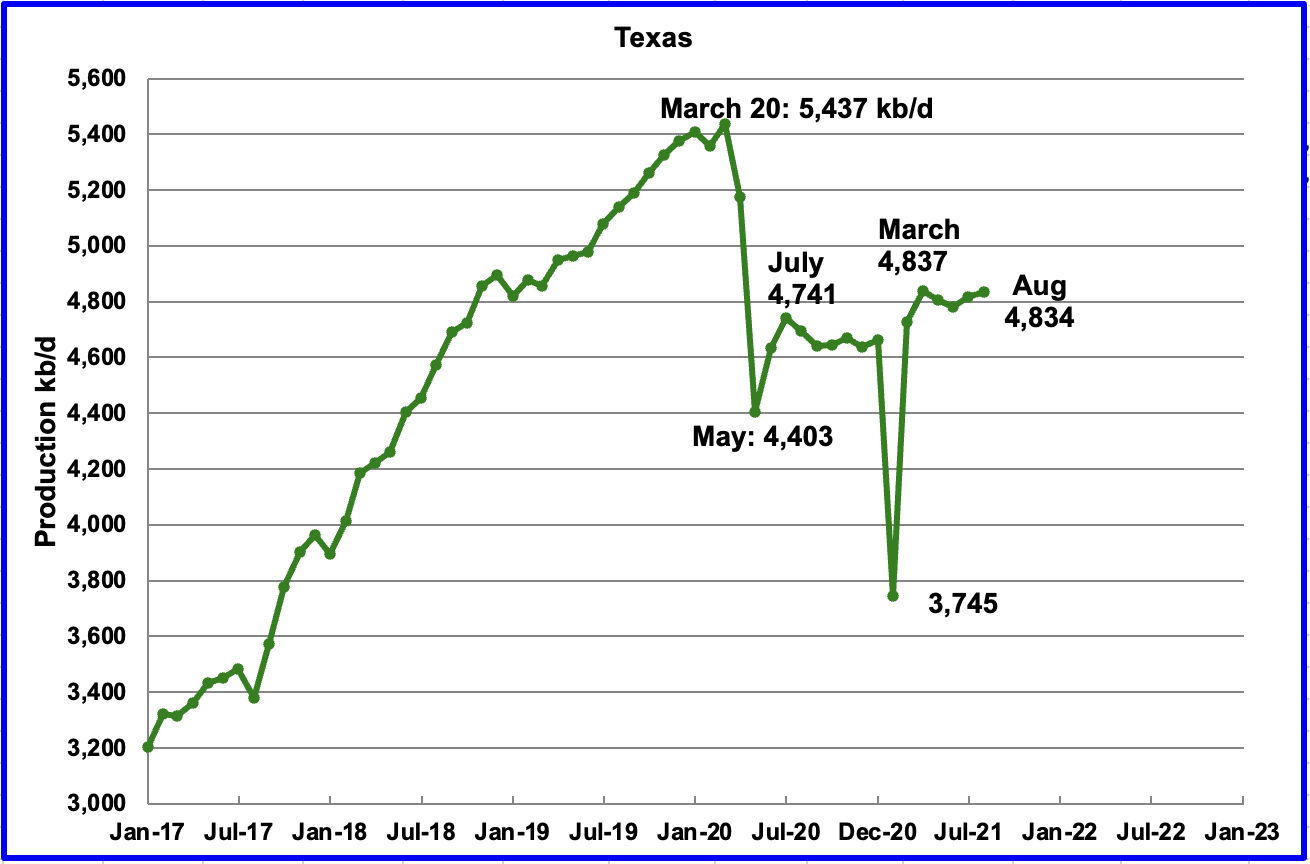
Texas production increased by 18 kb/d in August to 4,834 kb/d. Relative to July 2020, production is up by 93 kb/d.
In August there were close to 211 oil rigs in operation in Texas. By the week of October 29, 233 rigs were operating and production is slowly starting to increase.
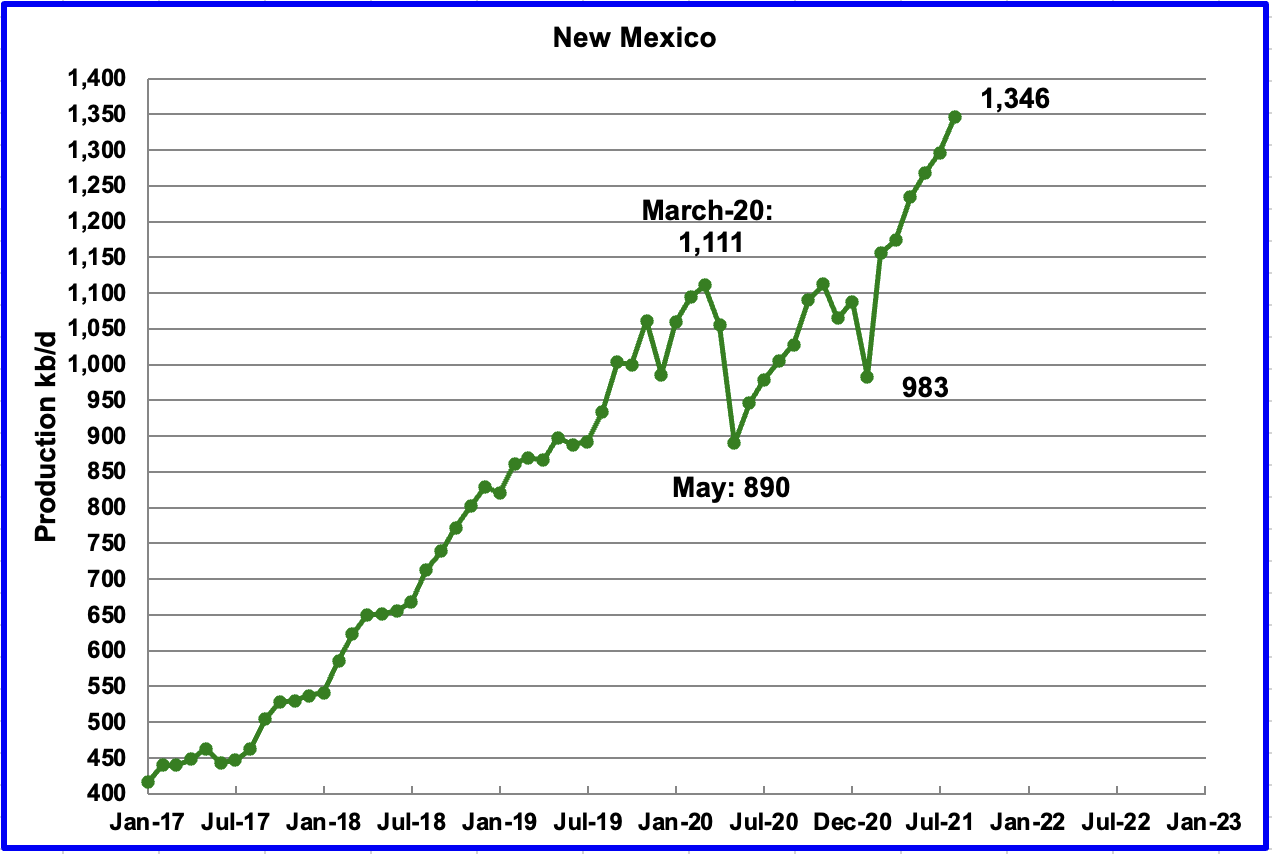
August’s New Mexico production set another new record and increased by 50 kb/d to 1,346 kb/d. The increase can be attributed to New Mexico’s Permian which is favoured over North Dakota, where higher production costs have curbed profits, according to this source
The steady increase in production is due to a steady increase in rigs as shown in the next chart and the completion of DUCs
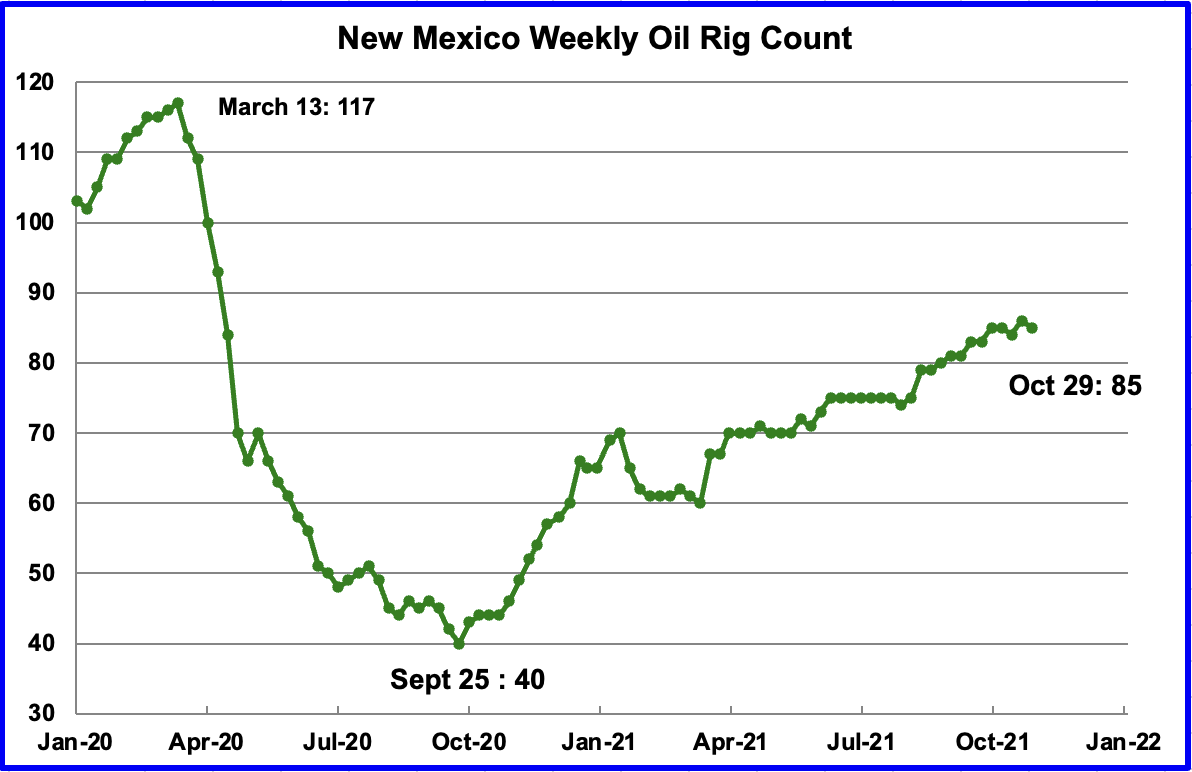
New Mexico’s rig count dropped by 1 in the week of October 29 to 85. Note the steady increase in rigs since the end of July. From the end of July to the end of October, the rig count increased by 11.

According to the EIA, August’s output was 1,089 kb/d, an increase of 29 kb/d over July. North Dakota has officially lost its status as the nation’s second biggest oil producer to New Mexico, according to this source

Coloradoʼ s August output increased by 1 kb/d to 391 kb/d. Colorado has had an average of 9 rigs operating from the end of July to the fourth week of October. One rig was added in the last week of October for a total of 10.
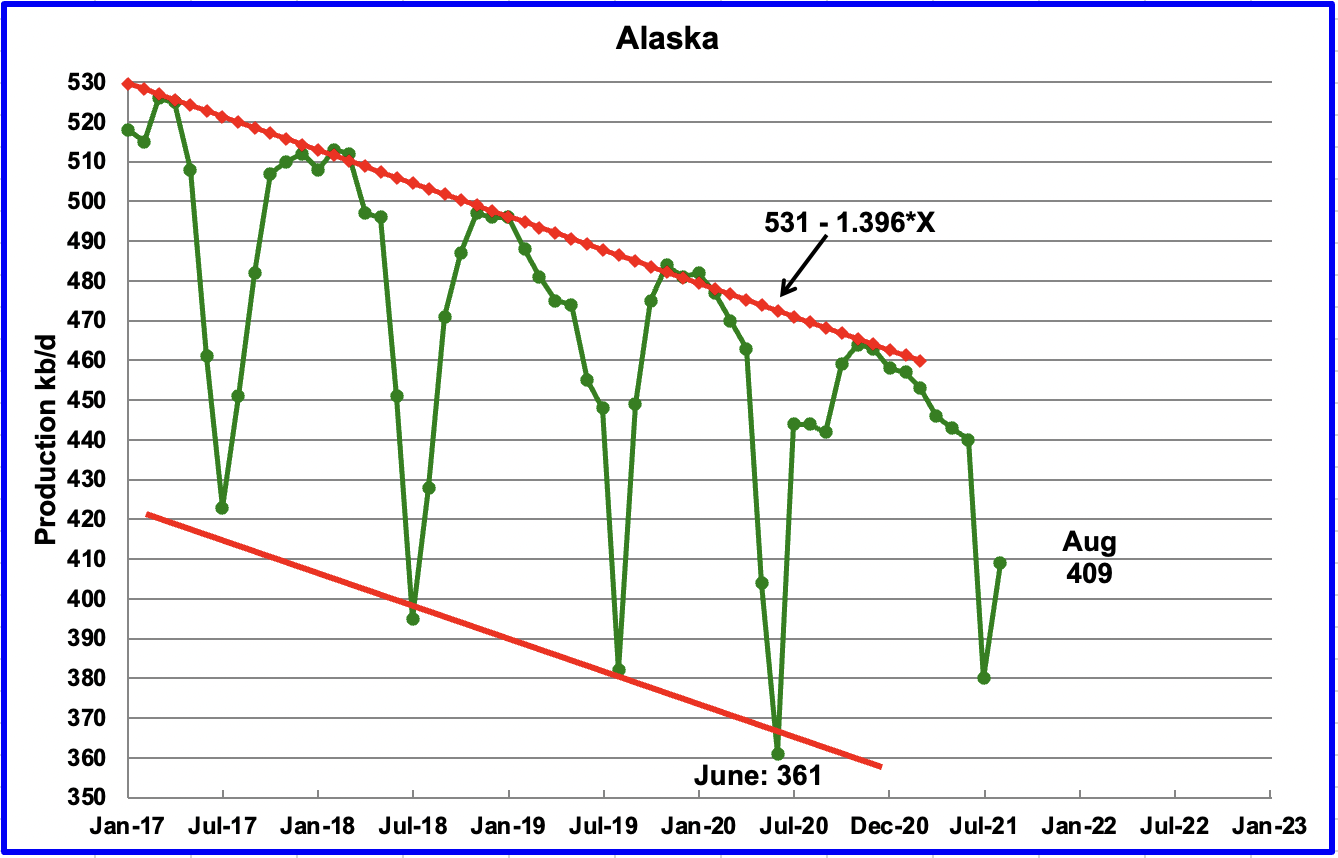
Alaskaʼ s August output increased by 29 kb/d to 409 kb/d as maintenance started to decline.
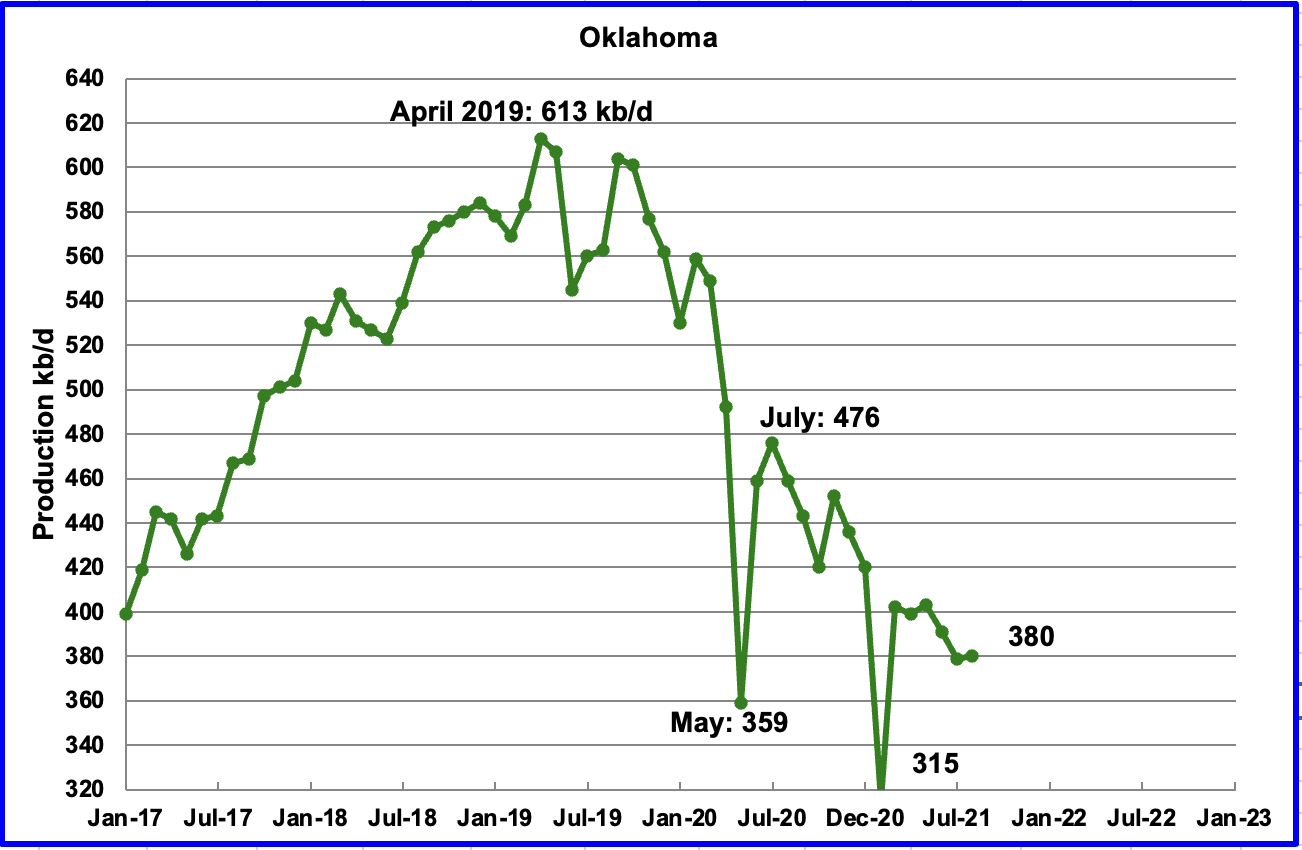
Oklahoma’s output in August increased by 1 kb/d to 380 kb/d. During August, Oklahoma had 30 rigs operating.
For the week ending October 29, 43 rigs were operating in Oklahoma. Oklahoma’s increasing the rig count is having difficulty in offsetting the decline rate in its oil fields.
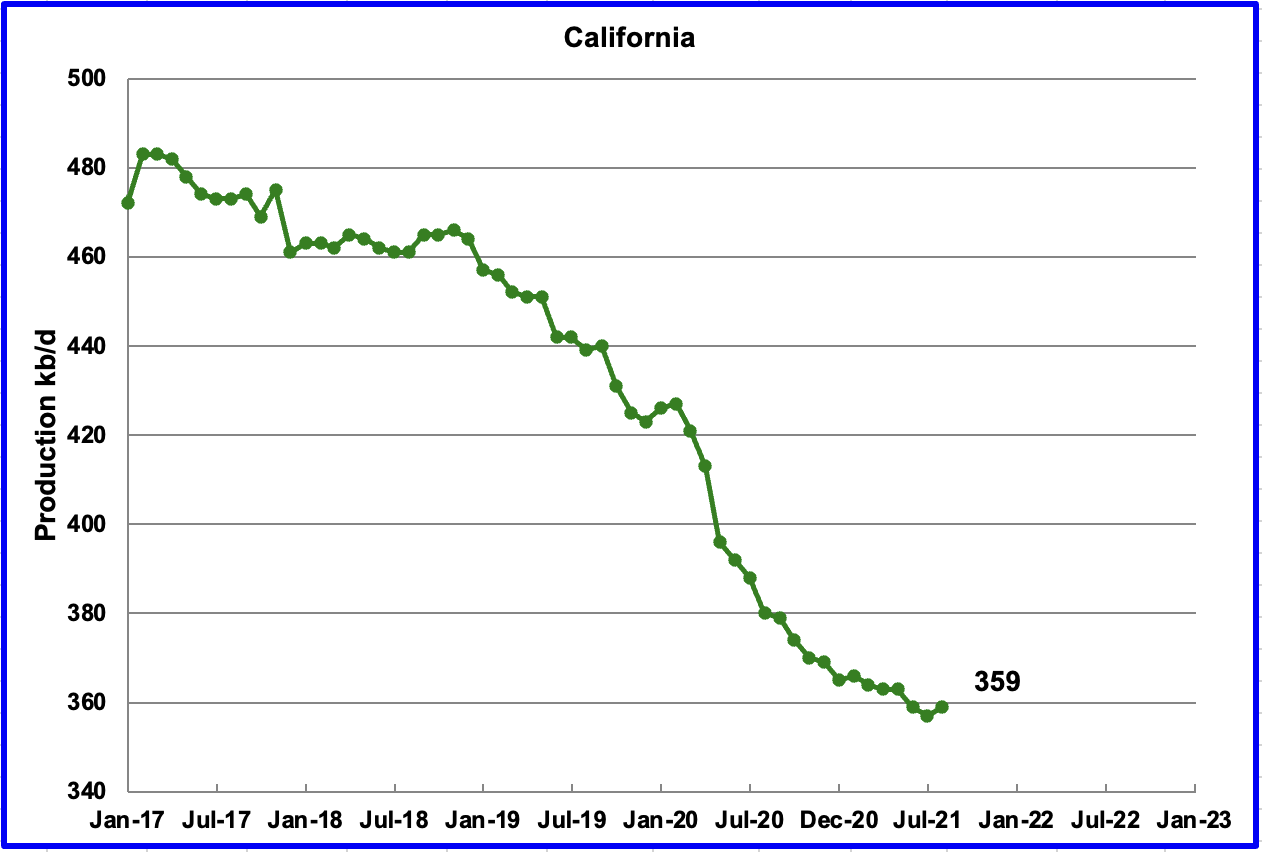
Californiaʼ s slow output decline reversed in August by increasing its output by 2 kb/d to 359 kb/d. California had 4 rigs operating in August and has slowly increased them to 9 in the week ending October 29.
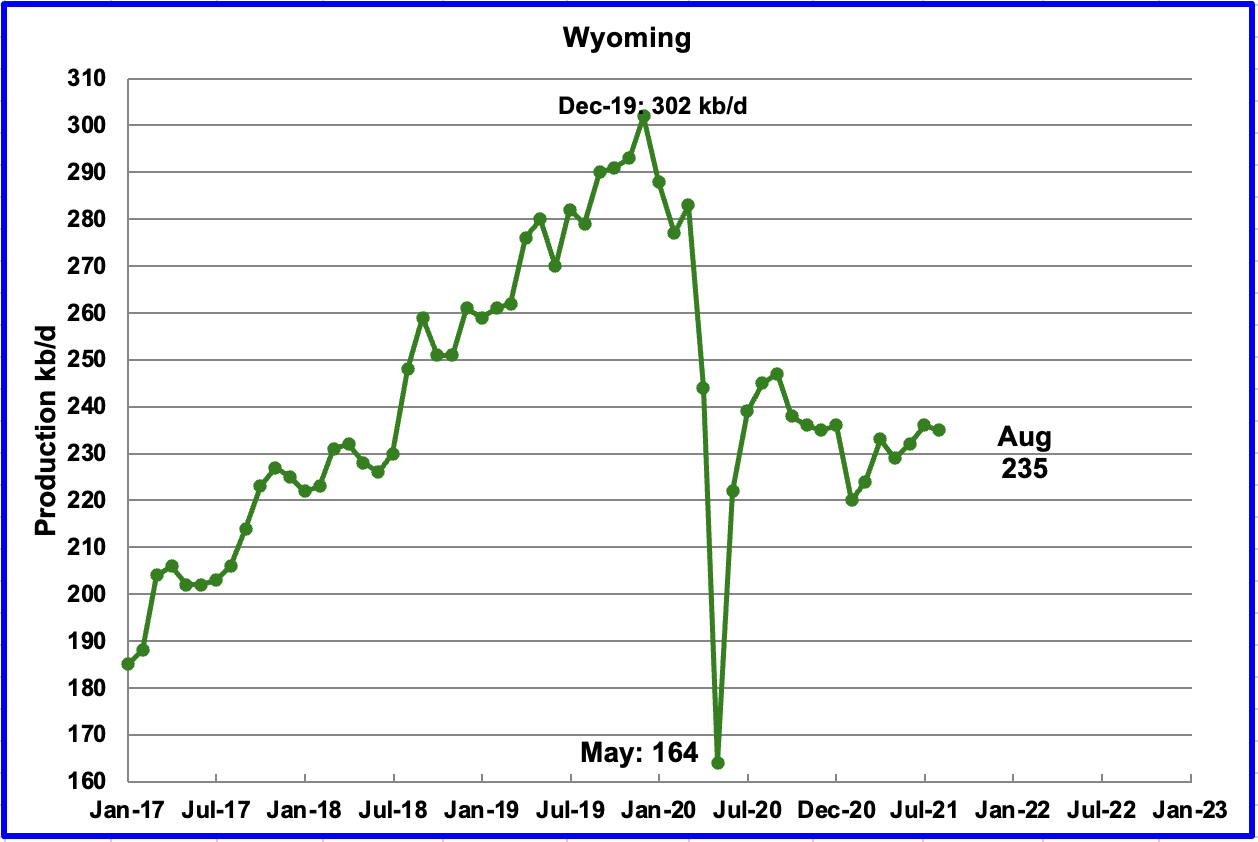
Wyoming’s production in August decreased by 1 kb/d to 235 kb/d. Wyoming had 15 oil rigs operating in August and decreased to 13 by late October.
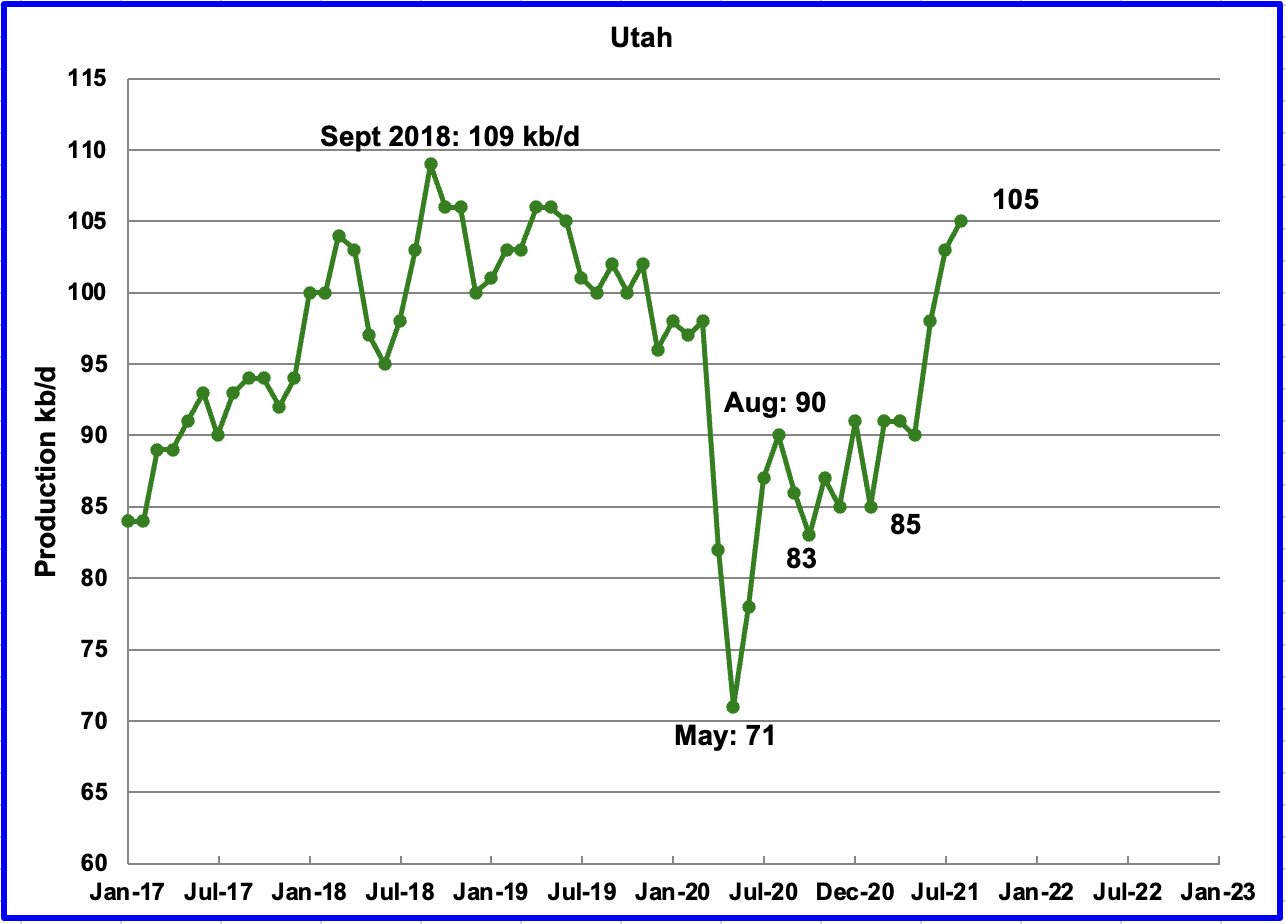
August’s production increased by 2 kb/d to 105 kb/d and is approaching its previous high of 109 kb/d achieved in September 2018. Utah had 11 oil rigs operating at the end of August and by the end of October the number had dropped to 8.
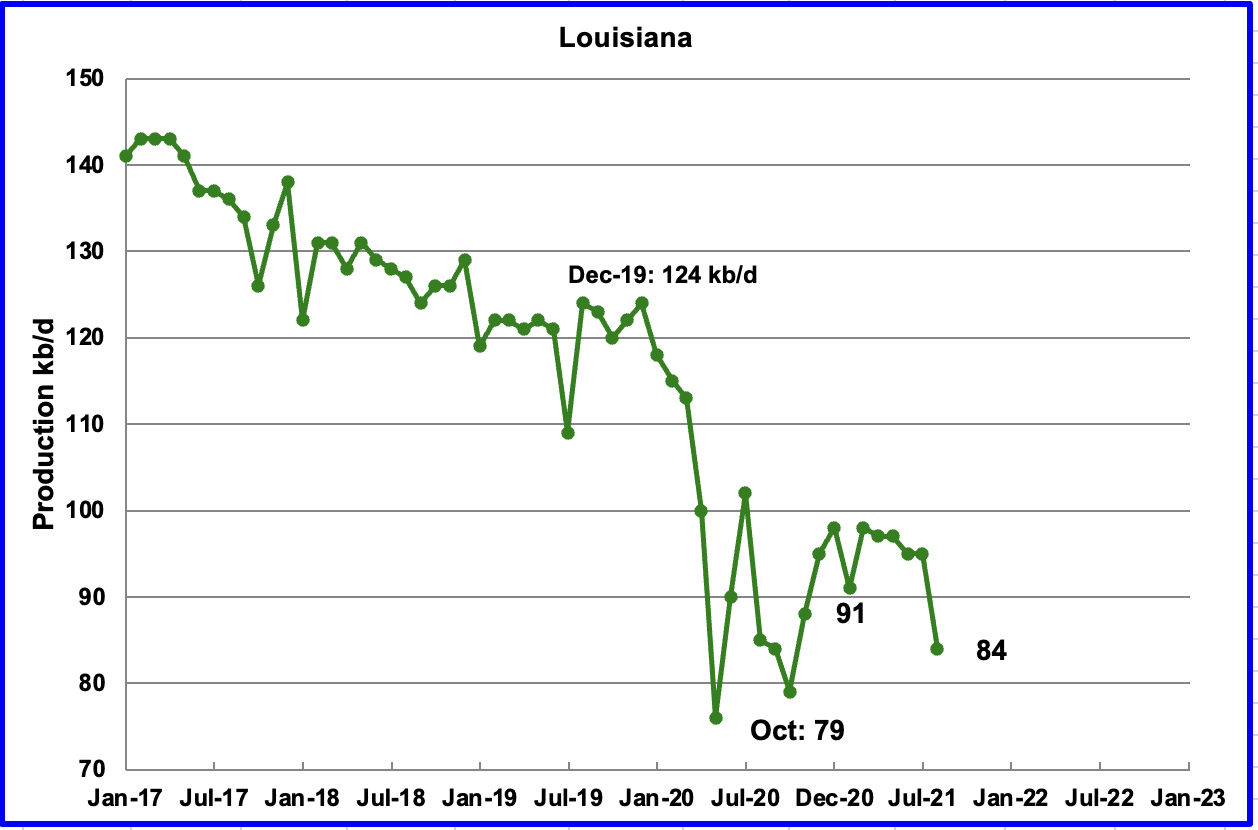
Louisiana’s output dropped by 11 kb/d to 84 kb/d. Louisiana was one of the hardest hit states by hurricane Ida in late August.

Production from the GOM dropped in August by 312 kb/d to 1,535kb/d. If the GOM was a state, its production would rank second behind Texas, even after its production was disrupted by hurricane Ida.
The October STEO projection for the GOM output has been added to this chart and projects output to be 1,835 kb/d in December 2022, little changed from the previous September report, red graph. The August output forecast by the STEO was 1,517 kb/d. A very good estimate, off by only 18 kb/d.
1) Short Term Energy Outlook
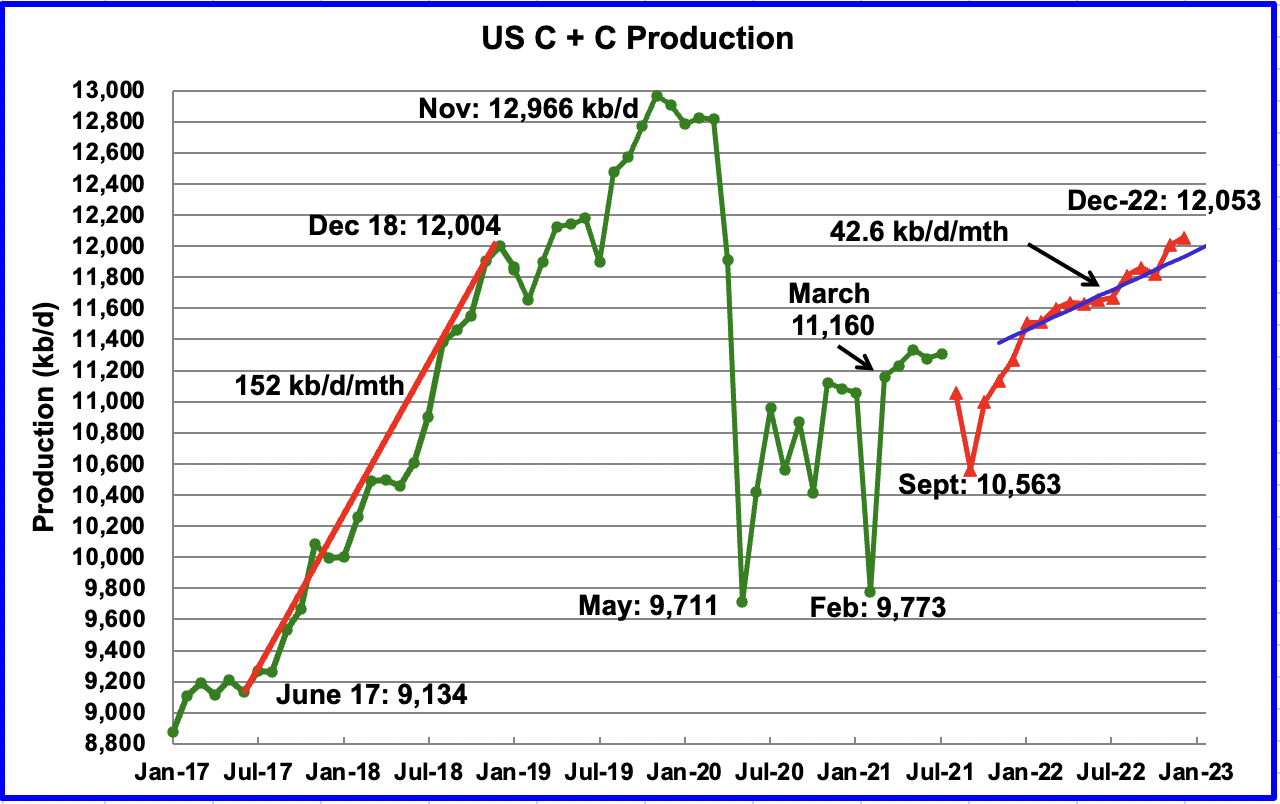
The October STEO has made further revisions to US output relative to the September STEO due to hurricane Ida which struck Louisiana. August and September production have been lowered while the US December 2022 output and the monthly growth rate have also dropped.
September 2022 output is projected to hit a low of 10,563 kb/d due to hurricane Ida. The weekly estimates for September issued by the EIA give an average of 10,680 kb/d, higher by slightly over 100 kb/d.
The December 2022 US production forecast has been reduced by 121 kb/d in the October report to 12,053 kb/d. However, and possibly more significant, the monthly growth rate from January to December has dropped from 68.1 kb/d/mth to 42.6 kb/d/mth. The reduction in the growth rate is due to an increase in the forecast January output and the decrease in December 2022. (Red graph)
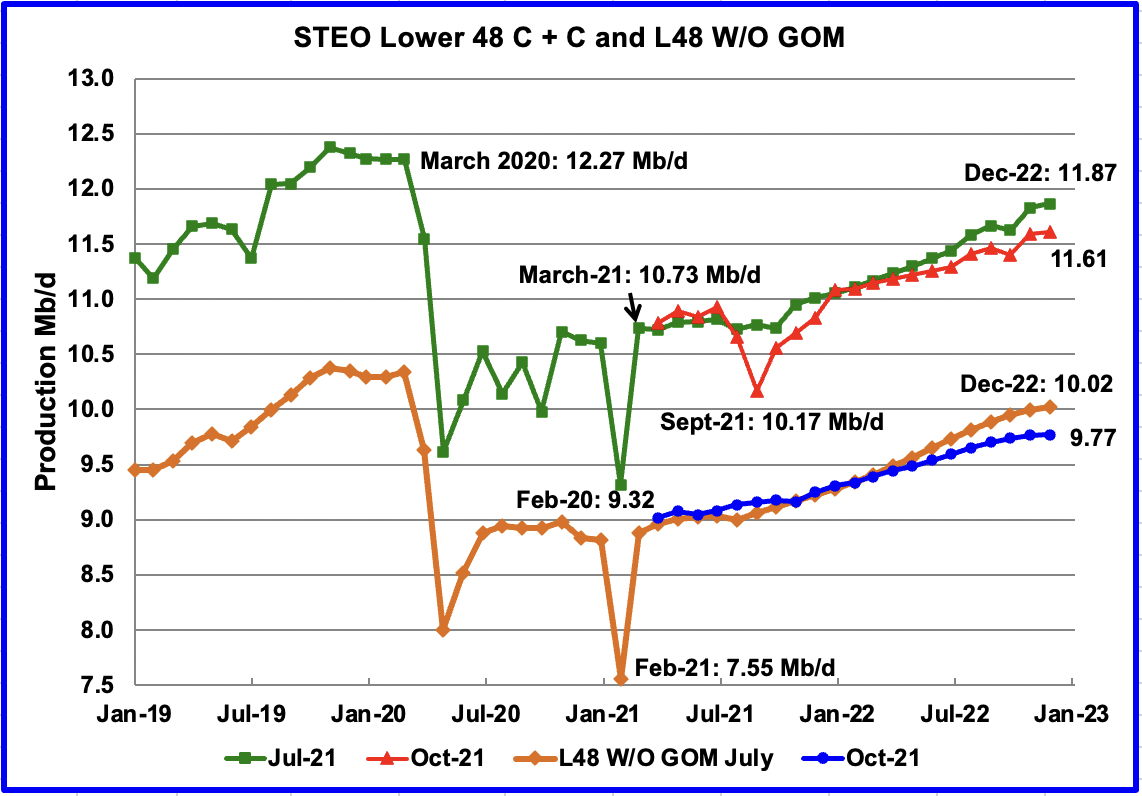
This chart compares the STEO forecast from the July report with the current October report to better demonstrate how the December 2022 forecasts have been slowly dropping. For the Lower 48, the December 2022 output has been revised down by 260 kb/d from 11.87 Mb/d to 11.61 Mb/d.
The October STEO output projection for the Onshore L48 states is also lower to the one provided in the July report. For the Onshore L48, the output projection for December 2022 is 250 kb/d lower than it was in the July report. Also, note that there is almost no growth in going from November 2022 to December 2022.

The October 2021 STEO oil price forecast shows a steady decline from the peak of $79/bbl in November to $62/bbl in December 2022. The big forecast change occurred in moving from the June report to the September and October reports. Note that on the day before the STEO was released, the WTI settled price was $80.64/bbl.
The December WTI contract settled at $83.57 on October 29, $7 higher than the EIA projection of $78.00 for the their December forecast.
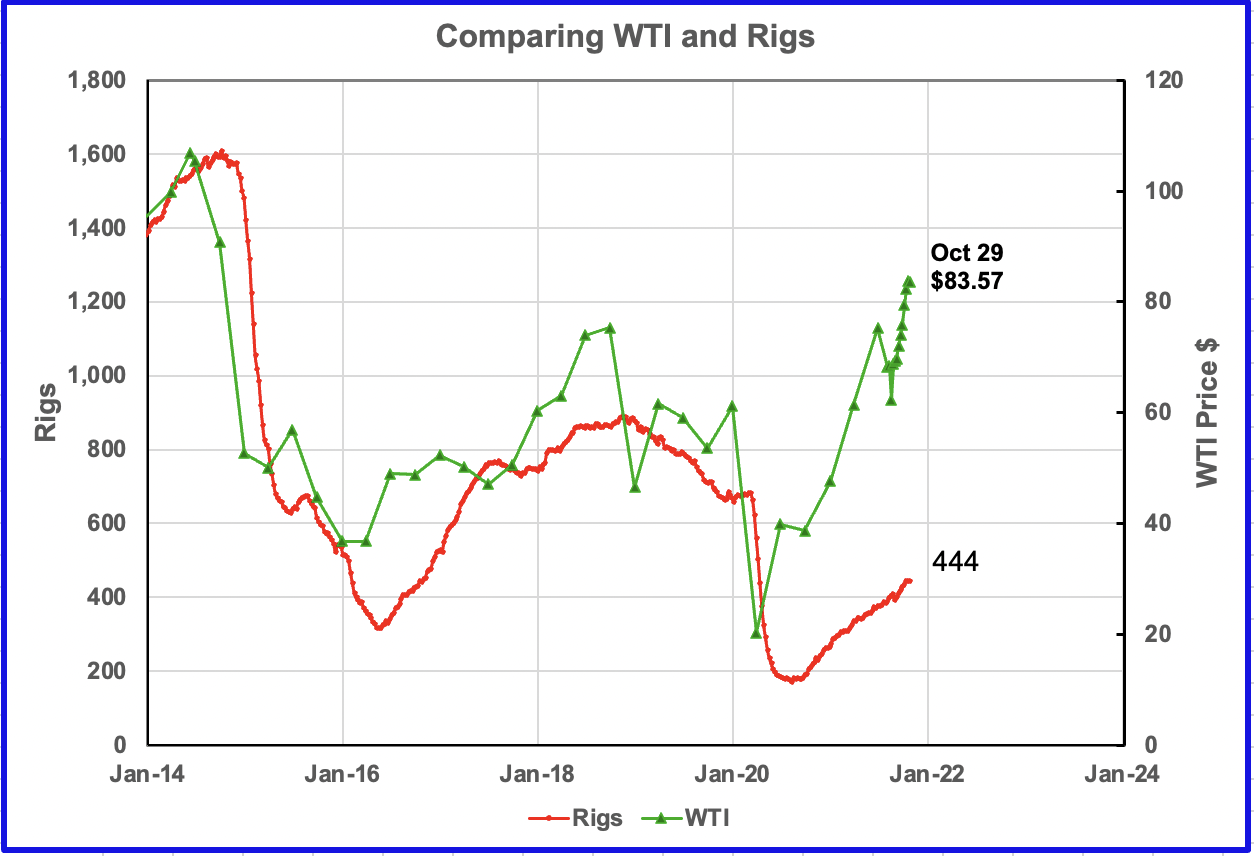
This chart compares/tracks the number of oil rigs with the price of WTI. The rising price of WTI appears to lead the rise in rigs by about 6 months. The front month WTI settled price for the December contracton October 29 was $83.57.
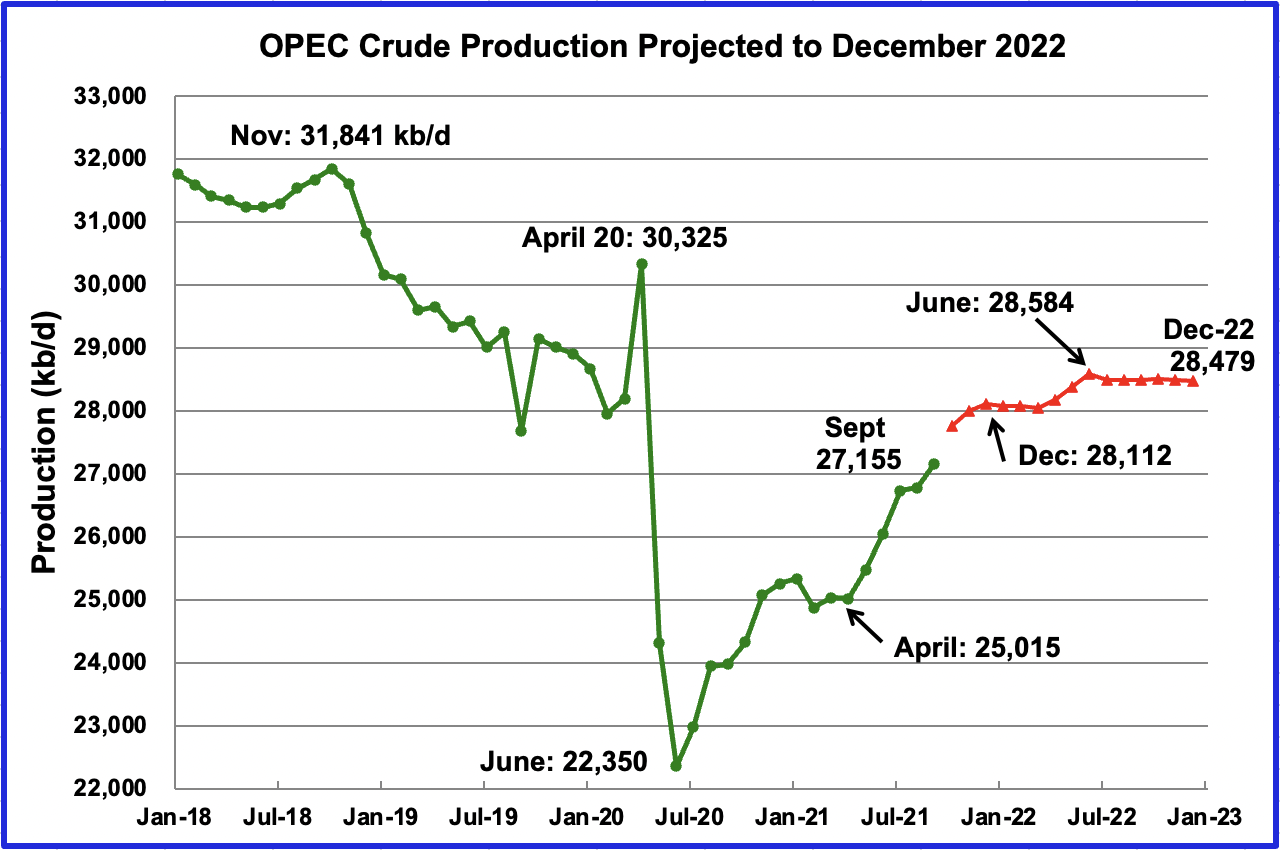
This chart shows the STEO’s October forecast for OPEC crude output to December 2022. OPEC’s output is projected to increase from April 2021 to December 2021 by close to 3,100 kb/d.
For September 2021, the EIA forecast OPEC production to be 27,155 kb/d. Actual production as reported by OPEC was 27,328 kb/d, a reasonably close estimate. October is projected to add 600 kb/d.
In July, OPEC + announced they will add 400 kb/d/mth from August to December for a total of 2,000 kb/d. Of the 2,000 kb/d, OPEC will add 1,382 kb/d according to the EIA.
OPEC’s production for the second half of 2022 is projected to be flat and close to 200 kb/d lower than OPEC’s output on January 2020, just prior to the onset of the pandemic.
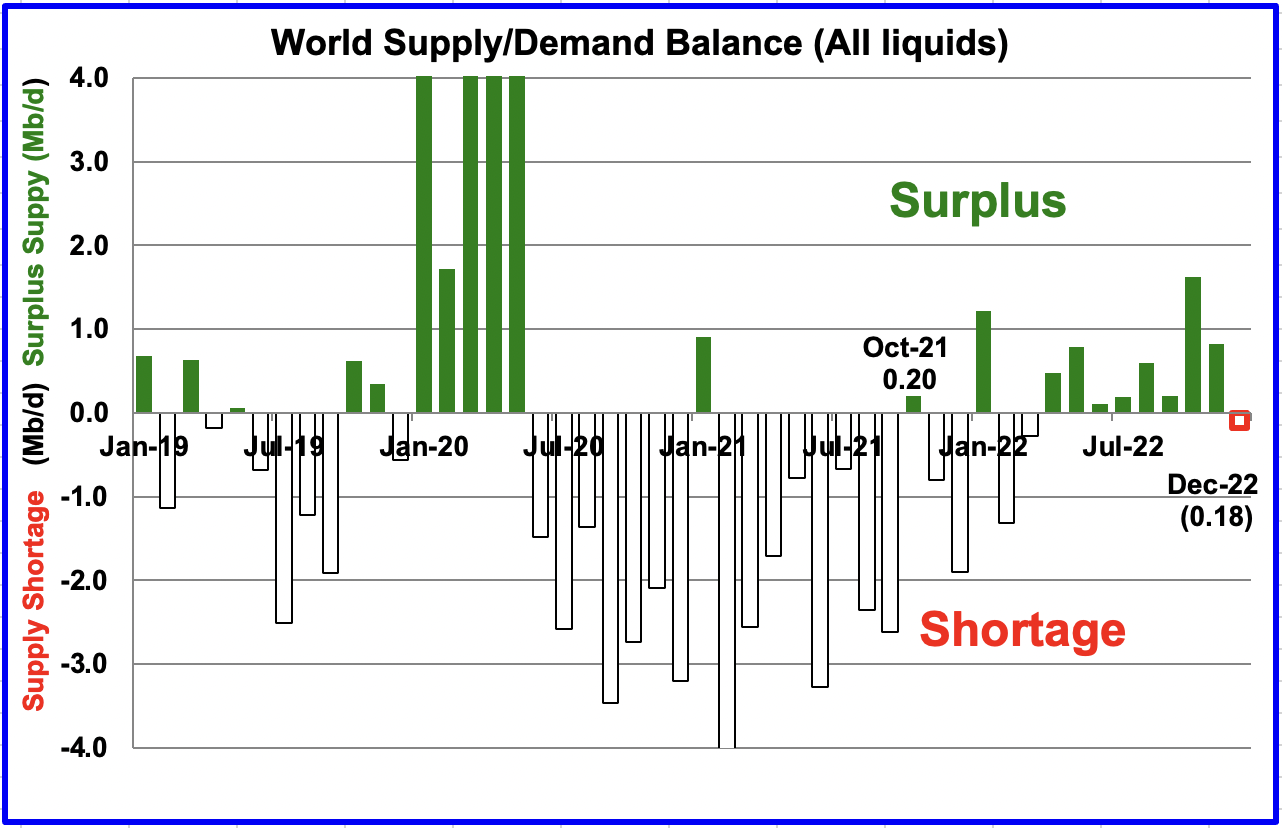
This chart show the historical supply/demand situation up to September 2021 and after that, the EIA’s forecast out to December 2022. September is showing a shortage of 2.6 Mb/d before moving to small surplus of 0.2 Mb/d in October.
From April 2022 to November 2022, the STEO is forecasting an average surplus of close to 600 kb/d. This is one reason why OPEC + is reluctant to add more barrels too early to the market to avoid another major surplus next year.
2) Drilling Productivity Report
The Drilling Productivity Report (DPR) uses recent data on the total number of drilling rigs in operation along with estimates of drilling productivity and estimated changes in production from existing oil wells to provide estimated changes in oil production for the principal tight oil regions. The October DPR forecasts production to November and following charts are updated to November 2021.
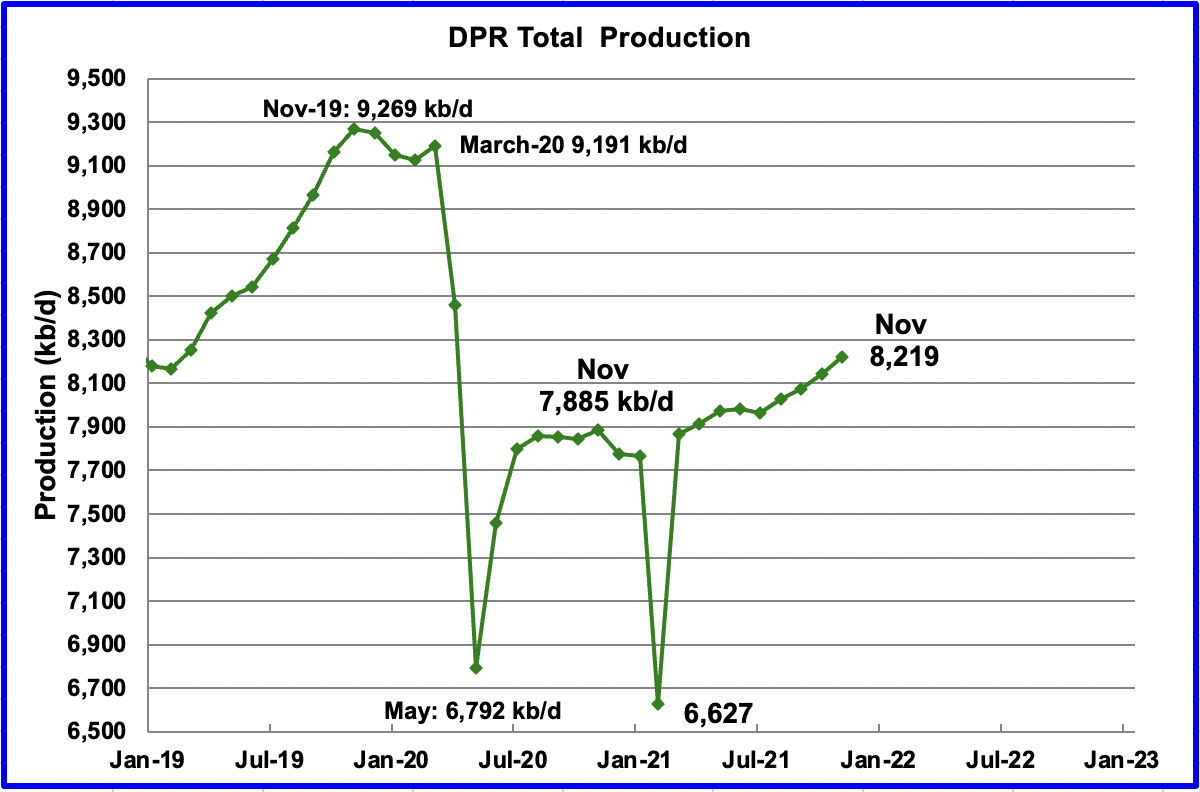
Above is the total oil production from the 7 DPR basins that the EIA tracks, projected to November 2021. Note that the DPR production includes both LTO oil and oil from conventional fields
The DPR is projecting that output for November 2021 will increase by 76 kb/d over October to 8,219 kb/d. From July to November, output in the DPR is forecast to increase by 255 kb/d or close to 64 kb/d/mth and appears to be accelerating since November added 76 kb/d. The two basins primarily contributing to the forecast increase are the Permian and the Niobrara. See charts below.
If the November rate of adding 76 kb/d/mth were to continue, this translates into adding 912 kb/d/yr to US production, which could potentially begin to disrupt world oil supply and cap the increase in the price of oil to below $100/bbl.
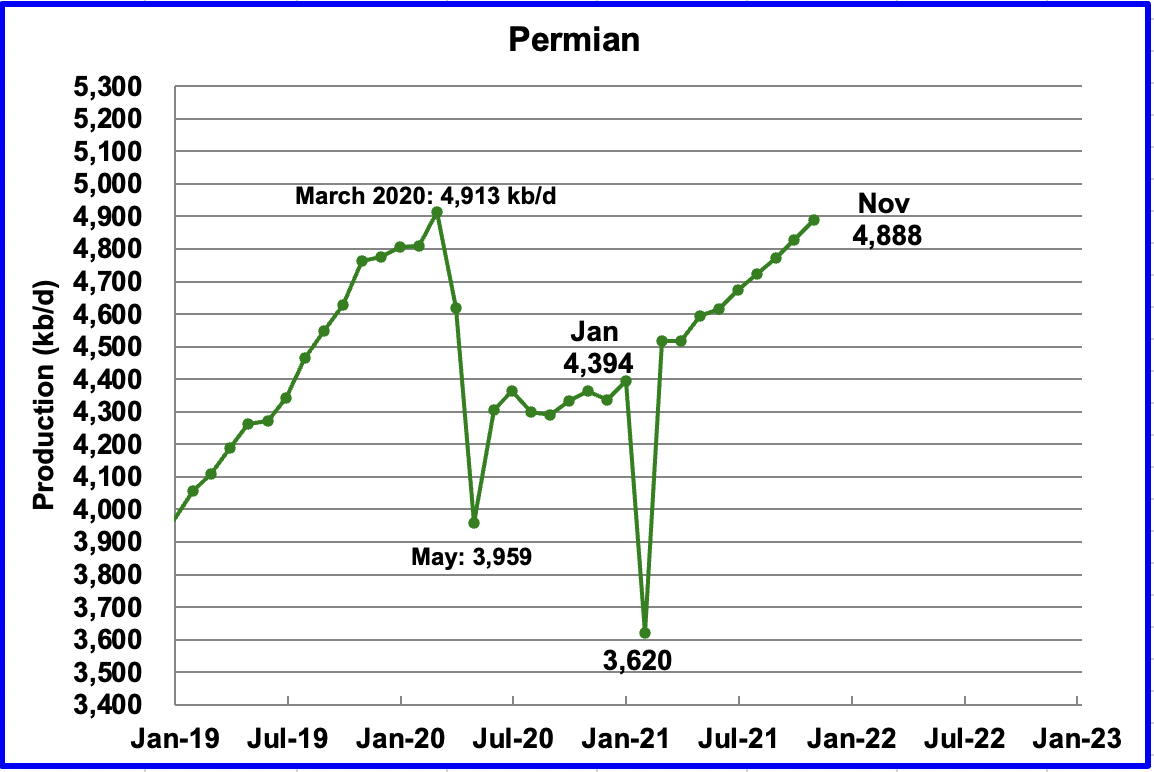
Permian output in November 2021 is projected to be 4,888 kb/d, up by 62 kb/d from October. From June to November production is forecast to increase by 272 kb/d or approximately 54.4 kb/d/mth. At this rate, Permian production will exceed the March 2020 peak of 4,913 kb/d in December.
During September, 284 wells were drilled and 409 were completed in the Permian. The completed wells added 294 kb/d to the forecast September output. The decline was 244 kb/d which resulted in a net increase of 50 kb/d. It is the completion of the DUCs, over and above those drilled, that accounts for the increase in the production in the Permian.
Since well completion data is only available up to September, production comments in the previous paragraph were limited to September.
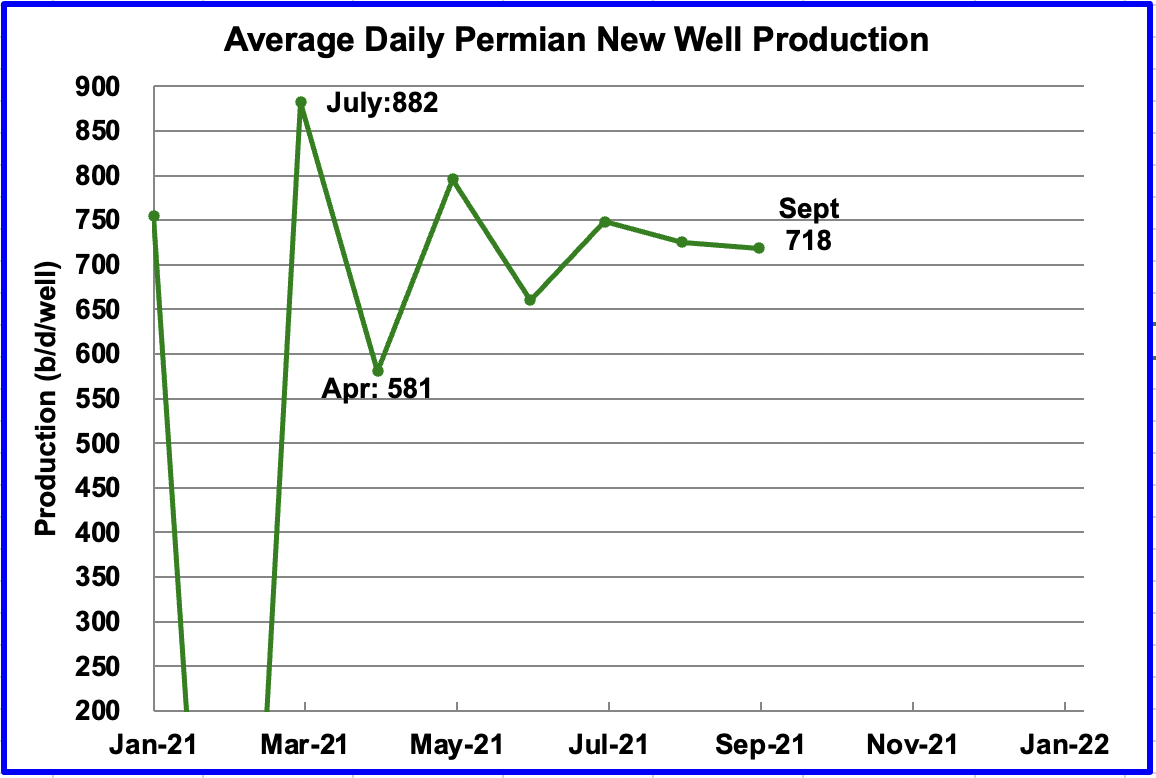
This chart shows the daily production from the average new Permian well tracked on a monthly basis. The daily output from new Permian wells was divided by the number of completed wells, as reported in the DPR and DUC reports.
For instance, during September, the new wells produced 293,820 b/d from 409 wells for an average of 718 b/d.
Interestingly, Shaleprofile shows a peak production rate in the second month of 891 b/d for Permian wells for wells completed in 2021. This is the highest rate recorded by Shaleprofile for Permian wells. It will interesting to track this parameter to see how Permian wells perform going forward as more DUCs are completed.
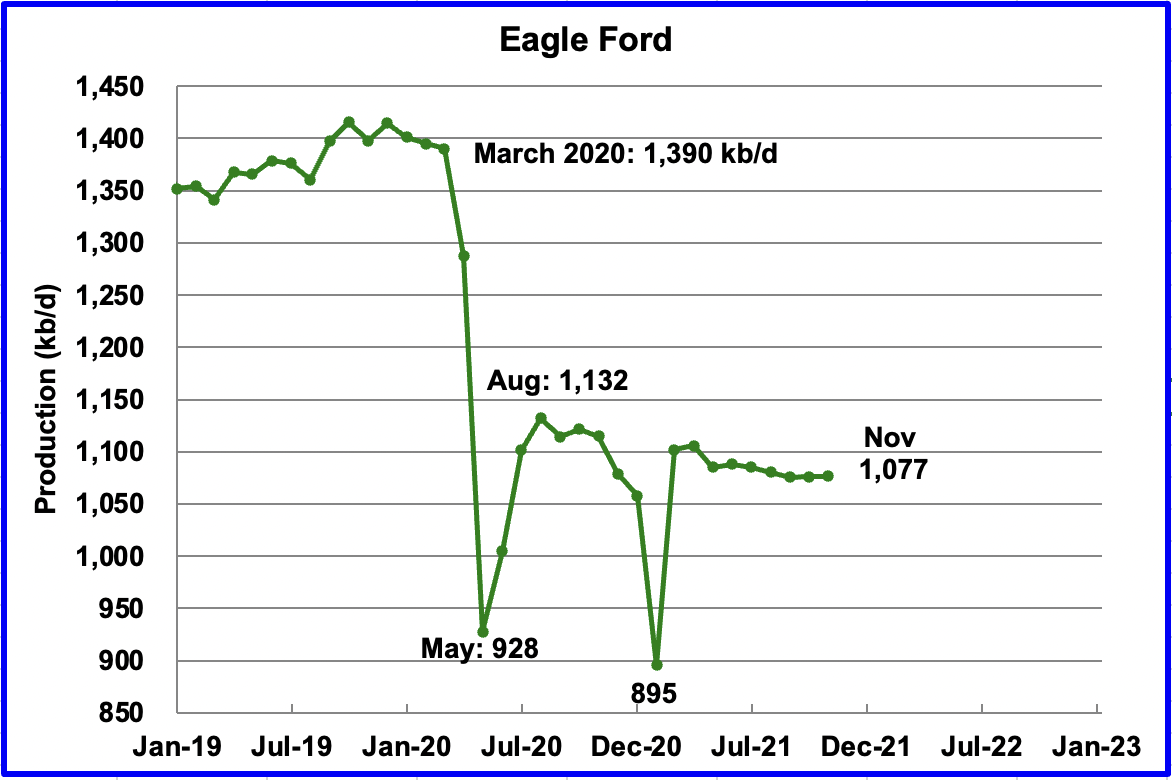
The DPR forecast for the Eagle Ford basin has shown a dropping but slowing output trend for six consecutive months. However output is expected to increase by 1 kb/d in November.
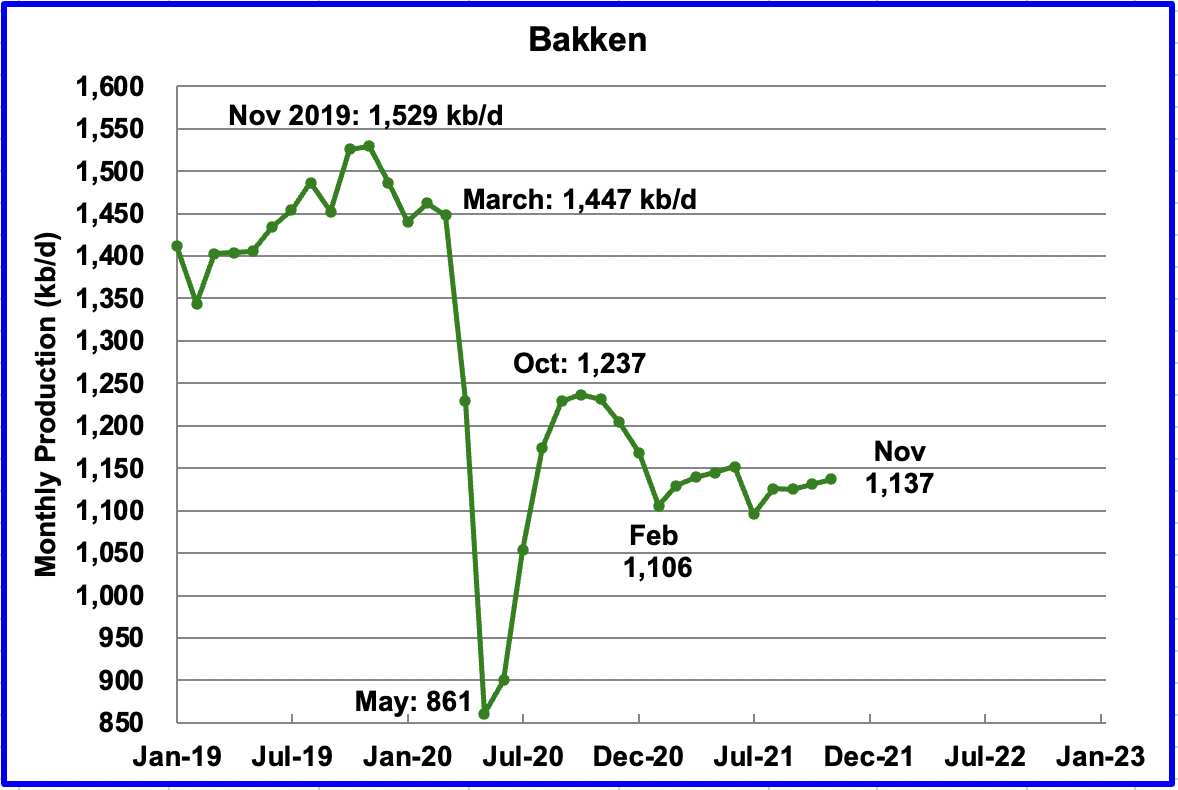
The DPR forecasts Bakken output in November to be 1,137 kb/d an increase of 6 kb/d from October.
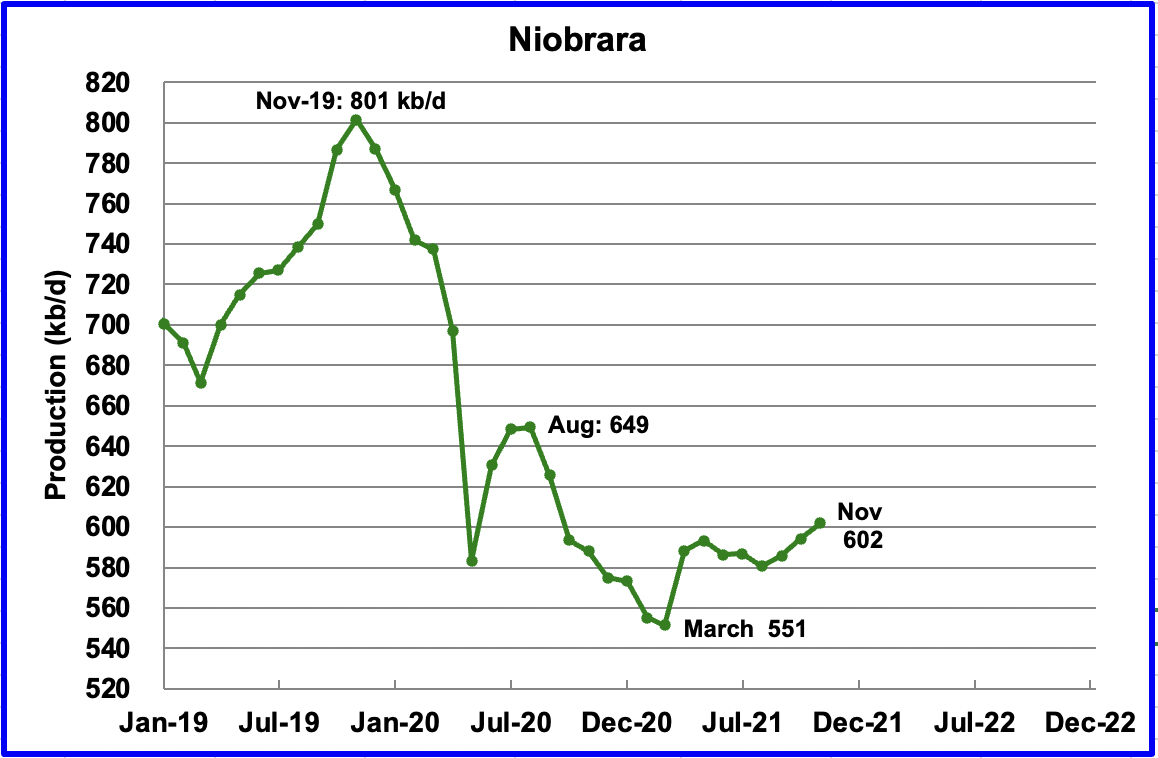
Output in the Niobrara reached a new low in March 2021 of 551 kb/d. Since then, output has been rising. November is expected to add 8 kb/d to 602 kb/d
The Niobrara is spread over Wyoming and Colorado. In June, 7 oil rigs were operating in the Niobrara. From August through October, the rig count had increased to 12.
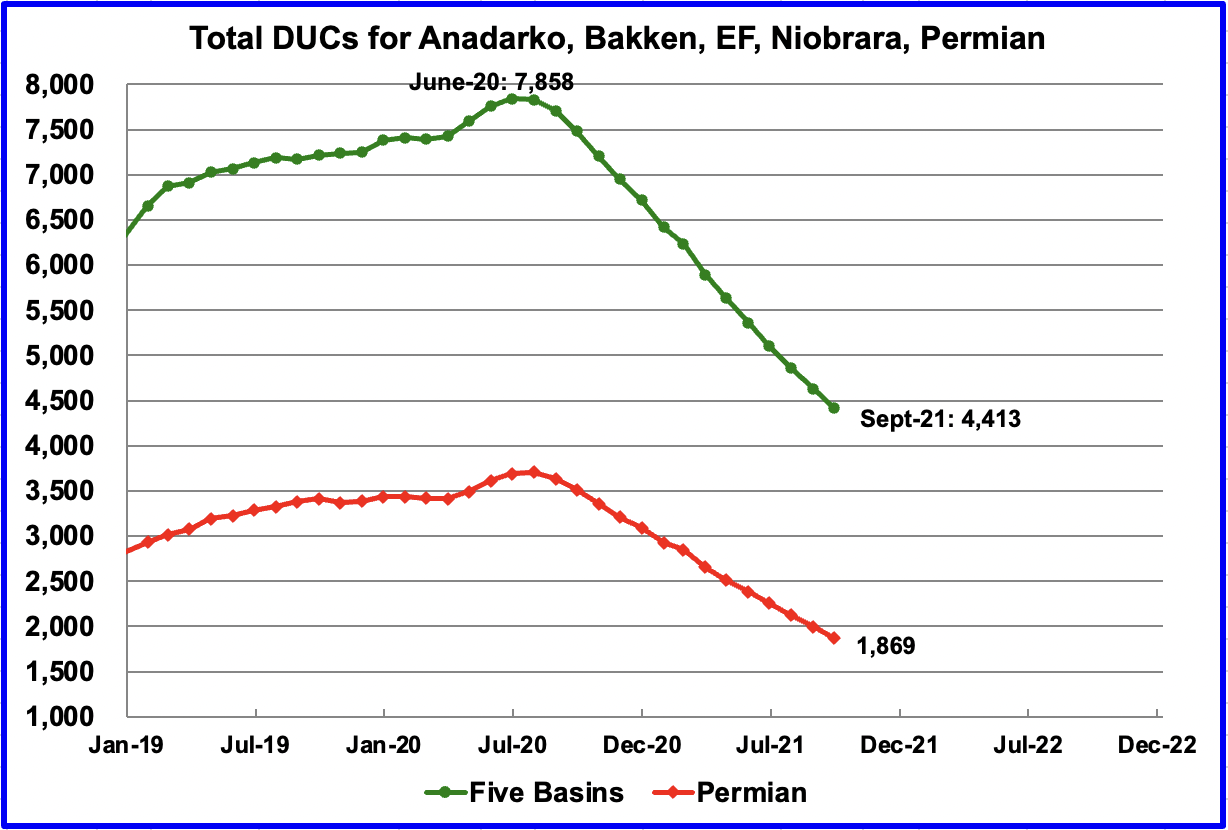
In these five primarily oil basins, DUCs have been completed at an average rate of close to 238 DUCs/mth over the last four months. In total, 219 were completed in September, according to the EIA. In the Permian, the average completion rate over the last four months has been close to 128 DUCs per month. In September, 125 DUCs were completed in the Permian.
The monthly completion of DUCs accounts for the increase in production in the Permian and the other oil basins.
3) LIGHT TIGHT OIL (LTO) REPORT
The LTO database provides information on LTO production from seven tight oil basins and a few smaller ones. The October report projects the tight oil production to September 2021.
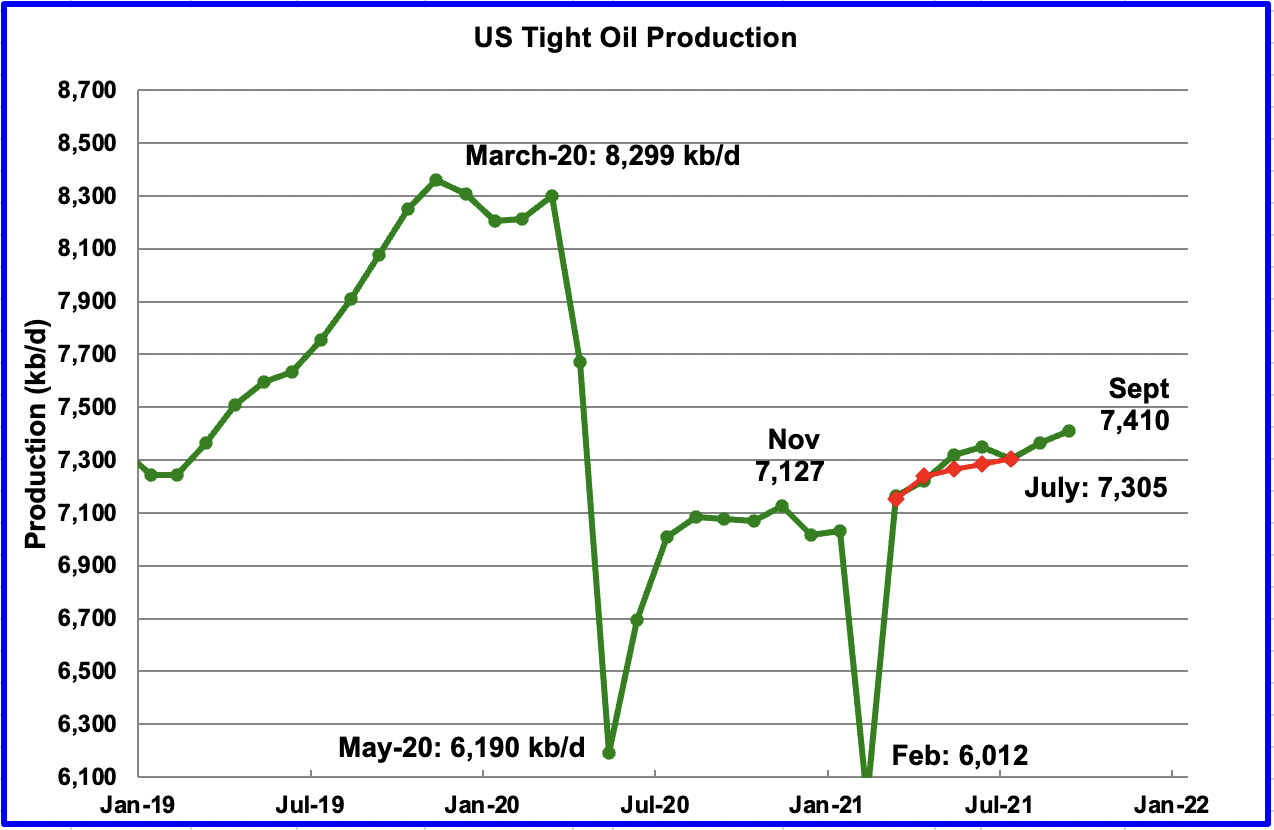
The October LTO report has revised down the output estimates in the September report by roughly 50 kb/d to 100 kb/d. September’s LTO output is expected to increase by 44 kb/d to 7,410 kb/d. However in the October report, August output was revised down from 7,460 kb/d to 7,366 kb/d, a downward revision of 94 kb/d.
The red markers represent LTO output as reported in the August report and indicates there has been less growth in production since August or that the LTO estimates have been too optimistic in the last few months.
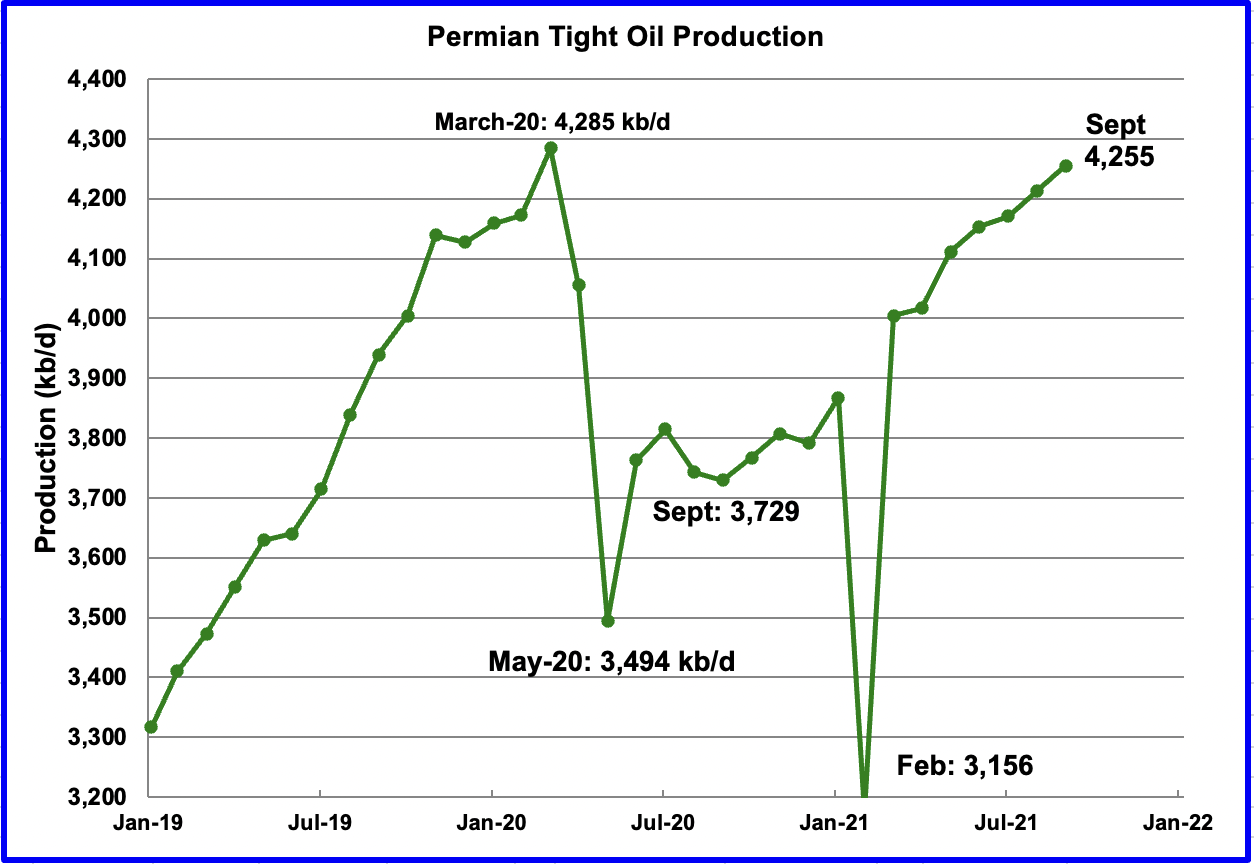
Permian LTO output in September is projected to increase to 4,255 kb/d, an increase of 42 kb/d. However the current September output is lower than the August output of 4,279 reported in the September report. Comparing August with August, the current August forecast is 4,213 kb/d vs the previous forecast of 4,279 kb/d, a decrease of 66 kb/d.
Production in the Permian continues to rise at an average rate of 48 kb/d/mth since April. At this rate, it should exceed the March 20 high of 4,284 kb/d in October.
It should be noted that Permian DUCs are being completed at an average rate of close to 128 DUCs per month and are a major contributor to the rising production.
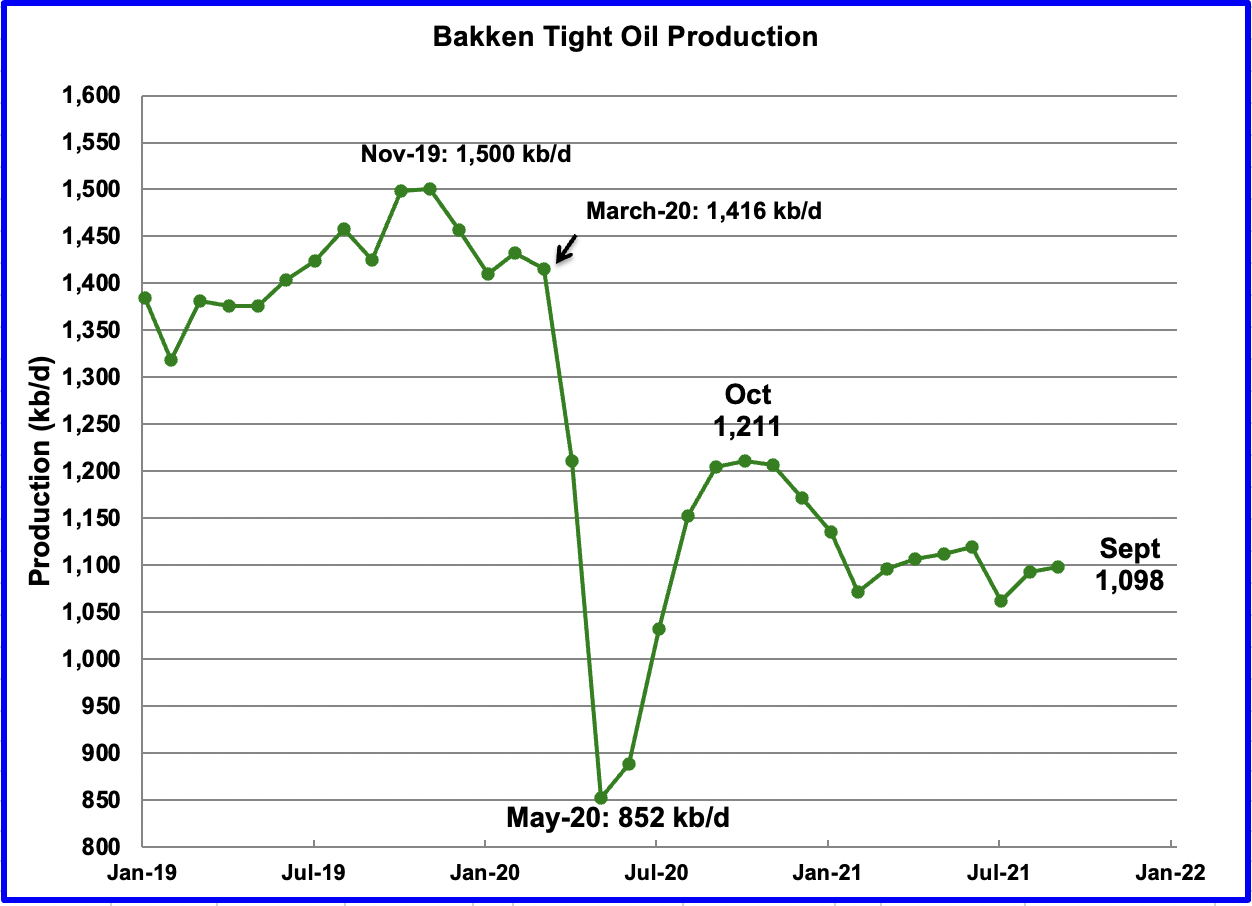
The Bakken’s September output increased by 5 kb/d to 1,098 kb/d. However note that this rate is 15 kb/d lower than the August rate of 1,113 kb/d reported in the previous report.
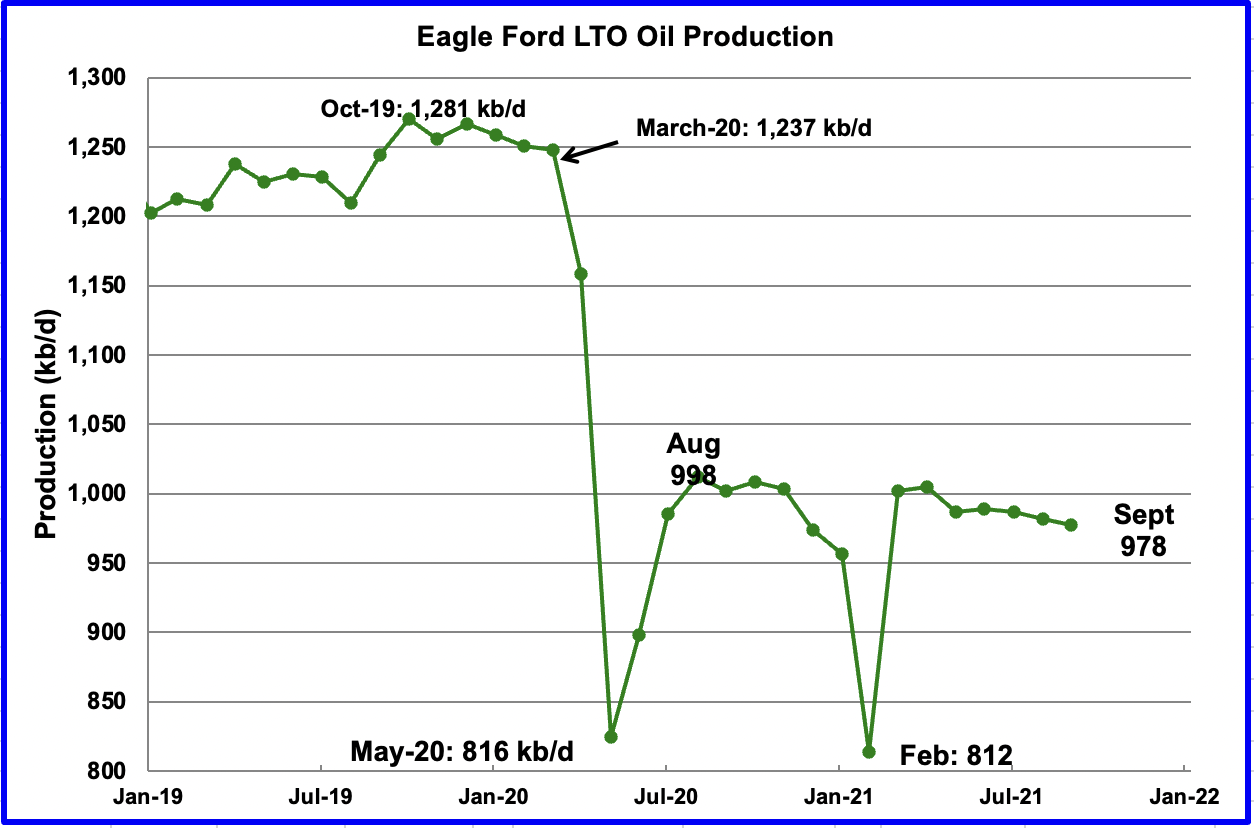
The Eagle Ford basin is expected to produce 978 kb/d in September, a decrease of 4 kb/d from August. However, for the Eagle Ford, the LTO report increased the August output from the last report by 20 kb/d to 982 kb/d.

Output in the Niobrara has been almost unchanged since April at slightly over 400 kb/d. April, May and June were each revised down by close to 10 kb/d in the October report.
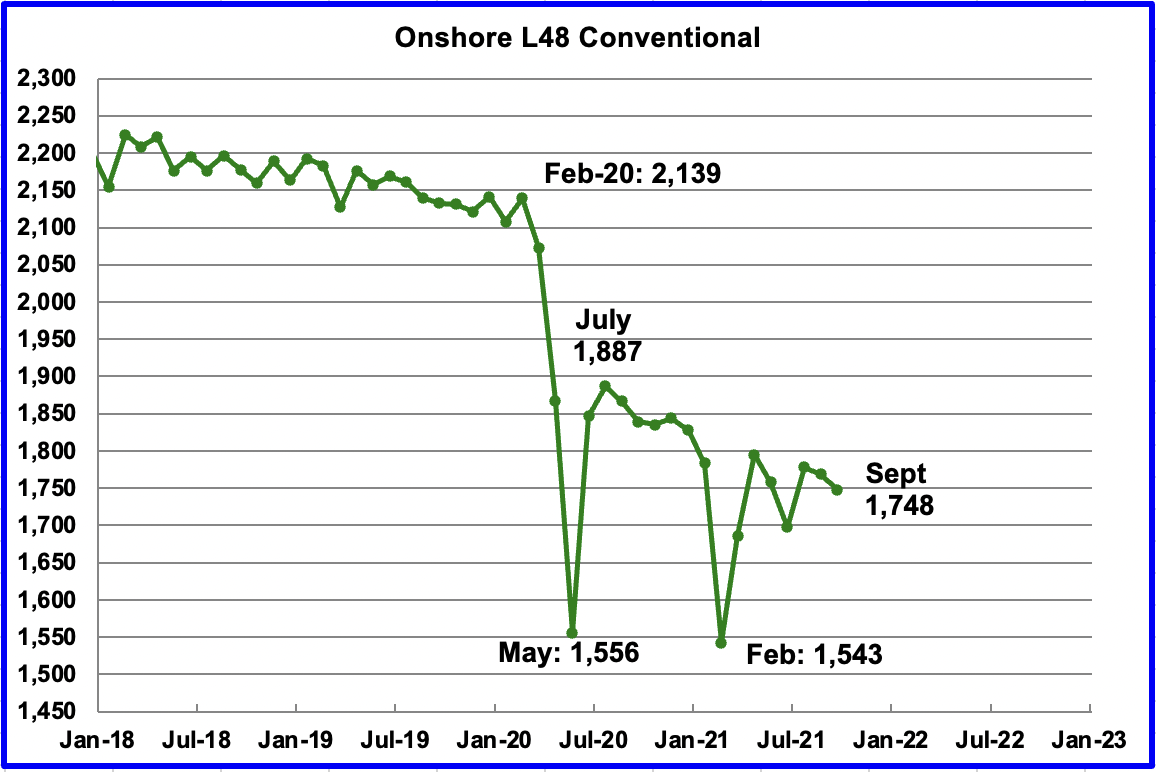
Conventional oil output in the On-shore L48 is expected to decrease in September by 21 kb/d to 1,748 kb/d. This estimate is based on a combination of the September LTO output and the October STEO report that has a forecast for the US on-shore L48 output for September 2021.
In the October LTO report, LTO output was revised down by close 50 to 100 kb/d. This downward revised output results in an increase in conventional oil output in the Onshore L48. The August conventional output of 1,691 kb/d in the September report has been revised up by 78 kb/d to 1,769 kb/d in the October LTO report.
Since July 2020, output in the Onshore L48 has been dropping at an average rate of close to 10 kb/d/mth, even though there were significant and unexpected drops in February and June.
4) Rigs and Fracs

Since the beginning of April, the US has been adding oil rigs at a rate of close to 3.66 rigs/wk. Of these, the Permian has been adding 1.43 rigs/wk. This means that more rigs are being added in other basins and states. Note that over 90% of the Permian rigs are horizontal ones.
Since the end of July, it appears that the addition of rigs in the Permian has accelerated over the average rate. Could this be related to the increasing price of WTI?
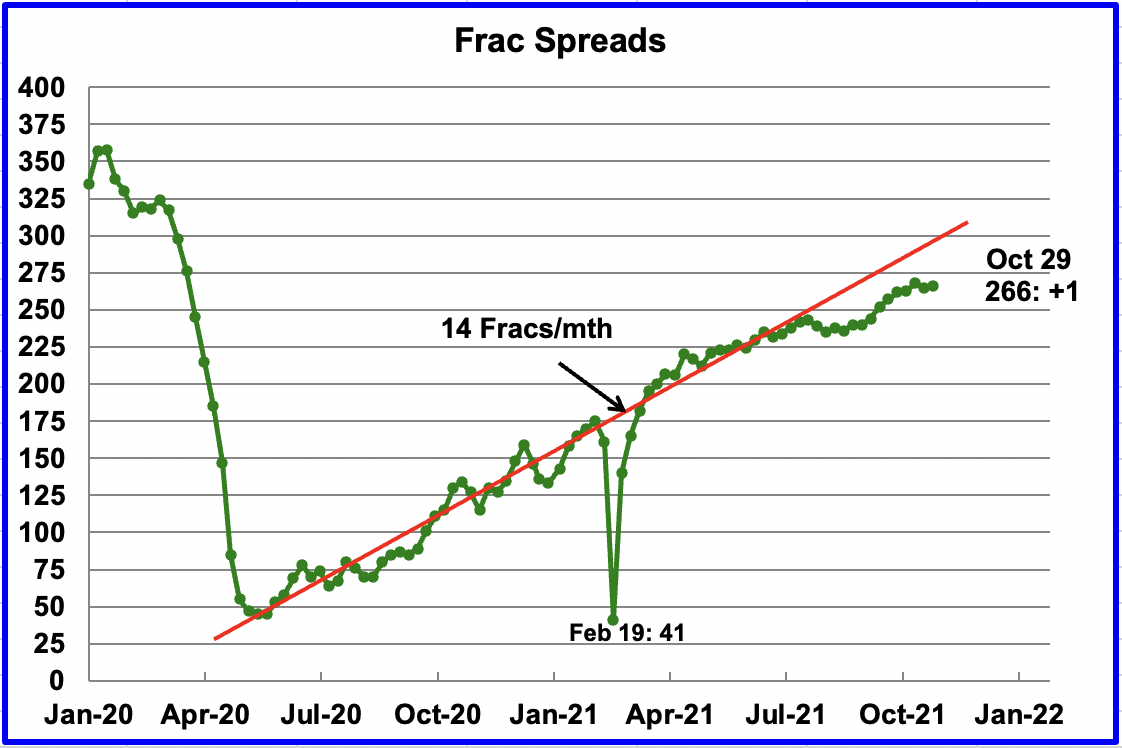
Starting from the week of July 23, 2021, frac spreads were not being added at the previous rate of approximately 14 spreads per month. Was the slowing due to Covid, not sure? However, starting in mid September, there are indication that frac spreads are being added at close to the previous rate of 14/mth.
Note that these 262 frac spreads include both gas and oil spreads, whereas the rigs information is strictly oil rigs.
250 responses to “August US Oil Production Drops due to Hurricane Ida”
Hi gang. I have posted a new page called:
From Whence the Fine-Tuned Universe
You can get there simply by clicking on the link up-top, just to the right of the “Peak Oil Barrel” logo, or you can just click this link:
https://peakoilbarrel.com/thefine-tuneduniverse-com/
Comments are welcome but only on the page comment section. Please do not reply here, on this post. Comment there only.
Also, please read the entire post before commenting. It is a 15 to 20-minute read. I have put many hours of research into that short essay. I have read perhaps 10 books on the subject and watched perhaps 200 YouTube videos on that subject and related subjects.
So please, no knee-jerk replies after reading the first two paragraphs or so. If you comment without reading, that means your mind is already dogmatically convinced of your opinion. And that is one of the subjects of the essay. That is, you may already have a dogmatic worldview that blocks any other opinions or theories, not allowing them to even be considered.
Thanks in advance for your comments. Ron
Dennis
Thanks. Yes Typo. It is correct in the table.
In a comment in an earlier post, Ovi suggested that perhaps we should look at directional and horizontal rigs for tight oil. I have done that for the Permian and for all of the US onshore oil rigs that are horizontal and directional.
Note that the axis is in days so the slope of the trend lines in the equations on the chart are rigs per day, multiply that slope by 365 to get annual rate of increase or by 30.4 to get monthly rate of increase.
Annual rate is 184 for all of US onshore horizontal and directional rigs and 70 for Permian basin for the period from April 23, 2021 to Oct 29, 2021. Monthly rates are 15.3 and 5.9. Weekly rates are 3.53 and 1.35.
Dennis
Maybe you or someone else could explain where a driller uses horizontal rigs and directional rigs. For instance I read that vertical rigs are used to start the well.
Can a horizontal rig also drill the lateral bores of a well?
Ovi,
It is not clear to me what the difference is between a horizontal and a directional drilling rig. Note that for the Permian basin for Week ending October 29, 2021, there were 3 directional rigs (range of 0 to 4 from April to Oct) and 247 horizontal rigs and 16 vertical rigs running (with a range of 10 to 16 from April to Oct). Also note that the Permian split from New Mexico to Texas in horizontal plus directional rigs is shown in chart below from April to October 2021. For WE 10/29 it was 170 TX and 80 NM.
Ovi,
Any rig drilling at any angle besides 90 degrees (vertical) is considered a horizontal rig, so I believe the answer is yes, the laterals are drilled by a horizontal rig, the horizontal rigs are capable of drilling the vertical section of the well, but perhaps it is not always cost effective to do so.
Ovi,
You use a spudder rig or vertical rig to drill down to a point to set your intermediate casing. Once the casing is cemented, then a horizontal rig is brought in to finish the hole. The reason the is done is because the spudder rigs are way cheaper to operate and use than bringing in a bigger horizontal rig from the beginning. In other words, it is a waste of money to use that rig for the mundane vertical. It does save time and money.
It is interesting to note that if there weren’t DUCs completed in addition to the new drilled wells, then production would either be flat or slightly falling in the Permian.
My company though continues to run two rigs and production is flat as a Mesa.
LTO Survivor
Is your production flat because these are new wells you keep drilling and you don’t have access to some pre-drilled DUCs?
https://www.dailymail.co.uk/news/article-10147369/Russian-westbound-gas-supply-Yamal-Europe-pipeline-comes-halt.html
“President Joe Biden has warned Vladimir Putin not to weaponise natural resources for political purposes after Russian gas pipeline starting flowing backwards out of Germany.”
Slim Jim , what a whopper . Don’t make it a one time post . Continue with all your views and comments . Welcome abroad .
Here are my views:
1) I had no clue gas pipelines could flow backwards.
2) If you are dependent on Putin for natural resources its time to move to another country.
I just read the quality content here. No one should care about my opinion.
SLIM JIM,
So if Europe is dependent on Putin and Russia for Natural Gas, where do you suggest that they turn to for energy supplies?
European Natgas production has fallen from 25.7 Bcf/d in 2014 to 21.1 Bcf/d in 2020. But, at the same time, European Natgas consumption has increased from 48.4 Bcf/d to 52.2 Bcf/d. Thus, Europe is in a sticky predicament because it has designed a GREEN ENERGY Policy that needs more Natgas.
With the world’s WHITE ELEPHANT called the Global LNG Industry basically turning GOLD into LEAD by constructing LNG Production & Export Facilities at $7-$30 billion a POP, plus $250 million for a new LNG Carrier (twice the cost of the largest VLCC Oil Carrier), and another $1-2 billion for an LNG Import Facility… LNG is a major Natgas EROI destroyer.
And, on top of that the Islamic attack on Total’s large $20 billion LNG Facility in Mozambique earlier this year, which is now if FORCE MAJURE… this has put a lot of U.S. and Canadian LNG projects on HOLD or have canceled.
So, when Europe decides to DITCH that nasty Putin to get Natgas from somewhere else, we wish them all the luck because we wonder where they are going to get cheap and readily available supply with current Natgas stocks still at 79% of where they should be… as they head into the winter.
steve
Australia? Putin’s got ’em by the uncircumsized balls!
Again….I personally would be “chucking a sneaky” and move to Canada.
SLIM JIM,
That is wise and excellent advice to move to Canada. Now, if you can send out an email to the 447 million citizens in the European Union… that would be nice.
steve
Slim, why not move to Russia ? Added benefit , the male to female ratio is skewed and all those beautiful Russian women in surplus . Better than Canada . 🙂
I don’t want hidden camera’s everywhere I take poo poo.
Canada is best Peak Oil spot IMO.
You get the 900 billion dollar US military…for FREE!!!!!
Steve , agree with you . LNG is a white elephant just like shale as a matter of fact even worse . The loss of 35 % energy in transforming gas to liquid and then liquid to gas at destination is crazy . EROEI is in my opinion negative . The problem is what to do ?? Answer : This trade will continue till it can’t . In an earlier post I had mentioned the LNG problems in India where 100 % import is from Qatar . Sky high prices for urea . The farmers are weeping tears of blood but the alternative is not to sow . The nation sleeps on an empty stomach . The “Energy Cliff ” is a bitch .
SLIM JIM , here we value everybody’s opinion . As a side note by your name I thought you were from Holland but it seems that you are based in UK . Why ? “Slim ” in Dutch means ” intelligent ” . As to Australia or Canada , the answer is Canada , The only nation with excess land , water , forest and energy and not in population overshoot . HHH has posted about the financial bubble their but still the best looking horse in the glue factory . 🙂 Australia was good but not anymore they shutdown their refineries so dependent on energy . Sorry , coal is not a transportation fuel . Most worrying, it is in the frontline of CC . Water starvation and adverse effect on agriculture as the Murray- Darling basin dries up . The continent is going to have less precipitation and more wild fires due to dry conditions . Take care and be well .
All I know is if China doesn’t continue finding enough coal to keep the lights on then demand from China falls off a cliff and dominos start falling all over the map.
China also has a diesel shortage currently that isn’t getting talked about much.
How high can oil price go if China continues spiraling down? There is potential for a whole lot of demand destruction that those who are calling for $100 oil aren’t considering.
Interesting times we live in.
If worse case scenario plays out oil could be back at $20 within 24 months. The oil bulls better hope coal finds its way to China power plants or they are screwed.
The problem is China isn’t a physical lack of coal. The problem is that coal prices are so high that power plants can’t produce electricity and sell it at a profit at the regulated electricity price.
A solution would be to raise the price of electricity to consumers, but the government prefers to keep it artificially low.
They are importing coal at a loss because cost aren’t being recouped by end users. They have to burn through US dollars in order to subsidize coal.
I disagree that home grown supply isn’t a problem. They can control price of domestic supply because domestic supply is priced in Yuan not dollars.
Domestic supply should be easy fix for them. But that’s not the case.
If there was no problem with domestic supply there wouldn’t be any news about power blackouts
Slim Jim
If you cut the upstream compressors and a few further downstream, the the gas would flow backwards as more downstream compressors are cut since their residual pressure is higher than in the upstream segment.
It is not happening because the compressors were reversed.
LTO Survivor,
For large companies doing a multi-well completion (say 4 wells at once from a large singe pad area), would a vertical rig be brought in initially to drill the vertical sections of the 4 wells, then pull out the vertical rig after the vertical casing is set and bring in a horizontal rig to complete the well? I would think logistically it would be simpler to use the horizontal rig for the entire drilling operation (with different tools used at different stages of the operation) and it would save time.
Yes. absolutely the spudder rigs will drill the intermediate hole on all four wells. Then they will bring in the bigger rigs.
LTO survivor,
Ok thanks. How are the 16 vertical oil rigs operating able to keep up with the 247 horizontal oil rigs? Are they 15 times faster? I would think just the moving and setting up of the rigs would not allow this to be possible. By the shale profile estimate about 1.3 wells are drilled per rig per month so with 247 rigs we would have about 327 wells drilled per month, if we assume all 327 wells also were serviced by the 16 vertical rigs operating that would be over 20 wells drilled per month for each vertical rig (and we would also need to assume no vertical oil wells were drilled). So that would be 1.5 wells per day on average. Seems when we add in moving the rig and setting it up and than taking it down to move to the next site this wold not be possible. How long does it typically take to take a rig down, move it down the road and then get it set up for a new job?
Curious if anyone can help with my question or whether my assumptions are accurate. I’m under the impression some portion of LTO production is over leveraged or debt driven that will be defaulted on. If so is there a percentage of present US production that one can characterize as a losing investment?
LEEG,
At current oil prices, most oil companies are doing ok, a few may still go bankrupt due to poor hedging decisions and too many completions when oil prices were low. There are many that think all tight oil is a losing bet, I do not agree with that assessment, but I am not an oil man so could well be wrong.
LEEG , all are bankrupt . Financial engineering , lies and misdirection along with the FED policy of QE and ZIRP have kept the LTO game alive . The music is playing but the party is over . This is not financial advice .
Permian supply projection has completion rate at 316 wells per month from Dec 2021 to Dec 2029 and output reaches 5594 kb/d by Dec 2029. I have a conservative scenario with completion rate at 390 wells per month from Jun 2022 to Dec 2029 (this is consistent with about 300 oil rigs drilling horizontal tight oil wells in the Permian). My scenario has Permian putput at 5201 kb/d in Dec 2029.
The shale profile supply projection is superimposed on my chart (solid colors are from shaleprofile), my model is the dotted blue line.
As I often suggest my model is quite conservative, a model with 350 completions per month barely reaches 5000 kb/d by the end of 2029, I have not tried a model with a completion rate lower than 350 new wells per month (this is the current completion rate assumed by my model for Oct 2020 to Oct 2021, past 13 months).
Dennis
Shale profile is showing 2,141 producing oil wells as of July 2021. An average of 306 wells/mth. In 2020 they completed 3,578 wells or an average of 297/mth. Why should well completions jump to 390 wells/mth starting in 2022.
Interestingly close to 90 rigs have been added to the Permian since January, but the rate of well completions remains roughly the same at 300 wells/mth. Puzzling?
Ovi,
Note that for my model shown in chart in previous commnet, I assume 350 new wells per month are completed from Oct 2020 to Oct 2021. Note that the shale profile numbers are based on RRC data which takes some time to be fully updated. Take a look at the following from one year ago at shale profile.
https://public.tableau.com/shared/MQX5WMN8F?:toolbar=n&:display_count=n&:origin=viz_share_link&:embed=y
Link above has better image.
March 2020-311 wells completed, April 2020-209 wells, May 2020-154 wells, June 2020-143 wells, and July 2020-161 wells
Ovi,
In the link below we have well completions (shale profile calls these “first flow” wells) for Permian from the July 2021 update (published in Oct 2021).
https://public.tableau.com/shared/W67RG4FHG?:toolbar=n&:display_count=n&:origin=viz_share_link&:embed=y
a poor quality image is posted below,
In the more recent estimate we have the following for wells completed in Permian:
In March 2020-424 wells, April 2020-287 wells, May 2020-190 wells, June 2020-182 wells, and July 2020-213 wells. The difference from the one year earlier estimate was
March +113, April +78, May +36, June +19, July +21
Of course we do not know what the future revisions will be for Jan 2021 to July 2021. Also note the difference in completions between the DUC spreadsheet and shale profile for Permian basin, for the EIA data they have 375 completions per month for Permian basin, with recent rates at about 405 completions per month (August and Septempber average).
Rigs have been increasing as have frac spreads, I imagine the completion rate will also increase.
Using data from the DUC spreadsheet for past 12 months for Permian completions and using an OLS trendline I get a monthly increase in well completions of about 11.98 per month. My scenario has completion rate at 350, 355, 360, … , 380, 385, 390 from Oct 2021 to June 2022, less than half the rate of increase estimated by the EIA over the past 12 months. Given the high oil price level and rising oil rig count in the Permian, this scenario seems conservative to me and the model output result is far more conservative than the shale profile supply estimate (400 kb/d lower output at the end of 2029).
What is your expectation for future completion rates? I would be happy to model it.
Forgot chart sorry.
From shaleprofile.com at link below (see well status and lick on first flow at upper left)
https://shaleprofile.com/blog/permian/permian-update-through-july-2021/
DC,
…”Permian putput…”: More perceptive than you may have intended.
Dennis there is really only about 4 more years of inventory. We are at the red queen. Without additional DUCs being completed there would not be an increase in production. If we see a $100 oil price handle and $4.00 per mcf gas price then maybe you will see a quick spike but really there isn’t enough equipment, personnel or financial backing to cause a surge. There would need to be a vibrant Oilfoeld service industry but who will lend to the sector to grow capacity?
I don’t want to burst your bubble Dennis but it comes down to inventory and we are quickly running out. Look for more consolidation in the Shale sector and this is not a vote of confidence but a way for companies to hide the dire inventory status.
LTO survivor,
My model has output flat until the end of 2022 (actual Permian output has been up), over the long run output increases from 3781 kb/d in Dec 2020 to 5202 kb/d in Dec 2029. Over 9 years this is a 37.6% increase in output or an average annual increase in output of 3.6%. I would hardly call this a surge in output more like a gradual increase in output. With higher oil price levels the inventory of viable well locations might increase, we will see. Also at these prices growth can be financed out of operating cash flow. If producers remain disciplined it will keep oil prices high.
Dennis,
Every once in awhile mention the difference between a “projection” and a “prediction”. A projection is based on a specific scenario chosen and the assumptions built-in to the scenario, so a specific numerical projection essentially extrapolates from the parameters chosen. OTOH, a prediction is a projection with a high degree of confidence.
What is nice about this distinction is that you can show what scenario is required when your projection is challenged. So when LTO_Survivor questions the projection as stated, one can show what scenario is required to match his assertion. I think you are doing this implicitly, but its useful to state this approach as a disclaimer occasionally.
Unfortunately Paul I cannot make any predictions as thefe are too many future assumptions that need to be guessed correctly for any scenario to rise to the level of a prediction.
I would say that the recent scenario is very likely to be lower than future Permian output. Probably with 80% confidence. I have also presented high oil price and high TRR scenarios that likely have an 80% probability that Permian output will be less than that scenario, that is the best I can do.
Dennis , my response to Slim Jim vanished again just a minute ago . Please retrieve and rectify the problem .
HH, I restored your post but I have no idea how to fix the problem.
Tks for the prompt action . Greatly appreciated .
Hi Ovi , for August the excuse is Ida , what are the excuses for Sept and Oct . Just joking .Wanted to say a thankyou for the work done . Impeccable as usual .
HiH
The real story story is in the onshore L48 and what is happening in Texas, NM and ND. How long can they keep on producing at between 70 kb/d and 80 kb/d. Right now the key is the DUCs. If WTI stays in the $80 to 90 range, more rigs will be brought in to replace the DUCs and they may keep on producing at the same rate.
Not sure what the situation is with the latest DUCs. As noted in the post, ShaleProfile is showing record peak production for the second month for the 2021 wells. Is this new peak from DUC wells or the new wells they are completing?
Ovi,
Keep in mind that every tight oil well that is completed is a DUC before it gets completed. So perhaps you mean are these old DUCs or new DUCs? It is difficult to tease out the age of the DUCs.
Looking at DUC spreadsheet from DPR and focusing on Permian basin, I get the following analysis.
Assumptions:
1. DUCs from Jan 2017 of 1279 are “dead DUCs” and non-viable at present.
2. From peak Permian DUCs in July 2020 DUCs added from Feb 2017 and newer are completed from oldest to newest (this is no doubt wrong, but we don’t have the data to be more accurate).
Based on that set of assumptions the DUCs completed next would be wells drilled March 2019, at present based on the most recent DUC spreadsheet there are 683 more DUCs to complete that were drilled from March 2019 to Sept 2021, in September, based on the assumptions of my analysis 125 DUCs were completed in Sept 2021 that were drilled in Feb and March of 2019, we have another nearly 4 months of DUCs before drilling rate will need to increase to completion rate, if rate of completions of older DUCs from Sept 2021 continues. This seems unlikely as the horizontal rigs running are capable of drilling 321 wells per month, this implies about 79 older DUCs get completed each month if the rig count does not change. Using that estimate there would be enough older DUCs to last 8.5 months (683 DUCs/79 DUCs per month). Of course if oil prices remain high or continue higher, it is likely the rig count will increase to 308 which is enough to drill 400 wells per month and keep DUC count stable if completion rate is 400 per month. That is consistent with my 38 Gb scenario if the drilling inventory increases over time as I suspect will occur with higher oil prices (WTI at $90/bo by June 2023 in 2020$).
>> The European Investment Bank (EIB), the lending arm of the EU, has vowed to close a loophole that allows it to lend money to oil and gas firms despite a ban on financing fossil fuel projects.
The EIB, the world’s largest multilateral bank, which is active in 160 countries, announced in 2019 it was phasing out lending to fossil fuel projects within two years, as it sought to become a “climate bank”. >>
Way too much talk about Capex at RDS, XOM, CVX, whoever. Groped around and I’m pretty sure financing sources like this flow at the NOCs. They don’t fund spending in a purely internal way.
A great 21 minute video: Saudi Arabia’s Oil Problem
Early in the video, it hints that peak oil may have indeed been in 2019. But it dwelled no more on that point and went on to discuss Saudi’s oil problem.
Putin ordered to gazprom to increase gas delivery to Europe after having ended the filling of Russian reserves. This had the effect to decrease significantly the price of gas on European market. Perhaps, it would have the effect to decrease also the price of oil barrel as some oil was burned in place of gas because burning oil products to produce electricity was cheaper than burning gas in some places. https://www.lci.fr/economie/prix-du-gaz-vladimir-poutine-ordonne-a-gazprom-d-augmenter-les-livraisons-a-l-europe-le-cours-degringole-2200435.html?utm_term=Autofeed&utm_medium=Social&utm_source=Facebook&Echobox=1635520157&fbclid=IwAR0rchNftfiARN2IWbNdkIEVSEk64sN1HvUCzPMBxEN0SYadMLvfa8lZIA0#xtor=CS5-111
Interesting stuff . No one in the shale patch will discuss this .
https://www.forbes.com/sites/uhenergy/2021/10/27/with-higher-prices-and-no-growth-this-oil-boom-is-a-bust/?sh=537fdcc15daa
Picked this from Mike S blog .
Another post courtesy Mr Shellman . A post by Art Berman . Needs no introduction .
https://www.oilystuffblog.com/chart-stuff
The Berman blog confirm my recent experience. I know everyone wants to think Permian growth will continue unabated through 2029 but based on my experience and if you read carefully between the lines of the Shale targeted Public company IR presentations then all would understand that these companies are running out of drilling inventory and it will only get worse in terms of spacing and pressure depletion as time marches on.
If this were business as usual and this was 2016, I would easily embrace D. Coyne’s model for Permian production. But this is 2021 and we know a lot more about parent/child wells, well spacing and pressure depletion. We are closer to the Permian Peak than his model suggests. Just sayin………
LTO Survivor,
Yes we do know more now than in 2018 when the last USGS assessment was published for the Permian basin. For a quick reminder the 90% confidence interval for the USGS TRR estimate for the Permian basin was 45 to 114 Gb with the mean estimate (best guess) at 75 Gb. In my model I only include the highest productivity benches assessed which total about 50 Gb for the mean estimate, so I have already reduced the TRR estimate to 50 Gb which is fairly close to the F95 USGS estimate of 45 Gb (for those not familiar, this means the USGS experts believe the probability is 95% that the Permian TRR will be more than 45 Gb), there is likely at least an 85% probability that the Permian TRR will be more than the 50 Gb that I assume in my scenario. For the medium oil price scenario I have utilized (oil price rises to $95/bo by 2029 in this scenario) and the low completion rate I have assumed the economically recoverable resource (ERR) is about 38 Gb. Perhaps LTO survivor is correct at current oil price levels, but my expectation is that the price of oil will continue to rise.
In a conversation with LTO survivor he has suggested perhaps 5% annual growth in Permian output might be reasonable, my scenario has Permian output rising at an average rate of 3.6% per year from Dec 2020 to Dec 2029,
Full scenario in chart below, my guess is that there is about an 80% probability that Permian output will be higher than this scenario, it is extremely conservative in my opinion.
Dennis,
I am not saying your graph is right or wrong . Honestly I have no clue what a higher price will do for the Shale industry. I think we now have higher prices in general because the entire exploration and production side of the industry collapsed during the Saudi/Russian price war simultaneous with the onslaught of Covid. To make matters worse, at the end of 2019 as we were just beginning to test the parent/child relationship between shale wells, we began to see startling results of much less bottom hole pressures, higher GORs, and more extension of frac lengths departing from our wide held industry belief of limited drainage.
The Oil resource is there and abundant but getting it out of the ground with less bottom hole pressure will be a monumental task. I have always believed that some day we will use applied materials to reduce the surface tension of the oil/rock and allow down hole separation to augment production but without enough bottom hole pressure much of the resource will be left behind. Secondary recovery never works too well in a fractured reservoir (whether man made or natural). I believe Co2 will work more effectively but this is extremely expensive and corrosive on equipment and pipe. The price of oil would have to be at $200 per barrel to justify this kind of basin wide project.
I really believe you have done an excellent job using the materials and information and math to come up with your prediction. However it is the hidden story in the boardrooms and engineering departments of all of these companies that is not being revealed to give you a true look into the mechanics of this oil production that comprises your prediction.
LTO Survivor,
I appreciate the feedback. Note that based on your comments my estimate for the Permian has been revised quite a bit. It seems no matter how low I go, it is not low enough.
I am not sure if you follow Enno Peters work at shaleprofile.com. The link below gives a flavor of his recent thinking on the Permian basin. Note also the question I asked him in the comments and his answer there. I use his answer in the chart below (his chart is the green solid projection) where I compare his estimate with my own model. In both cases the completion rate is the same from June 2022 to Dec 2029 at 390 new wells per month (his estimate is 300 rigs/month at 1.3 wells/rig/month so 300*1.3=390 wells/month).
https://shaleprofile.com/blog/permian/permian-update-through-july-2021/
My estimate is extremely conservative (it uses the 4 wells per section width estimate you suggested and average well EUR of about 435 kbo decreasing gradually after Dec 2019).
Note that by Dec 2029 Enno Peters supply projection has output at about 6500 kb/d and my projection is at 5200 kb/d. I think it likely the completion rate will be higher than 390 new wells per month, probably it will gradually increase to at least 500 new wells per month if oil prices rise to $95/bo or more as I think is likely.
You are certainly correct that there is much information that I do not have, but generally tight oil has surprised me to the high side, perhaps this time it will be different.
In the chart below the blue dotted line represents my very conservative Permian basin model (where the completion rate is 390 new wells per month with 300 horizontal oil rigs rotating from July 2022 to Dec 2029). The shale profile projection has 390 wells completed from 2022Q1 to Dec 2029.
Comparison of older scenario using 75 Gb TRR and lower oil price scenario with Brent at a maximum of $80/bo in 2020$ from 2022 to 2032 with more recent scenario which assumes oil price rises to $95/bo in 2020$ by 2030 (it reaches $80/bo in 2020$ in late 2024) oil price remains at $95/bo until Dec 2033 and price decreases to $80/bo by Jan 2036 and to $42.5 by mid 2041 and then remains flat. TRR for more recent scenario is 50 Gb. Note that I assume the lower TRR tends to favor a higher oil price as supply is likely to be less if resource is less extensive.
The older scenario has oil prices falling more slowly to $48/bo in 2020 $ by late 2059. Another difference is the older scenario assumes the completion rate climbs to 550 new wells per month by March 2030 and this rate continues to late 2036 and then completion rate falls to zero by June 2041.
In any case, the response to suggestions that my scenario was far too optimistic was to create a more conservative scenario. In my opinion any scenario lower than the 38 Gb scenario in the chart below would have a probability of 20% or less. That is, possible but not very likely.
Also notice that the older scenario has a maximum output of about 6250 kb/d which is less than the supply scenario created by Enno Peters with only 300 rigs (maximum of 6500 kb/d in Dec 2029). Part of the explanation for the difference is that Enno does not attempt to estimate future reductions in new well productivity, I do make such an estimate for wells after Dec 2019, based on USGS assessments and assumed completion rates for my scenarios.
I realized the 49 Gb scenario in the earlier chart was actually not really a very high output scenario, below I pick a different “high output” Permian scenario with the same oil price assumptions as earlier but in this cas the completion rate is higher reaching 624 wells in June 2026 and with the completion rate remaining at that level until Dec 2033, TRR is 75 Gb as before and ERR is 56 Gb with 162000 total wells completed in the Permian basin for the scenario. I also show the average of the 38 Gb and 56 Gb scenarios with an ERR of 47 Gb, that scenario would have a maximum completion rate of 507 wells from 2026 to 2033. My guess is that there is about an 80% probability that Permian output would fall between these two scenarios. The average low/high scenario is shown as an illustration, impossible to say what the best guess scenario might be, just somewhere between high and low, perhaps within 10% of the average low/high 47 Gb scenario shown.
The
Four more UK energy suppliers go bust amid high gas prices
https://www.theguardian.com/business/2021/nov/02/four-more-uk-energy-suppliers-go-bust-amid-high-gas-prices
(I know this is gas and not oil, but the other site is very dead)
Dennis,
I just dont believe we have 14 years of drilling inventory. I think that’s where we differ. Perhaps there is more than four years of drilling inventory with a lower rig count but I believe we are looking at 8 years at the most and once it hits the end, you will see a 40-50% drop off in year one unless 25 bopd stripper wells are profitable at the price at that time.
LTO Survivor,
I appreciate the feedback as my models may be much more realistic based on your input. I do not know what the specifics of the drilling inventory is, but note that the spacing you have suggested is used (1320 feet between laterals) and a 9000 foot average lateral length is assumed. I take the highest productivity benches from the Permian assessments (2/3 of total TRR assessed or 50 Gb best guess TRR). For my medium oil price scenario, I get about 44 Gb and 113000 total wells drilled on 30 million acres at 272.7 acres per well ( note the 113k wells includes 15.5k wells completed by Dec 2016), if all wells possible (ignoring economics) were completed the total wells completed would be 126.5k wells in the Permian basin. Note also that the original Permian assessment has 50 million acres of prospective area, I have excluded 20 miilion acres of lower productivity in the 38 Gb scenario in the charts above.
I remember early assessments of the Bakken/Three Forks in 2012/2013, many of those assessments thought the drilling inventory would be far lower than what actually was drilled and completed. It turns out the USGS assessment for the North Dakota Bakken/Three Forks in 2013 proved surprisingly accurate once we apply the economics as I have done. I get an ERR nearly equal to cumulative production plus proved reserves at the end of 2019 by using the USGS assessment and a model based on well profile date from shaleprofile.com and a set of economic assumptions.
My guess is that the USGS assessments have improved over time as they get more data on tight oil and new research on well performance in tight plays. Of course I may also be wrong as I have been many times before.
Here is a quote from an early blog post in Dec 2012:
Based on these models I think the upper limit to tight oil output from the Bakken and Eagle Ford in 2020 is about 2.7 Mb/d rather than the 5 Mb/d predicted by the IEA. Note that these estimates are quite optimistic and should be thought of as an upper bound to what may be attainable. This is an increase of about 1.6 Mb/d over current US tight oil output of about 1.14 Mb/d. A more realistic scenario might be a doubling of output to 2.3 Mb/d in 2020.
The post is at the link below
https://oilpeakclimate.blogspot.com/2012/12/update-on-bakken-model-using-hyperbolic.html
In summary, the IEA did a forecast in 2012 with US tight oil reaching 5 Mbo/d in 2020, my “optimistic” estimate for Bakken and Eagle Ford was 2.7 Mb/d in 2020 (Permian and Niobrara were not even on my radar at that time). By coincidence, the high point for Bakken and Eagle Ford in Feb 2020 was 2.68 Mb/d. Note however that I missed the 5.53 Mb/d of output from the rest of US tight oil in Feb 2020. Actual US tight oil output peaked in March 2020 at 8.3 Mb/d so I was too low by more than a factor of 3 in my December 2012 estimate of US future tight oil output.
My incorrect guesses on tight oil have mostly missed on the low side except in cases where there were oil price crashes, where my scenarios missed on the high side.
I expect my $95/bo oil price scenario (where that price is not reached until 2029 with Brent prices rising from $71/bo in late 2021 to $95/bo in 2029, in 2020$) may be conservative we might see $120/bo by 2029 and I doubt we will see any average annual Brent oil price under $80/bo from 2022 to 2029 in 2020 $.
LTO Survivor
Currently, it is all about the DUCs’ contribution to the Permian’s output.
During September, 284 wells were drilled and 409 were completed. The completed wells added 294 kb/d to September’s output. The decline was 244 kb/d which resulted in a net increase of 50 kb/d.
However, if the DUCs were excluded it’s a whole different story. Scaling the output by the ratio of wells drops the Permian output to 204 kb/d. (284/409*294,000 = 204,000). So with no DUCs the Permian output would have declined by 40 kb/d in September.
Alternatively, it takes 339 new wells to just offset the current decline rate of 244 kb/d.
Hi Ovi,
At shale profile they estimate about 1.3 wells drilled per month for each horizontal oil rig in the Permian basin. For week ending 10/29 there were 247 horizontal oil rigs rotating, if that count continues we would see 321 new wells drilled going forward. Over the past 6 months Permian horizontal rigs have been increasing at about 3.5 per week. If the rate of increase falls to 2 rigs per week we still see wells drilled increase to 342 per month by January. The DUC count will stabilize over time and then will increase as completion rate stabilizes at some higher level (probably 390 to 410 wells completed per month). If the rigs operating in the Permian increase by 100 (over a 12 month period) to 347 that suggests about 450 wells drilled per month, if only 410 wells were completed per month that implies increasing DUC counts by 40 per month, once the optimal DUC count is reached for producers they will reduce the operating rigs so that completions and wells drilled will be the same and the DUC count will stabilize.
Dennis
Just read this comment from an oil analyst where he said that a well used to cost $7M. $2M to drill and $5M to complete. However he said that drilling cost is much more than $2M now and that the drillers are using the DUCs to reduce their costs and implied that well completions will slow when the DUCs are depleted.
This is also true. Figures don’t lie but liars can use figured to hide the truth.
The IHS North American E&P index had been at its lowest since 2014 but had a big jump in the second quarter and I expect there will be a bigger one in the third (the figures for which should be out soon hough I don’t know the exact release dates).
Worldwide the UCCI has been increasing about as fast as it did when the industry went slightly bonkers in 2005 to 2008. Again 3q may be even higher. One thing this means is that capital expenditure doesn’t rise the actual development and ultimately the number of new wells will decline. It also will add to any risk aversion already present in the E&Ps (and maybe their potential lenders).
Worldwide the UCCI has been increasing about as fast as it did when the industry went slightly bonkers in 2005 to 2008. Again 3q may be even higher. One thing this means is that capital expenditure doesn’t rise the actual development and ultimately the number of new wells will decline. It also will add to any risk aversion already present in the E&Ps (and maybe their potential lenders).
And one last une the downstream index is the highest and climbing the fastest it ever has.
Ovi,
I assume full well cost is 10.5 million in 2020 US$ in my model for the Permian basin. I ignore the drop in well cost during the pandemic and assume well cost is unchanged from July 2017 to July 2036 at 10.5 million in 2020 US$. From 2010 to 2017 I assume real well cost gradually increases from 7.5 million to 10.5 million in 2020 US$ due to increases in lateral length, number of frac stages, and increase in proppant use.
The producers are completing more wells than they are drilling because they had an excess inventory of DUCs due to the pandemic, at this point they may be close to an optimum level and will likely increase the drilling rate to the completion rate that they desire.
As to whether completion rate slows, will depend on what happens with rigs, so far the trend has been up both for rigs and frack spreads, the rate of increase might slow down, but the fact that oil prices are quite high suggests the reverse.
George,
Great charts thanks.
Mike assumes that analysts assume nothing changes over time. My models have changing completion rates, changing costs, and changing well productivity. As to future values for any of these variables nobody knows what they will be. So I create scenarios with different completion rates which affects well productivity, I assume as completion rates increase that the rate of decrease in well productivity increases and vice versa. I use the simplifying assumption that future well design will be unchanged at the average 2019 lateral length, proppant per well, frac stages per well and well spacing and that well costs wil rise at the same rate as the rate of inflation (that is real well costs will be unchanged per lateral foot). If well design is unchanged in the future, increased operating efficiencies could offset rising matetial and labor costs and keep real well cost flat.
An older study from IHS at link below
https://www.eia.gov/analysis/studies/drilling/pdf/upstream.pdf
It would be interesting to get an estimate of average well cost (drilling, completion and land cost) for midland and delaware basins in 2019. My current guess is $10.5 million in 2020 US$, but there are many who know far more than me who could make a better estimte.
Your guess Mike is spot on. Well costs are around $10.5 million and rising.
Thanks LTO Survivor.
I just talked to someone in the UK who paid £1.50/litre (US$7.76/gallon) to fill up his car. This is the highest price ever in the UK. Strangely he said that traffic volumes have not decreased. For some reason, high fuel prices do not seem to affect people’s driving habits, or maybe there’s a delayed effect?
I just paid slightly more here in Sweden (17,75 SEK/l) to fill up the car, and a small can for the snowblower, stings a bit but sure beats walking and shoveling. Here a small comfort is also that much of the cost is tax that keeps our social systems running, however bloated they may be… And the same here, no visible affect on traffic volume, yet at least.
Perhaps high oil prices lead to faster transition to EVs. If so the demand for oil may eventually fall. This will likely require many years probably 2033 before oil demand falls below supply.
A couple of years ago the sighting of a Tesla was a happening here, now I see quite a few while commuting to work, mostly white Model 3s due to tax reasons since they, just barely, fall below the tax break limit for corporate cars…
But we are a fairly prosperous country, hard to see that happening in Vietnam etc. But ingenuity will hopefully help.
Addendum, there are also some electric snowmobiles developed, hopefully that will work out well.
For some petrol, and natural gas liquid products, I suspect people will work very hard to continue on with purchase even at much higher price levels, such as many of the derivatives of the petrochemical industry like resins and adhesives and paints and synthetic fibers, etc.
On the other hand, steady high prices of gasoline are likely to drive people towards vehicles with plugs even more rapidly than the current clip.
Does anyone here know if there is relative excess or shortage of the specific refined products of crude oil- just for example is there plenty of jet fuel but not enough asphalt? Perhaps this varies regionally.
Lots of substitutes for petrochemicals: coal, biomass, electrolytic H2 and atmospheric C. Chemical engineering has a lot of ability to transform things.
Asphalt is easily replaced by concrete.
A surprising amount of oil, diesel and gasoline are used in commercial, industrial and residential generators. Solar with or without batteries are already eating into that.
As renewable power gets cheaper and oil-based liquids get more expensive synthetic fuels will become competitive.
The same can be seen in The Netherlands. Record gasprice, but even more traffic than in 2019.
But the government will put an end to all this: new COVID-mandates.
Office-workers will have to work from home again just like in March 2020.
People need cars to get to work. The cost cutting won’t be coming from driving miles, but from discretionary spending.
And, indeed, the UK economic recovery has been slowing down lately.
From the Oil and Gas Journal reporting ion a Morgan Stanley analysis:
Last year, global capex fell to $350 billion and has not rebounded in 2021, and probably won’t in 2022 either. If capex stays stable at current levels, global oil supply will likely roll over around 2024 and then decline sharply thereafter.
Meantime, “sustained high oil prices are likely needed to restore balance: Unless more investment is forthcoming, or major demand break-throughs are made, oil prices will likely search for the level where some demand erosion kicks in. We raise our 2022 first quarter Brent forecast to $95/bbl and our long-term forecast from $60/bbl to $70/bbl,” Morgan Stanley said. Here Morgan Stanley defines ‘long term’ as the period starting in 2023 and stretching into the second half of the decade.
https://www.ogj.com/general-interest/economics-markets/article/14213072/morgan-stanley-global-oil-supply-likely-to-peak-earlier-than-demand
The Brent crude benchmark will hit $120 per barrel by the end of June 2022, Bank of America said in a research note this week, cited by Bloomberg.
The catalyst for BofA’s increased price forecast is the current global energy crisis that has seen prices for crude oil, coal, natural gas, and LNG skyrocket as the market tightens.
Just a month ago, BofA had forecast that oil could reach $100 over the next six months—and that was if we had a winter that was colder than usual. At the time, this was expected to be the most important driver of the global energy markets.
Excerpt from article linked below at oilprice.com
https://oilprice.com/Latest-Energy-News/World-News/Bank-Of-America-Sees-120-Oil-By-June-2022.html
Dennis
I think this is a bit of a stretch. It all depends on the assumptions. OPEC says there will be a supply surplus starting in June/July.
Not sure what BAC is assuming. Some analyst and participants on this site say OPEC will have difficulty in increasing their production much next year when all of their taps would have been reopened. OPEC would have to stumble at the 28,500 kb/d level and covid will have receded and world economy is into a good recovery to drive prices higher than $100.
I am more in the $90 to $100 range if the big 3, Texas, New Mexico and North Dakota keep increasing production at 70 kb/d/mth and reduce pressure on OPEC+
Ovi,
I agree with your oil price estimate, just thought the change in prediction by BOA was interesting, I think $95+/-5 per barrel for WTI in 2020 US$ is a reasonable estimate. Of course the experienced oil guys know that predicting the price of oil is a fool’s errand.
Just saw this.
OPEC oil output rise in October undershoots target
LONDON: The increase in OPEC’s oil output in October fell short of the rise planned under a deal with allies, a Reuters survey found on Monday, as involuntary outages in some smaller producers offset higher supplies from Saudi Arabia and Iraq.
The Organization of the Petroleum Exporting Countries (OPEC) pumped 27.50 million barrels per day (bpd) in October, the survey found, a rise of 190,000 bpd from the previous month but below the 254,000 increase permitted under the supply deal.
The biggest rises in October came from OPEC’s top two producers, Saudi Arabia and Iraq, which both boosted output largely as promised according to the agreement.
https://www.thenews.com.pk/print/905135-opec-oil-output-rise-in-october-undershoots-target
It will be interesting to see what comes out of the OPEC+ meeting on Thursday this week. Promises of more oil or stay the course?
Frugal,
I believe they will stay the course until we have sustained Brent prices of $100/bo or more for a month or more.
Was having trouble posting this, sorry if I spammed it a bit.
I am going to make an argument that I have been rolling over in my head for some time. My disclaimer is that I am fairly uneducated in this area. Everything I am saying here could be wrong, or only half-correct. But I still think it will spur some interesting discussion regardless.
Here is my simple thesis: A transition to EVs will not reduce demand for petroleum, at least in the short to medium term.
I’ll make two supporting arguments.
We Still Need the Rest of the Oil
We need to make clear what EVs actually replace. EVs replace gasoline. Currently, EVs on the market replace only vehicles that consume gasoline. That is, light cars and trucks. EVs that replace heavier vehicles, those that consume diesel (cargo trucks, tractors and heavy machinery), kerosine (airplanes), and bunker fuel (cargo ships) are not yet practical in a meaningful way. It will take many developments in battery technology before these applications become practical. Further, EVs do not replace the non-fuel uses of petroleum. Plastics, asphalt, pharmaceuticals, etc.
Fractional distillation is the process that (most) oil refineries use to separate petroleum into its component hydrocarbons. By boiling the oil, and then allowing the components to condense at their individual boiling points, the oil is separated into these disparate products. Via this process, about 45% of a typical barrel of oil is refined into gasoline. And that is the portion of the barrel that usage of EVs will turn into a waste product. But there is a rather big problem. You still need the rest of the barrel. You still need diesel, kerosine, asphalt, and all the rest. Just because you no longer want gasoline, does not have any effect on the need for the other products of petroleum. Which means you will still need the same number of barrels of oil.
Of course, this situation, if it becomes reality, could have some strange results. Since producers are no longer making money on the gasoline, but presumably still have the same costs to extract and refine the barrel, the costs of other oil products could rise. Another outlandish possible effect, is that perhaps refineries will begin flaring gasoline.
One solution to this problem would be to retrofit refineries to turn the gasoline into something else. If the gasoline were converted into other petroleum products (similar to the coal liquefaction pursued by Germany during WW2), overall demand for oil would decrease, as gasoline would be taking the place of other petroleum products. Doing this conversion is certainly possible. I have NO IDEA the costs or difficulty of doing so. I cannot imagine it would be cheap, or that it could be accomplished very quickly.
Regardless of the long term results, if initially the transition to EVs means we simply want less gasoline, we will still want the same amount of oil. Lack of demand for gasoline doesn’t reduce demand for all the rest. Onto my second argument.
Price Goes Down, Demand Goes Up
What is likely to happen when demand for gasoline falls off a cliff? Well, the price of gasoline would drop. Due to the need to make other products, refiners will still be producing a LOT of gasoline. And there is a great distribution network for it already. And it will be very, very cheap.
Anything producers sell it for, beyond the cost of distribution, will be free money from a product no one wants any longer. Is $0.20 per gallon reasonable? If producers don’t sell it, they pretty much just have to dispose of it. I’d imagine this entirely erases any economic reason for individuals to switch to EVs, not to mention stimulating a search for other uses of gasoline. I imagine it could power ships, or heavy machinery, or what ever else. And it’s gonna be so cheap that there will be a pretty massive incentive to make use of it. This is pretty much Jevon’s paradox at a massive scale. The result? Any large reduction in demand for gasoline will incentivize finding new uses, and demand for gasoline will go right back up.
Taking these two arguments together, I just don’t see EVs doing much to reduce demand for oil. Interested to hear everyone’s thoughts.
Niko —
This is a really good point. A big shift to EVs wouldn’t reduce oil consumption evenly. It would just hit those sectors that power light vehicles. There could be lots of surprises in store.
Two other thoughts occur to me:
First, US refineries produce a lot more gasoline than the rest of the world:
https://www.greencarcongress.com/2020/07/20200714-refineries.html
Second, in Europe EVs are hitting diesel car sales very hard, but not gasoline car sales.
https://www.economist.com/graphic-detail/2021/10/01/european-sales-of-electric-vehicles-have-nosed-ahead-of-diesels
I forgot that diesel powered light vehicles are more popular elsewhere. There’s that American ethnocentrism coming out. This would indicate that EVs can reduce demand for both diesel and gasoline, though to varying degrees. However, I think there is a portion of diesel which is still very hard to replace, and the other products of petroleum seem unaffected. At what point has enough of the barrel become low worth that it is no longer economically feasible to extract and refine the barrel at all?
My second point remains the same. Reduction in demand (for diesel AND gasoline) reduces price which disincentives transition and encourages finding new uses for what would be stranded assets. The interactions and results here are likely to be complicated.
Niko,
As demand goes down for fossil fuel price will decrease, but that will drive higher cost oil from the market, there will come a point where the gas stations will also not be able to operate because the price of fuel will be so low that profits become nil. Fewer gas stations will make ICE cars inconvenient relative to electric and they will be considered inconvenient. A little like seeing someone drive to work in a hrse and buggy or riding a horse. Perhaps a cattle rancher might do so, but generally people use ICEV and before long the ICEV will be the horse to the EV.
For large trucks batteries may get there eventually though electrified rail with last mile heavy duty EVs from rail to store or warehouse and EV delivery trucks and buses. We will get there, but it will take 10 to 20 years to accomplish.
As demand goes down for fossil fuel price will decrease,
The point I am trying to make is that demand for petroleum does not decrease as a singular unit. Rather, demand for specific petroleum products decreases, while demand for others remains. If producers can’t sell some of the barrel, they will likely have to increase prices on the rest. They will also have a large waste product problem, since those undesired products will be by-products of producing the stuff that people still want.
Will there be fewer gas stations? Or will gas stations add charging stations, continue selling (much cheaper) gasoline and diesel, and become hybrid affairs. What will be cheaper for refineries? Finding a way to get rid of these massive streams of waste product, or finding someone who wants to burn it, and burn it very cheaply? In 1978, gasoline prices were $0.65/gallon (inflation adjusted 2020 dollars, see https://www.usinflationcalculator.com/gasoline-prices-adjusted-for-inflation/) . So gas stations can obviously still be profitable at this price level. Do EVs still have an economic advantage over ICEVs at this price? Is it conceivable prices could go lower? I have seen analysis which suggests that fueling EVs costs about the equivalent of gasoline at $1.16. if EVs lose the price edge due to falling demand for gasoline, what happens to the economic incentive for switching?
The point is, as demand for these individual products (gasoline and diesel) decreases, there is a very large incentive to find a way to continue getting rid of them. And a very large economic incentive (in the form of rock bottom prices) for consumers to keep using them. The other products of petroleum will have to pick up the price slack, but since there are no good viable replacements, those products likely have very low elasticity of demand.
Unless you can easily convert any product of a barrel of oil into any other product, this problem will remain.
Niko,
The quantity of gasoline can change based on the type of refinery used. The market will adjust as things change in my opinion.
We will get there, but it will take 10 to 20 years to accomplish.
I will not try to guess how long it will take us to get there, but if we do, it will be because of declining supply, not declining demand.
Right now, today, oil prices are over $80 a barrel… because of declining demand? I really don’t think so. Demand is not declining, it is increasing. And supply is not keeping pace. But EVs are going to turn all that around soon. Not a chance.
Please don’t get me wrong, I hope I am mistaken. I hope EVs take over the world and IC vehicles will be reduced to the trash heap, including my 2007 Nissan pickup truck. But it is not going to happen. Well not anyway soon that is, not soon enough.
But I hope, I dearly hope, I am wrong.
Ron,
EV sales are growing very rapidly, it will not be long before petroleum demand starts falling faster than petroleum supply, my guess is 2030 to 2035, I also could be wrong.
Of course Dennis, you could be wrong. And so could I. And we usually are. 😂
Ron,
Yes predictions are usually wrong, on that we are in agreement.
Declining supply will happen before declining demand. Even with oil prices at $85 per barrel, the industry is dead and no one wants to invest except those of us who recognize the value of scarcity and depleting reserves. In any other time period in the past 50 years, higher prices would create the boom-like activity. Now it is more like a “dead cat bounce”. We would see deals coming out of the woodwork but this is not happening. There has been way too much destruction of the oilfield service infrastructure, labor disillusionment and retirement of highly skilled geoscience professionals, capital flight and green wave investing. You can only kick the dog so many times until he finally runs away.
LTO Survivor,
I agree. I expect supply to start declining in 2028 and high oil prices will balance supply with demand, by 2033 I expect enough EVs and plugin hybrids will be on the road that demand will begin to fall faster than supply at prevailing oil prices (by that time the prevailing oil price may be well over $100/bo in 2020 $.)
High oil prices may lead to an accelaration of EV sales growth, currently there are long wait times for popular EVs as supply cannot keep up with demand for popular models, currently if you order a Tesla Model Y (crossover mid-size SUV) delivery is expected in April 2022.
Niko —
Another similar question is what will happen to the ethanol market. About 40% of the US corn crop is refined to ethanol. There is an oversupply.
Europe has a similar problem, but will probably react by kicking out imported palm oil as a short term fix.
If EVs due suppress demand for oil, political pressure to increase the percentage of ethanol in fuel will increase. If oil prices fall, it will get more and more expensive to do that.
Ethanol fuel saved Midwestern farming from collapse when it was introduced, but it is a wobbly market.
There is some flexibility in refineries. There are units called hydrocrackers and catalytic crackers that turn heavy oil fractions into diesel or gasoline (hydrocrackers add hydrogen, which often comes from steam reforming natural gas, cat crackers remove carbon which is burnt to CO2 to provide the energy for the reaction). There is some nudge room within a refinery design to change the ratio of gasoline to diesel, but refineries can be modified to favour one or the other (at the cost of the changes and shutdown time to implement them). I would imagine it would be possible (and might already have been done although I can’t see why anyone would have looked into it) to find catalysts and a reaction route the gives the small amount of polymerisation needed to make diesel from gasoline with hydrogen or water as a byproduct.If the demand became apparent I’m sure the refining companies would be all over it. There are processes called alkylation units that take short chain alkanes (C3 to c5 I think) and make long chains ones which are used as fuel additive (I think for adjusting octane numbers and for anti-knock but am probably wrong). The new process would be something along those lines e.g. adding some short chain alkanes to long chain gasoline. Of course I could be completely wrong and this has been tried and found to be technically (e.g. no suitable catalyst) or economically impossible.
Interesting. So we can interchange diesel and gasoline to some extent. What about the other constituents of the barrel? Can we make kerosene from gasoline or diesel, for example?
There is no process designed yet that I know of. Presently it is possible choose to make either from heavy oil depending on what sort of cracking is used. Hydrocracking I think makes quite a wide range of paraffins so I’d imagine some are kerosene.
It is certainly possible at low efficiencies to turn gasoline to diesel because gasoline can be reformed to syn gas and then reacted to make diesel just as is done with gas/coal in gas to liquids/coal to liquids plants. Whether you’d ever choose to do it that way is questionable economically.
Gasoline is C7s to C11s, kerosene C12s to C15s and diesel C16 mostly (cetane). CTL and GTL make diesel, but I’d imagine any process that was viable could be tweaked to make kerosene.
I completely agree and have made point #1 previously – i.e. turning gasoline into a waste product is a huge problem for the other distillates and could create absurd price incentives (i.e. running gasoline generators to create electricity?)
Point #2 is also excellent. Since most people can’t afford new cars, let alone renewables, there will be massive incentives to postpone transition (other than early adopters).
In consulting with a municipality recently they are trying to move their Facilities department (a fleet of light vehicles for everything from streets and sanitation to park district) to EV’s. Among other problems is one they seemingly hadn’t considered – the unionized repair personnel who maintain all these vehicles will need to be re-educated.
They also assumed they would be selling the FF vehicles, not scrapping them – so somebody is buying them?
All in all I see a slow transition. I’m planning to get an EV once I get a charger through my condo board (20 yr old high rise in a major US city – no other charging stations in the building yet), but will keep our FF vehicle. I think lots of “lower upper class” folks will do similar.
I’ve been harboring very similar questions Niko- well stated.
The answers to the questions about feasibility, degree of flexibility, and cost of altering the crude oil fractional output are paramount to the trajectory of the industry and energy supply.
Hickory,
The comments in the link below especially comment #13 by Keith Bowers suggests we could produce more diesel and less petrol with changes in the refinery process (using more hydrocracking and less fluid catalytic cracking.) Using FCC we get about 70% gasoline from the cracking process and the more expensive hydrocracking process results in 85% diesel plus jet fuel and only 10% gasoline. Much of the World oil supply is heavier oil that requires cracking to get lighter products, refineries will be updated to use more hydrocracking as demand for gasoline decreases.
https://cr4.globalspec.com/thread/26624/Maximum-gallons-of-diesel-from-a-barrel-of-crude-oil
I know nothing about the complexities of refining so the information at the link above may not be accurate.
thanks Dennis- yes that comment #13 by Keith Bowers is very informative-
US generally uses Fluid Catalytic cracking and yields 5% fuel gas,70% gasoline, 10% high sulfur diesel, 10% heavy fuel.
Europe generally uses Hydrocracking and from the same feedstock yields 5% fuel gas,10% gasoline,30% jet fuel and 55% ULSD [ultra low sulfur] diesel,
according to his post.
And Hydrocracking is expensive because of reaction conditions (2500psig,850F= high cost equipment) and it consumes lots of costly to make hydrogen.
So there is technical feasibility to alter the end product mix.
But will market forces call for it, and is it feasible to do at scale in a timely and cost-effective manner?
We will see. These questions won’t just be theoretical before too long.
Hickory,
If there is no demand for gasoline, the change to refineries will be made, the increased cost to produce diesel and jet fuel will be passed on thconsumers of diesel and jet fuel, the change will not hapen overnight, gradually demand for gasoline will decrease and gradually refineries will be refitted, or the refineries that can do this process (in Europe and Asia) will export refined products to the US, if US refiners are unwilling to make the necessary investments.
Like most changes it will not likely be smooth road, many bumps to be expected.
Yes.
And the theoretical problem of too much gasoline in relation to other crude output components is probably not an issue to worry about for a decade or two at minimum.
Plenty of gasoline vehicles on the road.
The bigger problem will most likely be a shortage of the ‘whole ball of paraffin’.
Hickory,
Prices will go up to destroy some demand and will eventually lead to substitution especially in the light land transport case to electrically powered transport. By 2033 or so I expect demand for crude plus condensate will be falling faster than the supply of C plus C and we will see oil prices start to decrease which will leave more expensive types of oil not already developed (tight oil, oil sands, deepwater offshore, and Arctic oil) in the ground never to be developed further. Over time from 2035 to 2070 less oil will also be used for other types of transport, possibly less air travel and less seaborne trade in an attempt to avert a climate crisis.
Methane rules for existing oil and gas wells will soon be announced by the Biden Administration. We shall see what they do to stripper wells.
I haven’t been able to find specifics yet. If anyone finds them please link. I’d appreciate it.
One story from CNN states the methane regulations would place rules on approximately 300K wells. There are a lot more wells in the US than that, so maybe strippers will be exempt? We shall see.
Edit: From the news stories I have read it appears there will be some kind of low volume well exception. Also appears regulations would not go into effect until 2023.
This will take a lot of manpower, and I am not sure where the workers will be found. Maybe they have some new technology that can monitor with drones?
Also appears there will be funding to plug abandoned wells. Again, labor issues will be a problem. We contracted to plug six wells. Three were plugged a month ago, then rig had to go to more pressing matters. We hope to get the rig back before year end.
Shallow sand:
I have some questions, some in the form of statements, on stripper oil wells.
They produce from conventional oil reservoirs?
The reservoirs are water drive, or at least partial water drive (in other words, not strong depletion drive)?
When the reservoirs were initially produced, the wells were not stripper wells but what one would call conventional oil wells?
Could one come back to almost any abandoned oil field and drill updip wells and these wells would produce like a stripper well (low oil rate, high water cut)?
Do you intentionally drill stripper wells, or are they originally drilled with the thought they will be conventional oil wells?
On a related note – do most stripper wells start out as conventional producers, but over time, as the oil rate declines and the water rate increases, they become stripper wells?
thanks, SouthLaGeo
SouthLAGEO
Stripper well is a term used for low volume wells. I think they are defined as oil wells producing under 15 BOPD or gas wells producing under 90 MCFPD. Any well can be a stripper well and many unconventional horizontal shale wells are now stripper wells due to low production.
I think conventional well onshore lower 48 typically means vertical well.
Our wells are almost all producing from sandstone formations discovered over 100 years ago. Our field IP’s were generally 50 to 250 BOPD, but fell under 15 BOPD within months for the most part. Our wells are almost all producing from the same sand formation which ranges in depths from 800’-1,100’ depending on location. The majority are 900’-1,000’. Sands range from 10’-50’ in thickness, most are 20’-25’.
Our field was discovered in 1905 and considered fully developed for primary production by 1911. “Accidental” waterfloods occurred as early as the 1920’s when operators began to use abandoned oil wells to dispose of produced water. After WW2 large scale waterfloods were developed in five spot patterns on ten acre spacing.
Our field’s production peaked just two years after discovery in 1907 at over 100K BOPD. By the end of the Great Depression, production had fallen to about 3K BOPD. By the late 1950s, waterfloods had brought production back to over 10K BOPD. Production gradually declined until after the Arab Oil Embargo. A third peak occurred at about 5K BOPD in 1985. Production again slowly fell until 2006, and a fourth peak occurred in 2014 of a little over 3K BOPD. Production again slowly fell, then completely collapsed in 2020 to an all-time low of just 1.8K BOPD. First 6 months 2021 shows a very slight recovery from 2020.
We drilled successful wells up to 2014. I know of at least one successful well completed by an operator in 2021.
Of course, in US lower 48 there are stripper wells of varying depths and formations. I am aware of wells as shallow as 150’ and over 10K feet that qualify as stripper wells.
Most (but not all) stripper wells produce much more water than oil.
Many of the wells drilled in our field 1975-1985 and 2005-14 were always stripper wells.
The wells in our field flowed at IP 1905-11, then went on rod pump. Since secondary production began, almost all new wells immediately went on rod pump. There is some natural water drive, mostly artificial water drive. No gas drive to speak of, almost no wells in the field are capable of burning a flare.
Hope this helps.
Great many thanks, Shallow Sand,
A great deal of info in your response.
Let me follow up with 3 more questions.
Were the stripper you mentioned that were drilled between 1975-1985 and 2005-2014 good, economic investments?
This is a rehash of a question from my first post, and since you may not have direct experience with this, even just your comments would be appreciated – Could one come back to almost any abandoned oil field and drill updip wells and these wells would produce like a stripper well (low oil rate, high water cut)?
Any idea what the recovery factor is in your field? (By that I mean “produced oil/OOIP”).
thanks again,,
SOUTHLAGEO.
Keep in mind I am only referring to the field we operate in. There are thousands of fields in the lower 48. I am not qualified to comment on them, and probably not entirely qualified to comment on the one we operate in.
I think most of the wells drilled during those time frames eventually paid out. The time frame would have been long for some of them. Especially the ones drilled near the end of each oil price “boom.”
As I have stated here before, an “average” cost to drill, complete and equip an infill 1,000’ well during 2005-14 was $70k. It can be a little difficult for us to know cumulative from new wells going into a common battery with several other existing wells.
However, we have been able to make some estimates. We drilled a well in 2006 that only had one other well going into a common battery. This well has estimated cumulative of a little over 11k BO and is currently producing about 400 or so BO per year. It’s IP was 18. The monthly electricity allocated to it is around $90 per month. It receives 1 gallon of chemical treatment every two weeks, at a cost of about $500 annually. The pumper charges $150 per month (there are many other wells we operate near it pumped by the same pumper, if it was stand alone it would be at least $300 per month). It has been a very problem free well thus far, just four tubing holes in 15 years, each time some rods were replaced and the down hole pump was repaired. Pumping unit did have a saddle bearing replaced. Of course, electric motor has been replaced a few times and there are belts, grease and gear oil. The water produced by it and the other well (as well as 8 other producers on an adjoining lease) are disposed of down injection wells by way of a hydracell pump. Those have to be replaced every few years at a cost of around $3k. Also, injection wells can develop tubing holes. Those don’t cost much, unless the packer gets stuck. We just dropped $8k on a milling job to get a packer out of a hole.
It’s those “one time” things that hurt us. We have some larger plunger injection pumps. Those cost a fortune to repair. We also have a lot of pumping unit repairs. New units are many times cheaply built, gear boxes cost $3-4k to replace. So we generally use reconditioned units, which cost about the same.
I cannot speak to being able to redrill any “abandoned” field but the one we operate in.
Where we operate, there are hundreds, if not a thousand or more locations that could be redrilled and would produce oil. But I don’t know what a well would cost now, given severe labor and material shortages. I also would say that oil price would be very key to economics. Finally, some won’t produce enough to work out at any price.
As for recovery factor, that is tough. We haven’t had much professional study of our field for decades. When the large independent left our field about 30 years ago they estimated about 30% of OOIP had been recovered.
The field covers about 20k acres and has cumulative of nearly 300 million BO.
There are deeper zones that have been minimally explored. The “deepest” zone at about 4,100’ had several wells in the 1970s and 1980s that IP 100-500 and have cumulative over 50k. Two successful wells were drilled in this zone in 2013.
I can give you a bunch more info specific to our field but would rather do that directly if you are interested.
Great info. Thanks again.
No more questions!
SHALLOW SAND What differentiates shale sweet spots from non-sweet spots — is it mostly the depth of the oil column?
Frugal.
I don’t know enough about shale to comment.
LTO survivor does, and maybe he would be willing to help you.
I have been quite a few reports on the methane emission drone, and satellite, detection industry.
Example from last year-
https://jpt.spe.org/shell-and-baker-hughes-venture-going-big-methane-hunting-drones
Hickory. Our primary concern is regulatory costs. Our wells emit negligible to no methane. But monitoring a couple hundred plus wells that make a little less than 1 BOPD each could be very costly.
I am hopeful the DOE report on methane emissions from stripper wells is either finished, or will be soon. The preliminary results were very encouraging regarding the low methane emissions from stripper oil wells.
I suspect it might be difficult for EPA to monitor over one million wells. But I am not sure what tech they can and will employ, plus how many people they will hire.
My understanding is that most of the methane problems regarding stripper wells are due to abandoned gas wells that are not properly abandoned (i.e. they are leaking). Environmental groups located some in PA, and these findings directly led to all stripper wells being included in the Obama Administration proposed regulations.
Hopefully the DOE study will help EPA identify where the primary problems are.
I understand, and hopefully the attention/regulation will be focused on the big sources.
I suppose that having good data should help policy makers make more appropriate decisions.
And thank you for all the detailed explanations about your operations.
For the vast majority of people this is unknown territory.
Hickory.
I might be wrong, but I foresee non-fuel use of petroleum for many decades. Likewise, petroleum fuel use will not be completely eliminated for years. Assuming a peak in oil production has occurred or will shortly, it would seem to be important to not prematurely P & A productive wells due to a “one size fits all” regulation of any kind.
However, hopefully there will also continue to be technology improvements that can capture methane more cheaply.
The big problem is oil price volatility. I don’t see that going away. I think it will get worse.
Many of the major environmental events in industry result when companies are financially stressed.
Agree.
Diamondback drilling, the first shale E&P to announce plans, has saidd that production will be flat through 2022 (may eventually be down a bit if costs keep rising). BP, like other majors, is concentrating on share buyback rather than new projects. All indications continue to indicate flat or down production for the next year and probably beyond.I suspect the majors might be running out of major discoveries apart from any ESG issues (and by some other news wouldn’t have the personnel needed to take on many more projects).
4Q2021 not 2022.
This is what I have been seeing/saying.
Japan is an interesting example on energy use.
They have the third largest economy in the world and are dependent
on imported fossil fuels for 88% of the primary energy consumption.
In the past 5 years GDP has been on a slight uptrend, even despite the pandemic.
Conversely the crude oil imports have declined from 3400 to 2500 kb/d over the same period [2016 through 2020]
fig 18- http://crudeoilpeak.info/china-increased-oil-imports-in-covid-stricken-2020-by-a-lucky-8-8
I am not sure how they made adjustments to accomplish that disconnect so quickly.
With certainty we can expect Japan to make a mighty effort to avoid energy shortage even as fossil fuels available for import become harder to come by. The Fukushima nuclear meltdown also throws an important lesson on risk and cost into the mix.
It will be very interesting to watch the battle for energy security play out there.
The incentive for energy innovation is as high as anywhere in the world, and they have the financial and intellectual capital available to engage in a full-scale effort.
Here is a ‘Japan 2021 Energy Policy Review’ prepared by the IEA.
I have not dug through it, but at a glance it looks like very fertile ground for understanding the issues for anyone interested-
https://iea.blob.core.windows.net/assets/3470b395-cfdd-44a9-9184-0537cf069c3d/Japan2021_EnergyPolicyReview.pdf
Hickory,
It’s quite simple. Japan’s GDP Growth is not driven by the increase in energy consumption, as shown by Jean Marc Joncovici and others (Oil Consumption & GDP Growth), but rather, by its increase in public and private debt.
Furthermore, Japan’s Central Bank continues to be a BIG BUYER of Assets, Stocks & Etc. Japan’s Central Bank Balance Sheet as a percentage of GDP has increased from 75% of GDP in 2016 to 130% of GDP currently. And, that 130% of GDP is just Japan’s Central Bank Assets… LOL.
Steve
Steve- that explanation of ‘debt’ does nothing to explain how they cut their oil importation so much
[36% decline in 5 years].
Get used to debt, and inevitable gradual currency devaluation. It is how countries who have outgrown their underpinnings handle their finances.
They key is how well they manage or mismanage it. A lot of it is about timing, and what you spend the money on [infrastructure good/war bad, for example].
In the US most people buy their house with debt (mortgage), but they spread the payment over decades.
It has been amazing that Japan has handled their debt as well as they have for so long.
No- this story is not about debt, rather it is about Japans attempt at gradually weaning their country off of extreme reliance on fossil fuel importation.
It will tell us a lot about the prospects for other countries of the world.
btw- It should come as no surprise to anyone that energy supply is going cost more going forward. That will certainly happen if we simply stick with fossil fuel reliance to the degree we do now, and it will certainly happen if add other sources to the mix like more nuclear, geothermal, hydro, solar, wind at scale enough to make a difference. And it will cost a lot to introduce more energy efficient machinery, devices and buildings to the current stock. You can bank on it. I hope you and your country have worked hard and smart to be credit worthy.
Hickory,
I looked at BP 2021 Statistical Review and Japan’s overall energy consumption in Exajoules fell from 18.7 Exajoules in 2016 to 18.4 Exajoules in 2019 and then 17.0 Exajoules in 2020. However, 2020 was the pandemic shutdown. So, we will see what Japan’s total consumption is for 2021 and 2022.
But, it does seem that overall power consumption has fallen. Even looking at OURWORLDINDATA, it does show falling total energy consumption, but Renewables aren’t growing all that much since 2016.
Regardless… Japan is still one of the largest importers of LNG and that could be a problem for them in the future.
The idea that countries are going to transition to Renewables during the decline in fossil fuel production won’t work out as many assume.
The ENERGY CLIFF will be a BEE-OTCH.
steve
Japan’s population has dropped by almost 3 million since 2015
Japan has one of the highest median ages in the world.
Might be worthwhile to compare energy consumption for shrinking countries like Japan versus rapidly growing countries such as Nigeria.
Interesting how the oil importers have shrinking populations and the oil exporters are generally growing population.
This has been discussed here a lot and is a critical point.
The sources I looked at all have similar number on population, showing a decline over that period of 1.7 million, which about 1.5%
And yes-that can certainly decrease the need for energy, as can the ageing of the population that Japan is one of the leading countries on.
I doubt that accounts for the over 30% decline in fossil fuel importation, but it may end up being the path that some countries find as one of their prime methods of success.
And not necessarily on a voluntary basis.
And to your point on countries with a growing population like Nigeria, I think its highly likely that almost all have increasing levels of fossil fuel import unless they have a big domestic supply (like Brazil with oil and sugar cane ethanol). And that is why I highlighted Japan as an example. Their success or failure with providing adequate energy/capita to maintain their standard of living and economic activity, and the choices they make, will give lessons for the all others. In many ways they are like the canary in in the coalmine on energy security/supply.
I just glanced at Worldometers, maybe I read it wrong.
Clearly more at play, but I think many here agree that population trends are a major factor in the peak oil discussion.
Indeed Shallow Sand.
And the last thing any of us want to see if energy shortage driving population size, but it could come to that.
Maybe part of the oil demand drop in Japan could be due to people becoming more cautious about discretionary uses of fuel, but that didn’t show up in the GDP numbers.
Steve, the data about Japan crude oil importation comes the the BP Statistical Review July 2021
as presented by Matt of http://crudeoilpeak.info/ in the link I supplied above.
Somehow they made a dramatic 5 year cut in fossil fuel importation without tanking, thus far. I’m pretty sure China bought all the fuel that Japan didn’t, and more.
I along with most observers have been very surprised how during the past 30 years Japan, Europe and the US have been able to carry large absolute loads of debt. In part it shows the difference between debt and credit worthiness, and in part it shows an incredible job of ‘kick the can down the road’. How long that game is played so well is anyones guess.
Oil Declines Ahead of OPEC+ Meet as U.S. Supplies Edge Up
“OPEC is basically up to where they were pre-Covid and there’s a big question mark of how much extra capacity they have,” Irene Rummelhoff, executive vice president of marketing, midstream and processing at Equinor, said in a Bloomberg Television interview.
Oil Inventory, of the last leg of the draw, 40% is from India
World stock levels are on an express elevator to hell, going down. At 35 million barrels per month – from splicing Seppo’s graph to one at the Kayrros website.
David,
Indeed… heading over the ENERGY CLIFF is going to be one for the history books.
We will know we are heading OVER the Energy Cliff when U.S. and global energy inventories continue to trend lower, no longer enjoying the building cycles in the past.
steve
For some perspective on Seppo’s chart above. The 2015-2019 5 year average for OECD petroleum stocks was about 2900 million barrels, the chart above simply shows that OECD stocks have returned to the pre-covid 5 year average level. As the stock levels continue to fall (if that is what occurs, which the trend suggests) then we may see higher oil prices. This is the reason some analysts are predicting $120/bo oil in 2022. If that price is correct (I think it may be too high) we may see more investment and higher output over the next few years. We may see Iranian oil sanctions removed at some point which may add 1.2 Mb/d to World output. I also expect higher output from US, Brazil, Canada, Guyana, and Norway, the large OPEC producers (KSA, Iraq, and UAE especially) may also increase output if oil prices stabilize above $100/b.
U.S. shale producers signal more oil coming, as OPEC counts on restraint
(Reuters) – U.S. shale producers’ decision this year to resist pumping more oil even as prices surge could be nearing an end, according to company executives.
Several major oil companies, including BP Plc, Chevron Corp and Exxon Mobil Corp, are planning to increase output or shale spending next year, undercutting OPEC’s tight supply management that has pushed crude oil prices above $80 a barrel as global demand for fuel rebounded more swiftly than many anticipated.
Overall U.S. crude production rose last week to 11.5 million barrels per day, according to latest U.S. Energy Department figures, inching closer to its peak of about 13 million bpd before the coronavirus pandemic hit last year. More than 70% of U.S. output comes from shale production. [EIA/S] (Note the the EIA reported that U.S. production increased by 200 kb/d to 11,500 kb/d. This could be some GOM production coming back on line. Just speculating)
https://www.reuters.com/article/usa-oil-opec/u-s-shale-producers-signal-more-oil-coming-as-opec-counts-on-restraint-idUSKBN2HO259?rpc=401&
It will be interesting to see if they can get enough steel tubing for that….at any price.
No doubt about that, Lightsout!
Steel rods and tubing have taken another leg up here in the past month. It’s hard to even find.
Will the lack of rods and tubing result in fewer rigs, fewer wells or both?
Ovi.
I would think both.
Again, my comments are very local and maybe bottlenecks will be resolved in a few months.
I don’t think steel prices have risen so much as the lack of supply of finished products.
Electric motors have been hard to track down at times also.
………and Diamondback’s production will be flat……and CLR is running out of viable locations in the scoop and Bakken and moving to the Delaware…….and production is up to 11.5 or 11.7 or 11.9 or whatever the EIA guesses that week or month. We can’t talk more production into existence. I am not sure where Exxon, Chevron or COP are going to get the steel to ramp up production unless they own their own steel mill. When I read these articles it makes me so cynical that these writers know zero about what it takes to actually replace reserves and bring on new production.
Ramp it up, save the day, bring prices down because we are entitled to cheap infinite energy forever. It is our god given right. What a tragedy of misguided thinking and profligate waste.
LTO.
Any further comments on the Delaware Basin sale from PXD to CLR?
Appears that PXD wasn’t enamored with the asset (probably less locations than they originally hoped) and that CLR must be running out of acreage to suddenly jump into the Permian Basin where they have zero footprint, as you state above?
This one surprised me. Seems to be further evidence that places like the Bakken and SCOOP are about tapped out, at least with regard to oil.
Shallow Sand,
I totally agree. Pioneer bought Parsleys position in the Delaware and it never was really that great. They bought north east of Oxy in Barilla Draw in Reeves County and the rock over there begins to get a little ratty and edgy, Pioneer was never much of a Delaware driller any way and its economies of scale and presence in the Midland Basin made this a pretty good move for Pioneer. Now they can reduce debt, pay dividends and hope to get bought. I don’t know why Harold decided to jump into the Delaware now unless he is simply out of locations. I think despite the acreage not being prime, he made a pretty decent deal and I think got what he wanted/needed and Scott got what he needed/wanted.
LTO/Shallow
Watch what CLR does on this acreage in the coming months as very strong suspicion has arisen that CLR has – to a degree – cracked the code regarding the field repressurization issue.
Reading through the conference call transcripts reveals that the contiguous holdings (another $375 million land acquisition is expected to be announced shortly) are a major plus combined with ‘forward looking technology’ – Jack Stark’s description – applied to an area where much of the original formation pressure still exists (minimal development, as has been noted).
Large, contiguous leases are necessary to overcome disputes surrounding hydrocarbon migration potentially crossing lease lines.
The highly productive Long Creek Unit in North Dakota was specifically mentioned as a model for this approach. The LCU wells were considered Tier 2 acreage yet have been showing outstanding results in production.
Should it become validated that successful repressurization is taking place, the follow on consequences will be monumental.
Coffee , ” strong suspicion ” . I have a strong suspicion , I can fly . To continue “should it become validated that successful repressurization is taking place, the follow on consequences will be monumental. ” Well , if wishes were horses beggars would ride . Or maybe this is better ” If grandma had a d*** she would be called grandpa . ROFL.
Thanks Coffeeguyzz for the info.
I appreciate the perspectives you bring to the table.
Re-pressurization sounds like an impossible task to one who can’t even fathom what it would take to attempt the effort [like me].
Eyes open.
Biden declaration at the G20 that went rather unnoticed (at least in the French press, relayed only by regional or specialized press) :
““The idea that Russia and Saudi Arabia and other major producers are not going to pump more oil so people can have gasoline to get to and from work, for example, is not right,” Biden said Sunday.”
” (October 30th)
Let’s see what opec says today
We are starting to see political fallout of allowing inflation to run hot. 30% of the CPI is rent. And it should continue coming in scorching hot.
To me this means FED will raise interest rates a whole lot sooner than anybody expects. And there will be political pressure to do so.
What does any of that mean for the price of oil? Well you have Europe and Japan who can’t raise rates regardless of how hot inflation runs. Which means both of their currency will come under major pressure.
In dollar terms this should be deflationary for commodities and oil maybe inflationary for US assets as capital leaves Europe and Japan. Only market big enough to absorb those flows is US.
To me oil price just isn’t a one way bet on higher prices anymore. As other things start coming into play.
I’m not saying oil and other commodities won’t have a bid. What I’m saying is that the US dollar will be more bid than oil and other commodities. More money will likely flow into US dollar assets than oil and commodities.
Oil prices rise ahead of OPEC meeting
Citi analysts said that OPEC is likely to stick to current policy despite pressure from oil importers.
“The majority of OPEC members cannot raise production from current levels,” the bank said in a note, adding that even Saudi Arabia has emphasised the need to exercise caution given continuing uncertainty over the COVID-19 pandemic.
The majority of OPEC members cannot raise production from current levels,” the bank said in a note…
OPEC will not increase production above pre covid levels. Saudi, and perhaps a couple of other OPEC nations may be able to do that, but only barely. Other OPEC nations, in decline, will keep the total OPEC level below pre-pandemic levels.
In fact, Saudi Arabia is already at pre covid levels while OPEC 13 is still over 1.5 million barrels per day below pre covid levels. I expect Saudi’s monthly increase to dwindle to nothing in the next two to three months. When that happens OPEC will not be able to increase production very much, if at all. barrels per day.
World C+C is still over 5 million barrels per day below the April 2019 peak 12 month average of 83,130K barrels per day. That peak average will never be breached.
The world is still about 6.5 million barrels per day below the monthly November 2018 C+C peak of 84,600K barrels per day. That monthly peak will never be breached either.
Of course, all this is just my opinion, for what it is worth. But it is far more accurate than those 2028-2029 peak predictions we see posted here so often.
So Ron what do you make of this.
Current OPEC 10, through September, was 23,150k. Adding about 200k for October will put them at about 23,350K, or 950K barrels per day short of that 24,300 target. That is not going to happen in two months.
They are forecasting OPEC 13 to be up 190K bpd in October.
I think they have Russia about right. They are counting crude only here and Russia is at 10,840K C+C. They are producing from 800K to 1,000K bpd of condensate.
The world is still about 6.5 million barrels per day below the monthly November 2018 C C peak of 84,600K barrels per day. That monthly peak will never be breached either.
If this is true then peak oil has definitely arrived, and yet nobody seems to be talking about it. To be fair, most people think that the current oil shortage is because of an up to now only partial recovery from the Covid oil crash and OPEC deliberately holding back.
Ron,
We will see. I think the 12 month average peak for World C plus C output will be breached in 2024, and my current best guess for World peak C plus C is 2026 or 2027 at about 85 Mb/d. URR=2900 Gb.
I would also not that World C plus output has increased by 7.4 Mb/d over the past 13 months from 70.3 Mb/d in June 2020 to 77.7 Mb/d in July 2021. In a couple of years we might be above 83.13 Mb/d, it is likely in my opinion.
I would also not that World C plus output has increased by 7.4 Mb/d over the past 13 months from 70.3 Mb/d in June 2020 to 77.7 Mb/d in July 2021.
Dennis, that was just recovery from the covid cutbacks. Damn, I thought you knew that. 🤣 And you think that kind of increase might continue for a couple of years? Are you serious or did you just forget to post your smiley face?
Right now, all producers are almost fully recovered from covid, as much as they can possibly recover. But right now, in early November, every nation is producing flat out, trying to take advantage of these high prices. Of course, it is taking some time to get everything back online, but they have had months to do that.
You continue to post URR numbers. Your predictions would be far more accurate if you looked at production and decline numbers instead.
Ron,
I expect the rate of growth will slow to about 2 Mb/d each year from 2022 to 2025 as the oil industry recovers. The yearly average output for the past 12 months has been 75 kb/d, down about 5 Mb/d from the previous 12 months, I expect output will recover to above 83.13 Mb/d by year end 2024, so that is about an 8 Mb/d increase over 3.5 years or about 2.3 Mb/d each year on average.
I do look at all of it, the URR is simply shown to compare with other estimates, such as Jean Laherrere’s 2018 estimate of about 2900 Gb for World C plus C. What you miss is undeveloped resources by only looking at production and decline rates. Oil resources have already been discovered that can be developed. There is a lot of literature on this.
Link below is an excellent example
https://royalsocietypublishing.org/toc/rsta/372/2006
Also Ron the low oil prices of the 2015-2020 period resulted in low capital investment in the Oil industry, high oil prices may change that, but it does not happen overnight, it will take some time. Probably 3.5 years will be enough to increase World C plus C supply to the 2019 level, perhaps it will take 5 years, it depends on oil prices and investment decisions, which are difficult to predict.
Dennis “change that, but it does not happen overnight, it will take some time. ”
Regret to inform that we have run out of time . We have started burning inventory to keep warm , next we will burn the house furniture . Oh another one .” Oil resources have already been discovered that can be developed. ” . At what price ? $ 500 per barrel . ROFL .
Hole in head,
Much of it can be developed at $85/bo or higher. I expect oil prices will be around $95/b or higher on average from 2022 to 2027. There will be a lot of proved undeveloped reserves that will be profitable to develope if oil prices are as high as I assume.
Recent shock model
Seriously Dennis? The shock model, famously known as predicting peak oil a decade ago, returning the same answer and profile it always does? The only question I’ve got is what is the price that generates the maximum flow rate on that chart? Because based on that answer alone you can establish, or discredit, the validity of the entire forward looking production path. So…market price for WTI at the maximum rate is…?
Reservegrowthrulz.
It will be the oil price where supply matches demand. The curve is a guess where it is assumed that ongoing transition to electric land transport continues which will gradually reduce the rate of demand growth. My guess is that Oil prices reach about $110+/10/bo by 2026 (in 2020$), possibly they rise more than this (perhaps $140/bo in 2020$) between 2026 and 2040, by 2042 demand begins to fall at a faster rate than oil supply and output is demand constrained as most land transport powered by oil is replaced by electricity.
Note that extraction rate (percentage of producing reserves produced each year) had trended down from 1979 (12.7%) to 2019 (5.7%). A slightly higher extraction rate scenario would create a slightly later peak (2028) and a slightly higher URR (3000 Gb).
Difficult to predict precisely future market clearing oil price.
Alternative scenario below, oil price at peak (in 2028) at $115/bo nominal for WTI.
Reservgrowthrulz,
Just realized both previous scenarios assumed a low tight oil output scenario consistent with lower oil prices. The scenario below uses a higher oil price scenario for tight oil and has a higher peak (88 Mbo/d) for World C plus C output in 2028. The tight oil scenario assumes a maximum oil price of $92/bo for WTI in 2020 $.
Note that this scenario has demand falling below supply by 2027 which would lead to falling oil prices after 2027.
Reservegrowthrulz,
Comparison of EIA IEO 2021 for crude (3 cases) with my best guess oil shock model scenario. Note that after 2030 supply falls due to an assumed lack of oil demand as the World transitions to electric transport and demand falls faster than supply and leads to low oil prices (below the “low oil price case”) and falling output to match supply with demand. Up to 2030, my scenario is consistent with the EIA’s 3 cases (reference, low oil price, and high oil price scenarios).
2028-2029 is wishful peak thinking. It would take a monumental amount of capital to make that happen.
LTO survivor,
Perhaps the capital will be available at $100/bo or more, if not supply will be less and oil prices will be as high as needed to destroy demand and attract capital. I think $120/bo would definitely be high enough to balance supply and demand for oil.
Care to venture a guess, your insight would be infinitely better than mine?
OPEC+ Rejects Biden’s Plea for Bigger Oil-Supply Increase
After a brief meeting on Thursday, the group approved a 400,000 barrel-a-day production hike for December. That’s a pace that major consumers say is too slow to sustain the post-Covid economic recovery, with the U.S. asking for as much as double that amount.
I’m surprised they are managing to produce even what they are as total drilling rigs are still half pre-Covid levels. Except Russia all the Plus countries combinrd were in a gentle but accelerating decline for over ten years, so they might be expected to be more of a drag on overall production going forward once they,ve recovered as much of the Covid dip as they can. I’m not sure what complication condensate, which is outside the quotas, might play as well, if any.
OPEC+ can’t produce much more plus every time they do provide more oil to the market they get whacked by the futures market and prices. The industry or what’s left of it is like a scared and beaten dog. Every time they come running to meet world pressure they get kicked in the teeth and now with the COP26 contingent it adds a whole other negative element to directly starve the exploration and production industry of needed capital for reserve replacement. This is about years of mismanagement and misunderstanding a depleting resource. Its stunning how tragic this is for the world and its immediate energy demand/needs.
We are drawing on 2.5mbpd of inventory and still OPEC + will not increase production . Seppo’s inventory draw down graph is correct and worrisome . Interesting article .
https://www.worldoil.com/news/2021/11/2/bp-says-global-oil-demand-has-passed-100-million-barrels-per-day
To disrupt the status quo and assert Russian dominance, pricing oil in Bitcoin and only Bitcoin would end . . . pretty much everything. Wozniak this week came out as a Bitcoin proponent. “It’s math, not whimsy.”
But overall Russia could decide they are going to win anyway. No need to create upheaval.
Bitcoin is priced in dollars. Any type of dollar liquidity issue can take bitcoins value to basically zero.
And if those who own bitcoin get hit with a capital gains tax on unrealized profits. Good luck being long Bitcoin. Because just about everyone holding them would have to sell.
Not in Putin’s best interest to swap oil for Bitcoin but then again it’s not in his best interest to swap oil for euro’s either.
Gold on other hand is worth something even if the lights go out.
How would a foreign government buying oil with bitcoin be hit with a capital gains tax?
I was surprised Wozniak was so overt about it, but he’s right.
Why would a foreign government accept payment in something that’s value can drop considerably overnight depending on factors they have no control over?
Kinda like why does Putin except Euro’s as payment for oil when there is a high future probability that the Euro is abandoned as a currency in the future. Due to European countries not getting along with each other over lack of energy issues.
Only reason oil still flows to a place like say Japan is because Japan is able to convert yen into dollars. If they tried paying for oil with yen they would be told no.
At the end of the day Putin can accept payment for oil in whatever he wants. But that doesn’t mean what he received as payment holds and retains any value.
HHH , any thoughts on tapering ? My view , it is a sham . $15 billion is pennies when the amount is $120 billion . Powell will find a roundabout way to conjure up the amount if their is a
taper tantrum . Not going to have even a minor effect leave alone a major effect . DOA .
There is a short set up on all three major US indices. DJI, S@P500, and NADAQ-100 currently. This is likely going to be a major sell off. Starting next week. Yeah I just shorted the hell out of US stocks today.
I don’t think QE matters anymore. Only government put matters now and currently we don’t have one.
That does not address what you said about capital gains. A foreign country is at no risk of US capital gains. You brought it up.
As for this dollar conversion obsession, a Russian choice to accept only bitcoin for oil requires only one conversion for their society — a conversion of Bitcoin to rubles, which need not be on any currency exchange.
This is about purity. Wozniak has it right. The only thing preventing this is fear of upheaval, and Russia likely would choose to avoid upheaval because they slowly evolve dominant as things are. Upheaval is less relentless and more unpredictable.
The only thing preventing bitcoin from becoming a currency is that transaction costs are much to slow and expensive.
Bitcoin reminds me of the Linux Desktop.. For years the geeks preached how it was vastly superior to Windows Desktop and would soon replace it. But this claim ignored what users really wanted.
The same is true of bitcoin, which is very much a solution in search of a problem.
Who do you think is holding most of the Bitcoin? Almost every bit of the price appreciation you see in Bitcoin is unrealized capital gains. These guys are holding positions long term. But if you tax them. They have sell because the gains are so large.
Why would Putin accept something as payment that can lose half it’s value in less than a week? That was my point.
Made a chart but can’t publish it.
Alimbiquated,
You may have to reduce the resolution of the chart so that the file size is less than 55 kB.
I was thinking about price volatility and applied an algorithm that separates trend from seasonal changes. I applied it to the EIA data set Europe Brent Spot Price FOB (Dollars per Barrel).
The algorithm calculates the seasonal price variation and removed it and the non-seasonal annual changes from the raw data to get the trend.
This is a closeup of the seasonal variation in price. The model is multiplicative so the values are percentages.
The interesting part is the residual changes, which shows three big shocks, in 1991, 2008 and 2020.
Also it’s interesting that we seem to have entered choppier waters after 2007.
Alimbiquated,
Thanks. I usually fucus on annual average oil prices which would tend to smooth out seasonal changes.
Here is a chart of the annual change in real oil price (in percentage terms) from BP Statistical Reviw of World Energy 2021(annual average real oil prices.) Can you define the residual in your chart for us a little more precisely? Thanks.
From 1972 to 1985 there were few occasions where annual % change in real oit price exceeded 20% up or down, since 1986 swings in annual average real oil price have rountinely been more than 20% higher or lower, a very difficult environment to operate in.
It is a “multiplicative decomposition”. the idea is
Value= trend * seasonal * residual
Estimate the trend with rolling averages or regression.
Divide value by the trend to “detrend” the curve. The result should be about flat.
Calculate the seasonality e.g. by averaging each month of the detrended values and dividing by the average of the whole detrended series.
Then find the residual values:
Residual = Value /(trend* seasonal)
They are the variations that can’t be explained by the trend or the seasonality.
Thanks.
Same idea with Alaska North Slope crude output data. Notice that the residuals are growing relative to output.
Trend * Detrended = Output
Residuals = Detrended / Seasonal
Notice that most of the residuals are short term output reductions for one-off reasons. Seems logical.
Alaska decline and Venezuela uptick.
Venezuela’s oil exports bounce to over 700,000 bpd in Oct -data
https://www.reuters.com/business/energy/venezuelas-oil-exports-bounce-over-700000-bpd-oct-data-2021-11-02/
I recently read an article that Schlumberger is drilling something like 96 vertical and diagonal wells in Iraq’s Qurna 1 large oil basin. Exxon-Mobil pulled out and now several Chinese firms are taking over oil production. Of course, a huge sea water injection pipeline is needed to boost up the oilfields pressure. Supposedly, there is 40 billion barrels of oil in this field. Question for the commenter’s here is XOM must of pulled out for good reason and can the Chinese really pull off such a huge project?
In Iraq the outside operators get a flat fee , as little as one or two dollars a barrel. The operating costs are high because of security concerns so western companies can’t make a profit. ExxonMobil put in a proposal for the water injection project but they were kicked out, I suspect because they wouldn’t pay the bribes, which they are scrupulous about, whereas I get the impression that the Chinese just consider them a cost of doing business.
Officially Iraq has 142.50 billion barrels of reserves. As this number is likely exaggerated, it follows that the 40 billion barrel number for Qurna 1 is part of the exaggeration. What probably happened is that Exxon eventually figured this out and as a consequence pulled out.
This has maybe been posted before but indicates that even if Russia does the best it possibly can it has passed its peak: https://ogst.ifpenergiesnouvelles.fr/articles/ogst/full_html/2019/01/ogst190118/ogst190118.html
My comments keep getting deleted so I had to chop out some of the above.
The accelerating permafrost melt in Siberia and its probable effect on the aging infrastructure there might start impacting production soon (I’m sure Putin will have some stern stuff to say when the first pipeline ruptures and makes the collapsed diesel tank a couple of years ago look like a spilt pint of beer on a boozy Saturday night).
After some tests it looks like word press objects to the word n a m e
Though you had gone all Yoda for a minute.
hm, annoying it is
Sorry George,
I will correct that.
George,
Problem with “name” now fixed.
thankyou
Hypothetical scenario-
The USA supply of crude oil declines 50% by 2040, which is only 18 years away.
A few comments on the ramifications for this country. Feel free to add your own if inclined, or correct my comments if you think they are fallacious (is that a real word?)
-if the decline is gradual it can absorbed without causing an economic crash
[the US uses much more crude oil/capita than many other industrialized country, and wastes vast quantities]
Also note that combined use of crude oil for end products of petrochemical feedstock, asphalt, and lubricants are less than 5% of total as of year 2020, for example. These kind of products will not disappear.
-if the supply declines, the price will rise (all other factors being stable- haha), and the higher price will encourage more conservative/cautious use of the products. And yes this means changes, but is not the ‘end of the world’. Hardest hit will be the poorest of workers, or of course those who don’t work and aren’t rich.
Also harder hit will be sectors that rely on high oil use but are optional or discretionary activities.
-higher prices or oil shortage will stimulate more rapid shift to electric transport, and eventually an upgrade to the nations electrical infrastructure, despite political gridlock. Other forms of energy production will be prioritized simply on a cost/security basis [such as the offshore wind projects now in the planning stage- 30GW/77,000 projected jobs].
-these trends will happen regardless of any carbon concern or pricing (such as carbon tax)
-natgas and NGL’s will continue to be a robust industry far beyond the horizon of this time-frame (2040)
-other countries will vary widely in their prospects for successfully making these adjustments
-the US will likely absorb this crude oil decline in a very awkward and stuttering manner. A lack of grace, foresight, planning and smooth execution of projects is generally the American way.
These comments are just offered up as food for thought on the trends that are likely to happen in the intermediate term.
side note- the new anti-viral treatment pills by Pfizer and Merck will likely mean that the vast majority of the pandemic negative affects on economy [and energy demand] will be in the rear view mirror within a year, assuming the initial study result pan out on larger scale.
At what point do the oil producing states simply decide to keep it for themselves. Texas running pick up trucks as Virginia reverts to pony and trap.
Isn´t it not quite a few missile silos in ND and Montana? So I guess they would be supplied with locally produced oil if TSHTF. But thats a really, really worst case scenario, unlikely to get to that point, I hope.
However, on a grander scale, conflicts over oil and gas might pick up quite a bit, and the positioning in Africa and the Arctic has barely started. So the development will be really interesting to see, quite possibly with the US as an example to study, hopefully it will not get too bad… But as stated earlier, I´m in the acceptance phase, just in for the ride.
I have wondered similar things Lighsout.
And this country could fragment (over all sorts of issues), and a state like Texas could attempt to ‘nationalize’ its energy- keep it within the borders similar to what it currently does with electricity.
I don’t think that is a likely scenario however. The federal government and other states probably wouldn’t tolerate it.
And energy tends to flow towards money (demand).
The Texas energy industry will make much more money selling energy nationwide rather than just local.
Regarding the Texas electrical grid [ERCOT] isolation, I would be surprised if that lasts all that much longer. Too many opportunities and advantages to regional interconnection as the future unfolds.
I suspect others may see this all very differently.
One more thought on this- an oil producing state like Texas, who also happens to have have outstanding solar and wind reserve, may choose to electrify the light transport sector so as to have more residual oil product available to sell for more important (harder to replace) uses. I think it is likely that the economics of the situation will drive this. Leaders will follow.
Of recent I am observing a spike in articles and thoughts on the breakup of the USA across all media . What has changed ? Curious for some one based in Europe / India .
There is a lot of complex facets to this issue.
Here is one simple perspective-
There has been a steady and strong drift towards extreme partisanship.
The middle ground of political discourse has severely declined.
Its become black or white- which side are you on.
Your news source defines your belief tribe.
These things are nothing new in human discourse- just progressively worse in past few decades in this country.
You could get thousands of other answers, I am sure.
I think the political divisions are likely to be highly destabilising in the USA (is in many places but worst there) and exacerbated by worsening energy shortages and environmental impacts, especially as they start impacting food supply and leading to large numbers of migrants ( either internally oor coming from he south). Recent events would certainly reinforce the feeling that you are heading for demagogue led kakistocracy/kleptocracy/ochlocracy at all government levels from municipal to state to federal. Umair Haque thinks the US is hading anywhere from racial segregation to civil war and holocaust (https://eand.co). Cities will increasingly become blueberries in the tomato soup (if I remember correctly that is how Austin is described) and may start feeling like siege towns.
Putin and Xi will be doing their best to ferment the unrest and will find it easier as the collapse gets going. The number of guns, the number of different law enforcement agencies and the entitled individualism that the population generally espouse just make things more fragile, so I’d not be surprised at any level of strife that comes along.
But for all that you will still be better off than many places which are going to find themselves bereft of fuel and then food, I don’t know if by 2040 but by various studies the world is going to be somewhere between seriously short and running on empty for energy, minerals, soil, water and rubbish dumping room in thiriy years and they are not going all to be impacting uniformly so many areas will be (are) feeling them long before 2040.
As a bell curve move linearly ten the extremes move exponentially. Pick some aspect of environment/energy impacts and think how much worse the extremes now are than 2020. By 2040 it will be that number squared, by 2060 cubed. Recent studies on tipping points show you can go from smooth (even exponential) to step changes of unknown size and the very larest studies are showing how one tipping point can and will kick off others (e.g. Greenland melt inevitably leads to West Antarctic melt)..
George
I agree it’s going to get interesting. The FED can’t print their way out of it. XI has troubles of his own with a land too vast to control and Putin will probably be living in an insect infested swamp.
George- to your point on instability. I truly think that the US would have recently split into at least two distinct nations if there was a neat zipper to make the dividing line.
An earlier version of this happened in the late 1850-60’s when part of the country wanted to keep the slavery system of humanity/extreme racism in place indefinitely. That time the country barely held together.
Now the many tribes are scattered among each other. It would be a civil war like in the Balkans [worse in fact].
There would be no nation left. Just some scattered warlord dictatorship type territories, or something like that. Third world/failed state all.
Careful what you wish for folks.
What happens to electricity prices as the electric vehicles fleet increase sufficiently?
The price will clearly increase. Will we then put a tax on electric cars so that those who use them pay extra?
This idea of moving to electric cars in a bad one. I support electrifying public transportation, but for the rest we ought to walk or bike to where we need to go.
Seppo,
As wind and solar output increase and costs decrease due to economies of scale, electricity prices are likely to decrease rather than increase relative to a World that relies primarily on depleting fossil fuel, where elctricity prices are very likely to rise (even with no increase in electricity use from EVs).
Also much of the charging of EVs can be done during low usage periods where there is plenty of excess grid capacity. In addition, EVs charged using wind or solar power, waste far less energy than ICEVs typically about 3 times less energy waste.
Many less densely populated areas of the World have very limited public transportation, I agree that in urban areas using electricity for public transport makes more sense, also walking and biking is nice, but if the market is 5 miles from home and there is snow on the road and no public transport (in a suburban or rural area) it is a less realistic option.
EVs and all road vehicles will likely be taxed based on gross vehicle weight and miles driven annually when vehicle is registered each year, rather than by fuel taxes.
Electricity will be priced based on demand, high demand periods will have higher prices than low demand periods.
Americans think roads are paid for by gasoline taxes, but they aren’t in America. Nobody else in the world even tries. It isn’t a policy that makes any sense. In fact one of the biggest problems in American city planning is the odd idea that any road you can find government money for is a good idea. This is based on the delusion that the money comes from drivers so it it is a good business deal. In fact roads should be built to support a wide variety of things, and not just as a transaction between drivers and governments.
> walking and biking is nice, but if the market is 5 miles from home and there is snow on the road and no public transport (in a suburban or rural area) it is a less realistic option.
Finns seem to cope well. There is a lot of public transport and biking there although it is a cold, thinly populated country.
Alimbiquated,
I have never visited Finland, but my guess is that they probably drive cars there.
Well yes, but the point is that Finns can and do ride their bikes five miles in the snow. so it is not an unrealistic option.
Here’s an interesting video on exactly that topic.
https://www.youtube.com/watch?v=Uhx-26GfCBU
Why Canadians Can’t Bike in the Winter (but Finnish people can)
I think this is important because a lot of assumptions about how much oil we need are based on a mindset trapped in extremely bad city planning and massive misspending of public funds based on that bad planning.
Alimbiquated,
The cities and suburbs that exist is what we have. How old is the average Finnish person who rides to the grocery store (10 miles round trip in the snow at say -15 C. That’s a typical winters day where I live, there are some who ride their fat bikes in the snow, typically they do this on trails designed for this with no cars. Generally there are no grocery stores on such routes.
Hickory, a crude oil decline of 50% by 2040 is only 4% per year. I think we can handle that.
John, 4% can be handled?? . A small hole can sink a big ship .
John- yes I agree that we could handle that, especially if the issue was approached in a half-way rational approach. The decisions and the management of the situation is the big wildcard.
The US has a couple huge advantages in this battle. One being the current state where we have so much unimportant and excess use of oil currently in the system. Very few countries have so much slop to work with. And secondly, we have huge solar and wind reserves that could be deployed to serve just about all the light transport requirements of the country. And although some people on this blog scoffed when I said there is now a viable system to replace petrol/ICE for light transport earlier this year, even they will recognize the blatant truth in that staring them in the face before too long. These factors would not have been relevant at the start of the LTO production tsunami. Prior to that production wave starting in the Bakken, this country was in an extremely vulnerable state in regard to transport fuel supply and costs- without option. The technology and costs have changed dramatically, even if not all people have noticed.
On the other hand, the US also has huge headwinds. Much of it mental [fill in your own blanks here]
But also an extremely dysfunctional political system, and a genuine lack of any sense unified purpose or identity. Its just a couple dozen tribes with alliance to themselves and their media kin.
So, it will be haphazard effort at best.
Hickory,
The neoclassical economics mythology suggests we can all act as individuals in our own self interest without regard to the interests or needs of others and the magic of the market will create a perfectly efficient allocation of resources with government regulation (interference in the efficient market) only necessary in the case of positive (health care and public transport) or negative (pollution, including carbon emissions) externalities.
Note that I do not subscribe to this mythology, but it is the one that has infected the political economy of the US particularly since 1980 and is the reason we are so backward in comparison to most industrialized nations.
Permian rig count for horizontal oil rigs increased from 247 to 257 W/W, at 1.3 wells drilled per rig, this would be enough rigs for 334 wells drilled per month. Chart below has April to Nov 2021 trend, an annual rate of increase of 64 rigs per year, or about 1.2 rigs per week.
Dennis
The net oil rigs was was 5. +10 Hz. -4 Vertical. -1 Directional. Removal of the Vertical rigs is significant because they do the initial deep drill for the horizontal rigs. Note that in the previous four weeks, the rig count was essentially flat at 247/248 rigs.
Good, Ovi. Factual.
In the Permian, at least three strings of casing are now set and vertical rigs being used to drill surface casing holes (2400-3000′) are NOT capable of setting the intermediate string (8,000′) nor drilling or running 5 1/2 casing to the toe of the lateral. Day rates have come down so the surface casing rigs are not being used as much anymore. Some HZ wells in the Midland Basin require 4 strings of casing including a liner across the under pressured Spraberry; 80% of Permian wells are now done with one rig, IMO.
In Texas vertical rigs are drilling mostly conventional prospects that have nothing to do with HZ wells. One can’t accept the Baker rig count for vertical rigs without cross referencing it to TRRC permit applications. There is a life after shale oil, believe it or not, and some of us are plowing ahead. More and more conventional prospects are being drilled these days by smart people who understand that in the end, the only oil the world will need will be the long lasting stuff already drilled, not the stuff that declines 86% in 32 months.
The attempt to predict rig count based on a linear plot the past 14 months is stupid. Prices have gone up, wait until the go down. Predicting rig counts is almost as stupid as suggesting CLR bought that goat pasture in Pecos county to re pressurize it. That’s a goodun.
Was saying the total increase in rigs this week were all HZ tight oil rigs dumb, or intentional?
3Q21 earnings are mixed bag of non-GAPP bullshit that nobody at oilprice.com could even remotely decipher. Hedge losses were spectacular again, the money spent on M&A, or the equity diluted in stock and/or additional stock issuance for M&A, is not even taken off the bottom line anymore that’s how bad the lying has gotten. It made things look a lot better than they were. Debt deleveraging was a wash. Everybody has got a pile of cash, so whoop. D&C costs are up 25% in 2021 and going up another 25 in 2020, at least.
Well productivity IS declining in the Permian; lost in the need for people to prove themselves right, and others wrong, is the fact that productivity is declining in spite of much longer laterals, more sand loading, much more exposure to available…pressure depleted rock.
Every barrel of HZ tight oil now added to US production levels, will simply be exported to foreign countries. Cheerleading for THAT, given what we know about the current state of affairs in the Bakken, DJ and Eagle Ford Basins, and problems in the Permian with GOR, WOR and remaining (truthful!!) drilling inventory, is almost un-American.
Mike,
So vertical rigs are not used very much for tight oil wells currently (only about 20% of tight oil wells use a vertical rig in your estimation. Is that a correct understanding?
Baker Hughes has a few directional oil rigs (2 to 4) operating in the Permian basin. Can you clarify the distinction between a horizontal oil rig and a directional oil rig, or are they essentially the same (for those used in the Permian basin). Thanks.
Dennis
I found this comment interesting in Mike’s response. You had raised this question in a previous comment.
” 80% of Permian wells are now done with one rig, IMO.”
Ovi, the purpose in something as important as tracking rigs (Baker) would be negated if two rigs were counted to drill one well.
Prices have improved, it makes sense that some vertical conventional rigs have gone back to work. I can drive to five I know of in S. Texas today. Vertical rigs also drill SWD wells and there are a bunch of those getting drilled everywhere to dispose of new, produced water. There may be more vertical rigs drilling surface casing for HZ tight oil wells, they are not counted as active rigs, not in Texas. In the Eagle Ford, for instance we run two strings of casing, surface and one production string thru the radius all the way to the lateral toe. In that situation it makes sense that small vertical rigs might drill and set surface pipe on a multi-well pad. Not so much in 3 string areas like the Permian and Bakken. I do not believe reported vertical rigs have anything to do with HZ tight oil wells. Directional rigs are NA as to HZ wells. I suppose if this is all controversial the thing to do would be to contact Baker Hughes and ask.
Elsewhere, I am a little confused as to how so many almost, “defiant” predictions about future tight oil production and, for instance “rig efficiencies,” can be made without understanding the very basics of oilfield operations and what rigs actually do. I guess sometimes knowing that actually interferes with the pre-conceived intent of the model; beats me. People with oilfield knowledge here eventually get lectured off for some odd reason.
Mike,
Obviously you know more about this than any of us here.
I base the rig efficiency on the data I have, it is completion per month per operating rig, one does not need to know every detail to estimate this number. I use Enno Peter’s estimate for the Permian of 1.3 wells per rig per month operating, he may get this estimate from you or by just looking at the data, which he does a better job at than me.
My “defiant” (though I do not think of them as such) scenarios are simply a set of assumptions about the future applied to a model, and using similar assumptions to those by Enno Peters, my model is far more conservative than his for similar sets of assumptions about the future.
It may well be that my model is too conservative, I generally assume the future will be somewhat similar to the past, often such an assumption is incorrect.
On the rig counts, I believe they report the average number of rigs rotating for the week in question.
I ave always assumed oil rigs are drilling oil wells, gas rigs are drilling natural gas wells, and miscellaneous rigs are drilling disposal wells, but I may well be incorrect.
I simply report the numbers in the Baker HUghes pivot table.
at link below it is the second line, we can filter by basin, trajectory, and drill for to get all horizontal oil rigs rotating in the Permian basin for example as is reported in my earlier chart.
https://rigcount.bakerhughes.com/na-rig-count
Ovi,
Yes that information was helpful, it als seems based on Mike’s more recemt comment that there may be less use of vertical oil rigs in the drilling of horizontal oil wells in the Permian basin than in the Eagle Ford, if I understood Mike’s comment correctly.
Ovi,
We have conflicting information from LTO survivor and Mike Shellman on the use of vertical rigs in the Permian. I focus on the horizontal rigs, because that is what is most relevant for tight oil wells. The horizontal oil rig count increased from 247 to 257 this past week.
Mike,
Note that I said nothing about future rig counts, only what the trend in horizontal oil rigs has been from April to November.
Future rates of increase or decrease are unknown.
Ovi,
Check out the rig count that Enno Peters uses for the Permian basin at link below. As I understand it Enno gets a lot of insight from Mike Shellman.
https://public.tableau.com/shared/BPFQHZ88W?:display_count=y&:origin=viz_share_link&:embed=y
Enno has Permian rigs at 257 from Nov 2021 for his supply projection, this coincides with the horizontal oil rig count from Baker Hughes.
Dennis
Is Enno’s projection for Permian output, which shows it is rising slowly, confirming that the rise in Permian output shown in the DPR is essentially mostly due to the completion of DUCs?
Ovi,
Yes DUCs that get competed will raise output. As rig count continues to rise the wells drilled will rise to the level of DUCs that are completed. Enno has 324 well completions per month in Permian supply projection, EIA estimates around 400 completions, Enno’s estimate is basically the number of wells drilled (he assumes DUC count remains unchanged in his supply projection), so if both the EIA completion estimate and Enno’s estimate for wells drilled is correct, we would currently see DUC count decrease by 76 in November, if rig count continues to increase the delta DUC count will gradually decrease to zero (if completion rate remains at 400 per month.)
Ron has pointed out correctly that every well completed was a DUC before completion. It is the change in the DUC count month to month that is important, this will decrease in absolute value to zero and then will likely increase, if production ramps up and history repeats the pattern of 2017 to 2020.
There are claims that spending in tight oil plays will increase, this remains to be seen.
https://oilprice.com/Energy/Energy-General/US-Shale-Patch-Reports-Blowout-Earnings.html
Excerpt:
…
After a turbulent period characterized by mounting debts, dwindling cash flows, and awful share performance, the U.S. shale patch has roared back to life with the current earnings season, proving that the worst is finally behind the rearview mirror. Earnings are on tap this week for U.S. independent oil producers, with Continental Resources (NYSE:CLR), Devon Energy (NYSE:DVN), Diamondback Energy (NASDAQ:FANG), EOG Resources (NYSE:EOG), and Occidental Petroleum (NYSE:OXY) all reporting stellar Q3 2021 earnings.
…
New post on tight oil by Enno Peters at link below
https://shaleprofile.com/blog/us/us-update-through-july-2021/
Of special interest is the chart below,
There has been a slight decrease in Permian productivity per 1000 feet of lateral since 2018, but the decrease has been marginal based on chart below. See the link above for a better resolution image.
Dennis.
I haven’t looked at shale financials because I don’t have the time to do that right now.
However, keep in mind oil companies had a very rough 2020, preceded by a weak 2019, a decent 2018, a weak 2017, a very rough 2016 and a rough 2015.
A few good months doesn’t just make those bad years go away.
Sustained strong prices for a few years is what is needed in my view. I’m thinking $70+ WTI.
I am not confident about that happening. Politicians are having a cow about $80 WTI. Mind boggling considering we were higher than that 2011-14.
Shallow sand,
I am aware the tight oil industry did not do well from 2015 to 2020.
I imagine things are currently better for most oil priducers at $80/bo than they were in 2020 at $40/bo.
You can correct me if I am mistaken.
I agree higher oil prices are what is needed. I think average annual WTI oil prices will be sustained at $80/bo plus from 2022 to 2028 at least.
Dennis. Yes, much better.
Costs are rising. But still, we are doing well right now.
My point is that there is still some financial repair to do after 6 mostly difficult years.
You have more confidence in high future oil prices than me.
Neither of us knows what they will be. If we did, we wouldn’t be posting here, lol.
Shallow sand,
Glad to hear things are going well. I hope costs stabilize, I assume they are rising at a slower rate than oil prices. Yes there will be financial repair needed, I agree.
Does anybody recall what the average US price for gasoline was when WTI hit $147/bbl in 2008?
Ovi.
EIA has June and July, 2008 at $4.11.
When oil prices were low post 2014, many states raised gasoline taxes.
According to EIA the real gasoline price was $5/gal in 2021$ in July 2008. Highest average annual price was in 2012 at $4.26/gal, in 2011 it was $4.23/gal and in 2013 the gasoline price was $4.05/gallon (all prices in 2021 US$.) In 2006 the average crude price was around $80/bo (2021 $) and average gasoline price was $3.45/gallon (in 2021 US$).
From the information I have (from EIA real prices viewer) gasoline nominal price was $4.06/gallon in July 2008.
https://www.eia.gov/outlooks/steo/realprices/
Dennis.
Read an article written in 2019 which stated 31 states raised gasoline taxes from 2013-19.
Good point about using 2021 dollars too. We aren’t making nearly as much net income at $80 WTI in 2021 as we would have made in 2008, even though there was large cost inflation in the oilfield in 2008.
I think you and I agree that the political tears about $80 WTI are overly dramatic.
Shallow sand,
Yes Biden and the Democrats are correctly worried that they will do poorly in Nov 2022, if gasoline prices remain high so they want to claim they are doing something about it.
They would be smart to pull the trigger on any releases from the SPR until Sept/Oct 2022, doing it too early will not help them. In any case nothing will get done after Nov 2022 when Republicans take control of both the Senate and House. By 2024 maybe people will be accustomed to higher fuel costs (seems doubtful), so maybe Trump will be back in 2024.
Shallow sand,
Taking US average state taxes and adding to federal tax on gasoline, in 2011 it was 41.4 cents per gallon and in 2021 it was 47.3 cents per gallon, so about a 6 cents increase on average ( this is not weighted by fuel use, I don’t have the data for that).
Data from link below
https://www.taxpolicycenter.org/statistics/state-motor-fuels-tax-rates.
At $3/gallon, 6 cents is kind of a rounding error, imo.
Looking at the four major tight oil basins in the chart above the normalized productivity per 1000 feet of lateral has only decreased significantly in the Eagle Ford, with a slight decrease in the Niobrara and relatively flat productivity in Permian ans Williston from 2018 to 2020.
Future productivity is unknown. Note that I have been predicting decreasing productivity in the Williston basin since 2013, the only year I was correct was 2018 to 2019, all other years productivity was either higher or flat when normalized for lateral length. The Permian may be different, but so far things have been flat.
New post should be up in roughly 18 to 24 hours.
A new thread on Non-OPEC oil supply has been posted.
https://peakoilbarrel.com/july-non-opec-oil-output-adds-to-world-supply/
An open thread for Non-Petroleum comments has been posted.
https://peakoilbarrel.com/open-thread-non-petroleum-november-7-2021/