A guest post by Ovi
Below are a number of oil (C + C ) production charts for Non-OPEC countries created from data provided by the EIA’s International Energy Statistics and updated to July 2021. Information from other sources such as OPEC, the STEO and country specific sites such as Russia, Norway and China is used to provide a short term outlook for future output and direction for a few countries and the world.
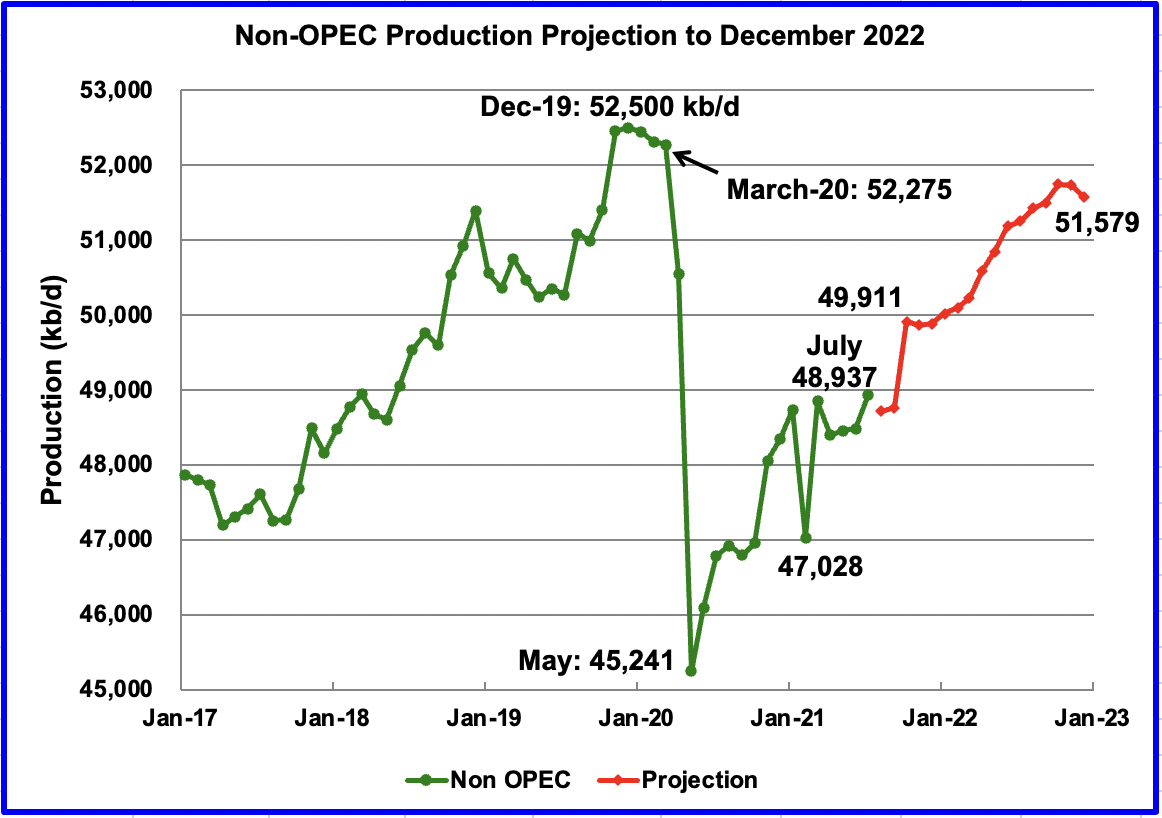
July Non-OPEC production increased by 458 kb/d to 48,937 kb/d. The three biggest contributors to the increase were Brazil, 142 kb/d, UK, 139 kb/d and Norway 85 kb/d. Russia only added 42 kb/d.
Using data from the October 2021 STEO, a projection for Non-OPEC oil output was made for the time period August 2021 to December 2022 (red graph). Output is expected to reach 51,579 kb/d in December 2022, which is lower by 411 kb/d from the previous post. Each successive STEO report has reduced the forecast December 2022 output.
In the previous October report, the difference between the peak production in 2019 and 2022 peak was 364 kb/d. In the current report, the difference has increased to 921 kb/d. As noted above, each successive STEO report has reduced the December 2022 forecast output.
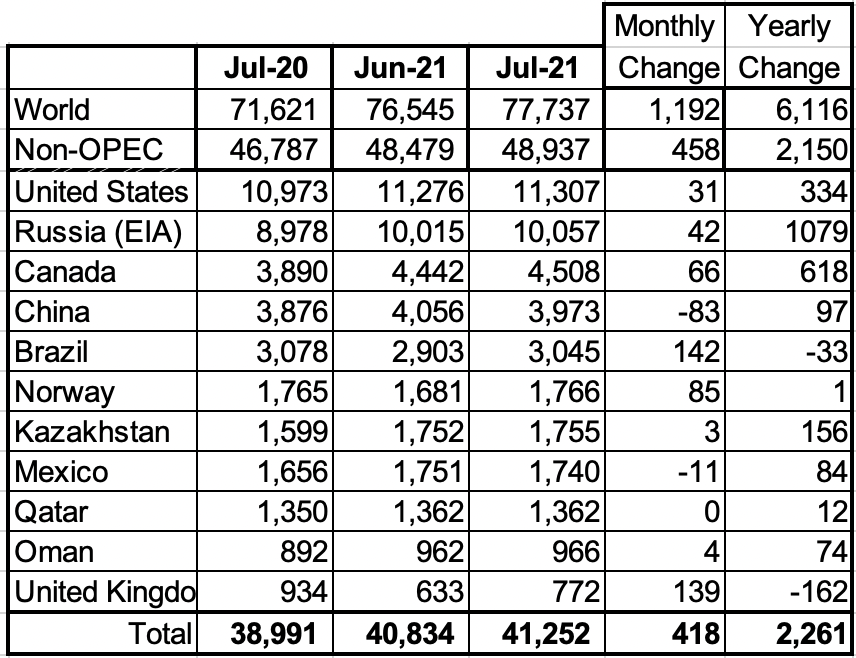
Above are listed the world’s 11th largest Non-OPEC producers. The original criteria for inclusion in the table was that all of the countries produced more than 1,000 kb/d. The last two have currently fallen below 1,000 kb/d.
In July, these 11 countries produced 84.3% of the Non-OPEC output. On a YoY basis, Non-OPEC production increased by 2,150 kb/d while on a MoM basis production increased by 458 kb/d to 48,937 kb/d. World YoY July output was up by 6,116 kb/d.
Production by Country
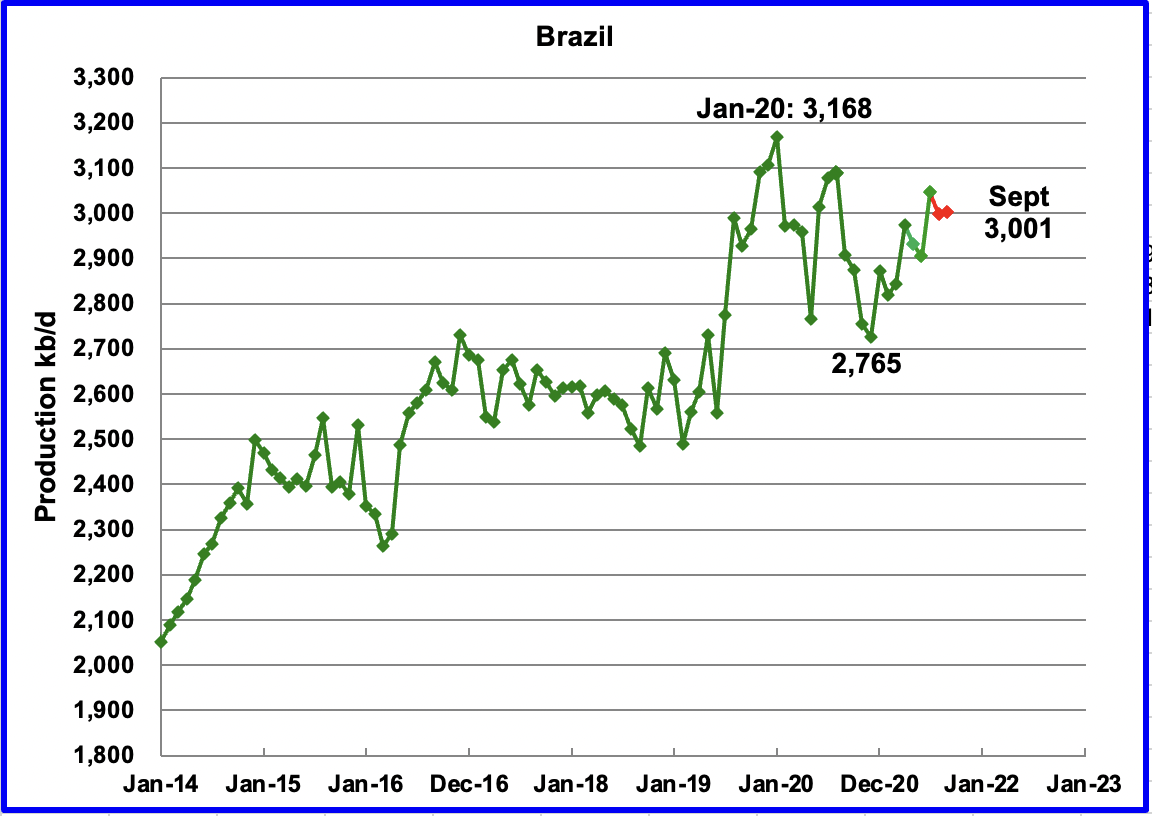
The EIA reported Brazil’s July production increased by 142 kb/d to 3,045 kb/d. August dropped to 2,997 kb/d according to this source and then increase by 4 kb/d to 3,001 kb/d in September. (Red Markers).
According to this source: “The field with the highest production remained the Tupi field, with 1.22 million boe/d and the highest production of both oil (948,000 barrels of oil per day) and natural gas (43.12 million cubic meters per day) in the country. The biggest producing well was 7-BUZ-10-RJS, in the Búzios field, which, in the period, registered 67,500 boe/d, the fourth biggest production in history by well.”
Brazil’s government is forecasting that the country will be pumping 5.3 million barrels of oil per day by 2030 facilitating its ability to substantially boost exports, according to this source. Note that close to 1 million barrels per day of this would be oil equivalents. I wonder if they have taken decline into account. There has been no progress since January 2020 and they are not part of OPEC +.
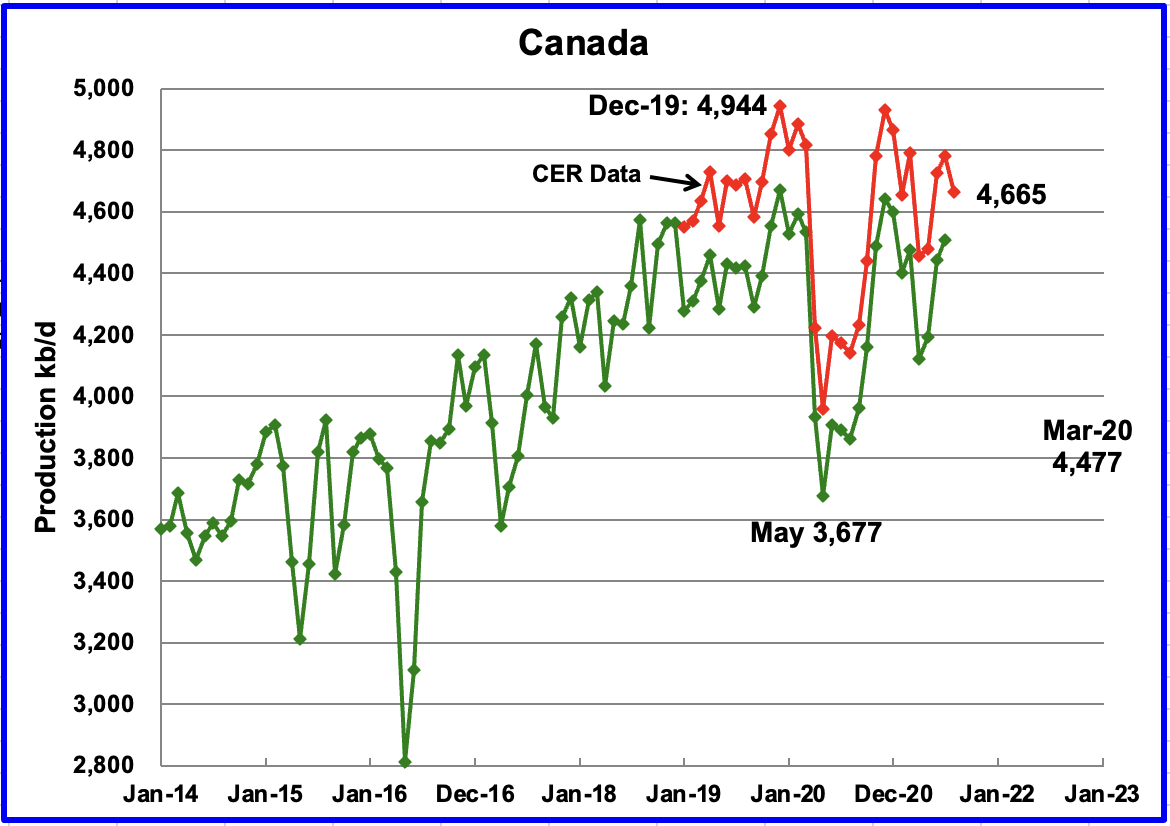
According to the EIA, July’s output increased by 66 kb/d to 4,508 kb/d. The increase was due to some oil sands cokers coming back online and completion of maintenance.
The Canada Energy Regulator (CER) reported August production was down by 118 kb/d to 4,665 kb/d. The EIA’s oil production estimate is lower than the CER’s by between 250 kb/d to 300 kb/d each month because of the difference in how Canada and the US report condensate.
On October 1, the updated Enbridge Line 3 began operating to deliver crude to Superior Wisconsin. The new line delivers more crude and is safer since it replaces a 50 year old line.
While line 3 has gained much of the current attention in the press, Marathon has been quietly revising the Capline pipeline. This can almost be considered to be a Keystone XL replacement.
According to this source, Capline was the largest south-to-north flowing pipeline in the United States with a capacity of 1.2 million barrels of oil per day, but owner Marathon Petroleum has been working to reverse the flow since 2017, which would allow both heavy and light oil to flow from a storage hub in the U.S. Midwest to a major refining centre on the Gulf Coast. The company website notes that the reversal will be completed this year.
To use the Capline, Canadian oil producers will need to ship their crude on Enbridge Inc.’s Mainline pipeline system to the U.S. Midwest, and then switch to the Enbridge’s Southern Access pipeline connected to the Patoka oil storage hub, which provides direct access to the Capline and a straight shot to the refineries of the U.S. Gulf Coast.
In August Canada shipped 168.7 kb/d by rail to the US. This was 25 kb/d higher than in July.
Baytex Energy earlier this year announced a new find in the North West Clearwater area. This was an unexpected find in a previously unexplored area that uses SAGD to extract heavy oil. In this area, the oil flowed naturally and the area they found had the highest flow rates of over 800 kb/d. See page 23 in the PDF file, Baytex Energy. Further background here and here.
Baytex has wells in the Eagle Ford basin, along with those in Canada. Well decline profiles for one of their Canadian basins are shown on P23.
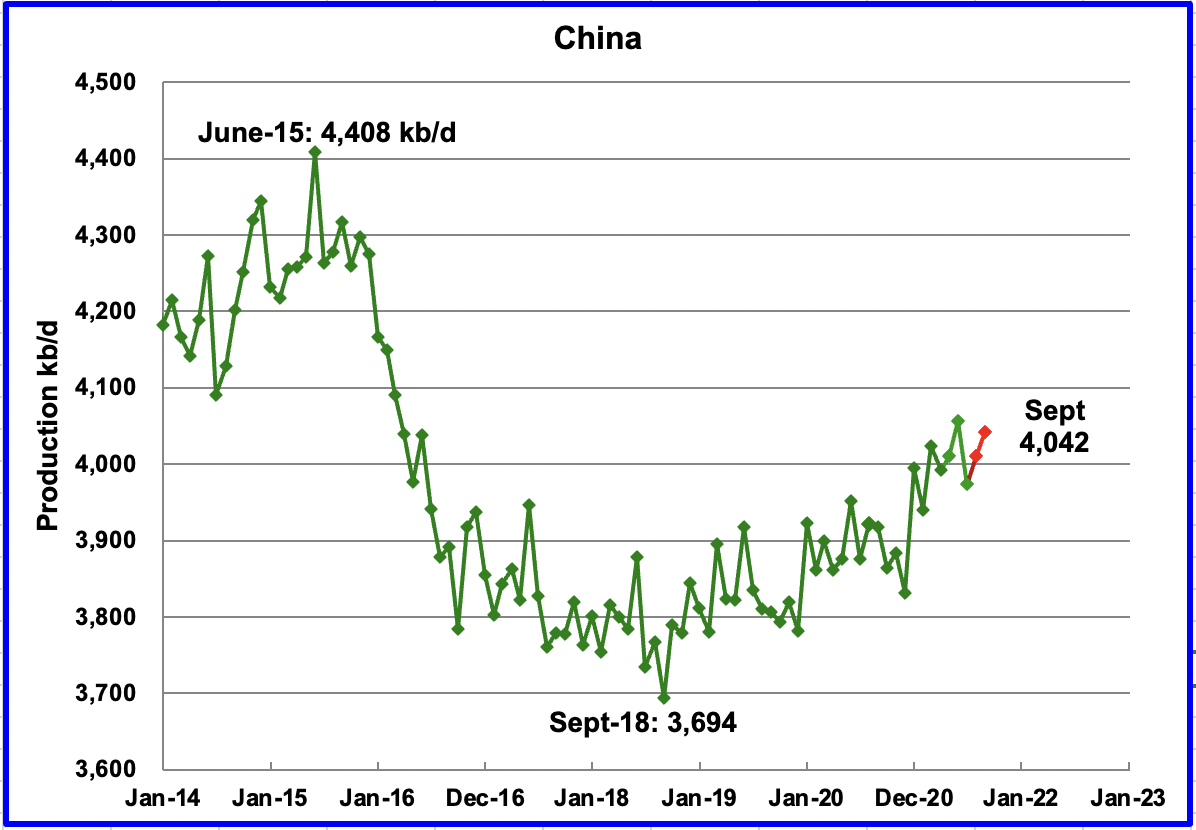
The EIA reported China’s July output decreased by 83 kb/d from June to 3,973 kb/d. In August it recovered to 4,010 kb/d and then to 4,042 kb/d in September according to this source. (Red markers)
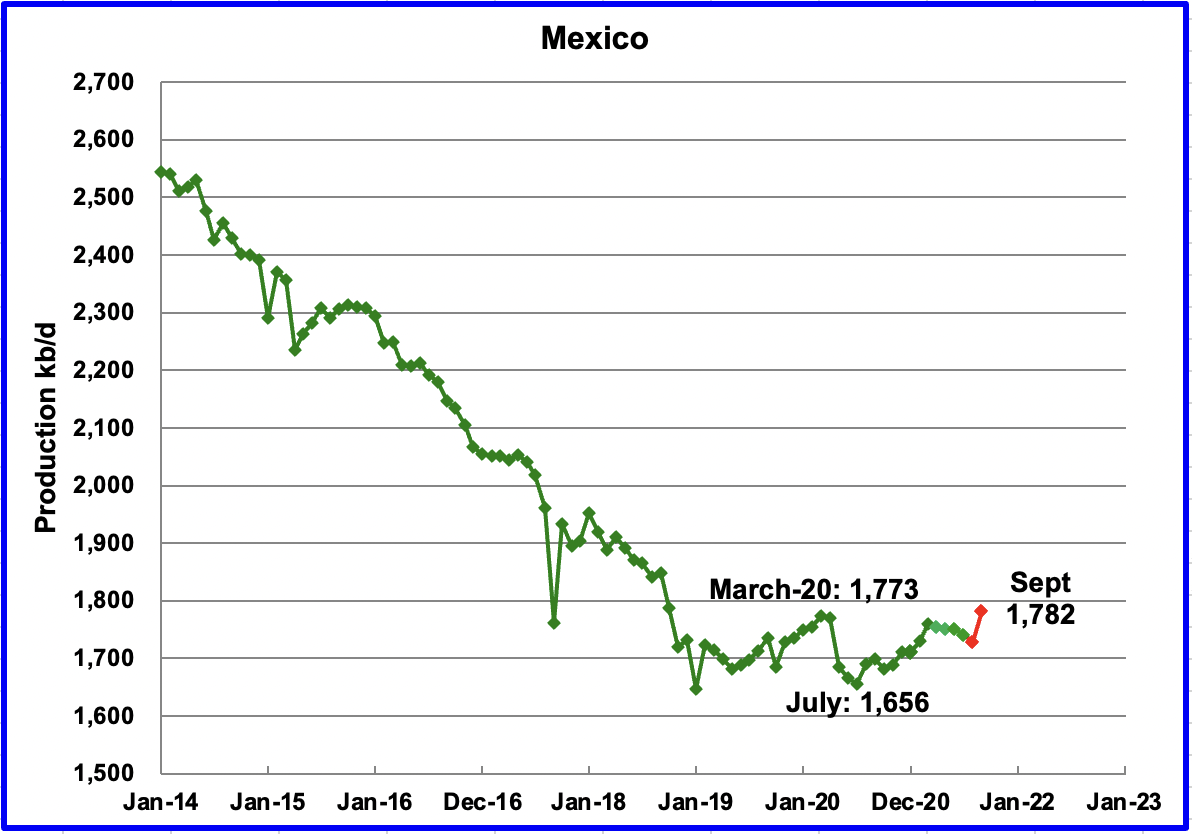
Mexico’s production, as reported by the EIA in July declined by 11 kb/d to 1,740 kb/d. Data from Pemex shows that August production was down slightly and then August rebounded to 1,782 kb/d. (Red markers).
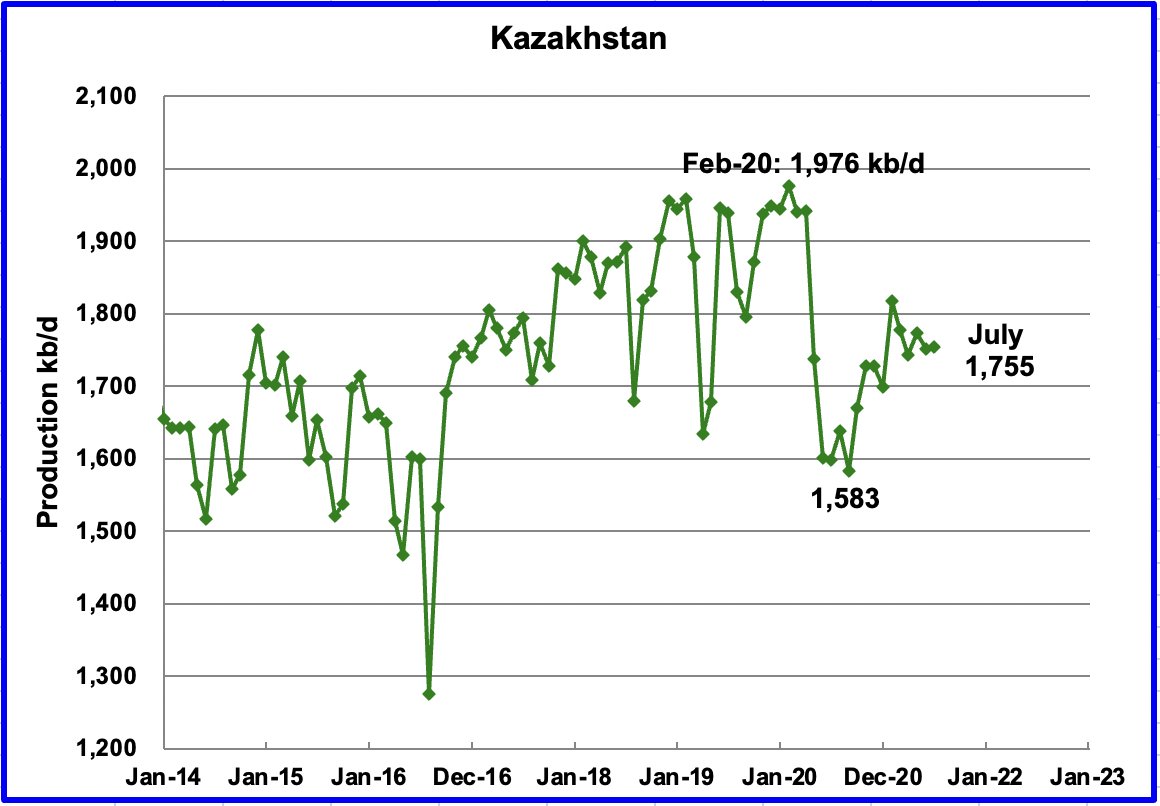
Kazakhstan’s output increased by 3 kb/d in July to 1,755 kb/d. Production was essentially flat due to maintenance in the Tengiz field.
According to this source, the quota for Kazakhstan under OPEC+ will be 1,508 kb/d in September, and each month production will increase by an average of 16,000 barrels per day,” said the Energy Ministry.
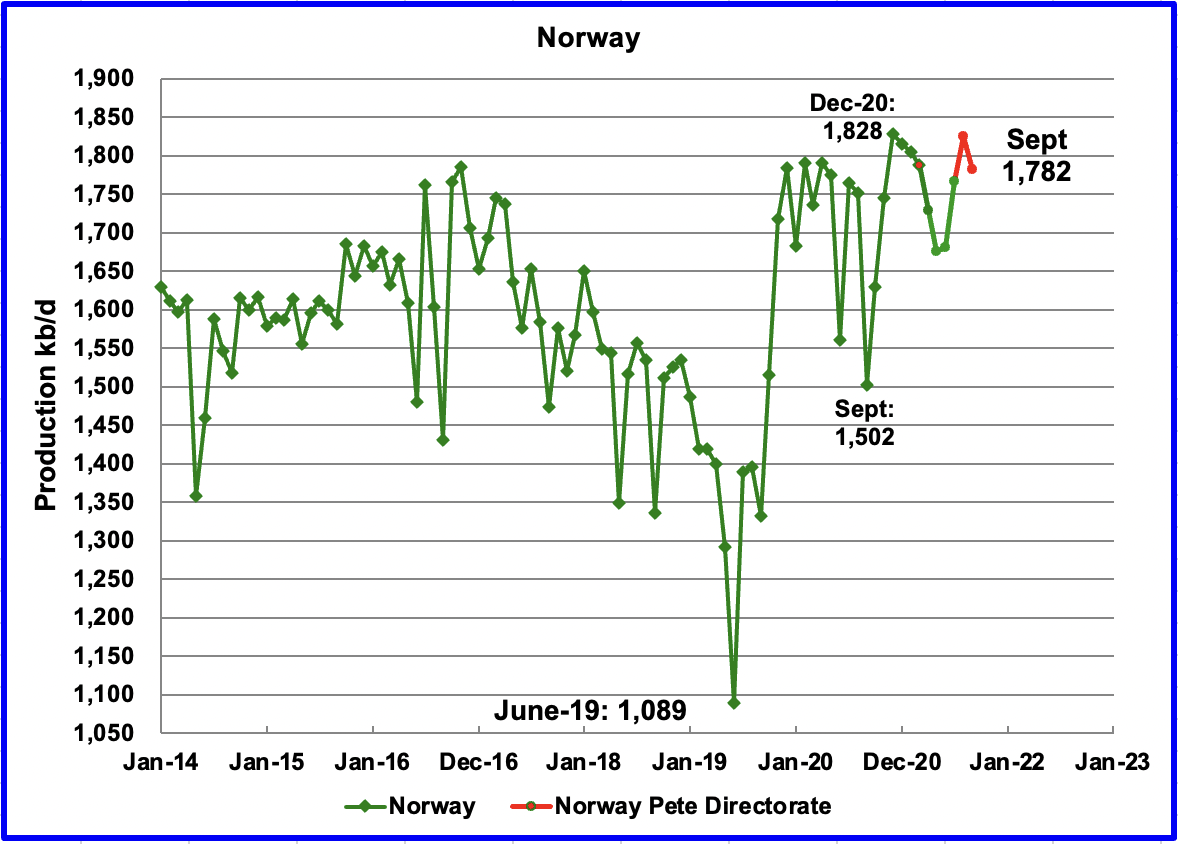
The EIA reported that Norway’s July production was 1,766 kb/d, an increase of 85 kb/d from June. The Norway Petroleum Directorate (NPD) reported that production in August increased to 1,825 kb/d and then dropped to 1,782 kb/d in September, red markers.
The NPD announced earlier this year that production would increase in the second half 2021 due to Equinor’s Martin Linge field coming on line in July. July and August did show a significant production increase by adding a total of 144 kb/d but September reversed the increase. The addition of the Martin Linge feels was not able to to surpass the previous high of 1,828 kb/d. What is the decline rate for these offshore wells, >5%?
Norway elected a new government in September and the new government plans a new direction for its oil and gas industry. The transition away from oil and gas will be a more gradual transition.
According to this source: “The Norwegian petroleum industry will be developed, not dismantled,” the two parties said in a joint policy document, adding that it will maintain the existing system of handing out exploration licences.
While climate change was a major issue debated during the campaign for parliament, Labour has said it wants to ensure any transition away from oil and gas, and the jobs it creates, towards green energy is a gradual one.
How many other countries will recognize the need for a gradual transition.
Another source states: Norway’s New Government Unimpressed with EU’s Arctic Drilling Pledge.
“The country’s incoming centre-left government has said it will seek to grow the country’s lucrative oil and gas industry while striving to cut carbon emissions. The comments came only a day after the EU pledged to pursue a ban on exploiting new fossil fuel deposits in a new regional strategy.”
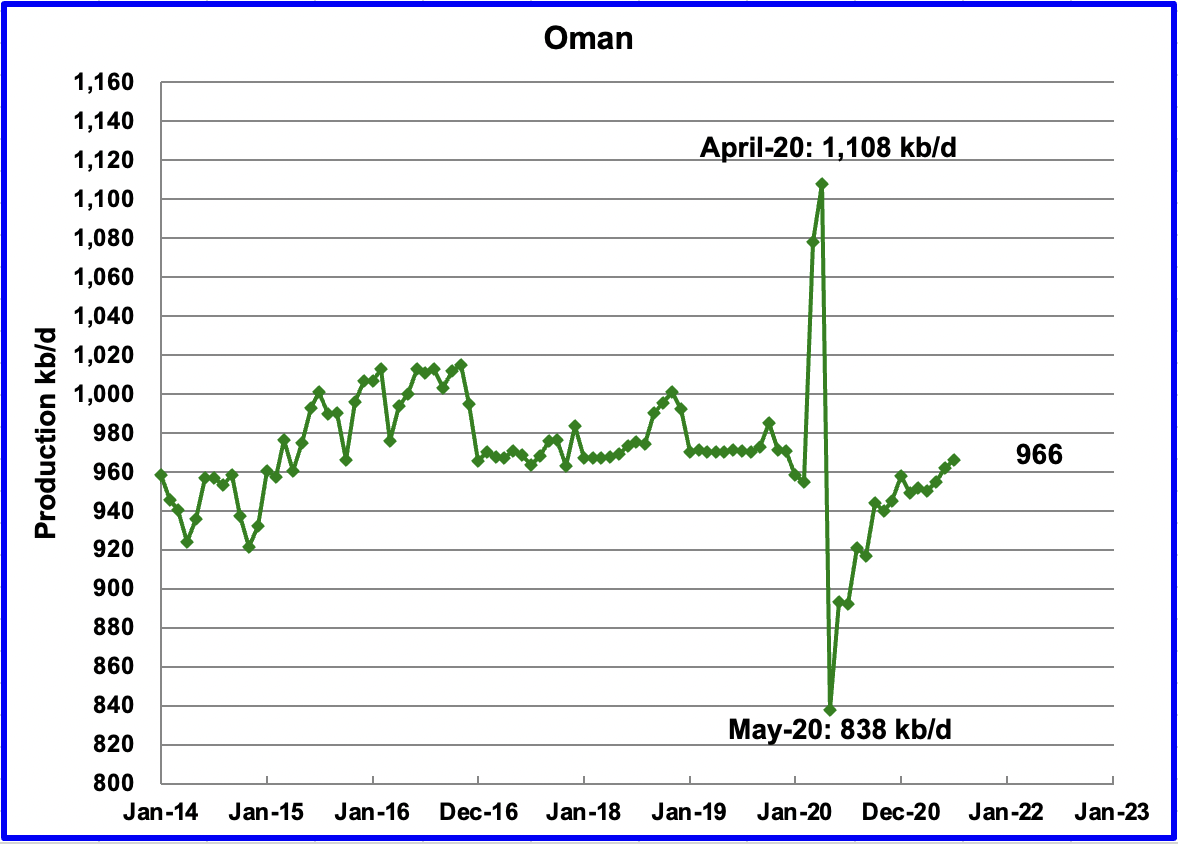
Oman’s July production increased by 4 kb/d to 966 kb/d.
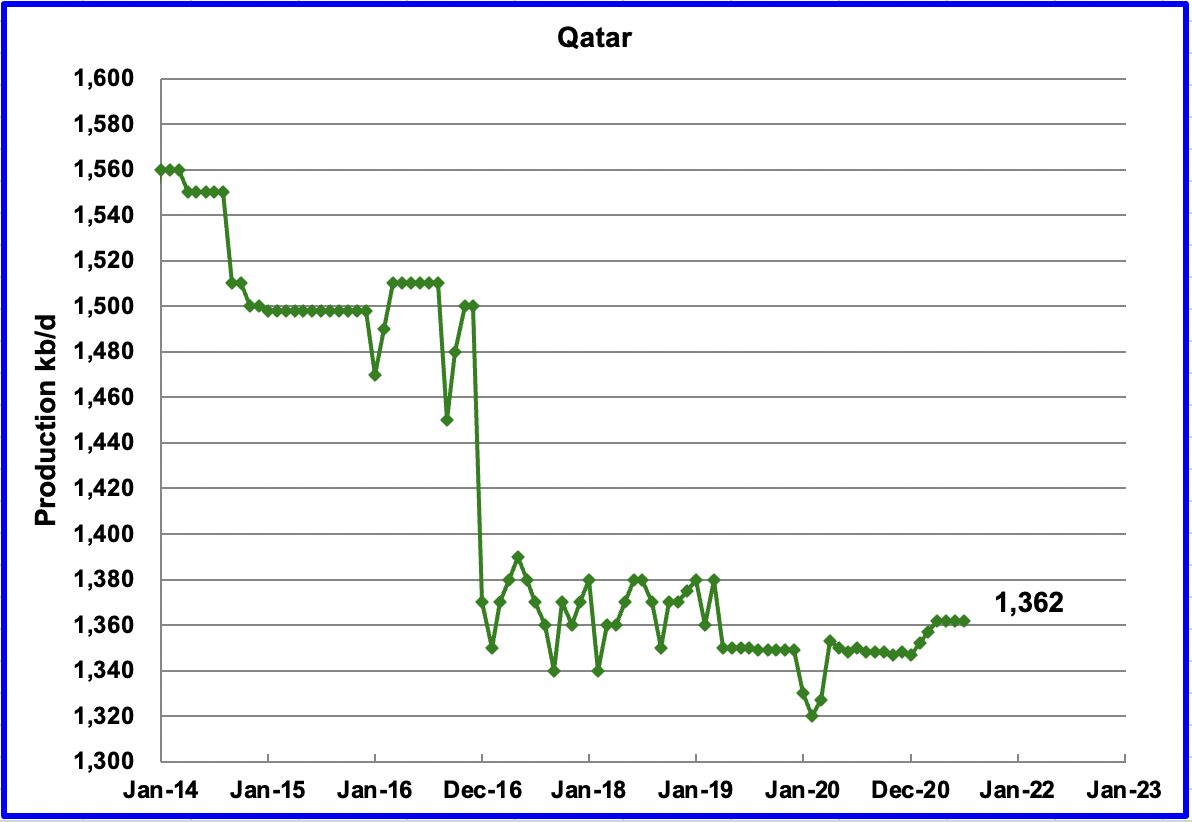
July’s output was unchanged at 1,362 kb/d.
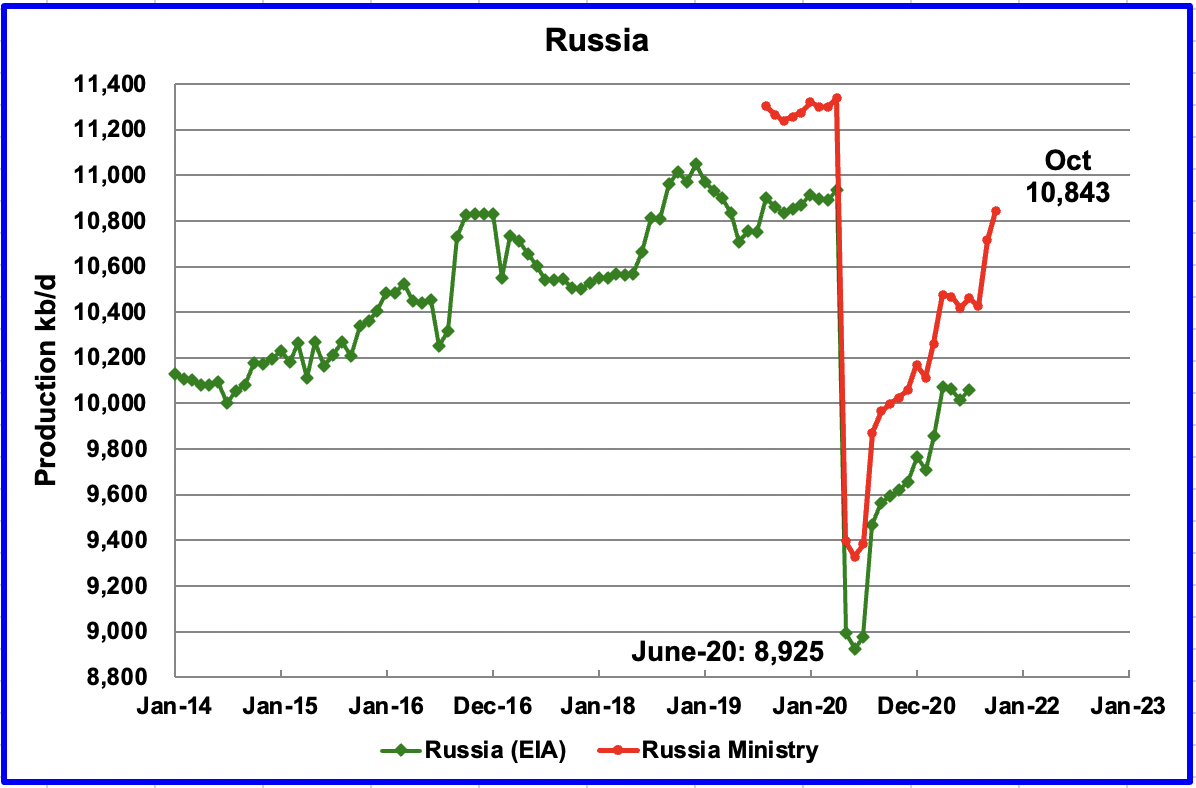
The EIA reported that Russian output increased by 42 kb/d in July to 10,057 kb/d. According to the Russian Ministry of Energy, Russian production increased by an additional 417 kb/d in October to 10,843 kb/d.
According to the above source, “As CDU-TEK data doesn’t provide a breakdown between crude and condensate, which is excluded from the OPEC+ agreement, it’s difficult to assess Russia’s compliance with the deal. If Russia’s condensate output was the same as in September – some 910,000 barrels a day, then nation’s daily crude-only production was around 9.93 million barrels, about 120,000 barrels above its quota for October.”
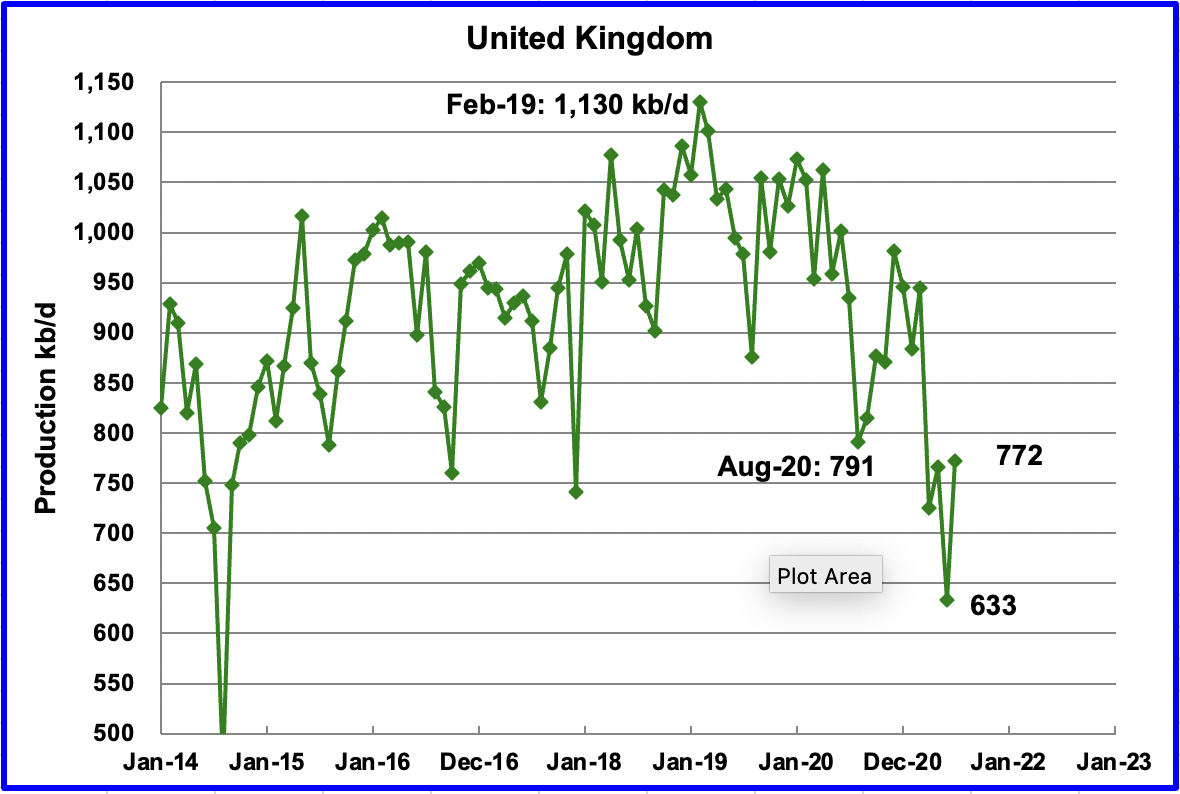
UK’s production increased by 139 kb/d in July to 772 kb/d due to the completion of some of the planned maintenance.
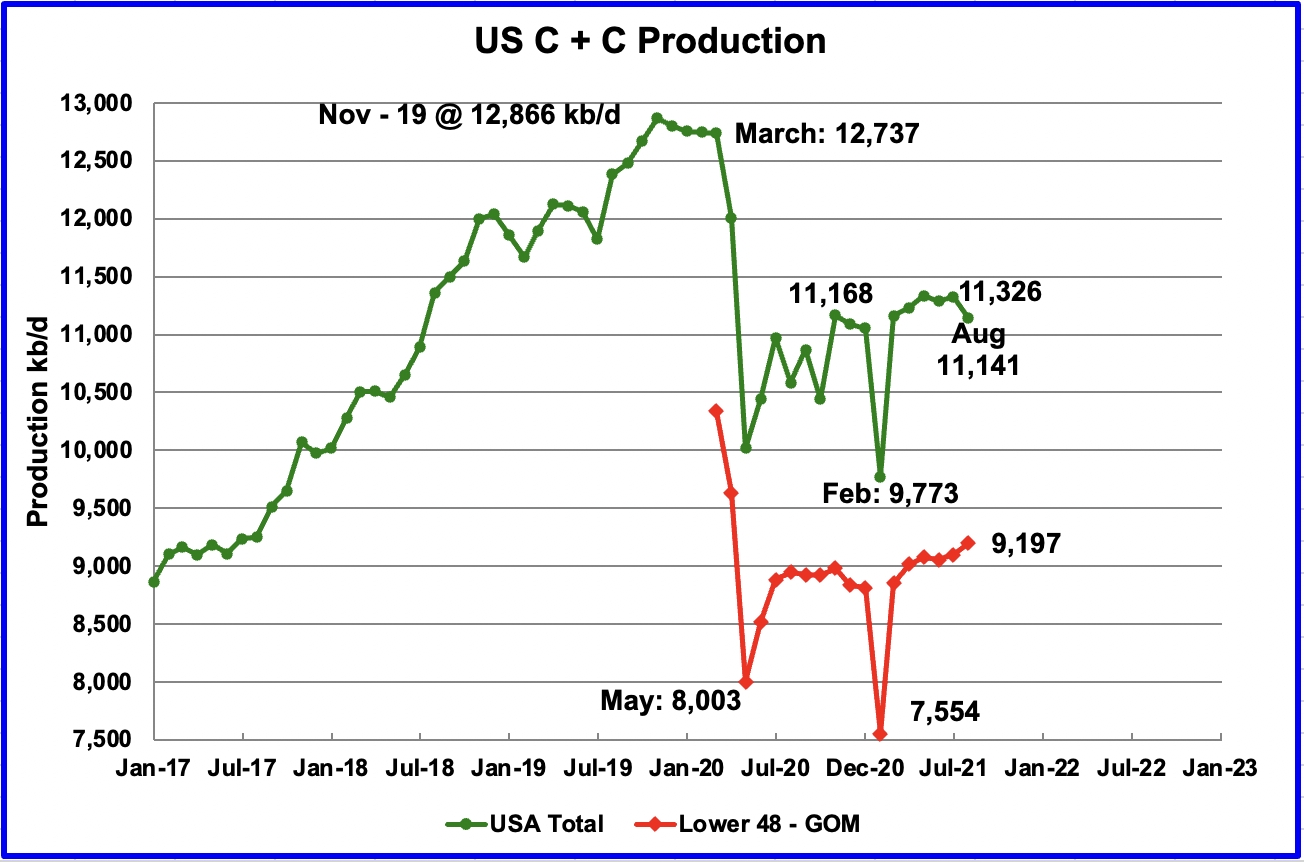
U.S. August production decreased by 185 kb/d to 11,141 kb/d. July was revised up from 11,307 kb/d to 11,326 kb/d in the October report. Note that August production is lower than November 2020, which was 11,168 kb/d, primarily due to Hurricane Ida’s impact on GOM production.
For the week ending October 29, the EIA reported that US output had reached 11,500 kb/d. Using the weekly EIA report of October 29, along with the earlier ones, the average US October production has rebounded back to 11,375 kb/d range. The STEO is predicting 10,560 kb/d for September and 11,000 kb/d for October. For August, the STEO output was low by 81 kb/d.
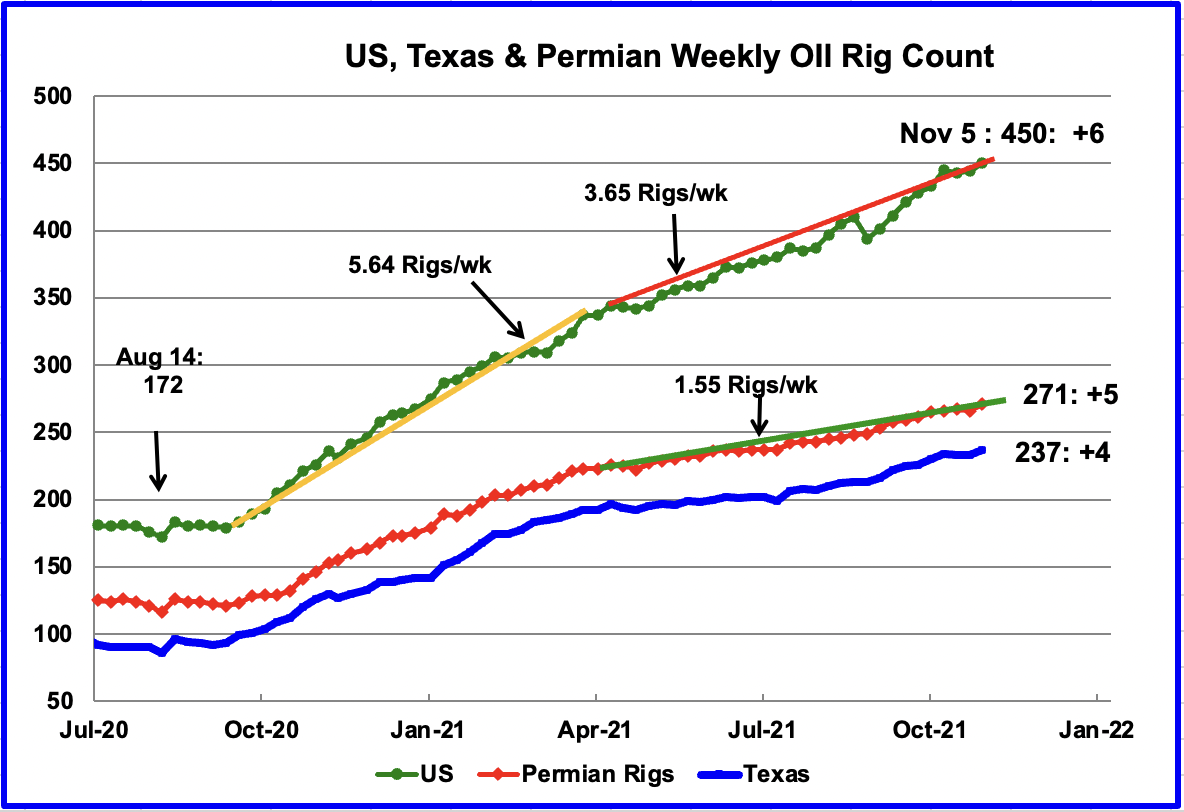
Since the beginning of April, the US has been adding oil rigs at a rate of close to 3.65 rigs/wk. For the week of November 5, 6 oil rigs were added for a total of 450. Of these, the Permian added 5. In the Permian oil rigs are being added at the rate of 1.55 rigs/wk. This means that more rigs are being added in other basins and states. Note that over 90% of the Permian rigs are horizontal ones.
In the week ending November 5, 5 oil rigs were added to the Permian. Of the 5, 4 were added in the Texas Permian. While the net oil rigs added in the Permian was was 5, this was a combination of +10 Hz rigs, -4 Vertical and -1 Directional. Removal of the Vertical rigs is significant because they do the initial deep drill for the horizontal rigs. Note that in the previous four weeks, the horizontal rig count was essentially flat at 247/248 rigs.
Since the end of July, it appears that the addition of oil rigs in the Permian has been at a rate closer to 2 rigs per week. Could this higher rate be related to the increasing price of WTI?
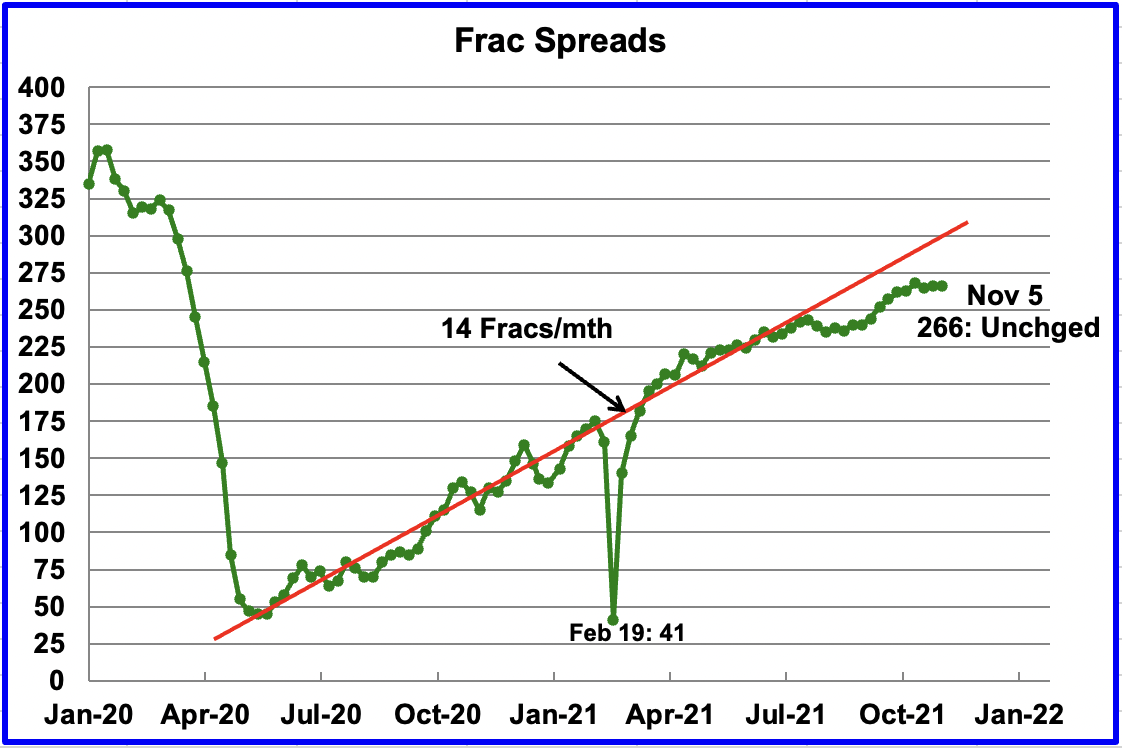
Starting from the week of July 23, 2021, frac spreads were not being added at the previous rate of approximately 14 spreads per month. While there has been an increase since then, there is a definite indication of slowing. For the week of November 5, no Frac spreads were added.
Note that these 266 frac spreads include both gas and oil spreads, whereas the rigs information is strictly oil rigs.
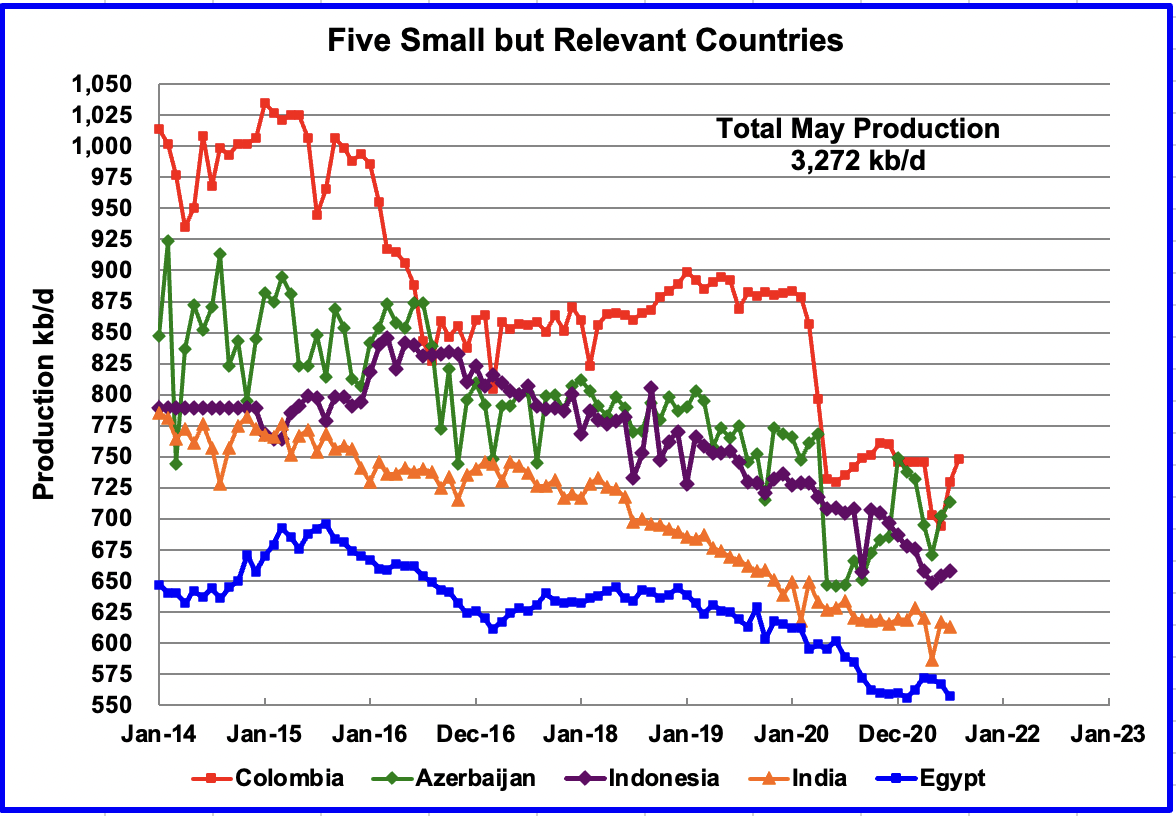
These five countries complete the list of Non-OPEC countries with annual production between 500 kb/d and 1,000 kb/d. Their combined July production was 3,272 kb/d, up 38 kb/d from June.
World Oil Production
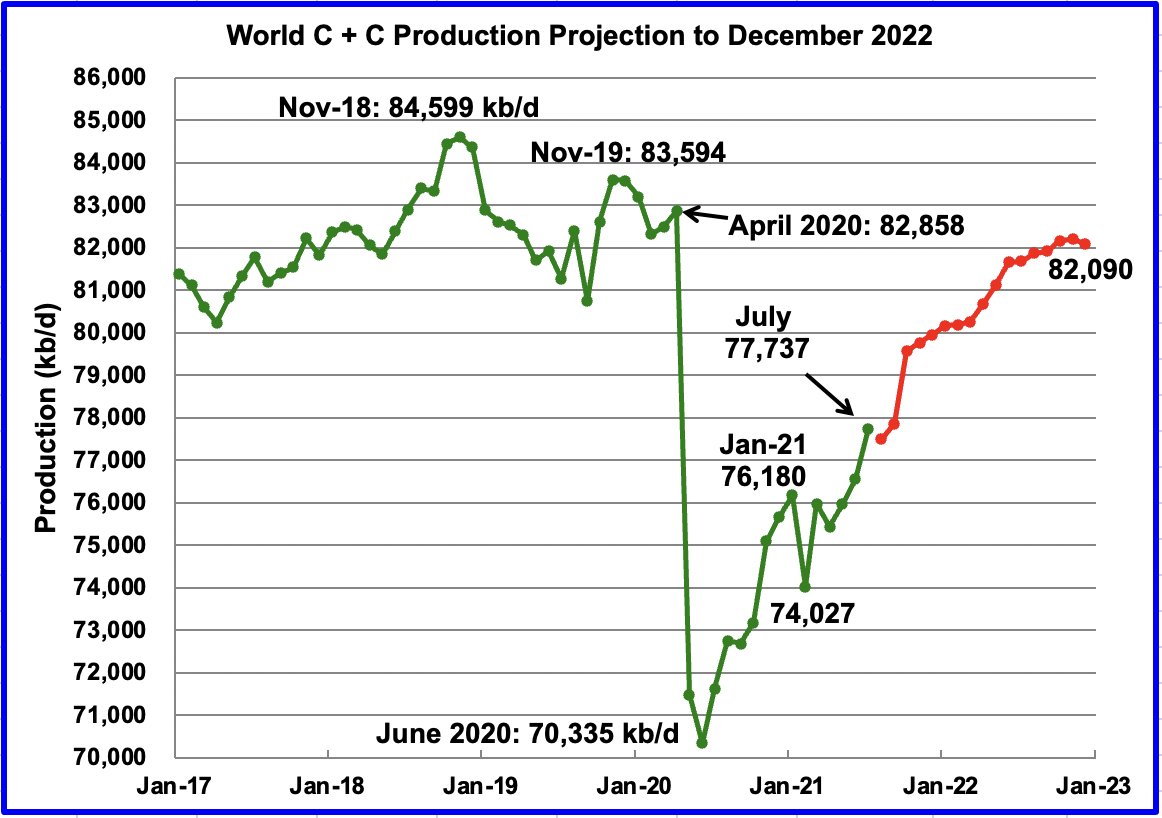
World oil production in July increased by 1,192 kb/d to 77,737 kb/d according to the EIA. Of the 1,192 kb/d increase, the biggest contributor was Saudi Arabia, 509 kb/d, followed by Brazil, 142 kb/d, UK, 139 kb/d and Norway 85 kb/d. Russia only added 42 kb/d.
This chart also projects world production out to December 2022. It uses the October STEO report along with the International Energy Statistics to make the projection. (Red markers) It projects that world crude production in December 2022 will be close to 82,090 kb/d, 379 kb/d lower than forecast in the previous report.
The current December 2022 forecast is 2,509 kb/d lower than the November 2018 peak of 84,599 kb/d. As best that I can remember, this may be the biggest gap that has been reported and it continues to get bigger.
Let’s look at production for the end of 2022 another way. Let us speculate, “What if world demand gets back to the January 2019 output level?”
By December 2021, OPEC + will add another 2,000 kb/d of crude to July, or 2,300 kb/d of C+C. In addition we can expect 300 kb/d above quota from Russia, 200 kb/d from the UK and 100 kb/d from the US for an additional total of 2,900 kb/d. It is assumed that US output reaches 11,500 kb/d by the end of 2021.
Adding the 2,900 kb/d to July 2021 brings December 2021 output close to 80,637 kb/d. This is 2,558 kb/d lower than the January 2019 output of 83,195 kb/d. Also the EIA’s December 2021 output projection is 79,955 kb/d which is 3,240 kb/d lower than the January 2019 output.
In either case, for production to get back to the January 2019 production level by December 2022, if required by world demand, will require OPEC and Non-OPEC countries to come up with somewhere between an additional 2,558 kb/d to 3,240 kb/d during 2022.
Of this additional output, OPEC is expected to provide close to 1,200 kb/d to 1,400 kb/d. The remaining 1,358 kb/d to 1,840 kb/d need to be provided by the Non-OPEC countries. Sounds like a daunting task. Note that EIA is only projecting an increase of 2,135 kb/d in 2022 from all countries, whereas a minimum of 2,558 is required.
219 responses to “July Non-OPEC Oil Output Adds to World Supply”
Ovi,
Nice post, thank you.
I agree it is not likely that World output returns to the Jan 2019 level, it might come a bit closer if Iranian sanctions get removed, but still will come up short by the end of 2022. For this reason I expect oil prices are likely to be well over $80/bo, probably in the $90-$100/bo range. Such high prices will be needed to balance oil demand with oil supply, by 2024 to 2025 I expect World 12 month average crude plus condensate output will surpass the previous 12 month average (about 83.2 Mb/d). I expect the peak will be 86 to 87 Mb/d in 2027 or 2028, demand may start to fall faster than supply by 2029 or so as the EV transition proceeds (high oil prices are likely to accelerate the transition).
7 years for EVs to significantly displace Ice. That’s pretty optimistic, I hope you’re correct.
Sean,
It is just enough to reduce oil demand below oil supply, in 2028, it is assumed the plugin vehicle fleet of light vehicles reaches about 103 million by 2028, enough to reduce oil demand by enough that falling oil supply is more than matched by falling oil demand. In 2020 the plugin vehicle fleet Worldwide was about 10 million, up from under 1 million in 2015. I think the scenario is realistic, some think it is optimistic and others believe my scenario is pessimistic. Every scenario of the future tends to be wrong as it is one of an infinite set.
I wonder will Africa buy electric cars?
https://lmc-auto.com/news-and-insights/african-auto-market-maturity/
I find it hard to envisage sufficient EV ownership by 2028 to reduce global oil consumption. Insufficient supply or docietal collapse maybe but not EVs.
Sean,
Total World light vehicle sales are around 76 million, in 2021 it is expected that plugin vehicle sales will be about 6 million (based on year to date sales through end of 3Q21). From 2014 to 2021 average annual sales growth of plugin vehicles has been about 38% per year, most of this period oil prices were relatively low (relative to 2005 to 2013 in constant 2020 US$).
If we assume vehicle sales growth of 35% per year we get the following for plugin sales in millions per year starting in 2021 and ending in 2029:
6.0, 8.1, 10.9, 14.8, 19.9, 26.9, 36.3, 49.0, 66.2
In 2020 cumulative World sales for plugin vehicles was about 9.42 million (2016 to 2020), using the annual sales scenario above, cumulative plugin sales in 2029 would be about 247.6 million, such a scenario would put a significant dent in World oil consumption, I assume both older and newer cars are driven the same annual miles in my model which is a very conservative assumption. Typically in the real world newer vehicles are driven many more annual miles than older vehicles so reduction in demand for oil is likely to be greater than I have modelled.
Link below has US data from 2009 for miles travelled by vehicle age
https://nhts.ornl.gov/tables09/fatcat/2009/best_VEHAGE_VEHTYPE.html
I assume most of the EVs will be sold in in OECD nations and China, Africa and other less developed regions have fewer personal light vehicles and less oil demand per capita. If oil prices are high and the price of EVs is reduced over time, many in Africa will never own and ICEV, if the buy a vehicle it will be an EV, this is like many in the West who have never owned a horse.
>Total World light vehicle sales are around 76 million
This does not include things like electric bikes which probably sold about 40 million units, and are projected to grow fast. The world continues to urbanize rapidly, so bikes may make more sense than cars. And there is a grey zone, including cargo bikes, where electric bikes replace light vehicles completely. Will e-bikes surpass cars?
A lot comes down to the choices Chinese manufacturers will make, or are already making. They totally dominate both the light vehicle industry and the electric bike industry. China produces three times as many cars as the United States. Most Chinese manufacturers are in the crowded cities of Eastern China, so their instincts are very different from those in Detroit. In addition they build to EU standard, which is the de facto international standard.
So it’s reasonable to expect drastic changes in the industry in the coming decade.
Alimbiquated,
Including e-bikes etc would of course reduce oil demand faster than I have modelled. Potentially growth in transport demand will be met by ebikes plus EVs while also replacing a lot of existing ICEV use over time.
An interesting area for study thanks.
Can you point us to any good research?
e-bikes are popular even in F 350 Central Oregon.
Bend is a somewhat progressive area of a very red area.
The lack of public transport may be a factor.
Who will buy any of the new cars?
https://www.youtube.com/watch?v=7WYBR0tlPA8
This isn’t exactly great for a market already dying for many reasons.
Dennis
The administration needs to find a balance on the oil price with regard to what price US producers need and what consumers should be paying. The US has lived off cheap OPEC oil for too many years. While OPEC’s oil price is climbing, US citizens are going to have to learn that their home grown oil also has a higher price to keep it sustainable.
As for this transition to solar/renewable/wind, it is going to take time and will require some acceptance that possibly new power line corridors will be required. This past week, Maine turned down a power line corridor. Anything new these days seems to have difficulty. I don’t think another pipeline will ever be built outside of Texas.
The other thing I wonder about is peak copper and possibly other peak metals. Same issue as we have with oil. Can they find/build copper mines at the rate to meet new upcoming demand. If they can’t, price will rise to make EVs and power grids too expensive. The world I see will have to learn to live with oil,solar, wind, nuclear, etc and fusion if we are lucky. Maybe we may have to learn to use less and conserve. Right now conservation does seem to be on the radar screen for most people.
As you say seeing the future is not easy.
Ovi the Maine case is interesting as fossil fuel companies worked to stop the power line and they succeeded. The case will probably be decided by the courts, but yes NIMBY is a problem everywhere.
The government will not be able to do much about oil prices, if the US had higher taxes they could adjust them to reduce pain at the pump, but currently total fuel tax on gasoline is only around 57 cents per gallon on average in the US (varies state to state from 33 cents to 85 cents per gallon) when weighted by sales volume in high and low tax states. At the federal level the tax is only 18.4 cents per gallon, so for individual states the rates vary from 15 cents (Alaska) to 67 cents (California).
https://www.api.org/-/media/Files/Statistics/State-Motor-Fuel-Taxes-Charts-july-2021.pdf?la=en&hash=55BE585BEAB89E19ECF7CAE7DC550A5F501B0747
The transition to EV’s will require nearly unimaginable mining growth which new mining will be a new source of fossil fuel demand. To replace all ICE with EV would require cobalt = 80 x’s current annual production; 40 x’s current annual neodymium; 30 x’s annual lithium and so on. Adding to that new fossil fuel demand will be materials and construction for new transmission lines as well as cargo ships to transport mined and/or processed materials. We can’t merely subtract gasoline usage from future fossil fuel consumption and think the picture is complete.
Regardless of peak oil or climate change there are at least 100 non-replaceable non-renewable resources which will be in permanent decline between 2030 and 2050. How will strain in the energy markets impact extraction? The opposite of growth based “synergies” turns into Liebig’s Law and the weakest link.
https://www.readblip.com/
They’ll just go from Cobalt to non-Cobalt technologies as need be. Tesla is switching to Lithium Iron Phosphate (LFP) batteries for some vehicles because of the rarity of some elements. The energy density is not a great as other tech but then if you want to drive electric and don’t need the range, LFP is a very good choice.
There’s nowhere near enough metal flow capacity to replace the fleet with EVs.
We’re currently watching peak copper unfold as well
Copper will be replaced by aluminium in many cases when it gets too expensive. Car producers already think about it for the wiring. It’s more complicated to do but if the price is right it will be done.
Batteries already trend to ditch rare materials. Lithium itself is not that rare – and for most cases sodium or iron batteries are already in the pipeline.
Aluminum will replace copper . Obviously you have been missing out on the story of China stopping the export of magnesium which is required to make aluminum billets . EU supplies of aluminium are till the end of the month , until China lifts the ban . This is ” peak everything ” . Shortages and price increases in important metals is now on . See link .
https://knoema.com/infographics/ffzioof/aluminum-price-forecast-2021-2022-and-long-term-to-2035
By the way 87% of the world’s magnesium is processed in China . Eu shutdown it’s last smelter in 2001 .
If I recall correctly the manufacturing of aluminum requires magnesium. And Europe depends on China for their magnesium supply.
And that supply from China depends on electricity generated from coal. Which is in short supply.
Didn’t Europe only have enough magnesium to last through November before auto production starts shutting down?
HHH , you are correct . That was the gist of my post that vanished into ether . We are at ” peak everything ” . Shortages and high prices for important and essential metals wll remain high .
https://knoema.com/infographics/ffzioof/aluminum-price-forecast-2021-2022-and-long-term-to-2035
That is no peak thing, please infirm you.
Magnesium and aluminium is everywhere – it was just so that smelting it in China is cheaper because of cheap coal and less enviromental rules.
No, Eulen . Magnesium and Aluminium are not everywhere . 87% of the magnesium comes from China . 59% of the world’s aluminium comes from China . That is the fact . If low cost is the reason then so be it . However then you would have to uproot all the manufacturing out of China because low cost is the reason for companies locating their plants in China . Anyway what matters is delivery to the final consumer . If the crude in Ghawar does not get to the petrol tank of Six Pack Joe in Montana its value is the same as the sands of the Sahara . Last , peak does not mean ” zero” production , it is the point of maximum production . After that no growth in production . Adding fuel to the fire .
https://www.reuters.com/business/energy/china-power-curbs-cut-7-annual-aluminium-capacity-wood-mackenzie-2021-11-12/
Aluminum is one of the most abundant metals in the Earth’s crust — seventh in abundance by mass
https://www.wikiwand.com/en/Aluminium#Earth
Aluminum is usually refined from bauxite ore. These are the main producers:
Australia – 105 million metric tonnes.
China – 68 million metric tonnes.
Guinea – 64 million metric tonnes.
Brazil – 30 million metric tonnes.
India – 26 million metric tonnes.
Source: https://www.nsenergybusiness.com/news/profiling-the-top-five-bauxite-producing-countries-in-the-world/
Aluminum is also recycled a lot, because it is expensive to refine bauxite.
Aluminum is one of the most recycled — and most recyclable — materials on the market today. Nearly 75 percent of all aluminum produced in the U.S. is still in use today. Aluminum can be recycled directly back into itself over and over again in a true closed loop.
Source: https://www.aluminum.org/industries/production/recycling
So the quantity available is steadily increasing.
Alimbiquated,
China produced over half of the World’s aluminum in 2017, 36 million tonnes of 63 million produced in the World. The next largest producer is India with 3.7 million tonnes and Russia with 3.6 million tonnes.
The Bauxite needs to be converted to Aluminum to be useful, this is mostly done in China. Canada produces 2.9 million tonnes and US 1.1 miilion tonnes.
Australia produces 1.6 million tonnes and Norway 1.3 million tonnes.
https://blog.bizvibe.com/blog/industrial-supplies/top-10-largest-aluminium-producing-countries
The US imported about 3.2 million tonnes of aluminum in 2020 for primary consumption (aluminum that is not from recycled aluminum.)
Germany imported about 1.8 million tonnes of aluminum in 2020 (they are the largest EU importer of aluminum).
Alimbiquated , bauxite is not aluminium , iron ore is not steel and crude oil is not gasoline ,diesel or jet fuel . Try injection moulding or pressure die casting with bauxite instead of aluminium billet . You will know the difference .
Good lord, people, can’t we distinguish between short-term problems and long-term problems? Supply chain problems are short-term, while “Peak” is a term used for long-term problems.
Magnesium and aluminium smelting are capital intensive, so expanding or moving production is expensive. So, a short-term shortage may take more than a few months to fix. On the other hand, it’s pretty obvious that we’re not at “peak aluminium” or “peak magnesium”: the fundamentals of supply are overwhelming abundant.
Shouldn’t this be an easy thing to agree on??
Funny thing: This is this is a peak oil site, and nobody talks about peak refinery capacity. It’s all about oil reserves — stuff in the ground.
So when we’re inventing fairy tales about peak aluminum, why talk about aluminum (a refined product made of bauxite) refinery capacity and not about the raw material reserves?
Alimbiquated,
Good point.
Nick,
Yes aluminum is not going to be a problem long term, short term there could be price spikes. Long term the market adjusts.
Ovi – I noticed that when Niobrara went below about 4 months DUC inventory the E&Ps added rigs at a faster rate ad the rate of decline fell (still not flat though). I had been under the impression that an inventory of 3 to 6 months was needed fo logistics. It is certainly not 6, and at the moment indications are it may be less than 3 (currently 3.7) but there has to be a minimum somewhere. The next lowest is Permian at 4.5 so it may soon be facing the same issue (add rigs or cut back on completions). Other areas are above 7 still. Do you have the number of frac spreads broken down by area? And what did the curve look like over the years before 2020 especially in the previous crash and recovery?
George Kaplan,
Shaleprofile has data for DUC counts see link below.
https://public.tableau.com/shared/Y7CQR4X44?:toolbar=n&:display_count=n&:origin=viz_share_link&:embed=y
You can adjust this chart by basin etc as you need. Lots of data available under well status (spud, DUCs, first flow, producing, etc).
Note that the data for DUCs at shaleprofile may not be very good after July 2020, particularly for Eagle Ford and Permian as a lot of data gets reported late to the RRC or the RRC takes a long time to process reports. The data for the previous crash and recovery from 2015 to 2019 might be useful.
George
I am not seeing the same trends in the Niobrara as you are seeing. Perhaps I am using different data. Regardless I will put up my info and we can go from there.
The first graph shows drilled and completed wells. Starting in January to May, the drilled and completed wells were moving in parallel and the number of drilled wells and the drop in completed wells were very close to each other. Also the same trend is shown in the table in the next picture. In June drilling started to ramp up and the DUC completions began to slow. In August and September the rate of completing DUCs slowed dramatically.
The second last column in the table shows the monthly drop in DUCs. The last column shows the number of months of available DUCs to complete based on the previous months drop. It doesn’t get down to 4 months in 2021.
The last picture show Niobrara output slowly climbing as drilling replaced DUCs. I wonder if the better/sweet DUCs are all used up and the reminder are mostly dead DUCs.
Table Picture
Ovi – divide the completed numbers into the duc colum to give the inventory in months (i.e. how long would they last if frilling stopped) not the duc drop. And plot the total ducs against time and you will see the kink at around may/june when the drilled line shot up towards the completed line. Its still a bit lower so ducs are declining slowly but eventually they must come together. It looks like they kept the completions constant (i.e. didn’t add any new fracking crews) and adjusted drill rigs to match. If they do the same in the permian then its not really relevant how many rigs there are, just how many frac spreads. I have no real appreciation for how much equipment is involved in hydrofracturing but it sounds like a hell of a lot so it may make sense in times of shortages for labour and materials that these would be the limit rather than drill rigs, however complicated a horizontal rig is. Permian is the next area with the lowest inventory and there is possible indication that the same thing is happening there (i.e. fracking constant, rigs slowly rising).
George
I guess that explains the difference. I was estimating the remains months of DUCs while drilling continued. I think this is the more realistic scenario.
What I find interesting and could be a fluke is that the slowing of completing DUCs is happening at slightly less than 1/2 the maximum number of DUCS, 800, in the Niobrara. I wonder if this could also be true in the Permian. If true, we could see a slowing of DUC completion in about 9 months.
I have no info on frac spreads.
Niobrara Output
Thanks for the post!
Interesting how much supply was lost due to Covid effects.
Where are we at on worldwide demand? Anecdotally the interstates and airports seem pre-Covid busy to me, but I assume we are still below 2019 demand?
The EIA short term energy outlook of 10/7/21 is interesting. Shows demand back to 2019 levels in 2022 but supply surpassing 2019 levels in 2022 worldwide.
I realize these figures are all liquids including refinery gains.
Would like some info/commentary regarding supply/demand worldwide in 2022 and beyond (I know beyond is a tough one).
I am seeing a big supply crunch coming given the CAPEX reductions. But maybe demand will not grow to 105 million /- by mid-decade?
To add to my view, I think energy transition will cause a lot of liquids consumption growth in the short to medium term. The infrastructure bill alone that just passed in the USA adds how much liquids consumption, for example? Throw in continuing population growth worldwide, I just don’t see demand flat lining soon.
But I keep an open mind and am willing to consider other views.
Shallow sand,
Plugin vehicle sales may be double 2020 levels in 2021 (over 6 million vs 3.1 million in 2020). By plugin I mean both plugin hybrid vehicles and battery EVs (Ford MustangE or Chevy Bolt, etc). For the low demand (or fast EV transition) scenario I assume sales of plugins grows at 35% per year up to 2028 and then slows up to 2032 when all new light vehicle sales are EVs, heavy vehicles follow with 5 year lag with growth rates similar to history of light EV vehicles. The high demand scenario has lower growth in EV sales (35%, 30%, 25%, 23%,…,17%, 16%,…, 10%) from 2022 to 2035 and then 10% growth until 100% of new light vehicle sales are EVs. The average scenario is the average of the high and low demand scenarios. Clearly these are guesses, future sales of EVs is unknown, currently heavy duty trucks have zero sales so that is highly speculative, but when available at high oil prices transition could be very fast (likely faster than light vehicle transition).
From 2014 to 2021 (I assume plugin sales will be 6 million in 2021) the average annual growth rate in plugin vehicles sales worldwide has been 38.5% per year.
Regarding plugin vehicles adoption and replacement of ICE I offer up a comment on trend to consider-
Many people will delay the purchase of a replacement vehicle, and keep their current ICE for longer.
These days vehicles can last a very long time.
This will suppress plugin vehicle sales for a while.
But then starting around mid decade the shift will pickup rapidly, and by 2030 be a tidal wave.
Combination of higher petrol prices, more plugin model choices, better batteries, and just word of mouth on the big advantages.
What do I mean by better batteries- some combination of less weight, higher energy density, better price, more recharge cycles. Not expecting any dramatic breakthrough, but continued progression of small improvements. Its a very active field of chemical engineering innovation.
In the meantime I agree with Shallow Sand- demand for oil products will be robust coming out of the pandemic.
Hickory,
Yes there will be some who delay purchase of a new vehicle, but higher oil prices may lead more people who do choose to purchase a new vehicle to consider a hybrid, plugin hybrid, or EV, there are a lot more choices these days around 40k with range of 240 to 250 miles, and many of these vehicles in the US are eligible for a 7500 tax rebate, this might increase to 12500 for some vehicles (union made in the US) if the BBB plan passes. I have read that the current average purchase price for a new vehicle in the US has risen to 45k, so 32.5k (after rebate) is not very expensive in today’s market.
A big problem is wide availability for EVs, they are hard to get, not a lot of supply.
That may gradually change.
My boss ordered a Tesla two weeks ago. Expected delivery date: May 2022.
shallow sand,
On World Demand according to OPEC, 2019 was 99.97 Mb/d, 2020 was 90.79, 2021 is expected to be 96.6 Mb/d, with 4Q21 at 99.82 Mb/d (nearly at the 2019 average level). Average 2022 demand is expected to be 100.76 Mb/d with 4Q2022 at 102.93 Mb/d. OPEC expects non-OPEC liquids production will grow by 3 Mb/d in 2022 (increase in annual average from 2021 to 2022) and demand for OPEC crude is expected to be about 30 Mb/d in 3Q2022 and 4Q2022, OPEC output for 3Q21 was about 27 Mb/d, OPEC is likely to struggle to reach 30 Mb/d by 3Q2022 even with removal of Iranian sanctions. It is for this reason that I expect high oil prices for most of 2022 (we might see a dip in first quarter).
When we SIFT through all the BS & WHITE NOISE, we see that the Falling EROI continues to destroy the profitability of producing oil. However, most don’t see this because we tend to look at quarterly or annual data, but fail to take a BIRD’S EYE VIEW.
The Margins for oil companies will continue to shrink as the Falling EROI increases costs while the oil price remains too low. Why? There is this little thing called DEBT, or more succinctly put, a MASSIVE AMOUNT OF DEBT held publicly and privately. With so much debt in the world, the market and economy can’t afford high sustained oil prices.
So, those seemingly intelligent individuals who continue to make nice-looking charts, IN A VACUUM, fail to realize the Falling EROI is a destroyer of energy, and soon… ASSETS.
As I have said many times, the ENERGY CLIFF will turn ASSETS into LIABILITIES.
But, I say… let’s continue with the Insane Market Meltup until the LAST SUCKER is pulled into Greatest Stock Casino in history.
Steve
I would add the the inflation we are seeing isn’t monetary in nature. It’s supply side shocks. And wages aren’t keeping up with inflation. And the longer these prices persist the more damage is done.
We are getting set up for a brutal deflationary collapse in prices.
Very interesting post. I have been seeing this over the last 20 years. It has been a fools errand to produce oil & gas at prices less than bottled water on a per gallon basis. The Stock Market Casino is a reflection of too many dollars chasing too few real investment opportunities. The Decisions of the Fed for the past 20 years have set up a very over inflated stock market. I think the only reason it stays up is that there are no alternative investments that are compelling. I am up 28% this year through 10 months. This makes me want to sell ASAP because I have never been that great a picking stocks.
LTO, HHH and all other idiots ( me included ) . Let us go crypto instead of worrying . ROFL
https://beincrypto.com/survey-americans-quit-work-crypto-gains/
That sounds like a brilliant idea. I have had crypto miners come to me to buy natural gas assets and associated land to build a crypto mine. I think there is so much value in mining absolutely nothing of value while using an incredible amount of energy.
Bitcoin is a proxy for liquidity. If US stocks sell off like I think they will. There is a lot of downside to Bitcoin currently.
Bond market is signaling not enough money creation. Lower yields, deflation. Yet prices for something’s like oil and gas, rent and food are still elevated. Dollar shortage. Only matter of time before it brings prices down.
Steve and others , I am currently more worried about electricity ( Olduvai Theory ) then about oil (Hubbert ) . Info I have on failing grids and production of electricity is surprising . Oil is not directly used by all ( if you are riding a bicycle or a man driven rickshaw ) but electricity ?? . Even in the slums all over the world all have an electric bulb and a fan . If anything happens to electricity then things could slide in a downward direction very fast . Understand that 66% of the world’s electricity is still thermal coal . Very fragile . I have posted earlier links about 2-3 days stock of coal in India’s power plants . Steve has correctly called ” peak everything ” , coal, oil, gas and let me add metals ( peak copper , tks Ovi) . Are we seeing the confluence of the Olduvai and Hubbert ? I seriously hope not . TSHTF .
P.S : I have used the word ” directly ” . I know that no cycle rickshaw would be manufactured if there was no oil .
More on Iran , China and oil . Iran sells all it produces .
https://www.reuters.com/business/chinas-iran-oil-purchases-rebound-lower-prices-fresh-quotas-2021-11-10/
ENERGY CLIFF will turn ASSETS into LIABILITIES
Bingo!
We have a winner
Yes , I know this is Zero Hedge but MSM is too busy with CRT , Trump, Vaccines and other stuff .
https://www.zerohedge.com/energy/biden-targets-another-us-pipeline-shutdown-after-begging-saudis-more-oil
A small text about the prospects for production at the Bazhenov Formation (in Russian):
https://www.angi.ru/news/2894033-%D0%90%D0%BB%D0%B5%D0%BA%D1%81%D0%B0%D0%BD%D0%B4%D1%80%20%D0%A5%D1%83%D1%80%D1%88%D1%83%D0%B4%D0%BE%D0%B2%3A%20%D0%9D%D0%B8%D0%BA%D0%B0%D0%BA%D0%B8%D1%85%20%D0%BD%D0%B0%D0%B4%D0%B5%D0%B6%D0%B4%20%D0%BD%D0%B0%20%D0%BF%D0%BE%D0%BB%D0%B8%D0%B3%D0%BE%D0%BD%D1%8B%20%D0%B4%D0%BB%D1%8F%20%D0%B4%D0%BE%D0%B1%D1%8B%D1%87%D0%B8%20%D1%82%D1%80%D1%83%D0%B4%D0%BD%D0%BE%D0%B8%D0%B7%D0%B2%D0%BB%D0%B5%D0%BA%D0%B0%D0%B5%D0%BC%D1%8B%D1%85%20%D0%B7%D0%B0%D0%BF%D0%B0%D1%81%D0%BE%D0%B2%20%D1%83%20%D0%BC%D0%B5%D0%BD%D1%8F%20%D0%BD%D0%B5%D1%82/
Alexander , ” long time , no see ” . Good to see you are back . Regarding your link , well it will not get devolped that is for sure . Maybe Russia should be more worried about this .
https://www.oilystuffblog.com/single-post/the-end-of-the-world
‘I’m afraid we’re going to have a food crisis’: The energy crunch has made fertilizer too expensive to produce, says Yara CEO
The world is facing the prospect of a dramatic shortfall in food production as rising energy prices cascade through global agriculture, the CEO of Norwegian fertilizer giant Yara International says.
“To produce a ton of ammonia last summer was $110,” said Holsether. “And now it’s $1,000. So it’s just incredible.”
Since September, it has been curtailing its ammonia production by as much as 40% due to energy costs. Other major producers have done the same.
I believe Russia put a freeze on fertilizer exports.
But like I was saying this inflation isn’t monetary by nature. And actually if it was monetary in nature then higher prices could be sustainable. Higher prices currently are gutting the economy because it’s not due to a over abundance of money.
We have higher prices but the money to support them isn’t really there.
People are running up debt to continue their current life style. People are running up debt just to keep the power on. All depends on where exactly you live.
The prediction for 2022 corn acres in the USA keeps dropping because of input costs.
Soybeans have much fewer inputs than corn. So even though corn prices are higher than soybeans (much more gross income at $5.50 corn than $12 soybeans) it appears there will be more soybean acres solely because of input costs for corn.
Interesting article at Oil Price at link below
https://oilprice.com/Energy/Energy-General/Why-US-Shale-Wont-Go-To-War-With-OPEC.html
Excerpt:
Post the depths of the pandemic, as the global economy began to recover, shale drillers moved from a posture of bank-financing their drilling programs to one of self-funding their activity with cash flow. This posture was driven not only by financial necessity but by government fiat as the new administration began to issue edicts intended to hamper growth in the industry as it pushed its “climate-friendly” agenda.
Two principle things have actually occurred in the face of this governmental opposition. The first is the consolidation trend that began in 2020 with several mid-sized companies being bought out by larger companies, has continued into 2021. Prime examples from 2020 would be, ConocoPhillips, (NYSE:COP), taking out Concho Resources, Devon Energy, (NYSE:DVN), taking out WPX Energy, and then Pioneer Natural Resources, (NYSE:PXD) taking out Parsley Energy. Most of these deals were pure stock swap transactions that created no new debt for the surviving company. These mergers have had the goal of “bolting-on” to existing prime acreage positions to enhance well planning, logistics, and to lower unit costs.
The second thing that’s occurred as shale drillers have seen the stunning run-up in oil prices this year triple and quadruple operating cash flows is the use of this cash flow to fund capex in amounts sized to keep production essentially flat through 2022, repair their balance sheets by paying down debt, and reward shareholders with increased dividends and stock buybacks.
In this piece the author mentions rising strength of the dollar, he shows a short term chart for DXY see link below for where one can find this info. Chart below is a longer term chart which shows current DXY is about 5% lower than in early 2020.
https://www.marketwatch.com/investing/index/dxy/charts?mod=mw_quote_advanced
I think long term strength on dollar matters more than short term. Add if the dollar’s value is ranged bound or is it trending higher or lower makes a difference.
I’m curious if oil can continue higher during a stock market sell off. Sell off that has duration. Not a day or two or week. But a sell off that takes place over several months.
The Saudis use to say: “Don’t worry, we (and OPEC) have hundreds of billions of crude oil reserves, ample spare capacity and we can meet any request for additional oil”. Not anymore:
Aramco Warns Oil Spare Capacity to Shrink as Travel Rebounds
Spare capacity in the oil market will shrink significantly next year as travel rebounds and due to a lack of investment among producers, according to Saudi Aramco.
Surplus capacity is the equivalent of 3 million to 4 million barrels a day and will drop as demand for jet fuel increases, Chief Executive Officer Amin Nasser said.
“The buffer might diminish, especially next year,” he said Tuesday via video during the Nikkei Global Management Forum.
I don’t know how the Saudis define spare capacity but here is EIA:s definition:
EIA defines spare capacity as the volume of production that can be brought on within 30 days and sustained for at least 90 days. Saudi Arabia, the largest oil producer within OPEC and the world’s largest oil exporter, historically has had the greatest spare capacity. Saudi Arabia has usually kept more than 1.5 – 2 million barrels per day of spare capacity on hand for market management.
The world will probably need that 3-4 mb/d of spare capacity (if it exists?) more than 90 days next year. If we instead define spare capacity as “…brought on within 30 days and sustained for at least one year”, how much do we then have?
Probably 1 to 2 Mb/d for KSA, maybe 3 Mb/d for all of OPEC from last month’s output level, maybe 30 Mb/d capacity might be sustained for 12 months, if Iranian sanctions are removed. They might be able to maintain that level for a couple of years with enough investment to replace reserves, much will depend on oil demand and oil prices.
I wonder if Iran is selling a bunch of oil under the table, to China for example, and is therefore under-reporting its production. If this is the case, Iran has less spare capacity than the official numbers.
I also think Iran sells oil through Iraq. They have a pipeline into Iraq.
Frugal, as I have posted here twice before (a year ago) but noone seems to be interested – 2 Yemeni experts, that have been on the ground, swear that it’s widely known that the Saudis are repackaging several tankers a month of Iranian oil as Saudi. I first heard this 3 years ago, and when I heard it from 2 more Yemeni geopolitical experts I started to give it some credence (first in an interview on Porkin’s Policy Review, then on a Russian news cast in Russian, where it was openly declared in an interview). Somehow the transaction is done via Yemeni it seems.
The implications are very important if true, as:
1) clearly SA is beyond peak if they are cash purchasing Iranian oil to hide their decline. I.e. SA has zero spare capacity. When SA “increases production” they either try to purchase another Iranian shipment, or they tap reserves and draw down
2) Iran is not only likely producing much more than declared, but they may also have far less scope for increasing production than otherwise assumed.
Also keep in mind that Iran has been barter trading oil for other resources and manufactured goods directly from Russia, the latter whom then sell it as Russian oil, and you start to think that Iran is producing flat out.
OPEC likely has zero spare capacity.
I believe the Spare capacity has vanished for the time being. Two years of little to no drilling is showing it’s ugly face. Every oil basin suffers from natural depletion even Saudi Arabia.
LTO Survivor,
Too little drilling perhaps, no drilling is unlikely. Chart below uses data from link below
https://rigcount.bakerhughes.com/intl-rig-count/
Middle east rig count fell from 428 in March 2020 to 239 in Nov 2020 and has risen to 275 in Oct 2021.
As oil prices approach $100/bo and OPEC output approaches capacity, the rig count will likely rise further.
More monthly rig data for Saudi Arabia, Iraq, UAE, and Kuwait (sum of 4 nations from Baker Hughes). Rig count is down from 2019 level significantly. Higher oil prices might eventually lead to higher rig counts.
it’s widely known that the Saudis are repackaging several tankers a month of Iranian oil as Saudi.
This is crazy stuff if true. On the other hand it’s a win-win situation for everyone involved: Iran can produce all out because it can export all its non-domestically consumed oil while Saudi, Iraq, and Russia can over-report their proportion. Why didn’t I think of such a brilliant idea.
I don’t know the truth about the KSA – Iran repackaging story , however I have repeatedly said Iran sells every drop of oil it produces . They have not survived 40 years of sanctions by sitting on their butt . They are masters of sanction busting and frankly they don’t care . Why ? Iranians are aware that nothing frightens Washington more than the shutdown of the Strait of Hormuz . They have sent tankers to Venezuela and the US navy did nothing .By the way when was last you heard of oil being stored in tankers off the coast of Iran ? They need not store because all is sold out . As to OPEC spare capacity ,there is none . They haven’t hung the ” House full ” board to avoid panic .
At least there is the “A lot direct to China” story. So they won’t have much spare capacity left that can be reactivated directly after a possible atomic deal.
Eulenspiegel,
I believe the number reported by secondary sources for Iranian output. If there is extra output from Iran that is not being counted, that would imply World output is higher than reported at present, perhaps the exports that Iran does manage are going to China, but their reported output is about 1300 kb/d less than it was prior to US sanctions. It is this oil that might come back on the World market, if a compromise can be worked out between the US and Iran.
I take the OPEC estimates based on secondary sources as a reliable estimate, perhaps this is incorrect, but I would require a reliable source to be convinced.
Frugal,
These are rumors without proof. According to BP stats, Iran consumed 1841 kb/d in 2019 and they produced 3399 kb/d, so they exported about 1498 kb/d. It is these barrels that the US is trying to stop and get shipped on tankers under different flags, etc. In 2017 Iran exported about 3210 kb/d according to BP stats, about 2 times more than in 2019. Output fell by about 1450 kb/d from 2017 to 2019 due to US sanctions. In 2020 Iranian output was almost 1800 kb/d less than in 2017 (BP data).
Note that BP counts oil as C plus C plus NGL, but it is one of the few places that good consumption data can be found, which allows us to estimate exports. Note that the EIA has Iranian C plus C exports at 2531 kb/d in 2017, almost 700 kb/d less than BP, if we assume all of the difference is NGL, this implies about 700 kb/d of NGL exports, roughly 22% of the liquids exports. If we assume the proportion in 2020 was similar, this would imply 1130 kb/d of C plus C exports in 2020 (78% of 1450).
Rumor is they export 600kbd to China. China can pull up this stunt – they don’t fear the wrath of the USA.
A few 100 kbd smuggle to Iraqu, russia and Venezuela and they are almost at full capacity.
But nothing proofed – this is rumor.
Dennis, are you surprised that OPEC Core countries (for example Kuwait) has not compensated other OPEC countries (for example Angola) unable to meet their quota as we discussed earlier?
Speaking of Angola, their exports keep falling but their quota keeps rising:
Angolan crude exports to hit record low in November
Export loadings of Angolan crude in November will be the lowest on Argus’ records that go back to 2007, a further sign of the structural decline facing the country’s upstream sector.
The country’s provisional loading programme comprises just 30 cargoes for a tally of 958,000 b/d, below the previous historic low of 991,000 b/d in July.
Speaking of Kuwait:
Kuwait says drilling, facilities work underway to reverse declining oil production capacity
In its latest annual report, released earlier in the month, Kuwait Oil Co. said its maximum sustainable production capacity had fallen to 2.579 million b/d as of March 31, down 572,000 b/d from 2018.
Also, oil rig count is stuck at record low:
https://ycharts.com/indicators/kuwait_oil_rotary_rigs
Furthermore, Saudi-Kuwaiti Neutral Zone is also currently in decline:
Saudi-Kuwaiti Neutral Zone facing technical issues, maximum output still far off
Current production on the Saudi side is “just under” 100,000 b/d, said the source, who asked not to be identified to speak about confidential operations. The figure implies total Neutral Zone output of less than 200,000 b/d, with production shared evenly by both countries.
Production in the zone has actually declined over the past few months.
Saudi energy minister Prince Abdulaziz bin Salman told reporters April 1 that the kingdom’s share of Neutral Zone production was 135,000 b/d, which would make for total output of 270,000 b/d.
Pollux,
I don’t think Kuwait has much spare capacity, most of this is in Saudi Arabia, UAE, and Iraq (also Iran if sanctions were removed). Iraq currently has political issues and Saudi Arabia and UAE want to keep the cartel from falling apart so are sticking to agreements, they don’t seem worried about an increase in tight oil output so why not let oil prices rise?
The only problem with that game is it will accelerate th transition to EVs, they probably won’t believe that until it is too late and they have billions of barrels in the ground that cannot be produced profitably (this will become apparent in 2030 to 2035). Oil price will fall to a level where a lot of technically recoverable resources will no longer be economically recoverable resources (those that are profitable to produce).
On middle east rigs, the number of rigs rotating has been rising since late 2020.
I was wrong in guessing they would adjust output, they seem to be just sticking to the original agreement, probably to difficult to get 14 nations to agree on anything, so they may just execute the plan and then make a new plan based on market conditions.
Chart below shows trend for past 12 months has been an average annual increase of about 31 rigs per year.
Data from Baker Hughes at link below
https://rigcount.bakerhughes.com/static-files/26924167-201b-498f-a45b-4b9fbe99270f
It will take a while at this rate to reach the average rate in 2019 (414 rig average for year), more than 4 years.
I found rig counts for individual nations and the 12 month trend for the Big 4 middle east producers (KSA, Iraq, UAE, and Kuwait) is roughly an 11 rig annual increase in rig count (nov 2020 to Oct 2021), at that rate, it would take over 11 years to reach the recent high of about 306 rigs in Dec 2019 (for Oct 2021 they were at 177 rigs).
There has been an uptick the past 3 months where the rate of increase has been at about 90 rigs per year, continued high oil prices might result in rigs returning to the 2019 peak in a couple of years
Russian drilling and discoveries also a bust:
https://oilprice.com/Latest-Energy-News/World-News/Russian-Oil-And-Gas-Discoveries-Plunge-To-Five-Year-Low.html
Thanks Stephen for this update . OPEC + is becoming irrelevant by the day , but they have the world by the b***S . Sorry , how can they be irrelevant if they have the world by the b***s ? An interesting paradox . Any answers ?
from POLLUX’s link above:
Kuwait will be able to unlock some 500,000 b/d of potential output capacity in the next two years, the head of its state oil company said Oct. 22, seeking to allay concerns over the firm’s own admission that its ability to pump crude had declined for the third straight year.
In its latest annual report, released earlier in the month, Kuwait Oil Co. said its maximum sustainable production capacity had fallen to 2.579 million b/d as of March 31, down 572,000 b/d from 2018.
So Kuwait’s current natural decline is rate is 572,000 b/d over 3 years year = 190,000 b/d per year. This can only mean one thing, their big fields are in serious decline.
So the EIA sees the world oil market oversupplied in 2022 with supply averaging 101.42, demand averaging 100.88 and WTI falling to $62 by December of 2022.
The EIA must be expecting big things from the Permian and assume that the World’s population is going to voluntarily reduce consumption. Neither of these two scenarios will happen with $62 WTI.
Genuinely unsure what is going on. No SPR release, world is fully supplied and, apparently, going into a glut. Yet global inventories dropping like a stone and little to no spare capacity to increase anyway.
Shallow sand,
The EIA’s expectation for US output in 2022 is not very realistic. They expect US output to increase by 1110 kb/d from August 2021 to Dec 2022 and by 860 kb/d over the next 12 months, based on capex plans for large oil producers in the US, the most recent STEO seems very far from the mark, supply is likely to be short (at least 400 kb/d less than the EIA predicts) even if oil prices remain at $80/bo.
If oil prices rise to $120/bo by June of 2022 as some analysts predict, then perhaps US output rises as much as the STEO predicts, but at oil prices under $95/bo (my guess) US C plus C output grows by perhaps 5% at most (annual rate of increase).
I took a closer look at STEO. They predict non-OPEC output rises by nearly 3 Mb/d from Sept 2021 to Dec 2022, about a third of this comes from the US, in reality the US increase will likely be 500 kb/d, they might also be off on the rest on non-OPEC by a factor of 2 so realistically output rises by only 1.5 Mb/d, OPEC might be able to increase as much as EIA forecasts by Dec 2022, if Iranian sanctions are removed.
STEO will continue to reduce their output forecasts and will revise their oil price predictions higher.
Dennis
The EIA’s latest STEO has added 200 kb/d to their December 2022 forecast over last month. They are betting on tight oil to comeback strongly. Will this then depress WTI back to $62, which may not be economical and the cycle repeats as production slows.
It will be interesting to compare the EIA’s demand/supply forecast for next year with the OPEC and IEA reports that come out over next few days.
As you say, predicting the future can be difficult.
Will this then depress WTI back to $62,
I don’t think it will. 200K barrels per day added to the world oil supply will not make much difference. What will determine the price of oil in December 2022 will be the world oil supply. I don’t think it will be as high as the EIA expects. I think oil will still be pretty high then.
Of course, that’s just my opinion and it might be wrong.
Ron I agree. I do not think World Oil supply will increase as much as the EIA expects.
Ovi,
Yes they did add a bit to World liquids by Dec 2022, but only 58 kb/d in Nov STEO vs October STEO. I think the EIA is far too optimistic about liquids growth in the near term. They have US output rising by 1100 kb/d from August 2021 to Dec 2022, output will rise by about half this amount in my opinion, they have non-OPEC output increasing by about 3000 kb/d, that is also likely to be too high by a factor of 2. This will leave supply short for all of 2022 and oil prices will need to be high to destroy some demand.
Some recent articles that may be of interest.
https://oilprice.com/Energy/Oil-Prices/The-Oil-Price-Rally-Is-Far-From-Over.html
summary of above
It seems that nearly everyone believes oil prices are only going to go higher from here, with OPEC refusing to change its plan and U.S. producers maintaining discipline
Citi is perhaps the one group that appears to see some downside for oil prices as it predicts higher U.S. production next year
Oil storage across the OECD was at the lowest level since 2015 and demand is only going to climb from here
https://oilprice.com/Latest-Energy-News/World-News/Bank-Of-America-Sees-120-Oil-Next-Year.html
excerpt:
Brent Crude prices could rise to as much as $120 per barrel in the first half of 2022 due to the global gas crisis, booming air travel with international flights returning, and a comeback of Asian demand, Bank of America says.
Although the U.S. is not very exposed to the natural gas crisis, Europe and Asia are, and the gas to oil switch will raise demand for crude, Francisco Blanch, global head of commodities and derivatives research at Bank of America, told Bloomberg on Tuesday.
Video of BOA $100 to 120/b oil price prediction for 2Q 2022 on Bloomberg TV at link below
https://www.bloomberg.com/news/videos/2021-11-09/why-bofa-s-blanch-sees-oil-headed-to-120-video
Inflation just came in at 6.2% annual. FED will be raising interest rates a whole lot faster than anybody is expecting them to.
Yield curve is likely to flatten. Long term yields falling and short term rising. Dollar bullish. Big time dollar bullish.
Only question left is do stocks sell off. If we get a risk off environment. I can’t see oil prices going where these banks think it will go.
HHH , this means a real interest rate of – 6 % (minus ) . The problem is that the FED cannot even raise the interest rate by 0.25% . An indication of tightening will crash Wall Street . My view QE(inflation) by other means will be unleashed but no interest rate rise till Q2 2022 . I agree that the final destination of these shenanigans’ is going to be a deflationary collapse . Oil price upper limit $ 95 and that too only a short time spike , then in reverse gear .
Hole in head,
Currently the prime rate in the US is 3.25%, typically economists focus on the core rate of inflation, that is 4.6%, so the real rate would be -1.35%, for those who can get the prime rate. Currently 30 year mortgage rates are about 3% for those with good credit scores, a real interest rate of -1.6% for the month of October. Note that inflation has been high over the past year (6.2%), but over the past 10 years in the US inflation has been low at 2% per year on average. For the past 30 years the average rate of inflation in the US (as measured by CPI) has been 2.36% per year.
Fed might raise rates a bit, or they may continue to wait, I think that they are correct in waiting for energy prices to stabilize and supply bottlenecks to ease.
Unless markets just absolutely implode from here. I think FED will call a special meet and hike rates before QE has even ended.
They going to let inflation go to 8 or 9 maybe 10%? I don’t think they will. They going to act.
The longer they draw out the rate hike the worse for market the rate hike is going to be. Inflation is 6.2 now. Next reading say it goes to 7. Well the market prices them in and dollar rally’s the whole time on growing expectations of a rate hike ,doing all kinds of damage to the economy.
HHH,
Fed focuses on core inflation rate which is 4.56%/year (Oct 2020 to Oct 2021), the average rate for the past 30 years has been 2.26%. Generally we see a bit of inflation when the economy grows rapidly as has been the case for most of 2021. The US economy has grown at an annual rate of 5% for the last 4 quarters (3Q2020 to 3Q2021 for real GDP using chained 2012$). From 1Q2017 to 3Q2019 the US economy grew at 2.6%, the US economy will slow, back to normal rates of growth (2 to 2.6%) and the supply chain will settle down once the rapid growth subsides.
Also oil and natural gas prices are likely to settle down at around $90/b and $4.50/ MMBtu.
If I am correct we won’t see core inflation above 5% and it will settle down to 3% or less.
HHH,
GDPNow estimate for 4Q2021 is currently 8.2% (annual growth rate). If correct, oil prices are likely to be high, perhaps not $120/bo, but $95/bo by 2Q 2022 is in the cards in my opinion.
Price came close to hitting my stop loss. Which is just above the high from two weeks ago.
Looks like my call was right for a turn lower. I’d have to see some solid support form to agree that higher prices are coming.
HHH,
We will see. I expect oil prices will rise long term. Short term market gyrations are of less interest to me.
Quite a change from the gloom and doom in the oil market with the price dipped to -$38. How quickly people forget.
LTO , SS , Mike S and all who are real oilmen . If this lady comes in power you better start a reverse countdown . Please accept my sympathies in advance .
https://www.zerohedge.com/energy/bidens-unhinged-socialist-banking-nominee-wants-oil-coal-and-gas-industries-go-bankrupt
Seems some people believe anything posted on the internet.
Get a grip.
HIH didn’t need to quote Zero Hedge. The same quotes from this nominee are set forth in articles by Newsweek, Bloomberg and many other mainstream USA media sources.
She did make this statement during an hourlong discussion.
She does have a view of banking that is much different than what would be considered mainstream in the USA. The NIA concept of hers is radically different from present.
Tester, Sinema and Manchin likely won’t confirm her, so I’d say she isn’t going to get the nod.
I’m being political on the oil blog, so sorry. But I agree with Amy Spannberger. Biden was elected to be normal and end the chaos Trump caused. The swing voters who elected Biden didn’t think they were electing another FDR.
This nomination is an example of Biden being out of touch. Why would Biden do this?
SS
You can see/hear Omarova with your own eyes and ears … as can anyone else so inclined to spend 2 minutes ‘researching’ by simply clicking on the linked ZH article above, then clicking on the linked threads in that article.
There are 2 video snippets – one 16 seconds long and the other 22 seconds long – wherein Omarova specifically states her intention of driving American hydrocarbon producers out of business by using the NIA to starve them of capital.
Not that different from mainstream American banking, which has always been heavily politicized. For example redlining is the practice of not lending money to certain neighborhoods based on skin color.
Also the government intervenes heavily in energy markets, for example by providing loan guarantees for nuclear plants like the Vogtle project, which simply cannot be funded otherwise. Pipelines also routinely require federal intervention to be financed, and petrochemical projects.
I guess it’s not socialism when you profit from it yourself.
I am squarely against redlining.
I also am not against government regulation, nor against certain forms of government assisted financing.
Why do you think my thoughts on this nominee would bear on any of those other things you mention?
Biden keeps shooting himself in the foot and I wish he’d stop.
Nominations like these are such unforced errors.
There are always many capable nominees for these positions. I would think the administration would fully vet many of them, determine which ones were going to cause problems due to past actions and statements, and avoid nominating them.
I thought Biden was going to unify the country. I don’t think jumping on the progressive bandwagon will accomplish the unification he promised. He thinks he needs to throw all of these bones to the far left. The far left didn’t cause Biden to be the Democratic nominee. The far left wanted Sanders, followed by Warren.
Biden was elected because enough people were tired of Trump. They were proven right on 1/6/21. But now the far left (who I estimate make up about 15% of the voting public, maybe less) want to steal defeat from the jaws of victory.
I am sorry to get political here, but Biden needs to do better, or we risk a return of Trump in 2024. I do not get the love for Trump, but man it’s still out there.
Maybe some of you need to head out to the rural areas in fly over country. There are still a lot of Trump signs out.
What is more important, placating the far left who didn’t want you as President and aren’t in sync with the vast majority of Americans, or unifying the country?
I will add, I know there are some far left posters here. Sorry to offend you. I know you strongly believe what you believe. But you hopefully at least can acknowledge the electorate is evenly divided and alienating center/swing voters is risky as hell for both 2022 and 2024?
Dennis , I am not the only one who is noticing what the lady is saying . Oilmen too .
https://www.oilystuffblog.com/single-post/we-have-a-winner?postId=a2df9495-3423-4bec-9323-996b0974a4ab
” … believe anything posted on the internet”.
Somewhat off topic from hydrocarbon related matters, but the nomination of Comrade Saule Omarova to become head of the Office of the Comptroller of the Currency speaks volumes on so many levels.
For any serious student of knowledge, communication protocols, current political trends, and more, an in depth examination of Omarova’s history and outlook could be … interesting.
Of course, pithy dismissals work just as well, I suppose.
Can anybody name former Comptroller of Currency without looking it up on the internet?
This seems like much ado about nothing.
Agree with Shallow sand that such nominations don’t do much to help democrats get re-elected.
Essentially the position seems to mostly be about Bank regulation and consumer protection. Doubtful she would have much direct influence on fossil fuel industry.
I love it when people pull out the Marxist card as Durden did, it makes me immediately question if the whole story is being presented.
Something we can agree on Dennis. I don’t think I matters one bit who they put in positions at the FED.
As long as inflation is running high they will be tightening monetary policy no matter who’s in and who’s out
HHH,
Comptroller of Currency works in the Department of the Treasury, not at the Fed.
The Fed Chairman is important imo.
And she is on tap to be next FED head.
HHH,
No I think you have it wrong.
See
https://www.washingtonpost.com/us-policy/2021/09/04/fed-powell-biden-nominees-brainard/
Excerpt:
If Powell is not chosen as chair, the widespread expectation is that Biden would nominate Lael Brainard, the lone Democrat on the Fed board. Brainard has consistently voted against the Fed’s moves to soften banking regulation and warned of the dangers of less Wall Street oversight, even when the economy is healthy.
Many people expect Biden will re-appoint Powell.
Maybe so. Yet at same time doesn’t matter who is in what position or what their political ideology is. Doesn’t change facts of where inflation is and is going.
The $5 trillion a year deficit spending just isn’t going to happen with inflation where it is at. If you can’t tame inflation spending comes to an end.
With COVID rampaging over Europe and Asia during winter this year. Supply side issues are likely to become much worse than they already are.
This inflation isn’t monetary in nature. But it also isn’t going away. All the lockdowns and government mandates won’t be helping with these supply side issues either.
And one more thing. There will lots of talks between nations. US and Russia are actually having talks over what can been done to increase oil supply. Now if talks don’t bare any fruit as in more supply. Then what?
My assumption is right now only tool that might be effective in bringing down inflation is rate hikes.
How far do you have to hike to get inflation under control? Your guess is good as mine.
HHH,
I see things differently. If covid becomes more of a problem as you believe, then economic growth slows, income grows more slowly and demand grows more slowly, this takes some pressure off supply chains. I don’t think pandemic problems will become worse, I expect they will get better as more and more people are vaccinated. I also think we are seeing a rapid rebound in demand due to recovery from the pandemic and this rate of growth will naturally slow down and take pressure off of supply chains and inflation will fall of its own accord. The Fed may raise rates a bit, but 4.56% core inflation is not that big a deal.
Dennis show me where wages are keeping up with inflation? You can’t because they aren’t. The consumer is going further into debt to bridge gap between what their wages can afford and prices.
The illusion of growth. The illusion of things are getting better . When in actuality things are way worse than the headline GDP or unemployment numbers indicate.
Best measure of how well an economy is doing is the total amount of goods and services. Now do those goods and services just cost more today than they did pre COVID?
Or do we have more goods and services than before giving us a higher GDP reading?
I’d argue we have a shit load less goods and services which is causing inflation. Not only in prices but in the GDP number itself.
HHH,
Take a look at real GDP (this is how goods and services are measured after adjusting for inflation.) You are correct that lately real median wages have been falling.
Real personal consumption spending dipped during pandemic then rebounded strongly, that is the reason the supply chain is having difficulty.
https://fred.stlouisfed.org/series/PCEC96
On real GDP the level for 3Q2021 is the highest it has ever been.
https://fred.stlouisfed.org/series/GDPC1
Click on chart for larger view.
Ah, GDP, a more useless metric to gauge how well off people are I’ve yet to see.
Kleiber,
Can you point me to better measure that iz widely available at the World level.
I choose real GDP because thefe is no better measure.
Imperfect to be sure, name a better measure.
You need to include energy and useful work and natural resources in there for GDP to mean anything. Otherwise, it’s basically just arbitrary, disconnected from reality numbers prone to fudge. This is how we get Nordhaus’ ludicrous climate modelling controversy or the idea that people are better off today because GDP = bigger. Might as well tell everyone the Dow Jones is at record levels, so quit complaining about things.
Kleiber,
Energy, and natural resources are included in GDP. Stock market prices have nothing to do with it.
So you do not suggest any alternative measure? Be specific, hand waving is of little use.
Note that this is not a happiness measure. Often wealthy people are not any happier, but most less wealthy people would be happy to have their income doubled (or increased by a factor of 10).
If you want to know what I’m talking about, check on the HARMONY model of GDP by Carey W. King. His recent book has a lot of good points relating to stuff we all probably already know on here relating to debt increase, energy expenditure per capita and the general malaise in the developed world.
This is rather more about gauging growth and what’s affecting it more than what present GDP is. But for answering why people are further in debt and the first to industrialise are suffering stagnant to declining prosperity and infrastructure, it’s instructive.
George
WRT to your earlier post above, I have taken a look at the completed vs drilled wells in the Permian. While my chart is different than yours, the last data point on the drilled wells graph is definitely showing signs of increased drilling.
This trend definitely needs to be watched.
I acknowledge there is increased drilling in the Permian and I also believe the GOR is rising because I have the proof as I watch our daily production and I know that each new child well is 50% less productive than it’s parent well. More drilling to keep production stable or slightly rising. With more drilling comes less available shale drilling inventory in the future. High deliverability over the past five years with increasingly lower R/P.
I have no idea about what Saudi has or whether it is selling Iranian crude. Usually by watching their actions, you should be able to pierce their opaque oil data. Their actions suggest that they are producing as much as they can and are enjoying a market of higher prices with fewer competitors. A ton of institutional money has fled the E&P industry and companies especially domestically are trying to figure out either how to grow or how to get out without Wall Street money. Their options are very limited as investors favor returns over growth. I look for more survival focused mergers and acquisitions to achieve better economies of scale even with higher prices and higher profits.
Guys , the shale players can drill , frac or do a headstand but no way they will breach 12,899 kbpd of Nov 2019 .
A dose of reality and fact checking . Separate the grain from the chaff .
https://www.oilystuffblog.com/forum/forum-stuff/fact-check-thread
Guy’s
This might raise a few eyebrows for various reasons.
https://www.lse.co.uk/rns/ZPHR/first-hydrocarbons-produced-at-state-16-2lncc-well-5rb2k9fpy6tdjxx.html
Lightsout , tks . A usual investor presentation all about how hard they work and what future prospects they have .Typical of a company that has never made a dime in profits and a ROI of (148 %) . You are correct ,surely raised my eyebrows .
Dennis , my reply to Eulen’s post vanished in the ether . Can you extract it and post . Just a minute or so ago .
Dennis , another one vanished . This was in response to HHH . Please retrieve .
Hole in head,
Not sure why this is occurring, they are being identified as spam, possibly the links are causing this.
Anyway tks Dennis , as they would say from where I come ” You, sir are a gem ” Take care .
Dennis,
DXY is at 95 and climbing this morning. All those dollars used to reflate the world economy over last call it 18 months are starting to come under pressure and unwind.
This situation should be highly negative for oil. As monetary underpinning for inflation comes undone. Ah but this isn’t monetary inflation we are experiencing. It supply side shocks.
Long term my money is on deflation winning out. Unless we get a different type of monetary system where central banks liabilities become legal tender.
At least in the EU cash money is direct central bank money. That’s the reason they need QE instead of setting interrest rates to lets say minus 4 ÷.
Without cash we would have seen this.
But with cash, banks would just lend out money at -4% and store it in a fortified mountain vault for arbitrage. The money would be the security to lend more…
It gets very interesting if the money paid for oil is converted to energy. The energy productivity curve (= World GDP in USD divided by world primary energy consumption) can be used for that. There has been a very linear correlation between GDP and energy, but for 2020 and 2021 i have no values now; inflation will influence the correlation.
After conversion the diagram below results. The Oil Price per barrel is in percent of the energy content of a barrel (BOE). The maxima of the spot price are the maxima the world economy can pay, because the corresponding energy value is what the economy receives from oil. The minima are required by oil producers (=OPEC ). If the price falls, they cut production, so that the price stabilises. In the autumn of 2020, the extrema lines crossed. Now the producers require more energy than the useful share of the world economy is. Where do the producer get this energy from ? They cannibalize the share of the world economy. They gray arrow results for the useful share of the economy. Now this share approaches even faster than before to Zero.
Goodbye, car industry.
Berndt , how did you arrive at the blue asterisks of car limit ? I am a skeptic , but I have also read your papers on Thermodynamics of oil production (11th March 2020 ) and so understand from where you are coming . Please explain .
HIH, with Dennis i have discussed the precursor of the diagram below. I have the time since 2013 divided in three time spans. For each span the change of monthly car sales is the y-axis, and the x-axis is the oil price. This gives a lot of points for each span, and a linear fit to the points gives a straight line, which hits the x-axis at a certain price. This price is a limit. Above the limit car sales decrease, below it car sales increase. In the first time span no influence of the oil price is visible, in the second the limit is 59 $, in the third it is 50 $.
The blue asterisk for the first span ist estimated and roughly the oil price before the drop in 2014.
Berndt,
The only line that gives a statistically significant result is 2019-2021, but the correlation is better explained by the drop in GDP due to covid and the chart tells us very little,
Note that the price indicated by the 2013 to 2015 line is a Brent price of $606/bo, so somewhere between $50/bo and $600/bo sounds about right.
Note that as more and more cars sold are EVs, the price of Brent crude will become less and less relevant, oil prices will fall to $30/bo (in 2021 US$) but still ICEV sales will fall as it will be clear that EVs are superior, I expect ICEV sales to fall to zero by 2040, especially in personal vehicle space, for heavy duty vehicles it might take until 2050. For water and air transport it will take longer, maybe 2070 to 2080.
You also need to account for the seasonality of vehicle sales for a meaningful analysis.
Berndt,
The price of oil has little to do with thermodynamics in a World economy where energy can be transferred between different industries (oil, natural gas, coal, wind, solar, nuclear, and geothermal). The oil price is determined by supply and demand.
Eventually the price of oil will fall, likely around 2028 to 2030 as World demand for oil falls below World supply.
You will claim it is because of thermodynamics when it finaly occurs, so are you predicting that the price of oil will be zero in Dec 2022? If not, you would be wise to redraw your chart to point to the time you actually expect this to occur. My guess would be 2070 at the earliest for the price of oil to fall to zero (though this may never occur). In 2050 I expect the price of Brent in 2021 US$ to be about $30/bo, the basis being supply and demand rather than thermodynamics (which has almost nothing to do with the price of any good,)
Dennis,
first the diagrams above have nothing to do with thermodynamics, only with car sales numbers, oil prices, and the energy productivity diagram below. 1 boe is 1628,2 kWh. No second law involved.
second : the diagrams show facts. Only the gray arrow is not a fact, it is my speculation/explanation. It is the prediction, that the car industry will get very heavy times.
third: long times i believed, that the oil industry will go together down with the car industry. But i revised my opinion, because the oil price increased the last months. The car industry will die first. The large number of existing cars will allow an relativly high oil price in the next year, despite only very small numbers of new cars get built.
fourth, my discussion with Seppo about thermodynamics resulted in a short report, which i sent to you with the proposal of publication. It is not my first goal to publish it, so i have not done it at another place.
Berndt,
World share of real GDP spent on oil from 1974 to 2020 with a projection from 2021 to 2032.
Note that I do not expect the 1974 to 2020 linear trend (not of any statistical significance) to be followed in the future.
If that trend were followed it suggests no spending on oil by 2064.
Dennis , this does not hold good “where energy can be transferred between different industries ” . Oil is a transportation fuel while others are for electricity production mainly . However the rest of your post needs an explanation by Brendt .
Hole in head,
The point is that a thermodynamic analysis would look at energy and entropy for the oil industry. There is a lot of energy supplied to the oil industry that comes from electricity produced from energy sources besides oil.
This is the reason that I point out to those doing a thermodynamic analysis of the oil industry that they need to look at all energy industries because the energy moves between different industries in the form of electricity mostly, but also in natural gas used in portable generators or to directly fuel transportation, but the bottom line is that nobody knows or cares what the EROEI of any fuel is, just ask an oil man if this figures into their business calculations, I am not an oil man, but I am pretty sure they would tell you they don’t know and don’t care.
The point of the business is to turn a profit, it is about high revenue and low cost.
@HIH,
i forgot to ask you:
Has my paper been understandable ?
Which part(s) have been most difficult to understand ?
Have you found errors ?
@HIH, Dennis etc.
Answer to other questions:
The fundamental difference between my opinion and Dennis’ is, that i believe, energy drives the economy. Dennis believes, money drives the economy. Dennis, i can’t remember you ever have mentionened energy aspects (exception: to contradict me).
Money is printed by central banks out of free air, energy is required to produce energy. So, we arrive at very different conclusions.
Berndt , yes . The maths was above my pay scale but the Physics I understood . In my schooling I was always good at PCM (Physics, Chemistry , Mathematics ) plus I have been following the ” peak oil ” discussion since 2005 so this was of great assistance in filling in the cracks . On the whole I got the gist of it maybe not the fine details .
Regarding the difference between your and Dennis ‘s viewpoint . I think it is that you are taking oil and Dennis is taking all energy sources in his circumference for the thermodynamic analysis . However Dennis can answer this better .
I am sure that Dennis also understands that ” the energy is the economy ” .Only those who are really naïve and post here would not know that . Take care .
Hole in Head,
As a computer guy, I would say information is the economy.
Obviously anyone in the energy business would have a different point of view!
Farmers will tell you farming is the foundation of everything.
I suppose if I knitted underpants for a living I would say underpants were key. After all, you can’t go to work without them, can you.
Alimbiquated , your computer needs electricity (energy ) and so does the process of recharging those batteries .
You wouldn’t be knitting underpants if you were on an empty stomach and wondering where the next meal was coming which you are sure of ( at least for the moment ) were it not for industrial agriculture ( conversion of hydrocarbons into carbohydrates ) . You are getting the cart before the horse just as you did in your post of bauxite and aluminium .
So let us put things in order :
1. Energy is the economy .
2. Oil is the master resource .
3. Diesel is king .
4. All money is a lien on energy .
QED .
‘t
Hole in head —
You probably never think about it, but there are a bunch of wires in your house that allow you to get electricity from the grid to the socket. All these wires connect the switches, sockets, fuses etc in your house.
Imagine connecting all those wires at random. What are the chance the system would work? Nearly zero, no matter how much energy you put in. changing a random configuration to a functioning system is adding information, aka “informing” the system, though that meaning of the word is rarely used these days.
The same is true of your car, which contains thousands of parts. You can’t just pop the hood and dump those parts in, they have to be precisely arranged, and a slight misalignment can make make the engine useless. Without the knowledge of how to fix it, all the steel and gasoline in the world won’t help. Furthermore each part is precisely machined based on knowledge of its future use.
Refining is an energy intensive operation. What does it do? It takes a muddle of different chemicals sorts them and cleans up the sorted portions for specific uses. It uses energy, but the energy is used to create order from the chaos — to add information to the system. The energy expended in refining is used to inform the product of the process. Better design can reduce the need amount of energy used.
The same is true in biology. Flowering plants waste huge amounts of energy producing flowers and nectar to attract bees. Why? Because bees have information about where other plants of the same species are located, and carry the pollen there. Bees sell this information to flowers in exchange for the energy of nectar. Sounds expensive for the plant, but better information has allowed flowering plants to totally dominate terrestrial ecosystems over the past 100 million years or so.
Animals are invest lots of energy to get information. Humans are extreme, using a fifth of their energy budget on their brains. sounds like a bad idea, but this information processing boost has turned us into the super-predator we are, despite being slow and feeble, barely able to even eat uncooked food.
In economics it’s the same thing. Better designs trump higher energy expenditures. This may not have been obvious 50 years ago, but anyone paying attention can see it everywhere now.
Look how electronic fuel injection replace carburetors. A mechanical device that decided how to mix air and fuel was replaced by smarter software, just like cassette tapes were replaced by music stored on a chip, mechanical watches were replaced by piezo-electronics, incandescent bulbs are being replaces b LEDs, and giant power plants with cooling towers are being replaced by solid state solar.
And then there are times when adding information and better designs just goes in one ear and out the other of the slow and feeble super-predator.
Hole in head,
Statements one through 4 are assertions with no proof. So this is not a proof.
The economy cannot be reduced to energy, the two are correlated because energy use increases with economic activity, but less energy is being used per unit of GDP (in constant dollars) over time. As we develop wind and solar power energy will become much less scarce.
Energy is the economy . Read this . It is in Italian but you can use google translate . This is not a hit piece by The Epoch Times ( Falun Gong ) but from Sputnik also called RT and owned by the Russian government which is friendly with Beijing .
https://it.sputniknews.com/20211115/collasso-energetico-in-cina-cresce-una-nuova-minaccia-per-leconomia-globale-13755458.html
Once the energy goes then so does the economy .
And another one . Why is Latin America in a mess ? Well the energy fell down aa few notches . Sorry in Spanish but google translate works .
https://crashoil.blogspot.com/search/label/el%20pico%20de%20la%20energ%C3%ADa%20en%20Latinoam%C3%A9rica
Declining energy = declining economy . Italy is the perfect canary in the coal mine .
https://www.enerdata.net/estore/energy-market/italy/
HiH,
again, two different things:
The thermodynamic analysis in my report calculates the exergy required for oil production. Which fuels or other sources deliver the exergy in reality is a different thing. Much of the exergy is not from oil; i think about the normal world energy mix of sources
https://en.wikipedia.org/wiki/World_energy_supply_and_consumption is used.
And ! SURPRISE ! today more exergy per barrel is used for oil production than the exergy the barrel of oil has. Ask Dennis to give you my email address, and i sent you the result of my discussion with Seppo. Without knowledge of the full story you can’t understand it. And i’m afraid, even in the report some facts should be added to get the full story.
Here you have an analysis about the subject of use of extracted energy ot extract it. The part of of the extracted energy to feed the extraction is of 15% by now and will increase in the future. https://www.sciencedirect.com/science/article/abs/pii/S0306261921011673?via%3Dihub&fbclid=IwAR284rk7bygw-SDztDyJ16OQxexPs8Vz9-UsyeWhGW5xl7hCt1cd2wglYAk
Well, the paper is about oil, not energy. The EROEI of electric transportation and electricity from wind, solar, etc are improving over time. Heck, even electricity from coal has an improving EROEI, at least in the US.
Which tells us that we should move away from oil as quickly as possible…
”Well, the paper is about oil, not energy.” @Nick G : oil and gas to be precise.
@Jean-Francois,
attached is an image from Charles Hall et.al., from the paper „EROI of different fuels and the implications for society“ (2013). In the image different types of EROI are defined.
First step is the standard EROI: The paper you have linked mentions an EROI of 15%. Halls paper mentions 10%. So we have an increase in eight years. You can imagine, that the last step „EROI ext“ in the diagram has a problem now?
In Halls paper the „societal EROI“ is mentioned. The thermodynamical necessary exergy is similar to that.
Berndt,
Energy is important, but the motivation for a business enterprise is to earn a profit. So a business owner tends to focus on money. Note that no single thing determines economic output, there a multitude of factors. The view that energy is THE essential ingredient is a highly simplistic view that I do not share.
Likewise the view that only money matters is also simplistic. Inflation adjusted dollars used to measure real GDP is just a simple yardstick that is indeed flawed, but probably the best measure that is readily available.
Using cars as a measure of economic well being is a far from ideal measure in my view. It is better to look at overall real GDP and there is very little correlation between the price of oil and real GDP at the World level. That is also a fact. There is a strong correlation between real GDP and energy use, the direction of causality runs from real GDP to energy. Also energy is being utilized more efficiently in terms of real GDP produced per unit of energy consumed.
You are correct that I don’t focus on EROEI, This is because the EROEI for a single product like oil is not important, only the EROEI of all energy sources used by society taken together is important.
Maybe some of the oil producers can let us know how important they consider EROEI of their oil production is. My guess is they have no idea what the EROEI is of the oil that they produce and could not care less. The concept may be of interest in the theoretical sense, but the concept becomes very difficult as the boundary of the analysis is widened to include total energy inputs for any energy source.
World real GDP (2010 $) per unit of Primary energy consumed (GJ) 2010-2020, increase of about 2$/year per GJ consumed. The long term rate of increase is lower from 1985-2020 at a slope of 1.31 $/GJ. The previous decade (2000-2010) was quite low at 0.71$/GJ.
The future rate of increase is of course unknown. My guess is that less fossil fuel use will lead to higher GDP/ unit of energy consumed because there will be less waste heat from other energy sources such as wind and solar and electricity in transportation use.
Dennis,
the thermodynamic evaluation says nothing about economics of oil producers. It says something about world economics. Most of the necessary exergy for oil production is not spent by oil producers, it is spent by nations or production of waste heat. The thermodynamic evaluation has to do with political economics, not business economics. (I dont know if i have translated the german expressions “Volkswirtschaft” and “Betriebswirtschaft” perfectly). If you have articles from Charles Hall: The Thermodynamic Necessary Exergy is similar to Halls “Societal EROI”.
Your diagram “2010$ real world GDP per GJ” is the same as my energy productivity diagram, but with different units. The increase of the GDP values is caused by inflation and technical progress. See diagram below.
Berndt , ” The thermodynamic evaluation has to do with political economics, not business economics. ”
I missed this one , must go back to reading your article again . Thanks for the clarification .
Berndt,
Real GDP adjusts for inflation, so no the increase is not caused by inflation, only by improved efficiency in the use of primary energy.
Political economists often like to find an objective measure of value such as labor. There is no objective measure of value, any good could be used. See the work of Piero Sraffa where he hoped to use input output analysis to show that any good can be reduced to its labor value in hours. What becomes obvious once we do the math is that the choice of measure is entirely arbitrary, we could use shoes, apples or capital as the appropriate measure.
In fact we could create a capital theory of value where capitalists are exploited by workers, or we could create an energy theory of value. All are equally arbitrary and of little practical use.
Bottom line there is no objective measure of value.
One can pound the table with a shoe and insist that labor (or energy, if that is preferred) is the source of value. But the claim remains just a claim.
The roman imperium has conquered the surrounding countries to steal their gold and silver.
The hispanic fleet has plundered South america for gold and silver.
Hitlers armies have died at Stalingrad on their way to conquer the caspian oil fields.
The US government has conducted two wars to secure access to Iraquian oil.
Most people in leading positions seem to heard never of Sraffas ideas.
Either Sraffa is totally wrong or your interpretation.
I propose to read “David Graeber: Debt: The First 5000 Years”
Berndt,
Talk to any political economist and they will be familiar with Sraffa.
Oil will not be very important in 20 to 30 years, and energy may be very abundant (the solar resource is very large).
Oil will not be very important in 20 to 30 years,
If we are lucky enough to have electric airliners, electric long-haul trucks, and a total solar and wind grid in 20 or 30 years from now, oil will still be very important. Plastics will still be made from petroleum, lubricants will still be made from petroleum, asphalt will still be made from petroleum.
Oh, I know, these things just might be made from thin air but I seriously doubt it will happen. And I seriously doubt that all air travel and freight hauling will be electric in two to three decades from now.
Oh, I wish it would happen, I would love it if we could just get rid of fossil fuel and petroleum products like plastics, fertilizers, and the hundreds of other things made from petroleum. But I live in the real world, not in a dream world. I don’t believe in miracles and never have.
Dennis , “Oil will not be very important in 20 to 30 years, and energy may be very abundant (the solar resource is very large). ”
I can only think of two explanations for this statement from you .
1. You are yet to have your first cup of coffee this morning .
2. You got out from the wrong side of your bed .
🙂
Ron,
There will be plenty of oil for those uses, so from a geopolitical perspective oil will be of less importance, also there will be enough energy produced in 30 years (so I am talking about 2051) from wind and solar that synthetic fuel can be produced to replace most uses of petroleum. Plastic can be recycled. Some may continued to be produced using natural gas and petroleum, but there will be plenty of resource to provide for those uses.
Hole in head,
Energy is likely to be plentiful in the future as population growth slows (peak likely by 2070, possibly earlier) and as real GDP per unit of energy consumed continues to grow (this rate has been about 1.45% per year over the past decade). As population growth rate falls to zero, the growth in World real GDP per capita (long term rate abut 1.45% per year) can be met by technological progress in the efficient use of energy.
So this is just a long term outlook based on past trends.
Not what doomers want to hear, it is just a different perspective on what is possible.
As always the future is not written, we will learn as we go.
Dennis , “what is possible. ” . It is possible that someone may deposit a million dollars in my bank account , but probable —-hmmm now that is another story . 🙂
Things that make me go –hmmm.
Crude Oil Is Back, And It Isn’t Going Anywhere Bold mine
Pressured by investors and society, the global oil industry is looking for ways to stay in the game by meeting the world’s growing demand for energy, including crude, with the lowest carbon emissions possible.
Such a feat by an industry so entrenched into our existence could surely secure its position even in a green future. Have they recovered enough from the pandemic to take on this monumental challenge?
Oil Demand Is Back
A year and a half after the 2020 COVID crisis began, analysts, forecasters, industry executives, and investment banks have been forced to acknowledge that the pandemic did not, in fact, sound the death knell for global oil demand.
Consumption has roared back to pre-crisis levels—or is at worst merely weeks away from reaching them. It has become evident for all observers—even reluctant ones, including the harsh critics of the ‘keep it in the ground’ camp—that the world will not move away entirely from oil—at least not for decades to come.
SNIP
Some supermajors, such as Shell, have said their own oil production has already peaked. All international oil companies are boosting investments in reducing their emissions and are using the cash from profitable oil and gas projects to invest more in lower-carbon energy sources.
It’s not easy to be a supermajor these days—investors, activist shareholders, and environmentalists want accountability and lower emissions, but the world still runs on fossil fuels and will continue to need oil and gas for decades, whenever peak oil demand occurs.
Finally a company that is willing to state the obvious with regard to EVs. Only the rich well developed countries with a reliable electricity grid can adopt EVs in the near term.
Toyota says large parts of world not ready for zero-emission cars
TOKYO, Nov 11 (Reuters) – Large parts of the world are not ready for zero-emission vehicles, which is why Toyota Motor Corp (7203.T) did not sign a pledge this week to phase out fossil-fuel cars by 2040, the world’s largest automaker said on Thursday.
“However, in many areas of the world such as Asia, Africa, Middle East … an environment suitable for promoting full zero emission transport has not yet been established,” the spokesperson said. “We think it will take more time to make progress…; thus, it is difficult for us to commit to the joint statement at this stage.”
According to a study published by the Munich Mobility Show in April, there are huge global disparities in electric vehicle ownership. read more
Sales are soaring in the European Union, China and the United States.
But cumulative electric car registrations through 2020 in South America, with a population of more than 420 million, were below 18,000.
And registrations in Africa, home to 1.2 billion people, were exclusively in South Africa and totaled just 1,509 cars through 2020.
https://www.reuters.com/business/cop/toyota-says-large-parts-world-not-ready-zero-emission-cars-2021-11-11/
Ovi,
Much the same occurred with ICEVs in the 20th century, developed nations got them first and later they spread to the rest of the World. In 2020 about 657000 passenger cars were sold in Africa. So about 55 vehicles per 100,000 people. In the US the sales rate per capita was about 20 times higher. In south and central america the per capita sales rate for personal vehicles is higher at about 42% of the US rate in 2020.
High oil prices will eventually lead to more EV sales in South America.
Note also that presently demand for EVs outstrips supply so the highest bidder gets the cars, the wealthier nations will adopt first and as the market gets saturated the EVS will move to less developed areas. Probably 2025 to 2030 in South America, maybe 5 years later in Africa.
Toyota is the one big automaker that has lagged the rest of worlds auto makers on developing vehicles with plugs.
Simply, they have missed the boat thus far. They are a no show. They don’t have a vehicle in the top 30 vehicles with plugs.
All the other companies are very far out ahead on this.
So take their attitude in context.
They finally have dipped their toe with their first EV model ready, but with very low production planned thus far. And their plugin hybrid RAV4 prime is a very good vehicle [42 miles electric and 600 mile total range]
I suspect they will eventually salvage considerable market share, but they are starting from far far back.
Vehicles with plugs now make up over 10% of new car sale sales in both Europe and China, and growing a very rapid clip. [1st half 2021 12% China sales and 15% European sales]
Luckily, since we are at peak oil plateau folks. And that means future supply shortage and price escalation.
Imagine the petrol supply situation today if those China and European sales of the past few years had all been petrol. Sure those with a big vested interest in oil shortage would be smiling, but the other 99% of humanity would be struggling (more).
Hickory.
Toyota announced in April, 2021 an $803 million investment to a Midwestern factory to add two EV lines, with production expected to start by 2023. This will add 1,400 jobs to this factory, which will continue to produce ICE vehicles.
My wife and I bought a Toyota Camry hybrid back in 2008. It was a great car, and it held its value too. It got almost 40 mpg both city and highway, and also had plenty of room.
I think the difference between Toyota and the other automakers is more about publicity than what they are actually doing.
For example, to me it makes more sense to develop plug-in EV with fuel backup capability. I would be much more interested in such a vehicle than a strictly electric vehicle, as there are times I need quite a bit of range, as I live in a rural area.
My opinion is that Ford and GM need the EV publicity more than Toyota, given the formers’ financial positions. But that doesn’t mean Toyota is doing nothing. A google search of Toyota and EV bring up a lot.
Speaking of which, maybe again getting too far from oil, but it will be interesting to see how Rivian does. Huge IPO.
Shallow sand,
I also live in a rural area and the charging infrastructure works fine with a Tesla. I also have a camry Hybrid (2013). The Model 3 is a much nicer car (though more expensive as well). I have never owned a luxury car before (like a BMW or Mercedes) so the Model 3 might not compare as well to those cars.
The BMW 320 was the best car I’ve ever owned.
But I’m driving a Toyota Yaris these days.
When in Marin and Sonoma was in friends EV on a regular basis.
Central Oregon?
Never.
https://en.wikipedia.org/wiki/BMW_3_Series
Hightrekker,
There are a couple of superchargers along route 20 in Oregon and some on 84 and 5.
Map at link below
https://www.tesla.com/trips
Dennis—
Yea, bird watching friends who just moved out from the East Coast have a Tesla 3, and they are getting by, but it has been challenging.
Yes planning is required and the long range version works better in rural areas. Distances are probably longer in Oregon than in my relatively small state, so it might be a challenge.
Hickory/SS
Toyota’s mistake was to bet on the hydrogen fuel cell. They woke up a few years ago and realized that was the wrong way to go for cars. Maybe heavier vehicles. Bus is a perfect vehicle for hydrogen fuel cell.
Toyota is now trying to develop a solid state lithium battery. Many other are also trying to do this because it is not prone to catching fire. Not sure where that technology stands today. I get the impression they are being dragged reluctantly into a standard lithium battery.
They are concerned with cost and supply of Lithium. Both Toyota and Mazda have put out reports that say the ideal car should be a hybrid with a range of between 100 and 125 miles. Battery size is smaller and cost is reduced. They can make three hybrids vs one all electric that goes 350 miles. Makes a lot of sense but I am not sure there is much of that going around these days.
Yep, and Yep.
They’ve got a lot of catching up to do.
The CEO is holding them back in a big way.
Subaru just introduced their first EV- Solterra. Its one a platform jointly developed with Toyota.
Better ask a Chinese manufacturer.
The Chinese produce three times as many cars as the Japanese, and the best selling EV in China only costs about $4000. Furthermore the Chinese are heavily engaged in Africa.
I take these remarks from Toyota as a statement of intent: They are not going to try to get into the African market. Fine, but that does not mean nobody will.
The question as always is whether there is demand for EVs in Africa. It’s worth noting that Africans are more likely to have a mobile phone than electricity or indoor plumbing. You may wonder how you can use a mobile phone without electricity, but millions of people figured it out. So don’t expect the continent to follow the same trajectory as the OECD. If someone comes up with a compelling product, they will buy.
Yes, in the 21st century, Africa’s biggest problem is if they can afford to buy EVs.
Oh man, have I got a story for you. There’s this thing called climate change…
Truly renewables will save us.
As media pundits (including myself) never tire of telling us, Tesla and Apple have a number of things in common — both grew very quickly on the strength of a revolutionary invention, and each has created an ecosystem of products and services, some of which consumers never knew they needed, until they did.
Ironically, the companies’ respective markets would seem to have very little in common. Cell phones (and computers, for that matter) are commodity-style pieces of hardware — one looks much like another, and it’s the software and associated services that differentiates them. Cars, on the other hand, come in every form factor imaginable, from the smart car to the Hummer, and drivers today give little thought to the underlying software, as long as it works.
There are good reasons to believe that this is going to change. Software is rapidly becoming central to the driving experience, and some believe that, in the self-driving future, the cars themselves will eventually start to look the same. We’re not so sure about that, but it’s plain that automakers fear a future in which they become assemblers of commodity, low-margin products, and they’re keen to establish new revenue opportunities in software and services.
So, will Tesla match Apple’s success, becoming the dominant player in its industry? Quite possibly. Will Ford, GM, et al go the way of Blackberry and Ericsson? Stranger things have happened. Will the auto market come to resemble the smartphone market? Maybe a little. Will cars turn into phones, or phones into cars? No.
Liberal
Apple computers and iPhones are the equivalent of what BMW was to ICE cars. Quality and refined design.
Similarly Tesla is the BMW of BEVs.
I’m impressed my utter shitpost got approved.
Anyway before I get banned again I just want to add that all the useless heavy crude is being rejected by refineries.
https://www.google.com/amp/s/financialpost.com/commodities/energy/while-oil-prices-are-surging-canadian-crude-is-getting-cheaper/wcm/e47e8229-7b37-4e1b-a7e5-7fffa76aa970/amp/
As I repeatedly said Dennis is projecting something that doesn’t even matter, and the growth of canadian, Kuwaiti, Iraqi, Volga and now Zuluf heavy output does nothing because only light oil is useful.
Liberal , why should I be worried . The article does not say that it is rejected , it just says that the refineries are only willing to buy at a bigger differential to WTI . At the end of the day this WCS will be refined . This is unlike the 3.5mbpd of Shale that has to be exported since the refineries in USA will not offtake this at any price . As to growth projections by Dennis my view has already been postulated so I will refrain .
The news doesn’t really cover it. Since June diesel production is down 5% while total production is down 2%. This may be meaningless but we will see a wedge like this as diesel is sacrificed for other fuels.
A diesel generator runs 50k hours. A gas generator is 2k. 50 watts per kg. Steel is maybe 50mwh a ton so 25 watts per kg over the life of a gas generator is half what it makes. Diesel generators are used because they’re much longer lived and even if gasoline was useful you can’t make it with tar anyway. The middle distillates fail first because of the dumbbell effect.
The “Dumbell effect ” . I remember West Texas ( Jeffery Brown ) coining this term when he wrote about the mixing of high API shale with low API WCS and the resultant blend being refined . He did say that their is very little middle distillate after the refining of this blend and most of it was the gasoline at one end and residue ( bitumen etc ) at the other end .
They are actually using 7% ethanol and not the regulated 5% in terms of EIA refinery input. Also, as an aside, EIA doesn’t reconcile mathematically. EIA production plus stock loss plus net import is 2% less than net refinery and blender crude input. They are pre refining to boost the volumetric barrels.
If the volumetric numbers are inconsistent this can make anything happen with inventory, it is combining dissimilar densities. This makes heavy oil a disproportionate share of the mass also.
Also, soy is low api, but I’m guessing they can use it on condensate. Biofuel provides structure, it stabilizes the disordered decayed natural products into oil. This prevents the dumbbell effect to some degree because the structure will average into more consistent patterns like aromatics. There’s whole areas of petroleum geochemistry nobody has quantified.
I keep reading that the COP 26 conference is proposing that all government’s have to stop subsidizing fossil fuel production.
Could someone in the industry tell me if there are subsidies for producing oil. All I hear is the taxes and royalties you pay.
I Just looked up some of the subsidies (from a 2011 source). The larger ones include:
Volumetric Ethanol Excise Tax Credit
Intangible Drilling Costs
Oil and Gas Royalty Relief
Refinery Equipment Deduction
John Kerry recently, at the CoP 26 climate talks, called these subsidies the “definition of insanity”.
I’ve read other places these subsidies also include government assistance for people to pay for their heating fuel costs. I wonder if he would want to eliminate that one?
SouthLageo
That list strikes me as a typical business expenses that most businesses could write off. Drilling costs are a typical business expense. For instance, is the last one, RED, the same as depreciation on a capital asset?
An article that looks at subsidies form 2019.
https://www.eesi.org/papers/view/fact-sheet-fossil-fuel-subsidies-a-closer-look-at-tax-breaks-and-societal-costs
information from IMF at link below
https://www.imf.org/en/Topics/climate-change/energy-subsidies
This is the big one. I have been hearing complaints about it for decades.
The Oil Depletion Allowance Bold mine.
Oil depletion allowance
From Wikipedia, the free encyclopedia
The oil depletion allowance in American (US) tax law is an allowance claimable by anyone with an economic interest in a mineral deposit or standing timber.[1] The principle is that the asset is a capital investment that is a wasting asset, and therefore depreciation can reasonably be offset (effectively as a capital loss) against income.
The oil depletion allowance has been subject of interest, because of the relationship of big oil with the US government, and because one method (percentage depletion) of claiming the allowance makes it possible to write off more than the whole capital cost of the asset.[2]
Ron
The oil depletion allowance makes sense under the Cost Depletion method.
I can see the problem with the % method. So you buy some oil acreage for $1M. You find oil that is worth $10M. The 15% allowance will give the company a deduction of $1.5M.
So what happens when the company spends $1M and finds no oil?
Well, if they spent $1M and found no oil, they would not need to use the Oil Depletion Allowance loophole, they could just write off the whole one million against profits if they had any. Anyway, I have no idea how it really works. But you might find the below-linked article interesting.
The Oil Depletion Allowance: The Largest Tax Loophole in American History
The tax code has numerous loopholes in it that reduce tax burdens, as many Americans discovered upon the New York Times report of President Trump’s taxes, which told a tale of tax avoidance. There are, however, not as many as there used to be and the most substantial one was the oil depletion allowance.
The rest of the article will give you an inside look at how American politics works. You won’t know whether to laugh or cry. However, here is the last sentence of the article. It looks like this loophole is almost completely gone.
In 1975, with an increase of liberals in the House and Senate, the oil depletion allowance was completely removed for companies that produced over 2,000 barrels a day, and gradually reduced for smaller producers until it hit 15% in 1984. This is where the oil depletion allowance stands today, a shadow of its former self.
I have discussed cost and percentage depletion in depth here in the past.
Cost depletion is deduction of the intangible cost of a lease.
For example, I buy an oil lease for $100K. The tangible equipment is worth $50k. I depreciate the $50k tangible equipment, as do all other businesses in US industry. I deduct a certain percentage each year until the basis is reduced to $0.
The remaining $50k intangible expense (the price I paid for the oil reserves) is subject to cost depletion. I can deduct a percentage of the $50k intangible expenses until it is reduced to $0.
Percentage depletion is the true subsidy. The producer deducts 15% of gross sales. So, if I sell $100k of oil from the lease, I can take a $15k percentage depletion deduction. However, I can only take percentage depletion on the first 1,000 BOEPD I produce, so the deduction is targeted to small producers.
I cannot take both cost and percentage depletion on the same lease (property). I have to elect one.
The idea behind continuing to permit small producers the percentage depletion deduction is to extend the life of low volume wells. Percentage depletion has been in the Democratic Party’s crosshairs since at least the Obama Administration. Of course, as I have mentioned many times, President Obama referred to percentage depletion as a Big Oil tax break. Big Oil = Integrated Majors, which cannot take the percentage depletion deduction at all.
The stripper well groups have worked hard to educate Congress on the differences between them, shale and the integrated majors. It’s seems to have worked. Percentage depletion is still on the books. The methane regulations appear to exempt stripper wells, although states have the option of being more strict than the Federal rules (these haven’t been written – so things can change).
As I have also mentioned, DOE has undertaken a study of methane emissions from stripper oil wells. Preliminary findings indicated negligible to no emissions from stripper oil wells in the regions studied. But I don’t think the final report has been released.
Politicians say a lot of inaccurate stuff regarding oil. Most of them don’t know what they are talking about. Which doesn’t lend much confidence to statements about many other matters.
Shallow Sand
Thanks for the example. Clarifies a lot, especially the 1000 barrels.
Subsidies are irrelevant, you cannot stop oil coming out of the ground when it is drilled.
I was asking myself exactly the same question, could not find yet a clear explanation of what these subsidies are.
I would call master limited partnerships a loophole that is a de facto oil and gas subsidy in America.
Yes, in fact what is called subsidies is tax cuts more than anything it seems.
Which is a bit of a strange definition. (compared to real subsidies).
Also it seems that government backed loans are also considered subsidies in a way.
But it is also true that one could consider a big part of western armies fossile fuels subsidies …
Every publicly traded upstream oil and gas master limited partnership in the USA went bankrupt between 2015 and 2020.
I think shale overproduction provided US consumers more of a subsidy than the Internal Revenue Code provided to upstream producers from 2015-2020.
US shale didn’t pay income taxes from 2015-2020 because it spent considerably more money than it took in.
It looks like in 2021 US shale might finally be trying to spend less than it takes in.
“Remember Mad Max: Fury Road? That was six years ago”
https://twitter.com/ClimateHuman/status/1459357403581849601
Mad Max 2: Road Warrior was 40 years ago
https://twitter.com/WHUT/status/1459545858882486272
Peak Oil then, Climate Change now, how soon we forget
Oil peaked in 2005.
https://web.archive.org/web/20210714083822/https://peakoil.com/forums/the-world-outside-america-has-been-in-peak-oil-since-2005-t78054.html
With regard to climate this graph is the tell, all the shutdowns due to COVID only resulted in the small blip on the blue line the other plots are pure fantasy.
The chart is a graphic reminder of how amusing we apes are.
Our intellects are no match for our appetites.
Tight oil production
World C+C to December 2020
http://crudeoilpeak.info/latest-graphs
Can’t post a pic of the latest, but it’s at the top of the column
Crude plus condensate is already stretching but but now its crude plus everything. Eia is tracking storage tanks with water and Canadian heavy. You can see a large divergence between state data and eia for Texas and Dakota. RRC already has incentive to overstate production for taxes.
For UAE their exports are falling, they have a heavy expansion for Zuluf. All the Saudi fields except ghawar, abaqiq and khurais are unconventional.
Liberal , you are correct . US production 11.7mbpd of this
6.5 mbpd Shale + 47 API (Crap)
1.0 mbpd NGL (Crap)
1.0 mbpd biofuel (Crap)
1.0 mbpd Refinery gains ( Crap +) .
Only GOM + Alaska and L 48 matter . = 3mbpd . Figures are rounded off . I think the same lying is going on worldwide . All producers are squeezing all they can before TSHTF .
I made a bunch of excels with ethanol math explaining why everything is failing due to falling ethanol and biodiesel stocks- the pixie dust used to raise tar api.
https://i.ibb.co/6wY2qDY/D8-A85-AAB-D19-A-40-B8-8-FA4-75674-FE29-F18.jpg
There’s a critical ratio here. 15m BOE makes 5m diesel. That makes 3m corn and 1m ethanol.
Ethanol api 50, but with better structure, tar api 25. Light oil is api 35-45 which is 50-80% residue.
1 refined barrel makes .2 diesel.
.2 diesel makes .2 corn.
.2 corn makes .05 ethanol.
.05 ethanol makes .2 light oil from tar.
.2 light oil makes 1 refined barrel.
Refineries have no awareness of any of this. The entire ethanol game delayed collapse by five years. Without ethanol it would be as simple as light oil died in 2021 and you’re dead. Because ethanol allowed some medium grades it delayed things 5 years.
All Saudi production except ghawar, khurais, abaqiq is unconventional or soon to be. Kuwait and Iraq are heavy. Bazhenov has some heavy. Russia imports oil (???).
I made a separate ghawar decomposition, already posted
https://i.ibb.co/Tt87hsd/BCF2-DC54-47-E0-4-C4-A-8-BE1-AF79-BDF33-DFA.jpg
Ghawar is an old field and everything points to collapse.
Saudi production is a wedge between their own consumption and exports. I assume they keep light oil for themselves. That gives something like
https://i.ibb.co/SwtY9rd/6-C7-EFE2-F-857-D-4784-9794-A05867-D23698.jpg
So there are multiple wedges here
1. Light oil running out
2. Saudi keeping it for itself
3. The new expansions being heavy
4. The wedge between (1) and (2) tightening
And everyone dies in like 3 years.
I wish Matt would update his lovely layer cake chart. It be eye candy for da doomer in me.
Which country will cover this loss in production ?? Oh and this is light oil that is going missing .
https://thenationonlineng.net/why-nigeria-crude-oil-production-is-declining-by-experts/
Good find HIH, Nigeria and Angola are looking worse off than Libya at this point. Africa will also disappoint the next few years due to low rig count and vandalism.
From the article:
“An OPEC document entitled “Crude oil and Condensate Production 2021,” shows that in July Nigeria produced 1.323 million barrels per day (mb/d) while it produced 1.238mb/d in August, 1.246mb/d in September and 1.227mb/d in October.”
More on Africa:
https://oilprice.com/Energy/Energy-General/Why-The-West-African-Oil-Boom-Ended-So-Abruptly.html
““Besides, saboteurs have been vandalizing the pipelines. There are also largely issues of oil bunkering bedeviling production in the country. With all these heinous activities, how do you expect Nigeria to meet its OPEC?”
I’ve read somewhere that this represents 25% of Nigeria production (cannot find the source back), seems huge.
But the pirate “refineries” industry are really impressive, see below around 7:30 for instance :
https://www.youtube.com/watch?v=9_jkZmSSDB0
looks quite “mad max esque”
The third quarter upstream capital cost index from HIS had a reasonably large increase, though not as much as the second quarter. I think it will keep on increasing for a time if oil prices stay high, but may be flattening out.
It is a pity the index only goes back to 2000 as I would like to see what happened to it in the 90s. OPEC then had some control over prices but in about 1996 there was a time when wages and costs in the upstream seemed to spike. Two or three years later oil price fell by about 50%, almost to $10 and many projects were cancelled, and presumably costs fell. After that prices rose by about 250% over a couple of years, fell modestly and then went bonkers from about 2005. I had thought this was the time OPEC lost control but in retrospect it might have been as far back as 1996.
Now that OPEC has given up any pretext of be able to control the market it will be interesting to see the dynamics and volatility in the prices and costs and how they compare to previous times. A dampening effect on costs might be that the majors don’t seem that interested in investing in new projects, certainly not as they were in 1996, 2005 2011-2014 and 2017, so maybe costs are less volatile but prices do who knows what. I don’t know how much the NOCs impact the UCCI, there is input from the service companies and EPIC engineering contractors but not the operating companies themselves.
The downstream index continues to rise to new peaks, I don’t know why, but it must be affecting refined product prices independently of oil prices at some point.
New posts up
https://peakoilbarrel.com/opec-update-november-2021/
https://peakoilbarrel.com/open-thread-non-petroleum-november-15-2021/