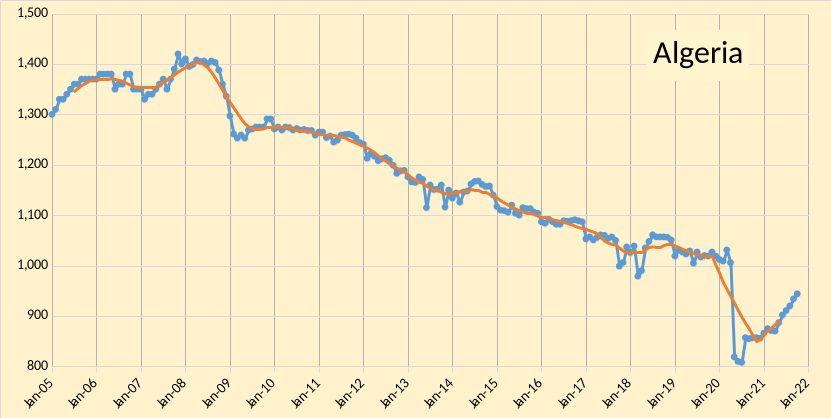
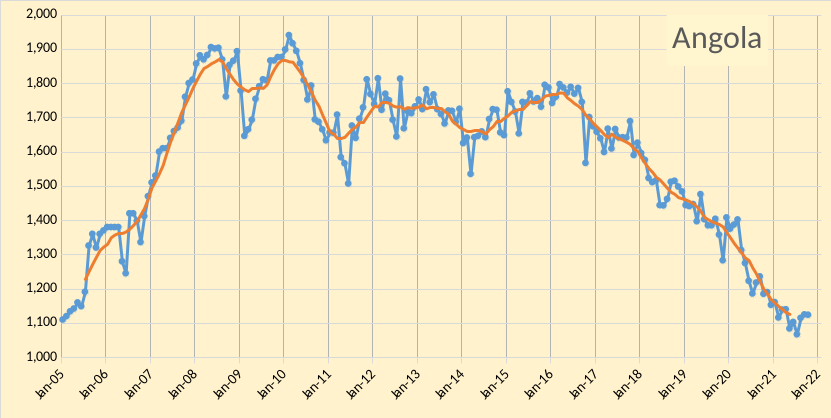
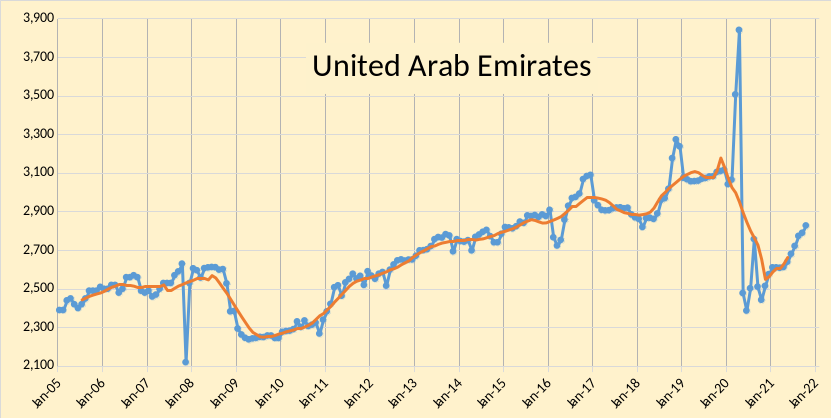
The OPEC Monthly Oil Market Report for November 2021 was published this past week. The last month reported in each of the charts that follow is October 2021 and output reported for OPEC nations is crude oil output in thousands of barrels per day (kb/d). In the charts that follow the blue line is monthly output and the red line is the centered twelve month average (CTMA) output.
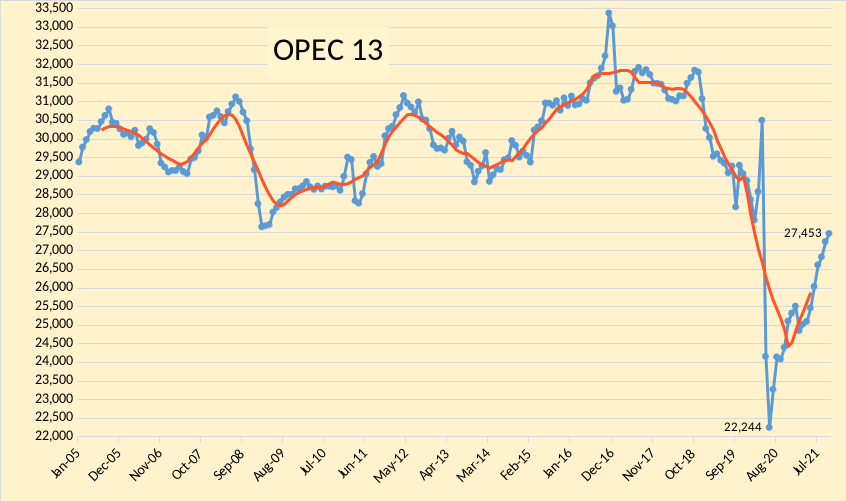
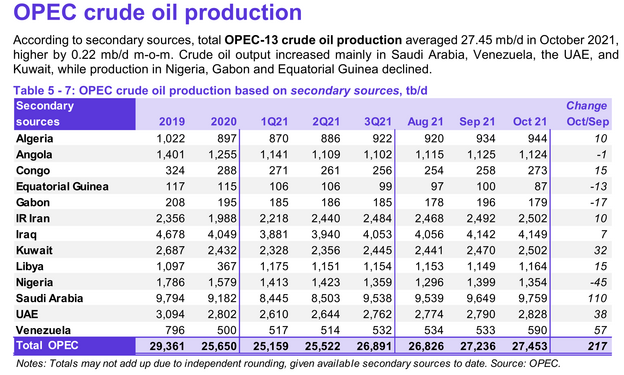
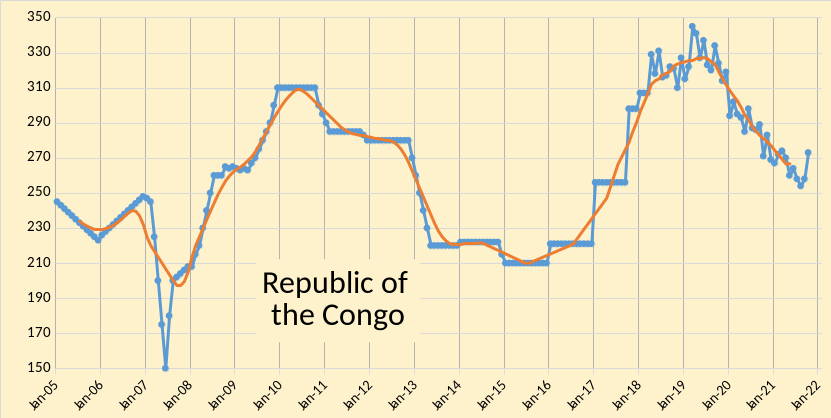
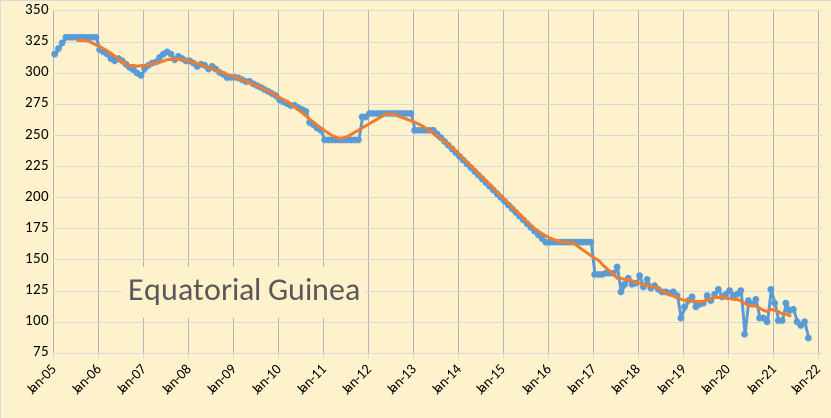
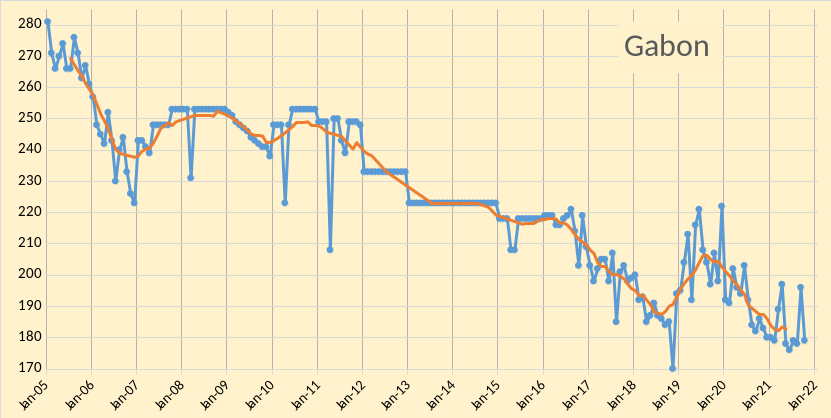
OPEC produced 27453 kb/d of crude oil in October 2021 based on secondary sources, an increase of 217 kb/d from September 2021. September 2021 output was revised lower by 92 kb/d from what was reported last month and August 2021 output was revised down by 16 kb/d compared to the October report. Most of the increase in OPEC output was from Saudi Arabia(110 kb/d) followed by Venezuela (57 kb/d), UAE (38 kb/d), and Kuwait (32 kb/d). All other OPEC members saw increases of less than 16 kb/d in October 2021. Decreased output from Nigeria (45 kb/d), and Gabon, Equatorial Guinea, and Angola (combined decrease of 31 kb/d).
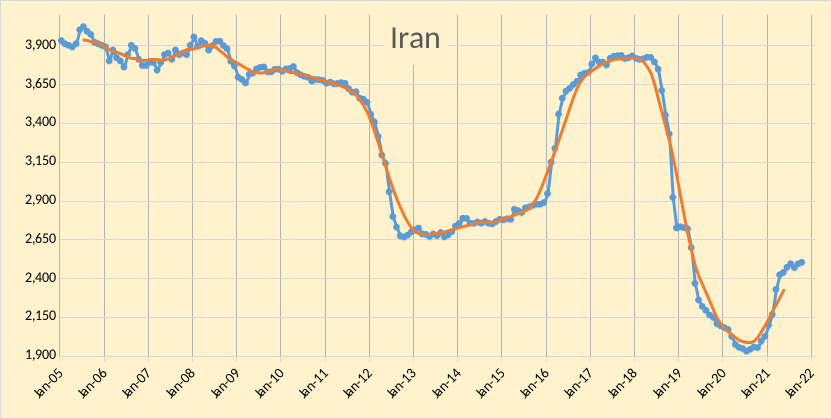
OPEC crude plus Russian C + C output was 38252 kb/d in October 2021. The most recent centered 12 month average was 36201 kb/d. At the recent World 12 month centered average peak in World output (Nov 2018), Russian and OPEC centered 12 month average output was about 42200 kb/d. Note that Iranian and Venezuelan centered 12 month average output was about 1200 kb/d higher than the October level of output in November 2018 (sanctions had only partially taken effect). If Iranian sanctions were removed we might see OPEC plus Russian output reach as high as 41000 kb/d by the end of 2022.
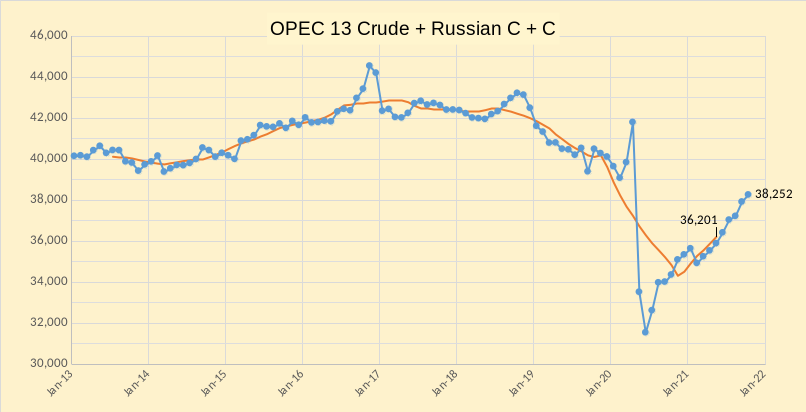
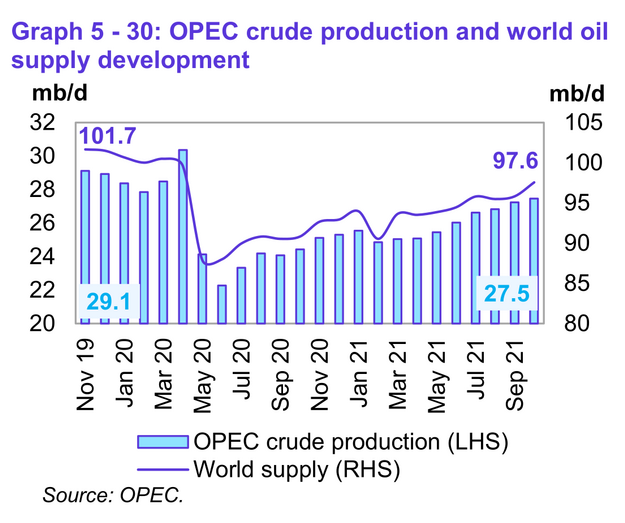
World liquids output increased by 1.74 Mb/d in October 2021 to reach 97.56 Mb/d, this is about 4 Mb/d less than liquids output in November 2019 (101.7 Mb/d).
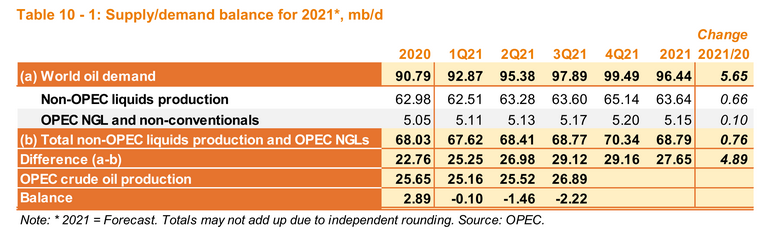
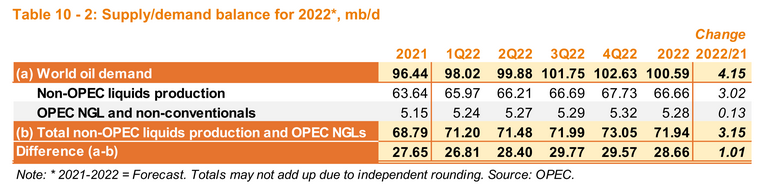
I expect that OPEC will struggle to increase crude output above 28500 kb/d, unless Iran gets relief from sanctions, with Iranian sanctions relief OPEC 13 might be able to produce 29800 kb/d of crude. The call on OPEC will be close to 30000 kb/d for the second half of 2022 based on OPEC estimates. Note that in 2021 they expect non-OPEC output to increase by 660 kb/d above the 2020 level and in 2022 that the non-OPEC y-o-y increase will be 3020 kb/d (more than a factor of 4 higher than in 2021). If this non-OPEC supply estimate proves optimistic, the call on OPEC would be even higher than the current OPEC estimate, probably about an extra 1000 kb/d, even with Iran returning to 2017 level of output of 3800 kb/d (which cannot happen in less than 6 months) OPEC would not be able to meet a call of over 30000 kb/d and oil demand will exceed oil supply at the current oil price level (about $82/b for Brent as I write this).
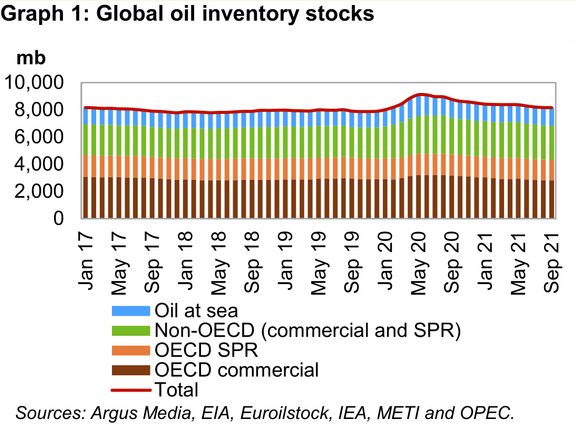
The chart above is from page v just after the Oil market highlights of the Monthly Oil Market Report (MOMR) and just before the table of contents. This feature article is well worth the 3 minute read and covers World oil stock levels as summarized in the chart above. They give figures from the peak in June 2020 to September 2021 and say World stocks from all sources decreased by 938 Mb over that 15 month period. My estimate from the chart is that the peak was about 450 Mb above the 2020 average stock level.
Looking at the 2021 balance of supply and demand (figure 5 above), the 2020 average stock level should have increased by about 1055 Mb above the 2019 average stock level and has decreased by about 342 Mb in the first 3 quarters of 2021 and is likely to decrease another 151 Mb during quarter 4. This suggests World stocks remain about 560 Mb above the 2019 average stock level (assuming OPEC estimates are correct and my guess for OPEC 2021Q4 output is correct). OPEC may be looking to draw World stocks down to the 2019 level, but a major problem is that the visibility of non-OECD oil stocks is not very good. OPEC seems to think there is plenty of oil in storage, judging from the price of oil the rest of the World does not agree.
Generally the World seems to want a 90 day supply of oil in storage (commercial, SPR, and oil on water). At 100 Mb/d of consumption, likely in 2022, this implies about 9000 Mb, but currently we are at around 8000 Mb in World storage or at about 82 days of current consumption (Oct 2021) and roughly 80.4 days of forward consumption (2021Q4). The non-OECD nations seem to be short as OECD stock levels are at about 95 days of forward consumption. Non-OECD nations may be trying to increase their petroleum stock levels to 90 days of forward consumption and are bidding up the price of oil.
206 responses to “OPEC Update, November 2021”
Thanks for the update, interesting times ahead, to say the least!
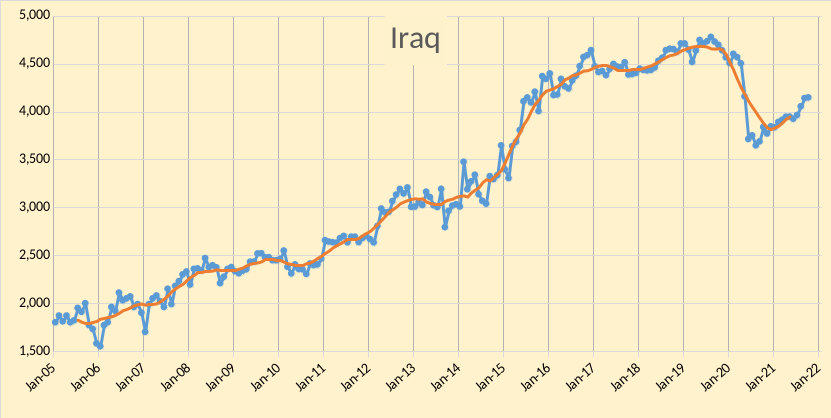
I just recalled some discussions a couple of years ago that Iraq could get to 6, 8 or even 12 Mbd? Whatever happened to those projections?
But in general, it seems like there are some ups, and some downs with quite some way to go before a new high…
Thanks Laplander,
The Iraqi projections always seemed pie in the sky to me.
Here is an old post from 2010.
http://theoildrum.com/node/6101
chart from that post below, capacity reaching 12 Mb/d by 2015, obviously this was far from reality, perhaps at some point Iraq gets to 5 or 6 Mb/d, but even that seems like a very optimistic estimate.
Note that the highest centered 12 month average output achieved by Iraq was in June 2019 at 4690 kb/d. A level of 4600 kb/d 12 month centered average or more was maintained from Nov 2018 to Dec 2019.
Note that there are a bunch of great comments after Staniford’s post.
Ron said Iraq would never reach 5 Mb/d, so far he is right as far as crude plus condensate output through July 2021, the maximum month was 4891 kb/d in Jan 2019 and maximum centered 12 month average was 4768 kb/d in May 2019.
As the political situation remains unsettled in Iraq, they may never see 5 Mb/d as Ron claimed correctly back in 2010.
Good call Ron.
Chart with OPEC Plus C plus C output, monthly (dashed line with markers) and centered 12 month output (dotted line).
OPEC is basically 5 nations, Saudi Arabia, UAE, Kuwait, Iran and, Iraq. They are about one-half million barrels per day from their pre-Covid average.
OPEC Other Eight, that is OPEC less Saudi Arabia, UAE, Kuwait, Iran, and Iraq is almost exactly one million barrels per day below their pre-Covid average. They are currently at their peak production or within a few barrels per day of that level. They will never reach their pre-Covid level.
Ron,
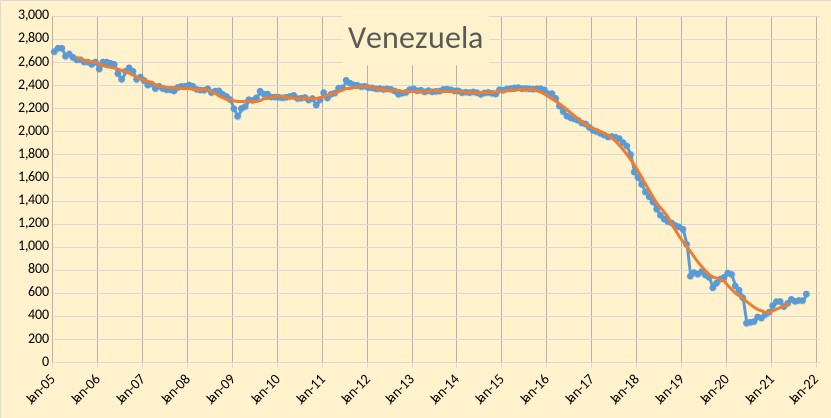
Some of the drop in Venezuelan output may be due to US sanctions (which were ramped up in 2017), if those were removed or Venezuela elected a better leader, things might improve a bit there. In Jan 2017, the centered 12 month average for Venezuelan crude output (as reported in MOMR) was 2029 kb/d vs 590 kb/d in October 2021.
For OPEC as a whole the pre-covid centered 12 month average output was 28979, this is 1526 kb/d below the October 2021 output level (as reported in the November MOMR.) If Iranian sanctions were removed, OPEC is very likely to be able to reach that level of output.
Of more interest is the OPEC plus Russian plus US output level for the centered 12 month average(CTMA) at the World peak in Nov 2018. In Nov 2018, US CTMA was 11462 kb/d, and the US peak was 12539 in Oct 2019 and for OPEC plus Russia plus US the CTMA in Nov 2018 was 53574 kb/d. My expectation is that Iranian sanctions will be removed and OPEC plus Russian output will reach 41000 kb/d or more by the end of 2023, If the US can return to its previous CTMA peak and my guess for OPEC plus Russia is correct (I believe it is conservative) then we get close to the previous Nov 2018 CTMA level for OPEC plus Russia plus US (we would be short by 35 kb/d).
Higher oil prices that are likely over the next few years may lead to increased field development in UAE, Iraq, and Saudi Arabia so that their output may more than offset decline in other OPEC producers, in addition the increased output from Norway, Canada, and Brazil might more than offset decline from the rest of the World.
Much will depend on the price of oil which will in part deoend on both the future supply of oil and demand for oil, all three of these interact and are difficult to predict.
Dennis, if and what if Venezuela might do in the next decade don’t matter. And it would take that long for Venezuela to rebuild their infrastructure as they have sold off their Orinoco pipelines for scrap. And remember, Venezuela has nationalized, for pennies on the dollar, every piece of oil field equipment of every company that has invested in Venezuela. They will not likely invest in Venezuela again.
pre-covid centered 12 month average output was 28979, this is 1526 kb/d below the October 2021 output level…
I think you meant 1526 above the October 2021 level. However, I have no doubt that if sanctions on Iran were lifted, they could reach their pre-covid level. However, that would still be 2,858K barrels per day below their 12 month average of 31,837K barrels per day of August 2017.
OPEC crude + Russia C+C peaked at 42,902K bpd in September of 2017. Their combined output in October 2021 was 37,953K barrels per day or almost 5 million barrels per day below that 12-month average. No matter what happens to Venezuela or Iran, they will never reach that level again. End of story.
Dennis, world oil production peaked two years ago. You should learn to live with that very obvious fact.
Ron you are correct that at present the World peak for both monthly output and centered 12 month output for World C C occurred in November 2018. Like every peak that has occurred before Nov 2018, this peak will be surpassed. I am patient, my expectation is that in 2024 we will see a new peak in centered 12 month output (that is the only number I pay attention to, monthly peaks are of little interest.) The final peak will likely be in 2028 and at that point there is a good chance (greater than 50% probability) that the peak will be determined by demand rather than supply, I expect there will be enough electric vehicles on the road by that time that demand will start falling faster than the fall in the supply of oil and oil prices will start to fall.
There are no facts about the future, it is to be determined.
Thanks for the correction, yes Oct 2021 was below the level in 2019.
As to whether OPEC plus Russia reaches the previous peak in 2017, we will have to wait and see, Russia, Iraq, Saudi Arabia, and UAE can all increase output from current levels and may be able to develop more reserves with higher oil prices. In order for the World to surpass the Nov 2018 peak, the OPEC plus Russian output at that point is the target which is 42112 kb/d for the centered 12 month output in November 2018, that is 3860 kb/d above the Oct 2021 output level. My guess is that at least 3670 kb/d could be added to the October 2021 level, other nations besides OPEC and Russia can contribute to higher World output relative to November 2018 (Brazil, Canada, China, Norway and US).
We will see, we have both been incorrect in the past and the future is likely to repeat.
Hey Ron, if we are now past peak and I think you are most likely correct, do you think that the government will admit to the public that the world has reached peak oil? Or will they use a cover story or possibly even an arranged premise to explain the abnormal situation? I know that the latter sounds ridiculous but I can’t imagine the major news services announcing the world has reached peak oil.
Izzy, I think the government will just try to ignore the whole thing. And they will say we are converting to all-electric vehicles so it’s not a big deal. But, and this is a very big but, if energy prices go through the roof because of peak oil, and I suspect they will, the government is going to have to say something. However, I have no idea what that something might be.
So far, the rich Norwegians are buying EV’s as second or third car in the family, with such huge incentives by the government, that they are getting them very cheaply.
This article is from 2017 so a bit dated, but the subsidies persist in Norway.
https://www.masterresource.org/electric-vehicles/norway-ev-costs/
and this one from 2019
“Some in Norway have criticized the wide-ranging incentive package as nothing more than tax cuts for the wealthy. Some even suggest it’s simply a discount on a second car for the rich, and therefore doesn’t do anything to take petrol cars off the road. ”
https://www.forbes.com/sites/davidnikel/2019/06/18/electric-cars-why-little-norway-leads-the-world-in-ev-usage/?sh=4e445af13e35
When Nixon mandated Federal Highway law of 55mph speed limit in response to the oil shortage brought on by the Saudi embargo in late 1973.
people weren’t happy.
And 6 years later when Carter enacted/proposed a series of energy measures in response to the Iranian embargo the country response was anything but enthusiastic.
I don’t think anything the government does on energy will be very well received since all the choices are going fail to bring back $2 gasoline for the rest of time.
The country does seem to generally applause when the short sighted mechanism of releasing oil from the strategic petroleum reserve is announced.
I suspect that ‘peak oil’ will be gradually acknowledged over a series of years by all kinds of media and corporations. It won’t be a news conference announcement by president Bannon during the super bowl halftime, or anything like that.
I wonder how the country would react to the government saying no to LNG exportation.
I work as a lead engineer for one of the largest LNG export facilities in the US and I am always bringing this up during management meetings. Trust me, these guys cannot even conceive of there being a cap on gas production, and rationing or even peak gas is not on their radar at all. The tell is that pipeline and takeaway capacity projects are through the floor with very little additional compression in the works either. If the polar vortex pays a visit this winter it could be very entertaining.
LNGuy-
Thanks, but what do you mean “that pipeline and takeaway capacity projects are through the floor “?
Does that mean running at full capacity?
That just means we aren’t doing much of anything to increase the ability to get gas out of the ground or transport it via pipeline so it’s hard for me to see how we avoid gas rationing to these huge export facilities at some point if the weather gets really cold. As soon as prices shoot up there’ll be a hunt to blame somebody and the export facilities make an easy target.
Tks Dennis . So in your opinion is it a ” pass” or “fail ” in total . 0.22 mbpd spread over 13 members is not impressive since it is basically KSA . I look it at 217 -(57 10 7)=143kbpd . Data of Venezuela , Iran and Iraq being unreliable . From my view it is a “fail” with relation to their public announcements . Doesn’t move the needle much . By the way production in Iraq is hampered by the drought .
https://www.france24.com/en/live-news/20211114-drought-forces-iraqi-farmers-to-leave-their-land
He has two wives and nine children . No need to say more .
Hole in head,
The secondary source data is not from Venezuela, Iran , or Iraq. It is as reliable as any data out there.
OPEC July 2021 output was 26609 kb/d and Oct 2021 was 27453 kb/d. OPEC was aiming for an increase of 250 kb/d each month or 750 kb/d over 3 months, actual output increased by 844 kb/d over the past 3 months, so I guess that is a “fail” as they produced 94 kb/d too much (or about 31.3 kb/d too much each month on average). This is about 12.5% higher than their planned increase.
In other news the first victim of the dollar shortage as foreseen by HHH hits the wall . The weak get taken out first.
https://new.in-24.com/business/316546.html
SriLanka closes its only refinery for 50 days due to dollar shortage .
”
When we refine the crude in Sapugaskanda, we get 37% heating oil, 19% aviation fuel and only 43% gasoline and diesel,” he told reporters. “There is no great demand for fuel oil and aviation fuel, so it is better to import refined gasoline and diesel which are in high demand.”
”
They are still hit by Corona – their refinery produces not marketable products. If aviation fuel would be in big demand, they would get $s – either by selling it for a good profit or by using it with toursim and business trips.
So the oil gets to a refinery with a better product split.
$147 oil happened when the offshore dollar market or Eurodollar market still functioned properly. An abundance of dollars were being created.
I think a lot of people get the dollar wrong because they just look at what the FED is doing. Money printer go brrr. When what really matters is dollar funding. Actual dollars being created in the real economy as opposed to bank reserves that just stay in the banking system and never leave into real economy.
Also, the velocity is way down, even if QE and such monetary measures are still well up.
Dennis/Ron
Looks like a few of us are looking at OPEC plus and what they might produce in the future. The first chart is for OPEC 10 plus. Libya, Iran and Venezuela are not bound by the OPEC plus agreement. From Jan 15 to Jan 20, OPEC 10 plus output bounced around 44,000 kb/d. Added to the chart is the OPEC 10 plus commitment to add 400 kb/d/mth starting in August. Red graph. That brings output to 41,939 kb/d by December 2021 if everything goes according to plan.
What I am also looking at is where output was in Mid 2019 and where it will be in January 2022 and sometime later in 2022.
In the first table below is the output (C + C) of the OPEC 10 in Mid 2019 and the expected output in January 2022. In the last column is the production loss from Mid 2019 to January 2022 for only those countries that are in steady decline. The two biggest decliners being Angola and Nigeria. The total decline is 945 kb/d.
A similar table has been prepared for the Non-OPEC countries. For those declining countries, their projected loss is 219 kb/d.
The combined decline by January 2022 is rounded to 1,150 kb/d. In Mid 2019, Opec 10 plus output was 43,900 kb/d. So we can expect the OPEC 10 plus to be heading for 42,750 kb/d sometime in 2022 because of the decline of 1,150 kb/d. To get beyond that will require extra production by a few of the OPEC 10 plus that are not in decline.
Thanks Ovi, this is the most interesting question to me. Not whether a new peak will be reached or not, because who cares really, it will be statistically irrelevant in difference from the 2018 peak. What I really want to know is when this current peak will occur. Dennis seems to think we will make it to 2028-29 but it don’t look so good to me. Next summer will be very very interesting in deed as demand bounces back.
Stephen Hren,
I expect we could get to 87 Mb/d by 2028/2029 for World C plus C centered 12 month average output. Not a huge increase but significantly different from 83.13 Mb/d (the centered 12 month average peak in Nov 2018), about 4.8% higher. It would also be quite a bit higher than the current 12 month average of World C plus C output (75.1 kb/d) by about 15%.
I expect we could get to 87 Mb/d by 2028/2029 for World C plus C centered 12 month average output.
Dennis, sometimes I find your production predictions just plain funny. Thanks. 😂
Ron,
Almost every long term scenario I have created in the past has been derided as being wildly optimistic.
Looking back, they have in nearly every case been too low. Perhaps this scenario will be too high. If oil prices are $95/b or higher in 2020$ for Brent crude from 2023 to 2028 for the 12 month average price and the World economy grows at rates expected by OPEC, IEA, EIA and IMF for 2021 and 2022 and then 2.5% real GDP annual growth rates for 2023 to 2028, then there will be demand for oil. For 1982 to 2019 World C plus C grew at 800 kb per day annually. World output of C plus C will return to 83 Mbpd by 2023, after that we return to 800 kbpd annual growth from 2024 to 2028.
This is a standard projection in line with EIA scenarios except my scenario peaks in 2028 and output falls due to transition to electric transport.
Almost every long term scenario I have created in the past has been derided as being wildly optimistic.
Then perhaps that’s your problem. You are overcorrecting, I mean way, way overcorrecting. 🤣
I don’t think there will be a lot of electric transport in 2028. Electric cars will be plentiful, and perhaps 10 to 20% of the fleet. But I predict close to 0% of freight will be transported by electricity. Three will be no electric airliners, and ships will still be powered by bunker fuel. And there will be virtually no long-haul electric trucks in 2028, just six years and two months away.
But, here is the good news. The drive to convert to electric transport will be driven by a herculean effort by then. With oil production dropping like a rock, panic will set in and drive the conversion to electric vehicles at warp speed.
Just had a thought Dennis, about your past pessimistic projections. Those were all made prior to peak oil. Now your optimistic projections are made post-peak oil. That explains why your projections were wrong, on the low side in the past, and so damn wrong on the high side in the future.
Damn, it just seems so obvious now, doesn’t it? 😁
Ron,
I assume no electric transport for water or air. The plugin fleet grows to 142 million by 2028 in my scenario, the heavy duty trucking will lag the personal vehicle space, but it could turn over quickly for last mile transport and with an expansion of electric rail for long haul shipping (though this is unlikely to happen by 2028 in North America). In my scenario oil used for personal transport is reduced by 1.9 Mb/d in 2028 compared to 2019 and the transition accelerates fro there as the older ICEV fleet gets retired over the next 12 years. By 2040 oil use for personal vehicles falls by 20 Mb/d compared to 2019, demand for oil is about 8.2 Mb/d below potential supply (under a no EV transition scenario) by 2040.
Ron,
Every time there has been a new peak in oil output, some have claimed this is the final peak, note that most of my actual “optimistic” projections proved to be pessimistic in reality. One exception is this very early oil shock model where my “high scenario” was actually too high. (see chart below). The high scenario I did not consider realistic, it had 2018 output at 85 Mb/d and a peak in 2021 at almost 86 Mb/d (these are average annual output levels for C plus C). This scenario is from 2012 and I did not anticipate the pandemic in advance. My medium scenario had a 2019 peak in C plus C at about 79 Mb/d and my best guess was something between the low and medium scenarios,
An excerpt:
The low scenario matches the hubbert curve rather closely from 2011 to 2035. The most likely scenarios are the plateau, medium, and low scenarios.
The high scenario attempts to ramp extraction rates to 1973 levels over a 30 year time frame, this seems quite unrealistic when considering that Saudi Arabia and other middle east OPEC members were aggressively ramping up production from 1960 to 1973 at the some of largest oil fields discovered to date.
I doubt that such world wide extraction rates will be seen in the future, but included it to illustrate that even if it were accomplished the peak would only move by a few years (to 2021 from 2019 in the medium scenario). Even the medium scenario is somewhat unrealistic as it ramps to 1990 extraction rates over just a 5 year period, the reality is likely to fall between the plateau and medium scenarios.
Link to post below.
https://oilpeakclimate.blogspot.com/2012/07/an-early-scenario-for-world-crude-oil.html
Chart from post below
Every time there has been a new peak in oil output, some have claimed this is the final peak,…
Dennis, what does that statement supposed to prove? In just America, there are over 330 million people. And if you throw in Europe, that number doubles. You can find some people saying the world will end tomorrow.
But, your statement certainly insinuates that because some people were wrong about past peaks, then this proves that any such statements about the 2018-2019 peak are therefore wrong. That is just faulty logic, Dennis.
I follow all the world’s major oil producers. I find that every year more nations enter the peak plateau stage and more nations exit that plateau and go into decline. You, on the other hand, seem to base your predictions almost entirely on someone else’s predicted URR. I think my methodology is far superior to yours.
Incorrect Ron. I use both estimates of URR and historical production in my analysis, you choose to ignore resources. Generally using all available information will result in a more accurate assessment.
You are correct that just because estimates of past peaks have been incorrect does not mean this will always be the case, however the 2018 peak will be surpassed by 2024 (average C plus C output about 83.9 Mb/d).
Note also that World extraction rates from conventional developed reserves have been more than 6% for every year from 1931 to 2010 (average extraction rate was 14%), my scenario for years after 2020 has extraction rates from 5.3 to 5.92% (2021 to 2054) with extraction rates falling below 5.3% after 2054. For reference the World extraction rate for conventional oil resources was between 5.8% and 5.9% from 2013 to 2018.
Total oil resources extracted in my oil shock model is under 2980 Gb (conventional and unconventional C plus C) fairly similar to crude plus condensate URR estimates by Jean Laherrere (around 3000 Gb).
My initial statement was a simple statement of fact. What you think I have insinuated, I have not, you have an active imagination, but you ability to guess at what I am thinking is not very good. Please don’t read words that are not on the page.
Every previous peak has been surpassed by the current peak, I think the current peak will also be surpassed in 2024, then new peaks will occur until a final peak is reached in 2027 or 2028 at roughly 87 /-0.5 Mb/d.
In the mean time, you can continue to correctly claim that 2018 is the peak in World oil output.
Gentlemen,
We have seen the peak. Unless the amount of capital being currently pissed away on overspending to find an alternative energy solution comes back into the fossil fuel industry, I don’t see any chance of peak at 2028 Dennis. And yes we do have higher product prices and higher EBITDA but that money will not be enough to create the amount of oil Dennis is predicting by 2028. I understand what has happened the past 40 years, but we are entering a new era of capital starvation for the fossil fuel E&P business and incumbent with this is the flight of talent to discover and develop new resources. This is an extremely crucial factor in creating new reserves.
The easy oil has been found and the harder oil like LTO has boomed and now busted. From my vantage point, as I review new projects, I am really underwhelmed with the quality of the new prospects/projects that I have seen.
Furthermore until the oil and gas futures are stable and increasing, there will be zero confidence to take on new projects and spend the amount of money necessary to create new reserves. In other words, with limited price assurance in the future there will be far fewer companies willing to spend the necessary dollars to create these reserves.
I am not here to debate the validity of Dennis’ work but I believe he is not taking into account the significant changes that have taken place with the new ESG mandate, PE:Commercial Banks abandoning the Fossil Fuel industry and finally the National and Major Oil companies Are diverting precious capital to alternative energy investment.
Perhaps peak oil is irrelevant because we will not not it due to the new energy solutions but folks we have hit peak oil.
Only thing I’d add to that is capital in general not just for the oil a gas sector will be scarce.
Baby boomers will be drawing down retirement funds in mass and that is global. All the pension fund money is going to up and leave markets.
LTO Survivor,
Thanks for the comment. I disagree. The price of oil will continue to rise as there is still plenty of demand. Non-OECD nations that have only petroleum stocks on land (including SPR) of about 52 days of forward consumption (compared to about 95 days of forward consumption for OECD nations) will continue to bid up the price of oil.
The idea that the oil market will be oversupplied in 2022 is a fantasy, the markat will be very short on oil and oil prices higher than $95/bo (2020 $) in 2022 for Brent crude seem a very safe bet. Perhaps this price won’t be enough to overcome rising costs in the industry, in that case oil prices simply rise to a level that will destroy enough demand to balance the market, stocks could reach a critically low level that spurs a $120 to $130/bo price spike, but that seems less likely (30% probability in my view).
It makes perfect sense that people/banks would be hesitant to put even more of their savings into LTO or other crude oil investment after the longterm heavy losses and bankruptcies from 2015-2020.
Once the floor on crude price looks to be about $90/b there will be more people looking to invest, since the prospect for a return on investment will look favorable once again.
The quandary for the oil industry will be that the higher prices will also result in higher end product prices. Every day that gasoline prices are over $2.50/gallon is another day that EV’s/PHEV’s will look like a bargain to the driving public.
A conclusion that one can draw is that all transport miles will generally be more expensive in this decade than they were in the past decade [exception being those with EV and electricity cost less than roughly 17 cents/kWh]. It would be wise to budget for the higher costs for transport, and generally everything with embedded energy cost.
If you want to see an indication of how the major corporations and governments of the world, including the big international insurance companies, see the ramifications of global warming on the world economy consider the etf ‘KRBN’. This tracks “the performance of a portfolio of liquid carbon credit futures that require “physical delivery” of emission allowances issued under cap and trade regimes.” Its been a steady march upward, and many believe it remains in a heavy catch up mode.
https://gml.noaa.gov/ccgg/trends/mlo.html
For reference- the newest data on 30 yr LCOE price for new electricity in the USA shows unsubsidized utility scale solar and on-shore wind both to be less than 4 cents/kWh.
https://www.lazard.com/media/451881/lazards-levelized-cost-of-energy-version-150-vf.pdf
Stephen
I agree with you that next summer will be interesting for the following reasons.
Hopefully Covid cases will be dropping and the US and other world countries and the world economy will be rebounding.
The OPEC plus agreement finishes in April 2022. Let’s see where OPEC plus is then. Will SA, Kuwait, UAE and Iraq output be able to offset the decline rates in a few of the other countries, especially Angola and Nigeria. Will world demand start to stress OPEC’s supply capabilities?
Where will US tight oil production be next summer. By then a high percentage of the DUCs inventory will have been depleted.
Permian will be at peak production or near enough by next summer and will no longer be a source of growth. Maybe it stays there a few years, maybe even ten years. But honestly once it reaches peak production it becomes a liability rather than an asset. Because then you have to have that oil. Where is all the other oil going to come from to offset all the other declining fields that have had very minimal E&P since 2015? Everyone is thinking short term. Everyone thinks the oil price is too unstable and financing too difficult to do anything other than LTO. And when there’s no more LTO growth there’s not going to be any more oil growth. If oil is around $200 for two or more years maybe we get one last maximum effort hurrah but then watch out below.
Stephen,
The oil will come from Saudi Arabia, Iraq, Iran, UAE, Kuwait, Brazil, Canada, Norway, China, and the US. There are a lot of undeveloped oil reserves in the World, high oil prices will lead to their development. Below is a “high oil price scenario” where the Brent oil price in 2020$ is assumed to rise from $70/b in 2021 to $120/bo (2020 $) in 2029 and then remains at that level until 2033 then falls to $55/bo by mid 2041 then remains at that level until 2050 (last well is completed in this scenario in 2038. Total horizontal tight oil wells completed in the Permian basin for this scenario is 126437 (34000 wells completed from Jan 2010 to Sept 2021.)
Click on chart for larger view.
Dennis, thanks as always for your thoughtful analysis. As usual, I am unconvinced. Half of your list could easily wind up being decliners over the next eight years, negating the gains of the others in balance, while the rest of the world also declines (e.g. China, Kuwait, KSA, Iraq, Brazil). Your Permian prediction seems so untethered from reality I’m quite honestly flabbergasted by its audacity. Who knows, maybe you’ll be right. In which case I’ll send you a video of me eating my shirt. But honestly, the Permian close to a full decade above 7M bpd? The climate for oil investment and development has changed radically from five years ago but your analysis remains the same. And you assume a stability in oil prices that has not occurred for over a decade. I feel like you are trying to apply a pattern to an inflection point, and it may not serve you well,
Stephen,
Future oil prices are unknown see comment at link below for a medium oil price scenario,
https://peakoilbarrel.com/opec-update-november-2021/#comment-730088
Medium oil price scenario in chart below, potentially this should be revised for lower oil prices after 2028 when I expect demand may fall below supply.
It is possible that China and Norway go into decline in the next 8 years, but I doubt the OPEC plus and Brazil, Canada, China, Norway, and US group will go into decline before 2027, if so the peak would likely be earlier perhaps as early as 2025, the rest of world was only declining at 80 kb/d pre-pandemic. See link below
https://peakoilbarrel.com/opec-update-november-2021/#comment-729963
Table 1
Second Table
Tks Ovi for simplifying the charts into tables . Now even the blind should be able to see the reality .
HIH
Pretty clear where the problems are.
Ovi,
If we group all of the declining OPEC nations together (Algeria, Angola, Equatorial Guinea, Gabon, Nigeria, Azerbaijan, Bahrain, Brunei, Malaysia, and Sudan) and consider the pre-pandemic trend we get about a 162 kb/d annual decline. Chart below.
There was a big drop (about 900 kb/d) in the declining OPEC plus nations over the Jan to June 2020 period, then the annual rate of decline slowed to 89 kb/d from June 2020 to July 2021 (last data point for all OPEC+ nations). That trend suggests another 45 kb/d for this group of 10 declining OPEC plus nations from July 2021 to Jan 2022, if the trend should continue. In July 2021 these 10 nations had combined output of 5165 kb/d, so we might see a drop to 5120 kb/d by Jan 2022. Trend line suggests about 5200 kb/d in Jan 2022.
Oil drilling activity in OPEC-plus might be picking up a bit, Mexico added 7 and UAE 4. Baker Hughes don’t give numbers for CIS. OPEC totals are still only just above half of pre-Covid, the plus countries shown didn’t drop as much. Venezula hasn’t had any rigs shown since early 2020, I don’t know how they are maintaining production. With the majors pulling back the Western Africa producers seem to be trending to zero rigs.
sorry for my skeptism but isnt this when KSA say the market is well supplied ( they have apparently ignored the US Presidents call on OPEC ) ?
Forbin,
The call on OPEC is World Demand minus non-OPEC output as evaluated by OPEC. They claim the market is well supplied, but the market does not agree. Non-OECD nations are trying to outbid OECD nations to get their stock levels to a 90 day forward consumption level. Potentially a coordinated release of stocks from the SPR in all OECD nations might alleviate the supply crunch, basically the OECD is hogging a lot of the oil stocks and the non-OECD wants their share.
Chart of OPEC plus, combined with Brazil, Canada, China, Norway and US output, monthly data and centered twelve month average (CTMA) last monthly data point is July 2021 (last data from EIA).
From July 2013 to July 2019 (6 years) the CTMA rose by 6128 kb/d (from 65594 kb/d to 71723 kb/d). The July 2021 level of output for this group of nations was 67787 kb/d. Peak CTMA was 72374 kb/d in Nov 2018.
Some will claim all of the increase was due to tight oil. The chart below shows OPEC plus combined with Brazil, Canada, China, Norway and US minus US tight oil output. The increase in output is smaller when we exclude tight oil as one would expect, but there remains a 3000 kb/d increase in CTMA from July 2013 to July 2017, from 2017 to 2019 US sanctions caused a large decrease in Iranian and Venezuelan output which accounts for the plateau from Jan 2017 to Dec 2018, then OPEC started cutting back output in 2019 with a brief increase in early 2020 before the pandemic caused an output crash.
We will also have claims that the rest of the World (nations producing oil besides OPEC plus and Brazil, Canada, China, Norway, and the US) is declining fast. For the period from Jan 2016 to Dec 2019 the annual rate of decline for the rest of the world was about 81 kb/d each year. High oil prices might reduce this rate of decline. Note that production from the rest of the world was increasing from Jan 2013 to Dec 2015 at 159 kb/d and for Jan 2013 to Dec 2019 the rate of decrease was only 67 kb/d.
This could be interesting if the chart is accurate.
“We just drew 45.2 million barrels of oil last week – yes, 6.5mbpd.
@Kayrros
confirmed the data by phone to me.”
steve
Steve , earlier Seppo had posted a chart where the global inventory was down from 3.1 billon barrels in Jan to 2.9 billion barrels last month . I had posted a link where a GS analyst says that the world is using 2.5mbpd from inventory . The fish does not smell good . 🙂
HOLE,
Yeah… I saw that post. However, this makes the situation “EVEN MORE INTERESTING.”
I feel bad for those Millennials who think we are heading towards a new CARTOON JETSONS world of Flying Cars and EVs until the COWS COME HOME.
Rather, we likely head over the ENERGY CLIFF and collapse like every other past civilization.
GOD HATH A SENSE OF HUMOR…
steve
Interesting post on “high grading” i.e. suck out the good stuff first:
https://blog.gorozen.com/blog/shale-oil-the-high-risk-of-high-grading
Rgds
WP
Agree WP . Interesting . A new angle .
Interesting link on that Rozencwajg report.
It was released on February 11, 2020 – almost 2 years ago – and largely analyzed the fourth quarter of 2019 and projected forward with an emphasis on the correlation of the number of rigs to hydrocarbon output.
The COVID drama had yet to manifest at the time of the report’s publication, so the complete upending of predictions is understandable.
A much more relevant perspective, perhaps, may be obtained from the just released data from North Dakota as the Director’s Cut for September was just published.
Why, one may ask, has the Bakken been able to maintain a relatively flat output of 1.1 million barrels per day with a rig count 1/2 to 1/3 the norm of the past several years? (The count has been about 25 rigs, more or less, for many months).
To get an understanding of that, a deeper look is required at the status of active wells, re-worked wells, productivity and – importanty – the production profiles of newer wells as all these factors – and more – are the reasons why US hydrocarbon production continues to hum along.
Of course, $80 WTI and $5 HH certainly helps.
WeekendPeak
Not that the article is one year oil.
Yes – but the concept that the best / easiest to harvest resources is shown in it. That principal applies to any and all resources, whether it is FF’s or for example ingredients for EVs.
What I think is interesting is that it shows that creaming off the best resource first leads to a double whammy later on – the quantity harvested in round 2 will be less and the price will be higher. In economics it is generally assumed that higher quantities go along with higher prices and vv. but harvesting resources this way seems to flip that around.
rgds
WP
Going , going , gone .
https://www.reuters.com/business/energy/exclusive-exxon-launches-sale-shale-gas-properties-texas-2021-11-15/
Further evidence that these are not long life reserves but in fact deliverability stop gaps. 90% of the Gas reserves per well in the Haynesville are produced in the first 14 months.Think about that. When we run out of locations which we are rapidly doing, the gas production will fall dramatically in the U.S. I am astounded that no one in the EIA or IEA is discussing this.
LTO.
I know even less about shale gas than I do shale oil.
The public companies stock prices are interesting, at least the ones that didn’t go bankrupt, like CHK.
For example, check out the long term charts on EQT and RRC. Worth a fraction of all time high, but current up several times the COVID lows.
Do you think the Barnett shale gives us any indication of the longevity of the other shale gas plays. I remember being in Dallas in 2008 and seeing rigs at the airport and other “non-traditional” locations. I see there is presently one rig running in the Barnett shale, and that is up from zero.
I have been looking for a historic production chart on the Barnett shale, but haven’t found one. When I get time I’ll look through the shaleprofile archives.
I just have no feel for how many locations are left in all of these shale basins. But I agree, when they are gone, they are gone, and without some type of cost effective EOR, there will be a big cliff.
Shallow sand,
Not a big cliff for Barnett, see link below
https://public.tableau.com/shared/7W9HBF7FX?:toolbar=n&:display_count=n&:origin=viz_share_link&:embed=y
Average annual decline rate about 9.5% per year from 2012(5400 MMcf/d) to 2021 (2200 MMcf/d).
Maybe not a cliff but a fairly steep ski slope that only recently began a more gentle descent.
If the Permian Basin dropped by half in six years I’d say that would be a very big deal.
Also, in money terms XOM owns more than 10% of the wells in the Barnett. They are hoping to get $400 million. DVN got about $600 million for about 20% of the wells in the Barnett (my problem of course is I don’t know if those figures are gross or net wells).
In any event, the remaining value assigned per well was about $150k. That values undrilled acreage at $0. I assume these wells cost $2 million plus? I found an economics presentation online from Pickering Energy Partners from 2005 stating the average cost for a Barnett horizontal well was $2 million in 2005. They used wellhead prices of $6 per MCF for their economics calculations, which turned out to be way too bullish.
Shallow sand,
Looks like a blue square to me. When the Permian reaches its economic limit, my scenarios (medium price) have Permian output falling from 6800 kb/d in Dec 2032 to 3400 kb/d in Dec 2036 or in 48 months. I agree it is a big deal, but nobody ever mentions that part of my scenario, only that we will never produce as much as I claim. The scenario has a maximum completion rate of 525 new wells per month, the average completion rate in the Permian in 2019 was 457 wells per month (my proposed rate is only 15% higher and is reached in July 2025).
Dennis.
I think it is tough to predict what the maximum production will be because it’s very hard to know at what rate wells will be drilled and completed over time.
Due to price volatility, rig counts and frac counts have varied greatly.
What does seem to be easier to predict is that when locations are exhausted, there will not be a gentle 2-3% annual decline in production.
That will be a big deal when it hits, unless demand is much, much lower than present.
Shallow sand,
I agree we do not know future completion rates, prices, costs, drilling locations, etc.
Also I do not expect 2 to 3% decline for tight oil it will be 30 to 40% when oil prices start to decrease after 2028.
In fact it may be falling tight oil output that balances tbe world oil market after we reach peak demand in 2028.
Request to Dennis or Ovi , please could you make a table for the world’s inventory Figure 7 of your post to make it simpler to grasp . Thanks in advance .
Hole in head,
That chart was pulled from the Monthly Oil Market Report published by OPEC in November. There is no data to publish, they said the peak was in June 2020 for World oil stocks and that the stocks had fallen by 938 million barrels by September 2021. If you put a straight edge on the chart you will see the 2018 to 2019 level of World petroleum stocks was about 8000 million barrels, the peak looks like about 9000 million barrels and by September 2021 the level had returned to the 2018/2019 level. The average 2020 stock level rose by about 1000 million barrels above the 2019 level (using balance of supply and demand figures from figure 5). In first 3 quarters of 2021 stocks fell by about 340 million barrels and perhaps another 140 million barrels in 2021Q4.
Unfortunately the world stock data remains pretty murky.
Dutch TTF natural gas futures (the EU benchmark) back above €100 per MWh (~$33.5 per mBtu or ~$190 per barrel of oil equivalent).
https://www.barchart.com/futures/quotes/TG*1
One interesting aspect about the reduced production and eventual shutdown of Slochteren (the main dutch NG field) is that it was triggered by a number of small earthquakes that damaged the properties of normal, average people. That was enough for the government to start winding down extraction. The strongest tremor was 3.6 on the Richter scale – not exactly a crazy strong event – but in the balance between what is good for the economy, the enviroment and what is good for the people shutting it down prevailed.
I mean, Europe is stopping fertilizer production. If they shut in 4 bcf/d for a few minor earthquakes and millions go hungry, I’d say they erred on the side of what was bad for the people.
Higher fertilizer prices might stop farmers from wasting so much of the stuff, and poisoning the rivers and coastal waters with it. A guy can dream.
Long before anyone goes hungry, meat prices will start going up, because most agricultural output is fed to animals, not to people. Right now prices are dramatically low in Europe. Given the rapid rise in sales of meat replacements, higher meat prices may not matter much in a few years.
Like so many other things, European meat prices have to do with China, which is not buying much European pork currently. But given the current chaos in global supply chains, I wouldn’t attach much significance to current prices of anything.
In wich “a number” means almost 2 000. In recent years the region of Groeningen has experienced as much as 3 hearthquakes on a single day. Since 1986 about a hundred buildings had to be demolished, with four hundred more currently marked as vulnerable. In 2016 the University of Groeningen estimated that more than 100 000 people had experienced damage and financial losses from these earthquakes.
It’s the age old question of rights of the individual (in this case a few) vs the collective.
Rgds
WP
That’s not going to decrease : the German regulation authorithy suspended the approval for the use of the new gazoduc nord stream 2 until the begining of the next spring to reexamine it.
NOT ALL SHALE GAS FIELDS ARE ALIKE… LOL
While I knew shale gas didn’t decline as fast as shale oil, I was completely surprised at how fast the Haynesville shale gas production declined. Gosh, Haynesville shale gas decline rate looks more similar to shale oil, than gas…LOL.
I gather Haynesville shale gas is more wet or ngls??
Here is a chart showing the Haynesville Gas Decline from Dec 2019 to June 2021 = -55%
steve
Here is Haynesville output, generally drilling does not stop completely overnight, so your charts are bogus. If you want to only look at 2019 wells, then look at only those wells.
The decline is 65% over 19 months for 2019 wells from Dec 2019 to July 2021, that is an average annual rate of about 51.5%.
Dennis,
My chart isn’t BOGUS. We can see the natural DECLINE if we omit the following years. Yes, I have a chart showing full production since present. However, if we want to look at the OVERALL DECLINE RATE of all the wells from 2008 to Dec 2019, my chart shows it.
Furthermore, I was showing how the Marcellus shale gas declines more slowly than the Haynesville.
Nothing BOGUS about that one… LOL.
steve
Steve,
Your chart says 2019 decline, it is the decline of all wells that started producing before 2020, note that it would be unnatural for well completions to abruptly stop on Dec 31, 2019, my chart shows actual output. Different fields have different geology and the decline curves will vary from play to play.
This is pretty well understood.
Dennis,
I ran out of room to include 2008-DEC 2019 in the title graphic… LOL. But, still, it shows the Natural Decline of the Haynesville without new wells. That is what we call the NATURAL DECLINE.
As for fields experiencing different declines, most Shale gas declines about the same as the Marcellus, from what I have seen. However, the Haynesville is declining much faster.
steve
Now compare the Haynesville Gas Production decline to the Marcellus over the same period…
Dec 2019 to June 2021.
Steve
Oil production for North Dakota came out yesterday. Production was up about 6,000 barrels per day in September. However, they are still down over 20,000 barrels per day since June.
At the current rate of ~13 Bcfd and using the USGS TRR figure of 300 Tcf, the Haynesville will produce for over 60 years.
The hydrocarbon bearing zones of the Haynesville and Bossier are ~2,000 feet thick with about half that deemed economically viable
The shallower Cotton Valley is also being developed.
While it has been common for H/B wells to have relatively short laterals for years, that is changing as longer lateral technology is being introduced along with acreage consolidation.
The US is about even with Qatar and Australia regarding LNG exports, but the US is weeks away from becoming the world’s leader as Calcasieu Pass and Train 6 at Sabine Pass come online. The Louisiana and Texas gas producers are very well positioned to supply the present – and future – LNG plants.
West coast Mexico LNG plants will draw from the Permian and Piceance.
COFFEEGUYZZ,
Yeah… well, I disagree. We can put lots of nice BIG numbers on the board as “RESERVES.” But, they have to be commercially and economically viable. Furthermore, it still takes about 1,500 semi tractor truckloads to Frack one shale gas wells. Those are powered by diesel.
Now, if those trucks were powered by ENERGY TOOTH FAIRIES, then maybe it could be possible to extract all those 300 Tcfs.
So, if oil production gets into trouble, I can assure you… so will Natgas production.
steve
Steve, Steve, Steve …
This is November, 2021.
You really must keep up if you wish to continue to try to maintain even a shred of credulity.
Virtually all operators describe their proppant amount use in terms of pounds per lateral foot with 2,000 to 2,500 pounds being the common range.
For a 10,000 foot lateral and 50,000 pounds per trailer load of sand, one gets 400 truck/trailer loads to deliver 20,000,000 pounds to frac a well … not 1,500. Furthermore, double trailers – used where local regulations allow – cuts the number of trips down to 200.
As the expert on these matters that you clearly are, you also know that locally-sourced 100 mesh is becoming the norm with 40/70 (still Northern White or equivalent) frequently used for taiing in.
Of course, the rapid adoption of wet sand frac’ing might change these numbers in the coming years, but that is to be determined.
BTW, speaking of changing numbers, have you ever done a followup on your breathless, epic claim – posted right here on this site – about the Pennsylvania Marcellus ‘peaking’ at ~14 Bcfd about 6 years back?
The PA DEP just released September’s production and it remains at the 19/20 Bcfd level, as it has for a couple of years now
Asking for a friend …
COFFEEGUYZZ,
LOL… you forgot one important factor in your equation. Water & Wastewater disposal. While some wastewater is recycled, most of the wastewater that comes out with the oil or gas is moved by tanker trucks. That is the larger percentage of truckloads when fracking and disposing of wastewater.
Also, it takes ZERO truck loads to clear and set up the Fracking Well site?? And how about the amount of truckloads it will take to RECLAIM the site??
Come on now…
You should know this… right??
steve
Steve , Coffee does not understand the concept of ” full cycle cost ” . This is like those who talk only about ” well head ” price or about “lifting costs” . Look at the recent post by Rystad regarding breakeven costs . What a joke . How come shale never ever made any money ? I have earlier said that the cost of oil to KSA is not in the balance sheet of Aramco but in the balance sheet of the Kingdom because that is where the expenses are to keep the oil flowing and the head attached to the shoulders of MBS .
They should just borrow more and burn cash for fuel.
On a more serious note, they should run their trucks on natural gas instead of flaring it off.
Actually, that´s an excellent idea! Lots of vehicles are converted to CNG nowadays (in some areas at least, but an increasing number non the less)
But I guess a compressor and stage coolers is a bit too expensive…
Signed, Bean Counter… /S
Interesting comments that could be fodder for further discussion/self education in these matters for those truly seeking to learn.
Some responses …
Terms such as full cycle costs, half cycle, wellhead, realized, netbacks, lifting are all highly relevant and precisely descriptive of different aspects of the hydrocarbon production and marketing process. For those unaware and wishing to understand both the “what’ and the ‘why’, research and find out. Rystad might be a good source for information.
Regarding the use of natgas as transportation fuel, THIS is a grossly under reported situation that is both rapidly evolving and worthy of ongoing attention.
The advances in the adsorption field (‘d’, not ‘b’) are stunning and may prompt dramatic announcements in the coming years. Switching over to natgas (or even propane) is a simple, inexpensive process that most any ICE vehicle on the road can do. When fuel storage issues are overcome, we will see a lot more of this.
The small (actually micro) LNG process operating in Northeast Pennsylvania – done by a company called EDGE – is currently using LNG-fueled trucks to ship LNG product to a Connecticut utility. This is almost a no cost fuel as they are liquefying practically at the wellhead.
Announcement by an outfit called Nacero a few weeks back about plans to build a multi billion dollar Gas to Liquids plant in NEPA should spark some interest.
They are breaking ground in a few weeks in West Texas for an identical, 100,000 bbld plant using cheap, abundant natty to make methanol.
Seems like those ever inventive Norwegians have come up with an economical process to do this as their first-in-the-world plant in Turkmenistan has shown.
Don’t blink, folks, or the dizzying pace of innovation will leave you all far, far behind.
Interesting-
EdgeEnergy- https://edgelng.com/
and Nacero- https://nacero.co/future
Chart for breakeven prices by Rystad from
https://oilprice.com/Energy/Crude-Oil/Breakeven-Price-For-New-Oil-Projects-Drops-In-2021.html
Note that they use a very low real discount rate of 7.5% which gives breakeven prices that are far too low, a more realistic real discount rate that may adequately reflect risk is perhaps 15% or more.
For the Permian basin assuming natural gas price at $4.50/ Mcf and a real discount rate of 7.5%, the breakeven is about $48/bo rather than the $37/bo price given by Rystad (Permian is likely the low cost tight basin in the US).
Note also the $48/bo estimate is far too low due to an unrealistically low real discount rate. Using a more realistic 15% real discount rate the breakeven rises to $54.50/bo, note that I assume NGL sells for 33% of the price of a barrel of crude in this analysis.
This suggests all of the Rystad break even calculations may be too low by about 32%( that’s the number for tight oil).
Canada has upgraded their projections. They have a new format. They have Raw Mined Bitumen and Raw In Situ Bitumen. I just added the two and assumed that is total Tar Sands. I think this is correct because they did not start doing this until January 2008.
Canada NEB Oil Production
Anyway, in the chart below, “Canada Total” in the chart below, is through August 2021 while “Tar Sands” is through September 2021.
I must add that I do not think Canada’s production will boom in the next few years. They have fully recovered from their Covid cut but their production is stuck at about the 2019 level. They are one of Dennis’ Big Ten that, he says, will carry world production to new heights by 2028. I really don’t think so.
Ron
The two major Oil Sands (We prefer Oil Sands) as opposed to Tar Sands) companies are reducing debt and increasing their dividends. The resource is there to increase production at a rate of roughly 100 kb/d/yr if they want to. It is capital intensive and that is the bigger issue.
The other issue is whether to produce Western Canada Select or to upgrade to Synthetic Sweet Crude. As best as I can read between the lines, the preferred direction is produce more WCS and ship it to the US for upgrading.
Unfortunately with the opening of the upgraded Line 3, more is being shipped to the US and the price differential with WTI has dropped from $12 to $ 20. This could also be due to the current refinery maintenance season in the US.
The resource is there to increase production at a rate of roughly 100 kb/d/yr if they want to.
Ovi, I suspect there is a lot more to it than “want to.” As you say it is capital intensive. But there is even more to it than that. How would they ship it? And at what price? But in the grand scheme of things, it really doesn’t matter. Will Canada’s oil production grow by leaps and bounds, or will it stagnate at about the level it is today? I suspect the latter. And the “why” really doesn’t matter. One cannot really make excuses for peak oil.
Ron
The shipping problem has vanished. Line 3 which started operating on October 1 went from a capacity of 400 kb/d to 760 kb/d.
Also, unknown to most, Marathon Petroleum has been quietly reversing the Capline pipeline. This can almost be considered to be a Keystone XL replacement.
Capline was the largest south-to-north flowing pipeline in the United States with a capacity of 1.2 million barrels of oil per day, but Marathon has been working to reverse the flow since 2017, which would allow both heavy and light oil to flow from a storage hub in the U.S. Midwest to a major refining centre on the Gulf. The reversal should be completed this year.
To use the Capline, Canadian oil producers will need to ship their crude on Enbridge Inc.’s Mainline pipeline system to the U.S. Midwest.
Also in 2023, the Trans mountain pipeline will be up and running and add 590 kb/d of additional export capacity. This pipeline will go to the pacific coast.
In addition, both Enbridge and Trans Canada Pipeline are adding friction reducers to the crude to further increase capacity.
Agreed, Canadian production will not grow in leaps and bounds. It will not affect peak oil. As I mentioned originally, 100 kb/d/yr between 2020 and 2025 is what CAPP expected in their 2019 outlook, Precovid. After that growth slows. The attached table is taken from the reference below.
https://www.capp.ca/resources/crude-oil-forecast/
Ron
I forgot to mention that the US may be very glad to have such a friendly neighbour with all of this oil a few years from now. Forgot shipping it to China from the Pacific port. The US Build Back Better plan might even come up with the money to help develop it at quicker pace. Stranger things have happened.
There is about 200,000 bpd to be added on the east coast but it would noot be net that amount by 2028 given the decline rates on the additions and Hibernia and Hebron. By memory one of IEA or EIA identified 700,000 in oil sands but I don,t think any is beyond concept stage so I don’t think it could come online that early even without the political and funding issues it would face (presumably needing new pipelines and upgrader, and a source of natural gas). The heavy oil in Alberta is facing continued decline and, while it picked up a bit this year, drilling has generally been on a declining trend.
ps – just read Ovi’s comment which I think generally agrees.
https://aspofrance.org/2021/11/18/us-shale-plays-production-from-eia-jan2007-sept2021-forecasts/
Jean Lahererre has a new post at ASPO France concerning US shale oil and gas
Interesting share. Thanks. Must I understand that there are some strangeness in the data of EIA? Is it really reliable?
JL seems to think so and he’s probably got as much oil and gas experience as anyone to be able to tell. I only started posting here because of some EIA reports on the GoM that didn’t make much sense so I can belief there are issues with other things they issue.
Here is the documentation for drilling productivity report (EIAa in Laherrere’s report)
https://www.eia.gov/petroleum/drilling/pdf/dpr_methodology.pdf
On page 3 they explain what they are presenting for data, an excerpt:
The DPR Regions are based on the county-level geography encompassing the key oil and natural gas production formations in each region. Identification of the formation boundaries comes from prior and ongoing shale gas and tight oil research at EIA. Although five of the seven DPR Regions are identified by the geologic formation that produces the greatest volume of oil and natural gas within that region (the Permian Region encompasses the Permian Basin, which includes a number of individual formations which produce oil and natural gas), all of these Regions include other geologic formations that also produce oil and natural gas. Some of these other formations have produced oil and gas for many decades and will continue to do so into the foreseeable future. Thus the data used by the DPR, along with the DPR estimates of current and future oil and gas production for all seven Regions, include not only the production from the “headline” formation (e.g., Bakken), but also the production coming any other formations within that region. For example, the Bakken Region’s oil and natural gas projected production includes the oil and gas produced by the other Williston Basin formations, such as the Three Forks.
Thanks George for the link .
Jean Laherrere uses the drilling productivity report for his production data, but this is a mistake. He should use the following source instead for monthly data
https://www.eia.gov/energyexplained/oil-and-petroleum-products/data/US-tight-oil-production.xlsx
The drilling productivity report (what laherrere calls EIA source a) includes output from both tight oil and conventional in the tight oil region.
In addition HL does not give reliable estimates when annual production to cumulative production ratio is higher than 10%. In addition his HL diagram on page 3 (left panel) has a mislabelled y-axis, he has aP/cP% but the data is actually monthly production divided by cumulative production.
Cumulative tight oil production through Sept 2021 is 20.8 Gb based on the official EIA tight oil estimate (Jan 2000 to Sept 2021). The annual production to cumulative output production for US tight oil for the most recent 12 month period was 12.5%.
Conclusions reached by JL
“EIA and Rystad LTO production forecasts look unrealistic beyond 2030.
They rely only about drilling many wells without bothering to check if there is enough room to drill these wells. The LTO sweet spots are well known and almost fully drilled.
It is the same for the US shale tight gas future production with the optimistic exportation of LNG in 2040.
AEO2021 reference forecasts light tight oil being 9 Mb/d in 2050, when my forecast is zero!
AEO2021 reference forecasts shale gas and tight gas being 50 Tcf in 2050 (still growing, no peak forecast), when my forecast is zero! ”
JL ‘s view and that of Mike S , LTO and others is tallying viz ; there will be no place worthwhile drilling also called well inventory by LTO . Mike S says 3 years .
Hole in head,
I expected that North Dakota Bakken/Three Forks productivity would start decreasing in 2014, back in 2012. In 2021 I am still waiting. Though we are likely close to peak well productivity in the Bakken (2018 was higher than 2019, but 2020 higher than 2019 and 2021 looks to be less than 2020.) Significant average well productivity decrease basinwide is still not clear.
Image below very fuzzy, better image at link below
https://public.tableau.com/shared/6M52XT7RG?:toolbar=n&:display_count=n&:origin=viz_share_link&:embed=y
Extract from page 4 .
7 LTOs production will be zero in both forecasts when EIA in AEO2021 forecast 7 Mb/d for the reference scenario with a cumulative production 2020-2050 of 80 Gb to be compared with25 Gb for my forecast: 3 times less!
In boxing terms ” KO ” .
I expected that North Dakota Bakken/Three Forks productivity would start decreasing in 2014, back in 2012. In 2021 I am still waiting.
You may be waiting because you have not looked at their output in a couple of years. I have. I am not waiting anymore.
🙂 . 🙂
Ron,
I follow it very closely. Output is a function of completion rate and well productivity, the completion rate has decreased in the Bakken/Three Forks since the start of the pandemic in part because the Permian basin attracts more capital due to higher profits because transport costs are lower for Permian basin to Gulf coast refineries due to proximity. The ability of midwestern refineries to handle the light tight oil from the Bakken/Three Forks is limited and many tight oil companies have become more conservative in their investment plans. In 2019 about 1300 wells(108/month) were completed in the North Dakota Bakken/Three Forks, in 2020 only 600 (50 per month) wells were completed in the North Dakota Bakken/Three Forks , and for the first 9 months of 2021 430 wells have been completed (48 per month). Note that for the first 3 months of 2020, 280 wells were completed (93 per month), so the last 9 months of 2020 from April 2020 to Dec 2020, only 320 wells were completed (about 36 wells per month).
I look at all the data available, not simply output.
The output is explained by the changing rate of completion as well productivity has been fairly stable over the 2019 to 2021 period.
Dennis, the data clearly shows that the Bakken is in decline. True, there are fewer completions and other factors. Those drillers are not idiots Dennis, they know what they are doing. They are drilling less for a reason, the damn field has peaked and they know it.
At any rate, it is absolutely incorrect for you to say that the field is not declining. It Is!
Ron.
Dennis is just referring to production per well. It apparently hasn’t changed much in the Bakken.
Apparently about the only Bakken completions are Tier 1 locations. Also, it appears there aren’t a lot of Tier 1 locations left given how far completions have fallen.
So it appears you are both correct.
As I recall, there is a lot of Tier 2 and Tier 3 acreage in the Bakken that was sold for little to nothing when prices collapsed. It might get drilled if there is a prolonged super spike in the oil price.
As I recall, much of the lesser locations were in Divide, Bottineau and Bowman counties. Looks like just one rig running in each county.
I stand to be corrected on this, I haven’t looked closely in a long time.
Also, note Harold Hamm and CLR made a large buy in the Permian Basin. CLR claims this isn’t a sign of anything in the Bakken. Could be corporate speak?
Bakken may not decline fast if they keep completing 50 /- wells per month, but it sure won’t grow much at that rate either.
Shallow Sand wrote: Dennis is just referring to production per well. It apparently hasn’t changed much in the Bakken.
Well, barrels per well has changed dramatically since 2012. It is about half what it was back then. However I am sure you are referring to barrels per new well. However, I would think that a lot has changed since then. Laterals are longer. No? And other things are very likely to have changed, like the sand they blow into the fractures. No?
I would think fracking technology has changed a lot since 2012. No?
I agree with your post Ron.
There are a lot of wells in the Bakken that are already shut in, likely due to reaching economic limits because of low production rates.
Maybe those will be re-activated, if they can find enough crews to run the rigs. A lot are probably wells producing under 20 BOPD that went off with a tubing leak or need a pump change.
Just take a look at EOG’s wells in Parshall field. This was THE sweet spot between 2008-13, which to me isn’t all that long ago. Lots of SI wells.
Ron,
The output is determined by output per well convolved with wells completed per month.
You are correct that I mean the well production profile of new wells.
See shale profile to see how they have changed over time, I expected productivity would decrease, but in fact productivity of the average new well increased from 2012 to 2018 and since 2018 it went down a bit, then up a bit, and then down a bit in 2021, but basically has been on an undulating plateau from 2018 to 2021.
Lateral length has not changed a lot but number of frack stages and proppant has changed over the 2012 to 2018 period. Perhaps there are no drilling locations left in the sweet spots, but this will be confirmed by a drop in average well productivity.
About the Bakken, below pictures (built from precise wells data) are really impressive :
https://www.nytimes.com/interactive/2014/11/24/upshot/nd-oil-well-illustration.html
I think they should have had more publicity
Ron,
Read the words as they are written, where did I say output was not declining?
I said that the completion rate has fallen, as I demonstrated with data, this can be found at shaleprofile .com. You have the cart befor the horse here. You say the completion rate has fallen because the field has peaked. If we saw a significant decrease in average new well productivity I would tend to agree. It is not there in the data. Producers have simply chose to complete fewer wells and that is the reason output is falling. If completion rte increases, output will rise, unless new well productivity suddenly starts to decrease. Currently there is no evidence that this is the case.
See simple model 1 at link below
https://peakoilbarrel.com/oil-field-models-decline-rates-convolution/
The spreadsheet is at the following link
https://drive.google.com/file/d/0B4nArV09d398MldkT2R0SmlqSjg/edit?usp=sharing
Ron,
A clarification. When I say well productivity, I am talking about the estimated ultimate recovery (EUR) over the life of the well. This is not directly related to output per well which will depend on completion rate over time.
If we assume Bakken wells get shut in at 15 bo/d the EUR for new wells completed in 2018 was about 388 kb. The average 2015 Bakken Three Forks well had an EUR of about 300 kb.
If we assume Bakken wells get shut in at 15 bo/d the EUR for new wells completed in 2018 was about 388 kb.
The statement above is from someone who masters the physics of time travel.
A clarification. When I say well productivity, I am talking about the estimated ultimate recovery (EUR) over the life of the well.
Dennis, you did not say well productivity, you said: I expected that North Dakota Bakken/Three Forks productivity would start decreasing in 2014, back in 2012. In 2021 I am still waiting.
Nothing in that statement even hints that you are talking about well productivity. Obviously, anyone reading that statement would assume you were talking about field productivity. Now you may not mean what you very obviously wrote, nevertheless, that is what you wrote.
Perhaps you should be more careful in the future in saying exactly what you mean to say. Yes, I later figured out that you were saying something that you did not mean to say. But you should not think everyone would figure that out.
Ron,
Sorry I was not clear. I thought the chart showing well productivity from shaleprofile.com would make it clear.
I guess not.
Ron,
And I agree I should have said well productivity, I very rarely consider field productivity (output per well at some point in time) as it is not a very useful measure for analysis, generally when I refer to productivity I mean the average estimated ultimate recovery for a the wells that started producing in a given year.
Chart below shows cumulative production profile (cumulative output of the average well in the Bakken over its life) the tail of these wells can be estimated using hyperbolic decline profiles fit to the data with exponential decline assumed after the decline rate reaches 10% per year. So from this chart it is clear that average output per well was increasing from 2014 to 2018, then well productivity dropped a bit in 2019, then it increased in 2020 (to above the 2018 rate), then dropped a bit in 2021 (though it is early to try to estimate 2021 EUR).
The last time I estimated Bakken well profiles in 2019, I has the average 2018 well at 269 kb at 35 months (EUR at 165 months 388 kb), atual cumulative output at 35 months for the average 2018 Bakken/Three Forks well in North Dakota was actually 275 kb, so my estimate (based on data up to month 20 in 2019) was conservative. In my scenarios I assume well productivity decreases after 2018 for North Dakota Bakken/Three Forks.
Ron,
In my original response to hole in head there was this sentence in the comment:
Though we are likely close to peak well productivity in the Bakken (2018 was higher than 2019, but 2020 higher than 2019 and 2021 looks to be less than 2020.)
I thought I had said well productivity, and in fact I did.
Comment at link below
https://peakoilbarrel.com/opec-update-november-2021/#comment-730144
Not a problem Dennis, let’s move on. My point is only that the Bakken has peaked, and will never reach one point five million barrels per day ever again. That is the only important point. Well, in my opinion anyway.
Ron
I agree Bakken is likely past peak.
If oil prices rise to $100/b and completion rates rize as a result we might see a secondary peak in the future at 1200 to 1300 kb/d.
Dennis wrote, concerning his theory that the peak oil will not happen before 2028: The oil will come from Saudi Arabia, Iraq, Iran, UAE, Kuwait, Brazil, Canada, Norway, China, and the US.
The below chart is Dennis’ Big 10 listed above. The data is through July 2021 in K barrels per day.
Ron where did I write that? In this thread I have focused on OPEC plus and Brazil, Canada, China, Norway, and the US. The decline rate of the rest of the world befor the pandemic was at an annual rate of about 81 kb/d. Output dropped in 2019 because OPEC plus cut back output, then a spat between Saudi Arabia and Russia led to a temporary increase in late 2019 and early 2020, then the pandemic led to a drop in output and now we are seeing output recover.
In any case, I would include Russia with those other nations.
For the past 14 months the recovery in World C plus C output has been quite rapid (annual rate of about 5500 kb/d), I expect it will slow down as we approach 84 Mb/d in 2023.
Ron where did I write that?
Yesterday on this thread. The entire post is cut and pasted below, except for the chart.
D COYNE
11/17/2021 at 9:33 am
Stephen,
The oil will come from Saudi Arabia, Iraq, Iran, UAE, Kuwait, Brazil, Canada, Norway, China, and the US. There are a lot of undeveloped oil reserves in the World, high oil prices will lead to their development. Below is a “high oil price scenario” where the Brent oil price in 2020$ is assumed to rise from $70/b in 2021 to $120/bo (2020 $) in 2029 and then remains at that level until 2033 then falls to $55/bo by mid 2041 then remains at that level until 2050 (last well is completed in this scenario in 2038. Total horizontal tight oil wells completed in the Permian basin for this scenario is 126437 (34000 wells completed from Jan 2010 to Sept 2021.)
Click on chart for larger view.
Thanks Ron,
I would add Russia to that list, though OPEC plus added to Brazil, Canada, China, Norway, and the US is better still. As oil prices rise we may see plateaus last longer and some increases from nations we do not expect.
I would add Russia to that list,…
I really don’t understand your logic, Dennis. Russia has already told us they have peaked. Yet you insist that they either don’t know what they are talking about or they are lying.
I hope that now you can understand my reluctance to buy into your scenario.
Ron,
Russian output will increase from their current level and they will return to close to their previous peak and likely remain on a bumpy plateau for 5 years or more after that. Russian output has been increasing at an annual rate of 914 kb/d from June 2020 to October 2021. They are currently at about 10.8 Mb/d, their peak 12 month average output was 11.25 Mb/d in 2019, I think Russia will return to their peak output.
This adds 400 kb/d to World output, the US can add about 1397 kb/d (from Aug 2021 level), OPEC can add 2500 kb/d, so just these add 4297 kb/d to World output getting us to about 82 Mb/d, then adding Norway, Brazil, and Canada is likely to push us over the previous 12 month average peak.
Here is a canadian forecast
https://apps2.cer-rec.gc.ca/energy-future/?page=scenarios&mainSelection=oilProduction&yearId=2020§or=&unit=kilobarrels&view=&baseYear=&compareYear=&noCompare=&scenarios=Evolving,Reference&provinces=ALL&provinceOrder=YT,SK,QC,PE,ON,NU,NT,NS,NL,NB,MB,BC,AB&sources=&sourceOrder=
They have two scenarios one with output at 5450 in 2028 and the other at 6000 kb/d in 2028. For 2021 the two scenarios are 4974 kb/d and 5059 kb/d, the lower scenario assumes aggressive action on climate change and the higher scenario is a reference (BAU) scenario. So an increase of 475 kb/d to 940 kb/d (average of two is 708 kb/d or roughly 100 kb/d for average annual increase in output.). Brazilian output is expected to increase by about 200 kb/d per year until 2026. Norway’s output is expected to increase by about 300 kb/d between 2021 and 2025. Currently 2025 is the expected peak for Norway. All together this is about 2 Mb/d over the 2021 to 2027 period.
Potentially UAE, Saudi Arabia and Iraq might expand their capacity over the next 6 years so we might see extra output from them as well as they bring more capacity online. Much will depend on OPEC’s assessment of future demand which may change over the next 5 years.
They show Canada’s 2021 average at 5 million barrels per day. Canada’s National Energy Board has their average, through August at 4,676,694 barrels per day. The EIA estimate, of course, will be quite a bit lower. Anyway, they are not going to average 5 Million BPD this year.
Potentially UAE, Saudi Arabia, and Iraq might expand their capacity over the next 6 years so we might see extra output from them as well as they bring more capacity online.
Yeah, that might happen. Not likely but it might. And a 10-mile diameter meteorite might strike the earth and destroy all human life on earth. Not likely but it might.
Ron,
We have a different evaluation of middle east resources. Time will tell which is closer to being correct. It seems likely that demand rather than supply will be the limiting factor on World output of C plus C.
Canada’s 12 month average output is up by 200 kb/d from a year ago, they did not recover as fast as the scenario estimate. Output is increasing and if oil prices remain high this is likely to continue.
World C plus C, EIA data Jan 2018 to July 2021, trend from June 2020 to July 2021 (using OLS) extrapolated to end of 2023, I doubt output will reach over 85 Mb/d by Dec 2023, the rate of increase will be slower in the future, I expect we might reach 85 Mb/d by 2025 or 2026.
Ron – the Shift project has some detailed analysis on some of those countries because they are large suppliers to EU. It has Iran and Iraq increasing but mainly only after 2030. I can understand for Iraq as they are waiting for the development of the seawater injection project. Kuwait and Saudi are shown as pretty flat from 2015 to 2030 except for the Covid dip.
Norway will peak in 2024/2025 but will be lower than today by 2028 without some big discoveries (that would have to be in the next couple of years to be online by 2028. Brazil will increase but not by as much as once thought as recent exploration success and lease sales have been quite poor.
UAE looks likely to have potential to increase a bit. I don’t know where China would get much more oil from. Jean Lahererre indicates the US shale basins have peaked or will do before 2025, and will mostly be declining and with lower production the now by 2028.
The below chart is World C+C production less Dennis’ Big 10.
Peak oil is back . Published by ASPO Belgium . They say ” Watch Out ” 2025 .
http://www.aspo.be/en/peak-oil-is-back-white-paper-published-in-the-belgian-newspaper-lecho-02-july-2020/
Interesting (and brief) statement, which ends:
We should not waste the educational opportunity offered by the current health crisis, and also avoid restarting the economy on the same petro-dependent basis. Otherwise we risk an oil crisis following soon after the health crisis.
But, of course, we know no such goddamn crisis will be averted.
True, absolute knowledge of such a scenario is not there. But I would say that is a damn good guess.
Thanks, HH for the link. Their bullet points need repeating.
Improve knowledge of peak oil, for both the State and citizens, so that everyone can assess the effects on their lives, and makes their own arrangements.
Include peak oil in energy policies. In Europe, coal must be abandoned for climate reasons, gas fields are in decline, and some countries exit nuclear energy while the world oil decline is looming. Can we manage these combined declines ?
Anticipate the possibility of zero or negative economic growth over long periods. In 2004-2008, a stagnation of oil production for 4 years was enough for oil prices to soar to $150/barrel and for European economic growth to come to a halt. Given the strong GDP/oil consumption coupling and the efforts to reduce oil consumption that will have to be made each year for decades to come, we could expect a recurring brake on growth.
Act today, when we still have room for maneuver, rather than tomorrow under constraint.
Make no mistake, peak oil is back. I predict you will soon be seeing a lot more articles like this one. And this time next year there will be more of them than in the height of all past peak oil scares.
Russia news aggregator writes:
“OPEC+ countries significantly increased oil exports in October-November, which contributed to the decline in Brent prices in recent weeks.
However, the reserve of productive capacities of the countries involved in the agreement is limited and may turn out to be less than the known estimates, the Vortexa consulting company states in its report.
According to the company, OPEC + can run out of productive capacities within the next year, if the demand continues to grow, TASS reports.
Since May, the countries of the OPEC + agreement have been weakening restrictions on oil production, but not all of them were able to really increase production and exports, which fueled the rise in oil prices in recent months. Only Saudi Arabia and the United Arab Emirates were able to provide a noticeable increase in oil supplies abroad, whose total exports are currently 2 million bpd higher than the average in the first half of 2021.
“But their supply additions were eaten up by disappointing export levels elsewhere, including at that point of time Russia,” Vortexa notes.
Meanwhile other countries of the alliance showed stagnation or even a decline in production, according to the calculations by Vortexa experts.
“According to the EIA, global spare capacity in October was 6.2 mbd, while according to the Saudi oil minister it is 3-4 mbd. I would argue we have at best 3 mbd, up to 2 mbd in Saudi Arabia and less than 1 mbd in Russia and the UAE combined,” David Wech, Vortexa author, says.
“If demand were really to reach 2019 levels soon and declines at many producers continue at recent rates, most of that cushion could be used up within the next 12 months,” he concludes.”
Vortexa do ‘oil and gas real time cargo tracking’ and ‘analytics, it seems.
LOZ,
Thanks for this.
Synapsid
The Opec+ group’s compliance with its crude output restraint agreement rose last month as several members struggled to meet their higher quotas. It has left some key consumer nations mulling strategic stock releases.
https://www.argusmedia.com/en/news/2275656-opec-compliance-up-to-116pc-in-october-update?backToResults=true
Picked this from the blog of Mike S . Interesting read . Energy demand vs Talent demand . SS , LTO etc have for long have lamented on the shortage of manpower . Rigs don’t get installed automatically and pipes are not laid out by AI .
https://jpt.spe.org/if-this-isnt-the-end-then-what-is-it
Hole in head,
An interesting read I agree. The focus was on petroleum engineers and modern tools may allow more to be accomplished by fewer engineers using sophisticated software and AI. Certainly this does not help tht much in the field, though there may be some technologies that have made the job of a rig hand easier today tahn was the case 40 years ago, seems to be true in many trades jobs where better tools make the job easier than in the past.
Technology can do a lot in blue collar jobs. We don’t have oil here, so I know nothing about rigs, but I see enough construction site (and for information, we don’t build normal homes with wood and cardboard here).
Personal on construction sites halved the last 20 years – there is a mini crane on even the smallest site which can be steered with a smart phone like device from everyone, replacing lots of toiling. Special elements have increased – instead of brick and mortar bigger elements are placed direcetly with this crane without the help of an additional crane driver. And so on. That’s even with home or small condo construction.
I think that happened already with your oil rig situation, too.
I’ve seen a video from a gas rig where they pulled the pipe? and the pipe segments have been handled by the automatic. This would have been a 10 man crew and a big crane back in the 80s I think.
But the remaining people have to be more qualified – all these expensive machinery has to be used without errors to avoid big expensive damage. And that’s the work problem I think – you can’t employ someone who has delivered taco and pizza the day before.
XOM bid on and bought 94 GOM leases near the Texas coast for a massive carbon capture project.
Any comments on that?
My expectation for US output
Offshore Gulf of Mexico lease sale 257 occurred yesterday.
The biggest news is that Exxon picked up a whole bunch of leases in the shallow waters of offshore Texas for carbon sequestration.
https://www.oedigital.com/news/492193-exxon-lays-foundation-for-offshore-carbon-storage-project-at-gulf-of-mexico-lease-sale
Ha,, just saw Shallow Sand comments above. Sorry.
The leases Exxon bid on clearly follow the Miocene geologic trends in this part of the Gulf.
Offshore Texas shallow water has virtually no current production but it used to be a decent gas trend. Nice faulted 4-way structures are set up immediately downthrown to large, linear growth faults. Not sure if Exxon is thinking about injecting into the abandoned gas reservoirs, or if they are looking at injecting into other wet sands.
CCS projects will all be dropped when peak fossile start to hurt bad (already the case in fact), I mean it is at least 30 or 40% loss in energy efficiency (not even counting the CO2 pipeline I think), so for 2 mountain tops removed in the Appalaches, let’s just remove a third one to be able to put a green sticker on the KwH produced by burning the first two.
Somehow a mix of totally uninhibited extractivism and hysterical greenwhashing.
You imagine India or China using 30% of their coal output to push the waste under the carpet ? I don’t, and the idea is atrocious.
Will not happen anyway
Currently 2025 is the expected peak for Norway.
?? You mean a second peak ? Norway has peaked around 2000 for oil :
https://iiscn.files.wordpress.com/2021/11/oil-production-norway.png
Norway has had a number of local peaks, 2025 is the next predicted one. The Shif report is an excellent bottom up analysis, but only covers the main exporters to Europe. As for all these things its assumption on price has already proved wrong, but I wonder how much the lack of response from the industry to rising prices is surprising the analysists.
https://theshiftproject.org/en/article/oil-what-are-the-risks-for-the-future-of-europes-supply-the-new-shifts-report-about-peak-oil/
Thanks George,
That decline after 2025 is quite a bit steeper than what the NPD seems to predict.
https://www.norskpetroleum.no/en/production-and-exports/production-forecasts/
As mentioned before, Sverdrup will be an interesting case to follow, impressive so far, but stamina unknown at this point. But we´ll see.
Minor note, the graph posted by George above was a bit confusing at first, but per ans is apparently by year, so peak Norway was then about 3,2 mbpd or so, in 2001.
George Kaplan included a chart that showed a forecast for developments in oil extraction (not clear if this is all liquids) from the Norwegian Continental Shelf (NCS) towards 2050 in MBo/a,
1 MBo/d = 365 MBo/a
MBo; Million Barrels of Oil
NPD’s forecast at the end of 2020 for 2025 was for 2,09 MBo/d (C C) [which is likely to be revised for a combination of reasons]
D Coyne tries to refute the information in the chart posted by Kaplan
(by the way; Is George Kaplan a handle inspired by the movie “North by Northwest” by Hitchcock with Gary Grant, released in 1959?)
by showing a figure starting in 2015 from a recent forecast from the Norwegian Petroleum Directorate (NPD) for total petroleum extraction from NCS towards 2030.
Total petroleum extraction = Oil plus Condensate plus NGLs plus Natural Gas. (in MSm3 o.e./a; o.e. = oil equivalent)
For 2030 NPD as of recently forecast total petroleum extraction of 3,76 MBoe/d for 2030 from NCS.
(Note, this NPD forecast does not include a split between the different petroleum classes.)
Rune,
Thanks for the clarification, The NPD does include a split up to 2025. But the chart I found was the only NPD projection I could find for after 2025.
From this page
https://www.norskpetroleum.no/en/production-and-exports/production-forecasts/
When the data is downloaded from that page we get the following. My previous chart includes all petroleum liquids and Gas so as Rune suggests is not very useful.
Here is the NPD forecast for C plus C up to 2025.
It would be helpful to also present a likely trajectory for crude oil extraction from NCS for 2026 through 2030.
Based on the most recent NPD’s resource estimates, a steep decline could be expected (probably as high as 13-15% YoY on average for 2026 – 2030), which would make the forecast presented in the chart posted above by Kaplan seem optimistic.
Hi Rune , happy to see you interjecting once again . Please keep doing so . We need your expertise specially when we are on the downslope of ” peak oil ” . Hope you will accept my request . Take care and be well .
Rune,
The NPD oil resource estimate is about 53 Gb, using a rough assumption of 2 Mb/d in 2025, past output and past discoveries, I get the following through 2035 for an oil shock model, the decline rate averages about 3% from 2025 to 2035.
NPD resource estimate
https://www.norskpetroleum.no/en/petroleum-resources/resource-accounts/
The average annual decline rate from 2004 to 2012 for Norway’s C plus C output was about 7.3% per year
The method that gives good results for projecting future petroleum extraction developments is bottom-up analysis, which is complex, time and resource-consuming, and requires skills, talent, and relevant experiences.
This method is not perfect but makes it possible for others [third parties] to test and verify.
Further, it makes running scenarios with different prices and phasing of reserves with various start-up assumptions (drainage strategy and first flow).
In engineering and other disciplines, it is Standard Operating Procedure [SOP] to test the results with alternative methods, and if these converge, it is a good thing.
Using the data produced by the black-box model results in the following total extraction figures:
2021 – 2030: 1 115 MSm3 (crude oil)
2021 – 2035: 1 584 MSm3 (crude oil)
The black-box model tells nothing about when and what new developments (reserves and their classes) are phased in like:
Extraction and sanctioned (Class1, 2, and 3)
Clarification phase (Class 4)
Extraction probable (Class 5)
Not evaluated phase (Class 7)
Undiscovered (Class 8 and 9).
The black-box model says nothing about what reserves (size and location) are phased in and when.
For 2035 the black box model comes out with 88 MSm3 and does not estimate the remaining extractable at the end of 2035.
—
All data below is for crude oil and from NPD.
At the end of 2020, NCS reserves estimated in extraction and/or sanctioned were: 1 125 MSm3 (Class 1, 2 and 3).
Extraction in clarification phase: 252 MSm3 (Class 4)
Extraction probable, but not resolved: 154 MSm3 (Class 5)
Extraction not evaluated: 288 MSm3 (Class 7)
Does the black-box model list what total amount and which discoveries of the above will be sanctioned and in extraction by 2035?
One needs to take a deep dive into the distribution of the estimated reserves for the discoveries in the classes above and find the probabilities on which discoveries in these classes will be in extraction by 2035.
Then throw in (new) discoveries and when these will be sanctioned and start to flow.
The development of these reserves is price-dependent, and some are time-critical; they depend on access to existing infrastructure for commercial development. Some are small (less than 1 MSm3) and located such that developments are unlikely.
Bottom line, there is now nothing in the NPD data that supports the presented results from the black-box model as it has several inadequacies.
Rune,
No doubt there are proprietary forecasts, that give all of the information you require.
I do not have access to such forecasts.
The black box model, has cumualtive output of 39 Gb in 2035, assumed TRR is 53 Gb (from NPD), so remaining resources would be 14 Gb at the end of 2035. Output falls to 0.7 Mb/d by 2050 for this scenario. Cumulative output in 2050 would be 45 Gb, with 8 Gb of remaining resources. Cumulative output at the end of 2020 was about 29 Gb (based on data from EIA).
I agree a bottom up analysis is better.
Again, there is no way for others to verify the black-box model.
The black box model lumps together reserve and resources with no regard to status on reserves and resources, their sizes, and locations.
What are the estimated PDP reserves for the black box model at the end of 2030?
What is the forecast for the “creaming curve” for NCS from the black box model?
How does the split between the different resource classes develop for the period 2020 – 2030?
How does the R/P ratio for PDP reserves (RC 1, 2, and 3) develop from 2020 to 2030?
At the end of 2020, NPD estimated about 12 Gbo undiscovered resources (RC 8 and 9).
How does the black box model change the classification of these resources over time, i.e., move it from undiscovered to sanctioned for developments?
How long will it take to “confirm” the estimated undiscovered resources? 50 years? 80 years?
It is feasible to develop reasonable forecasts towards 2030 based on recent NPD data, but that takes time and some insights into Norwegian petroleum activities.
George Kaplan, who posts here, makes a reasonable effort at that.
Rune,
PDP reserves at the end of 2030 would be 3.4 Gb.
Extraction rate rises from 13.1% in 2019 to 19.4% in 2025 (output is 2.01 Mb/d for Norweigan C plus C in 2025 for the Oil shock model presented). Extraction rate falls to 18.97% in 2030 C plus C output is 1.8 Mb/d for scenario with an assumption of falling oil prices after 2028.
Chart for PDP reserves for scenario.
Rune,
Cumulative discovery (backdated), note that often past discoveries are updated over time and tend to increase more than they decrease ( a part of reserve growth).
Dennis
Norway’s decline from January 2017 to January 2020 appears to be steeper than 7.35%.
I did not expect answers to all the questions I raised earlier.
What Dennis provided so far suffices to document a portion of my critique about the black-box model.
1.) The black box model presents about 4 GBo of NCS PDP reserves for 2020.
NPD had 5,95 GBo of PDP reserves at the end of 2020.
2.) For 2030, the black box model has PDP about 3,4 GBo and an extraction of about 1,8 MBo/d = 0,66 GBo/a resulting in a R/P (PDP) of 5,2 and a YoY decline of about 3%!?
3.) For 2035, the black box model has PDP about 2,8 GBo and an extraction of about 1,45 MBo/d = 0,53 GBo/a resulting in a R/P (PDP) of 5,3 and a YoY decline of about 3%!?
Is there documentation from any basin where R/P (PDP) barely remains above 5, where the YoY decline rate remains at 3% for over a decade?
4.) I expected that actual data from the most recent NPD resource report had been applied for the presented creaming curve. From there, it is possible to make educated guesses about future trajectories.
Here I shall only point out one thing: NPD’s most recent resource report has total discoveries at the end of 2020 barely touching 40 GBo.
The black box model presents about 43-44 GBo for 2020.
Concerning backdated resources/reserves, let me point out that the most recent NPD report for NCS on these has revised down total crude oil reserves and resources to 52,1 GBo.
The above lists a few shortcomings and discrepancies between the black-box model and actual data and proven metrics (like the relation between R/P and decline rates).
Some basic QA would quickly identify these few.
Building a model is all about observing the natural world (or any other ecosystem) and making adjustments as observations [data, revised relations, etc.] so dictate.
The natural world gives a big EFF in models where the developer expects the real world to behave according to the model.
In one of my favorite financial channels, they used a cartoon illustrating this with the Titanic hitting the iceberg, whereby everyone on the bridge yelled, “That was not in our model!”.
I intend to stop this session here, as I IMVHO has documented some of my critiques regarding the black-box model.
Ovi,
You are showing net decline; that is, flow from new developments slowed the decline in crude oil extraction from the legacy developments/fields.
Several developments with reserves up to 300 Mbo were started in those years that soon added 100 kbo/d – 160 kbo/d each calendar year. These “smaller fields” enter a steep decline like 10 – 15% YoY after plateau.
You can look at the YoY decline from 2014 to 2017 without the developments added in those years.
Recent discoveries are generally smaller; many of the coming additions are from discoveries made close to 50 years ago.
Rune
Thanks. I realize that it is net decline. That is the only info that i have access to.
Rune,
Thanks for the feedback. The model is an approximation, based on limited information,
The PDP reserves estimates change over time and the model was last updated in detail in 2018.
Below is a modified model with faster development rates from discovery to production over the 2007 to 2020 period than the previous model. Proved developed producing reserves are 5.5 Gb at the end of 2020. Extraction rates (from PDP reserves) are shown on right axis and they decrease after 2025 so that output is about 1 Mb/d in 2030.
I do not know what future extraction rates will be or the rate that reserves will be developed. This scenario seems exceedingly conservative, possibly F95.
Cumulative output in 2030 is 35 Gb for this scenario, PDP reserves are 5.5 Gb in 2030.
Note that the extraction rate falls to 7% by 2030 for this scenario (from 13.4% in 2025), the last time extraction rates were 7% or less in Norway was 1993 and earlier (1981-1993 and 1971 to 1974).
NPD oil resources on Dec 31, 2018 were 8128 million cubic meters and on Dec 31, 2020 they were 8289 million cubic meters. On Dec 31, 2010 the estimate was 6458 million cubic meters.
Generally the number increases over time, this is why the often used term is reserve growth (rather than reserve shrinkage).
Ovi,
Using annual data from 2017 to 2019 I get average annual decline rate of about 6.2%.
An alternative model where R/P (using PDP for R) remains at about 7.3 from 2025 to 2035, average annual decline rate from 2025 to 2035 is 4%. Only change from model above is different extraction rates from 2025 to 2035. PDP reserves in 2030 are 4.6 Gb for this scenario (due to higher extraction rates from 2026 to 2030) an cumulative output at the end of 2030 is 36 Gb, backdated cumulative discoveries through 2030 are expected to be 45 Gb, in 2050 cumulative discoveries (backdated including future reserve growth) are expected to be 48 Gb. Note also that for the scenario I expect extraction rate will decrease more quickly after 2070 and URR for the scenario is 48 Gb. A more aggressive decrease in extraction rate would lead to a lower URR, perhaps 44 Gb or less.
Note that although the resource might be 53 Gb, not all resources are produced, the ultimately recovered resource is likely to be under 44 Gb as oil prices may fall after 2030 and some discovered resources will not be profitable to produce. Scenario below has URR of 43 Gb with cumulative output through 2060 of 43 Gb.
Rune,
This message just to let you know that I have your blog/site in my RSS reader (the way I read blogs, check for updates), and your RSS feed does not seem to work, it says “no article recently published”, whereas your article on the Bakken for instance should clearly appear.
YVES T,
Thank you for noticing me.
I will have a look into it.
(Due to little and infrequent posting some of my feeds may become disconnected.)
George , apologize in advance if it seems I am sermonizing which is not my intent because your knowledge is 100 x more than mine , but “lack of response from the industry to rising prices is surprising the analysists.” Should it or should it not ? If someone is updating himself on the affairs of the oil industry he will know
1. The world is now fully mapped .
2. There are no more spots of ” cheap and abundant ” oil to drill .
3. Oil companies cannot invest more because they now face geological limits on their existing operations viz depressurization , GOR , quality , carrying capacity etc which cannot be solved by throwing money .
4. Insiders in the industry are aware of ” Peak oil ” though they may not say it publicly . All are seeking an exit plan and have one foot out of the door .
In such an environment the lack of response is nothing to be surprised about , at least for those who follow the industry regularly . Tks .
Should it or not – I have no idea, it wasn’t a leading question,I was just wondering. In the Shift report (lucky i missed the t above rather than the f) They show a curve for expected prices and I can only imagine they assumed the development choices would be made as they have been in the past. There certainly isn’t a statement that says something like “we’re assuming these prices but also that the majors will be favouring share buy backs and dividends even more than they have been recently, so developments may be delayed or not happen at all.” Your comments apply more to yet to discover resources, I think (the blue bands), the parts that may be delayed with the reluctance to.invest which seems to be happening are the orange band (identified but not yet in development).
Looking at the graphs, the french one seems a bit strange. With the sudden spike in 2025 and the steep decline thereafter. A form of plateau from 2012 through 2030, and more supplies to come spilling into the 2030’s for a while seems more likely. A few fields are being delayed due to supply chain problems e.g. Johan Castberg starting late 2024 as being communicated. There is still a lot of potential of smaller tie ins around the 4 hubs in the Barents sea, and areas in the Norwegian sea and even in the mature North Sea. This will affect the 2030’s and 2040’s given the that the economics are good enough. There are some hopes that the tail will be less steep given the wast acreage outside the Norwegian coast.
HIH, the easiest oil has been mapped. But there is still a mix of profitable and less profitable smaller fields out there. Depletion of oil is a slow moving process, thankfully (given enough investments are poured in that is).
Kolbeinih , the key word is ” cheap and abundant ” . The rest is immaterial .
The famous “the end of cheap oil” front page by the Economists a few decades ago did not age well. The world is vastly big, so I still believe that if enough investments are put into it in a stable environment, the supply problems are going to be delayed. But that is not happening right now due to ESG policy, and due to the price being too low and volatile the last 7 years. Supply problems are coming no matter what I guess. If that is a bad thing…depends. We have to adapt to a lifestyle with less oil one way or another. There are a host of potential problems in the future due to living in excess (etc. a 100 mb/d oil lifestyle is one example) as I am sure you know well.
The decline is less steep than the 2002 to 2012 profile. This latest peak is a lot about Jahan Sverdrup which is pretty much an anomaly in a mature basin. Some of it is te Barents, but that alone would produce a much lower new peak. The predictions are based on Rystad data for discoveries which are probably as good for Norway as anywhere. I would agree with what is showing up based on the NPDs own estimates for what fields are likely to be developed. After Johan Castberg there is only Whisting as a stand alone hub, which will be in the orange band. There may be some other tie-backs in the “not yet evaluated” group but I think there authors, who are experirnced Geologists (ex IEA leads) would get these about right, so the orange band includes all likely tiebacks from recent discoveries. The biggest unknown would be expected new discoveries, which are quite low. But success rate in Norway appears o have tailed off quite quickly recently, as I discussed in one recent post, and the Barents appears more gas prone than North/Norwegian Seas.
Hi George.
It looks like we might finally find out if offshore Namibia holds any promise.
https://www.offshore-energy.biz/maersk-drillship-gearing-up-for-namibian-ultra-deepwater-well/
George, thanks for posting this.
It prompted me to look at my forecast for 2030 from 2017.
My last posted crude oil prediction towards 2030 for NCS was based upon actual data for NCS from the end of 2016.
Just roughly revisiting that forecast from early 2017 and adjusting for a higher actual extraction rate from Johan Sverdrup, deferred start-ups, etc., than what reasonably could be expected from open sources early 2017.
Recent sanctioned developments (like Johan Castberg and soon Brediablikk, to name a few) make me expect that total Norwegian crude oil extraction will be close to 400 MBo/a (1,1 MBo/d) in 2030 compared to the shifts projects expectation of 600 MBo/a (1,6 MBo/d).
We plan to update the NCS post (and make it public) with forecasts towards 2030 sometime after NPD posts their data for 2021 in the winter of 2022.
Rig count for week of Nov 19 is out.
Oil rigs up 7. Texas Permian up 5. NM Permian up 2. It’s all about the Permian.
thanks Ovi.
Permian horizontal oil rig count.
In March 2020 the count was 398 (recent peak), most recent month was 263, low point was 114 in July 2019.
Interesting that they state Urengoy need’s more compressor capacity.
https://www.bloombergquint.com/business/gazprom-readies-key-siberian-field-for-peak-output-in-winter
Investors, foundations, universities and governments pulled their assets from fossil fuel companies in record numbers in October.
https://www.resilience.org/stories/2021-11-16/the-divestment-movements-big-month/
Is this a financial response?
Why is there a gas shortage in China? Chinese pay more for gas than Americans while 1/5 income
This is what happens when you live in a society where everyone’s trying to rip everyone else off.
Thats Funny- we have someone from a capitalist country accusing the communist country of trying ‘rip everyone else off’ Hilarious irony.
You forgot to consider that China imports over 70% of its oil consumption. Maybe that has something to do with paying more for gas.
I don’t think you realize the scale of the corruption in China. It’s magnitudes worse than in any western country. Taiwan’s not like that either and China is a dictatorship, not a communist country.
“The blackouts that hit Texas earlier this year caused billions of dollars in debt for some utilities when natural gas prices skyrocketed. That’s led to lawsuits over alleged price gouging.”
“The thing is, jacking up the price of gasoline during a disaster is clearly illegal in Texas, but it’s not clear whether the same thing is true for what happened to natural gas prices. In Texas’ deregulated energy market, high prices during times of energy scarcity are expected. CPS Energy says this was different, that it was the victim of price gouging. And it’s one of several utilities suing natural gas suppliers and the group that operates the state’s electric grid. The state and the federal agency are also investigating what happened.”
I’m sure there is heavy corruption in parts of China.
Like in the USA, regulations and laws governing commerce (and murder) are not applied uniformly and consistently.
From Mike S blog .
https://www.oilystuffblog.com/forum/forum-stuff/you-can-t-be-serious
Read the comments also .
Does Mike S not realize that the USA exports chart includes oil that is imported and then refined in the USA? It’s a book-keeping gimmick to maintain the fraud that the USA is a “net-exporter” of oil.
Paul,
The chart posted by Mike Shellman is crude oil only, the fact is that much of the tight oil produced in Texas is exported (about 3000 kb/d exported of 5000 kb/d of tight oil produced in Texas (Eagle Ford and Permian Basin). About 1000 kb/d of the 4000 kb/d of Permian Basin output is produced in New Mexico.
Also the net export data takes all exports of crude plus petroleum products and deducts all imports of crude and petroleum products, the only problem with this is refinery gain, if it were done on a mass rather than volume basis it would give a more accurate estimate.
Dennis,
Agree, that’s refined crude oil, of which a large fraction of that is imported to start with. The book-keeping gimmick is that after the unrefined crude is first imported, it is then assigned as being a product of the USA for future export. That’s why the Trump administration was able to claim that the USA was a “net exporter” of crude oil.
The fact is that the USA produces 15 million barrels of oil per day, but consumes 18 million barrels of oil per day. So the USA probably imports at least 6 million barrels unrefined crude and reexports 3 million, thus keeping 3 million to make up the production deficit.
https://www.cmegroup.com/openmarkets/commodities/2021/2020-record-year-for-US-Crude-Exports.html
Lot of details concerning biofuels etc, but the net exporter slogan is nuts.
Biden to announce a coordinated SPR Release.
Sounds like a political move to show he is doing something about inflation and oil/gasoline prices. However seems like the market is discounting the move since at this time WTI is up a bit.
https://www.bnnbloomberg.ca/oil-pares-gains-as-biden-said-to-prepare-spr-announcement-1.1685295
Let’s see if the OPEC don’t talk only and reduces production. They have to coordinate only the core countries – the other ones are already wide behind their quotas.
This will be a double whammy in the future – when they have to refill….
Hawkish FED is also political move to dampen inflation. They don’t even have to actually raise interest rates. All they have to do is make it seem like they are going to.
Dangerous game to play though when everybody is leveraged short the dollar and long everything else. And the dollar is strengthening.
I’ll take the other side of the inflation bet and say oil is heading back to the $50’s If dollar index is going back to +100 that is exactly where the price of oil is going.
Tightening credit and 50$ oil will crash US LTO industry then. At 50$, LTO needs abundand cheap credit to keep drilling, even to hold production level. Otherwise we will see a production decline as in May 2020.
Then the SPRs need to be emptied soon – especially since OPEC will cut production then.
Alltogether this looks like an economic crash then – at 50$ the oil industry won’t supply the economy fully anymore – at least not longer than a few months.
I doubt we will see $50/b for an average monthly Brent oil price prior to 2029.
Never say never – with an economic / political crash like April 2020 we’ll see the 20$ again. And the attached chaos of this event.
And if the FED and other central banks botches the current inflation wave with wrong policies, we can see such things.
In my opinion the bonds will crash when QE finally stops – no one buys 2% bonds in such enviroment without a pistol to his head.
Economic science is very statistic driven – in past inflations, people where buying bonds over stocks. But in these time, bond interrest rates have been much higher.
We had +18.4% industrial prices in October in Germany. Good time to buy low interrest bonds on the brink of crashing.
Let’s face it: If the USA and Europe had to pay realistic interrest rates (Inflation + something for the risk of more inflation), they would go broke.
Wage inflation is ante portas anyway: With all this shortage of truck drivers, oil workers, bartenders … there is only one solution for many businesses: Pay more.
I did not say never. I said it is doubtful. As in low likelihood, before 2029.
Perhaps you are a bit older than me and witnessed the 1919 pandemic, I have never seen anything like the Covid pandemic prior to 2019. We are already seeing demand for oil recover strongly and oil output is unlikely to keep pace at an oil price under $75/bo.
That very basic economic analysis suggests oil prices at $50/b are not very likely.
It is true that an economic collapse could reduce demand, in my view such a collapse is highly unlikely in the near term.
Saw an interesting piece on the Newshour where David Wessel suggested the Fed has recently been less aggressive while waiting for Biden to announce his Fed chairman pick. Now that Powell has been nominated for a second term, the Fed might take more decisive action on inflation.
New post up by George Kaplan
https://peakoilbarrel.com/gom-reserve-revisions-for-2019/
and open thread
https://peakoilbarrel.com/open-thread-non-petroleum-november-23-2021/