The US Energy Information Administration (EIA) published its Annual Energy Outlook (AEO) 2022 on March 3.
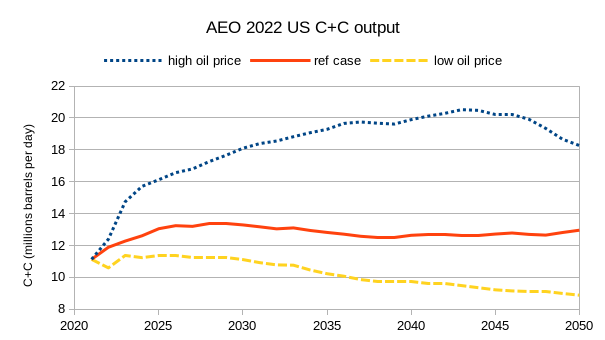
Three scenarios are shown in the chart above for a low oil price scenario, a reference case scenario and a high oil price scenario. The cumulative crude plus condensate (C+C) output for the scenarios from January 2021 to December 2050 is 112 Gb, 140 Gb, and 200 Gb for the low oil price, reference, and high oil price cases respectively.
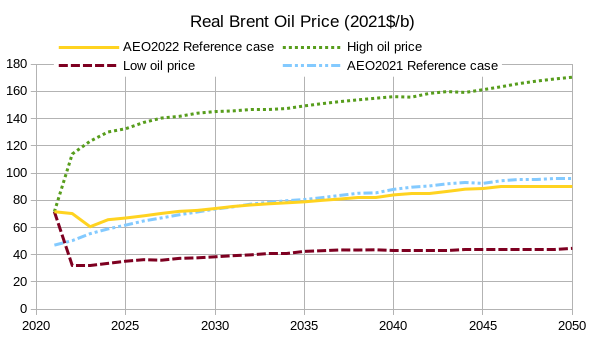
The real Brent oil prices for the AEO 2022 reference case and low and high oil price cases are shown in figure 2 above and the AEO 2021 reference case is included for comparison (little changed from last year). Based on current oil prices the high oil price case might be more reasonable, but oil prices are volatile and the future oil price is not known.
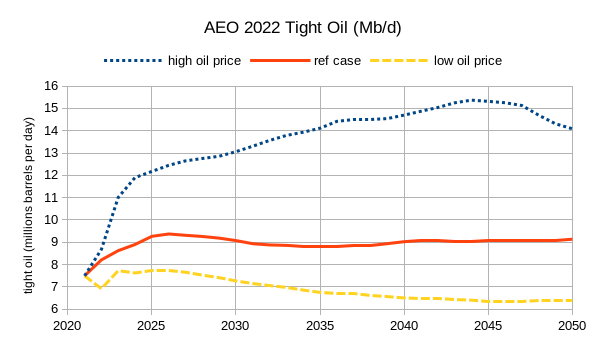
The chart above shows the AEO 2022 tight oil cases for the reference oil price and the low and high oil price cases (as shown in figure 2). Cumulative tight oil output from 2021 to 2050 is 76 Gb, 98 Gb, and 148 Gb for the three cases.
Actual output for both US C+C and tight oil is likely to be far less than what the EIA predicts in AEO 2022 because the real oil price scenarios do not anticipate falling demand for oil as the World transitions to electric land transport. By 2035 at the latest (and potentially this might occur by 2030) demand for crude plus condensate is likely to be falling faster than the supply of oil in a high oil price scenario. This will lead to falling oil prices.
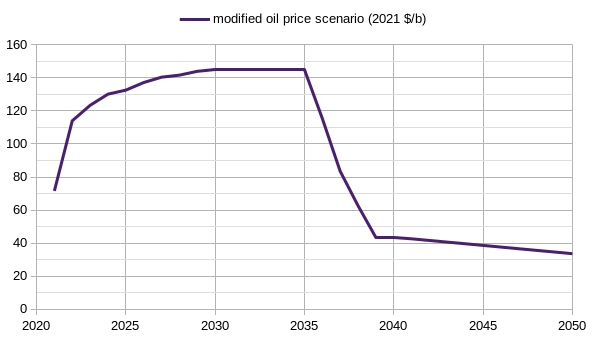
I have created a simple scenario that uses the high oil price scenario up to 2030, has flat oil prices at the 2030 level until 2035 and then oil prices fall to the low oil price scenario level by 2039 and then gradually fall by $1/b per year from 2040 to 2050. Chart below presents this modified oil price scenario in chart form.
Using the oil price scenario above we can estimate what tight oil output might look like using the high oil price case, the reference case, and the low oil price case.
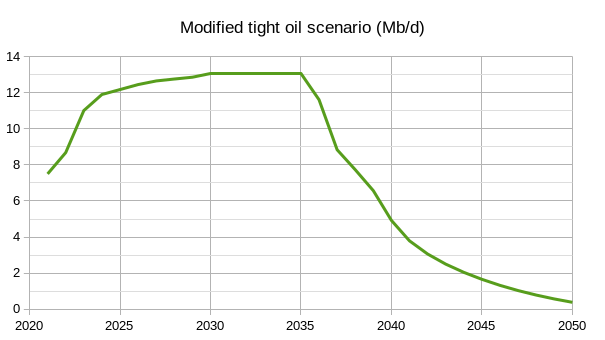
For the modified tight oil scenario above, I assume no new wells are completed after 2039 due to the low oil price (under $44/bo in 2021$). Note that the average 2020 Permian basin well barely breaks even at $43/bo at the refinery gate, in 2039 averge new well productivity is likely to be lower, costs are likely to be higher and breakeven oil prices will be considerably higher than in 2020 or 2021. Cumulative output for this tight oil scenario is 87 Gb from 2021 to 2050. Note also that if we assume oil prices start to fall in 2030 rather than 2035, and assume the decline is as rapid as in my modified oil price scenario from 2035 to 2050, but the curve is shifted 5 years to the left, than cumulative tight oil output would decrease by 24 Gb from 2021 to 2050 to about 63 Gb.
An earlier scenario for tight oil that I created in a previous post is compared with the modified tight oil scenario in figure 5 in the figure below.
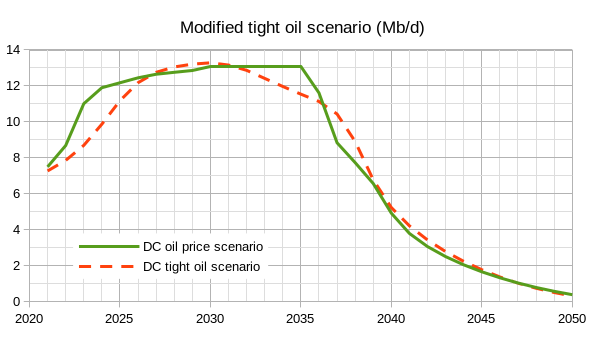
Cumulative output for the DC tight scenario is 85 Gb from 2021 to 2050, note that a different oil price scenario with oil prices falling sharply in 2030 rather than 2035 would reduce cumulative output by roughly 20 Gb.
255 responses to “Annual Energy Outlook 2022”
Dennis
There may be some merit in the high price scenario. However, as in 2008, it will be followed by a recession and anther oil price collapse. Throw in the new attacks by Yemen on Saudi oil facilities and it appears future oil supplies will be rocked by black swans.
Maybe you need to consider the high price scenario up to 2023 or 2024 followed by a price collapse.
I know that a few on this site don’t appreciate such speculative scenarios but I think they are necessary to get some insight into what could happen.
https://fortune.com/2022/03/09/worst-case-oil-forecast-240-per-barrel-global-recession/
My reaction was the same.
There is a big risk of a deep global recession in the next few years as higher energy costs bite into budgets for everything else.
Higher energy costs mean higher food costs, and higher raw material and manufacturing costs.
These higher costs will leave less capital available for all kinds of base infrastructure and energy projects needed for transition from fossil fuels. And much less family budget money for all sorts of purchases worldwide.
Surprising that US EIA would put out C + C production projections without considering the affects of electric transport on demand/pricing. Good job on that Dennis.
I suspect that oil prices as high as they are now will accelerate the adoption of electric vehicles. Watch the market in Europe to see where this is going worldwide.
Germany is the biggest car market in Europe- 2021 market share of new sales for vehicles with plugs was up 73% in one year and now at 26.0% market share. Don’t be surprised to see the plug-in market share in Germany reach 40% this year.
Ovi,
If there is a finacial crisis, prices could drop, consider the price history from 2008 to 2015 in response.
Perhaps we will see Great Depression 2, note also that my tight oil scenario only assumes a maximum oil price of $100/bo. The EIA thinks OPEC has a lot of spare capacity that will keep oil prices low and thet higher levels of tight oil output will not be needed. I am highly skeptical of the EIA’s IEO from 2021, oil supply is likely to be short and oil prices will be between the reference scenario and the high oil price scenario, perhaps oil prices may be low enough that economic growth will not be affected much.
Black swan events cannot be predicted, many of them might reduce oil supply rather than increase it which would tend to result in higher rather thn lower oil prices.
In any case if demand is lower, output will need to be lower and oil prices will be lower.
Feel free to create other scenarios, the number of possibilities is infinite.
Dennis
When I was thinking of black swan events, I was not contemplating the discovery of another Ghawar in Colorado. I was thinking of the latest increased capabilities of the Houthis.
The tank farms in Saudi Arabia that hold those 130 M barrels of inventory oil are a target for their latest cruise missiles. Also they could hit the gas oil separation plants. Both would be significant events.
As for the EIA assumptions regarding OPEC’s spare capacity, I am not clear on what information they have. My only thought is that through the use of horizontal drilling and water injection SA, UAE, etc, will be able to extract a higher portion of the oil from their reservoirs than in the past.
Ovi,
OPEC has been using horizontal drilling and water injection and many other high techniques for at least 20 years, potentially high oil prices might lead to more aggressive development and higher capacity, but my expectation is that much of this will be offset by decline in existing fields and they will struggle simply to maintain current capacity (or to offset decline in the 8 smaller OPEC producing nations). As to the 130 million barrels in storage, that is about 13 days of Saudi output, perhaps not that big a deal, the GOSP’s would be a bigger deal. All of this (any attacks on Saudi oil infrastructure) would suggest higher oil prices. The high oil prices will tend to increase output everywhere, relative to a low oil price scenario.
Chart below has real annual oil prices in 2021$/b from 2005 to 2014, average real oil price was about $98/b over this period. Notice how quickly oil prices bounced back after the GFC.
The low oil prices experienced from 2015 to 2021 was due to a glut of oil supply, I do not expect this to occur again until 2030 at the earliest, the odds are about 1 in 100 that this would occur before 2027 in my estimation. My best guess is 2032 for a future oil supply glut, with an 80% confidence interval of 2028 to 2036.
Discussion of EV’s reminds me of the story about why Henry Ford built his early cars to run on gasoline — because gasoline was dirt cheap, the refineries made money on distillates and flared or virtually gave away the fractions they had no market for. Today, distillate inventories are low and gasoline inventories comfortable. Permian ‘oil’ does little to help the situation, EV’s will exacerbate the demand distortion. Are we headed for a big discrepancy in gas/distillate prices again?
There are more EVs being sold in Europe than in the US, and in Europe they’re displacing diesel (distillates).
Looking at IMF forecasts out to 2026 and assuming real economic growth continues at 2.72% annually from 2027 to 2030 and tht 87 Mb/d of oil is produced in 2030 and sells for $145/bo in 2021$, then total crude plus condensate sales woulf be about 3.74% of World real GDP, this is unlikely to cause much hardship. Note that in 2011 about 4.4% of World Real GDP was spent on crude plus condensate with no ill effects on World real GDP growth, World real GDP grew at about 2.9% per year over the following 3 years as oil prices remained high from 2011 to 2014 (above $108/b in 2020$ for each of those years).
Oil prices at $280/bo (in 2021$) would be a problem, but I expect that such an increase would be temporary, we would see demand decrease and supply increase in short order (12 months), if that were to occur.
Using World Bank Real GDP data at link below
https://data.worldbank.org/indicator/NY.GDP.MKTP.KD
I find the following for real GDP growth in constant 2015US$, the only years from 1960 to 2020 where growth was less than zero were 2009 (GFC) and 2020 (global pandemic).
The only other times negative real GDP world growth occurred was from 1900 to 1959 was during WW1, WW2(including post war recession in 1946), and the Great Depression, see link below.
https://www.iea.org/data-and-statistics/charts/global-annual-change-in-real-gross-domestic-product-gdp-1900-2020.
Forgot chart for my comment above.
Hickory
BEVs and PHEVs are not immune from rising prices and already are out out reach of most buyers.
Ovi, many of the BEV/PHEV’s that are gaining market share are the smaller ones for the urban markets of the world. They don’t need the kind of range we have become used to in the wide open spaces of N.America, they are easier to park, and they are not so expensive because the battery size is smaller. These kind of vehicles will continue to gain market share, as the cost to operate/km is so much less than ICE when oil is over $50/barrel
examples-
https://www.caranddriver.com/reviews/a33540804/2021-vw-id3-ev-drive/
https://www.caranddriver.com/kia/niro-ev-2022
https://www.motortrend.com/cars/ford/escape-plug-in-hybrid/
Ovi,
It is highly likely the price of EVs will fall as output ramps up and economies of scale become a factor.
At high oil prices the total cost of ownership comparison between and EV and an ICEV becomes very favorable for the EV, even at current price levels, but the relative prices will become more similar.
Ovi,
Prices of cars in general have been rising due to supply problems. Tesla is not unique in this regard.
Ovi,
New car prices have always been out of reach of most buyers: historically 75% of car sales are used. More affluent buyers pay for the initial depreciation.
Ovi —
New cars are beyond the reach of most buyers, which is why the used car market is much bigger than the new car market. Most buyers eat the scraps the rich let fall from the table, like the dogs in the New Testament.
Or in well organized societies, they use public transportation. The German government is proposing a €9 / month flat fee for public transportation to deal with high oil prices. Private cars in general and new cars in particular are a luxury item.
The Pareto rule applies to light vehicle fuel consumption, by which I mean a minority of the vehicles are responsible for a majority of the consumption. The reason for this is that most vehicles are parked 90 % of the time. If a vehicle is used 2 hours a day 7 days a week, that’s 14 hours. But a week has 168 hours.
If the initial purchase price plays a major role in the total cost of ownership, the vehicle isn’t used much.
The owners of heavily used vehicles tend to be commercial operators with better data for decision making than private buyers have. They also have a strong incentive to reduce operating costs. We’ve already observed this with the Toyota Prius, which was first adopted by private early adopters, and then in much larger quantities by taxi companies.
To sum up, the percentage of registered vehicles isn’t a good proxy for fuel consumption, and what “most buyers” can afford is not a good measure of acceptable new car prices. So the price of new EVs is less relevant than you might think to future oil demand.
Absolutely correct. With little effort a person can look at the annual price increases in battery metals and see that fall of $/KW in EV,s is over and has to increase dramatically. With the worlds auto manufacturers racing into EV,s and Giga factories being built all over, metal supplies can’t possibly keep pace. With every energy related decision being keyed off of the carbon atom (except in China) the world is facing a grim future.
Ervin,
Often an increase in the price of a good, leads in time to greater output of that good. Often this also leads to economies of scale and improved processes which reduce the cost of the good. This is likely to occur with EV batteries as production ramps up.
See for example
https://news.mit.edu/2021/lithium-ion-battery-costs-0323
and the associated paper
https://pubs.rsc.org/en/content/articlelanding/2021/EE/D0EE02681F
Ovi-
“Sweden’s auto market saw plugin electric vehicles take 55.6% share in March 2022, up substantially from 37% year-on-year.”
These kind of headlines are less and less surprising.
Its the vehicle trend of the decade.
Hickory,
EIA considers EVs but believes adoption will be slow. I think they are wrong.
Dennis
Tesla Raises Prices
As I mentioned above, EVs are being priced out of the hands of the average consumer. The EIA may be incorporating higher EV prices in their scenarios.
https://www.reuters.com/business/autos-transportation/tesla-raises-prices-some-china-made-vehicles-2022-03-15/
The best selling car in China in 2021 is an EV, a tiny EV-
In 2021, the Wuling Hongguang MINIEV was the best-selling car model in China, with the sales volume of 426,480 units. [GM is part owner]
“China’s Best Selling EV Is Only $5k and Has a Range of 100 Miles”
https://www.reviewgeek.com/109476/chinas-best-selling-ev-is-only-5k-and-has-a-range-of-100-miles/
Its certainly not what I’m going to be looking for, but for many in the world the cost to own/operate advantage will be a bigger and bigger incentive as oil price and availability challenges continue on this decade.
We had a Fiat 500 for my mother in the 70th to drive shopping and go around with the 2 kids. This car is pure luxus in comparision – less range but more space, much less noise( it had a 2 stroke engine) and I think a lot more safe. And yes, more engine power ;).
And we didn’t drive 100 miles a day with that Fiat.
EVs are being priced out of the hands of the average consumer.
Tesla is still production limited. They’ve done a heroic job of doubling production every 2 years or even faster, but right now demand is rising mighty fast. They may as well raise prices to cover costs and increase investment in additional production.
Ovi.
Average new car price rose to $47,000 US $ in Dec 2021.
https://www.kbb.com/car-news/average-new-car-price-tops-47000/
The price of a Tesla Model 3 (RWD, 272 miles range) is currently $48,440, not a huge difference from the average new car price.
The BMW 3 series with similar features would be about $45,120.
At some point the price of used EVs will become reaonable, though currently a 2018 Tesla Model 3 long range RWD with 72k miles is listing for $41.5k on Carguru, it will be a while before these cars become affordable as a used car, the car may have been about 50k after the 7500 federal rebate still available in 2018, so not a ton of depreciation.
This is more likely a result of current high vehicle prices (both new and used) due to the chip shortage. My mechanic says that used vehicles are overpriced, and that there is no dickering on the new market, because dealers can sell everything they can get.
Lloyd,
I agree, my point was that Tesla is raising prices along with car producers in general, I thought it was interesting that the price of the Model 3 was pretty much in line with average new car prices, probably not a coincidence.
There is a big risk of a deep global recession in the next few years as higher energy costs bite into budgets for everything else.
Higher energy prices don’t increase energy costs. KSA won’t spend much more money on drilling, and US oil companies certainly won’t spend all of their new revenue on drilling, even if they succumb to a new enthusiasm for drilling. The US has very low net oil imports, so high oil prices would send money from New England to Texas, and from consumers to oil company owners. Money would be rearranged, but not leave the country.
Oil exporters might have inflation, while oil importers had recessions, but if the exporters are smart they’d lend their newfound money to the importers, and buy stuff from the importers rather than just buying debt. That’s what Nixon was all about: recycling the oil money leaving the US back to the US through the banking system, to prevent imbalances between importers and exporters.
Nick G,
Higher energy prices increase the cost of most other goods because typically energy is used to produce other things, or to transport those things or to heat the buildings where production occurs.
This then will lead to increased costs for the inputs to the process of energy production. Cost may rise by a significantly lower percentage than the increase in energy prices and this will vary depending upon how energy intensive the particular good is.
For an energy producer such as Saudi Arabia, one would look at opportunity cost. If a barrel of crude can be sold for $100/b on the World market, that is the opportunity cost of every barrel of oil used in Saudi Arabia, even if it is sold for less within the nation.
Higher energy prices increase the cost of most other goods because typically energy is used to produce other things, or to transport those things or to heat the buildings where production occurs.
For most things the cost of energy is a small percent. For instance, for Fedex, a transportation company, energy is only about 5% of it’s overall cost structure. The same is true for most industries, including most farming and manufacturing. There are some that are energy intensive of course, including trucking, fertilizer, petrochemicals, aviation and metal smelting. But they are a distinct minority. IIRC, when oil prices rose around 2014 it didn’t bleed into the economy in general: the core rate of inflation barely budged.
It can be very hard to separate the effect of general commodity price increases at the end of a business cycle from the effect of one commodity in particular. Oil is a relatively large commodity, but it’s not quite as influential as is often speculated.
This then will lead to increased costs for the inputs to the process of energy production.
I’d say that simple excess of demand over supply in a boom and bust environment is the important factor.
Cost may rise by a significantly lower percentage than the increase in energy prices and this will vary depending upon how energy intensive the particular good is.
Yes.
For an energy producer such as Saudi Arabia, one would look at opportunity cost. If a barrel of crude can be sold for $100/b on the World market, that is the opportunity cost of every barrel of oil used in Saudi Arabia, even if it is sold for less within the nation.
That would be the rational approach! Oddly enough, KSA has been announcing dramatic plans for wind & solar for years, and failed to come through. Lately that appears to be changing, but it feels a little like Charley Brown and Lucy’s football.
I suspect that the bias inside the country towards oil and gas, and the power of these legacy industries, has blocked these plans. It’s similar to the US, which has been a heavy oil importer for most of it’s history since WWII, but still can’t find it’s way towards the kind of rational fuel pricing we see in Europe.
Nick “Higher energy prices don’t increase energy costs.”
Of course not, its the other way around.
High energy costs are reflected in higher pricing.
Are you suggesting that oil prices have suddenly risen because the cost of extraction has suddenly risen?
If you’re thinking of marginal costs, then that does make a little sense. Additional LTO supply in the US is much more expensive than the average cost around the world. But most oil comes from older wells where the costs are pretty much fixed. A sudden rise in oil prices simply means a great deal more profit.
Nick G,
My understanding is that costs per barrel tend to increase in older wells due to higher water disposal costs and downhole maintenance, this is based on comments by Shallow sand, I do not think costs are fixed for older wells.
As with many commodities, there is a huge gap between the extraction costs of oil and the price consumers are willing to pay. That is why prices are determines by herd instincts, not by supply and demand.
Of course in the long term supply and demand do determine prices, but in the long term we will all be dead, as Keynes put it.
“Supply and demand” and are worshiped like gods. But the demand curve is a piss poor way of predicting price. Why? Look at the chart. It doesn’t contain a time axis.
You don’t have to be math genius to see it supply and demand are meaningless as predictors. Like the old blues song.
Cocaine’s for horses and it’s not for men
Doctor says it’ll kill me but he don’t say when
Of course in the long term supply and demand do determine prices, but in the long term, we will all be dead, as Keynes put it.
Well, just what period are you calling “long term”? Keynes was obviously talking about many years. Long term as far as supply and demand is concerned is a month or two at most. News and rumors always determine the short-term swings in the price of oil. But if you think that high prices can be maintained when there is a worldwide gult ot oil then you are sorely mistaken. And likewise, if you think low prices can be maintained when the world is screaming for more oil then you need to rethink your worldview because it is sorely screwed up.
No, it is just plain common sense. Supply and demand determine the price of every commodity. That is just how the world works, whether you believe it or not.
costs per barrel tend to increase in older wells…costs are fixed for older wells.
Sure. But those costs don’t increase overnight, nor are the cost of existing wells related much to the current price of oil. For example, KSA has very low lifting costs, and if the price of oil jumps that simply means more money for the royal family, government spending and the sovereign wealth fund.
If the price of oil doubles in the space of a week, the cost structure for both private and national oil companies doesn’t change: only the surplus revenue.
there is a huge gap between the extraction costs of oil and the price consumers are willing to pay.
Part of your message is that “demand” can come from foolish fashion, misguided conspicuous consumption (.e.g, massive SUVs and pickups carrying only one passenger), etc.
We can hope that consumers wise up, and choose not to pay for high priced oil. EV sales roughly doubled in the last year, and smart consumers will continue this trend.
Ron —
Keynes was interested in boom-bust cycles and the relationship between inflation and unemployment. He identified supply chain shocks as the primary drivers of these booms and busts.
He was also interested in what he called “sticky” prices. According to classical economics, unemployment is impossible because the price of labor should fall when demand outstrips supply. Your “common sense” directly contradicts empirical data.
Oil prices vary wildly although supply and demand change slowly. According to Keynes, inventory levels are a more important driver of prices than supply and demand. One reason economies are so much more stable today than a century ago is better inventory control.
Oil traders agree. Oil prices are dominated by inventory levels and concerns about general political and economic issues — basically the herd mentality of the traders.
According to Keynes, inventory levels are a more important driver of prices than supply and demand.
Naw, I have to doubt that Keynes wrote that. Keynes was a very smart man. He was smart enough to know that inventory is supply. Or at least a very large part of it.
Oil prices are dominated by inventory levels
Well, what the hell would you expect? Low inventory tells traders that production is low. High inventory levels signal a glut is there. Of course, inventory levels are also an indicator of demand. If demand gets low then inventory levels pile up and vice versa.
Nick,
You said that costs for older wells are fixed, that’s just wrong, when someone says something that is false, I point it out. Let’s consider a business, costs do not change quickly in most cases (though the cost of steel pipe can change dramatically as can the cost of sand, and energy, etc and these are input costs for producing oil). The important consideration for a business is the profit (that is price minus cost). Take your Saudi Oil well, yes if prices double there is more profit and this might lead to more resource development, if the expectation is that high oil prices will continue. Now consider oil prices dropping by a factor of 2 or 3, this might lead to low or no profit and in the case of cost greater than price, a rational business might stop producing oil.
In short the price of oil matters, especially longer term (over several years) as consumers have a chance to adjust (buy a smaller vehicle or switch their home heating system to natural gas instead of oil, or move closer to work).
Ovi,
When real oil prices rose from 2009 to 2011 by about 72% over 2 years there was no World Recession. Oil is much less of a factor in the World economy today than in 1973 or 1979.
Note also that I do not expect oil prices will remain at very high levels, they will probably settle in the $100 to $150/b range (2021$) and there could be a mild recession at some point.
I do not expect oil prices will remain at very high levels
The old economist’s truism, which I’m confident you’re very familiar with: The cure for high prices is…high prices!
So “The cure for high prices is…high prices!”
The best way to put out a fire is to pour more gasoline . 🙂
In the past, high oil prices have eventually led to low oil prices sometimes due to slower economic growth and sometimes due to over supply, though in every case it is a combination of both these factors (lower demand and increased supply) that brings oil prices down.
Sorry to state the obvious, but your joke suggests you may not agree.
Dennis , ” You talkin to me ? ” Robert De Niro in The Taxi Driver .
$ 25 by 2025 , remember our bet ? Obviously not . In India we say eat almonds to devolp a good memory . 🙂 . Get some when you go shopping next time .
Dennis,
I believe this truism applies generally to commodities (as well as pretty many any free market), where boom and bust cycles are a classic and enduring problem for producers.
High prices cause reduced demand through more efficient use and substitution, and increased supply. This is true of oil as much as anything, though as we approach PO the most important dynamic will be substitution. One can also think of this as a supply effect, as electricity replaces oil.
I’d say it’s misleading to emphasize reduce growth as an effect of high oil prices. First of all, it’s mostly true from the point of view of oil importers: high prices are very good for the economies of oil exporters. Secondly, PO enthusiasts have mistakenly generalized from short-term impacts of high oil prices to the idea of long-term economic harm: this is not the case. For instance, we see from the work of Prof James Hamilton that high oil prices contributed to the 2008 credit shock because of the short-term impact of reduced sales of low-MPG SUVs & pickups.
Hole in head,
My expectation is that oil prices will eventually fall, but my guess is $30/b (in 2021$) in 2035 at the earliest (probably more like 2040). I do remember your prediction of $25 in 2025 (I will assume in 2020 $). Note that low prices are also the cure for low prices as demand tends to increase and supply tends to decrease at a lower oil price level.
Doubtful that demand for oil will be met with adequate supply of oil at $25/bo, prior to 2070.
Nick,
In some cases economic growth slowed as a result of a large increase in the price of oil (1974, 1980-81, 2008-2009). In the last case the large increase in oil prices in the first half of 2008 was only a part of the story, the main reason for the GFC was poor financial regulation. The effect is likely larger for oil importers, but much of the World’s economic activity occurs in oil importing nations.
In some cases economic growth slowed as a result of a large increase in the price of oil (1974, 1980-81, 2008-2009).
The effect of oil in 1980 is often exaggerated. The Fed under Volcker chose to “wring out” inflation expectations that started to rise during the Vietnam war due to “war on a credit card” and loose money from the Nixon/Arthur Burns Fed. High oil prices contributed to inflation, but were not the primary cause.
. The effect is likely larger for oil importers, but much of the World’s economic activity occurs in oil importing nations.
The effect is equal. Every dollar that leaves importers goes to exporters, one for one.
In the short term there is turmoil, lag and market “friction”, but in the medium term oil importers will increase their consumer imports, and oil exporters will issue debt to cover the transition. A little later oil exporters are likely to get carried away and overspend on imports, causing dutch disease and eliminating the importers’ debt caused by the transition. And then EVs will cut their revenues, and they’ll be in trouble, like Venezuela is now…
Nick G,
Nothing is ever determined in society by a single cause, the fact remains that many recessions have been preceded by a sharp increase in the price of oil, one could argue that increased spending on oil might reduce spending on other goods. Also note that not all income is spent, and not all savings are invested, these are ideas from classical economics that have proven false, especially in the short run.
It’s not only the purchase price it’s also the price per kWh. I just checked for the area in Germany where my parents live: 48 US cents per kWh.
Half of the households are renting and can’t put up panels. Quite a few roofs are not suitable for PV since they were not designed to take additional weight, except snow.
Another issue is that the grid at the street level was not designed for charging EV s.
There are quite a few houses in the neighbourhood that don’t have garages. I can see three Teslas being charged with a cable hanging over the garden fence onto the street.
Yep, electrical price is absolutely a big deal.
Where I live our state has a flat rate 11 cents/kWh.
Certainly Germany has some big and difficult decisions to make.
I’m still waiting for the invention of roads that only go downhill.
German electricity is priced high for consumers to encourage efficiency and conservation, but low for industrial/commercial to protect export competitiveness. IOW, pricing is an allocation/regulatory decision, not simply a “cost” decision.
Similarly, in the US it’s generally possible to get special low pricing for EV charging, usually through a new meter. That ought to be possible in Germany.
On the other hand, Germans used highly efficient washing machines dryers etc, and that cuts costs a lot. In fact, German households don’t have high electricity bills compared to American electricity bills, despite high prices.
The power of pricing incentives to encourage efficiency, conservation and substitution!
More than 30 €-cents / Kwh, next year much more. When getting a new tarif, we are at 50 cents at the moment.
No incentive to waste anything. I’m at less than 1500 Kwh/year for 2 people at the moment.
Trying to live in unnatural Industral Civilazation predicts its own end.
We need an Agraian Society.
Instead we got the MIC
So, lots of comments on EV adoption but zero on what appears to be very optimistic future US C & C production?
There must be a heck of a lot more oil in those six Midland Basin counties than even the shale cheerleaders think?
As for EV, I don’t know. It’s been 10 years since my neighbor bought a Tesla, and to date there are four registered in my county of almost 20k. I do see more and more all the time in the various suburbs I travel to.
Seems we are decades away from a lot of electric semi-trucks, tractors and airplanes. Not to mention all of the non-fuel uses.
But enough of that, we could debate that forever.
Doesn’t anyone here think the idea that US C & C will quickly ramp to 16, 18 and over 20 million BOPD in the “high price” scenario and be maintained for decades is a little far fetched?
Hi Shallow.
It will also be interesting to see how this goes.
https://asia.nikkei.com/Business/Markets/Commodities/Japan-U.S.-U.K.-lenders-loan-Kuwait-1bn-to-boost-oil-output
I’m not sure how it’s worth while or even possible to comment on the EIA estimates because how they are arrived at is pretty opaque. They seem to be based mainly on demand side considerations so are not far removed from a cargo cult. I haven’t done a detailed look but they appear to be incompatible with EIA estimates for reserves, which I think are based on company estimates and therefore include geology considerations.
When I used to be involved in contingency studies to look at price variation effects on project or reserve viability the low price variations had a much bigger effect than the high price ones; e.g. a project could be rendered uneconomic with relatively small price drops but the upside wouldn’t be really significant, even from doubling the price. The EIA studies show the opposite effect. I can see conventional offshore projects have different characteristics to tight oil – i.e. once a platform is in place, especially if it’s got a rig for dry trees, almost all the oil is available oil can be accessed, EOR might get a bit more at high prices but there is an absolute limit no matter what the price. However the EIA numbers don’t really pass the smell test.
I’ve only briefly looked at how good previous EIA estimates turned out for the GoM, and I’d say not very, even given that they were changed every week to match the most recent production figures.
At the moment frac. spread numbers are declining even as prices stay high, which seems the exact opposite of what EIA would assume.
Well said, George. Frac spreads are dropping with WTI at $110. DUCs are almost used up and rig counts in the Permian, our last great hope for any increase in US oil supplies, are not increasing enough to offset the fall in DUC inventory. Unlikely the US will break 12 m/d in 2022 even if oil prices stay above $100. So far as the forecast that is the lead for this article, it’s straight up asinine and only a fool would believe it.
Stephen Hren,
I agree the AEO 2022 high oil price scenario is not realistic, particularly after 2035.
As far as US output reaching 12 Mbpd in 2022, for past 12 months US output has increased by 511 kbpd and tight oil output increased by 577 kb/d from March 2021 to February 2022. The linear trend for the past 12 months for tight oil output is an annual increase of 664 kb/d. Higher oil prices might increase this annual rate of increase.
Shallow sand,
I agree the EIA high price scenario is quite far fetched. If we focus on the tight oil scenario for the high oil price case the cumualtive output from 2021 to 2050 is 148 Gb, in addition about 17 Gb had been produced by the end of 2020 and another 12 Gb wold be produced after 2050 if no more wells were completed afer December 2050, so this suggests a tight oil URR of 177 Gb, likely at least 75 Gb too high in my opinion. My modified scenarios are more realistic at roughly a 103 Gb URR for tight oil, assuming oil prices remain high through 2035.
In fact, it was the unstated point of the post. The reference case seems more reasonable as far as URR, though still probably 25 Gb too high when we add tight oil output before 2021 and after 2050 (17 Gb before scenario and perhaps 13 Gb after 2050).
The reference oil price scenario does not seem realistic, especially for the period from 2022 to 2035 and especially if you are correct that adoption of EVs for land transport is very slow. Basically the EIA assumes there is a lot of oil that will be produced by OPEC that is unlikely to be profitable to produce at the reference oil price scenario.
See comment at link below on OPEC output forecast by EIA
https://peakoilbarrel.com/annual-energy-outlook-2022/#comment-737517
real life comparisons for the US reader to ponder on.
Your prices.
What you’re paying now Your new prices from 1 April 2022
Electricity Standing charge (per day) 24.112p > 43.394p
Unit rate (per kWh) 20.680p > 28.455p
Gas Standing charge (per day) 26.123p > 27.219p
Unit rate (per kWh) 4.169p > 7.479p
typically I use 5000Kwh electricity and 13,800Kwh gas, 3 bed semi with 3 adults
( double glazed and cavity walls insulated for a 1974 build )
UK use for a typical 3 bed house is 4200Kwh electricity and 12,000Kwh gas
Vauxhall Corsa -e (typical small car but not the smallest )
Approximate miles: 209 (WLTP)
Cost: from £26,640
Rapid charging: Yes: up to 80% in 30 minutes
Available: Now
price range is £26,640 to £30,110
£17,380 to £29,605 for fossil fueled versions
NOTE: the UK is in a period of Wind drought and our 24GW capacity produced yesterday an averge output of 1.467 GWh .
Cheers
Forbin
Buy ASAP . They are running out . 🙂
A comment on another blog . True ??
“The type of sand frackers need has tripled in price which is one reason fracking has not expanded much even with the high price of crude.”
Russia is in peak oil mode. This is the 2nd and last peak
https://crudeoilpeak.info/russian-oil-production-update-nov-2021
When the first peak happened in West Siberia in the mid 80s (+Chernobyl = energy crisis), the collapse of the Soviet Union followed.
http://crudeoilpeak.info/russia%e2%80%99s-oil-peak-and-the-german-reunification
The war in Ukraine and sanctions will accelerate the decline after the peak. We do not know what is going to happen.
Matt, it has been a few years since we’ve seen your lovely layer cake graph of world C&C production (most recent data up to Dec 2018).
Shall we look forward to seeing one again?
Yes, I am working on it
Behind a paywall unfortunately, but there may be a free copy somewhere:
https://www.ft.com/content/1f8a2511-d6ab-4183-b5c6-da6a69b3c815
“‘You can’t just turn on the taps’: bottlenecks hit hopes of US oil output surge”
Try this
https://www.universalpersonality.com/you-cant-just-turn-on-the-taps-bottlenecks-hit-hopes-of-us-oil-output-surge/
Dennis- I offer some push back on the idea expressed above that the global economy can digest higher oil prices out to 2030, with out recession.
I cannot vouch for the accuracy of this report, but the gist of it is close I suspect-
“Primary energy expenditures are likely to reach a new peak of 13% of GDP in 2022, comparable to levels in the 1979-80 energy crisis. This is 3x the average level of 4% from 1900-2020, and 1.3x 2018 levels.”
https://mailchi.mp/thundersaidenergy/subject-13393832
I doubt this is just a temporary blip. This refers to ‘primary energy expenditures’ rather than just oil-
its the whole ball of paraffin, except…
this does not take into account other related energy expenses related to transition from and depletion of fossil, such as building nuclear, wind, solar, transmission, storage, and electrification of transport, building retrofit, HVAC upgrades, etc. And it does not take into account the higher knock off affects of high energy cost such as on food and raw materials/manufacturing.
In sum, I expect high energy related expenses to challenge the global financial wellbeing and economy performance in a very strong manner this decade. Big enough that the projections will get thrown off hard is my guess.
Hickory,
I focus on oil, would need to research more to compare past levels, note that there have been times when oil expenditures were roughly 10% of World GDP (1980). Not sure about all fossil fuels.
Hickory,
I have realized that trying to calculated coal and natural gas spending is quite tricky as there are many diffierent markets for natural gas and coal, there is less of a World market than is the case for oil, I would be highly skeptical of such estimates for coal or natural gas.
If we use Asian Marker price for coal and the German import price for natural gas to represent World prices (data from BP stats), we get about 8% of World real GDP spent on fossil fuels in 2011 (data on prices only available from 1987 to 2020). As to future prices, that is difficult to guess, if we use IMF forecast for 2022 real GDP and $100/bo for oil, $20/MCF for natural gas and $220/tonne for coal we get about 7.65% of World real GDP spent on fossil fuel in 2022. If oil prices average $150/bo in 2022 (rather than $100/bo) then we would have 9% of World real GDP spent on fossil fuel, slightly higher than in 2011. We can only speculate on future fossil fuel prices. Very high prices for all fossil fuel could potentially lead to a recession, though it might also spur demand for wind, solar, geothermal, hydro, nuclear power and EVs, as well as heat pumps, and refitting buildings for better energy efficiency.
Strong work making the attempt Dennis, impressed at the effort as always.
I was just trying to point out a scenario that has a pretty high chance of coming true in my view of things.
Some people refer to a ‘great reset’ or readjustment to a world with less energy, less credit, less trade, less honoring of treaties and country boundaries, old alliances.
I’m not sure if this current disruption to the flow of things will be the trigger that pushes the global economy over the peak, but it could be.
I have a new term- Peak Combustion.
Its not here just yet.
Thanks Hickory.
I checked oil spending using Brent crude prices and the hgh point was 9.2% of World real GDP in 1979 (from 1970 to present, annual data), so I remembered incorrectly. Chart below has that data for 1970-2021.
Forecast for % of spending on oil assuming 4.5% annual growth in World real GDP in 2022, 2.7% growth in 2023-2026 and 2% in 2027-2030, oil prices rise to $110/b (2021 $) for average annual price in 2022 and increase by $5/b each year up to 2030. Forecast in red (and dotted line), historical data in blue (solid line).
Thanks Dennis.
Not what I expected.
This is exactly Tim Morgan’s point at Surplus Energy Economics. GDP data obscures the point that a fair bit of GDP is actually just activity to extract the energy we need for everything else. This leaves less left over for everything else we value economically.
Coal is dead you say? Well, a 500Mtpa increase will certainly feed a terrific swath of those Chinese EVs. 😉
CHINA COULD EXPAND COAL PRODUCTION BY 500 MILLION TONNES IN 2022
“China has produced 687Mt across January and February, 10% up year on year. According to analysis from Macquarie Bank after seasonal adjustment that would imply a growth rate of a whopping 500Mtpa, two and a half times Russia’s total exports in 2021.”
https://stockhead.com.au/resources/monsters-of-rock-chinas-to-expand-coal-production-by-500-million-tonnes-in-2022-macquarie-says/
Just a thought . 2022 we will talk about energy . 2023 we will talk about food the way things are devolving currently .
Yup. See Doomberg on Substack’s latest piece:
https://doomberg.substack.com/p/farmers-on-the-brink
The Ukrainian invasion won’t help either:
https://www.thisnannuplife.net/less_4_f_is_for_famine/
Spriv and Hole in head,
Let’s talk about food in the Open thread please.
Thanks.
Ok , boss .
That is a great article even though it’s on the wrong thread
Stephen,
You can copy the comment into the open thread.
FED is hiking rates and appear to be going to hike aggressively into an inverted yield curve. This isn’t a black swan event. More like a planned demolition. West already has their bogeyman to take the blame.
A lot of short selling going on in government bond markets not just in US but just about everywhere. My guess is we going to get a collateral shortage where the shorts have no way to exit and we get a massive margin call in bond markets.
FED will step in but it won’t be until markets and prices and inflation have fallen a lot.
HHH , correct ( as usual ) . Car production is dead ( semi conductors etc ) and so is housing . The two main engines of growth are now sputtering . 2020/21 was Covid and 2022 is Putin . Never fix the problem , easier to fix rhe blame .
https://wolfstreet.com/2022/03/26/the-treasury-bond-massacre-and-the-spike-to-5-mortgage-rates-this-is-all-going-very-fast/
Yes yields are rising at same time inverting. But understand the majority of the big players the primary dealer banks and large banks don’t buy and own treasuries for the yield. They don’t care what the yield is. They need the bonds and notes for collateral.
I don’t know how high yields will top out at. But what I do know is there are a lot of people who will have to post more collateral that they don’t have as things get repriced.
And eventually these dealer banks and large banks come flooding back into bonds and the shorts get crushed as they can’t find the collateral to exit their shorts.
With US treasury issuing less debt it’s a recipe for a large margin call in markets and lower oil prices.
Igor Shpurov: If oil production of 115 million tons is stopped, it will be possible to restore it only by 70%
March 24 / 08:52
Surgut, KhMAO. If oil production in the amount of 115 million tons is stopped, its subsequent recovery will not exceed 70%. This was announced by the head of the FBU GKZ Igor Shpurov today during a speech at the Oil Capital forum.
“In Russia, a possible limitation of oil production in the amount of 115 million tons is being discussed. This is exactly the volume that is currently exported to the EU (108 million tons) and the US (7.4 million tons). This is fraught with great risks,” said the director of the GKZ.
He recalled that the implementation of the OPEC+ agreement in 2020-2021 implied an annual reduction in production by 48.7 million tons due to the suspension of low-rate wells. The level of 2020 (pre-crisis) has not yet recovered. Accordingly, according to Igor Shpurov, the consequences associated with a reduction in the volume of 115 million tons will be much greater: “This is a stop in drilling in volumes of about 26 million meters per year, a reduction of about 13% of the drilled stock. The result is a complete shutdown of the drilling service. And geophysical, repair and other types – by 40%. This is a rather serious loss of technological competencies that our companies have gained in recent years.”
According to the GKZ, in the event of such a large-scale shutdown of oil production, recovery in the future will not exceed 70%.
In order to prevent such a blow for the industry, Igor Viktorovich is sure that it is important to keep production at the current level (2021), while maintaining the restrictions that were introduced by OPEC+. This will help maintain competencies in the industry, jobs and a relatively quick recovery of production.
“In order to place oil surpluses, it is necessary to create a system of temporary storage facilities (TSS), primarily in salts, which will accumulate about 55-60 million tons of oil annually. Russia needs 20-25 such storage facilities. By the way, in the United States, the capacity of underground storage facilities is more than 100 million tons. It is clear that it will not be fast, but there is such a possibility,” the head of the State Committee for Reserves emphasized.
To do this, according to him, it is necessary, first, to prepare, together with oil companies, a plan for implementing a scenario with a partial decrease in oil production and the organization of a storage facility for temporary storage of oil, providing for the maximum preservation of service and the rational use of subsoil. The second is to develop a system of tax support for events. Third – to work out the issue of adjusting the transport corridors of export supplies, taking into account the localization of PCN.
And, finally, consider the possibility of abolishing the MET for oil sent for storage in the PKhN.
Recall that in 2019 Russia produced 560.2 million tons of oil and gas condensate. At the end of 2021, this figure amounted to 524.05 million tons.
I mentioned earlier that the EIA has high expectations for OPEC output.
Consider Jean Laherrere’s oil forecast from August 2018 (link below).
https://aspofrance.org/2018/08/31/extrapolation-of-oil-past-production-to-forecast-future-production-in-barrels/
OPEC conventional crude URR was estimated at 1070 Gb (excluding Orinoco belt oil in Venezuela) with remaining resources at the end of 2018 at 552 Gb. The EIA’s 2021 International Energy Outlook (IEO) has OPEC crude output at 429 Gb from 2018 to 2050 with cumulative output from 1960 to 2050 at 949 Gb. We would expect OPEC to peak at about 50% of URR, which is 535 Gb of cumulative output, OPEC reaches cumulative output of 543 Gb in 2019 (and 532 Gb in 2018). Chart below has the IEO 2021 OPEC reference case. This is not a realistic scenario.
Chart below has high oil price case for OPEC, essentially oil prices are high due to lower OPEC output, no doubt there must be other nations with lower output as well because the US has about 8 Mb/d higher output in the high oil price case. Also note that the IEO scenarios for both reference and high oil price cases have cumulative crude output of 2400 Gb through 2050, Laherrere estimates about 2800 to 3000 Gb for World URR in August 2018. If the peak were at 50% of URR, that suggests 2022 for a peak, based on the IEO forecast.
In any case the EIA scenarios are not very good.
World crude minus US crude output in IEO 2021 high oil price case. After 2032 this scenario looks quite unrealistic to me.
Okay, so this is what the EIA expects from OPEC. What do you think Dennis? Do you think OPEC is likely to steadily increase production almost every year until reaching 42 million barrels per day in 2050?
Ron,
No I do not. This is why I said the scenarios were not good, I meant to imply that it is wrong in my opinion. I also called the IEO OPEC scenario unrealistic.
I think OPEC might return to 33 Mbpd at best, perhaps by 2030, then I would expect a plateau of perhaps 5 years followed by decline. Below I compare the IEO 2021 high oil price case for World C plus C output with an oil shock model that has not been adjusted for lower Russian output due to Ukrainian invasion and resulting sanctions ( the shock model is likely optimistic as the model presented assumed Russian output would plateau at around 11 Mb/d for 2022 to 2028 followed by decline, note that IEO 2021 also did not anticipate a disruption of Russian output and will likely be revised lower for 2022 to 2028. Difficult to guess how it will play out, but in the short term (2022-2023) I expect World output will be lower than the shock model presented in the chart below.
Opec minors
Alexander Khurshudov: gas for rubles is a strong and unexpected move
March 24 / 06:45
Moscow. March 23, 2022 The dollar exchange rate fell below ₽95 at the moment as of 15:27 Moscow time, according to the Moscow Exchange data … The euro exchange rate at the moment fell to ₽110. The sharp strengthening of the ruble coincided with the announcement that Russian President Vladimir Putin ordered that gas payments be converted into rubles for unfriendly countries. At the same time, the president confirmed that Russia will continue to supply gas in accordance with the volumes fixed in the contracts concluded earlier.
The President also instructed the Bank of Russia to develop a mechanism for making payments in rubles within a week. He also asked the government to instruct Gazprom to amend existing contracts.
The message is commented by the expert of the Oil and Gas Information Agency Alexander Khurshudov:
We live in a tragic but interesting time. I’ll try to at least roughly estimate how events will develop in the next 3-4 weeks.
Option 1. The EU refuses to supply Russian gas. In this case, he will have to compensate for 155 billion m3 of our gas (such a volume was received in 2021), and for this he will strain all other suppliers in Norway, Algeria, Qatar, and the USA. According to many estimates, the maximum they can do is to increase supplies by 10%, which is 19 billion m3. The free volume of gas in UGS facilities at the beginning of March amounted to about 35 bcm. Even if you introduce the regime of the most severe economy, sleep in clothes and put stoves in some places, there will still not be enough gas. There is practically no chance of this option being implemented.
Option 2. European consumers go to the Moscow Exchange to buy rubles. A powerful influx of the euro is formed, the EUR/RUB rate is rapidly declining. I fully admit that it will drop to the level of 75-80 rubles / euro, and will pull the dollar along with it. But since gas prices in the EU are unlikely to fall (and so far they have risen to $1,200 per 1,000 m3), buying Russian gas for rubles will remain profitable, it will cost 25-30% below the spot price. Option is possible, but unlikely; EU authorities will not allow such a political defeat and forbid their companies to bow to Russia.
Option 3. The EU will not refuse supplies, but will not agree to pay in rubles either. He will file lawsuits in his courts, since they have always been on his side. This option is the most probable, it can be called “no peace, no war.” The calculation here is simple: as long as the legal proceedings drag on, either the khan will die, or the donkey will die, and during this time it is possible to tighten up the reserves. But this calculation is not justified. Maybe Gazprom will prove something in arbitrations, but Russia will soon make the next move. And it will again become unexpected and accurate.
I note that for the whole world Russia appears in this game in a noble white tailcoat. No, no, we are ready to continue supplying gas so that the population does not suffer. But you yourself put a paw on our gold reserves, made it difficult to use them. So pay in rubles.
Many years ago, my chess coach taught me an indisputable truth. It belongs to the Russian world champion Alexander Alekhine. To win the game, he said, you need to force the opponent to think for himself every move. Today our president made a strong and unexpected move, so let the Europeans think.
———
I was surprised by Putin’s decision to pay in rubles, because he always followed the rule to comply with agreements, I assumed that due to the freezing of Russian money in the West, he made such a decision. Let me remind you that the author of the note (Alexander Kh) posted texts on this site in early March , he wrote to me that some contracts stipulate the possibility of payment in rubles.
China settles natural gas contracts with Russia in Euro’s.
Think long and hard about it. It matters none in what currency Russia settles oil in. Certain parts of media have made a big deal about it. Who cares?
Just like it matters not if Russia and India settle trade in rupee. What is Russia going to buy with all the rupee they receive?
Even if Russia demanded physical gold as payment. Guess what physical gold is purchased with fiat currency. Sure gold may go to $100,000 but what will you transact in after everybody runs out of physical gold?
HHH.The fact is that Russia’s trade balance is positive, something about sales are close to $ 500 billion, and purchases of $ 350 billion take out the difference in the form of profits from Western companies and Russian business owners, let’s say so. Which I consider acceptable because citizens consume enough. Therefore, which I think is fair, because our country has great natural resources and sharing with others is good and fair. But the US government did not like this situation, I think so. Due to sanctions, I think consumption will decrease, and the balance will decrease, but I hope that there will be no hunger.
I think Russia oil production gets shut in as it backs up from the ports all the way to the wellhead. Last time they had to shut in it took them 32 years to get oil production back to anywhere close to where it was.
We probably going to get a moonshot in price over $200 due to this shut in that’s followed by a crash in price. That is most likely outcome. No black swan needed.
This likely plays out in April. As ships can’t get near the ports to get the oil out of Russia.
Insurance won’t cover ships that enter what is a war zone.
Actually has little to do with the sanctions and more to do with ships not being covered.
HHH , incorrect . The oil will flow . Russia exports about 5.5- 6 mbpd per day . 3.5 mbpd is via pipielines to EU . This is unhindered . This leaves 2-2.5 mbpd for sea shipment . Washington has already given the green signal to New Delhi to import all it wants . They have placed orders for 15 million barrels immediate supply which will be paid for in USD . In the meanwhile both governments are working on REVIVAL of the Rouble- Rupee agreement that existed before the collapse of FSU . So this oil is clean , will be shipped and have insurance . The second buyer is China . Does Washington have the b**** to act against a ship carrying Chinese oil ? I would really love to see the US Navy try rerouting an oil tanker destination Shanghai . The ports of loading for the oil are not on the Black Sea Coast . They are in the northern coast where there is no war . Their route to India or China does not fall in the war zone . The oil will flow .
Just for info . Nuland was in New Delhi threatening and then begging for India to follow the sanctions regime . She was sent packing . Following her was British trade delegation which had come with a prior appointment to work out a trade deal post “Brexit ” . They were also told to go back home empty handed . Why ? Wang Yi the Chinese foreign minister was coming and he was more important to deal with . Things are changing .
Yeah I was talking about the eastern oil fields and ports. Not the western ports and oil to Asia
Those fields have no infrastructure connecting. Eastern will be shut in as ship aren’t insured in the Black Sea ports.
Hole in head,
I tend to agree, there are many who don’t really care about the Ukrainian invasion, Russia will no doubt find buyers for their oil and may be able to find buyers for their gas as well, not sure they have the ability to store excess gas or if the have LNG trains to reduce the volume by a factor of 600 by liquifying the methane. Natural gas could be more of a problem.
Dennis , here is the latest on the NG supply via pipelines to Europe . Gazprom has booked space for Wednesday but nothing from Thursday on . From Friday the Rouble rule takes effect . Let us see what happens after 48 hours .
https://www.reuters.com/business/energy/russian-gas-flows-europe-remain-steady-2022-03-29/
Dennis , as to the NG storage as and when the Rouble rule takes effect . My personal opinion is that Putin will not go down to zero immediately . He will reduce supply step by step and get a concession with each step . Squeeze and grind slowly . A death by a thousand cuts would be more beneficial than “off the head ” . Just a thought .
Hole in head,
As warm weather approaches Europe may be able to get along with less natural gas, not sure how well Russia will do without the natural gas sales, I guess they can choke back wells and flare or vent natural gas if needed, I doubt that have liquification capacity or pipeline capacity to send the gas currently going to Europe elsewhere.
Dennis , Good Morning .As I write NG storage in EU is 29 % ( I am not including the 20% required as MOL to maintain pressure ) . This is EU , I don’t have info specifically on Germany . Germany already planning rationing and some stupidity . See my posts on the other thread . By the way Benelux is not so worried at this moment because we are getting our supplies from the Groningen gas fields up in the Netherlands (Holland) .
Hole in Head.There will be no problem with conventional gas wells.
Just change the fitting and you can reduce the flow rate.
High-rate watered wells should continue to work,
low-yield watered ones will apparently drown out forever.
Dennis , it is not about domestic heating . The problem is industrial usage of NG . I have posted that Germany has already issued an alert to rationing . Will they shut down energy intensive industries ? Already they are operating at 60 % capacity . Can they survive at 30% capacity ? They will collapse at that capacity utilisation . Then their are unintended consequences . Co2 is a bye product of the fertiliser industry . Shutdown a fertiliser plant then no Co2 . However Co2 is used to stun animals in the slaughterhouse .Then what will that mean ? No meat . Now add no fizzy drinks and the worst of all no beer 🙁 .
Usually in Europe 20th of March is the end of winter and the last 10 days have been pretty warm . However now the weather forecasts is that the for the first 10 days of April day time temps are going to be between 0-10 degree celsius .
Hole in head,
Up to Europe as to best course of action, long term Russia may lose a very good customer. Maybe they will find others, but they may need to either build LNG facilities or new pipelines.
Alexander,
Do you have access to the Russian Ministry of Energy website? If so, could you report March output for Russian C plus C when it is reported here. We no longer have access to that site.
Thanks.
Dennis, I think you are being a little presumptuous. If the site is shut down then no one has access to the site.
Ron,
Perhaps they blocked only the english language version of the site. I am not an expert on these matters.
The site: https://minenergo.gov.ru/en/activity/statistic is only in Russian. It just gets translated to English by the software.
Denis. Here’s what I could find:
http://government.ru/department/85/events/
https://minenergo.gov.ru/
On the social network:
https://vk.com/minenergo_rf?ysclid=l1dqxwvzrd
Official site without access
Thanks.
I am surprised it has been shut down. Not a good look for Russia.
I am thinking about applying for jobs in oil fields and am curious if I would be a competitive candidate for an entry level job. The wages are very appealing; as it stands I’m soon to be priced out of my city due to skyrocketing rents, so I need to figure something out.
I currently do road cleanup for a city government. Before that I did construction. Before that my resume is pretty scattered between restaurants, grocery stores, and temp jobs in warehouses, factories, etc. I have a BA in History, for all the good that’s done me. I’m in my mid twenties and in good physical shape, have no issue doing heavy work for long hours. I have my own steel toed boots. I do not have a CDL, unfortunately, though I’d be happy to get one if I could afford it. I’m willing to relocate across country, of course.
Would an operator hire someone like me? Or is this an industry where you need to know someone to get in?
Where do you want to live?
A CDL would be a big help if you want to drive a truck.
If you have a driver’s license and can pass a drug test you will absolutely find a job.
If you want a long term career where you are less likely to get laid off in the next bust, learn how to pump wells. This is where you (in simple layman’s terms) check the wells and tank batteries on a daily basis, apply chemical treatments to them, and do minor repairs. If you don’t mind doing the same thing every day, like working outside and like being alone a lot, this is the job for you.
I know several experienced pumpers who make six figures. Rig counts, frac spreads etc go up and down like a yo-yo, but those 1 million plus wells nodding up and down in the US will always need someone to take care of them.
There are several community colleges that offer courses on how to do the pumper job. There are also some publications that have a lot of good information.
Good luck!
Shallow sand,
Could someone wanting to go into the pumping business get a job working for an experienced pumper in your region in order to learn the ropes? I would think someone in their twenties could get a job working for a 50 or 60 year old owner and maybe take over their client list when the owner retires, maybe even buy the equipment. Shoot me an e-mail if you are interested in connecting this person with someone you may know.
Hey, thanks for the reply.
I’m not too picky about where I live in the short term–I was looking at jobs in North Dakota yesterday, and that’s pretty remote. Long term, I would much rather be somewhere warmer, like Texas. I’m from Georgia, so I can take extreme heat. Extreme cold, I’m not as happy with.
Working as a pumper honestly sounds perfect. I work solo right now actually, so I have no problem with that. Would be nice to learn something more technical like what you’re talking about. I’ll definitely have to look into community college courses then. Thanks for the tip!
CJS,
Go for it.
Today.
As long as you are not doing drugs, are willing to work long and hard, the opportunitues are sky high.
North Dakota has had a several thousand count for job openings for quite awhile. Checking online the state economic office may offer some preliminary perspective.
If you take the plunge, strongly suggest you …
Take any job offered, anytime.
Cross train with different skillsets. (Mechanical aptitude – aka guys that can fix things – are always in demand).
Save. Some. Of your paycheck – every single payday – for the inevitable rainy days.
The Great Crew Change has already started.
Industrious, high integrity younger people have a bright future ahead in this industry … just be prepared to start at the bottom and work long and hard.
Good luck.
Thanks! Yeah North Dakota definitely looks like the place with a bunch of openings, and at decent pay rates too. I can see why, what with the winters up there, but I figure I can take it for a year or two and then move somewhere more hospitable once I have some experience.
CJS,
If you don’t want to move, there are no doubt a lot of opportunities in West Texas, probably a little warmer, perhaps too warm in the summer.
Maybe check out
https://www.oilystuffblog.com/
You will find more oil men there who might have some advice.
Thanks Dennis!
CJS,
Mike Shellman has been in the oil business for 50 years and is a real straight shooter, not sure how long Shallow Sand has been in the business (maybe 30 years?) and is also great.
Oily Stuff is Mike Shellman’s blog, lots of oil industry pros comment there and may have more tips besides the excellent advice from shallow sand.
Thanks, Dennis, for wanting to help this young man.
Cee, unless you want to freeze your Georgia ass off, don’t go to North Dakota. It sucks up there. West Texas is hot, and windy but you can handle that. Affordable living is difficult out there, but doable; it has to be researched carefully. Folks are Georgia friendly in W. Texas…all over Texas; the Haynesville (gas) in East Texas and Louisiana is busy and they have tall trees there. There are no trees in West Texas.
Say yes sir, and no m’am; get tough, and work happy. Work….grateful. Learn to speak Spanish as fast as you can. Be patient, you’ll have to start below worm level and work your way up. Always, always listen to people above you; that’s how you learn. Don’t ever be disrespectful to authority. Don’t trust anybody not to hurt you; shit happens in the oilfield, avoid stupid at all costs.
H&P has a good entry level program for drilling rig floor hands; they will even send you to school and buy you books. Ultimately, however, you want to move away from drilling and completion work and into the production side of things. D&C is unstable work and those hands are always the first to get sent to the barn when things get slow. Large scale D&C work is not long for the Permian anyway.
You’ll always work on the production side. Well intervention (workovers) and lease operations (gaugers/pumpers) are always in demand. As are vacuum truck (water) drivers. That’s pretty low on the food chain but hell, you can make $90K a year hauling water while you wiggle your way into the production side. You have to be smart, mechanically inclined, know how to fix ANYTHING… and have big nuts. Don’t worry about saving money, you’ll work so hard you won’t have time to spend money.
If hard-ass manual labor scares you, axe the oil and gas thing completely and seek more comfortable, soft surroundings. Like California. As a last resort you can always learn to be a politician; they don’t ever do shit. Hell, if you don’t have a criminal record, you could have become a Texas Railroad Commissioner a few months ago. Anybody can be a TRRC Commissioner.
Good luck, man. You can do it. I’m pulling for you!
Mike gives very good advice and he knows what he is talking about.
Due to shale, a lot of times people think of just Texas and North Dakota as far as oil producing states.
No offense to either state, but if you go to a shale area, the cost of living could be very high.
However, there are many states that have oil and gas production.
I’m partial to stripper oil wells because that’s what we have. They tend to be easier to manage, and can produce oil for decades. We are producing many wells drilled over 100 years ago, and except for wells we drilled 2005-14, even our newer wells are 40 +/- years old.
Take a look at the EIA monthly field production data. There you can see how much oil each state produces each month.
You might be surprised. You can live in the South, Southwest, Midwest, Great Plains, Rockies and/or California.
Again, over 1 million wells need some to take care of them, and the workforce isn’t getting any younger.
Thank you Mr. Shellman.
Shallow sand,
I was thinking you might know of someone in your area that might be looking for a 25 year old willing to work hard with a college degree, I think it is a bit warmer in your area than N. Dakota, but not as warm as Texas. Cost of living might also be better.
Mike Shellman,
If you are interested in offering more private advice to CJS, just shoot me an email.
Hi Mike, I hope you’re able to see this post, I could not figure out how to reply directly to your comment.
I think you’re right that I’d better avoid North Dakota if I can! Below freezing temperatures don’t much agree with me, I have to say. Texas certainly seems like a solid option. And I do still remember a little spanish from college; I’ve actually been practicing it a little recently, translating between my boss and the mexican laborers the city hires for landscaping.
Your point on drilling being unstable is well-taken; production definitely sounds like the smart move. Truck driving is also appealing; I’ve thought before about joining a “CDL school” trucking company. The only thing holding me back is the over-the-road lifestyle. But driving a water truck local sounds like a solid gig.
Thanks for the advice!
10 year is at 2.51% and the 3’s,10’s the 5’s,10’s the 7’s,10’s and 20’s,30’s are all inverted.
When stocks break and they will break. Long end comes crashing down. And curve gets a whole lot more inverted.
Oil has a small window to go higher on an even greater supply shock coming out of Russia.
HHH , what is with the junk bonds ? Still alive ? It seems market still has the ” risk off ” button pressed . The spread hasn’t gone haywire as I expected . These should have been the first to explode (implode ) .
A Bear Market bounce like the one we are experiencing will do the trick. Risk off? Tech & Discretionary just rallied 10%. And don’t even talk about energy. I’m pretty sure HHH mentioned that it would take a while for the rate hikes, and slowing economy (relative YoY!), to sink in and it looks like he has called it perfectly. The market is choppy = Volatility in the 20s. Look for that to spike soon and catch a lot of people off guard (e.g. Bitcoin the ultimate risk on asset is up 20% in the past month). Oil is going up along with equities for now, but once the reality of the economics is priced in to the market, oil will almost certainly (HHH I believe also said) super spike up and then crash down again, along with equities, and take high yield with it.
Well remember a lot of these high yield bonds or corporate bonds have been used to do corporate stock buybacks.
When stocks roll over and head south due to yield curve inversion. The same corporates will be under water or upside down from where they borrowed via bonds and bought stocks in at. Think forced selling in stock market.
Conventional wisdom says FED would be back in market already lowering interest rates and doing QE. But if inflation is still hot which it will be. FED doesn’t have political cover to step in.
I’m thinking another 2008 is dead ahead and once prices and inflation are back down much lower FED will have the cover they need.
And I think it’s also likely that pension funds pullback from the corporate debt markets until such a time comes where FED has political cover to step back in.
I’d also argue from a global standpoint the Eurodollar curve matters more. It’s based on 3 month Libor. When it’s inverted basically the banks that do all the global dollar funding are saying hey we don’t really like what we see in the future.
We have already a supply shock.
Google “Diesel rationing” – it’s coming to more and more countries. There always a bigger supply shock can come.
And what about Natural gas ? The EIA seems to be much more optimistic on NG than on oil. (for the US I mean)
And by the way on natural gas, is it normal that the last month on below file is December 21, this is the normal delay for publishing these figures ?
https://www.eia.gov/dnav/ng/ng_sum_lsum_dcu_nus_m.htm
Yves,
Yes there is typically a 3 month delay, the numbers come out at the beginning of the month of April for Jan 2022 output of crude and natural gas.
The AEO 2022 reference case for dry natural gas output is below. From 2010 to 2021 the average annual rate of increase of natural gas output in the US was about 1.2 TCF per year. The expectation from 2023 to 2050 for the reference case is about 0.24 TCF per year, about 5 times less than the recent past. TCF=trillion cubic feet
Dennis, thanks a lot for the info.
Regarding shale gas are the wells not as closely packed as for oil ?
Because for instance in the Permian, there are areas really packed with wells, such as for instance :
https://www.google.fr/maps/place/Odessa,+Texas,+%C3%89tats-Unis/@31.4074239,-102.3230187,7497m/data=!3m1!1e3!4m5!3m4!1s0x86fbc96a39137cf9:0x1625ab3454615f46!8m2!3d31.8456816!4d-102.3676431
But looking the Marcellus, I cannot see areas with so many wells.
Yves,
Although a bit of an overstatement, high pressure gas wells (Ohio Utica, for example) tend to be slightly more separated than their oil brethren, but this is a debatable, ongoing issue … optimal horizontal spacing between wells.
When you look at graphics depicting unconventional wells, one must be mindful that it is a 3 dimensional – not 2 – representation. All the parallel lines on Bakken maps show Middle Bench Bakken, Upper and Second bench Three Forks all on the same pad. (Third and Fourth bench Three Forks exist in a few spots also). The vertical distance might span 500/600 feet or so.
This holds true for the Permian with its various hydrocarbon formations stacked one upon the other.
The Marcellus is somewhat different primarily because the Mighty Marcellus is so prodigious, operators have targeted this horizon for about 90% of the existing wells … essentially a true 2 dimensional depiction is seen on Pennsylvania charts.
The few Upper Devonian and Utica wells are primarily – although not exclusively – found in Greene and Washington counties, PA.
Thanks for the info, yes, understand the different layers that the wells can aim at.
Regarding North Dakota, there are also these quite amazing pictures derived from precise wells data :
https://www.nytimes.com/interactive/2014/11/24/upshot/nd-oil-well-illustration.html
Oil literacy by Mike S . LTO is not a substitute for Russian Urals . Quality matters .
https://www.oilystuffblog.com/single-post/oil-literacy?postId=27b31517-7a06-499c-8d13-8cf8ec414dea&utm_campaign=d21ea3a4-3f01-4d2a-88cd-b6f6c0722ec3&utm_source=so&utm_medium=mail&utm_content=50c4e089-4a0e-49a7-adac-287538ebb7ed&cid=fa335351-37bb-44a6-9899-f8c34b4a0f81
100% credit to Mike S for this . The math is never wrong . Ship out LNG to Europe . USA ( United States of Amnesia ) . Gore Vidal was right .
This just in from a mate of mine in Australia very keen on LNG costs and shipping, and trying to compete with Russia in the LNG contest in Europe:
The supply chain is developing to be a war time alternative to Russian oil and gas. It is so obvious.
Here’s some math on the LNG contest between Russia and the US and their effort to supply EU with LNG.
A Q-Max tanker can carry about 266,000 cubic meters of LNG, equal to roughly 5.5 billion cubic feet of LNG.
A Q-Max tanker burns 40 gal of fuel for every mile. 3,000 miles across the Atlantic is 120,000 gal of fuel……there……and 120,000 gal back……empty. So 20 tankers would use 4.8 million gallons on the round trip.
Wikipedia list this for Nord Stream 1&2:
“The pipeline has two parallel lines, both with capacity of 27.5 billion m3 (970 billion cu ft) of natural gas per year.”
So the double pipeline of Nord Stream 1 would be 55 billion cubic meters.
55 billion/365 = 150.7 million cubic feet per day.
150.7 mcf/266,000 cm per ship = 566 ships per day.
566 ships / 24 hrs = 23 ships per hr.
Twenty ships will burn 4.8 million gallons of fuel there and back…….or Russia turns on the tap for an hour?
Not really a contest. The US strategy is a losing game and will never keep up. It could be used as an emergency effort only.
You’ve mixed up cubic metres of liquified gas with standard cubic metres of natural gas (at one atmosphere), and divided cubic feet by cubic metres. One Q-max tanker holds 5.7 standard cubic metres of gas, therefore it would need 170 per year to meet the Nord stream flow you gave (i.e. one every two days). Still a lot, but the regasification capacity is probably the ultimate limit.
George , I can’t answer this . I took this from the page of the real ” oilman ” Mijnheer , Meneer Mike S . Anyway does the difference between Metric and British discount the fact that that LNG from USA to Europe will save it from energy starvation .? Thanks for pointing out the anomaly . You sir are a gem .
P.S : Mike S doesn’t have to answer because as the post says this as ad verbatim from what he received from his associate in Australia . The Aussies are for quite sometime pretty confused . Tilt to China or AUKUS ? Just like is it male or female or X . When a society can’t find what is between those thighs I get highly skeptical to what is whirring in their head .
Hole in head,
I have read that some of the LNG boils off during transport and this is used as fuel to power the LNG tanker, so no diesel is needed to power the ship.
I wa not correct, they can use natural gas, but sometimes use fuel oil or diesel depending upon the relative price of the fuel. See
https://www.nasdaq.com/articles/off-the-boil:-lng-tankers-burn-more-oil-as-gas-prices-soar-2021-09-03
They can use the gaseous methane for fuel but they can also have BOG reliquefiers onboard to condense the BOG back to liquid. Depends on the ship.
Hi , LNGuy . Long time no see . Can you do us a favour ? I put up a post copy + paste from MIke S blog . Mr Kaplan pointed out an anomaly regarding the mixing of british and metric systems whereby the conclusion arrived at ( ships of LNG required per day ) was incorrect . If possible can you redo the maths so that we can have the correct figure ? Tks in advance .
HIH, it’s not 100% clear to me what you’re trying to calculate but I think the conversion factor you might be looking for is that 1 cubic meter of LNG is equal to about 20,000 cubic feet of gas. The ratio of liquid to gas is about 1:610.
Eta, I think you got that part right but somehow you jumped from m3 to ft3 in the pipeline calculation without doing the proper units conversion. Maybe that’s the issue.
George,
Thanks for the clarification.
HOW TO DESTROY THE EROI OF NATGAS… Make LNG
While I’d imagine the investor relations departments are showing the Positive ROI of LNG Processing Facilities as the best thing since sliced bread, the EROI of turning Natgas into LNG, shipping it, and then turning it back into NATGAS has to be AWFUL.
Regardless… now that US Under Secretary of State for Political Affairs Victoria Nuland believes the Nord Stream 2 gas pipeline project is currently “dead” and is unlikely to ever be “revived,” Germany will have to pay a higher price for its NatGas as LNG.
This is excellent news for everyone, except the German Industry and Economy.
steve
Steve , as per my earlier post . The Indian government told her to FO . Good riddance to bad rubbish .
Steve,
The EROEI is better than flaring the natural gas. Much of the gas being exported as LNG was previously being flared in the Permian basin, now there is pipeline capacity to move the gas and storage space may be limited.
Dennis,
Interesting assumption. However, according to the EIA’s statistics, the United States actually vented or flared more natural gas back in the 1940s-1950s than today, even though production was much less.
Even if we assume the LNG Industry is taking ALL OF THIS VENTED GAS today, it would represent a bit more than 1 billion cubic feet per day. The U.S. LNG Industry exported nearly 10 Bcf/day as LNG last year.
Thus, simple math suggests… IT’s NOT MUCH.
steve
Be aware that at least on one leg of the round trip that the LNG tanker will burn boil-off from the LNG tanks.
Steve,
Fast evolving topic.
US is currently exporting 14 Bcfd via LNG (additional ~ 6 Bfd via pipe), and will jump to about 15 1/2 Bcfd when the remaining trains at Calcasieu Pass come online in the next few months.
Looking ahead ~ 6 years, US LNG could easily double if the current impetus results in rapid FIDs for several pending projects.
COFFEE,
So, you say current U.S. LNG Exports have already reached 14 Bcf/d? That’s interesting that it has jumped that much in the past two months. According to the Dept. of Energy March 20022 LNG REPORT for Jan. U.S. LNG exports from Sabine Pass, Louisiana Cove Point, MarylandCorpus Christi, Texas Cameron, Louisiana Freeport, Texas Elba Island, Georgia, were 11.2 Bcf/d and the forecast is for 11.5 bcf/d for 2022.
Regardless… it will be interesting to see how U.S. Natgas production grows over the next two years, and how much of that growth will be consumed domestically.
steve
Steve,
He said total exports are 14 Bcf/d with about 8 Bcf/d of it being LNG. Or that is my reading (14 total minus 6 by pipeline is equal to 8 as LNG).
In 2021 US exported 18.2 Bcf/d of natural gas, but we also imported about 7.7 Bcf/d of natural gas. Net exports of natural gas were about 10.5 Bcf/d in 2021. Of this total in net exports of natural gas in 2021 about 9.7 Bcf/d was exported as LNG. The exports of natural gas by pipeline were about 8.5 Bcf/d in 2021 and imports of natural gas by pipeline were 7.6 Bcf/d, net exports of natural gas by pipeline were about 0.84 Bcf/d in 2021.
Currently there is about 11 Bcf/d of LNG capacity with another 2.7 Bcf/d under construction (with last completion date in 2025) and a further 21 Bcf/d approved but not yet under construction as of December 2021). If all of these are approved and remain online that is a total of 35 Bcf/d. For reference the US produced 93.56 Bcf/d of dry natural gas in 2021 and exported about 10.5 Bcf/d (net exports).
Steve/Dennis,
I needed to double check recent stats for accuracy sake.
As per EIA’s Natural Gas Weekly Update (Thursday AM release … incredibly data rich source of near Real Time info), Gulf Coast LNG feedgas was 11.7 Bcfd.
Add in Cove Point and Elba Island with about 1 Bcfd exports, and near 13 Bcfd US natgas is involved.
Note, feedgas includes onsite processing which can consume 10% to 15% of total feed.
On 2 days last week, total LNG plant supply hit 13.9 Bcfd.
The first 3 months of 2022, US LNG exports are averaging just over 11 Bcfd with expected slight increase as Calcasieu Pass trains incrementally come online.
Pipe exports to Mexico averaged almost 6 Bcfd in December, 2021, and hit almost 7 Bcfd in June.
So … total US gas exports are currently running about 17 Bcfd (11/6 split LNG/pipe), with an additional Bcfd used for onsite processing. (I have been unable to learn much more detail of the different operator’s precise production processes which have varying feedgas requirements for liquefaction).
FWIW, Golden Pass (19 mtpa capacity, and Energia Costa Azul (~ 3.2 mtpa) are already under construction with production expected in 2024.
Coffeeguyzz,
the weekly data is not very good, I only pay attention to the monthly data. For December 2021 LNG exports were about 11.14 Bcf/d. And yes there is more LNG capacity to come online in Sept 2022 and then 2023, 2024, and 2025 for projects that have started construction, other projects have been approved but construction had not started as of Dec 2021.
The world has plunged into a deep, enduring energy crisis that may threaten the economy for years to come
An insightful article.
Historically, when the oil burden on the global economy has reached five to six per cent of GDP for a sustained period, the cost becomes too great to bear and demand consequently falls. Demand will grow for at least another 10 years, yet supply cannot keep pace due to structural challenges, so the price of oil must act as a demand-destroying mechanism where consumer behaviours such as flying the family to Disneyland or renting an RV for a summer vacation becomes unaffordable to the masses.
Mike Rothman of Cornerstone Analytics Inc. believes this price level sits at around US$183 per barrel and, importantly, would need to remain at that level for a year to result in behavioural change. This price level compares to the inflation-adjusted all time high oil price of US$187. He also believes that the fair value for oil is US$114 given current inventory levels, meaning there is currently no political risk premium in the oil price. This is an important distinction to make as many could mistakenly believe that high oil prices are a result of political tensions rather than a structural bull market.
https://financialpost.com/commodities/energy/oil-gas/eric-nuttall-the-world-has-plunged-into-a-deep-enduring-energy-crisis-that-may-threaten-the-economy-for-years-to-come
“enduring energy crisis that may threaten the economy for years to come”
I think that is putting it lightly. The threat looks to last indefinitely.
Only severe recession will give the appearance of temporary easing of energy supply crunch.
Its hard for me to see how economies in stagflation will digest high energy costs and all the downhill affects.
I agree. It’s hard to see how this suddenly turns around when there is nothing that can physically do that, not green energy nor renewed FF investment. This is just the downslope rearing its ugly head for an energy descent, and no one has prepared the public for it at all.
It rather reminds me of the “inflation is transitory” rhetoric from the Fed last year and the current UK gov’t mantra that energy prices spiked only as we came out of the pandemic, so here’s an energy loan (but don’t call it a loan) to help you with the bills. The reason they don’t entertain the other notion that this is permanent is because they have no plan for that.
Kinda like Germany just assuming cheap gas would always be there to power their industry and step in for wind and solar.
Not much more will be coming out of the shale patch this year, according to this article:
https://oilprice.com/Energy/Energy-General/What-Is-Holding-US-Oil-Production-Back.html
“ We’re dealing with the same inflation and supply chain every other manufacturer is dealing with in the U.S. You’re seeing double-digit inflation rates across a range of commodities and categories, including land, trucking and chemicals imported from Europe. All those supply chain issues are impacting our ability,” ConocoPhillips Ryan Lance told CNBC earlier this month
Stephen,
Thanks. From that same piece that you linked.
A recent survey by the Dallas Fed has found that Big Oil intends to grow its median crude production by a mere 6% Y/Y while smaller firms aim to expand theirs by 15%.
Note that “Big Oil” is about 75% of output of tight oil in the Permian (using top 15 producers as a proxy for “Big oil”) and this would suggest only an 8.3% annual increase in Permian basin output. Note however that Permian output increased by about 14.9% from Jan 2021 to Jan 2022 with average WTI oil prices at about $68/bo in 2021 and the most recent 4 week average at about $103/bo.
So oil prices rise by 51%, but inflation running at 8% is impacting the ability to expand output?
I am not buying it, I think some of this is posturing to keep investors happy. Sometimes stockholders know less than the CEO and should not be listened to, a smart CEO knows this and may say one thing, but do something else.
That inflation figure is not giving the real picture. Look at the steel market. 8% is not even scratching the surface.
Required,
Steel prices have increased a lot (about 35% for steel tubing), but that is a small part of total D C costs. Have overall costs risen by 51% in the past year? I am skeptical. Link below has PPI for steel tubing.
https://fred.stlouisfed.org/series/WPU10170674
Ovi,
I agree the article is good.
There are some predictions of $250/bo out there, but my guess is that they are taking about a short term spike in oil prices. I doubt that we will see an average annual oil price rising to $183/bo in 2021 $, note that the high oil price scenario for the EIA’s AEO 2022 has annual Brent crude oil price remaining less than $160/bo through 2045.
Do you expect we will see $183/bo in 2021$ for Brent average annual price in the next 10 years? I believe such a scenario is highly unlikely (maybe 1 in 50).
I think that there will be some demand destruction at $130 to $150 per barrel and an an acceleration of EV and plugin hybrid sales that will substitute electricity (mostly produced by coal and natural gas along with nuclear, hydro, wind, and solar) for oil in land transport (the largest user of oil resources). Russian output may not be curtailed very much as I imagine China, India, Africa, and South America may all be willing to use the Russian supply that no longer finds its way to Europe, North America, Australia, Japan, and Korea.
The long term impact on Russian output may be smaller than many imagine, though sanctions might reduce resource development to some extent.
Dennis
There is a lot of hyperbole out there these days. I don’t expect to see $183 oil this year. As you indicate, I agree that starting at $125, demand destruction starts to kick in more seriously. I think that the current $110 level is already starting to reduce demand.
As for $150 and above oil, I can see that in a few years. We need to have OPEC plus out of their reduced production mode to get a better idea of their real capacity. If that were to happen by this fall and oil stayed in the $100 range, that would allow for a demand increase and begin to stress the OPEC + capacity limits. If it became apparent to the world that OPEC plus was at capacity, then prices would begin to rise till supply and demand came into balance. The $140 to $150 range, I believe is where it would settle out. Beyond that, I think the world heads into a depression.
Ovi,
Sounds pretty reasonable. The only thing I might disagree with is that recession occurs at $150/bo, I think the estimate of $180/bo in 2021$ is roughly the level that will lead to a recession and it is not clear that level will be reached and sustained as demand may grow more slowly as the World fleet of EVs and plugin hybrids increases. Many are skeptical that this will have an effect on oil demand, I think it will become apparent by 2030 to 2035 that oil demand is growing very slowly or perhaps decreasing due to high oil prices and the substitution of electricity for oil in transport.
A good read . Comments also .
https://wolfstreet.com/2022/03/28/us-natural-gas-production-and-lng-exports-amid-urgent-demand-for-lng-from-europe-wheres-it-going-to-come-from/
To further this natgas/LNG topic, Energy Transfer just announced a ~ 3 mtpa supply agreement with China’s largest private natgas supplier. This buttresses an anticipated FID for ET’s ~16 mtpa project in Lake Charles.
The Mexican west coast LNG project in Puerto Libertad is considering doubling its capacity to a massive ~28 mtpa.
Events are unfolding so rapidly as to be dizzying when contemplating what the future may bring.
https://www.nsenergybusiness.com/projects/mpl-lng-project-puerto-libertad/
Cuts the Panama Canal out of the shipping route for Permian nat gas.
Hickory,
” … shipping route for Permian nat gas”.
Actually, that (somewhat dated) linked article mentions potential sourcing from the San Juan as well as the Permian basins. It does not identify the Piceance – specifically the Mancos B – as a ready source for tens of trillions of cubic feet of natty supply. With 4,000 feet of payzone, the Mancos B could rival NEPA in profitability if a ready market were available.
West coast Mexico may provide that.
This topic of additional “shale” formations (virtually no one speaks about the Mancos B) is one of the bigger ‘blind spots’ commonly found in online discussions of future hydrocarbon production/consumption.
Encino just announced a big push in oil development in their vast Ohio Utica holdings.
Should that company continue the nascent work of others in experimenting with oil recovery of the shallower Clinton Sandstone (half of Ohio is sitting atop a small ocean of shallow, unrecoverable oil), and find some degree of success, significantly more liquid hydrocarbons may become economically available.
Years ago, many of we optimists (realists?) regarding shale production were derided as ‘Cornicopions’ and the like. Simply being familiar with what is there (underground) and applying the economic and entrepreneurial components of human behavior leads one to the inescabable conclusion that hydrocarbon scarcity is not an insurmountable aspect in our lives.
Thanks for the info.
SanJuan Basin is NW New Mexico, and Piceane is W. Colorado
for those like me who are unfamiliar.
Wonder if the pipelines are in place to handle the volume?
Hickory,
South of the border, there is significant capacity.
As the Mexican government seems to be working with their government own national utilities, (pipeline/gas/electric) southern pipeline resources should be adequate. (Big push underway to transition Mexican power plants to use gas rather than oil).
There have been pipes out of the Piceance for decades.
If expanded capacity is needed, additional/more powerful compressors could be added as well as bigger pipe.
The marketability of west coast LNG will be amongst the most optimal on the planet.
I was thinking about rubles for oil. Let’s walk through this. Does Russia really want a strong currency? Does it benefit Russia to have a stronger currency? No it doesn’t.
Russia’s economy is utterly dependent on being able to export energy and commodities.
Knock on effect it wouldn’t be just the EUR/RUB that moved.
China would be biggest loser with such a move. The Euro’s China gets from trade would be worth way less. Very same Euro’s China uses to buy gas from Russia. But not only that. The ruble would gain on the yuan. Makes trade between China and Russia more expensive no matter how you look at it.
Lowest OECD inventory ever .
Hole in head,
I have data for OECD inventories for the 4th quarter of 2013 when the level was 2589 Mb, based on EIA data OECD inventories were at 2545 million barrels at the end of 2013,
https://www.eia.gov/opendata/qb.php?sdid=STEO.PASC_OECD_T3.A
Also found an old IEA report link below
https://iea.blob.core.windows.net/assets/c8c659da-ec0f-43ae-b4ef-a9105ad238d6/OMR_2001.pdf
On page 48 of the PDF it shows OECD industry stocks at 2446 Mb at the end of 2000Q1. In terms of days of forward supply that was 52 days for the industry stocks. At the end of January 2022 OECD industry stocks were at 2621 Mb and this covers 57.2 days of forward supply. It is the lowest stock level since April 2014 according to the IEA.
https://www.iea.org/reports/oil-market-report-march-2022?mode=overview
According to the EIA’s Monthly Energy Review US production has pretty much held steady for the last five months. I wonder how much the latest Putin’s War high prices will change things.
The data below is through February and is in thousand barrels per day.
The U.S is producing more than S.A. Does anyone know how much Russia is producing ?
Iron Mike,
In February Russia produced 11.06 Mbpd of C plus C, I have not seen March data yet, it may come out in early April.
https://www.investing.com/news/commodities-news/russias-feb-oil-output-rises-trading-paralysed-by-sanctions-2775797
No one knows. And I doubt we will get any accurate data out of Russia for a while. The Russian Oil Minister’s site has been shut down.
No One Really Knows What’s Next For Russian Oil
Self-sanctioning amid a global backlash against Russia has left analysts dividend in their forecasts for the future of Russian oil.
OPEC+ and the U.S. Energy Information Administration are the most bullish on Russian crude outlook.
The IEA and Standard Chartered are less optimistic, however.
It’s exactly one month since Russia invaded Ukraine, and the oil markets remain as volatile as ever with little clarity as to how direct and self-sanctions will impact Russian crude output as well as global oil demand.
Ron,
I imagine Alexander O has access to the Energy Minister’s site in Russia, also this is often reported on at news outlets.
Dennis, the Energy Minister’s site is down and news outlet’s in the west have no idea what is happening in Russia. Of course news outlets can guess, and I hope they will.
See my post below on Russian oil tankers.
“Until now, Europe got Russian gas and paid by changing a number in a computer. But now Russia wants Russian rubles for Russian gas. Where can you get rubles?
– by selling something to Russia, and getting paid in rubles.
– at the Russian national bank. You give one gram of gold, and get 5000 rubles in return.
So all Europe has to do is send 7 tons of gold to Moscow. Each day.”
We will see how this works out—
There must be a solution for Europe?
Hello. Somewhere I came across an explanation of how it will be: dollars are transferred to Gazprom Bank, they are converted there (commissions at the expense of the bank) and the contract is paid. That is, almost nothing has changed.
My guess: perhaps behind the scenes, due to concessions or threats, they agreed. Of course, this is conspiracy theory ….
I’m just a historian, who comes here to gain info from you energy experts.
Alexander . Watcher has a good post . This is also good . Win Win for Putin .
https://mishtalk.com/economics/via-clever-tactics-putin-gets-his-way-on-rubles-for-energy-demand
“This is also good . Win Win for Putin .”
Cheer-leading for Authoritarianism.
Typical.
Another large release from SPR rumored to be on the way. Oil drops $4 on this rumor.
The status of SPR after 50 million release and then there is the follow up with with 30 million in March.
https://www.energy.gov/fecm/articles/summary-50-million-barrel-release-strategic-petroleum-reserve
https://www.energy.gov/fecm/articles/us-department-energy-announces-contract-awards-crude-oil-sales-strategic-petroleum
I thought these were to be saved for emergencies and not to reduce the price at the pump.
It’s a completely reasonable course of action since the SPR was intended to be used in the event of artificial shortages and/or too high gas prices. Consumers need relief at the pump and it makes more sense to do this rather than suspend gas taxes.
Essential pig . Incorrect . SPR is not to be used for price suppression and least of all for the reasons you have given . There is no artificial shortage . All producers are drilling full capacity and all the oil is sold out , even Russia’s . However nothing can be done if the shortage is from a natural cause also called ” peak oil ” .
SPR is to be used only for exceptional circumstances viz war , supply disruption (OPEC ban in the 70’s) , natural disasters ( Katrina and the shutdown of the oil complex in St. Louis) are a few examples . Consumers need relief .?? Then how about relief from high food prices , healthcare and the list goes on , In Europe we are paying minimum Euro 8.25-8.50 per gallon of diesel .
How does enabling consumption resolve this issue? You have a commodity in short supply, do you:
a) make it easier for people to carry on using it at present rates.
b) use price signals to force considered usage of a valuable and finite resource.
This is rather like the obsession with EVs this place has. In a world that has glorified personal mobility to the detriment of all else from social cohesion of urban areas (Twitter going crazy because Americans consider a 20 minute walk to be a hike. Bring a water bottle) to the decimation of the ecosphere (EVs are green because they don’t use petrol. They just use everything else a car uses. And also oil), it’s very American to “solve” peak oil by making everyone invest in yet more mining to carry on happy motoring.
Because, of course, lithium, copper, cobalt, and rare earth prices haven’t gone up oodles lately either.
Some charts on the Permian from ” The OIlystuff ” .
https://www.oilystuffblog.com/chart-stuff
‘Asian Peak Oil Update’
courtesy of Matt from down under
– March 30, 2022
http://crudeoilpeak.info/asia-peak-oil-update-nov-2021
White House mulls the largest ever release of the Strategic Petroleum Reserve, perhaps as much as 180 million barrels over six months (~1 million b/d) in an effort to fight the disruption created by sanctions on Russia
https://www.bloomberg.com/news/articles/2022-03-31/biden-team-weighs-a-massive-release-of-oil-to-combat-inflation
Sounds like a dumb idea. That is like a 3rd of what is left. And all for short term political gain. What is the plan after that?
HHH,
Maybe they can refill the SPR with LTO rather than exporting it? Not sure how well the tight oil does in storage.
Dennis , why not fill the tanks with water and say this is oil .? 45 API s not a substitute for 25 API . As a matter of fact somebody here did say that they are now counting oil tainted brine as oil , don’t remember who .
Hole in head,
45 API oil works just fine in some refineries. US Gulf Coast refineries are set up for heavier oil and there is a lot of that in the World, they could also be filled with Canadian oil. There are lots of markets that are happy to use the US tight oil. Plenty of European refineries can use it.
In Jan 2022, 26 nations imported 3.35 Mb/d combined of US C plus C, nearly all of this was tight oil, they seem to be finding a use for it. This includes India, China, Canada, UK, Brazil, Denmark, France, Spain, Italy, Portugal, Norway, Sweden, Switzerland, Germany, Ireland, Korea, Norway, and the Netherlands.
See
https://www.eia.gov/dnav/pet/pet_move_expc_a_EPC0_EEX_mbblpd_m.htm
Dennis , when did I say it is useless ? It is good for blending or used as a feedstock in US refineries but only to a certain extent . If it is the same as 25 API then why import ? Just substitute the 25 API with 45 API . As to exporting 3.35 mbpd to 26 countries , works out to 128,000 barrels per country . What an achievement . Sometimes your defence of an
incorrect statement or assessment dazzles me .
Hole in head,
As I said the US refineries were designed at a time when the World oil supply had become very heavy, only about 5 Mb/d of tight oil can be handled by existing US refineries.
In 2018 Russia exported about 5 Mb/d of crude plus consensate see
https://www.eia.gov/international/data/world/petroleum-and-other-liquids/annual-crude-and-lease-condensate-exports
US exported 3.2 Mb/d of tight oil in 2020 and imported 7.9 Mb/d of crude plus condensate, net imports of crude were about 4.7 Mb/d.
You did not say tight oil was useless, but suggesting it is no better than water or oil stained brine, suggests as much. There was a time when lighter oil command a premium on the World oil market because it is cheaper to refine.
For example the Tapis blend
https://corporate.exxonmobil.com/crude-oils/crude-trading/tapis
for price differentials see
https://enredada.org/tapis-crude-oil-price/26393/
That is expensive oil stained brine.
Dennis , I know about Tapis . “As of 2018, production is approximately 300,000 barrels per day ” . Yes , when the world was producing 90 mbpd . 0.03% of the world’s production is your benchmark . Further the differential was when ‘” Gasoline was king ” . Now ” Diesel is king ” . An excerpt from a post by Eulen “Google “Diesel rationing” – it’s coming to more and more countries. There always a bigger supply shock can come. ” Not all oil is same . Thai food is not cooked in olive oil .
Not all rice is same . Indian and Pakistani Basmati rice fetches a price much higher than the long grain rice . Quality matters . Anyway I will discontinue this exchange further , just not worth it .
Hole in head,
Most oil produced in the World is heavy oil, about 7.7 Mb/d is tight oil, the other 72 Mb/d is primarily medium to heavy grades of oil, there will be plenty of diesel.
D Coyne
You say that… and yet diesel rationing is now being talked about, so I’m not quite sure that’s the reality of the situation.
Kleiber,
The diesel rationing may mostly be due to a shortage of oil and perhaps fewer diesel imports from Russia.
Russian oil tankers are vanishing off the map
New York (CNN Business)Russia’s invasion of Ukraine made the country a pariah in the global energy market. Since the war started, a de facto embargo on Russian oil has emerged, with oil companies, trading houses, shippers and banks backing away, all at the same time.
Now, however, there are signs that Russian energy is drawing interest from potential buyers, at least in the shadows.
As the war in Ukraine drags on, Russian tankers carrying crude oil and petroleum products are increasingly disappearing from tracking systems.
So-called dark activity, where ships’ transponders are turned off for hours at a time, has in the past been viewed by US officials as a deceptive shipping practice that is often used to evade sanctions.
Dark activity among Russian-affiliated crude oil tankers is up by 600% compared with before the war began, predictive intelligence company Windward, told CNN.
“We’re seeing a spike in Russian tankers turning off transmissions deliberately to circumvent sanctions,” Windward CEO Ami Daniel said in an interview. “The Russian fleet is starting to hide its whereabouts and its exports.”
And this is not just happening with crude oil. Similar trends are playing out with other petroleum products, too.
There is more to this article. But the point is no one knows how much oil Russia is producing or selling. Russia wants to keep it quiet while they sell their oil undercover. That is why they shut down the Minister of Energy’s website.
The next segment in this article is bolded and titled: ‘These vessels want to disappear’
Ron . From day 1 I have said the oil will flow . Sanctions don’t work . The rouble is back to pre war level . Lesson from this is ” You can’t sanction your dealer ” 🙂 . Putin has now signed the decree that NG must be paid for in roubles . He is serious .
Again how does a stronger currency help Russia? They are utterly dependent on exports. If ruble goes up against Euro and the dollar it also goes up against Chinese yuan and India rupee.
That is how FX works. Everything coming out of Russia becomes more expensive to everybody.
HHH , our views diverge . I am now looking at things from the POV of ” Limits To Growth ” . The world will pay as( high or low) long as it can and when it will become unaffordable it will stop . There are now limited raw materials left . Next stage will be ” unobtanium ” at any price . What is the price of a can of beans that is not on the shelf ?
Ruble becomes best-performing currency in March; soars to 83 to the dollar
https://www.business-standard.com/article/international/ruble-becomes-best-performing-currency-in-march-soars-to-83-to-the-dollar-122032901631_1.html
Hint:
Fertilizers are likely the next commodity to be sold to “unfriendly countries” only for rubles.
US update Late Friday night
January down 216 kb/d.
Ovi . Thanks . My guess , the good quality DUC’s are over . From here on the deluge . You and many had indicated that June/July would be when the decline would begun . Seems like it was an overestimation but not your fault . The shale guys lie thru their teeth . Truth like cream always rises to the top .
HIH
I have a different explanation for the drop. Speculative. Still you could be right. We will know better by Summer.
Hole in head,
tight oil production is up.
Thanks Ovi,
When considering L48 excluding GOM minus tight oil (aka conventional C plus C L48 onshore output) we get the chart below. The sharp drops in early 2020 and Feb 2021 are explained by the pandemic shutdown and severe winter storm in Texas. Was there some event in January I missed?
In Feb 2021 US L48 excluding GOM minus tight oil output fell by 227 kb/d and in Jan 2022 it fell by 251 kb/d, US C plus C output fell by 216 kb/d in Jan 2022.
Noticed mistake on chart title, should say Conventional.
Dennis
I have a magnified version of your chart, starting in January 2018 in tomorrow’s post. It looks the same but the production drops you mention are different than what I show.
Are you using the latest actual EIA production numbers up to January. I am using the March STEO numbers.
Ovi,
I am using psm for all c plus c and official tight oil estimate for tight oil. I subtract GOM, Alaska, and tight oil from US total.
STEO numbers are less accurate so they are not used at all in my estimate which ends at Jan 2022.
Are you using DPR for tight oil, remember that includes conventional from the region. Also I try to use data rather than models where possible. Official estimate is based on data DPR is model based.
I used 2000 to 2022 to show how unusual this drop in Jan 2022 seems to be.
I expect we will see revised estimates in the future.
Ovi,
Spreadsheet at link below with data for chart on Conventional L48 C plus C excluding GOM
https://peakoilbarrel.com/wp-content/uploads/2022/04/US-conventioal-L48OS.ods
Also the STEO uses Monthly Energy review data rather than PSM data.
The tight oil data in my chart comes from link below (links to spreadsheet)
https://www.eia.gov/energyexplained/oil-and-petroleum-products/data/US-tight-oil-production.xlsx
The US, Alaska, and GOM data is from PSM data at link below
https://www.eia.gov/dnav/pet/pet_crd_crpdn_adc_mbblpd_m.htm
Dennis
I use all of the same data that you used and my numbers are identical up to November. As I noted in my reply, the only difference is in December and January where I use the STEO numbers and don’t update them to the latest numbers. Also I project ahead one month to February. The STEO data is up to date with the EIA numbers except for one month. The April STEO will incorporate the latest numbers.
I have emailed you back your spreadsheet with my numbers added.
Ovi,
Why use the STEO data when you can use the Petroleum Supply Monthly data directly?
In my view the PSM data is most accurate of the various EIA data sets. Only use the STEO data for Feb for a better chart. The STEO does not reflect the latest revisions in the PSM so December and January are different because we used different data sets.
Note that your assumption that the PSM is based on the STEO is not correct, the PSM is based on the 914 survey and the methodology is completely separate from the STEO. The STEO takes the data from last month’s 914 through December 2021, but that number has now been revised in the most recent 914.
Basically the STEO is only up to date through November 2021, the December 2021 and January 2021 data may be incorrect.
Dennis
The conventional oil drop is reported in the EIA outlooks part of the post, so I stick with the outlooks data. Also the STEO data is used to project ahead by one month.
It is important to state the source of the data and that is done in the post.
Dennis wrote: In my view the PSM data is the most accurate of the various EIA data sets.
I agree, it is by far the most accurate of them all and I have been following them all for over 15 years now. And it is always the least revised. The Monthly Energy Review is always revised to match exactly what the Petroleum Supply Monthly states.
Ovi,
I agree it is good to state the source of the data, next month’s STEO will use the PSM Jan 2022 data, so I would suggest getting a jump on that by using it today, as to February 2022, both the STEO estimate and the most recent tight oil estimate will likely be revised, so that data point (Feb 2022) is less useful imo.
The point of my chart was simply to point out that either the tight oil estimate is too high for Jan 2022 or the estimate for all US output may be too low as the drop ij conventional oil output suggested if both were correct does not match with what we know. Conventional C plus C output from lower 48 excluding GOM did not drop by 251 kb/d (from 1782 kb/d in December 2021 to 1531 kb/d in Jan 2022), something is amiss with the EIA estimates for December 2021 and Jan 2022. It might be that small producers have produced more than the EIA has estimated, or that mergers have messed up the data reported to the EIA by Enverus (formerly Drilling Info).
To get an idea how unusual the drop in L48 inshore conventional crude in Jan 2022 is historically, I show the month over month percentage changein in output from Jan 2000 to Jan 2022 in chart below.
There are only 3 months where the monthly change is lower than -10% (more negative), May 2020 (-17%) due to oil prices falling to less than zero in April 2020, Feb 2021(-13%) when a severe winter storm in the Southwest caused freezeoffs in Natural gas and oil production which lead to large electricity outages, and Jan 2021 (-14%). The February 2021 episode was widely reported in national news, was there a severe weather event in Jan 2021 that I did not hear about? It seemed like a pretty normal winter, perhaps milder than usual in the northeast with lots of rain and warm weather episodes in the Northeast.
Ovi,
Chart more similar to yours below, difference is using PSM data through Jan 2021 and my chart ends one month earlier (Jan 2022 rather than Feb 2022).
I do not have a good explanation for the severe drop in Jan 2022, unlike April/May 2020 (pandemic) and Feb 2021 (severe winter storm in southeast). My guess is that tight oil output will be revised lower and US output will be revised higher in the future and that the real drop in conventional is not 14% per month as suggested by the most recent data.
Perhaps an oil man might be able to offer more insight as to whether the 14% monthly drop reflects reality for conventional oil output in Jan 2022 relative to December 2021.
Ovi,
Yeah…. I just looked at the EIA MAR 31st Monthly Petroleum Supply. Something seems amiss here as the Monthly updates continue to decline while the Weekly Supply Data shows an average of 11,625 kb/d for Jan 2022.
Steve
Steve
My understanding is that the PSM numbers are estimates based on the STEO report. In the report that will be posted tomorrow night I speculate that the drop is related to unseasonal winter weather in Texas and NM in December and January.
Ovi,
No the PSM is not based on STEO, that is incorrect. It is based on the EIA-914 Monthly Crude Oil and Lease Condensate, and Natural Gas Production Report, for methodology see
https://www.eia.gov/petroleum/production/pdf/eia914methodology.pdf
The report is at link below
https://www.eia.gov/petroleum/production/
The data revision policy is at link below
https://www.eia.gov/petroleum/production/pdf/eia914revisionpolicy.pdf
Basically the PSM is based on a survey of large oil and natural gas producers that make up at least 85% of production in the larger producing states, typically coverage is about 90% or more. The rest of the output is a statistical estimate where they assume the other 10% or 15% of production will change in a similar way as the large producers. The current problem may be that large producers are holding back (to keep shareholders happy) while smaller producers (who may not have shareholders besides the proprietor) may be increasing output so the statistical estimate based on what the large producers are reporting may not be correct.
Some of the detail can be found at link below
https://www.eia.gov/petroleum/production/xls/comp-stat-oil.xlsx
Dennis
I made a mistake in answering Steve. I meant to say the weekly data are based on the STEO data.
Steve the weekly estimates for all US output except Alaska is based on the most recent STEO estimates at the time the weekly data is reported. Also unlike the PSM which revises the most recent three months of reported data monthly, the weekly data is never revised. Sometimes the weekly data is spot on, but mostly it is either too low or too high because the STEO is often wrong and gets revised monthly.
See page 38 of document linked below from EIA
https://www.eia.gov/petroleum/supply/weekly/pdf/appendixb.pdf
Excerpt:
EIA estimates weekly domestic crude oil production using a combination of short-term forecasts and the latest available production estimates from Alaska. The four data elements contributing to the estimate are:
• the most recent Short-Term Energy Outlook (STEO) model estimate (including interim estimates) for average daily production for the lower 48 States and the Federal Gulf of Mexico (GOM) (STEO Table 4a: http://www.eia.gov/forecasts/steo/data.cfm?type=tables);
• daily production volumes delivered from the North Slope of Alaska to the Trans-Alaska Pipeline System (TAPS) (reported to EIA by the Alyeska Pipeline Service Company);
• daily volumes of natural gas plant liquids produced on the North Slope delivered to TAPS (reported to EIA by BP); and
• daily production for South Alaska estimated from monthly production reports (lagged by two months) from the Alaska Oil and Gas Conservation Commission(AOGCC).
…
There is rage today that “oil companies are sitting on leases and not producing from them”.
Anyone here know if the leases have been proven to have any oil in them? They were bought speculatively?
Russia tying the ruble to gold is a maneuver quite clever. Rather than overtly and offensively declaring there will be no FX trading in setting a currency price for the ruble, they instead say it will be tied to gold. This is the same as decree of a dollar or euro to ruble ratio outside London or Chicago/NY trading, but it doesn’t sound like it. It sounds horribly reasonable and guts the power of central banks in Europe and the US.
With that as reality, Europe will indeed pay rubles for gas, and the big danger they face is the price of gold reflects ECB money creation to fund that purchase of gas. If that happens Russia will have to respond further. And they will. China/Russia/India can place gold on their own exchange and set the price for it.
The Golden Rule is he who has the gold, makes the rules. This is the gas rule. He who has the gas, makes the rules.
The price will rise. Qatar will not complain. Nor will it take action to reverse the rise.
Watcher – regarding the leases. There are a number of reasons operators will have leases and not drill or produce from them. Sometimes it’s speculative, like you suggest. This is common in the GOM where an operator may pick up a bunch of leases in a frontier area with the notion that they may eventually drill an exploration well on the lease which best tests the play concept. Then again, they may never drill it, if the prospect doesn’t stack up against its other undrilled prospects.
Just as common, an operator may pick up protection leases around a discovery or producing field – to keep another operator from coming in, picking up that protection lease and potentially diluting the initial operator’s equity by drilling a successful offset and forcing unitization.
Hi Bob,
When will the final data for 2021 be out for GOM from BSEE?
Currently they seem to have 1704 kb/d for 2021 average which is pretty close to the EIA estimate (1701 kb/d).
https://www.data.bsee.gov/Production/Files/Annual Production 2005 – Present.pdf
For Dec 2021 BSEE has 1696 kb/d and EIA estimates 1710 kb/d.
Monthly data for BSEE
https://www.data.bsee.gov/Production/OCSProduction/Default.aspx
I imagine the data gets revised, the last update was March 7, 2022.
Dennis,
The data is probably good enough to call complete. I can start working on the GOM production update post shortly. It may be ready in 3 weeks, or so, possibly sooner.
Bob
bob,
Thanks.
https://www.aapg.org/publications/news/spheresofinfluence/details/articleid/36728/the-good-the-bad-and-the-ugly-the-strategic-petroleum-reserve
Something to think about in regard the SPR release
I wonder how China stores its SPR?
This short article is very interesting. Salt cavern pressure is maintained at 800psi to minimise shrinkage and spalling of salt. I had not realised that US salt cavern storage was susceptible to degradation during the withdrawal/refilling process.
As is so often the case, the details of something apparently simple are in practice pretty complicated.
Saw this today
“Today, President Biden is calling on Congress to make companies pay fees on wells from their leases that they haven’t used in years and on acres of public lands that they are hoarding without producing”
Wonder how long it is before markets sniff out that what is being released from the SPR won’t cover what is going to be shut in over in eastern Russia.
OPEC+ sticks to modest oil output rises, ditches IEA data
DITCHING THE IEA
Just as the IEA was working on a new stocks release, OPEC+ decided to stop using IEA’s data, replacing it with reports from consultancies Wood Mackenzie and Rystad Energy.
OPEC+ uses the data to assess crude oil production and the conformity of participating countries with agreed output curbs.
The IEA advises Western governments on energy policy and has the United States as its top financier.
The IEA said in an emailed statement its data and analysis was “rigorous and objective” and its monthly update on OPEC+ oil production would be made available to the public to support transparency.
In February, the IEA surprised the market by revising its baseline estimate of global demand by nearly 800,000 barrels per day, just under 1% of the 100 million bpd global oil market.
The more interesting thing to comment about on this blog is the oil supply potential going forward.
It is not so wise other than short term keep oil prices down just because “people react to the price at the pump”. No matter how the future unfolds every drop of oil that is economical is going to be extracted. Because it is too damned useful. A direct quote from G. Kaplan. To which I agree.
Natural gas supplies are underestimated a lot of places probably. I have read the comments about the abundance in the US (for some time) compared to oil. The same applies to Norway. There is more natural gas reserves out there offshore than oil actually. It is just not that easy to get gas to be commercial. A lot of shelved (gas) projects in Norway are given the green light now probably. It takes time to develop – but as long as the price is right; pipeline connection or LNG can be considered.
If you look at the world in google map satellite mode, you could look at the frontier areas. The most interesting areas are offshore less than 1000 meters depth in the arctic areas, and maybe in the south China seas, Northern Australia. Alaska, the coast of Norway, the Russian arctic, a little bit Canada outside New Found land are more unexplored. If these areas give a hydrocarbon potential to ease pressures for 1-2 decades to facilitate a green transition at even a 100 dollar break even price for western world in particular. It is more than well worth it. Question is what is the supply potential given higher oil or gas prices.
Higher oil and natural gas prices will not be sustained long term as there are cheaper sources of energy. These will replace oi and natural gas in time. The higher the price, the more quickly this will occur.
D. Coyne,
There are a lot of uncertainties. You are hoping that the global trade network prevails to supply renewable energy cheaply. I am just much more pessimistic in general.
Kolbeinih,
Note that I think this will take some time, perhaps 15 to 20 years, but wind and solar are very competitive at high fossil fuel prices and I am fairly certain (65% probability or higher) that constrained fossil fuel supply will keep fossil fuel prices high enough that fossil fuel energy will gradually be replaced with wind, solar, hydro, geothermal and nuclear power, at some point fossil fuel prices start to fall due to lack of demand, but in order for depleting fossil fuels to be profitable prices will need to fall to a level where tehy are no longer profitable to produce to remain competitive with non-fossil fuel energy, this probably occurs in 40 to 50 years time and possibly in 70 years fossil fuels are eliminated as an energy source entirely (or perhaps 99.5%).
I respect your opinion, thank you!
Kolbeinih,
Also note that just because an area has not been explored does not mean that much oil or natural gas will be found there. I imagine geologists and geophysicists have an idea where the best places are to look, those are the areas that have been explored. There are likely good reasons the unexplored areas have not been explored, possibly because there is not much to find or that production would be exceedingly expensive (as in offshore Arctic.)
In general that is certainly true. To make an example, the Wisting area in the Barent sea (oil) was not even on the table a few years ago. Now, it is going to be developed and all of the surrounding areas drilled. Could make another 1 billion barrels unaccounted for. There could be other Wisting’s out there as well. But in general I can see the view that most is explored. But is it true really? Only higher prices and time to develop projects can really answer that. A lot could be shelved, and more so in the undeveloped/secretive nations (both onshore and offshore).
Kolbeinth,
Note that 1 billion barrels is not a lot on the World scale, the World uses 30 Gb per year. I guess in this case I am more pessimistic than you. By 2035 demand for oil will be falling faster than supply and many of the high priced oil projects will become unprofitable, this may keep a lot of the more expensive Arctic and deepwater oil developments from reaching FID.
Russian output in March.
https://www.reuters.com/article/russia-oil-idUSR4N2VF01D
April 1 (Reuters) – Russia’s oil and gas condensate production fell to 11.01 million barrels per day (bpd) in March, from an average output of 11.08 bpd in February, two industry sources familiar with the data told Reuters on Friday. (Reporting by Reuters Editing by Mark Potter)
A new post regarding January US production has been posted.
https://peakoilbarrel.com/us-january-production-drop-surprises/
A new open thread for Non-Petroleum comments has been posted.
https://peakoilbarrel.com/open-thread-non-petroleum-april-1-2022/