By Ovi
The focus of this post is an overview of World oil production along with a more detailed review of the top 11 Non-OPEC oil producing countries. OPEC production is covered in a separate post.
Below are a number of Crude plus Condensate (C + C) production charts, usually shortened to “oil”, for the oil producing countries. The charts are created from data provided by the EIA’s International Energy Statistics and are updated to Febuary 2026. This is the latest and most detailed/complete World oil production information available. Information from other sources such as OPEC, IEA, STEO and country specific sites such as Brazil, Norway, Mexico, Argentina and China is reported to provide an extra one or two months production preview beyond the EIA’s latest report.
The EIA’s June STEO report continues to make significant and major revisions to the World’s projected oil production after February 2026 due to the US/Iranian war. Also US December 2027 projected production has been revised upward. See US chart at the end.
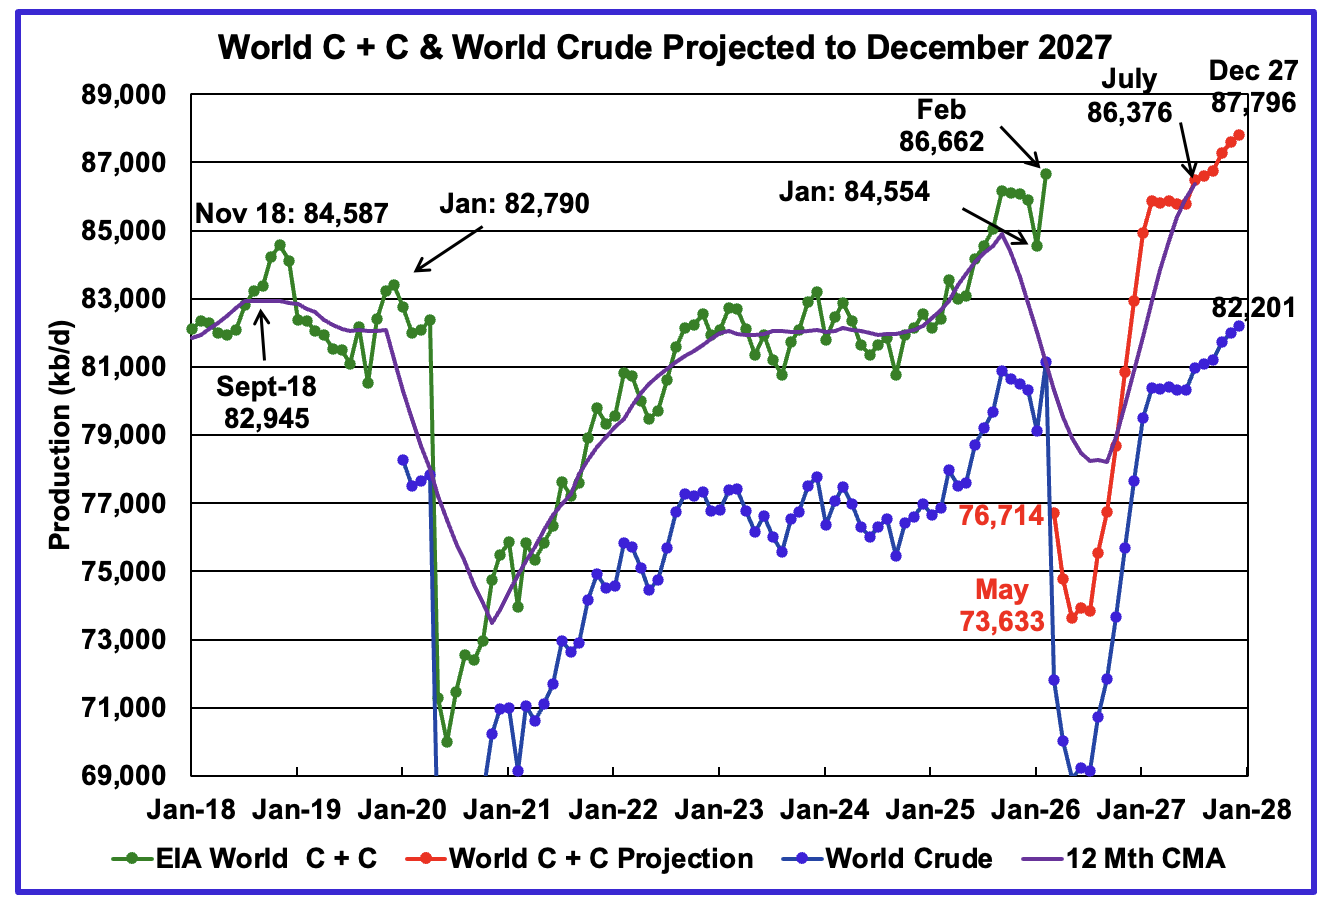
The World’s February oil production increased by 2,108 kb/d to 86,662 kb/d, a new high, and is over 2,000 kb/d higher than November 2018. The largest contributors to the increase were Saudi Arabia, US and Kazakhstan.
This chart has been updated using the June 2026 STEO to project World C + C production out to December 2027. It uses the STEO report along with the International Energy Statistics to make the projection. Production in March 2026 is projected to fall by 9,948 kb/d to 76,714 kb/d. May production is forecast to be the bottom and is projected to be 73,663 kb/d.
The 12 month Centred Moving Average shown at July 2027 is 86,376 kb/d.
For December 2027, production is projected to be 87,796 kb/d, a new projected high. The increase comes from a combination of Non-OPEC countries and the US.
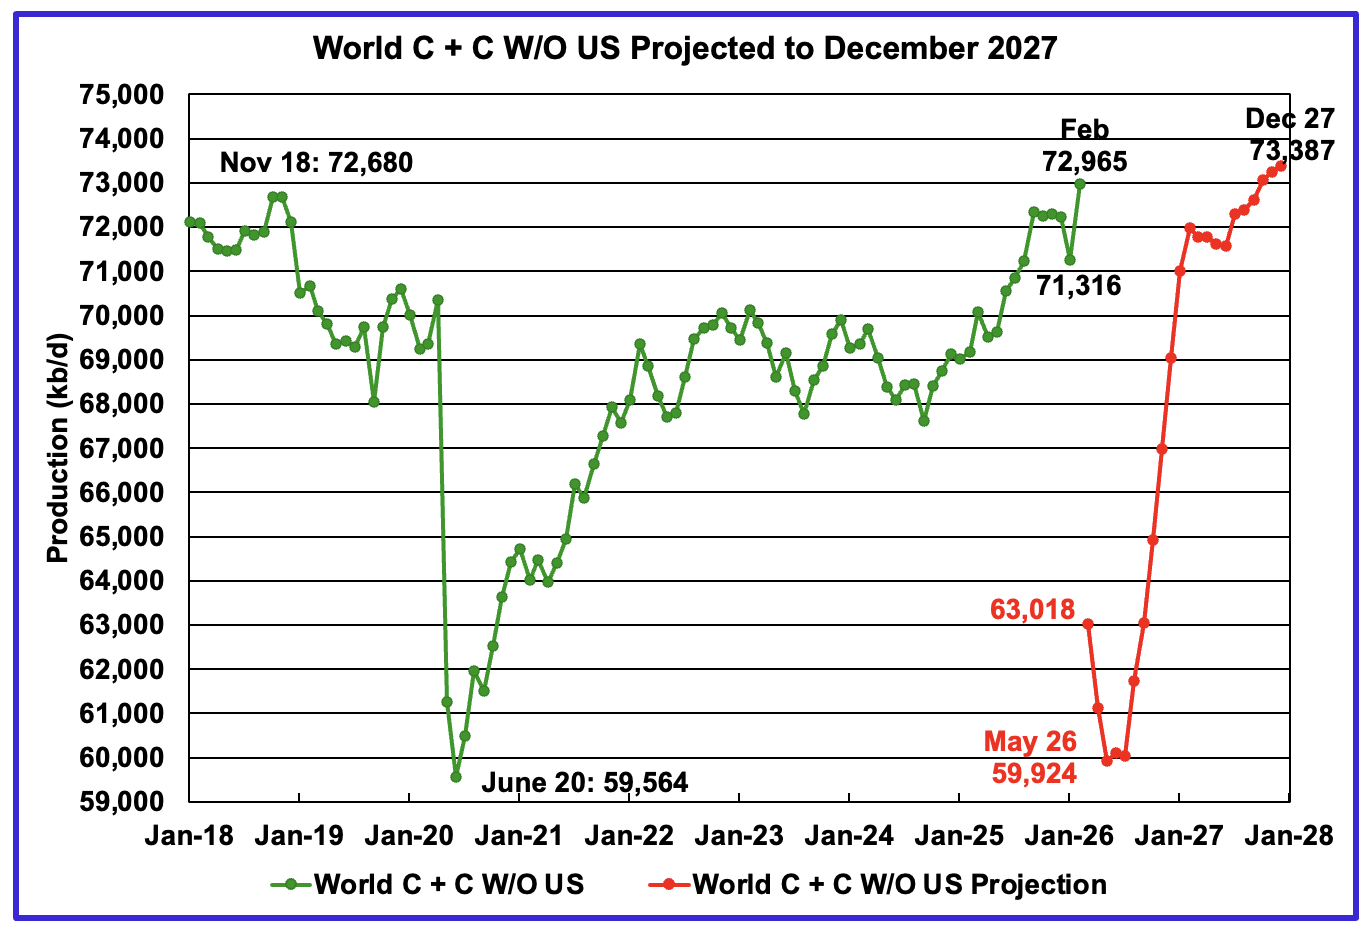
February World oil output W/O the US increased by 1,649 kb/d to 72,965 kb/d, a new high. March production is expected to drop by 9,947 kb/d to 63,018 kb/d.
The projection is forecasting that December 2027 World W/O US oil production will be 73,387 kb/d. This is only 422 kb/d higher than the expected February production of 72,965 kb/d. Very little growth is expected from the Non-US World oil producing countries over the next two years. This small increase may be more than welcome to offset the demand destruction occurring now.
A Different Perspective on World Oil Production
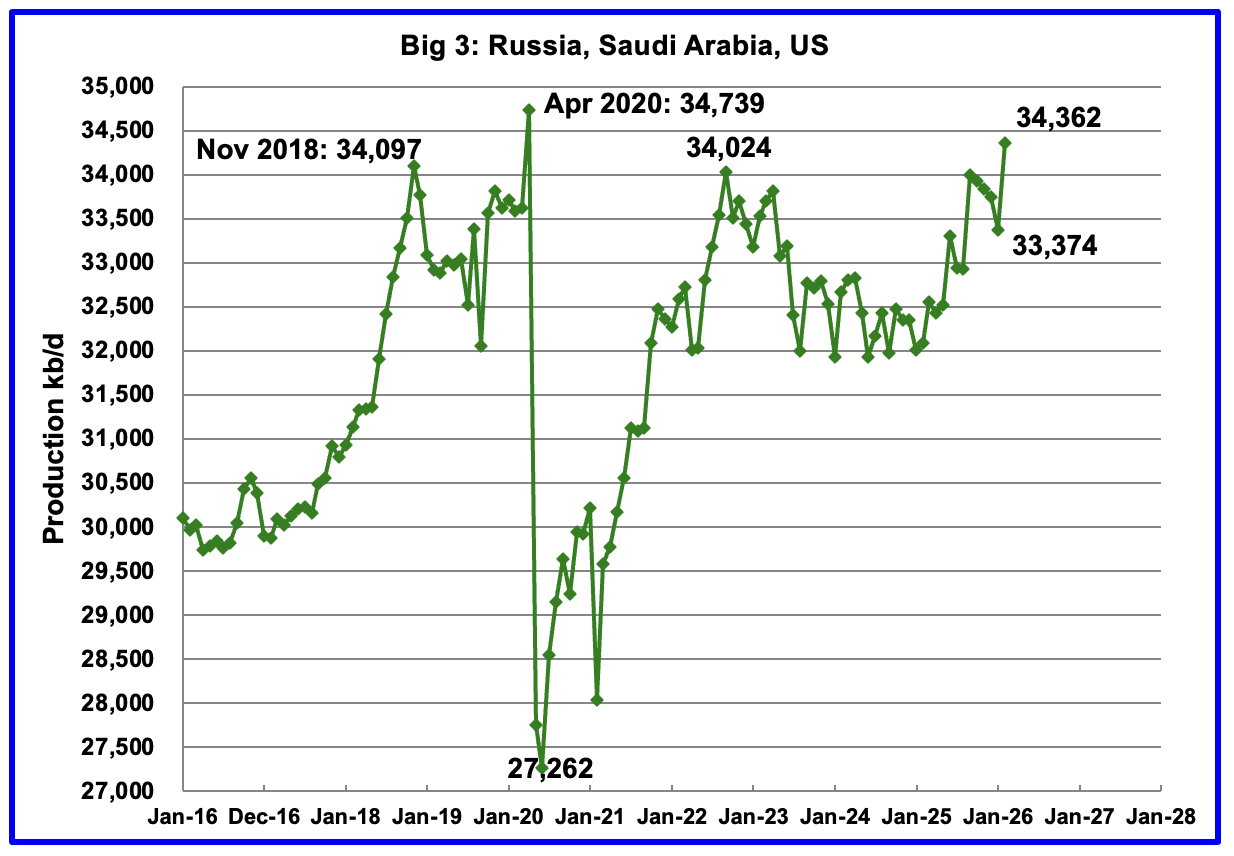
February Big 3 oil production increased by 988 kb/d to 34,362 kb/d. The US and Saudi Arabia had increases while Russian production dropped.
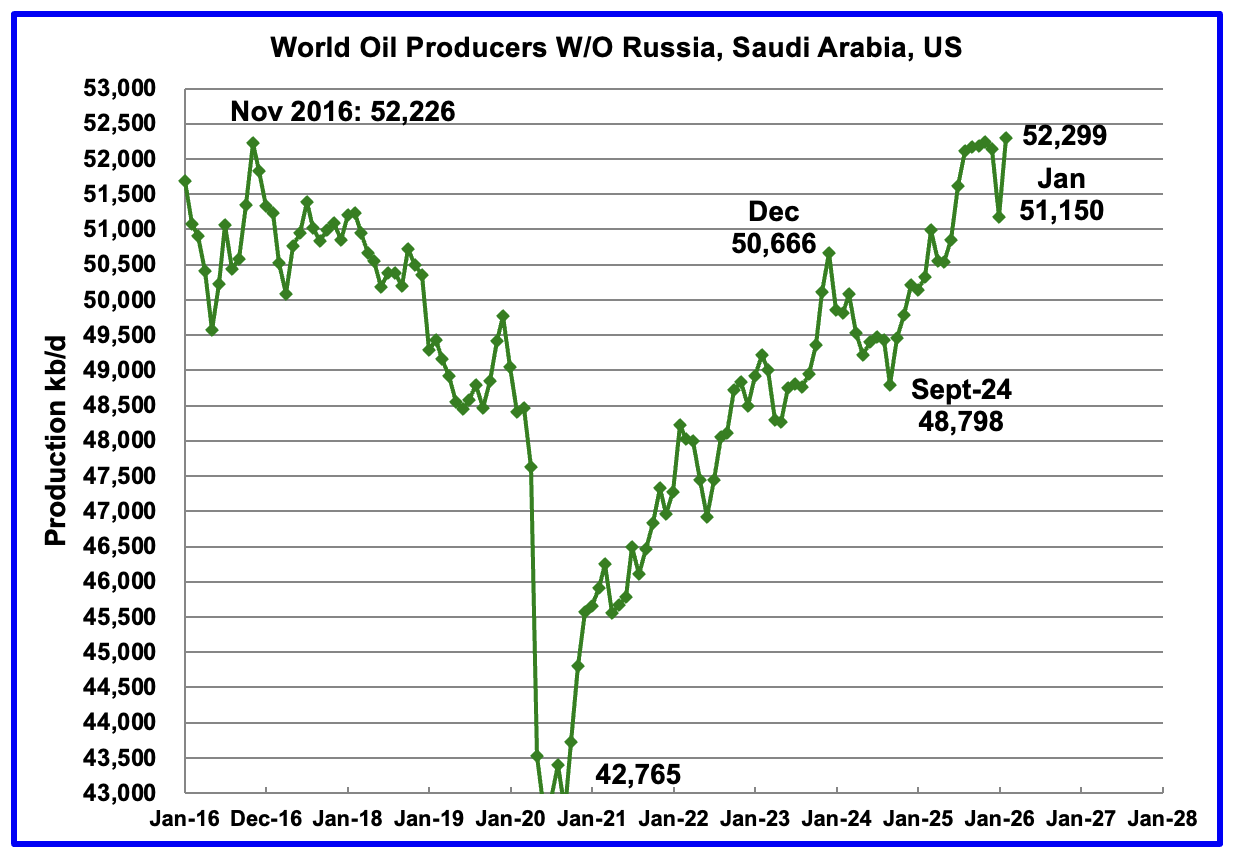
Production in the remaining countries has been slowly increasing since the September 2020 low of 42,765 kb/d but dropped sharply in January. February 2026 production rebounded to 52,299 kb/d by adding 1,149 kb/d. The biggest contributors to the gain were Kazakhstan and Venezuela.
Countries Expected to Grow Oil Production
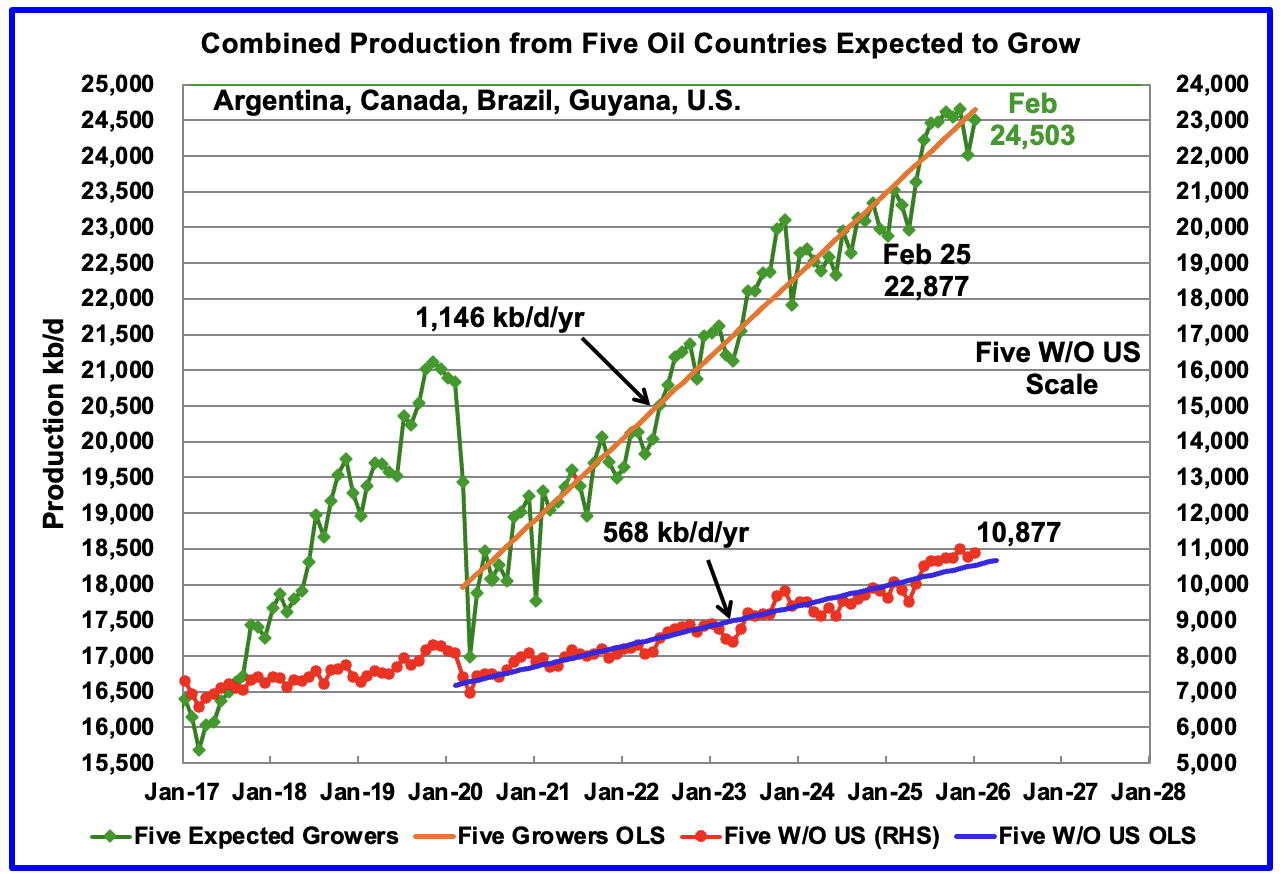
This chart shows the combined growing oil production from five Non-OPEC countries, Argentina, Brazil, Canada, Guyana and the U.S., whose oil production is expected to grow in coming years. These five countries are often cited by OPEC and the IEA for being capable of meeting the increasing World oil demand for next few years. Production from these five countries from April 2020 to February 2026 rose at an average rate of 1,146 kb/d/year as shown by the orange OLS line. This is an updated OLS and the growth rate rose slightly from 1,130 kb/d/yr to 1,146 kb/d/yr. Since February 2025, production has risen by 1,626 kb/d.
To show the impact of US growth over the past 5 years, U.S. production was removed from the five countries and that graph is shown in red. The production growth slope for the remaining four countries has been reduced by 578 kb/d/yr to 568 kb/d/yr.
February production has been added to the five growers chart and it rose by 485 kb/d to 24,503 kb/d.
World Oil Countries Ranked by Production
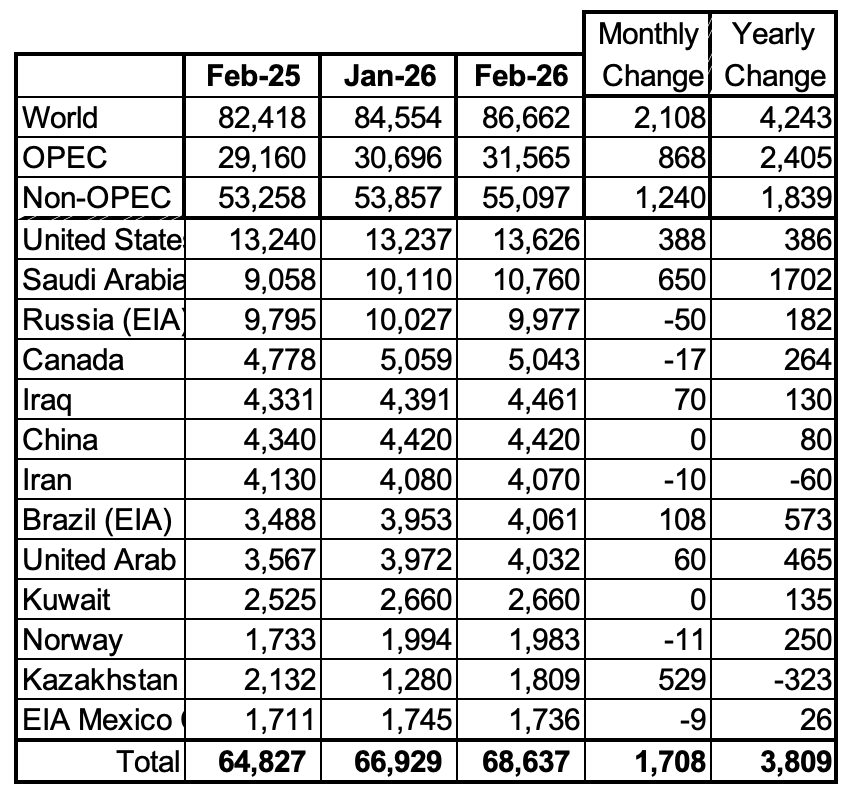
Above are listed the World’s 13th largest oil producing countries. In February 2026 these 13 countries produced 79.2% of the World’s oil. On a MoM basis, production increased by 1,708 kb/d in these 13 countries while on a YOY basis production rose by 3,809 kb/d. Note the large YoY increases from Saudi Arabia, Brazil and the UAE.
Non-OPEC Oil Countries Ranked by Production
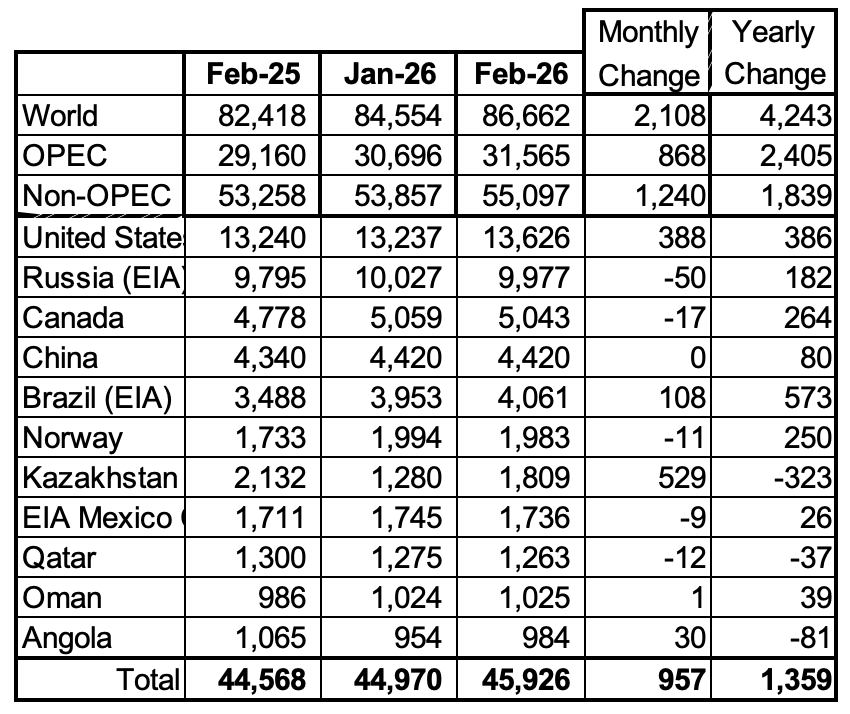
Listed above are the World’s 11 largest Non-OPEC producers. The original criteria for inclusion in the table was that all of the countries produced more than 1,000 kb/d.
February’s MoM production decreased by 957 kb/d to 45,926 kb/d for these eleven Non-OPEC countries while as a whole the Non-OPEC countries saw a yearly production increase of 1,839 kb/d to 55,097 kb/d. Major yearly gains came from US and Kazakhstan.
In February 2026, these 11 countries produced 83.4% of all Non-OPEC oil.
Non-OPEC Country Oil Production Charts
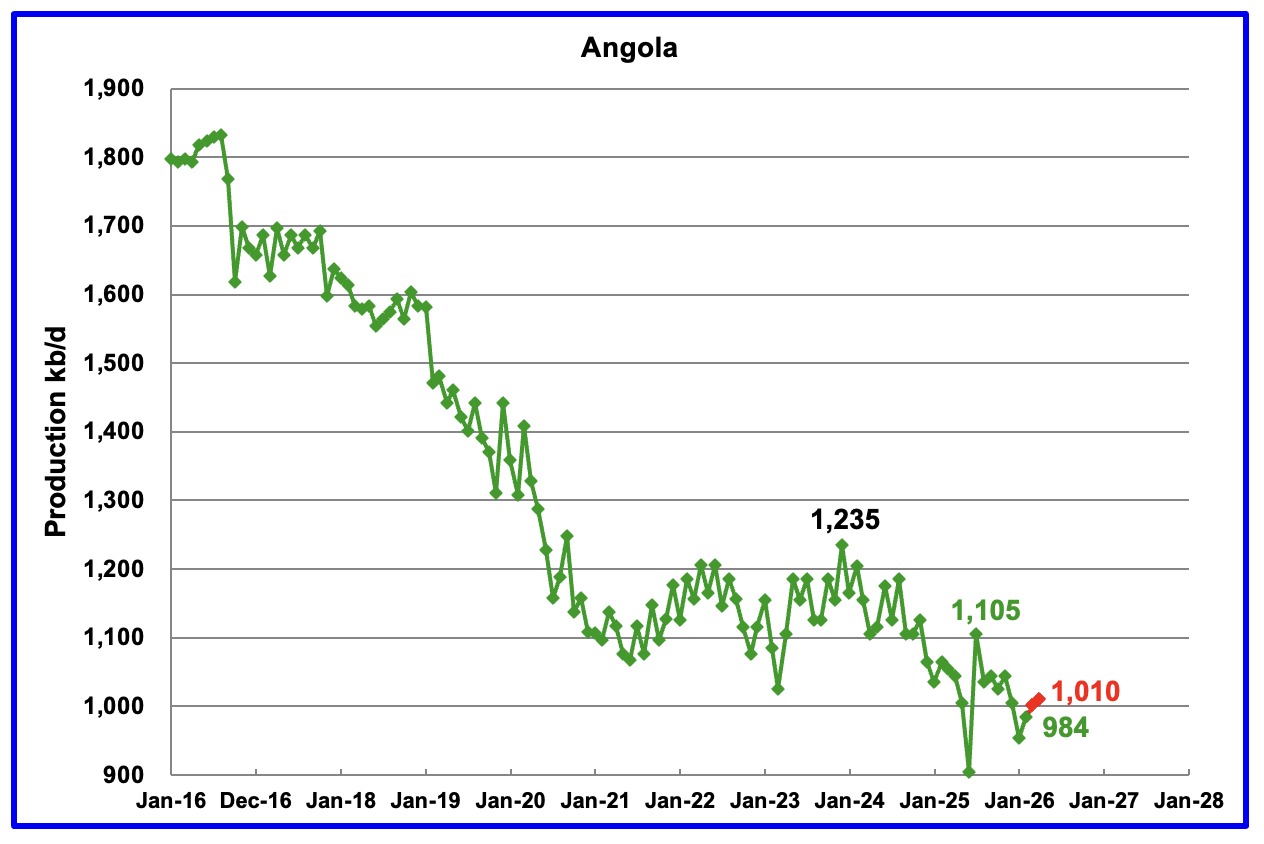
The EIA reported Angola’s February oil production rose by 30 kb/d to 984 kb/d.
According to Angola’s National Agency for Petroleum, production in April rose to 1,010 kb/d, red markers. Note that the 1,010 kb/d projection comes by reducing the ANP’s estimate by 20 kb/d since the EIA’s reported production numbers are typically 20 kb/d lower that the production reported by the ANP.
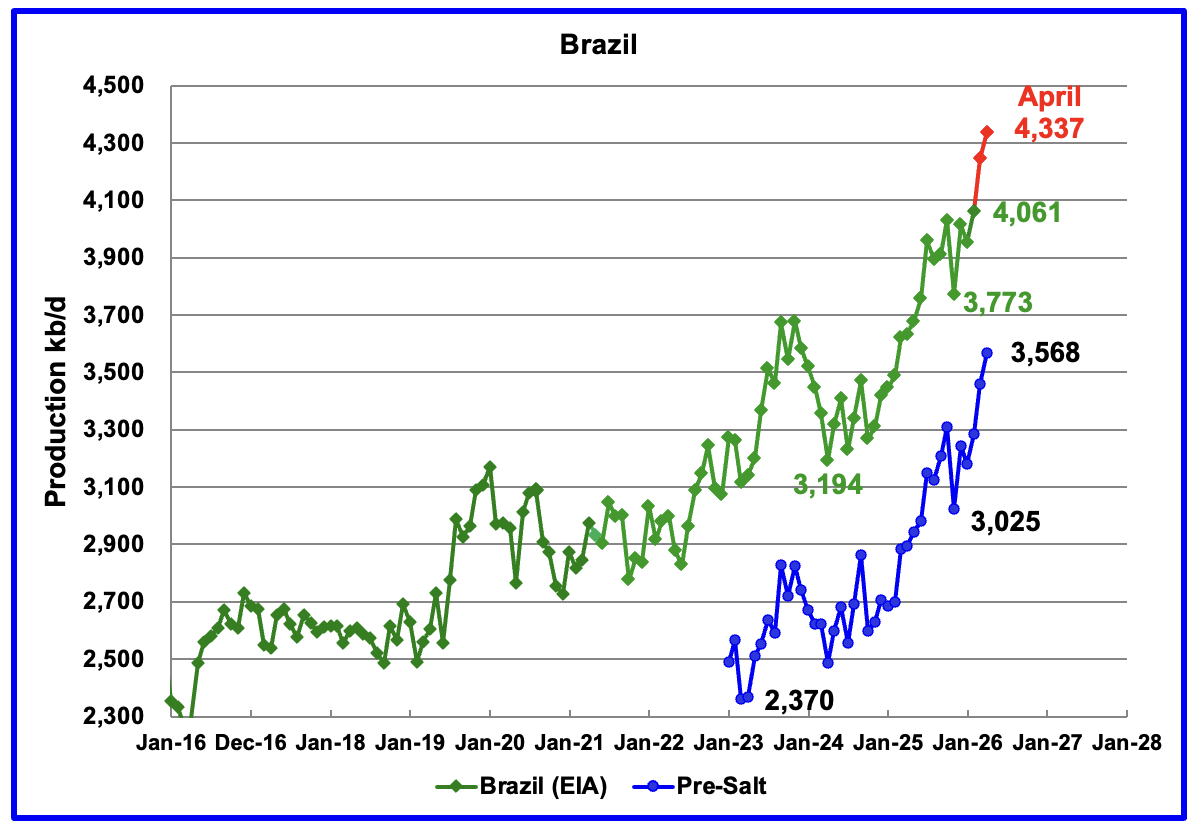
The EIA reported that Brazil’s February production rose by 108 kb/d to 4,061 kb/d. According to this Article, the pre-salt reservoirs remained the backbone of national production, accounting for nearly 80 per cent of total oil and gas output.
Brazil’s National Petroleum Association (BNPA) reported that production rose both in March and April to a new high in April of 4,337 kb/d.
Pre-Salt production was a major contributor to the March and April production rebound.
According to the June OPEC MOMR: “In 2026, Brazil’s liquids production, including biofuels, is forecast to rise by about 270 tb/d, y-o-y, to average 4.7 mb/d. Upstream liquids production is set to surge through production ramp-ups at the Buzios (Franco), Mero (Libra NW), Marlim, Bacalhau (x-Carcara) and Wahoo projects.
Rising development costs and sustained inflationary pressures are increasingly challenging offshore project economics. Consequently, final investment decisions could be pushed back, moderating the expected pace of growth.“
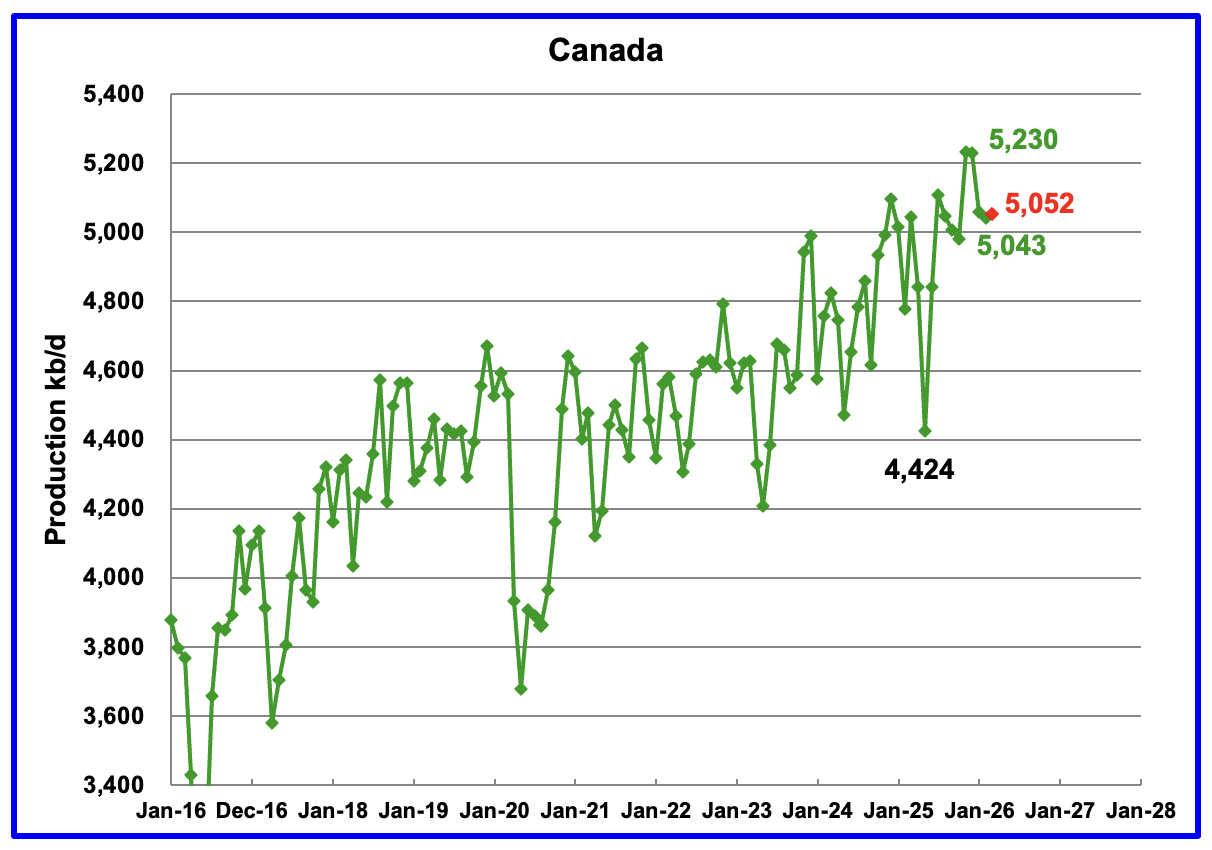
Canada’s oil production decreased by 17 kb/d in February to 5,043 kb/d.
Canada’s January and February production was down due to unexpected downtime at a few oil sands companies. March production is expected to grow by 9 kb/d to 5,052 kb/d, red marker.
According to the IEA’s May OMR: “May is expected to see further losses as both the Syncrude and Suncor Base Plant upgraders have scheduled maintenance. Annual production is forecast to increase by 90 kb/d to 6.5 mb/d on average.”
According to this Article, President Trump signed an executive order to build a smaller version of the Keystone XL pipeline.
The pipeline, proposed by Canadian pipeline company South Bow (SOBO.TO) and its U.S. partner Bridger Pipeline, could increase Canada’s crude exports to the U.S.by more than 12% if it goes ahead. A presidential permit was required for the project to proceed.
According to this Article: SOBO announced it has secured the shipper commitments it was seeking to advance the project. However SOBO will not make a financial commitment “Without assurances that a new U.S. administration would not revoke the permits in 2029, as Biden did with KXL, the project is likely to be stalled,” O’Donnell said.”
In January 2026 the TMX pipeline, which exports oil through the port of Vancouver, was operating at 80% capacity. As of June the pipeline was slightly apportioned, 0.2%, due to increased demand associated with the Iran/US blockage of the straits of Hormuz. New/increased demand is coming from China, India, and South Korea to offset losses from ME countries.
“The Trans Mountain pipeline has reached full capacity for the first time since its expansion was completed, boosting the pipe’s total carrying capability to 890,000 barrels daily. Indeed, this month the pipeline has seen more demand than there is capacity, a senior executive at the same-name company said, as quoted by Reuters.”
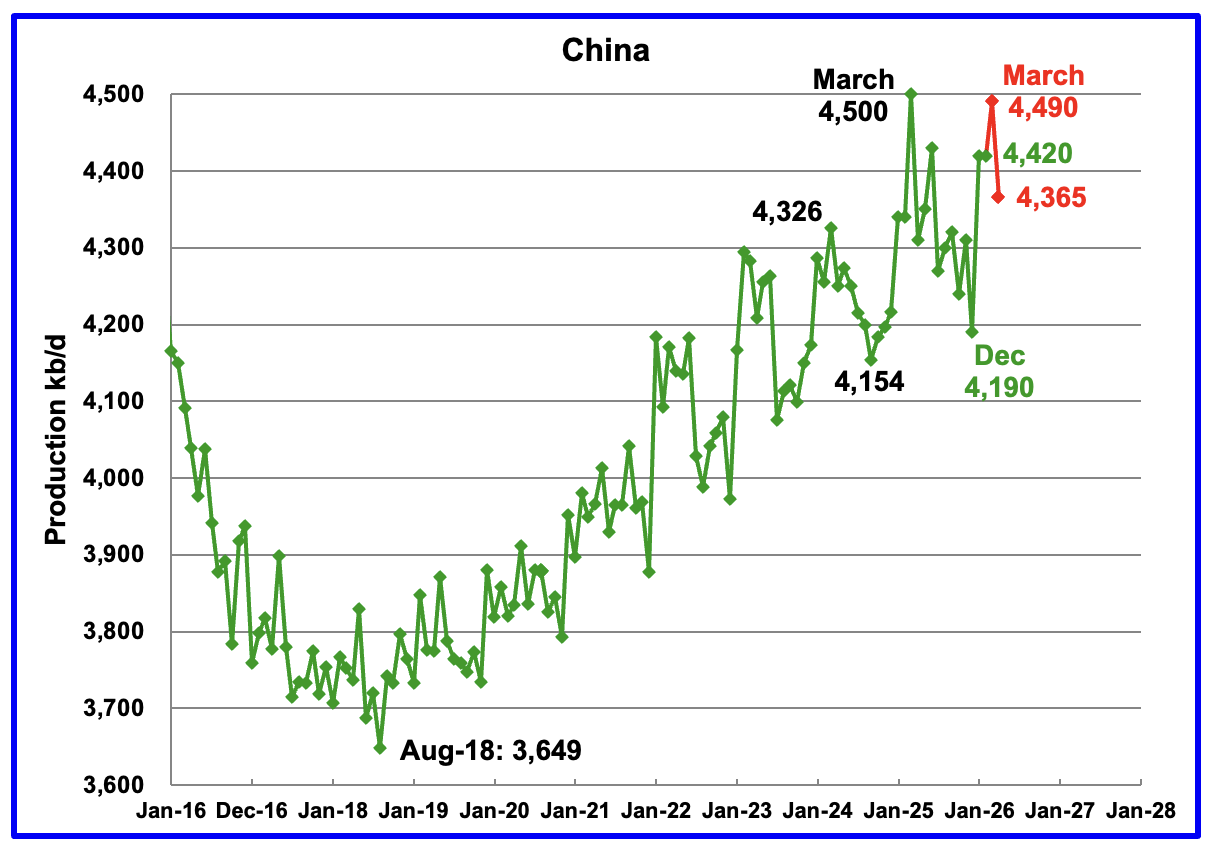
The EIA reported China’s February oil output was unchanged at 4,420 kb/d. On a YoY basis, China’s February production rose by 80 kb/d. For March, China reported average production of 4,490 kb/d, red markers.
For the last two years, March has proven to be a record production month. Again this year March showed a large gain but it did not exceed the March 2025 peak of 4,500 kb/d. Does this hint at an upcoming peak in China oil production?
Note that April production dropped by 125 kb/d to 4,365 kb/d.
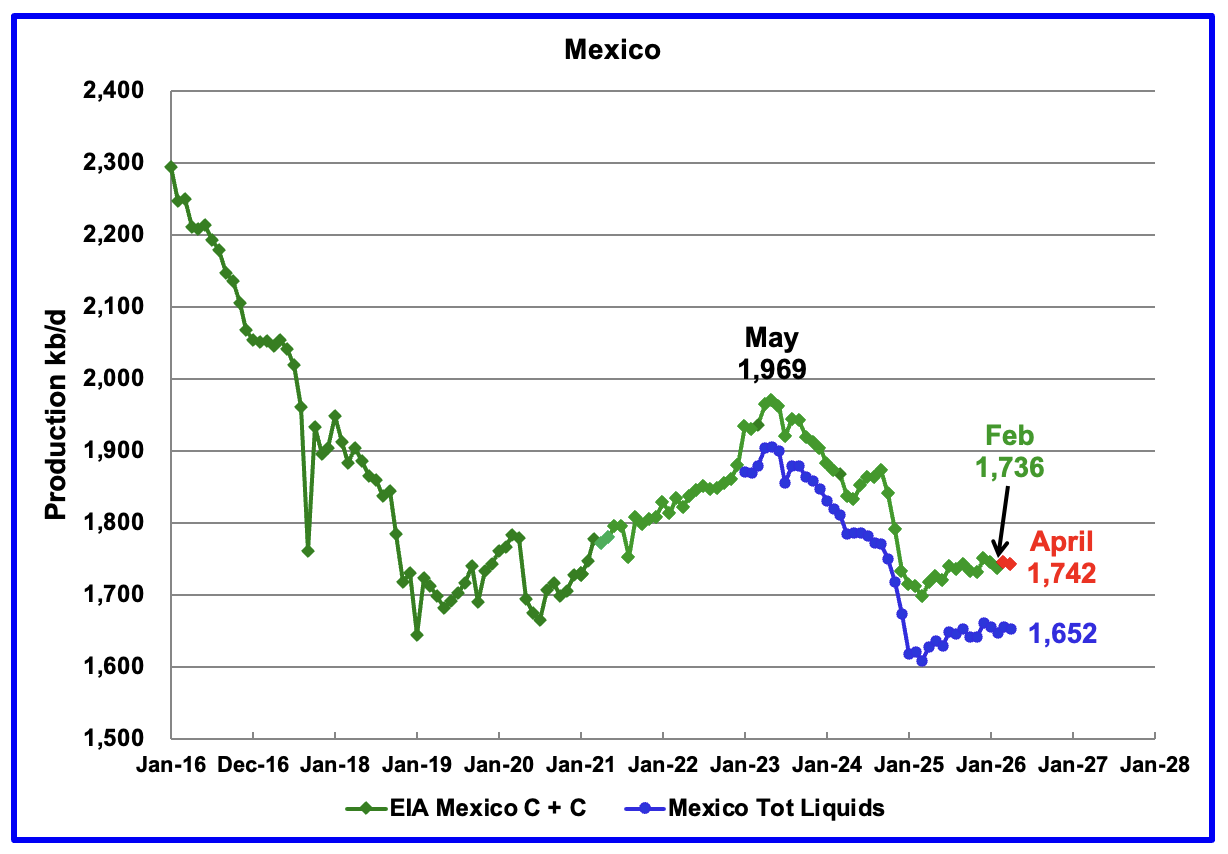
According to the EIA, Mexico’s February output dropped by 9 kb/d to 1,736 kb/d.
In June 2024, Pemex issued a new and modified oil production report for Heavy, Light and Extra Light oil. It is shown in blue in the chart and it appears that Mexico is not reporting condensate production when compared to the EIA report.
In earlier EIA reports, they would add close to 55 kb/d of condensate to the Pemex’s “Total Liquids” report. More recently the EIA has been adding 90 kb/d of condensate to Mexican production. For March and April production, 90 kb/d have been added to the Pemex report. April production is estimated to be close to 1,742 kb/d. Note that Mexico’s production, as reported by Pemex for the last eight months has stabilized around 1,650 kb/d, blue graph.
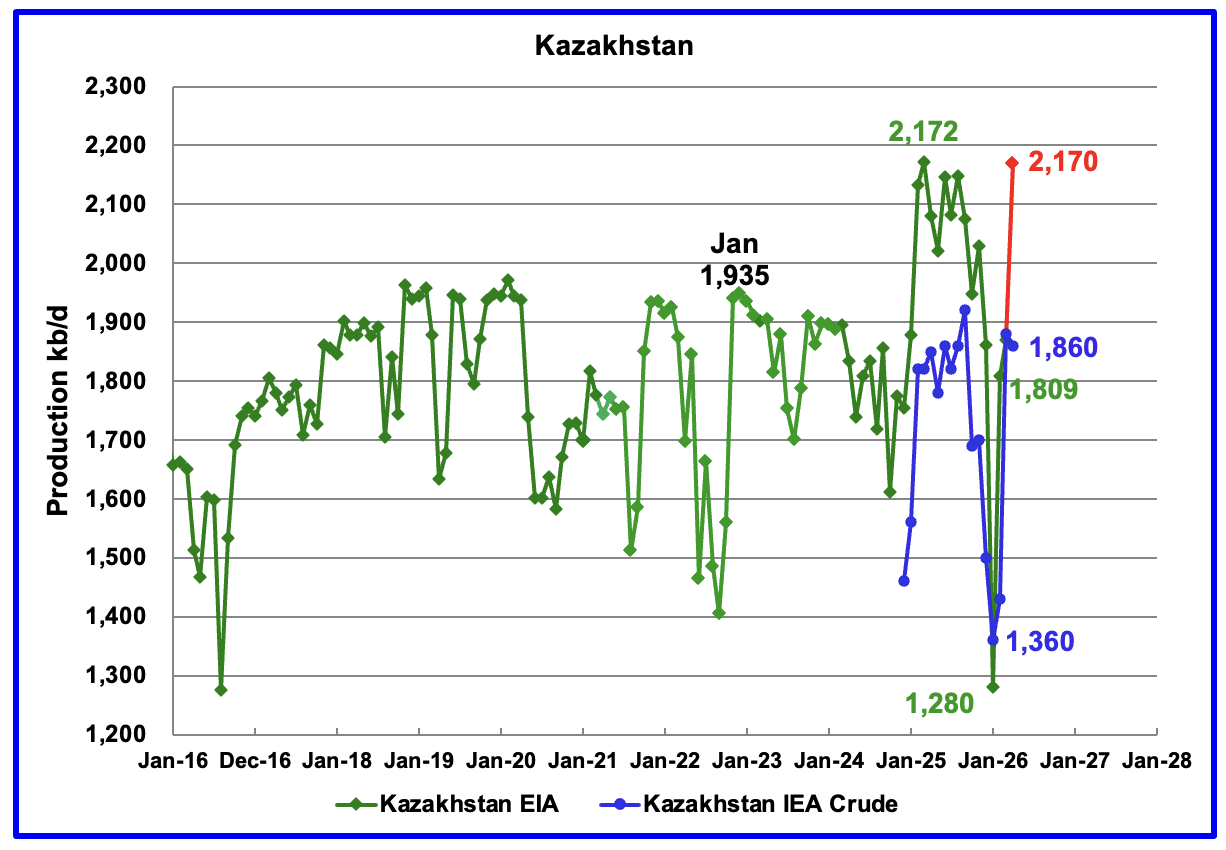
According to the EIA, Kazakhstan’s February oil output increased by 529 kb/d to 1,809 kb/d after the fire damage to the Tengiz oil field power generating plant was repaired.
Since Argus no longer reports OPEC + crude production, production data for Kazakhstan will now be taken from the monthly IEA reports. March production rebounded by 450 kb/d to 1,880 kb/d even though Kazakhstan was supposed to reduce production in March. The May IEA OMR reported that crude production in April dropped by 20 kb/d to 1,860 kb.
The C + C production for April, red marker, was taken from this Report.
The increase was driven mainly by higher output at Tengiz, the country’s largest oilfield, where the source said production jumped 39% to 973,000 bpd.“
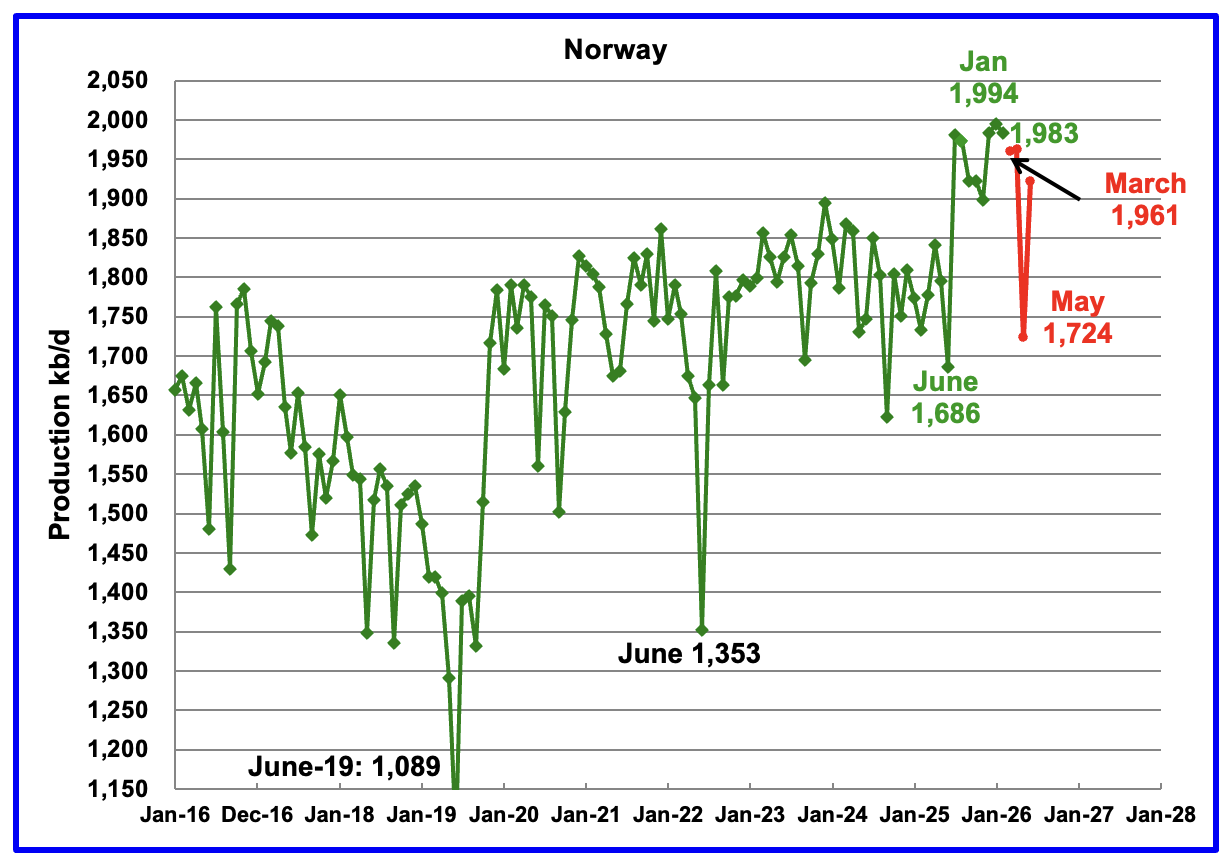
The EIA reported Norway’s February production dropped by 11 kb/d to 1,983 kb/d.
Separately, the Norway Petroleum Directorship also projected that oil production from February will drop to 1,728 kb/d in May. The red markers are the NPD’s production forecast.
According to OPEC’s May MOMR: “Norwegian liquids production is forecast to rise by about 10 tb/d to average 2.0 mb/d in 2026. This has been revised upward due to higher-than-expected output in recent months.
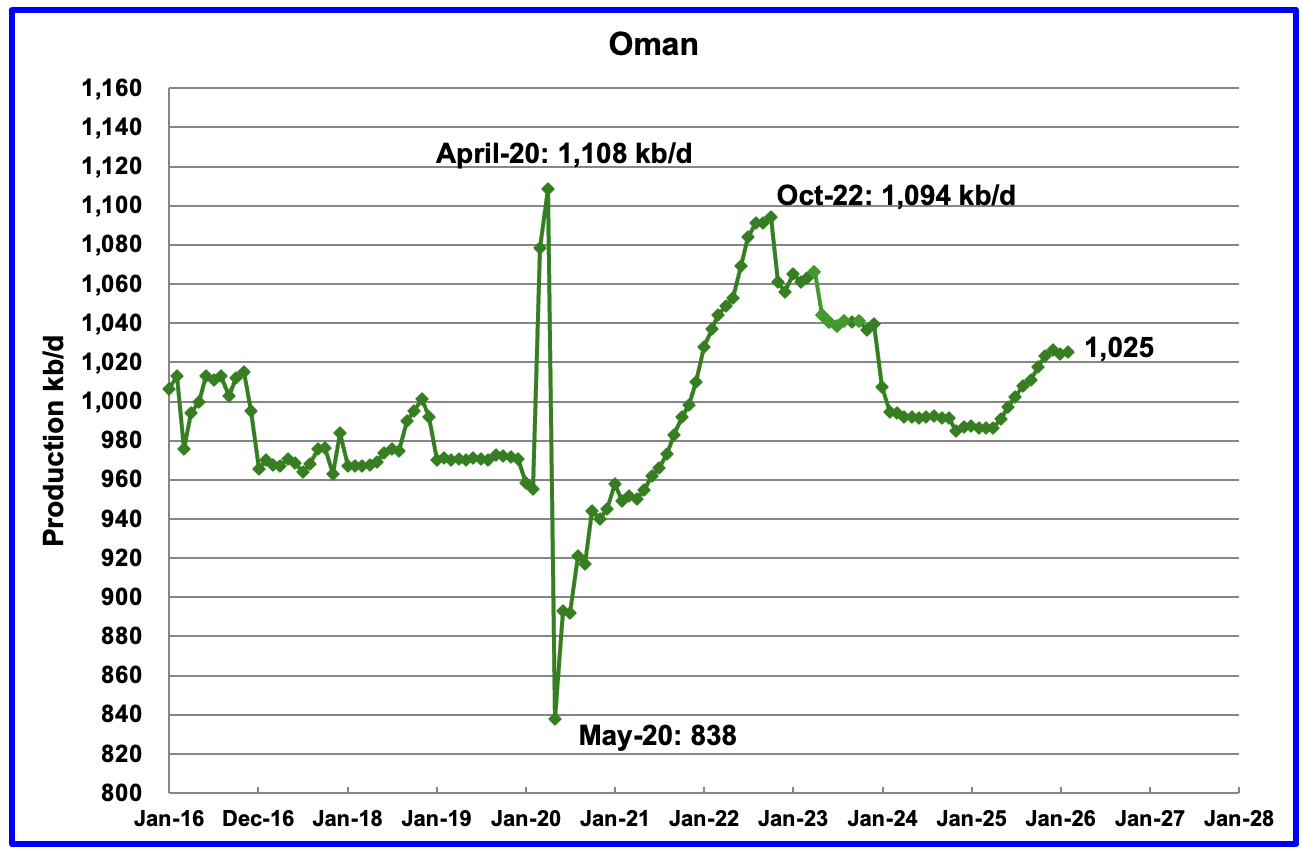
According to the EIA, February output rose by 1 kb/d to 1,025 kb/d. Oman’s production appears to have started a budding growth phase. Previous production peaked in October 2022.
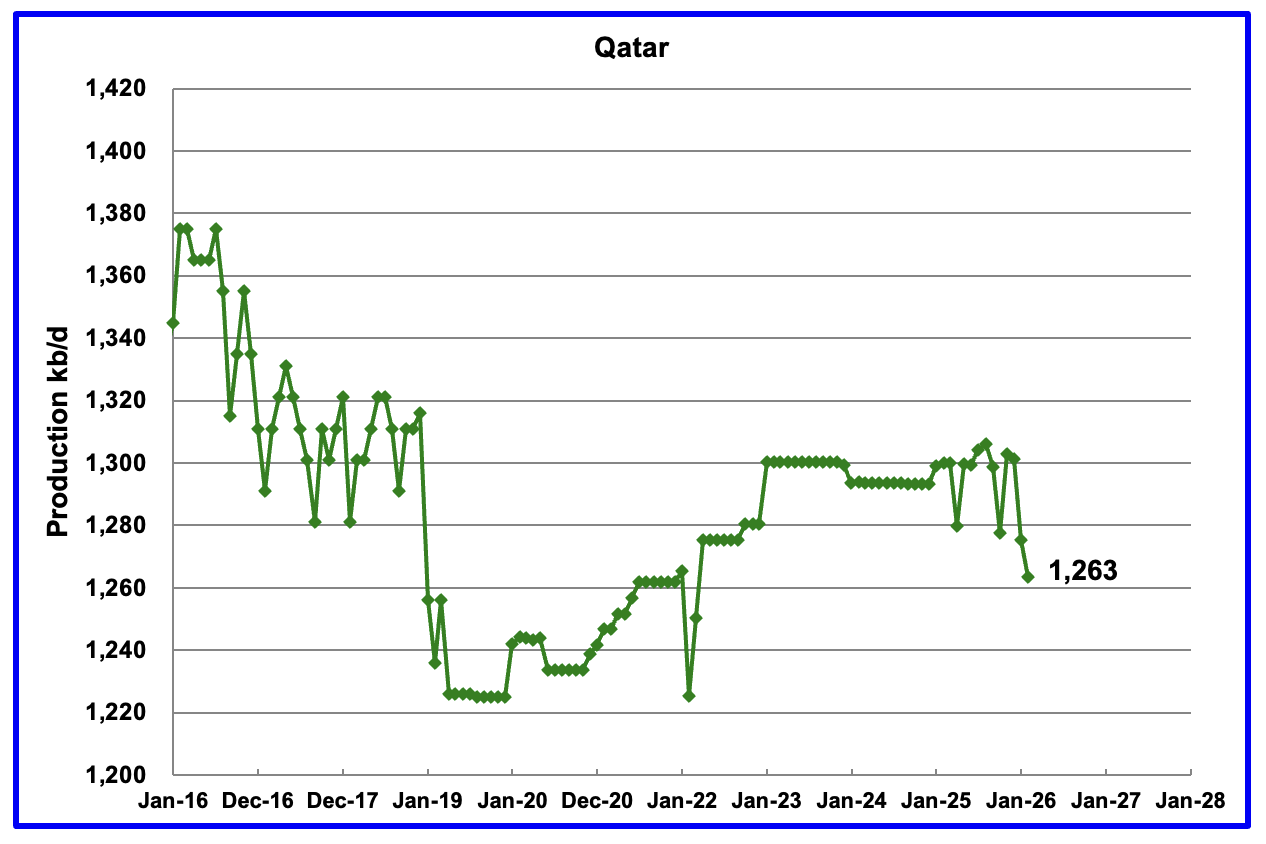
Qatar has restarted providing the EIA with monthly updated oil production.
Qatar’s February output dropped by 12 kb/d to 1,263 kb/d.
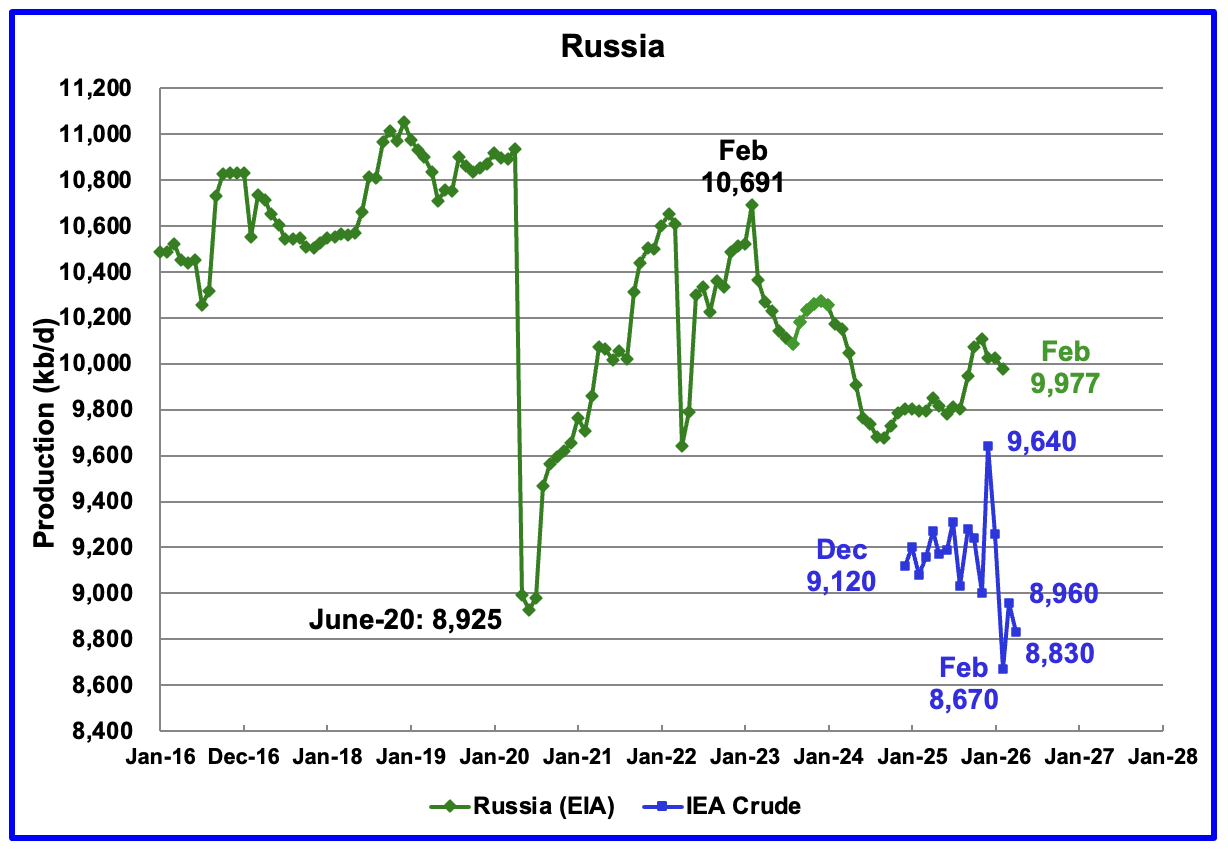
The EIA reported Russia’s February C + C production declined by 50 kb/d to 9,977 kb/d and was up by 264 kb/d from February 2025.
The above chart also shows Russian production as reported by the IEA. It is difficult to assess the accuracy of the IEA report since over the last few months the IEA’s Russian production had been around 100 kb/d to 150 kb/d higher than Argus’ Media. The best that can be done at this time will be to compare the production trends between the EIA and the IEA. I think that Russian oil production continues to be a major state secret at this time because of the damage being caused by the heavy bombing to its related crude oil processing facilities.
According to the IEA’s April report, February crude production dropped by 590 kb/d to 8,670 kb/d. The IEA’s May OMR reported that Russian crude production rose by 290 kb/d in March and then dropped by 130 kb/d in April to 8,830 kb/d. This is the first clear indication that Russian production is being affected by the Russia/Ukraine war.
The OPEC June MOMR is reporting Russian Crude production in April and May was 9,019 kb/d and 9,009 kb/d, respectively. For April, OPEC’s Russian crude production is 189 kb/d higher than the IEA’s report.
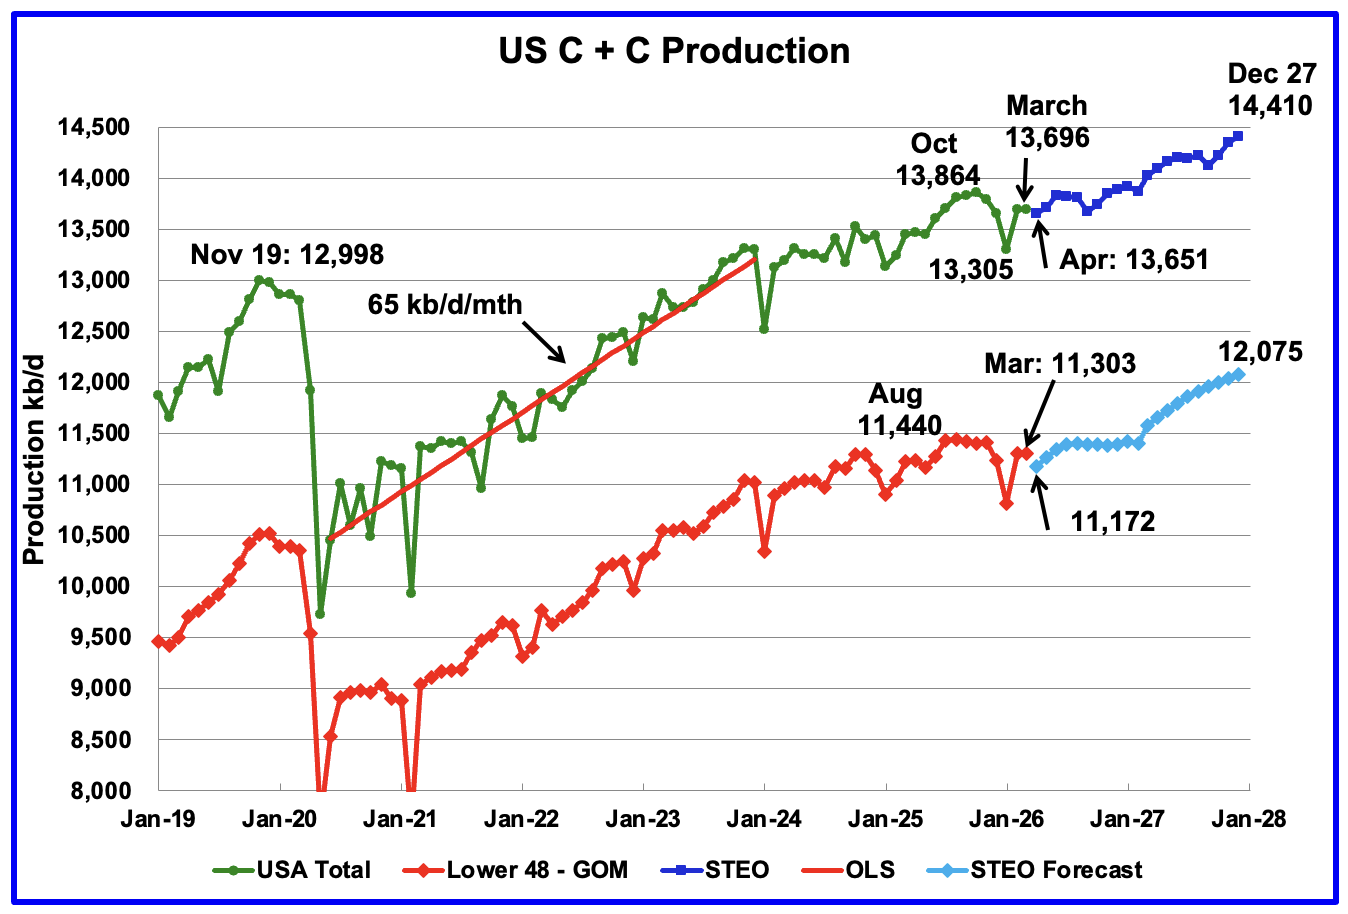
This US production chart showing output up to March 2026 is the same as the one published last week in the US update. However the projected portion of the two production graphs, light and dark blue, have been updated according to the June 2026 STEO.
For US projected production, December 2027 has increased from 14,282 kb/d in the April STEO to 14,410 kb/d in the June STEO, an increase of 128 kb/d. For Onshore L48 production, December 2027 production has risen from 11,892 kb/d in the March STEO to 11,961 kb/d in the May STEO. The rising production is projected to come primarily from the Permian basin.
Surprisingly US April projected production has dropped from 13,745 kb/d down to 13,651 kb/d.
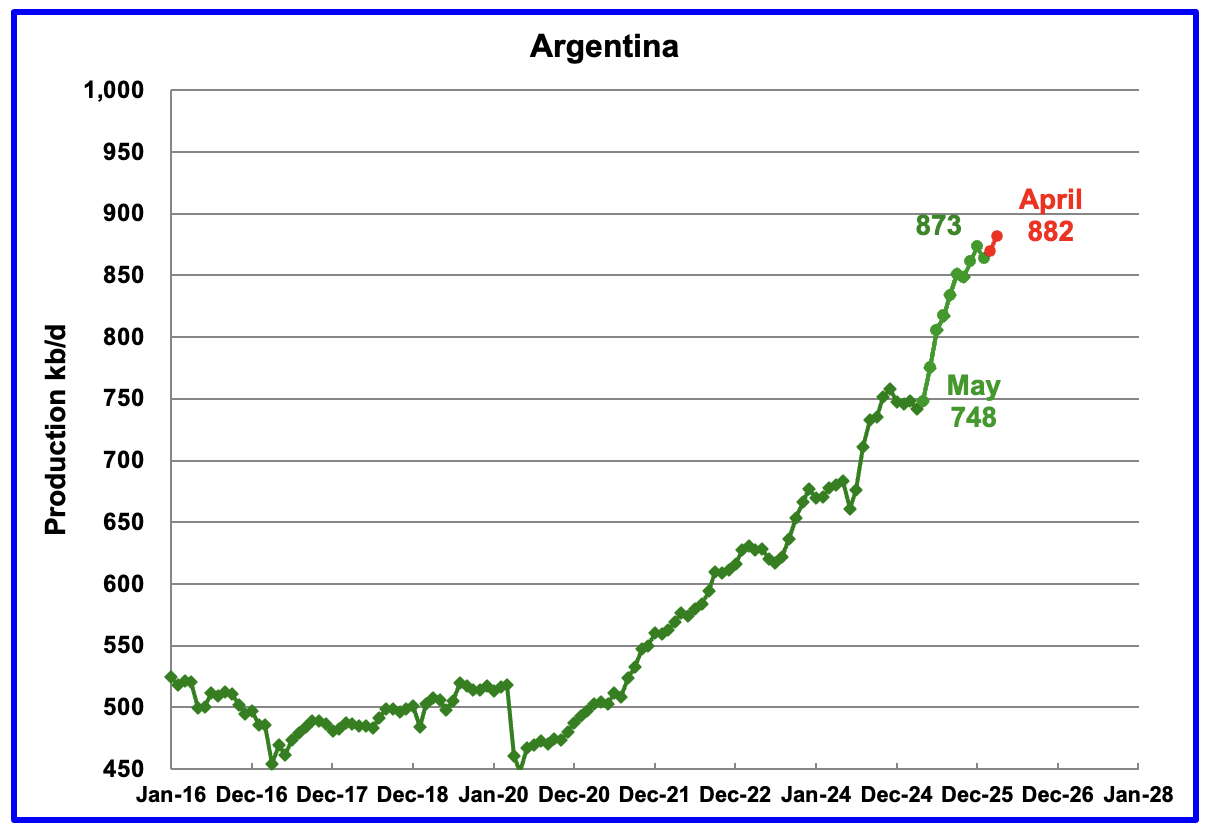
Argentina’s production has grown by 134 kb/d from May to April. Red markers are production as reported by the Argentina Ministry of Energy.
Leave a Reply