The EIA publishes every possible energy stat for the USA and hardly anything for the rest of the world. Well, anything current for the rest of the world anyway. Their International Energy Statistics is already five full months behind and working on six. December 2014 is the last international oil production data we have.
Anyway during this lull in other data I decided to look at the last three years of international data, from December 2011 to December 2014. All data is in thousand barrels per day.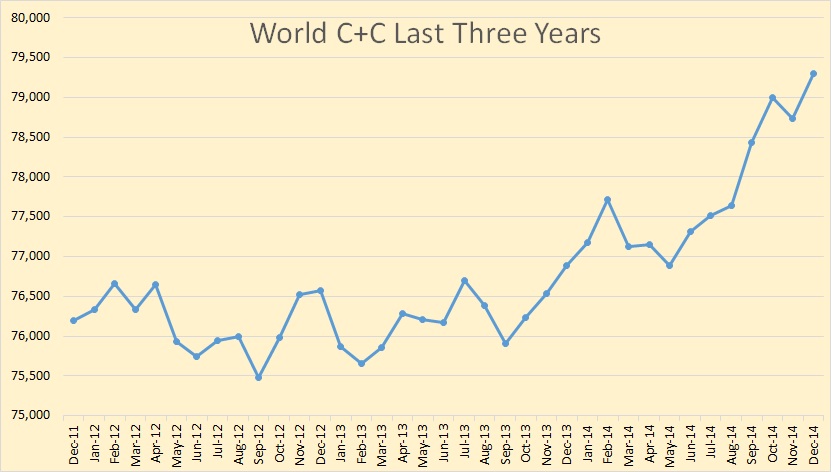
World C+C production was flat for most of 2012 and 2013 but in late 2013 production took off and has increased by about 3 million barrels per day above the average for 2012 and 2013. December C+C production was 79,300,000 BPD.
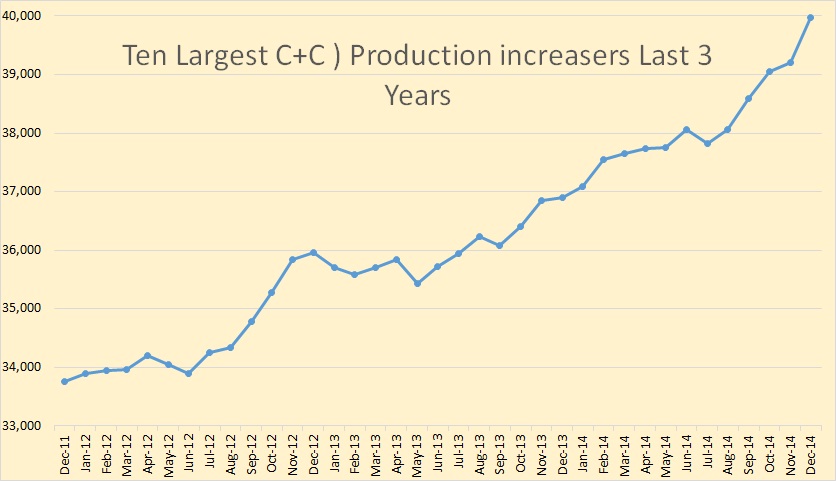
While total C+C production has increased by 3,000,000 BPD over the last three years the top ten gainers have increased just over twice as much, 6,200,000 BPD.
And just who were the big C+C production increasers for the last three years. Keep in mind this is the total change, or increase, over the last three years, not total production.
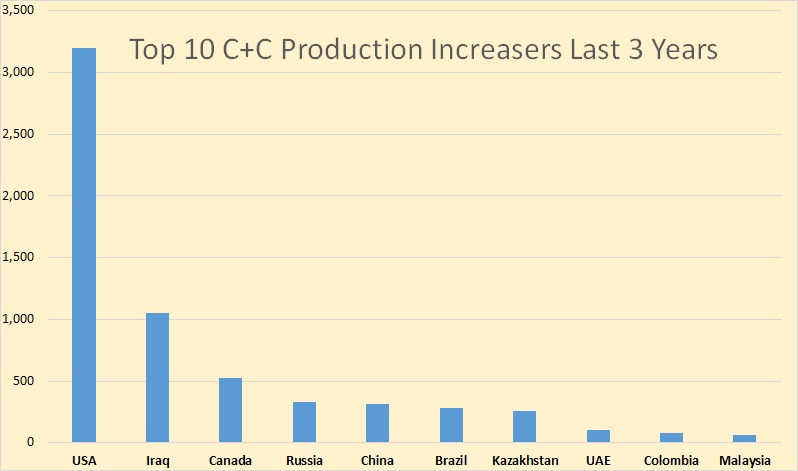
The largest gainer, by a wide margin, was the USA. Iraq and Canada were runners up and the rest were also rans.
Almost everyone else had declines.
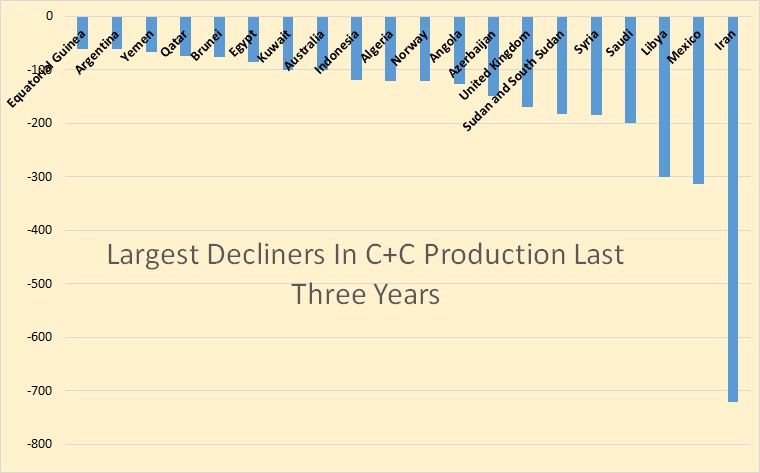
Here are the 20 biggest decliners. Iran of course declined the most but surprisingly the second largest decliner was Mexico, not Libya. Saudi, the fourth largest decliner has, since December, increased production by about half a million barrels per day.
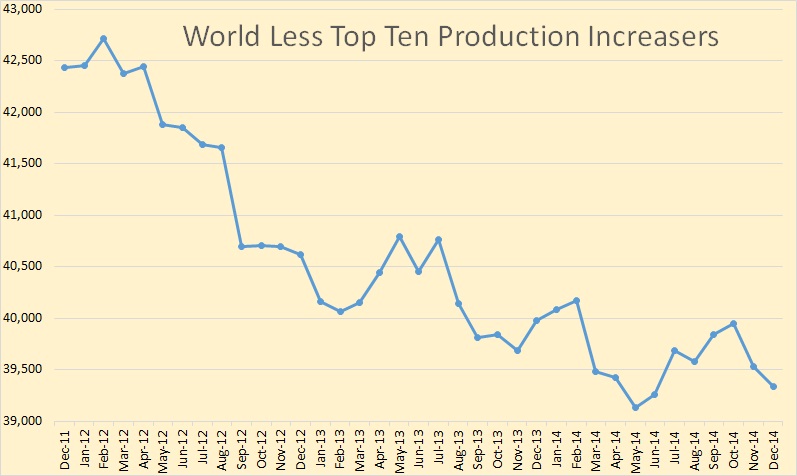
World C+C production minus the top ten gainers has declined by 3,100,000 over the three years 2012 through 2014.
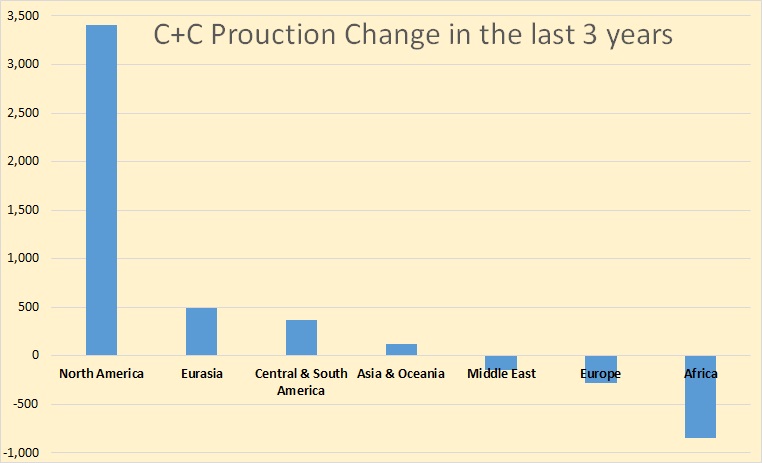
Just for kicks I decided to include production change per geological area over the three years, 2012 through 2014. As you can see it is no contest, North America wins by a large margin. However if we had the last 5 months data this chart would look somewhat different as the Middle East has had a pretty good increase over that period.
And on another subject under the “Do You Believe This” category:
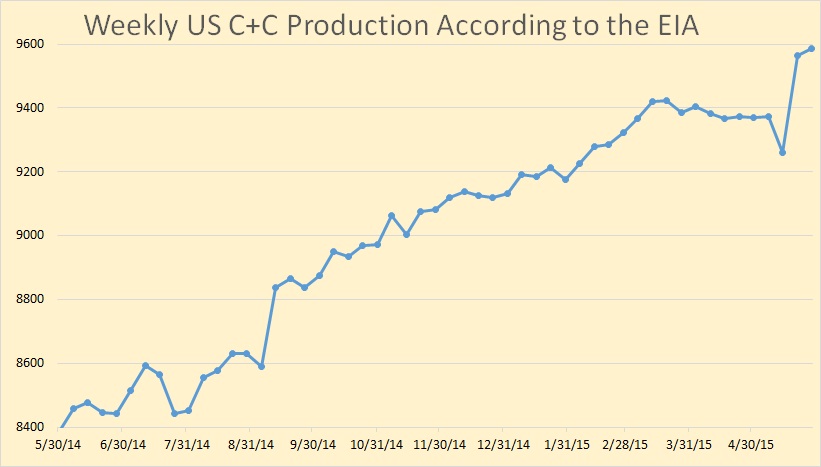
This is the US weekly C+C production for the last 52 weeks with the last data point May 29th. And no, I flat don’t believe it. Here are a few reasons why.
The AAR also reported U.S. Class I railroads originated 113,089 carloads of crude oil in the first quarter of 2015, down 17,982 carloads or 13.7 percent from the fourth quarter of 2014.
First Quarter crude oil shipped by rail is down 13.7 percent from the first quarter of 2014.
Sikorsky to Cut 1,400 Jobs, Citing Falling Oil Production
Sikorsky Aircraft Corp. says it’s cutting 1,400 jobs in the coming year as the helicopter manufacturer faces declining demand for shuttling workers to offshore oil platforms.
A helicopter maker cuts employment by 9.2 percent due to falling offshore oil production. Of course this is all over the world but definitely includes the Gulf of Mexico.
And our neighbor to the north:
Canada’s crude oil production fell in May to lowest level in almost 2 years, Barclays says
Investment bank Barclays says a “perfect storm” of events including wildfires and upgrader maintenance in Alberta are expected to have cut average national production to 3.98 million barrels of oil a day in May after peaking at an average of 4.59 million barrels a day in January.
In May Canadian crude production was 610,000 BPD below January production. But apparently even January production was not all that great.
Alberta oil production dropped by 8% between Q3 2014 and Q1 2015
Production of conventional oil and gas in Alberta — excluding oil sands projects – fell by 8% between the third quarter of 2014 and the first quarter of 2015, when oil prices crashed as a result of OPEC’s fight for global market share.
According to research firm CanOils, production fell by 56,880 barrels of oil equivalent a day during the period, primarily because of falling global commodity prices, though pipeline constraints and maintenance also played a role.
Alberta conventional liquids fell by 56,880 barrels per day during the first quarter 2015 compared to the third quarter 2014. And this was before the wildfires.
One more point:
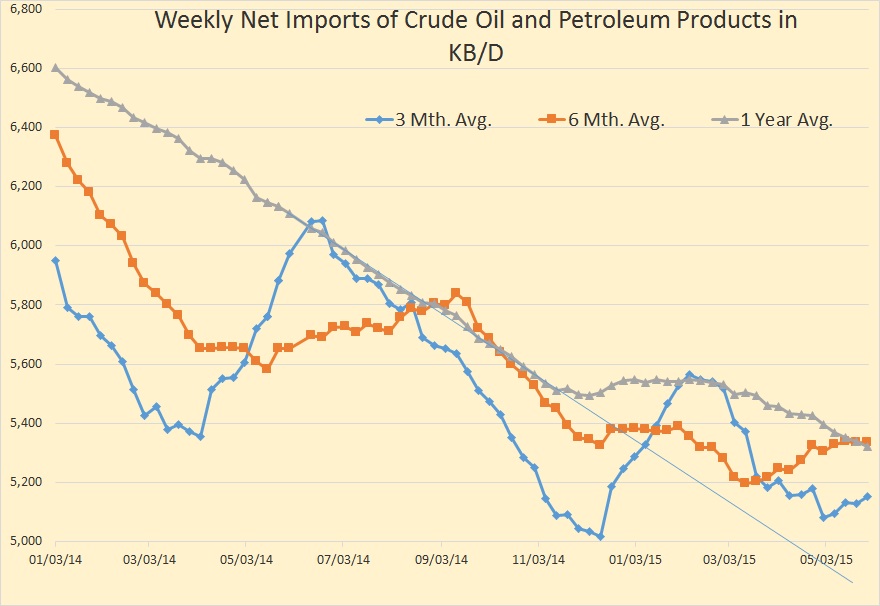
Annual net imports of crude oil plus petroleum products had been on almost a linear decline until late 2014. Now imports have almost flattened out indicating a decline in US crude oil production.
And we made the Top 10 list.
Top Oil and Gas Blogs and News Websites for 2015
___________________________________________________________
Note: If you would like to receive an email notice when I publish a new post, then email me at DarwinianOne at gmail.com .
492 responses to “World Oil Output Last 3 Years”
Hi Ron,
Nice post. Perhaps the US output is being shipped by pipeline rather than rail. I am not sure where we would find pipeline data for the US. Also the 4 week average weekly data is a much better indicator than the weekly data which is very noisy. Chart with 4 week average for the past 53 weeks below.
The EIA’s March estimate(9500 kb/d) looks too high by 100 kb/d based on the weekly data, That might be revised downward later, the EIA seems to be assuming that output is increasing in Texas, it would be interesting to hear what Mike and MBP are seeing in Texas. I would think the recent flooding would result in decreased output from Texas.
On the flattening of net imports, I would say this indicates that US crude production has stopped increasing (assuming no change in consumption), when US crude output starts to decline (again assuming no change in consumption), we should see net imports increase. So far that has not happened in any sustained manner(if we focus on the 12 month average).
Perhaps the US output is being shipped by pipeline rather than rail.
I seriously doubt that. 60 percent of Bakken oil is shipped by rail because there is no pipeline for it.
Of course the four week average is smoother than the weekly average. However the EIA says the US produced 9,566,000 barrels per day the week ending May 22 and 9,586,000 barrels per day the week ending May 29. Averaging that out over 4 weeks does not make those two figures look any less absurd.
Hi Ron,
I use the weekly supply estimates.
http://www.eia.gov/dnav/pet/pet_sum_sndw_dcus_nus_4.htm
The 4 week average for the week ending May 22 was 9393 kb/d, that looks quite reasonable to me. The data is noisy at the weekly level and should be ignored in my opinion.
Dennis, I am sorry but this weekly data cannot be ignored because the EIA says it is an adjustment. That is they had the previous production levels way too low and they are now adjusting it to what it should really be.
What jump? Record U.S. oil output due to revisions, not rigs, EIA says
The latest figures were sharply higher because the EIA incorporated detailed data from states including Texas showing that production in March was higher than earlier estimated.
What they are saying Dennis, is that they had the earlier production numbers way too low so the current data only reflects what it should have been all along.
The EIA is saying Dennis, that you should ignore the earlier data because it was wrong. The current level of 9.586 million barrels per day reflects what it should have been all along. Or something very close to that number.
Probably have to factor in that lease in Teapot Dome, Texas, that is not part of Texas recorded production. By May, I estimate that to be around 800,000 barrels a day.
Really? You believe they have production 800,000 barrels per day too high?
They show a 3,674,612 daily production from Texas in March. Adding the condensate to oil production from Texas “Production Statistics and Allowables reports, it is 3,073,479 daily. So in March is was 601,133 over. Add to that another 33,000 they came up with recently to the US Total, and add to that any drop in April and May, which I feel confident has happened by now, I think 800k is not out of the question.
”that lease in Teapot Dome, Texas, that is not part of Texas recorded production”
The more you learn the more obvious your ignorance becomes.
I am sure I am not the ONLY person who wonders about the Teapot dome that is not part of recorded production.
google the “teapot dome scandle”
Ancient history that I was already aware of.
It is even mentioned in some high school history text books.
There was nothing in the comment to indicate humor or sarcasm given the tone of the comment which seemed entirely serious to me and about CURRENT day production.
Senior moment on my part I guess.
But every once in a while you do run across all sorts of things that are not included in ordinary statistics for one reason or another mostly having to do with politics.
For instance the official ” books” that tell us how much money Uncle Sam owes leave out half of the money he has promised to pay out.
The 800k barrels per day discrepancy just about has to be involve some bookkeeping smoke and mirrors.
I jumped to the conclusion that the name of the scandal was being recycled and that some sort of Enron bookkeeping was involved.
Sorry about the sarcasm, but not believing that the government has truth as it’s primary goal has been ingrained in me since I was a non-commissioned officer in the Vietnam era. That is apolitical, as whatever the “facts” are is dependent upon what is politically expedient.
Hi Ron,
The article you linked to says the EIA weekly data is modeled data, I am pretty sure their monthly estimates are also modeled (for the most recent months). Based on Dean’s estimates for Texas, I think the EIA is wrong in that March estimate, output is probably around 9450 kb/d+/- 50 kb/d in May. Usually the EIA’s monthly estimates are pretty good, so perhaps the March estimate is pretty good, but I don’t put a lot of stock in the weekly estimates.
There has been some discussion about Texas data and final estimates of crude output by the RRC of Texas each month for the most recent month of data.
There are those that believe that these “final estimates” are pretty good so I decided to look at them closely.
I found the “final estimates” for March 2012 to February 2013 to compare them with the current reported output for those months.
I have assumed that the reported data for those months is exactly right (no estimating, that would be bad) and it probably is because there have been 27 months for all the data to come in. On average the RRC’s “final estimates” of crude output are always too low (between 6% and 14%), the average over the 12 months from March 2012 to Februry 2013 was 10%. Chart below with data downloaded from the RRC PDQ today and compared with the final estimates from June 2012( for March 2012) to April 2013 (for Feb 2013).
Link below for June 2012:
http://www.rrc.state.tx.us/all-news/052912b/
A google of “RRC Production Statistics and Allowables for July 2012”
with the appropriate month and year will give you these “final estimates”.
Congratulations on the recognition, I believe you have earned it.
Yeah, the oil production the US is reporting is far too high to actual, so the weekly report is more than questionable. Texas production is probably going south starting in April, but by sure by May, May’s permits were a third of what they were last year in the Eagle Ford. Of course, that will only be reflected in later months, as they are working on the decreased permit numbers starting in January, now. Jan through March was finishing up what they had drilled through December, so production numbers were only slightly down. A look at EOG’s projection for 2015 firms that theory, and results of my research.
Geopolitical tensions in the Middle East are a lot more than given credit for per the current price of oil. The Salafi movement has a lot more support among the Sunni than reported on. A recent poll by Al Jazeera showed that 81% of the 39,000 polled supported the advance by ISIS. So much for the outcry of the “moderate Muslims” regarding the terrorists. The ISIS cadre is increasing geometrically. My wild eyed guess is that ISIS has won, so far, and is consolidating strength before their next advance.
Thanks Guy,
A look at EOG’s projection for 2015 firms that theory, and results of my research.
Could you tell us a bit more of EOG’s projections and the results of your reseach?
These are permits from District 1 and 2 since the first of the year. I took out gas permits, amending permits, and non-horizontal wells. To include all you have to select both oil, and oil and gas, because some companies use oil only, and some use oil and gas. This is what they are going to be working on in coming months. Historically, there has been, at least, a three month period between the drill and the completion. Actually, a couple of years ago, there was a six month backlog of drilled wells waiting to be fraced. So what they have been working on through March has been mainly stuff waiting to be completed. It is impossible to get a clear picture of a month’s completions, or even the prior month, according to what is posted as completions. It just takes a while for them to post it. That doesn’t necessarily hold up production statistics, but it makes the completion query pretty useless. You have to wait for the production statistics before a clear picture of what has been done in a particular month. However, just looking at a mass of completions, individually, it appears we are mainly in the stuff permitted since January.
EOG has stated that their production in the first quarter was very close to what they had last quarter, at about 300k barrels a day. However, in the second and third quarter they expect the production numbers to look close to 260,000 barrels a day. Slightly over a 10% drop per quarter two and three, with an uptick in production in the fourth quarter to be closer to the 300k mark.
EOG has the capacity to operate like that, because their cash flow and lease area allows for them to negotiate with drillers and frac operations to do that. Other companies will not fare as well. Still, simple extrapolations of the best case scenario shows that current estimates of the drop are fairly Pollyanna.
Hi Guy,
I expect that the Eagle Ford will be slowly declining, have you looked at the Permian Basin? Maybe things are picking up there. For the Eagle Ford you can look at the RRC graphic that gives the wells on schedule, I am not sure how accurate it is.
http://www.rrc.state.tx.us/media/28857/eaglefordshaleplay2015-06-lg.jpg
http://www.rrc.state.tx.us/oil-gas/major-oil-gas-formations/eagle-ford-shale/
In May there were 281 wells added to the Eagle Ford oil well schedule (8448 oil wells on schedule on June 1 and 8167 oil wells on schedule on May 1, 2015.)
On April 2, 2015 there were 8026 oil wells on schedule, so only 141 new oil wells were added in April 2015.
For March 2, 2015 there were 7894 oil wells on schedule, so 132 new oil wells in March 2015.
On Jan 7, 2015 there were 7574 oil wells on schedule, so 320 new wells were added in Jan and Feb (about 160 wells each month).
Short story, things picked up in May 2015, average wells added per month from Jan to April was 148 wells per month, in May the number of new wells added nearly doubled (an 89% increase=281/148).
We do not have this kind of data for the Permian Basin.
This data is dependent on what has been posted on the RRC site by the companies. As I said, they can include the production to the RRC, but actually not post the completed well for many months. It is not a good reflection on what is currently happening in the Eagle Ford. I posted what has been permitted per month in District 1 and 2 in another post on this discussion. Detailed information on this can be obtained through their query system. Contrary to what this depicts, activity has NOT increased in May, it has decreased.
To give an example of the difficulty in determining what is actually happening from looking at the completion reports, I will give an example of District 1 completions for May which had 340 wells posted. That is a large number until you drill down and analyze. The first 210 completions posted were submission dates from February back to 2014. Some of those were actually completed in 2013, but their IP rates would indicate that they could have been plugged soon after. Of the remaining 130, if you drilled further down, you would find a significant number of those that had submission dates in May, but the completions could have been six months ago. You can analyze some of what is happening by looking at the companies who normally post completions the month after they are completed. The completions are mainly for permits issued after the first of the year, and they are already beginning to post some of the completions done in May during May. That is the best I can come up with in analyzing what is happening, but permits are definitely down in May, and completions APPEAR to be on the decline. However, the production data that comes out in August will give the only clear picture of how May did, as they could keep posting May completions into the next two months.
The Permian spans several districts, but the main district appears to be District 8, which in May showed the first major decrease in permits (about a third of normal). I don’t keep up with the Permian that much, but know that it is more expensive to drill. My property is in the Eagle Ford.
There are two ways you can determine if activity is picking up. The first is the number of permits issued. The second is quicker, you just need to read the full Baker Hughes well report. It lists drilling by Field name. In either case, nothing supports the supposition that activity is increasing in the Eagle Ford, or the Cline (Permian). At 59 a barrel, you probably won’t see it increase much, if any. Companies like EOG can make money at that level, but it is inane to waste all of your reserves at that oil price level.
Hi Guy,
Permits and drilling are important, but the key data is completions, the well doesn’t start producing until it is completed. Permits are usually pulled way before drilling (6 months or more) and at these prices a lot of wells are held back in the frack log waiting on higher prices.
Eagle Ford output declined from a high of 1470 kb/d in December to 1412 kb/d in Feb 2015, which is the latest month I have estimated. If more wells were completed in May than you think (in the range of 160 to 200 wells) then output in the Eagle Ford may be rising slightly. Trying to dig the data out of the RRC website is a nightmare.
Hi Guy,
So when the RRC says there are X wells on the oil well schedule as of June 1, that is incorrect?
Or is this a poor reporting issue for the RRC, where it says 280 oil wells were completed in May, but in fact these were completed over the past 6 months and are only now showing up in the system.
Are there computers in Texas? I find it hard to understand the system down there. 🙂
Not hard. It has the largest number of varied companies operating in the largest state south of Alaska within the largest oilfields in the US. You expect all of these to operate in unison like a massive concert? Take a look at the number of wells in just the Eagle Ford, again.
Hi Guy,
In that comment that follows I had misunderstood Guy to mean it is not hard to find the data on completions, but I misread, he meant “not hard” to understand why Texas seems to handle the data like it is 1960 instead of 2015. 🙂
I appreciate the information. Maybe you have a subscription to the RRC data and that makes it easier or you get your info from Drilling info, which is supposed to be nice (I don’t have that either) or you know tricks for using the free database that I don’t know.
Luckily Enno Peters shares data from the NDIC that he puts in an Excel spreadsheet which makes things pretty easy relative to Texas data at least for me.
Do you have month by month completion data for oil wells for the Eagle Ford?
If it is not hard to find that, could you do so and share it here? (the last 12 months would do, but the last 4 years would be better). According to the following web page there were 222 oil well completions in the Eagle Ford in April 2015.
http://eaglefordshale.com/news/eagle-ford-leads-the-state/
Excerpt from page linked above:
Statewide, well completions were up in April 2015, with operators reporting 1,867 oil, 314 gas, 125 injection and one other completions. In april 2014, there were 1,012 oil, 92 gas, 21 injection and four other completions. Total well completions for the year are still down by several thousand over this time last year.
Activity in the Eagle Ford continues lead the state in April with 176 permits to drill oil and gas, 222 oil completions and 94 gas completions.
If the information from the blog above is accurate, it looks like things were slow from Jan to March, but picked up in April. I will look at the Eagle Ford output data the next time the RRC updates production data, last I checked output had been relatively flat from Sept 2014 to March 2015 (peak in Dec 2014) at around 1440+/-30 kb/d for C+C in the Eagle Ford over that 6 month period.
I think the problem arises because they don’t measure cumulative production on a monthly basis. And they aren’t expected to give an estimated number. I’m used to operations where the tanks are gauged in the early morning, this is merged with the lact meters, and the production is attached to the area drilling report. This means that by lunch a consolidated daily is available all the way to the company president.
Hi Fernando,
I would think this data is available for most of the larger companies (which probably produce 80% of the oil) and could easily be gathered by the RRC, by requiring the largest 30 oil companies in the state to report this data to the RRC on a weekly or monthly basis.
From this sample of data(80%) from the large companies an excellent estimate for the state could be made. When I look at the RRC completions database it is surprising that there are many wells where the completion paperwork is submitted 12 to 24 months after the well is completed. This may be the reason that the oil is reported by lease rather than by well (as is done by the NDIC). It makes figuring out what is going on very difficult using only public data from the RRC. Most oil leases have 4 or more wells so finding a well profile when the data is reported by lease is difficult.
Well, we know what RRC districts that the Permian Basin encompasses, so you could just query the data for those districts as a proxy for the Permian Basin numbers. If you don’t know, it’s 7C, 8, and 8A. I have a hard time posting images so here is what it looks like:
http://www.rrc.state.tx.us/media/1469/permianbasinactivepermits.jpg
Hi MBP,
Thanks. The Eagle Ford Page tells me how many oil wells are on the schedule each month. The PDQ might tell me how many oil leases are on the schedule this month, but figuring out the number of wells and how it changed from last month is beyond me. The output reporting for the PDQ is not very complete, so is not all that useful, but I do the best I can using Dean’s data and the ratio of Permian basin output to statewide output to guess at Permian basin output ( this assumes that the ratio of Permian ti statewide output does not change as all the data eventually gets reported and that Dean’s guess is fairly accurate). I will do that at the next RRC update, in February Permian output was up from January.
I’ll add my congrats for making the Top 10 list.
Here’s an article I was sent, another very interesting article by John Kemp:
Crude processed by U.S. refiners gets lighter and lighter: Kemp
http://www.reuters.com/article/2015/06/02/usa-refineries-feedstock-kemp-idUSL5N0YO3JA20150602
Of course, in regard to running out of easy options, my thesis is that US refiners pretty much hit this point in late 2014.
And as we have previously discussed, I wonder how much global demand there may be for the light stuff. But a lower price works wonders for demand, and I suppose we could see a global shift away from diesel powered transport to gasoline powered transport.
In any case, global refineries were designed to handle the API gravities on the following chart:
http://i1095.photobucket.com/albums/i475/westexas/APGravityVsSulfurContentforCrudeOils_zpsc28e149c.gif
While virtually all of the recent growth in C+C supply has been on the very light end (40 API plus C+C):
http://i1095.photobucket.com/albums/i475/westexas/US%20Crude%20Oil%20Production%20by%20Type_zpsso7lpqgq.png
Diesel and kerosene did not evolve for power use and aircraft use whimsically.
There are reasons.
If those applications chose a less efficient or safe or easy or whatever approach and chose gasoline, that consumption will rise.
Of course this won’t have to affect price because that can be dictated, but there just won’t be much of it and scarcity stops being addressable by price if price gets trumped by decree. “You WILL drill, and the CB will make up any losses.”
Entirely credible. If you’re scarce in THAT environment, game over.
Jeffrey,
Thanks for the excellent article by John Kemp–it should be useful to everyone who comments here.
Ron, congratulations for the recognition for all you do. There is no replacement for this site.
Two others that I’ve found useful are Sandy Fielden’s posts at rbn energy, and Downstreamtoday which is a good source for current information on refining, pipelines, and LNG.
Ditto on the congratulations Ron!
Don’t forget I predicted long ago that some day the msm media will be calling you for interviews!!
That will be a recognizable turning point in the peak oil debate for sure- and a damned good indicator that barring miracles technical AND political we will be seeing less oil year over year thereafter.
Any of us holding airline stock should definitely get rid of it the day the calls start coming!!!!!
”I suppose we could see a global shift away from diesel powered transport to gasoline powered transport.”
It is probably not big enough to show up in the statistics yet but there is already a noticeable movement BACK to gasoline in medium duty trucks among folks who use them intermittently rather than continuously. The average farmer shopping for a straight truck rather than a tractor trailer rig is most likely looking at gasoline very favorably today.
Ditto anybody else who uses his truck only occasionally or intermittently.
You have to put a lot of miles on a so called two ton or ” straight ” truck these days to justify the diesel engine option and the higher price of diesel -in ADDITION to the much greater hassle of dealing with ICC and other regulations involving interstate travel. You have to do a good bit of extra bookkeeping with diesel that you don’t have to do with gasoline.
Everybody in a forum such as this one knows already that diesel is nowadays more expensive than gasoline thus negating most of the fuel economy per gallon advantage.
Gasoline engine fuel economy has improved faster than diesel economy and gasoline engines are also nowadays almost comparable to diesel durability in a medium truck.
The difference in durability only comes in some years down the road. Overhauling a gasoline engine ten years from now is a better deal than laying out the extra thousands TODAY for a diesel engine.
These factors taken all together have resulted in a strong increase in demand for GASOLINE fueled trucks at or near the commercial size designation – sixteen tons gross- compared to similar diesel powered trucks.
Of course we have no way of knowing for sure if the price per gallon will continue to favor gasoline or that the various grubby pawed regulators won’t change the regs so that going across a state line with a gasoline fueled truck will be equally as troublesome as going with a diesel.
And for what it is worth all the talk about diesels and torque is just about one hundred percent bullshit repeated over and over by people who have never driven trucks. HORSEPOWER moves loads. An engine that has a rep for having enormous torque is simply an engine that produces a lot of horsepower at low revolutions per minute.
Trucks have transmissions that enable to driver to keep the tach up where the power is except in REALLY old models that had as few as four forward gears. I can’t remember the last time I saw a four speed truck ( as opposed to a pickup on steroids ) on a serious job but there are still a very few old six speed MACKs running commercially. Trucks these days have seven to ten gears with thirteen not all that unusual. All the ones I know of that have thirteen are diesels. Excepting Macks eight or nine forward gear transmissions were typical from the fifties forward and almost universal from the sixties forward.
OUR 1953 Ford f 700 ” two ton” which hauled eight tons (seven legally , lol) had a five by two transmission giving nine effective gears. The next to last one ”low five ”was was almost a perfect duplicate of ”high four” and so went unused most of the time. The 1953 Chevy school bus that took me to school for years had eight forward gears but only six of them were used on a regular basis.
Torque really mattered for driving ease and pleasure back in the days when cars and pickup trucks had only three forward gears.
It hardly matters at all nowadays since just about all light duty vehicles have automatic transmissions that downshift when you floor the gas pedal. Most any modern two liter or larger engined four banger econobox will match an old American V8 family car ( not the the hot rod models) to fifty or sixty mph.
If extra light oil continues to make up a large share of the total crude supply it is a safe bet that some refineries will be modified or purpose built to take advantage of it. . If gasoline STAYS substantially cheaper than diesel fuel the commercial vehicle fleet mix will move toward gasoline as well.
There is NO WAY to justify the purchase of a light duty truck with a diesel engine on a dollars and cents basis. You would have to run the hell out of it for years and years and even then you might not recover the additional expense in fuel savings.
Better to invest the difference in purchase price in something that pays off such as a heat pump or insulating the attic or triple paned windows or a big screen tv.
A big screen tv will keep you home and out of the truck and the local sports bar a substantial number of evenings and weekends over a period of years.Cocooning they call it. Less fuel burnt, fewer DUI ‘s.
But it won’t impress your ignorant buddies and dumb girls nearly as much as a noisy diesel engine and extra fat wheels. Nor will it be quite as good when it comes to showing your friends and coworkers know you have the money to pay for one.
I would three times rather drive a new pickup with a gasoline engine just to avoid the racket. A properly maintained three hundred horsepower farm tractor makes less noise at idle than a new diesel pickup so help me sky daddy. This ain’t because the big three don’t know about good mufflers. It’s about marketing. Pretty much one hundred percent marketing.
Yair . . . I agree with much of what you say but the common 2.5/3 litre common rail turbo after cooled diesels go pretty well but are not yet common in the US I believe?
Hi Scrub,
The new small diesel engines with these features are amazing. To be clear I have nothing at all against diesels per se. My arguments are based on the initial price premium, the higher price of diesel fuel , and in the case of occasional highway commercial use the additional regulatory hassles in the USA.
One more thing I will add. The legendary durability of diesel engines is due to their historically being manufactured to extremely high standards for strictly heavy duty commercial use and the relative simplicity of the design.
The newer ones going into light duty vehicles are not much if any better constructed than gasoline engines. The engineers have trimmed out the extra weight that meant strength and rigidity. Just about every moving part is lighter by a mile, the block is thinner , less rigid. The revolutions per minute red line has been moved from about 2200 or so to around 4000 in order to get more horsepower per pound.
The simplicity in comparison to gasoline is all gone, excepting the spark ignition system which is generally bullet proof on modern gasoline engines .
Nothing is built to a COMMERCIAL or INDUSTRIAL standard on a diesel automobile engines. Bottom line, nobody should expect them to last much if any longer than a comparable gasoline engine.
Some diesel engines used in recent years in cars and pickup trucks give a LOT of trouble.
Nevertheless diesels are inherently better engines in terms of fuel efficiency.I do expect them to continue to gain market share in light duty vehicles on a world wide basis and to hold onto their near one hundred percent market share in HEAVY duty vehicles that are used long and hard day after day.
But a six or seven thousand dollar diesel engine option in a pick up truck is still a dollars and cents mistake for ninety percent of the buyers.
I have an 8 year old diesel and it has never required any repairs. I only take it to periodic maintenance.
Yair . . . Gotcha OFM. Well considered comments . . . but things do change from region to region and of course with fuel price all other things being equal.
The current crop of petrol engines in small pickups go well enough running light but try and tow their rated load (especially with auto) and the consumption can go out of sight.
Common on the retirement bucket list is to “go around the block” that is to drive the coastal road right around Australia, only a masochist would do it with a petrol engine towing heavy.
Cheers.
.
HI Fernando and Scrub,
My twenty four year old gasoline fueled Chevy pickup truck with close to 300 k miles ( almost 450 kilometers ) has never had an under the hood repair except for replacing the starter motor( twice) , alternator (twice), and water pump( three times) – all of which are necessary on a diesel as well. If I were willing to pay for OEM parts most likely none of these would have needed replacing more than once but an eighty dollar aftermarket alternator is easier to pay for than a three hundred dollar alternator.
The dealer warrants a new alternator for six months on such an old truck. The local auto parts store warrants it for the life of the original owner. -Meaning it was replaced the THIRD time at no charge. Ditto the starter motor. A third the price with a lifetime warranty. Ditto the water pump.
Dealer parts departments are to be avoided if money is an issue- unless the part is hard to get so that the labor bill for replacement outweighs the price. I work on my own vehicles.
If you are going to run a truck long and hard for years on end you most definitely want to at least THINK ABOUT a diesel, even considering the higher price of fuel and the higher purchase price.
But relatively few of the light trucks sold in this country actually get used that way. The ones that do are mostly owned by independent contractors who let their ego involved and buy a diesel thinking it’s a smart move. It is actually mostly a STATUS purchase.
Look around at the trucks that belong to construction companies – or utilities – in the USA and the pickup trucks driven hard every day by supervisors are virtually all gasoline fueled.
The bean counters will NOT pay for diesel pickups.
But any truck driven often enough to accumulate a lot of miles and that weighs over about ten thousand pounds ( four thousand kilos, about) in working trim is almost for sure a diesel.
The biggest load that is usually hauled in a typical American pickup truck is a keg of beer or a new piece of furniture. Only a smallish fraction of them get any regular use other than as a passenger vehicle. Even among my neighbors who are farmers a pickup is used a lot more as a car than as a work vehicle- even though most farmers these days own cars as well.
Once a man gets used to driving an American truck such as a Ford F150 he usually PREFERS to drive it even if there is a NICE car in the driveway .
The seating position is MUCH superior , you can see MUCH better, and the ride is quite satisfactory. You get in and out without bending over or banging your head.
BUT load one down and hook on a heavy trailer – then is when you want the diesel for fuel economy.For sure.
The fuel economy factor is much more important in Europe given high oil taxes.
Yair . . . thanks for reply OFM, I enjoy your down to earth explanations and examples of the “American way”.
Cheers.
Hi Jeffrey,
Great article, thanks.
It seems the simplest solution is simply to allow crude exports. The law forbidding crude exports outside of North America will just lead to inefficient refinery operations. There are other refineries in the World(in Europe) which can handle the light crude just fine, the excess light crude should be sold to our allies in Europe.
Dennis, there is no law against exporting condensate and a lot of condensate is exported to other countries.
Hi Ron,
It is certainly true that estimates can be off, that will always be true. The EIA’s estimates are far better than the estimates by the RRC for the most recent months and Dean’s estimates tend to be better than either. I have no idea about Oklahoma, New Mexico, I believe I said that the Texas data was likely not correct, see below taken from an earlier comment.
Based on Dean’s estimates for Texas, I think the EIA is wrong in that March estimate, output is probably around 9450 kb/d+/- 50 kb/d in May.
So my take is that the EIA estimates are pretty good, not perfect, the data from many states (North Dakota being an exception) for the most recent 6 months is not very good so the EIA does the best it can at guessing.
Dennis, I don’t think you understand my argument. My argument is that the EIA estimates are a joke, A fucking joke! Below are their Texas estimates, in thousand barrels per day.
    Texas Oil	Thousand BPD Change
Apr-14	3,065	93
May-14	3,078	13
Jun-14	3,144	66
Jul-14	3,203	59
Aug-14	3,251	48
Sep-14	3,240	-11
Oct-14	3,331	91
Nov-14	3,415	84
Dec-14	3,492	77
Jan-15	3,553	61
Feb-15	3,614	61
Mar-15	3,675	61
Now do you actually believe that Texas C+C production was anywhere close to being up exactly 61,000 barrels per day in January, February and March?
The RRC estimates can be compared to the actual production on the RRC site. They update the production figures monthly back to when they should have been posted. During the past two years, they have not varied to their estimates by over 2 million per month, some under. EIA has not adjusted their figures to close to the RRC estimates or production figures during that time. The EIA estimates are in the stratosphere, no where close to Earth.
Ron,
Time will tell what the actual output levels were in TX.
I stand by my assessment of the EIA estimates, they are not as good as Dean’s estimates and they are far better than reported RRC data. Without Dean’s analysis, they would be the best estimates we had. More on TX EIA C+C estimates down thread.
It looks like the EIA estimate is simple, they take the most recent 12 months that they are confident about (in this case Jan to Dec 2014 and find the average monthly increase (about 60 kb/d) and simply extrapolate the linear trend.
Not very sophisticated, I agree, but probably the best they can do. A better estimate would probably be about a 40 kb/d increase each month, but we will see how Dean’s estimates evolve.
Dennis, Dean’s estimates are very good but you cannot compare apples and oranges. The RRC data is not an estimate. It is just all the data that has been reported to the RRC at a given point.
You keep referring to, or implying as in the above post, that the Texas RRC data is an estimate. It is not. When the RRC makes an estimate they say so and put the word estimated in bold so there can be no doubt that this is an estimate. All other RRC data are not estimates.
RRC PRODUCTION STATISTICS AND ALLOWABLES FOR JUNE 2015
The Commission’s estimated final production for March 2015 is 84,879,948 barrels of crude oil and 533,174,979 Mcf (thousand cubic feet) of gas well gas.
That estimate is for crude only and does not include condensate. That works out to be 2,738,063 barrels per day or 11,117 barrels per day less than they produced in February. So the Texas RRC is estimating that crude only production fell by 11,117 bpd in March while the EIA estimates that Texas C+C rose by 61,000 barrels per day in March.
I will bet you $100 that the RRC estimate is much closer than the EIA estimate.
Hi Ron,
I said that the EIA estimates are likely to be off, I think the March estimate should be 60 kb/d lower than reported, the RRC “final estimates” have tended to be low by about 15% over the past 3 years or so, until recently, where I agree that the EIA may be overestimating the EIA estimates have been far better than RRC estimates.
It is pretty difficult to do a comparison of C+C to “crude only”. The only way to do it is to look back about 18 months or further at reported RRC data and EIA estimates and RRC final data. I have done that several times and shown that the EIA estimates are far superior to RRC estimates in those cases. You choose not to believe the data.
Maybe Dean could look at his estimates vs the RRC “final” estimates, I would be willing to bet that Dean’s estimates will be closer than the RRC “final estimate”.
I am not going to bet against myself, where I have already agreed that the EIA estimate from Jan to March for Texas C+C is too high (by about 21 kb/d in Jan. 42 kb/d in Feb, and 63 kb/d in March).
the RRC “final estimates” have tended to be low by about 15% over the past 3 years or so…
15% of what? Total production? I doubt it, That would be almost half a million barrels per day. 15% of production change? That would not make any sense because if there was little change then 15% of almost nothing would be almost nothing. Or if there was actually a decline, as there often is, what is 15% of that?
Ron and Dennis, maybe it would help if Dennis stopped using the word “estimate” for everything that the RRC releases. I seem to recall Mike getting quite annoyed with Dennis about this and making absolutely clear that Texas does not and is not going to, do their royalty and tax calculations based on estimates. I don’t recall ever seeing a RRC “estimate” and IIRC Mike basically said that neither the producers, the royalty owner or the state, had any interest in producing “estimates”. What Ron publishes every month includes what would most accurately be described as preliminary data.
I get the sense that Dennis continues to refer to RRC preliminary data as “estimates” which is just plain wrong. My guess would be that, most long time readers of this blog understand how the RRC data evolves as the detailed production data gets included over time. If that is the case, Dennis is one of the few who just don’t get it!
Hi Ron and Islandboy,
Island boy first,
All data reported is an estimate, nobody knows exactly how much oil is produced. The state of Texas makes an “estimate” each month of what they think output for the state will be once all of the production is reported, I am well aware that the reported output increases over time.
The final estimate takes the following form:
http://www.rrc.state.tx.us/all-news/022713b/
The Commission’s estimated final production for December 2012 is 51,069,243 barrels of crude oil and 485,269,993 MCF (thousand cubic feet) of gas well gas.
The RRC PDQ is found at link below:
http://webapps.rrc.state.tx.us/PDQ/home.do
now to Ron’s question,
As to “15% of what”, I overestimated, the final estimate is 13% lower than the reported crude in the PDQ.
The Dec 2012 crude is 57,733 kb in the PDQ, so
57733/51069=1.13 so the estimate was 13% too low relative to actual reported output.
All data reported is an estimate, nobody knows exactly how much oil is produced.
Dennis, that statement is just flat ass wrong! The RRC does publish an estimate as I linked to above. But to show that it is an estimate they put the word estimate in bold so there can be no doubt it is an estimate.
All other data they publish is the actual data reported from the field and is never estimated.
The data is preliminary it is not an estimate. Preliminary means incomplete, it does not mean it is an estimate.
Dennis, there is a difference between preliminary data and estimated data. You should accept that hard ass fact and stop saying the Texas RRC data is an estimate.
The word estimate means a guess. When you call the Texas RRC data an estimate it gives the false impression that this is the Texas RRC’s best guess as to what was actually produced that month. It is not that at all. It is all the data received by the RRC for that month. It was the actual totaled data for every barrel reported. No estimate whatsoever.
Hi Ron,
Numbers are never exact when they are a measurement, all data is inexact and subject to revision, you have a different understanding of estimate than I do.
From the Merriam Webster’s website:
http://www.merriam-webster.com/dictionary/estimate
Full Definition of ESTIMATE
1
: the act of appraising or valuing : calculation
2
: an opinion or judgment of the nature, character, or quality of a person or thing
3
a : a rough or approximate calculation
b : a numerical value obtained from a statistical sample and assigned to a population parameter
4
: a statement of the cost of work to be done
You use estimate as 3a I use 3b. The output of oil is always an estimate in my view, some estimates are better than others.
The “reported output” by the RRC is not accurate if one thinks that it represents total state output, and many people do.
After 24 months it is probably close to correct, but until 24 months have past we have to estimate what the actual total output is.
Are you ok with reported output, when referring to Texas data?
I do not consider an estimate to be a pejorative as you (and others) seem to, I use the term interchangeably with “data”, all data is an estimate in my opinion.
Dennis, you are nitpicking. An estimate is a guess, a measurement is never a guess even if you’re measuring interment is imperfect.
Calling a measurement an estimate will only confuse the matter. If we go by your criteria almost every bit of data ever collected is an estimate.
Your chemistry professor asks you:
1. Is this measured data?
or,
2. Is this an estimate?
If you say “both” then they are justified in saying: “Get the fuck out of my laboratory.”
http://en.wikipedia.org/wiki/Measurement#Difficulties
The good student would say, “fine”.
Dennis, Texas does not estimate its oil production. Every barrel extracted from the subsurface is accounted for; it is how billions of dollars of revenue each month is disbursed to royalty owners and how billions of additional tax dollars indirectly benefits 28,000,000 Texans. The information the TRRC reports is accurate at the time; it adjusts that data in ensuing months for the benefit of the “public” and data driven peak oil “experts” like yourself. Some of the statements you make regarding this matter are laughable.
The disinformation you spread about how Texas reports its production serves no one and creates doubt and mistrust to people that read this blog in search of answers. Fortunately I don’t think too many people pay any attention to your opinions about this TRRC-EIA estimated production horseshit. I hope not anyway.
We know what we are doing in Texas; our oil check book is balanced. Your beloved EIA, thankfully, has nothing to do with that.
Mathematics and model making does not make the world go round. The real deal is that in Texas, barrels equal money and we, by Gawd, know how to manage that money.
Mike
IIRC this is why Mike was so annoyed by Dennis and his insistence that the RRC “estimates” were so bad. There are three primary parties with interest in the data as Mike was so clear to explain.
There’s the mineral rights owner who expects to get paid a portion of the revenue earned from each and every barrel produced from their property. There is the state which intends to collect some taxes for each and every single barrel produced. Last there is the well operator that has to pay the the mineral rights owner and the state out of the revenue that they get from the sale of each and every single barrel they get out of each well. There lots of other people, including employees of the three main parties who depend on the money earned or paid for/by each barrel of oil.
Mike’s point was that when it comes to RRC data, you are dealing with peoples money, the money that is earned and paid out to/by people in Texas for the production of oil. I don’t think you or The RRC or anybody else want to be playing fast and loose with a Texan’s money!
edit: I had not refreshed the page recently so I did not see Mike’s contribution above which validates my point.
Thank you, Mr. Island. And to Mr. Patterson, as well; both of you seem to understand this issue very well. We do not “estimate” production in Texas. It is a disservice to this blog to say otherwise.
Mike
Hi Mike,
So I would be interested to know, when you produce oil what is the margin of error on the data.
For example, I would imagine that your data would not be perfect, say to the nearest milliliter. Is that correct?
So is the reported output not an estimate of the actual amount?
I will refrain from referring to Texas data as an estimate, even though all data is an estimate from a scientific perspective (even for chemistry professors).
We will assume that Texas data for crude and condensate is known exactly to the nearest milliliter. 🙂
For everywhere else, the data will continue to be estimates.
Hi Islandboy,
Texas does do estimates as Ron pointed out above.
Those estimates are not very good.
The reported data may be “accurate” at the time, as Mike says, if incomplete data can be considered accurate.
Mike is probably not aware that it takes about 24 months for all the data to be in in the RRC PDQ.
He seems to think it takes about 6 months for the data to be in, maybe he has access to better data than I do, the RRC PDQ data is takes 24 months before it is complete (which is the correct way to judge accuracy in my opinion.)
For example I downloaded data from the RRC PDQ in August 2013 with the latest reported data June 2013. Data from Dec 2012 for that download for TX C+C was 62,702 kb, currently the PDQ reports 68,842 kb for C+C output in Dec 2012, so the reported data in August 2013 for 9 months earlier was 9.8% too low. For data downloaded from the RRC PDQ in Dec 2013 with Oct 2013 as the latest data point, data from 6 months before the most recent data from April 2013 had TX C+C at 66,107 kb, currently the reported output is 71,976 kb for TX C+C in April 2013, so the Dec 2013 reported data was 8.8% too low (assuming current data is exactly correct).
I don’t really care about this discussion, but an estimate to me means something different than incomplete data.
An estimate seems to suggest that they are taking what they know and filling in holes to give a best guess.
Incomplete data would suggest they are giving you everything they know at this point and if they get more later, then they will update it.
So the estimate is a “rounded” number and the “incomplete data” is an exact number, which may or may not be changed later on.
Dennis,
You’re missing the point. If you go to the station to fill your tank with fuel and it comes to X.xx gallons for $Y.yy then you bought EXACTLY X.xx Gal because that’s EXACTLY what you paid for.
If there were a few milliliters more or less that finally got into your tank that’s irreverent. And, if a refiner pays you for 50,000 barrels of oil then you produced EXACTLY 50,000 barrels of oil.
The accountants agree with this, the state agrees, the producer agrees, everyone agrees except, apparently, you.
Hi Doug,
Ok, if you are convinced that measurements are exact, that is fine. I consider all data to be an estimate, I guess I learned science differently from you. To me, estimate does not have a negative connotation. I will refrain from using the word for anything to do with oil.
Jean Laherrere thinks it is pretty silly for oil data to be reported as precisely as it is, he know a lot about the oil industry, perhaps not as much as you or Mike ( though I would be surprised if that is true), but definitely a million times more than me. For any one to claim that output is known exactly to the last barrel (or perhaps to the last milliliter) is beyond my comprehension.
But I will yield to the mob that thinks measurements can be made exactly. Heisenberg must have been wrong.
http://en.wikipedia.org/wiki/Uncertainty_principle
Ok, if you are convinced that measurements are exact, that is fine
It seems to me that what people are saying is that in terms of accounting and taxes, these numbers are being treated as “exact.”
Hi Boomer,
Yep.
Dennis,
I think the debate is about measurement error versus adjustments made by analysts, ex post facto.
It’s one thing to gather data using generally accepted measurement methods, and it’s another to have an analyst use adjustments, such as seasonal adjustments, projected incompleteness adjustments, etc.
The line is pretty fuzzy, no doubt: almost all measurements involve many “factors”, “multipliers”, “content adjustments” (e.g., water, NGLs), density (which varies by temperature and many other variables), chemical composition, etc.,etc., etc.
I guess what we’re *really* talking about is transparency and general consensus about accuracy.
Dennis, water content in the sales oil is what seems to cause the largest measurement headaches in large volume operations. I’m not familiar with small volume sales.
Hi Fernando,
I tend to think of all data as having some level of uncertainty, thus if one measures a liquid it will have some degree of error in the measurement and thus is an estimate of the actual amount.
Perhaps in the oil industry you guys have figured out a way to eliminate all measurement error and values are known exactly.
The idea that we know exactly how much oil is produced seems pretty silly to me.
I will just pretend I am an accountant and that this makes sense.
Dennis, it’s important to differentiate the instrument accuracy from the legal/commercial aspects. The legal/commercial numbers we use to pay royalties and taxes are absolutely right to the significant figures specified by the ruling bodies. This could be one milliliter in some jurisdictions if they choose it that way.
The larger the measured volume, the easier it is to have an “accurate” measurement. Volume measurements using lact units (special devices which meter the sales stream and sample periodically to have the water cut and oil properties properly established in a lab) are very accurate. But I assume small operators use tank measurements, these are less accurate. But once they are set and accepted by the regulator they tend to be 100 % right. I’ve seen appeals to sales made 30 days after the fact, but those involved tanker loads, and were very controversial.
I haven’t kept track of how Texas does it, evidently they don’t require operators to report on schedule, which is quite unusual. But there’s a need to split the two worlds. I wouldn’t expect end of the month reports for a large complex like Texas to globally have more than say 0.1% error, meaning that the production should not change more than that over time. Texas can have a better system put in place, but it’s not a priority. And this is a bit troublesome. It allows those who have an inside view to trade oil with an advantage.
Hi Fernando,
I guess the difference is one’s understanding of the word estimate. To a scientist all measurements are an estimate and estimate and data are terms that are used interchangeably as all data is an estimate. To the non-scientist estimate means a very rough guess, that is not the way I use the term, in that case I would always say a rough estimate.
I will be more careful about using the term in the future or may avoid using all together as most people seem not to understand this.
Texas supposedly produced 89 million barrels of crude oil in March based on information by the Texas RRC. Let’s assume the error is about 0.1%. So that would be plus or minus 89,000 barrels for the month of March. If we knew output exactly to the last barrel, the error rate would be 0.000001%, so they are quite accurate in Texas apparently.
Dennis, I am circulating bottoms up and want to address this TRRC reporting issue one more time, please:
The increment of oil measurement in Texas is 42 gallon barrels, not pints. We don’t “estimate” oil production in Texas. “Evidently Texas operators don’t have to file reports on time,” whoever said that doesn’t know his ass from a hardhat. We report it on time but subsequently some of the data gets adjusted to balance barrels of oil sold to barrels of oil bought and for other reasons; there are a number of different entities involved in the balancing of the oil check book. I assure you, sir, there were not 89,000 missing barrels in Texas in March that folks did not get paid for.
Texas is a big place, 1000 miles wide, with lots of hard ass operator’s in it (myself excluded!) with 13 times the number of wells and 3 times the production that North Dakota has. We don’t need to assimilate North Dakota’s production reporting system.
In 53 years of receiving checks for mineral interest, overriding royalty interest, working interest from the sale of my crude oil I have never once had to give any money back because of a mistake or correction in “estimating.” I have never once heard of anyone at the TRRC being found guilty of insider oil trading; that’s a gooden, hee hee. This problem is just numbers and its only a problem with the data driven folks wanting desperately to monitor the precise time in history peak oil production occurs.
It’s already occurred.
To quote Lyle Lovett, you’re not from Texas but Texas loves you anyway. You are not going to “fix” us down here and its important that people know we don’t count barrels of oil on our fingers and toes.
http://www.glo.texas.gov/what-we-do/energy-and-minerals/royalty-reporting/index.html
http://www.glo.texas.gov/what-we-do/energy-and-minerals/_documents/oil-gas/royalty-audit/oil-gas-royalty-audit.pdf
and http://www.comptroller.texas.gov/taxinfo/crude/index.html
Mike
I was also sent an updated EIA chart on US C+C production by API gravity. The EIA is now showing almost no increase in US 40 API and lower gravity crude oil from 2011 to 2014.
Ron. Another great post! Thank you for all the time and effort you put into your blog. Good to see you recognized for this effort.
I think it would be interesting to see a graph of upstream CAPEX spending for the larger producers such as USA, Canada, KSA, FSU and a few others, if that data is available. I know IHS Energy compiles that data, but it is not cheap. I’ll check around when I get time to see if that info is in the public arena.
Hi Ron,
I have EIA data for Texas from several different dates in the past, sometimes they overestimate TX output and sometimes they underestimate, it is hard to know which is which at the time.
For example many of us thought they might be overestimating Texas C+C back in September 2014, but it turns out that the EIA data at the time was an underestimate of Texas output, in March 2014 the EIA data was an overestimate of TX C+C output, in one case they were low by 3% and the other they were high by 3%. Chart below with EIA Texas C+C data at different dates.
better chart
Dennis, I am concerned about 2015 production estimates. The EIA will eventually get the 2014 data correct when the RRC gives them the final numbers.
Here are the Texas RRC estimates for the last 12 months of Texas Crude Only Production. The RRC has Texas Crude only up 37,471 barrels per day since December. The EIA has Texas C+C up 183,000 barrels per day since December. That is 145,529 more than the RRC estimates. I know, one is crude only and the other is C+C. However the difference would likely be even greater had they both been C+C.
The March EIA data is just too high, way, way too high. And that goes for Texas as well as the entire USA.
Hi Ron,
The EIA data for 2014 through Sept is already very close to what will eventually be reported by Texas, do you see how little the EIA estimates have changed over time? Look in particular at the Oct 2013 estimate and 10 months earlier all four of the EIA estimates are nearly the same, the error was never more than about 3%. If we look back to March 2013, the Final Estimate was 13% too low for Dec 2012. The EIA TX C+C estimate for data pulled in Feb 2013 for Dec 2012 output was 68,820 kb, reported Texas C+C for Dec 2012 by the RRC is 68,842 kb, a difference of 0.03% . Final estimate from March 2013 (for Dec 2012) is at link below:
http://www.rrc.state.tx.us/all-news/022713b/
Texas RRC data can be found at following page:
http://webapps.rrc.state.tx.us/PDQ/home.do
The EIA TX C+C data for Dec 2012 reported in Feb 2013 can be found here:
http://www.eia.gov/petroleum/supply/monthly/archive/2013/2013_02/pdf/table26.pdf
Hey Dean,
If you are reading this, could we see your latest TX crude only estimates in numbers so I can do a chart for the last 12 months comparing the RRC’s “final estimates” with your estimates, maybe the RRC has improved their estimation since March 2013 (maybe they just read this blog and use your estimates 🙂 ).
Thanks.
Hi Ron,
Using the RRC estimate of final production in your chart above and assuming the ratio of C+C to crude only remains at the ratio reported currently in the PDQ, and also assuming that the number in the chart is an underestimate by 13% (that is about as bad as the estimates have been), then March TX C+C would be about 3535 kb/d in March and the EIA estimate would be high by at least 150 kb/d (about 4% too high). The minimum C+C for TX in March would be about 3316 kb/d, so roughly 3440+/-100 kb/d would be about right, if the crude to C+C ratio doesn’t change much when all the data is in.
If this average guess is close, the EIA is too high for Texas C+C by 7% in March 2015.
The average of the EIA estimate and “modified” estimate of final production by the RRC is about 3400 kb/d for Texas C+C output in March 2015.
I would also revise downward my guess for US C+C output in March 2015 to 9400+/-50 kb/d.
World C+C per capita since 2011 has grown ~0.25%/year and is down ~3.5% since 2005.
Ex US production, world C+C per capita is down ~3.6% since Dec 2011 and down 8.8% since 2005.
US oil production per capita is down 40% since 1970 and down 25% since 1985, currently at the level of 1945-50.
The world is where the US was in terms of oil production per capita in the mid- to late 1970s, which was US Peak Oil I, peak of industrialization, and the onset of deindustrialization and financialization of the economy.
A similar secular era of global deindustrialization awaits, only this time the world does not enjoy cheap, easily accessible, high-quality crude oil nor have we low debt to wages and GDP as the US experienced in the early 1980s at the onset of the secular reflationary debt cycle that peaked in 2006-08.
Ron,
Congrats on being in the Top 10. The work you do is some of the best on the internet.
I thought this news item was quite interesting:
A gold rush in Texas? House Bill 483 would let the Texas comptroller’s office establish the state’s first bullion depository at a location yet to be determined.
AUSTIN — Texas — long known for cattle, cowboys and oil — could soon be on the map for something much different…. GOLD.
State Rep. Giovanni Capriglione asked the Legislature to create a Texas Bullion Depository, where Texas could store its gold, which is now in New York, and where others could keep their precious metals.
The goal is to create a secure facility that would allow the state to bring home more than $1 billion in gold bars that are owned by the University of Texas Investment Management Co. and are now housed at the Hong Kong and Shanghai Bank in New York.
http://www.star-telegram.com/news/politics-government/article22707600.html
steve
Let’s convert to the gold standard! What could go wrong?
Not sure how the world will pay back trillions of dollars of debt with gold.
Especially running trade deficits where u would be exporting your gold to Asia.
Sincerely,
Ron Paul
If I owned a lot of gold I wouldn’t want it in a place where I couldn’t take a CONVENIENT look at it whenever I pleased.
What could possibly go wrong if the out of town bank gets in big trouble?A Texas judge probably scares a Texas banker a LOT worse than a federal judge scares an banker who already lives in another country. Just saying.
At different times I hear that the owners of large amounts of gold have a VERY hard time getting possession of it from the banks they have entrusted it to. SFAIK this is true.
Does any body know for sure that it is not?
There are two non-operated working interest lots for sale on the internet auction that I reviewed recently. I jotted some notes down regarding expenses.
The non-operated working interest owner of the two lots has a .74 NRI in each. I do not know if that is common. I was under the impression that most of the leases were in .80 range, although I would also note that I understand each lease is different, and in all likelihood one can run the gamut as far a NRI (net revenue interest) is concerned. In my view, a 74% working interest is not good long term.
I would really be interested in hearing from coffee, or others, who could maybe shed some light on what a typical percentage is for working interest owners to hold in the Bakken. If the operator owns all of the working interest, it means in this scenario that he pays all of the expenses, but only receives 74% of the proceeds from oil sold, with royalty, overriding royalty and carried working interest owners receiving the other 26%, but paying not operating expenses.
In any event, I made a stab at calculating this small interest owner’s OPEX per BOE. One lot consists of eleven wells located in Antelope field (Sanish Pool) the second consists of 6 wells located in the Elm Tree Field (Bakken Pool), Both lots are operated by Continental Resources and both are in McKenzie County, ND.
For the 11 well lot, the total charges per BOE to the interest owner were: 9/14 – $16.73. 10/14-$15.80, 11/14-$21.22, 12/14-$21.60, 1/15-$24.13, 2/15-$28.68.
For the 6 well lot, the total charges per BOE to the interest owner were:9/14-$5.81, 10/14-$12.29. 11/14-$19.37, 12/14-$7.20, 1/15-$9.39, 2/15-$8.70.
So, as one can see, the costs to operate wells in the Bakken of North Dakota vary greatly on a monthly basis. This is consistent with what I posted awhile back after a review of some other lease operating statements for wells located in Dunn County, ND.
Secondly, as can be seen, there are many times where costs are much higher per BOE than what the 10K and 10Q reports show for the company per BOE as a whole. If I recall correctly, CLR reports OPEX (LOE) in the $5-6 per BOE range.
Again, I think there is quite a bit of expense considered CAPEX for wells on an ongoing basis, not just when wells are first drilled and completed. For example, I think companies are capitalizing tubing leak repairs and down hole pump repairs, which are quite expensive, and which many producers would commonly think of as OPEX and not CAPEX. This makes OPEX per BOE appear much lower than it is if such expenses are not capitalized.
Keep in mind the recent point we discussed about SEC/GAAP accounting versus tax accounting. Tubing leak repairs and downhole pump repairs are likely capitalized for SEC/GAAP purposes, but not for income tax purposes.
I think it is also noteworthy to state the drop in net barrels per day the owner of these two small lots experienced from September, 2014 to February, 2015. On the eleven well lot, September, 2014 barrels per day was .158. In Februrary, 2015 barrels per day had dropped to .101. On the six well lot, September, 2014 barrels per day was .263. In February, 2015, barrels per day had dropped to .162.
Finally, it is worth noting just how much of a drop occurred in cash flow and for the North Dakota shale companies by analyzing the very small non-operated working interests that are for sale on the auction.
In September, 2014, on the 11 well lot, the non-operated working interest owner received, after payment of expenses, $293.17. In February, 2015, the non-operated working interest owner received, after payment of expenses, $36.36.
In September, 2014, on the 6 well lot, the non-operated working interest owner received, after payment of expenses, $317.19. In February, 2015, the non-operated working interest owner received, after payment of expenses, $149.10.
As I have harped ad nauseam, ultimately, shale is a business. Profit and loss matters. How much cash is in the bank matters.
I again acknowledge, the above is a very small sample. However, results are consistent with other shale lease operating statements I have reviewed. Decline happens fast. Decline plus price crash has put these companies in financial straits. Only the banks and yield starved investors keep them afloat.
Congrats on the top 10 Ron.
Thanks for the research Shallow, very interesting indeed. It is clear that some shale companies present one face to investors, and another to interest owners.
There is a small Bakken company, Abraxas, which is pretty open about their working interests per well. Several wells are listed between 73% and 76%. It could be that the other part is going to royalty owners? On the other hand, there is typically also a big difference between gross wells and net wells, so it seems to me that many Bakken companies get very small stakes in other wells, in other to have access to the well data.
Enno. I agree that in many instances, more than one company owns the working interest in shale wells. That is actually pretty common in the US industry as a whole. A good way to spread the risk.
Of course, what I am referring to is net revenue interest. In our area the first leases, over 100 years ago, provided for a 1/8 royalty. When more and more gushers were hit, 1/6 royalty became common. There are many 1/6 leases still in operation in our area, which have been in continuous production for over 100 years.
I just wonder if many of the shale wells have been financed through the sale of overriding royalty interests. Having 7/8 of the revenue from the leases v. 3/4 or even less can make a huge difference, especially as the well becomes a stripper well, which almost all of these shale oil wells will be some day.
Mike would know, but I have read that 1/4 leases are very common in the EFS. If overrides were sold on top of that, could be looking at NRI of less than 70%. Could cause wells to become uneconomic much quicker.
I wonder if I bought some stock in one of these shale companies if they would send me company wide Lease operating statements? LOL, I seriously doubt it.
Enno. I looked at Abraxas 10Q. In that they are referring to working interests and not net revenue interests.
I have seen some 10K for smaller companies refer to both working interest and net revenue interest. Not many do.
Well if there is usually a 1/5th royalty, or 80% NRI, and those leases had a 74% NRI then someone could have a 6% override on the leases. So the breakdown of NRI is 20% mineral owner, 74% WI partners and 6% override holder.
MBP. That could be. There are so many different ways that interests in leases are sliced and diced, it is probably impossible to determine a “standard” for trying to calculate “breakeven” figures on the whole. What is common in the Permian, or is there anything common? Here I know of leases that are under 70% NRI all the way up to, of course, fee leases that are 100% NRI.
I assume the first leases in the Bakken and other shale areas provided for a smaller royalty, in general, than the later one’s, after the “boom” took off. I wish the companies would provide information as to company wide “NRI” net revenue interest. To me, this is an important metric.
Just like OPEX can jump up big time in one month if, for example, there is a tubing leak in the bottom joint of a 10,000′ well. And, of course, if for GAAP/SEC accounting purposes, that $70,000+ tubing job is thrown into CAPEX, we really cannot just take the large company LOE from 10K/10Q to determine what the true costs are. Just to keep the well producing, of course.
For example, I would note in the most recent investor presentation, CLR sets forth CAPEX of $180 million for leasehold and $150 million for “other”. What exactly is all of that? It would be good if the companies would provide quarterly and annual lease operating statements to shareholders, broken down by area of operation, so we could see what the real deal is.
Bottom line, to keep stock prices up, public shale companies have to say some things that may be contrary to how things really are. They have to say they are growing production, even if that is not the best thing to do in the current low price environment. They have to say costs are going down, whether they are or not, or whether rushing the drilling and completing of a well is really a good idea in the short or long term.
In my view, this has been self-defeating. I see the COP CEO telling OPEC delgates that they need to get used to shale, that it will become more efficient, will compete with them, etc., etc. Nothing like putting a cap on both oil prices and earnings, with statements like that. Apparently this CEO is ok with the $2+ billion in cash his company burned Q1, 2015.
Keep on making the claims and keep on drilling and completing wells guys. Hopefully you all can push US C + C over 10 million and drive the oil price back down to $40 WTI. Then you can become even more efficient with your new technology and make even more money, as a Wall Street Journal article contended. Something about Moore’s Law?
I think most of these guys were around in 1986, or at least heard the stories. How did that price war with OPEC work out for US independents? I was a young ‘un then, but I am pretty sure the same BS was spewed by a lot of companies that bit the dust.
Hi MBP,
Things may be picking up in the Eagle Ford, based on new oil wells on schedule in the Eagle Ford (an increase of 281 oil wells on the schedule in May 2015 from 148 new wells per month from Jan to April). Is there increased activity in the Permian basin as far as you can see?
I haven’t seen any huge changes, but I don’t deal a lot with the unconventional stuff so I wouldn’t be the best person to ask. Since the big 15 + stage fracs are less frequent now I can do the small single stage ones that I need for a cheaper, so that’s nice.
Hi-
Question for you. As the well declines, does the LOE per barrel tend to go up? So in year one when the LOE per barrel might have been $5-6, in year three or four could it be much higher? Is that what you’re saying above?
What’s LOE?
LOE=Lease Operating Expense
Fernando,
Lease operating expenses.
Does the lease operating expense include work over and repair? Or is that a separate line item?
Hi Fernando.
shallow sand or Toolpush or Mike or MBP are the ones to answer your question–I just quoted from a glossary at MPG. The definition was “cost of maintaining and operating property and equipment on a producing oil and gas lease.”
I was wondering because we have to consider work over expense a bit differntly where answering the question.
Fernando,
I understand. I’d expect workover expense to be part of LOE/OPEX but shallow sand has showed us several examples of what sounds like OPEX being shifted on the company’s books (the ones the SEC sees, anyway) to CAPEX, for shady reasons.
I’m not in the industry, though, so what I’d expect doesn’t count for anything.
Syn. I do not know that throwing well repairs into CAPEX is for shady reasons. I assume this is how the companies are required to report these expenses for GAAP/SEC purposes. Or, at least, they are allowed to elect to report in this manner. Oil and gas accounting in the United States is complex.
As companies have determined that OPEC is it this for the long haul, and that prices could stay low for awhile, the CEO’s are going to have to continue to make bolder claims. That is how it works.
I have read that Continental Resources will run out of credit line by the end of the summer, and is preparing to issue more shares to pay it off. They will likely do just fine raising more capital. If Halcion and Sand ridge were able to float around a billion each in bonds, I am sure Continental could raise enough to keep drilling for several years, even at $50 oil.
They won’t make money doing it, but they have been cash flow negative the entire time, so what difference does it make.
Syn, when I first came to this blog, I compared what it costs to drill and complete a 20,000′ Bakken well with what it costs to drill and complete a 1000′ vertical well where I am from, as well as what the long term production would be from each. I found this an easy comparison because the cost of a Bakken well was about 100 to 1 that of a 1000′ vertical hole.
I then compared output. Over the life of the well, EUR claims per barrel of oil equivalent were about 800,000 for Bakken wells. This includes gas, of course. So I divided by 100, and that would be 8,000 for a well in our area.
I then read from the excellent posters on this blog that 400,000 barrels of oil equivalent was more credible, and that 200,000 barrels of oil in the first five years was also in the ballpark. That would be like 4,000 barrels of oil over the life of the well, and 2,000 barrels in the first five years here.
We operate in a high cost, marginal field. I do not think we can drill new wells here at present prices and stay in business long, and we expect our wells will produce as much or more proportionately that the Bakken wells do. Over a 30 year time, our wells recover 10,000-20,000 barrels of oil. At 100 to one ratio that would be like 1 million to 2 million barrels of oil.
So then I thought, maybe the economic advantage for shale is in the OPEX. However, I have concluded that the low OPEX is only in the early years, when the well makes a lot of oil, and that from years 5 plus, the OPEX per barrel is no better than in our high cost marginal field. Also, I have learned that LOE listed in company SEC reports is likely not true LOE (OPEX) but that the actual per barrel cost is probably 1.5 times that much, or more. My guess at this point is that OPEX (LOE) per barrel for wells five years old and older ranges from $15 to $60 per barrel.
I have spent a lot of time analyzing this and really need to stop. I just need to sit back and see what happens.
shallow sand,
Thanks for this!
I wondered about that “shady”; I should have added (?)
John Keller. In general terms, I believe the answer is yes. From my review of a small number of Bakken lease operating statements, OPEX (LOE in USA) runs about $10-12 per month if nothing goes wrong. So, if a new well produces 9,000 barrels in a month, LOE is $1.33 per barrel at $12,000 of operating expense, whereas an older well producing 600 barrels in a month, LOE is $20 per barrel at $12,000 operating expense.
The one expense that does tend to decrease in Bakken wells is the cost of disposing water. It appears most wells produce less water over time.
As I have noted several times, the LOE figure in company 10K and 10Q likely does not include expenses that many of us would consider LOE or OPEX. Pulling the rods and tubing to repair a tubing leak (cost around $70,000 if nothing goes wrong) or pulling the rods to repair/replace a down hole pump (cost around $30,000 if nothing goes wrong) have been treated as CAPEX on every lease operating statement I have seen thus far.
From the limited number of lease operating statements I have reviewed for Bakken wells, as well as front Mike’s input, it appears down hole repair frequency is about 1.5-2 times per year on average. Some wells are more troublesome than others. Likely, I think the problem wells either are highly corrosive, or the well bore is not straight, causing more rod wear on the tubing. Mike has alluded to this also.
In a group of Bakken well lease operating statements I reviewed, completed in 2008-2010, the per barrel cost over a nine month time frame ranged from $17 per barrel to $56 per barrel, if I recall from memory. The primary difference was the $17 per barrel had no down hole failures, the $56 per barrel had 4.
I really would like to review more Bakken lease operating statements, and as well would like to review EFS and horizontal Permian ones, to get more of a feel for the total costs to operate.
Hopefully this helps answer your question. There are so many variable that come into play when operating oil and gas wells in terms of expenses, it is difficult to get any type of average. We operate in one old stripper well field and, depending on the well and what problems might have arose, LOE for the month ranges from below $5 to over $100 well to well.
Thanks for that. I enjoy getting intel from guys with boots on the ground. I doubt any wall street analysts have analyzed lease operating statements. I’ve been convinced that shale drilling is nothing more than a Ponzi Scheme. I’ve mainly been focused on the inflated EUR claims. But, with this piece of info I’m even more convinced. Perhaps, this helps explain why companies continue to drill like mad and have been outspending their cash flow with added borrowings. They need to dilute down the increasing operating costs of legacy production. If they were to slow drilling their reported operating costs per barrel would skyrocket.
Thanks again.
John Keller. I went over our last three years plus this year’s first four months.
Our down hole repair expenses were $4.72 per barrel.
The ratio of average cost of our down hole repairs to what I think they are in the Bakken are not 100 to 1, but more like 60 to 1. However, we only have a failure on about 1 of every 4 wells per year on average. From the limited data I have reviewed in the Bakken, it looks like annual failure to well ratio is around 1.5.
I think Mike said on deep wells he owns he figures about two down hole failures per well per year.
Also, keep in mind my comments about the questionable practice of going very fast on well construction. I compare that to a house. Do you want the builder of your home to do the work as fast a he possibly can?
I’ll give you yet another real world example. Many wells here in the early days were drilled with cable tool rigs. Those take a lot longer, but typically result in a straighter hole.
Have a lease that has two cable tool wells and two rotary wells. Going back to 2012, I do not see we have had a down hole failure on either cable tool hole. We have had 7 on the rotary holes.
Mike commented about rod guides. Rod guides are used to help reduce rod and tubing wear. One common cause of rod wear on tubing is a crooked hole. Rushing drilling, in our area, has resulted in crooked holes.
Know of a lease that was air drilled back in the 1980s. Wells drilled very fast. Every hole crooked as all get out. Was plugged out ten years later, could not be operated at a profit in the 1990s low oil price environment due to down hole failure issues.
Also, not a good idea to cut corners on the cement job. Ask BP about that. Anyway, on land, bad cement jobs seem to me to result in casing holes. Wonder what a squeeze job costs on a 10,000′ well bore.
Finally, I have no clue how the horizontal leg on these wells is kept free of debris over the long term. How do you acidize the horizontal part of the hole? Cleaning out those, if it can even be done, has to cost a fortune.
I’d sure like to pick the brains of shale oil engineers about this stuff and more. Are there any lurking out there?
When I was working on field technical support we had an automatic bottom line goal to keep mean time between failures above 400 days.
As you mention, the hole design is extremely important, the drilling team has to have it hammered into them to keep the hole within specs, such as dog leg severity, and making sure the pump setting spot is very straight (this is critical for the submersibles and other long pump assemblies with rotating parts).
Keeping the hole clean is an interesting topic. In most cases it involves pulling the well and going in with coil tubing.
Shifting the cost of a repair to CAPEX is a teenager’s move. It increases taxes, reduces return on capital employed. But I’ve seen it done by very well connected head accountants whose main interest was beefing up the stock for the mullets who focus on OPEx and forget to check return on average capital employed.
Anyway, it seems to me the LOE, OPEx, or whatever you wish to call it is better estimated for the future with a constant, and multipliers for oil, water, and gas production rates.
Fernando. Keep in mind the companies only report those items as CAPEX for GAAP/SEC standards.
For income tax purposes, those items are expensed, as are intangible drilling expenses.
The companies show a profit for GAAP/SEC purposes, but show a loss for income tax purposes.
The difference between what the GAAP/SEC books show and what the tax books show, in terms of income tax due, shows up on the balance sheet as “Deferred Income Taxes”.
The US shake companies show hundreds of millions or billions in deferred income taxes as a liability.
As I discussed with others in a previous post, shale companies face a cash crunch if they stop drilling. They are using up all of their income tax deductions up front. If drilling stops, production drops, GAAP/SEC income drops, presumably share prices drop, but income tax liability could very well increase, substantially I might add.
I thank Clueless for explaining this, or in my case re-educating me. I had went over this stuff in college taxation classes, but that was around 30 years ago.
Public companies have two sets of books, one for SEC and one for IRS. In the case of oil and gas, there can be a tremendous difference between the two.
Shallow, overseas tax rules can be different. For example, there’s no tangible and intangible split, depreciation is by units of production, and there’s a lot of playing around shifting to CAPEX. The typical set up consolidates subsidiaries based in the Caribbean to a Dutch corporation which consolidates the subs, and depending on the parent corporate entities takes the cash to fund international exploration. I think most companies do it to avoid double taxation. The USA expects to be like an imperial power with all other countries paralleling USA tax law, but many of them have their own ideas.
The financial sec book games they play are also real in the sense that they mislead the buyer. The whole approach is lousy.
Excellent post. I want to show you the way they post the Colombia field data:
http://www.anh.gov.co/Operaciones-Regalias-y-Participaciones/Documents/Producción%20fiscalizada%20de%20crudo%202015.xlsx
The April data should be loaded by mid June. They use , for decimals, the data is in bopd, and considered very accurate.
The largest field is Rubiales, a relatively young heavy oil field with a pretty decent water drive. Note the large number of fields, and how some of them are fairly tiny. They are incredibly sensitive to price.
Here’s Ecuador:
http://www.arch.gob.ec/archivos/pdf/reporte-diario-de-produccion.pdf
Ecuador posts daily. They are a bit sloppy, for example this sheet says its for May. But it’s really the June data. They show the LACT unit or tank gauges taken on a daily basis.
And here’s an article about Venezuela trying to organize nations outside OPEC to make cuts and prop up prices:
http://news.yahoo.com/venezuela-seeks-allies-outside-opec-steady-oil-prices-210017163.html
The article underestimates inflation, it’s running over 100% per year. They haven’t announced the expected gasoline price increases, so it remains nearly free.
So peak oil in 2005 or so bites the dust. ‘We hardly knew yea.” Well, I suppose we can now call it for 2014? 2020? Roll a pair of die, add it to 2014, and call that good enough?
Depends on how you define “oil”, I guess. I have the gut feeling that oil from reservoirs with average permeability > 0.1 millidarcies has peaked. It may have peaked in 2005 to 2007.
For a second there, I thought you wrote you had a glut feeling.
Last I checked oil was defined by it’s chemical properties, not by the properties of the rock that it was extracted from. I’m sure the average driver doesn’t give two hoots about the reservoir properties, so long as it makes his car go.
I choose to define oil by the degree of extraction difficulty at the reservoir (I´m a trained Petroleum Engineer, so I tend to be a bit technical). If I merely limit the reservoir permeability to a small amount (to segregate the typical “shale oil”), and also limit the oil viscosity (to isolate the extra heavy crudes from Canada and Venezuela, I get a graph like this
To prepare the graph I segregated the Venezuela and Canada heavy oil production. I had to use my own sources for Venezuela, and I disguised the figures a little bit. For Canada I had to mix the syncrude and the diluted, which means the total amount isn´t exactly what´s extracted out of the ground (syncrude is made by taking out the asphalt and adding hydrogen to the heavy oil molecules, so the total volume is a bit different).
The shale production is a bit rough merely because I eyeballed the data for the Bakken in North Dakota and the miscellaneous, but the Eagle Ford is copied from a Texas Railroad commission data base.
Those of us who know the business understand the basic message we are getting from the oil patch: the stuff is getting very hard to get out, what´s being put on top of what appears to be a fairly flat conventional production is a very difficult to extract production class. Given what I see in these graphs I wouldn´t be counting on much extra production from anything that isn´t extra heavy crude or light crudes from very tight rocks
That’s a pretty arbitrary distinction, though. I mean you could slice and dice the figures all sorts of different ways based on any arbitrary classifications that you chose. I mean, you’ve got deepwater in your “conventional” category, but deepwater is arguably more difficult to get out of the ground than shale is, especially subsalt, so how do you justify the distinction? Given a nice reservoir under salt and 1.5km of water, or a crappy onshore reservoir that you can drive to, is one absolutely better than the other just because of permeability?
Ultimately all that matters is the net flux of liquid hydrocarbons out of the holes in the ground. The conventional peak is of no immediate importance if other supplies can make up the shortfall, increase for a while and stay profitable. Of course, this is what we’re going to find out in the next few years. However I kind of feel that making up arbitrary categories to show that this country or that type of oil has or hasn’t peaked is less important than the overall picture.
Yes, it’s arbitrary. We could try to group the crude streams in other ways. So let’s take deep water, say beyond 1000 meters water depth, and toss it into “unconventional”. We know the remaining crudes would be declining for sure.
We also know (at least I think I do), that most extra heavy, tight light oil, and deep water oil needs around $100 per barrel to justify e&p.
This tells me that the typical conventional crude we can develop also requires about $100 per barrel (it gets work and investment, but that’s not good enough to make it compete with unconventionals.
I did that segregation in part to show myself what it takes to keep production steady. I think it’s got to be between 90 and 100. But in short order it’ll have to increase.
Its like running up the down escalator, if you pay me more I’ll run faster and gain a couple of steps, but I’m not sure I can keep speeding up.
Yeah, now you’re talking. If the world economy could continue to do well with oil at $500, say, then I think any worries about peak oil would be grossly misplaced. $100 seems to be a level that the more energy intensive developed economies struggle with, but your Chinas and Indias manage ok at this sort of level. Exactly what level the affordability ceiling is at is the question, I guess.
Actually, I don’t think it is a straight forward function. Let me explain: let’s say you are operating a nearly watered out field, an análogue of Caño Limón. You have a slight decline rate, water cut is 98 %. Wells are pumped with Submersible pumps. If the price goes up to $200 per barrel there isn’t a lot you can do to increase production. Furthermore, if you think oil prices are going to keep on climbing you won’t have any encouragement to accelerate.
Or jump to reservoirs like Hutton. The platform was removed, this means it’s very difficult to justify a new platform.
It’s like that, we got lots of cases where the higher oil prices won’t do much. And then there’s the impact on supply chain costs of higher prices. I think somewhere between 100 and 500 the whole thing breaks down, renewables kick in, we give ourselves a few wars, the economy craters and I end up having to move to the Galápagos Islands to feed on iguanas.
Think again, Fernando. Those iguanas are protected.
And don’t get any ideas about the tortoises, either.
Hey Fernando,
You are welcome to move to my neighborhood.
Food will not be a problem here unless the climate goes totally haywire.
A few of us old mountaineer throwbacks still remember how our grandparents farmed, using almost nothing originating off the home farm except a few tools.
Working the fields by hand solves lots of problems. Obese field hands are as scarce as chicken teeth. When the day is over you will be too tired to be bored.
If you are really hungry a pot of beans is gourmet food. LOL
I dunno, $100+ has been encouraging a LOT of drilling in the north sea that wouldn’t have happened. The total amount we’re going to get out of the Forties field is way up, thanks to Apache drilling like crazy there over the last few years, going after some really marginal targets. Given the age of the infrastructure there, this is stuff which wouldn’t have been retrieved in a few years time if the platforms had been decomissioned. On a per-well basis, sure you’re right, but the higher prices will encourage more marginal drilling and I expect people will go after EOR much more aggressively in the next few years.
Yes, Sam, the higher prices do encourage a lot of activity. But the overall tendency is for the “conventional” oil to keep declining. That hyper active development work we do doesn’t reverse the decline. What allows the total to increase is the unconventionals, which also happen to be very expensive to develop and produce. Back in 1987 I recommended a well which came in at 10 thousand bopd on choke. By 2001 the best well my team recommended made 2000 bopd. And two years ago I was consulting for outfits hoping for 800 bopd per well. It’s just drying up.
Hi Sam and Fernando,
Excluding extra heavy oil what do you think C+C less extra heavy URR will be if oil follows roughly the oil price scenario below?
My guess is 2800 Gb, cumulative output plus 2P reserves was about 2000 Gb in 2010 by Jean Laherrere’s estimate (oil sands in Canada and Venezuela are not included.)
The prices are in inflation adjusted in 2015$ and the price is for Brent crude.
Dennis, as I mentioned the 2800 sounds fine. It depends on whether they can invent a battery worth buying.
Hi Fernando,
Thanks. Not sure I get your battery comment. If the batteries are not an option, there are more fuel efficient cars, trains, light rail, higher population density, car pooling, bicycles, and walking.
Dennis, I try to model renewables using the Spanish grid performance data. The grid here is probably the best in the world. But it’s not feasible to push renewables beyond 50 % without incurring really obscene costs. A cheap energy storage system would do the job, but it doesn’t exist. One of these days I’ll show what I’m doing with it.
Dennis,
I believe Fernando is talking about storage for seasonal backup: when solar insolation is low in winter, and there’s a week long lull in wind output.
He refuses to acknowledge that chemical batteries (or pumped storage) are a “strawman” – a solution that no one who’s really involved in planning such things is actually proposing. They’re not proposing them precisely because they’re obscenely expensive for this application.
Instead, the mainstream proposal is “wind-gas”: methane or H2, stored underground.
Why should I acknowledge something I think is no good as a solution? And I don’t see that super genius Musk selling hydrogen, he peddles batteries.
Why should I acknowledge something I think is no good as a solution?
You don’t need to – you just need to give a good, engineer’s response: a specific, preferably quantitative analysis.
I don’t see that super genius Musk selling hydrogen, he peddles batteries.
Well, yeah…that’s what he’s got to sell, so he’s hyping” it a bit.
It’s valuable for almost everything he says it is, but it’s not a solution for seasonal lulls in renewable production.
Hi Fernando,
The wind and solar can be pushed beyond 50% by overbuilding wind and solar capacity (whichever of the two is cheaper, right now it is probably wind power) and using the excess capacity rather than try to use batteries or fuel cells to fill in the gaps. As long as the wind and solar are widely dispersed and if the Spanish grid is also tied to France and the rest of Europe, the need for backup will be minimized.
I think 80% of load provided by wind and solar (with overbuilt maximum capacity to two times average load) is possible with low real cost (similar to today’s cost) by 2030 in Spain.
Dennis, you would have to show me a model to back your statement about wind and solar in Spain. I asume you realize local industry is very good at building renewables and the government is keen on reducing unemployment. Nobody has cone out with anything remotely like what you propose.
One more time:
http://www.sciencedirect.com/science/article/pii/S0378775312014759
Excerpt from the abstract:
“Our model evaluated over 28 billion combinations of renewables and storage, each tested over 35,040 h (four years) of load and weather data. We find that the least cost solutions yield seemingly-excessive generation capacity—at times, almost three times the electricity needed to meet electrical load. This is because diverse renewable generation and the excess capacity together meet electric load with less storage, lowering total system cost. At 2030 technology costs and with excess electricity displacing natural gas, we find that the electric system can be powered 90%–99.9% of hours entirely on renewable electricity, at costs comparable to today’s—but only if we optimize the mix of generation and storage technologies.”
And from the conclusion:
“At 2008 technology costs, 30% of hours is the lowest-cost mix we evaluated. At expected 2030 technology costs, the cost minimum is 90% of hours met entirely by renewables. And 99.9% of hours, while not the cost-minimum, is lower in cost than today’s total cost of electricity.”
and
“We find that 90% of hours are covered most cost-effectively by a system that generates from renewables 180% the electrical energy needed by load, and 99.9% of hours are covered by generating almost 290% of need. Only 9e72 h of storage were required to cover 99.9% of hours of load over four years. So much excess generation of renewables is a new idea, but it is not problematic or inefficient, any more than it is problematic to build a thermal power plant requiring fuel input at 250% of the electrical output, as we do today.”
So, have you read this analysis and come up with any specific thoughts??
I’m sorry, but in real life we don’t make decisions based on papers written by college students. I guess this doesn’t seem to sink in, that paper you guys like to link isn’t any good.
I’m sorry, but in real life we don’t make decisions based on papers written by college students.
When I was in graduate school we did consulting for businesses. The quality of our work was equal to or better than what they would have gotten from other consultants.
And there are quite a few folks in Silicon Valley who never completed college at all but are very well-paid.
Fernando,
That’s a silly, hand-waving, ad-hominem argument. And if it were relevant, it wouldn’t be accurate – the lead author isn’t a student, he’s the chair of his department at a technical school.
You asked for a model, here it is. Take a look, and make a real argument.
Hi Sam,
If output declines slowly, World real GDP grows at around 2.5% per year, and oil spending at less than 5% of World income does not result in a recession, then oil prices can rise to around $224/b(2014$) by 2030. Whether demand will require this high a price will depend on many factors including the price of alternatives to fossil fuel.
Dennis,
Most forms of oil consumption have alternatives that cost the equivalent of $60-80/b. So, most oil consumption would go away at prices much above $100. The higher the difference between the market price of oil and the price of alternatives, the faster oil consumption would melt away. We see this in Europe, where fuel is priced twice as high as the US, and Europeans use 18% as much fuel per capita for personal transportation.
Many people don’t understand “capex lag” – it takes time for alternatives to ramp up, but they do so exponentially, which means that growth looks slow in the beginning, and then surprises you later on.
Both time and price discrepancies will accelerate the transition to EVs.
Hi Nick,
At some point costs may fall to that point. So far with oil at $100 to $120/b over the 2011 to 2014 period (about 2.5 years), there was not very much movement away from petroleum. Perhaps it will accelerate as you foresee, I am not as optimistic as you, I think a crisis will be needed to spur the transition, probably a severe recession or depression in 2030 in response to declining oil output and high oil prices ($250/b or more).
Dennis,
2.5 years is a very short time. It takes about 4 years for car makers to develop a new car.
Again, EVs are much cheaper than ICEs when oil is at $100, right? Natural gas is much cheaper for trucks, right?
The full development of a variety of EVs and hybrids is still taking place.
Remember how deceptive exponential growth is…
Hi Nick,
Consider Europe where due to tax policy, fuel prices are already the equivalent of $200/b oil (if fuel taxes in Europe were at US levels).
There is still considerable petroleum use in Europe and it has been about 20 years that these higher fuel taxes have been in place in Europe. Penetration of EVs is very low, rail and public transport are far superior, per capita petroleum use is roughly half the US level, so Europe is in much better position to weather peak oil.
The transition for North America may also take at least 20 years to get to European levels of petroleum consumption (on a per capita basis).
I am not saying a transition away from petroleum cannot be accomplished,
but the notion that it will not be exceedingly difficult to accomplish does not ring true (at least to me.)
There is still considerable petroleum use in Europe.
Europeans responded to those price signals. They use 18% as much fuel for personal transportation. The big fuel use is commercial, where the taxes are lower.
The transition for North America may also take at least 20 years to get to European levels of petroleum consumption (on a per capita basis).
It may well, at current prices. BUt if prices shoot up, or we implement a real carbon tax, things could change fast. And EVs would allow us to do much better than a weak goal of 50% fuel consumption reduction.
the notion that it will not be exceedingly difficult to accomplish does not ring true
Look at the Chevy Volt. It reduces fuel consumption by 80-90%, has no range limit, and costs less than the average car, overall. Let that sink in, for a moment.
Why would such vehicles be difficult to use?
Hi Nick,
The Chevy Volt is 4 seats rather than 5, which does not work for many people and it is one model. I agree it is a nice compromise, although for those that commute a long distance a Prius would probably be cheaper.
The important figure is the total petroleum use and the transition away from petroleum for personal transportation will not happen quickly at US tax levels, which are unlikely to change.
As much as you claim that the transition will be fast, it has not been very fast in Europe, it is not clear that it will be fast in the US, when oil gets to $150/b, maybe things will speed up, possibly to the level you envision. At $100/b, it will continue at its tortoise like pace in North America.
Yes, the Volt isn’t for everyone. It takes a while for a full “ecosystem” of models, sizes and formats to be developed. It takes a while for people to get comfortable with new things, especially with Fox News and talk radio scaring people away.
I agree – $100 oil isn’t a large incentive for the transition.
Europeans aren’t a useful benchmark: they use so little fuel for personal transportation that they have little incentive to go to EVs. And, they’re very used to their very small diesels.
On the other hand….
EVs are starting to grow quickly in Europe.
US CAFE standards will keep rising.
Hybrid and EV costs are falling.
EVs are taking market share from both ends: low cost EVs are nibbling from the bottom, as they get bigger and more powerful with longer range;
high cost Teslas are nibbling from the top, as they develop more models, and as they develop less expensive models.
EVs are just better: both cheaper and better performance. There will be a tipping point…
Hi Sam,
Probably true. What would be nice is to have World data for petro, diesel, and jet fuel produced, but this data is not readily available. It seems that including NGL is a mistake because very little of these “liquids” are used for transportation, a better measure might be C+C plus “other liquids”, which consist of mostly ethanol and biodiesel. Then we would want to reduce the barrels of ethanol to account for their lower energy content relative to crude (maybe 0.7 boe for 1 barrel of ethanol). The EIA only has biofuel data through 2012, so I will wait for the new BP Statistical Review of World Energy to estimate C+C+other liquids on a barrels of oil equivalent basis. Roughly 2.3 Mboe/d of other liquids have been added to C+C output in 2014, in 1983 it was about 0.2 Mboe/d, so roughly 2 Mboe of other liquids were added to output over the 1983 to 2014 period and the growth of C+C+other liquids (not including NGL) was about 1.3% per year on average from 1983 to 2014. Possibly biofuels output could be expanded, but in the case of biodiesel and ethanol it probably is a net negative for the environment.
I think ethanol is ok if it uses sugar cane. I want to start a combination ethanol and fuel from bacteria business in Cuba, but I need to wait until we give the Castro dictatorship the boot. I’m even looking at laying a cable to Jamaica to sell them electricity from a nuclear power plant.
The ability to extract any substance from a given formation depend on the chemical properties of that substance, so differentiating is sophistry.
Liam….that’s not really correct. It also depends on the nature of the water in the reservoir, the rock properties, pressures, temperatures, deposit geometry/geology, the geography, the nature of rock layers above the reservoir….
I chose two streams to make a simple point, the conventionals , as I arbitrarily defined them, are in a plateau. This means the $100 per barrel environment only allows new “conventional” developments to barely offset decline.
Because we see the new conventionals (including deep water) barely offsetting decline at $100 per barrel, it’s safe to conclude the marginal high cost conventional costs as much to develop and produce as the extra heavy and the “shale” oil. And it seems to me the extra heavy and “shale” crudes do require close to $100 to be viable. Evidently, some unconventionals are more profitable, but we need to focus on the more marginal projects, because those deliver production growth.
This leads me to conclude the oil price will eventually gave to increase to the $90 to $100 to allow production to meet demand. And soon thereafter it will have to increase in real terms. The key for producers is to focus on not allowing excessive cost inflation, use a conservative price forecast, and be prepared for a bumpy ride.
The long term key seems to be renewables or whatever replaces oil. Thus far, at the current price level, biofuels seem to compete if grown in low latitude tropical areas. But there isn’t enough land, and people do have to eat.
Do I detect humor or sarcasm? It could be either -you are not well known here Johnny.
Given that the price is up anywhere from three to six times since 2005 and production is no higher – that is to say the production of REAL crude as opposed to various things that have been REDEFINED as crude – well, a few decades down the road historians and economists will probably be referring to the ”peak oil plateau” that started in or about 2005.
Since the dice could read up to twelve 2017 might actually be a pretty damned safe bet for a recognizable and indisputable end point of the plateau.
ONE thing is for SURE. There will be a peak and we are now ten years closer to it than we were in 2005.Cornucopians seem to believe the oil industry will grow forever, or at least for generations to come.
Peakers are surprised that it has lived longer than expected without going into obvious old age decline.But the middle years peak seems to be perfectly obvious – at least to me.
We are also, most of us, surprised that the world economy has stood up as well as it has given the higher prices since 2005.
I am ready to bet my last can of beans , if I am still around, the 2035 edition history books will read my way.
Are you offering odds ?
Hi Old Farmer Mac,
The crude plus condensate has not been redefined, there was a period where crudes were getting heavier after the peak of the North Sea and Prudhoe bay and the LTO surge in output reversed this trend. Since 2005 C+C output has increased.
Whether this can be considered a plateau depend how you plot the data. In the chart below I blow up the scale to show changes since 2005 on the left axis (Ron usually plots the data in this manner), I plot the same data on the right axis with a zero scale and it looks very much like a plateau. Bottom line output has increased from 73.9 Mb/d in 2005 to 77.8 Mb/d in 2014 (average for the year in each case) or by 5.3%, this is an average of about 0.58% per year over that 9 year period, so the plateau description is apt in my opinion.
A problem with this story is that 2005 was unusual because of a rapid C+C increase from 2002 to 2005 due to a rise in oil prices over this period and OPEC’s attempt to keep prices in check by raising output. A truer picture is found by looking at a longer period such as 1993 to 2014 where a somewhat steeper linear trend is found.
Over that 21 year period C+C output rose at a fairly steady 1.2% per year based on EIA annual C+C data for the World (60.2 Mb/d in 1993 and 77.8 Mb/d in 2014). If we extend back to the low annual output level after the 1980-2 oil shock in 1983, the trend is the same, a 1.2% annual increase in C+C output from 1983 to 2014.
Second chart to go with comment above. 1983-2014 World C+C, EIA annual data with exponential trendine. About a 1.2% per year annual increase in C+C over the 1983 to 2014 period.
Hi Dennis,
I should have been more explicit in talking about things being redefined as oil.
I had in mind the smoke and mirrors trick the msm has pulled in talking about ” total liquids” in recent times.
Moonshine , soy and canola biodiesel, palm oil , and some stuff that comes out of gas wells are NOT crude oil .But the media keeps telling us about total liquids. Lots of people are confusing total liquids with REAL petroleum oil.
Hi Glen,
Gotcha. I mainly wanted to point out that C+C has not really changed in definition and what Ron is reporting is real, C+C has increased since 2005, but not by much, but the better picture is to look back to the trend from 1983 to 2014.
Yeah Johnny it could appear that way. My personal prediction for peak oil has been 2017-2020. However, if all depends on what you call oil and really doesn’t matter much anyway. The oil industry is like that stinky smoke belching old car you hate to get rid of. More and more money is needed to get the same result (rolling down the road ) and you know the inevitable day it will crush your pocketbook too much is just hanging on the near horizon. In the meantime, confidence in the reliability of the car is steadily eroded.
Hi Marblezepplin,
I agree with your prediction, though I would widen the window to 2015 to 2020, I think we may see a plateau over that 5 year period with the 12 month centered moving average C+C output level at around 78 Mb/d+/- 2%.
There are certain economic thresholds that will place a glass ceiling on future production. The US economy has trouble handling oil prices over $90, China might be able to handle $110 barrel. Oil above these prices will force a shift to alternatives. Coal and natural gas will also start to rise in price if more production is demanded. Solar and wind power will build out much more quickly at higher prices, undermining the fossil fuel market. So the current new oil producer is caught between a rock and a glass ceiling. Their only alternative to find a way to lower costs.
Oil above these prices will force a shift to alternatives.
71% of oil is used for transportation. Liquid fuel for transportation is the problem, or will be the problem. None of the “alternatives” you mentioned will replace liquid transportation fuel, not in the near future anyway.
Not directly, but indirectly because they produce electricity. And, there are electric vehicles which are cheaper overall, and have better handling and performance, than ICEs. EVs don’t seem to be in short supply, and every car maker has several hybrid and EV models and they’re working hard to bring out more. Difficulty ramping up EV production isn’t the barrier to a fast transition, at least at the moment.
Of course, they can be powered by coal, natural gas, hydro or whatever. But wind, solar and nuclear are indeed growing very fast.
Finally, it’s worth noting that perhaps 10% of oil consumption is used to generate power, in KSA, Japan, India, China, Pakistan, Chile, Hawaii, Jamaica, etc. Solar is far cheaper, and replacing oil can keep solar growing (and gaining more economies of scale and manufacturing experience, thus reducing prices) for a while.
Ron,
Are you absolutely sure of that Ron? History and modern applications disagree.
Ever hear of the electric motor? Used to power trains and streetcars all over the place. How about the steam engine?
But I guess those electric cars that pass by me on the highway and all those electric trains to the east of me just are a lark or are powered by liquid fuels.
Sweden is even prepared to run cars on wood gas if need be. Some people are already doing that in the US.
I bet it would take just a few months to get the first steam locomotives on line if oil started to become rare. Electric buses that recharge as they go are already in the testing stages. Can always set up street car systems again and all locomotives are already electric just need to dump that diesel engine and hook up some wires.
Ships can run on steam power. They can also run on wind power or some combination of the two.
The only application I can see that cannot readily be replaced is aircraft fuel. World jet fuel use is about 5 million barrels per day. The new design jets are about twice as efficient which means that synthetic fuels would have to be produced at about 2.5 million barrels per day worldwide to keep the same flight capability. A little dimerization, some high pressure hydrogenation and it’s take-off time. Not really that much and think of all the new job opportunities. They could even fly slower and really extend that range.
Mining transport is no problem.
How did we ever get from the horse to the steam locomotive and electricity and radio without oil? Must never have happened.
Petroleum use is by design not necessity. It is also a highly inefficient energy source for transport.
And as far as timing, most of our transitions have taken 20 to 30 years at most, some even less. Now with computerized machinery we can do things a lot faster.
Marble,
Converting the infrastructure just for cars would take decades. The grid would have to be more than doubled. Charging stations would have to be built for long distant travel. And it is doubtful if large trucks and farm tractors and other farm equipment could ever be converted to all electric. And of course the electric passenger plane is a fantasy.
Funny, I never said anything about electric planes, just the opposite.
Ron, none of those are showstoppers.
For instance, let’s calculate the size of the grid expansion: 230 million cars times 12,600 miles per year equals 2.9 trillion miles per year. Divide that by 3.5 miles per kilowatt hour, and you get about 830 billion kilowatt hours per year. 830,000,000,000÷24 hours in 365 days gives you about 95 GB on average. That’s an expansion of less than 25%. Do that over 20 years and it’s easy.
In addition the total energy required to produce electricity with fossil fuels is higher than for Wind or Solar because of thermal losses of at least 60%, so there is some savings from a total energy standpoint of moving to Wind and Solar.
<i<thermal losses of at least 60%
Yes. ICEs use about 4 times as many joules per km (or more!). That explains why Ron intuitively thought that the grid would have to be doubled, whereas it really would require an increase of less than 25%.
Footnote: my comment above concludes that 95GB would be needed. That is, of course, 95GW, 22% of the current average of about 440GW.
You can cut tha back to 8000 miles per year. It’s going to be a lot more expensive. Then you need to add trucks and cop cars.
You can cut tha back to 8000 miles per year. It’s going to be a lot more expensive.
What’s going to be more expensive? Not electricity: EVs can mostly charge whenever power is cheapest, and that will be a lot of the time.
Then you need to add trucks and cop cars.
Cop cars are already included.
The sensible replacement for long-haul trucks is rail. What’s left won’t require much.
” Charging stations would have to be built for long distant travel.”
With due respect Ron, that is not something that is going to take decades. One of the reasons I hold Elon Musk in high regard is that he, through Tesla Motors, is demonstrating how many obstacles to EV adoption can be removed.
Exhibit A, the Tesla Supercharger Network. The first one went live in late September 2012 and there are now 190 locations in service with 15 under construction and 13 permitted ( as of June 4, 2015 according to http://supercharge.info, an interactive map page). It has been possible to drive a Tesla using the Tesla network up and down both coasts of the US for some time now, as these were the first “routes” developed. By the end of 2016 Tesla intends to cover the entire lower 48 according to their own interactive map page at http://www.teslamotors.com/supercharger.
That’s roughly four years by a single company, using a proprietary technology to supply electricity that is paid for in the price of the car. Think about that for a moment. Tesla is demonstrating that a high speed charging infrastructure for long distance travel by car, covering most of the lower 48 can be built out in about four years!
I’ve got to hand to Musk! When he said his goal with Tesla was “to accelerate the advent of sustainable transportation”, he wasn’t joking!
Oh, and congrats on making that top ten!
Islandboy, y
I think I found a solution you will like:
1. Knock off the Cuban dictatorship
2. Change the constitution to a normal multiparty set up, with democracy, a free media, and a separate judiciary.
3. Write laws to set aside a location for three nuclear power plants to be built in sequence over a 25 year period.
4. Build a large wind park in Oriente province with hydro storage.
5. Lay a cable to Jamaica and sell you 500 Gw at an average price = 32 USA cents per kWh.
Would you go for it? We can throw a few thousand batteries into the deal if you wish.
Here’s an idea that I like!
Do away with the monopoly license granted to the sole grid network operator to sell electricity and allow private investors to set up small private renewable plants, solar PV for example, on or close to consumer premises and sell electricity directly to them. Introduce “time of use” metering by the grid operator so they can recuperate the real cost of running peaker plants, as opposed to base load and charge a rate that balances supply and demand by encouraging a price based demand response from consumers.
This could take advantage of the advances in price and performance that are going to arise from Tesla and their competitors in the stationary storage arena, as intermittent renewable penetration grows. By the time intermittent penetration increases to say 30%, the economics of storage should be significantly improved from what they are now.
This type of market would allow increased prices for electricity that costs more to produce and encourage consumers to modify demand to control costs. It would also encourage the implementation of storage solutions, including pumped storage on this very hilly island. Time of use pricing could provide incentives to solve the problem of a predominantly limestone geology not providing good options for elevated storage reservoirs.
Free up the market and let private enterprise work on solutions. Let the Clean Disruption begin! That way we would only have to deal with the up front capital costs and not have to worry too much about the price and availability of fuels. Could try and get the same people who are throwing money at shale to finance it. Odds are it would be a safer, better investment!
its better to have a fixed charge per peak power unit you wish to sign up for, plus a fixed charge to cover the overall grid maintenance cost, plus a variable cost which depends on the overall system cost at any given minute. The independent producers would be free to deliver power to the grid at any time, but the price they receive would only be the variable price. If there’s too much energy being shoved into the grid the price can go negative, and the power you generate would be sent by subsea cable to Cuba. In Cuba we will have a quality mix of power generation and we will pass it trough to Florida.
Fernando,
Which design would you recommend for the nuclear plants, and who would you recommend to build them?
There’s lots of problems building these things right now, is why I ask. France is floundering, for instance.
Dunno much about nuclear. I would buy French. Not all the French are the same. Or maybe USA, if they guarantee completion. Or Canadian.
Hi Fernando.
France looks like a bad bet these days. The company that designs the reactors, Areva, is about to be merged with (taken over by) Electricite de France; Areva designs the reactors, EDF builds and manages them, and both are 85% owned by the French government. Delays, cost overruns, and now quality problems have just about sunk reactors being built in Finland, France itself, and China; the last two may have to be disassembled at least partly or possibly altogether. Finland canceled the second reactor it had ordered.
In the US the same delay/overrun story is going on at the Vogtle plant in Georgia, the first reactors for which are by Westinghouse which is owned by Toshiba.
I haven’t heard much out of Canada; maybe there’s a chance there.
Marble, try to include Pakistanis, Indonesians, and Nigerians when you think about solutions.
Why, can’t they think for themselves? Unless of course they want to hire me as consultant, then I will be glad to help them.
Solar works especially well for them: they have good insolation, and solar can replace all of the diesel used by businesses and residences to supplement their terrible grid.
These areas also have wind power.
Wind and solar are far more reliable, when you take into account the risks of relying on imported coal, oil and gas.
And ask yourself – do you really want Nigeria to build nuclear??
I’m fingerless.
RON, congratulations on being picked to be in the top ten blog sites. You deserve it with your great charts and insights.
Not difficult to see how peakoilbarrel can be in such rarefied air.
When you do a well search at ndic, you can just pick a field, click for the search and all of the companies with wells in the field are displayed.
If you pick the Sanish, all wells are displayed.
Looks like Whiting has a fair number of wells in the Sanish.
It eventually will be peak wells in the Bakken from the looks of the Sanish field.
https://www.dmr.nd.gov/oilgas/findwellsvw.asp
Sure looks like peak oil out there. People are running like crazy out there in their cars, trucks, everything.
If it weren’t for those pesky emissions from those fossil fuels being burned at a rate of ten times more than in the late nineteenth century, it wouldn’t be such a concern.
It’s peak resources, how long it can remain sustainable is a mystery.
This is a worrisome report. A small collection of countries increased by 6 million bpd and the world only increased by 3 million bpd. Half of the increase was from the US which is probably high decline rate production.
This may be a bit too technical: the increase is attributable to production from very low permeability reservoirs (less than about 0.1 md), and from extra heavy oil reservoirs (oil gravity less than 10 degrees API). Maybe I’ll try an exercise to deduct the Canadian and Venezuelan extra heavy, and the USA light tight oil from the total world production? I will have to use an approximation for Venezuela because they fudge their numbers, and I don’t get to see their real production super secret spreadsheet anymore
If I change the bar to 14 degrees API it is more pronounced. For example, the production increase seen in Colombia is due to the developments at Rubiales, Castilla, and other fields with oil gravity < 14 degrees API.
On pipelines from North Dakota I found the following:
https://ndpipelines.files.wordpress.com/2012/04/wb-oil-export-options-4-13-2015.jpg
This seems to indicate that pipeline capacity was supposed to increase by 140 kb/d from the end of 2013 to the end of 2014. Perhaps some of this capacity came online in late 2014 or early 2015. This would be about 12% of 1100 kb/d (roughly ND Bakken/Three Forks output for 2015Q1.)
I also found the following:
http://northdakotapipelines.com/rail-transportation/
Part of the rail estimate is based on Tesoro refinery inputs and truck shipments to and from Canada.
It is also based on NDIC output data, which we have for the first quarter of 2015 and the fourth quarter of 2014. We do not have data for April and May for Bakken output. We can estimate based on the well completion data from the NDIC and my Bakken model, for April there were about 154 completions and in May there were 136 completions, output will remain relatively flat at 1140 kb/d +/- 10 kb/d through May 2015. If 140 wells per month are added from June 2015 to Dec 2016 and new well EUR starts to decrease in June 2015 and reaches a maximum annual rate of decrease in June 2016 of 8%, the output will look like the chart below, output falls to 1120 kb/d in Dec 2016.
Thanks for all your posts Dennis.
Coffeeguy (I belief) once mentioned that recently the monthly updates from NDIC are published by webinars online.
https://www.dmr.nd.gov/oilgas/presentations/webinarsmedia.asp
I found them pretty interesting (at least the first couple of minutes) to get a glimpse on the near future of the Bakken. Helms was also taken by surprise on the jump in completions in March, and suspected cashflow needs to be an important reason. In these months the number of completions are significantly higher (>130) than the new number of wells spudded (<100). This will continue for most of the year, after which I expect a more sustained drop in production once this "drilled but not completed" well inventory starts to run dry, barring a major rise in prices. My guess is that we end 2015 above 1.1 million bo/d, but will see a drop below it next year, if the current trend persists.
Hi Enno,
Thanks.
I think that the number of wells spudded will pick up over the summer, April is a muddy month and tends to slow the works a bit. If Kopits’ oil price forecast is correct, I believe the North Dakota Bakken/Three Forks may remain on plateau (at about 1.2 Mb/d), if the LTO focused oil companies lose access to credit and/or oil prices remain $60/b or less through 2015 I will be wrong. Your guess will be correct if the oil futures market is predicting the oil price accurately, currently the Dec 2015 Brent contract is at about $66/b (WTI at $60/b for Dec 2015).
Hi Enno,
After listening to the teleconference with Lynn Helms, I see that Lynn Helms expects output between 1.1 and 1.2 Mb/d for North Dakota through the end of 2015. His information is that $65/b is needed before the frack log is worked aggressively and $75/b is needed for more rigs to come back online. Based on futures prices this won’t happen until 2017 so output should decline in 2016 as you suggested above.
The way I look at it, at the end of March there were 880 wells waiting on completion and rig count will bottom out at about 80. If we see about 80 spuds per month and we need 140 completions per month for flat output, then the difference between spuds and completions is 60 completions per month which would run through the fracklog in 14 months, which takes us to April 2016, at that point we would see a big drop in output without an increase in the rig count back to 120 or so. If the futures strip is accurate, output will drop in 2016, if Steven Kopits’ oil price forecast is correct, output may slowly increase by early 2016 as more rigs are employed at higher oil prices.
$75/b is needed for more rigs to come back online. Based on futures prices this won’t happen until 2017 so…
I do hope you realize that today’s futures prices is not an actual predictor of what the price of oil will actually be when that point in time arrives.
Hi Ron,
Yes I realize it is simply what the participants in the futures market are willing to pay now (minus commissions) for oil delivered at some future date. The prices change all the time, just like the spot price. Nobody knows what the future price of oil will be. The futures strip may give a vague indication, but it is usually not correct, especially 12 months or more into the future.
Helms mentioned futures prices at the link that Enno posted, just thought it was interesting., especially the $65/b for completions to pick up and $75/b for rigs to be unstacked.
In the presentation that Enno gave a link to above they also talk about new pipelines that have come on line and are part of the reason for the decline in oil by rail, also some oil was being trucked from Canada and shipped by US rail, less of that is now happening because some new rail terminals opened in Canada that is handling that crude.
Someone has recently been trying to blow smoke up my skirt about the Bazhenov Formation in Russia being the cause of a permanent oil glut in the future. Anybody here know any better? Also, congrats on making the list. Well deserved.
Have they worked in Western Siberia? Ask them for the Bazhenov average depth, degree of over pressure, and liquid API gravity in the area they think is most prospective. This will let you know if they know a little about it.
The EIA cover it in some detail in their shales report here:
http://www.eia.gov/analysis/studies/worldshalegas/pdf/fullreport.pdf
The Bazhenov is certainly responsible for a very significant amount (~25%) of the technically recoverable shale oil resource that they calculate. Scale wise it’s something like 10 Bakkens, and it’s geologically similar, so there’s every chance fracking might end up working there. I’m sure that, eventually, if it can be fracked profitably it will be. Of course, the proof of the pudding will be in the eating. To my knowledge nobody has yet succesfully got any shale oil out of it yet, because of all the above ground problems. Until there’s been sufficient test wells drilled, nothing will be certain.
I cant download the linked report. The Bazhenov is the Jurassic horizon underneath the main Cretaceous reservoirs we see in Western Siberia all the way into the Yamal peninsula. I reviewed a study of the Jurassic they showed me for a giant field the Russians operated out of Nadym, and it definitely had huge potential. But I remember seeing scattered sands mixed in with shale.
To answer the “trick questions”, it has high pressure, the crude has gas, it can be found at around 2700 meters (more or less), it can have a gas condensate, and when I’m feeling optimistic I think it may have about 50 billion barrels recoverable. But that’s a wild guess.
Kemp has a pretty good summary here, all the salient points included:
http://uk.reuters.com/article/2014/07/16/russia-shale-kemp-idUKL6N0PR1OP20140716
One of the most detailed reports on the Bazhenov shale in english:
http://www.oxfordenergy.org/2013/10/tight-oil-developments-in-russia/
and here:
http://rogtecmagazine.com/bazhenov-tight-oil-developments-in-russia/
Yes, Sam, it’s a good summary. I wrote 50 billion barrels if I’m feeling optimistic. The article you linked says 75 billion. It all depends on the fine print. It’s going to be like the bakken, it’s good in four five counties in North Dakota, and produces less elsewhere. The eagle ford is similar, it produces less towards the Mexican border. So the 75 billion may be a reach. Time will tell.
The following is relatively current.
BAZHENOV FORMATION COULD PRODUCE BY 2018 DESPITE SANCTIONS, SAYS GAZPROM EXECUTIVE
http://www.shaleenergyinsider.com/2015/06/02/bazhenov-formation-could-produce-by-2018-despite-sanctions-says-gazprom/
Greenbub,
Just go online. Everything to know about everything is on the Internet. You got to know the world. 🙂
Greenbub,
It is Sarcasm 🙂 but on the serious note did you see that there is a trouble even counting the barrels of already produced oil and literally in your own backyard and then how can you believe that someone here knows how much barrels of oil can be produced in the future in the field half world away, where they speak a language that to readers here looks like old Egyptian scriptures?
We like to speculate. And some people are pretty good at speculating. When I worked in Russia the language issue was a bit of a hassle, but that encourages one to learn Russian.
Speculating – that is like looking at icing on the Torte. Hard to resist those cravings and desires. But that can easily take you away from reality. Just remember that many so called “experts” speculating $500/barrel in 2008 $. And look today $59/barrel in 2015 $ and that after zillions $ were created digitally on the screen. Oil is cheaper then Perrier water 🙂
I’m not an “expert” in the field of oil price prediction. If I could predict it I would keep it to myself, become a hyper super duper billionaire, and buy me one of those Pacific islands they say are supposed to go underwater, build a university that really teaches students, and have a triumphant video explaining what I think about things.
LOL
But YOU DID ADMIT HERE that you BOUGHT some oil individual stock based on partially comments here or/and partially on you crystal ball in the basement. SO YES, YOU DO SPECULATE and you think you are expert on OIL PRICE but apparently you are not even aware of it. If you don’t think that you are expert then why did you buy it in the first place?
Why did I buy it? Because I reached the conclusion oil prices would go up. I guess I’m good at differentiating between good and bad information. I didn’t buy anything when they were talking about $500 per barrel in 2008.
typo: “56,880 barrels” is not “well over half a million barrels”
Thanks Candbuck, I have made the correction.
Ron,
Regarding the jump in production, could it be something to do with how the eia logs production data? It’s logged as sales, right, so if producers were trying to hold their oil in storage tanks somewhere until the price increased sufficiently (say $60 give or take), and then they sold their stored oil when that price point it, then it would cause a big bump in the figures without the flow of oil out of the ground having increased. I’ve read this idea somewhere, and it seems to make sense.
Dennis,
For the Petroleum Supply Monthly the EIA uses data from the states when they have it and estimate states production when they don’t. So they mostly estimate.
In North Dakota and Alaska they have it exactly right. For the Gulf of Mexico they are pretty close. For almost everywhere else their estimate is way off.
Below is the Petroleum Supply monthly production change in thousand barrels per day from December to March and February to March for selected states.
        Dec-Mar  Feb-Mar
USA       137     126
N.D.      -36      14
Okl.       20      24
N.M.       45      29
Tex.      183      61
GOM       -53     -26
Aka.       -9      17
Now I ask you, do you really think that Texas data is correct? Or New Mexico or Oklahoma? An if North Dakota, Alaska and the Gulf of Mexico were down a combined 98,000 bpd December to March that means the rest of the nation was up a combined 235,000 barrels per day over that three month period.
Of course the EIA knows they are off. They are always off. And of course they know there will be revisions. There are always revisions. But I don’t think they have any idea how large their later revisions will actually be.
Based on Dean’s estimates for Texas, I think the EIA is wrong in that March estimate, output is probably around 9450 kb/d+/- 50 kb/d in May.
I said this in an earlier comment.
The EIA estimates are not perfect, but they are better than most of the estimates from the states (with the exception of North Dakota) for the most recent 6 months.
Dennis, the data other states report to the EIA are not estimates, the data is simply the data that oil companies report to them. The data is incomplete except for North Dakota and Alaska. The data from the GOM is pretty close, and relatively accurate after about two months. GOM producers apparently have a shorter time to get their production numbers accurate than do most other states.
Hi Ron,
Ok, the reported output does not reflect the total output of most of the states, every number reported is always an estimate in my view, some estimates are better than others. North Dakota, Alaska, and GOM have relatively good estimates of oil output, most other states in the US have relatively poor estimates of actual oil output. Most people, even those with extensive knowledge of the oil industry assume the reported state numbers must be best, this is incorrect for most cases. In fact, for those states with good data, the EIA just uses the reported state data, so the EIA estimates are always as good as or better than the state data for the most recent 6 months of data in the Petroleum supply monthly.
For Texas, however Dean’s estimates are best in my view ( better than the EIA or RRC data).
Dennis, I am sorry but you have it all wrong, very wrong. The states don’t estimate, they count the total reported to them by the oil companies. This count is passed on to the EIA. The EIA, knowing the data is incomplete in most cases, then estimate.
The EIA gets all their final data from the states. In states where the final data is delayed many months, the EIA uses preliminary data from the states to make an estimate of the final data. This number is revised every month as more and better data arrives from the states.
This is not the case for the weekly data however. The weekly production number is arrived at by use of an algorithm based on refinery inputs, storage an other data. That number is never revised but subsequent numbers are merely adjusted, sometimes greatly, to reflect what the EIA believes the production numbers currently are.
Bottom line, the final monthly data the EIA reports, is exactly what the states report to them. Not one barrel more and not one barrel less.
Hi Ron,
Oh on the meaning of estimate, I use the term differently than you do. I consider every measurement as an estimate, you consider “estimate” to mean what I would call a rough estimate. Do you really think that the output in Texas is known exactly to the last barrel? I do not, therefore any data reported is an estimate in my view, only in mathematics can you have exact results.
I agree that eventually(after 24 months) the EIA simply uses the data from the states, but the data from the states is pretty bad (with the exceptions you have mentioned) for the most recent 24 months reported.
I also agree that the weekly data is not very good at all.
Do you think it is possible that the EIA sees something happening somewhere that makes them believe that output may be increasing?
I was surprised at the jump in the Eagle Ford from 140 new oil wells completed in April to 281 new wells completed in May. Perhaps there are other areas where there is greater activity.
It will be interesting to see the next Texas output report and Dean’s estimates, I think you are right that the EIA’s estimates (revised upward in May) are too high by roughly 60 kb/d in my view, time will tell.
Mr. Coyne, I have explained to you for nearly two years how Texas operators report production and why TRRC production data is accurate at the time it reports it, then is subsequently adjusted over ensuing months as additional data is processed. The State of Texas does not “estimate” its oil production, sir. That is a ridiculous statement. Every barrel extracted from the ground represents the basis for billions of dollars each year in royalty to mineral owners and billions more in severance tax benefits to over 28,000,000 Texans. We’ve got it down to a gnat’s ass.
I know that you consider yourself the big cheese of peak oil modeling, Dennis. Your beliefs regarding Texas, however, are dung heap.
Mike
Hi Mike,
The data reported represents total output for a given month. I suppose we could say that it is accurate in the sense that output will be at least that much. To most people, if I report that output is 75,000 kb in May 2015 and in fact output is 100,000 kb, that the 75,000 kb number is inaccurate. It may be different in Texas.
But we will call it “accurate at the time” if that makes you happy.
How many months would you think that it takes before the data reported is complete?
Have things picked up in the Eagle Ford? Based on graphics at the RRC Eagle Ford page, there were 281 oil well completions in May vs an average of 148 oil well completions per month from Jan to April in the Eagle Ford. Does this make sense based on what you are seeing?
” Do you really think that the output in Texas is known exactly to the last barrel?
Short answer. Yes!
Long answer. See Mike’s post above, to wit: “Every barrel extracted from the ground represents the basis for billions of dollars each year in royalty to mineral owners and billions more in severance tax benefits to over 28,000,000 Texans. We’ve got it down to a gnat’s ass.” The fact that it takes the RRC a few months to publish the complete data, for the benefit of the public, does not mean that the many thousands of directly involved parties have not paid or been paid the correct amount of money based on the data.
Just imagine for one moment, an ill tempered rancher who owns the mineral rights to ten stripper wells, finding out that he wasn’t paid for any portion of the output of a one barrel per day stripper well. Me thinks somebody would be in deep doo doo and possibly find them self staring up the business end of the rancher’s shotgun.
The first is the comparison of RRC estimate to actual production recorded. After the fourth month, the actual production comes fairly close to the RRC estimate.
RRC Estimate Actual Oil
14-Jan 69,927,674 73,141,334
14-Feb 65,593,424 67,441,614
14-Mar 73,670,931 75,975,277
14-Apr 72,632,766 75,599,498
14-May 77,787,308 78,507,930
14-Jun 76,953,161 78,241,312
14-Jul 82,583,166 81,982,097
14-Aug 81,453,587 82,725,147
14-Sep 77,633,356 79,235,618
14-Oct 80,591,275 81,658,256
14-Nov 79,190,062 79,649,314
14-Dec 83,718,353 82,168,195
15-Jan 81,015,390 77,213,157
15-Feb 76,977,022 70,016,811
15-Mar 84,879,948 71,586,361
The estimate is not seriously off of what actual production that is eventually recorded.
Adding in condensate to actual, and compared to EIA estimates, you get:
in thousands of barrels
month total rrc EIA totals
14-Jan 85,811 88,150
14-Feb 78,976 81,644
14-Mar 89,009 92,177
14-Apr 88,546 91,944
14-May 91,689 95,417
14-Jun 90,544 94,321
14-Jul 94,856 99,288
14-Aug 95,487 100,793
14-Sep 91,250 97,202
14-Oct 94,549 103,275
14-Nov 92,088 102,454
14-Dec 94,981 108,249
15-Jan 89,212 110,137
15-Feb 80,365 101,184
15-Mar 81,984 113,913
If you substitute the last four months of actual production with the estimate (below), you get a good idea of how much EIA has gone into the stratosphere since October of 2014. Prior to that, the figures would not reflect a serious difference. Since October, EIA is no longer dealing with Texas, but some other planet that has a Texas in it.
rrc eia
14-Dec 96,531 108,249
15-Jan 93,014 110,137
15-Feb 87,324 101,184
15-Mar 95,278 113,913
Perhaps this is the difference between getting it fast and getting it right?
Hi Guy,
You have to go back two years to March 2013 for complete RRC data. When current reported crude data is compared with the final estimates from March 2012 to Feb 2013, the estimates are on average 10% too low.
The reason the final estimates look good for 2014 is because all the oil production data has not found its way to the PDQ.
I agree the EIA data is a little high from Jan to March probably about 20 kb/d in Jan, 40 kb/d in Feb and 60 kb/d in March. The EIA data for Jan 2014 to Dec 2014 is probably within 1% on average of what will eventually be reported by the RRC (in 2017).
The RRC really needs to look at how they get the data so quickly in North Dakota.
Ron, that’s because the offshore platforms have production meters which measure the cumulative production for a set period.
I didn’t work offshore gom for very long, but I remember some fields were already equipped with remote telemetry units and we could see the oil counters all the way from Lafayette. Back in the 1970s, Shell had a system at East Bay with transducers hooked up to each well, and they even had a pretty decent idea of what they were producing. I’m still a bit surprised to see that onshore USA is so slow in reporting metered production. I suppose it must be because they truck a lot.
I know if I look up all of our leases on IHS Energy, I will find the production monthly from 1980 to April, 2015. I think accurate and timely information is out there on US onshore production, but one has to pay for it.
Hi Shallow Sands,
Do you have access to IHS data for Texas? Is the reported output the same as reported by the RRC in the PDQ?
I would think IHS just gathers the data from the RRC. It is entirely possible that the RRC has information that they share with IHS in a timely manner that is not shared with the public on the PDQ.
I imagine if you didn’t report your data to the government (for tax and royalty purposes, then IHS would not have the data.
Both Mike and you know that this data gets reported to the government on a timely basis. In Texas it seems to take about two years for all of the production data to find its way into the state wide production data query (PDQ), which would be understandable if all of this was done on paper. Maybe that’s how they roll in Texas. 🙂
IHS has almost everything. I used to have access to IHS and also kept the Wood Mac and other sources in our floor library. It was really useful. Plus I used to read those books to be one familiar with the business. I must have read over 1000 field development histories over a 35 year period.
The increase of 3 million bpd of C+C in production over three years is just enough to offset the increase in world population. Any actual increases to society will have been in efficiency gains at the user end. Considering that the “gain” came at a huge investment of capital to produce no real gain, there has been a loss to society in money, resources and effort to maintain. The oil machine is wearing out and running down. If it was an engine I would be asking weather it should be rebuilt or scrapped. Since the rebuilding so far is only diminishing the rate of loss, scrapping is probably in order before more money and effort is wasted on a failing engine.
Hi Marblezepplin,
The huge capital expense can simply be thought of as what is needed both for the production increases and to maintain the existing level of output, at some point in the near future (between now and 2020 would be my guess) output will no longer increase, but a huge capital expenditure will be needed to maintain the same level of output, if oil prices are not sufficient to maintain this level of capital expenditure, then output will decline which will tend to drive oil prices higher unless there is a recession. Gradually there could be a transition to more efficient means of transport as oil prices increase (rail, public transportation, car pools, Uber, biking, walking, hybrids, EVs, and smaller vehicles).
It will be interesting to see how the World economy responds.
I think that transition is gonna be real fast. It certainly is around here in average-america small town. I could not believe those people got together and bought 25 used leafs after just a hint from me that they were a bargain.
I have been working on a wood/kitchen trash pyrolyzer, and find a ton of far more serious work on it being done elsewhere with very promising results.
http://phys.org/news/2015-06-re-use-paper-sludge-pyrolysis.html
http://phys.org/news/2014-05-wood-biofuel-greenhouse-gas.html#nRlv
http://phys.org/news/2008-07-duckweed-genome-sequencing-global-implications.html#nRlv
Just think what could be done in biomass with a small fraction of the capital disappearing down all those holes in ND.
Hi Wimbi,
I seldom disagree with anything you post.
”Just think what could be done in biomass with a small fraction of the capital disappearing down all those holes in ND.”
Boggles the mind , doesn’t it?
But even so, spending that much on efficiency and conservation measures would probably pay three or four times as good a return!!
Sure, always those first. Then, after that, getting what we need from solar wind biomass is easier.
What impresses me is how much can be done with biomass that people don’t seem to notice. My widget makes fuel gas and a lot of charcoal, which I can put into the ground if I want, but mostly use for cooking snacks and other frivolity.
It eats any biomass whatever. Like duckweed, water hyacinth and kudzu, all of which are in great oversupply in some places, like where I grew up.
I remember my mother’s yells when she discovered our goats up on the roof eating the kudzu that was trying to drag it (the house) down.
She was not worried about the goats or the kudzu, but the roof, with those sharp hooves.
Russian exports
223 million tons in 2014.
Bloomberg Energy has a new format. You can click on either WTI, (CL1.Com) or Brent (CO1.Com) and get a 1 day chart or 1 month chart or 1 year chart or 5 year chart.
Below is the Brent one day chart.
http://www.livecharts.co.uk/MarketCharts/brent.php IMO this one is the best live chart of oil price (use mouse scroll).
A moment for Unified Field Theory of oil, as it were.
Anyone watching global bonds get smashed the past 3 weeks will know this is not your daddy’s world you’re living in. The ECB’s QE program faces a problem the Fed did not have — namely the Germans haven’t run huge deficits for decades on end and thus there aren’t all that many German bunds outstanding to be bought/QEed/monetized. This would seem at first glance to make them precious . . . a buyer wants them desperately and the sellers should be able to price them up (which lowers yields).
Instead, yields have exploded. German government 10 yr bunds have DOUBLED in yield over a few weeks. How can this be? The ECB dares not let the yield go negative — huge threat to the narrative there — so they dictate the price they’ll pay and banks holding those bonds that want a higher price are informed they won’t get it, and that they WILL sell nonetheless, at the ECB price, if they know what’s good for them. Nice bank you got there. Be a shame if anything happened to it.
Of course bonds around the world correlate, and so US T yields have gone in essentially the wrong direction over the same time period — straight up. Worsening that, even though the US ran those deficits (and still does) for decades pumping out tons of debt paper (18+ Trillion trala trala), the Fed had already bought up 25% of bonds outstanding by end of QE3, leaving not very many in the marketplace (lotsa institutions own them via bylaw requirements and they can’t sell so their bonds are not really in the marketplace). So volatility amplifies to unprecedented levels for the “most liquid market on Earth”, because it ain’t anymore.
This leads into how we’ve been looking ultra closely at shale financing. There are lots of phrases around about how oil will flow if you can make a profit at it.
Nope. Oil will flow regardless of profit. That’s what the SS dood is proving with each incremental analysis tidbit. Shale oil will flow regardless of profit. Isn’t that nice? How should KSA feel about that? Or Russia?
What does this mean in Russia? Same thing. They pay their oil workers in Rubles. Doesn’t really matter what dollars do, excepting those foreign oil companies on site who might care. If they are really needed (and most probably aren’t), the Argentina subsidy model could be embraced to keep Total’s Siberian guys happy. But largely no need, the oil workers are paid in Rubles and those can fund Russian wheat and veggies and Sukhoi’s however the gubmint wants them to.
The Russian oligarchs want to be rich in dollars, so they’re not gonna embrace a complete schism from money overall — but they don’t have Putin’s poll numbers and he’s acting a great deal like he understands how money is losing its clout amid oil scarcity.
A better look is at KSA. They don’t have to please oligarchs. They pay their Pakistani and Indian workforce nearly nothing to get the oil to flow. They have an enormous sovereign wealth fund and laugh at talk of “fiscal breakeven” for oil price. Meaning, overall, KSA may be the thing to watch because they already are configured to not care what oil’s price is. They will make oil flow if it’s under the ground regardless of price.
What we will see with them is . . . when it stops being under the ground.
Reiterating from . . . last Ronpost comment? dunno. Reiterating . . . if you have oil scarcity in an environment where price does not matter, it’s game over.
A better look is at KSA. They don’t have to please oligarchs. They pay their Pakistani and Indian workforce nearly nothing to get the oil to flow.
Watcher, that is not the case. They do pay their Pakistani, Indian, Filipino, Bangladeshi, Yemini and other third world workfoce very little. But these guys drive trucks, work the motor pool and other manual labor. The people that drill the wells, work the refineries and do other technical work are either Americans, Europeans or other trained personnel. And they make very good money. I know because I worked there for five years and have a relative still working there.
They do have a lot of highly Saudi workers. They observe things. 😉
Supporting extraction of unprofitable oil will do more harm to the economy than not extracting this oil at all. In economy, doing unprofitable things is a waste.
When you are running short of oil, economy disappears from the priority spectrum. This is essentially the overall point.
When it is scarce, you will do ANYTHING to get it. It’s air. You must breathe.
As it is said, it is the blood of the (un)economy.
Watcher. I think KSA cares about the oil price. How long will the sovereign wealth fund last at low oil prices?
I think they are more than a little worried about shale and I’d say that worry has grown since last year. They didn’t consider the following scenario (neither did I):
Shale oil and gas will keep on flowing because institutional investors will keep buying the bonds. Why will they keep buying the bonds? Because they know the banks (themselves actually) will keep lending the money to pay the bond interest.
Why will the banks keep loaning money to pay the bond interest? Because more bonds will need to be floated in the future to pay off the credit lines. Can’t let the credit line/bond issuance fee profit center dry up. Also, they own many of the bonds, they don’t want defaults.
Ultimately, if US can keep printing money and injecting it into banks, the train keeps on rolling. The second quarter numbers for shale will be almost as bad as the first. But only those small companies not deemed essential to the narrative will be have their credit lines cut.
Yes, conspiracy talk. But man, I can’t see how these guys keep getting credit line increases when they are in such bad shape.
Thirty years, last I looked. I’ll look again.
757 Billion USD. 2nd or 3rd (flipflops with UAE) behind Norway.
Riyadh projects $39 B deficit this year and I think that was with a presumed oil price of $52/b. IMF today is splashing their own estimate of $150B with some items they say are one time events blah blah. IMF budget projections always have an agenda. This is sensationalism to push the Saudis to cut pumping.
Anyway 757B / 39 is 19 yrs with no return on the 757 at all. If they earn just 2% on it, that’s 15B/yr so the draw would be 39 – 15 or 24 . . . and 757 / 24 = 32 yrs ( a bit less cuz the draw down decreases the 757 X 2% each year). 5ish% return and they may breakeven and not draw down the fund at all. Shrug.
As for the rest of the text, you’re describing Greece the last 2-3 yrs.
Ok. I hadn’t looked at that recently and had forgotten that KSA could last that long on its reserves.
Budgets are like the modeling wackos. They are never right.
Circumstances change. Always. No exceptions.
KSA is spending money bombing Yemen. That wasn’t in the budget. It should not run up big bills but as soon as you start talking sorties then you can start redefining numbers, and the IMF embraced that.
What does jet fuel cost you as a sovereign country when you take it out of your own ground and refine it with your own refinery?
What does jet fuel cost you as a sovereign country when you take it out of your own ground and refine it with your own refinery?
The same that it costs everyone else. If you burn it in planes, you can’t sell it.
I do not think that Watcher has factored in the fact that Saudi population will more than double in 30 years. So, the annual budget keeps rising, but we do not expect them to be able to increase oil exports in any significant way. Also, with their people expecting largess from their oil heritage, there is no way that they can politically spend down their reserves over an extended period of time.
T. Boone told a good joke on CNBC.
Banker is meeting with the CEO of an client oil producer, who is delinquent on three loans.
Banker first asks the CEO, “how about this rig loan, the rig is now stacked, how are you going to get that one current?” CEO says, “it could be worse!”
Banker next asks the CEO, “what about this loan secured by undrilled acreage, how are we not going to lose our collateral if the rig is stacked?” CEO says, “it could be worse!”
Finally banker asks the CEO, “what about this loan secured by production? The production is declining faster and producing more salt water every day!” CEO says, “it could be worse!”
Exasperated, banker exclaims, “How could it be any worse?’ CEO responds, “We could be losing our money instead of your money!”
LOL, good one.
Hey, Ron
Todd told me about the blog ratings last night, so congrats from both of us.
Mike
EPA draft report…..
Assessment of the Potential
Impacts of Hydraulic Fracturing
for Oil and Gas on Drinking
Water Resources
http://www2.epa.gov/sites/production/files/2015-06/documents/hf_es_erd_jun2015.pdf
“The Environmental Protection Agency has released its long awaited draft assessment of the impacts that fracking has on the nation’s drinking water supplies — confirming that the process does indeed contaminate water.
“From our assessment, we conclude there are above and below ground mechanisms by which hydraulic fracturing activities have the potential to impact drinking water resources,” the EPA wrote.
The impacts take a variety of forms, the EPA wrote, listing the effects of water consumption especially in arid regions or during droughts, chemical and wastewater spills, “fracturing directly into underground drinking water resources,” the movement of liquids and gasses below ground “and inadequate treatment and discharge of wastewater.”
The agency wrote that it had documented “specific instances” where each of those problems had in fact happened and some cases where multiple problems combined to pollute water supplies.
Environmental groups welcomed the agency’s central conclusion as vindication.”
…
“Drilling supporters seized on the EPA’s failure to report evidence of “widespread, systemic” pollution, asserting that it shows that fracking is safe.
“After five years of study, the EPA learned exactly what the states, industry and even some of the more competent bureaucrats in the Obama administration have known for some time — hydraulic fracturing is not a threat to drinking water,” Rep. Rob Bishop (R-Utah), chairman of the House Natural Resources Committee, said in a statement, according to The Hill.”
http://www.desmogblog.com/2015/06/04/epa-study-fracking-contaminates-water-supplies
I guess now Cuomo will start his own rock fracturing business.
Ron, congrats for the recognition of having one of the best O & G blogs in the world !!
Somewhat off topic- But politics are going to have a hell of a lot to do with peak oil as time passes.
This link is to a Stephen Pinker interview. It contrasts nicely with what Caelan Mc Intyre has had to say about his work recently.
http://www.vox.com/2015/6/4/
The link seems to be broken. On the other hand, at the bottom it sends you to:
http://thenicestplaceontheinter.net/
That’s probably more fun than the interview, which I haven’t read yet.
http://www.vox.com/2015/6/4/8725775/pinker-capitalism
This link is to a Stephen Pinker interview. It contrasts nicely with what Caelan Mc Intyre has had to say about his work recently.
Well, whether you like Steven Pinker or not, really doesn’t matter all that much. What does matter is the data. Here’s a chart from his interview. As Matt Simmons used to say: ” Look at the data, look at the data again and then look at the data one more time and then form your conclusions”
See also:
The Great Debate: ORIGINS OF VIOLENCE (OFFICIAL) – (Part 1/2)
https://goo.gl/LzadSS
(Part 2/2) should follow automatically if you should watch the first part.
As Matt Simmons used to say: ” Look at the data, look at the data again and then look at the data one more time and then form your conclusions”
Fred, you just don’t understand, in the mind of the ideologue, ideology trumps data every time. And you don’t even have to explain why the data is invalid, just link to your expert who can explain the data away.
That same argument can be made, and has been made, about some folks’ beloved Pinker, yes? And yet, do we really need data? At least all the time?
Considering the cops, the so-called ‘private’ security, and military all roaming around (You-hoo, these aren’t objective robo-cops.), as well as CCTV cameras and ‘dog-leashes’ (ID tags, passports, etc.), wars on drugs, public harassment, land-grabs/ethnic displacements, drone wars, overseas prisons outside legal juristictions, etc., to make one ‘suspect’ that something is seriously amiss where this supposed ‘peace’ is concerned.
Violence seems to have taken on a peculiar fuzziness, a kind of ‘pay-for-it/deduct-it-forward/debt-based/draw-down’ dimension that Pinker may be somewhat blinkered about.
To say nothing about the issue with the ecosystem… I wonder what Pinker has to say, if anything, about that kind of violence, which boomerangs back on us, over time. Seems that, too, should count.
Caelan, just as I suspected, you haven’t read anything on the subject and are using anecdotal evidence of current times for your entire argument.
A graph at the top of Page 57 of “The Blank Slate” by Stephen Pinker
shows nine bars, eight of them representing the percentage of male
death cause by warfare in South America and New Guinea. I have
converted the bars to percentages of deaths because I cannot post the
chart itself. The figures may not be exact but they are as close as
I could glean by just looking at the bars. The names represent
indigenous tribes.
Jivaro 59 percent of males died as a result of war.
Yanomamo (Shamatari)39 percent of males died as a result of war.
Mae Enga 36 percent of males died as a result of war.
Dugum Dani 30 percent of males died as a result of war.
Murngin 29 percent of males died as a result of war.
Yanomamo (Namowei) 25 percent of males died as a result of war.
Huli 20 percent of males died as a result of war.
Gebusi 9 percent of males died as a result of war.
US & Europe 20th C. 1 percent of males died as a result of war.
The first eight bars, which range from almost 10 percent to almost 60
percent, come from indigenous peoples in South America and New
Guinea. The nearly invisible bar at the bottom represents the United
States and Europe in the twentieth century and includes the
statistics from two world wars. Moreover Keely and others have noted
that native peoples are dead serious when they carry out warefare.
Many of them make weapons as damaging as their technology permits,
exterminate their enemies when they can get away with it, and enhance
the experience by torturing captives, cutting off trophies, and
feasting on enemy flesh.
Pinker shows this graph in this Ted Talk:
Steven Pinker: The surprising decline in violence
Actually, since the beginning of the 20th century, 115 years ago, way less than 1% of the world’s population have died as a result of war. This compares to 59% of one tribe and an average of about 30% of all the tribes.
There have been other studies on this in recent years, they include:
Constant Battles: Why We Fight by Steven LeBlanc
War Before Civilization: The Myth of the Peaceful Savage by Lawrence H. Keeley
In Venezuela we call them Yanomami. But I find the Wayu to be deadlier. I used to have a Wayu guard my apartment. He carried a sawed off shutgun, but his main juju was his tribe. If somebody hurts a Wayu they are in a war. I used to give him extra money, and one day he told me I could consider myself his brother. That meant that if anybody killed me the Wayu in his tribe would have the duty to kill THE BROTHER of whoever got me. They don’t avenge a death by killing the culprit, they kill his relatives. So it can really escalate.
Venezuela has become a really violent country. They have something like 20 thousand to 24 thousand murders per year, which ratios to 200,000 to 240,000 murders per year in the USA. Two days ago they had a firefight near downtown Caracas with seven wounded cops. They don’t report the casualties for the bad guys. Lately it has escalated and they use hand grenades during battles between gangs or cops versus gangs. Mexico gets a lot of headlines, but its tame compared to Venezuela. And I bet 30 to 40 % of young male deaths are caused by gun shots or knives.
Nothing like prehistoric hunters-and-gatherers with guns, hand-grenades and assorted industrial weaponry.
Steven Pinker’s Stinker on the Origins of War
“Three and a half minutes into his [TED] talk, Pinker presents a chart based on Lawrence Keeley’s War Before Civilization: The Myth of the Peaceful Savage… It lists seven ‘hunter-gatherer’ cultures as representative of prehistoric war-related male death…
Are these groups representative of our hunter-gatherer ancestors?
Not even close.
Only one of the seven societies cited by Pinker (the Murngin) even approaches being an immediate-return foraging society… The Murngin had been living with missionaries, guns, and aluminum powerboats for decades by the time the data Pinker cites were collected in 1975—not exactly prehistoric conditions.
None of the other societies cited by Pinker are immediate-return hunter-gatherers, like our ancestors were.… Even beyond the fact that these societies are not remotely representative of our nomadic, immediate-return hunter-gatherer ancestors, there are still further problems with the data Pinker cites. Among the Yanomami, true levels of warfare are subject to passionate debate among anthropologists, as we’ll discuss shortly. The Murngin are not typical even of Australian native cultures, representing a bloody exception to the typical Australian Aborigine pattern of little to no intergroup conflict. Nor does Pinker get the Gebusi right. Bruce Knauft, the anthropologist whose research Pinker cites on his chart, says the Gebusi’s elevated death rates had nothing to do with warfare.’…
To make matters even worse, Pinker juxtaposes these bogus ‘hunter-gatherer’ mortality rates with a tiny bar showing the relatively few war-related deaths of males in twentieth-century United States and Europe. …the twentieth century gave birth to ‘total war’ between nations, in which civilians (not just male combatants) were targeted for psychological advantage (Dresden, Hiroshima, Nagasaki . . .), so counting only male mortalities is meaningless.
Furthermore, why did Pinker not include the tens of millions who died in some of the most vicious and deadly examples of twentieth- century warfare?
…Nor does Pinker include Africa, with its never-ending conflicts, child soldiers, and casual genocides… He leaves out every one of South America’s various twentieth-century wars and dictatorships infamous for torturing and disappearing tens of thousands of civilians. El Salvador? Nicaragua? More than 100,000 dead villagers in Guatemala? Nada.
Absolutamente nada. ~ Christopher Ryan
Caelan, I expected you would let someone else do your arguing for you. After all, you could not be bothered to do the research yourself.
I did, I read them all. That is the book by pinker, the books by LeBlanc and Keeley. I haven’t read Pinker’s last book yet. But he does include civilians and he also remarked that most tribal warfare wipes out the entire tribe. You know, just like it says in the Bible, “Slay both men and women, infant and suckling, ox and sheep, camel and ass.” 1 Sam 15:3
They killed them all. Of course the population today is hundreds of times greater than it was then so today’s numbers may be greater. But the percentage of those killed by violence then was far greater than it is today. And Pinker even includes civilian homicides in his work.
Had you bothered to read that, or even watch the video you would have known that. Pinker included everything in his work that your googled critic claimed he did not. But that’s what happens to people who do not do their own homework and depend on Cliff Notes someone else wrote.
Fred, what is the gist or result of this ‘Great Debate’? While I have limited time to view it right now, catching the first few minutes, is Pinker moderating it?
A 21 minute Ted Talk would well be worth your time:
Steven Pinker: The surprising decline in violence
Excellent Presentation.
‘The Great Debate’ does not specifically refer to the topic at hand. It refers to the format of dialog amongst the panelists invited to discuss the many varied scientific topics of the ‘Origins’ project at Arizona State University. See link for information about the project.
https://origins.asu.edu/about
Yes, Steven Pinker is introducing the individual speakers of this panel and therefore serving in the role of moderator.
The general gist of this discussion is about the biological origins of human violence.
Thanks, Fred. Violence is part of supernovae, star-stuff that we are. Even lovemaking or childbirth could be considered ‘violent’ in some regards. Certainly women have died from childbirth, those murderous fetuses. God forbid we should all be caged in prison industrial complexes called countries and have ourselves turned into harmless dark, inert space-dust at zero kelvin, while the rest, the ‘1%’, the governpimps and their cronies, revel in their own internal anarchy and dance around the outside of our cages, pretending that everything’s perfectly peachy-peaceful, in a Pinker perspective.
Caelan,
We exist because of the laws of physics and darwinian evolution.
What do you expect?
Your posts constantly complain about how things are.
Yet your “solutions” are terrible. IMO.
This is the way things are. Try being thankful for what you have.
I’ve been to many countries and I have never felt like I was in a prison.
The average person today lives better than the Kings of the past lived.
“The average person today lives better than the Kings of the past lived.” ~ Boltzmann Brain IV
Until they don’t. Until they hit the pavement/wall.
Don’t forget that handbook for genocide commissioned by King James.
Considering that 9/11 and the American response unleashed forces of war throughout the planet, and this, at a time when humanity was celebrating “the end of history,” I’d say Pinker is just another American intellectual with his head up you know where.
Pinker is a Canadian and you are a blooming idiot.
Hey Ron, whatever happened to your ‘vile names’ contention, as previously-expressed? Have you changed your mind, or does ‘blooming idiot’ not qualify?
Of course my mind has not changed. But exceptions can be made for bonafide blooming idiots like dolph9. When a person posts something really stupid, and when it is obvious that this person really believes what he/she just posted is a logical argument that makes sense, then that person is a bonafied blooming idiot.
No, Ron, I think it’s just a rationalization for an ad hom– an ‘attack’ (speaking of violence) on a person, rather then their comment– and may even be suggestive of your approach/attitude regarding this Pinker/violence issue to boot.
Incidentally, did dolph9 say at one time that they were 34 years old? And you are what? 76? If so, that makes you easily over twice their age, and one would think old enough to set a better example, yes?
Perhaps but what the fuck! You, apparently, have read nothing on the subject and, also apparently, not even bothered to watch the 20 minute Ted talk video. So tell me, why do you propose to know something about something you could not even bother to read or watch?
What qualifies you to even comment on someone and a subject you know absolutely nothing about?
“Caelan, I expected you would let someone else do your arguing for you…
What qualifies you to even comment on someone and a subject you know absolutely nothing about?” ~ Ron Patterson
Make up your mind.
I have already made own arguments– caged-tigers; ecocide-boomerang; collapse, etc.– such as under the previous article, and embellished it with arguments from a few sources. How about you? Pinker seems to be a bit of a cherry-pick.
In one of my arguments, helped somewhat by Nassim Nicholas Taleb’s ‘fat tails’ (link previously provided), I asked where the violence went. IOW, even if Pinker is correct, he may prove to be incorrect from a longer-view perspective. Such as when most or all of us are dead and gone without replacements. How do you think that might happen, Ron?
For starters, no one is cherry picking this issue, not me, not Pinker, not LeBlanc and not Keeley. The issue is covered top to bottom. The issue has been covered top to bottom from every possible angle.
The data is overwhelming, violence has dramatically decreased in modern times. Anyone who disagrees with that simply has not examined the evidence. The evidence cannot be disputed but it can be denied, denied on ideological grounds. And that is exactly what you are doing. When one’s ideology clashes with the facts, they usually sink into denial.
It is nonsense to ask “Where did the violence go ?” Violence is not something must always be there and if it is not here then it had to go somewhere else. That is absurd.
But of course as the world sinks into anarchy, which I believe it will, the violence will return. As states fail and law and order disappears, violence will return with a vengeance. That’s what happened in Somalia and what is happening right now in other failed states.
See my most recent response below.
Pinker is a top talent.
People don’t like evolutionary psychologists because it threatens their silly view of themselves and their existence.
Caelan thinks if we implement anarchy, everything will go great.
Yet there is no evidence supporting this, and common sense suggests it is foolish.
Enough said.
Perhaps we could imagine that that guy sitting in the chair in that comic is you (and maybe a few others, too, by the looks of it, including Pinker, the ‘Honorary American Intellectual’). ‘u^
Caelan, your domino cartoon is not remotely connected to your argument. We all know that complex systems must eventually collapse. And when they do collapse then that domino will indeed fall on us all as law and order disappears.
But law and order within very large states, along with the increasing “circle of empathy”, has dramatically decreased violence in modern times.
The fact that all this will one day collapse and violence will return with the collapse of law and order does not change that fact one iota.
It is funny how your so-called ‘law and order’ (by the elite/1%, for the rest?) isn’t a domino that topples/crushes (or a whole lot of them that do so), but that merely, harmlessly, ‘disappears’, *poof*.
I apologize if I didn’t realize Pinker is Canadian but my point remains the same.
The assertion that we are becoming less violent is absurd on its face, given events. The world has become a much more violent place since the late 90s.
In fact, I’m surprised people here defend this view so belligerently, given that the idea of a “peaceful” kumbaya world is held most widely by techno-cornucopians who have no time for discussions on resource constraints.
Peak oil = return to human baseline and fighting for resources = more violence. It’s already here now, there’s no delay, no need to speculate on when it will return.
Caelan I appreciate your views and I must defend myself against Ron even as I know that this is his site so I won’t push the point further than this. Just as peak oil is not 20 years out but is here now, the return to violence is here now, whether or not it is being accurately measured. Just as one example, of many, suicide rates are up in America and suicide counts as violence in my book (violence against one’s self). To be sure I respect Pinker and have seen the data for myself, but just remember folks, Pinker is a typical optimist who would argue vehemently against everyone here on just about every topic imaginable.
Ron, if you and Pinker ever got together you would disagree about most everything and yet you viciously attack me. It is what it is, best of luck to you.
” To be sure I respect Pinker and have seen the data for myself, but just remember folks, Pinker is a typical optimist who would argue vehemently against everyone here on just about every topic imaginable.”
That is an absurd claim. Pinker is an evolutionary psychologist who values evidence over ideology. That is what differentiates him from mainstream psychologists that ignore biology, chemistry and physics in their theories.
Pinker goes wherever the evidence leads him. He doesn’t have a preset agenda.
If the evidence is that we are more violent than our ancestors…that is where he will go.
If the evidence is that we are less violent than our ancestors….that is where he will go.
That is the scientific mindset. IMO, it is the best we humans can achieve with our feeble minds.
If you have actually ever read any of Pinker’s work you would realize that he is promoting the scientific method as it applies to human psychology.
I have no idea what Pinker’s view on Peak Oil is. But I am certain if you showed him the evidence, he would follow whatever the evidence says.
That is the core of why his work is so good. He doesn’t let ideology blind him. In an industry, psychology, where people feel threatened by evolution.
His critics are almost always people who don’t like the idea that our evolutionary history explains our behavior.
dolph9, the more I think of Pinker and surrounding issues, the more I think of something like the intellectual equivalent of monocropping. So, in a sense, you may have a point about his head being up his ass, if that’s what you meant.
But isn’t that the case/point in general with regard to academic/professional specialization anyway, or most any job in general? Willful/Deliberate blinkered ignorance of the rest of the world outside one’s particular chosen field of view?
Systemic/Structural co-dependence? Infantilization?
I’m pretty sure I’ve said stuff like this on TOD, years back, like the myopia of specialization as part/par for the course of the system.
So it seems to stand to reason that there’d be a fairly large audience/applause for the (blinkered results of the) blinkered, maybe like Pinker.
Every person who places their ideological beliefs above science, reason and facts, willfully has their head up their ass. And in my almost 77 years I have met many of them. I used to debate them in public forums. They called themselves “Creationist”.
But there are really many other kinds of ideologists. There are those who believe in the myth of the peaceful noble savage. Then there are a group of these noble savage believers who call themselves anarchist. They believe the best form of government is no government at all. Or at least only local governments among small groups of people. Or some version of such. And to believe such a thing without any evidence whatsoever is the epitome of an ideology.
Any tribe or group of people may indeed live with peace and harmony within their group. But any such group will always have neighbors. And therein lies the problem.
Not only are human societies never alone, but regardless of how well they control their own population or act ecologically, they cannot control their neighbors’ behavior. Each society must confront the real possibility that its neighbors will not live in ecological balance but will grow its numbers and attempt to take the resources from nearby groups. Not only have societies always lived in a changing environment, but they always have neighbors. The best way to survive in such a milieu is not to live in ecological balance with slow growth, but to grow rapidly and be able to fend off competitors as well as take resources from others.
The group with the larger population always has an advantage in any competition over resources, whatever those resources may be. Over the course of human history, one side rarely has better weapons or tactics for any length of time, and most such warfare between smaller societies is attritional. With equal skills and weapons, each side would be expected to kill an equal number of its opponents. Over time, the larger group will finally overwhelm the smaller one. This advantage of size is well recognized by humans all over the world, and they go to great lengths to keep their numbers comparable to their potential enemies. This is observed anthropologically by the universal desire to have many allies, and the common tactic of smaller groups inviting other societies to join them, even in times of food stress.
Steven LeBlanc, “Constant Battles: The Myth of the Peaceful, Noble Savage” page 73-74.
[U]nderlying all the other reasons for warfare is almost always this fundamental imbalance of resource stress and population growth.
Page 169
“They believe the best form of government is no government at all. Or at least only local governments among small groups of people. Or some version of such.” ~ Ron Patterson
No, it is about ethical government. An ethical government includes one that one can opt in and out of; that one is not coerced by against their will, say, at the point of a gun.
Voluntary!
“Anarchism is a political philosophy that advocates stateless societies often defined as self-governed voluntary institutions, but that several authors have defined as more specific institutions based on non-hierarchical free associations. Anarchism holds the state to be undesirable, unnecessary, or harmful.” ~ Wikipedia
(I’ll respond to the rest of your comment later.)
LeBlanc gives, in very plain English, exactly why anarchism, according to Wiki’s definition, would not work. I had hoped that if you replied to my post you would try to counter LeBland’s argument. I guess that was too much to hope for.
Any group of people can control behavior within their own group or tribe. But they cannot control their neighbors behavior. And LeBlanc explains why tribes, throughout history, has always been in conflict. “Constant Battles” is the title of his book. And that is what the evidence shows. Tribes have always warred with each other.
Of course modern history, back to the beginning of recorded history, clearly shows this. His point is that archeological history clearly shows this to be the case for pre-historical man as well.
Of course this is so. It appears that man, so long as he has resemebled modern humans at least, has always been disordered internally and thus externally. Has man ever not been conflicted internally? It is useless to espouse any form of governement when man, alone by himself, is conflicted. But what is the cause of this conflict? Until we find the cause, it is useless to talk of government. Each has to look inside himself and ask this question? Why am I conflicted? Why is the mind never totally, completely clear?
Is thought not the reason? Do we think our thoughts,or does thought beget the thinker, the observer that then observes the world thought the filter of personal experience, the “me” such that the experienced is in fact then nothing but the experiencer? If reality is denied in such a fashion, we are fragmented, we do not see the whole. There is separation. I may be separate from you as an organism, from that chair, but psychologically, is consciouness broken up in the way thought tells us it is, each thinker believing himself to be seperately thinking his own thoughts, or is there merely thinking?
The great physicist David Bohm said ”
What is the source of all this trouble? I’m saying that the source is basically in thought. Many people would think that such a statement is crazy, because thought is the one thing we have with which to solve our problems. That’s part of our tradition. Yet it looks as if the thing we use to solve our problems with is the source of our problems. It’s like going to the doctor and having him make you ill. In fact, in 20% of medical cases we do apparently have that going on. But in the case of thought, it’s far over 20%.
In Bohm’s view:
…the general tacit assumption in thought is that it’s just telling you the way things are and that it’s not doing anything – that ‘you’ are inside there, deciding what to do with the info. But you don’t decide what to do with the info. Thought runs you. Thought, however, gives false info that you are running it, that you are the one who controls thought. Whereas actually thought is the one which controls each one of us.
Thought is creating divisions out of itself and then saying that they are there naturally. This is another major feature of thought: Thought doesn’t know it is doing something and then it struggles against what it is doing. It doesn’t want to know that it is doing it. And thought struggles against the results, trying to avoid those unpleasant results while keeping on with that way of thinking. That is what I call “sustained incoherence”.
Bohm had many highly interesting discussions with the philosopher (he would have hated that term) Jiddu Krishnamurti discussing the subject of thought and the enormous effect of it on humankind, on its place in the answer to the question, “Why are we so fragemented”, which is the question behind this thread ultimately, why man has always been so disordered.
In conversation with David Bohm:
https://www.youtube.com/watch?v=xuaRPN4yPwY
The ‘404’ link seems fitting.
But, lament not, as, on the same site, you can apparently find out that the claw/prize game is rigged and something about Caitlyn Jenner. Fulfilling stuff.
IHS CERA expects the number of new fracked wells in the US to drop from ~37,000 in 2014 to ~22,000 this year (about 40%, in line with the expected drop in E&P capex). Not surprisingly, the # of vertical and directional wells is expected to decline from 12,000 to 5,000, almost 60% .
The number of frac stages is projected to drop from 565 to 367 (-35%).
Source: http://blog.ihs.com/refracturing-might-account-for-12-of-the-overall-market-in-the-future
AlexS. Thanks for all of the information you post here. The article you linked discusses re-fracs. In the limited number of Bakken lease operating statements I have reviewed, two wells were re-fracked. In each, production went from under 30 bopd to over 300, but only had information for two months after re-frac. Do you have any information as to shale oil re-frac decline curves?
shallow sand,
here is an article by Wood Mackenzie
http://blogs.woodmac.com/is-refracking-the-future/
There is a chart (too heavy to post here) showing decline curve for a shale gas well
re-fracked by Devon in the Barnett shale
And this one, with no charts:
http://www.epmag.com/eps-face-opportunities-challenges-refracking-800236
Before they try to refrac they ought to have a geomechanics model prepared, so they can see which way the rock fractures. I wouldn’t trust a service company 100 % because they are trying to sell the actual job.
Something that Watcher has been discussing:
Greece crisis live: borrowing costs soar as Athens looks to Moscow
http://www.telegraph.co.uk/finance/economics/11653211/Greece-IMF-payment-live.html
Greece matters. It looms. It is a big pair of scissors heading towards the thread by which the whole system hangs.
Repeatedly those scissors keep getting batted away by the ECB’s printing press and the IMF’s access to everyone else’s printing press, but those scissors, pushed away, then try to approach again.
And again. And again.
The Syriza bomb throwers are proving to be more gutsy than the EU would like. The news stories are avalanching about internal Syriza tensions and how the leadership really truly wants to fold up like lawn chairs and surrender and sign onto more debt (borrowed to service previous debt, and add to that debt), and are only held back from such a “rational course of action” by “extremists” within their own party. And I mean a zillion of these stories in the past week, desperately hoping for snap elections the EU could buy.
A few weeks/months ago it was all about how the Syriza finance minister was the extremist and the handsome friendly glad handing PM Tsipiras really wanted to surrender and eat catered meals at the Eurogroup meetings, but the evil FM said no. Well, when it became clear Tsipiras was saying no all by himself even when the FM was at home, the talk of regime change started.
320 Billion Euros. Probably about 5% interest. The proposals from the EU presume it can be paid off by 2060 by continuing to take loans and, of course, achieving 4-5% GDP growth every year for the next 45.
The Greek proposal is . . . you printed this stuff. Expunge it. If you want more, print it. The obstacle, Spain and Italy owe even more.
Consumption between 300 and 400K bpd. Russia could be persuaded to supply that in return for . . . whatever.
It’s all resource/pipeline routes poker game. So called “Greek Debt” is just one of the chips on the table. And everything else that we read is just part of the “scratching the nose”, “blinking”, “yawning” of the poker players at the table 🙂
I think the primary pipeline Russia desires it probably north to Madedonia, then Serbia and Hungary and then into the central European distribution node in Baumgarten Austria (an obvious nuke target if there ever was one).
There is another pipeline route across Greece and then across the Adriatic to Italy to distribute from there, but that route is already defined, unfunded and specified for Azerbaijani gas, in quantities FAR below what GAZPROM can flow. So . . . the EU is pushing that one just to obstruct the other.
They will also work on Macedonia, Serbia and Hungary, but the GAZPROM counter to that has been . . . once the gas/pipe leaves Greece GAZPROM will no longer own the pipeline and so the EU restriction on ownership disappears.
No reason to believe the EU will not manufacture some other restriction, but once that pipeline is built northward out of Greece, they are going to lose a lot of leverage. GAZPROM will pay for the one in Greece but not northward. The EU knows someone will.
And so, is this really $320B important enough for the EU to consider it a chip? I’d say no. With Syriza, friendly to Russia, in power — that pipeline will happen, and the EU won’t try to buy them off with loan expungement. That expungement will have to happen for other reasons, and with it will be the Spain and Italy reaction.
Here is the whole game. There can only be 1 pipeline. There cannot be competing pipelines because there is not enough of gas or precisely gas market to justify the expense for construction of many competing pipelines.
The “only” disagreement is who is going to control the pipelines. Routes are only important in terms of percent of ownership for the pipeline “owners”. Because if you control the pipelines you control whose gas is going into them: be it Russian gas, Azerbaijani gas, Iranian gas, Syrian gas or whoever. Right there you control the whole gas market.
Gasprom really needs to consider using LNG to ship Yamal gas from a Pechora sea terminal, that area seems to be ice free most of the time. This will allow them to sell gas by ship into UK terminals.
Why would Russia bother selling NatGas to any EU members, once this is completed:
http://www.forbes.com/sites/kenrapoza/2015/05/03/russian-government-ratifies-huge-china-gas-pipeline-deal/
ELM + Putin = Bad news for NATO aligned countries.
Putin is laying down the foundation of making it difficult for oil importing countries (like NATO) to get the supplies they need.
I’ve seen Russia making many moves in countries (Venezuela, Nigeria, Iran, etc) that are important exporters. If he sinks his claws in those places he may be able to gain some control over their decision making.
Putin is a major player in Oil, Natural Gas and Uranium.
Putin doesn’t have the conventional military muscle to embargo anyone.
But he has the ability to make it difficult on over indebted countries who will struggle as they find it more and more difficult to get exports.
He appears to be offering to bail Greece out in exchange for their Natural Gas.
This is part of a larger strategy…IMO.
http://www.therightperspective.org/2009/06/26/nigeria-russia-join-forces-on-oil/
“Russia is keen on developing a trans-African pipeline to transport Nigerian gas to Europe. The creation of Nigaz is seen as Russia’s move to strengthen its already-strong hold over supplying Europe with oil.”
That IPS report is wrong. Read “Venezuela’s heavy oil scam” by me.
link?
That was a good article fernando.
You obviously know more about this stuff than me.
It seems to me there is a clear pattern of behaviour with oil exporting countries and Russia. With exception of Saudi arabia, Canada and Mexico, I can find articles with the others.
Maybe at this superficial level I am reading too much into it.
Thanks!
http://21stcenturysocialcritic.blogspot.com.es/2015/05/venezuelas-heavy-oil-scam.html
http://www.ipsnews.net/2013/03/russia-to-get-venezuelan-oil-for-a-few-cents-a-barrel/
“Rosneft’s agreements with PDVSA are part of Russia’s projection towards Latin America, a region that has traditionally been in the sphere of influence of the United States,” said Kenneth Ramírez, an expert on oil geopolitics and president of the private Venezuelan Council of International Relations.
http://www.janes.com/article/47293/uk-reviews-falklands-defence-as-russia-offers-su-24s-to-argentina
Did I mention Argentina? There’s oil in the Falklands and the Vaca Muerta (according to Fernando)
https://www.caseyresearch.com/articles/putins-power-play-how-it-will-change-the-uranium-sector
Putin dominates Uranium Sector. Will be tough to convert USA & Europe electricity from coal/natural gas to nuclear if you have to get Putin’s help.
Makes Coal to Liquids tough.
http://www.pinnacledigest.com/blog/pinnacle-digest/rosatom-eyes-tehran-russias-nuclear-energy-dominance-continues
Iran…..??
The pattern here is obvious. Someone is trying to use energy to gain power.
“Russia, though its state-owned nuclear power company, Rosatom, is exerting its dominance over the nuclear energy industry, and therefore the uranium sector, at an unbridled pace not seen in years.”
Unbridled pace? I wonder what the urgency is?
What site are we on again? peakoilbarrel.com??
Hmmmm……
Clearly, it’s very risky to be dependent on energy imports.
It makes wind and solar look more and more attractive…
You can say that again Nick G.
Putin and China (artificial islands in South China Sea) are moving. They are making moves in regards to energy. No question about it.
I’ll bet my undersized testicles on it!
They have state owned oil companies and massive militaries, so it is no surprise they are moving, according to STRATEGY.
The USA might elect Mike Huckabee, who believes in makebelieve stories as if they were facts and is anti-science, as president.
I wouldn’t trust that guy to understand what the internet was (“It is one of Satan’s children!”), let alone be the president.
I am hoping for Thorium. ORNL created it and it worked. It is not a near term solution, but it looks like they are going for it again!!!
Please respect my time for prayer:
Jesus,
I know I have ignored you since I was a pre-teen. But remember all that forgiveness stuff you talked about. Cut a guy some slack.
Also, you said we were supposed to give away all our money (unlike religious right conservatives do)….We all make mistakes right??
Can you please give us some more energy, especially non-greenhouse gas producing liquid fuels? Certainly, that is within your omnipotent repertoire. It is looking very scary here….
thanks!
Boltzmann Brain 10:31
http://www.caseyresearch.com/articles/how-putin-conquered-south-africa
and South Africa……
Throw in the link for China above and it appears someone (who just invaded the Ukraine and formed the Eurasian Economic Union this year) might be trying to:
1…..2……3…….
rebuild the soviet union using energy power to control and manipulate.
An amazing coincidence that this is happening at the same time world oil production is on a undulating plateau.
Hmmmm….
My work here is done….
Big congrats to Ron on the well deserved recognition.
This site provides first class data analysis and the comment section is a gold mine (or fiat currency mine if you prefer).
Someone posted this link the other day for total Russian crude oil exports, that I had not seen before:
http://www.cbr.ru/Eng/statistics/print.aspx?file=credit_statistics/crude_oil_e.htm&pid=svs&sid=vt1
Using a 7.33 conversion factor, Russian crude oil exports in 2014 (at about 4.5 MMBPD) were down about 14% from 2007. Note the 7% decline in crude oil exports from fourth quarter 2013 to fourth quarter 2014.
On a total petroleum liquids basis, Russian net oil exports have been at or below 7.2 MMBPD since 2007 (through 2013).
Good point Jeff!
Maybe the Russians are scared that one of their main sources of income is going away!
They are unquestionably being proactive though!
Putin is notorious for manipulating people who are dependent on his energy.
Looks like he is trying influence that potential to me!
thanks!
mazamascience.com/oilexport confirms the 7.2ish and flat number, but there’s nothing sharp on the curve. Just a gentle flattening.
Probably some definitional stuff going on, too, as regards oil sent to the old soviet republics maybe not being called an export. Shrug.
The decline in crude exports is more than offset by the increase in refined products exports. This is a result of the modernization of Russian refineries.
Based on the observed rate of decline in the Russian ECI Ratio (ratio of production to consumption*, from 3.7 in 2007 to 3.2 in 2013), estimated post-2007 Russian CNE are on the order of about 70 Gb (total petroleum liquids + other liquids, EIA data). They shipped about 16 Gb from 2008 to 2013 inclusive, putting estimated post-2007 Russian CNE at about 23% depleted at the end of 2013. I estimate that Russia shipped about 4% of their remaining post-2007 CNE in 2013.
Of course, if there is a substantial production increase and/or consumption decline, this Russian CNE estimate will be too low. On the other hand, this CNE estimate method was too optimistic by 23%, when I extrapolated the initial seven year rate of decline in the Six Country ECI Ratio (the Six Country Case History consists of the major exporters, excluding China, that hit or approached zero net exports from 1980 to 2010).
*Total petroleum liquids + other liquids production divided by total liquids consumption, EIA
If you prefer the EIA data, here are their historical numbers and near-term projections for Russia (STEO May 2015 and International Energy Statistics).
I expect Russian liquids production to remain flat until 2020. Consumption is likely to decline slightly this year and probably in 2016 and to marginally increase thereafter Net exports are likely to be roughly at current levels by 2020
As I noted up the thread, on a total petroleum liquids basis, Russian net oil exports have been at or below 7.2 MMBPD since 2007 (through 2013).
And as also noted up the thread, the CNE estimation method I used for Russia was too optimistic for the Six Country Case History.
We shall see what happens.
Incidentally, since I compiled the Top 33 net exporters data base (through 2013), the EIA has revised upward both their numbers for Russian total petroleum + other liquids production and for consumption. The net effect was that 2007 Russian net exports went from 7.2 to 7.1.
The EIA also recently revised upward their 2005 production number for Saudi Arabia from 11.1 MMBPD to 11.5 MMBPD.
I guess when one compiles a data base, one has to list the vintage of the data.
The Russians would like to have the UK as an ally. They also consider the USA a potential ally, but realize the neocons are still working hard to control the planet. So they play a defensive game for now, and this involves using moves away from home to distract the imperial focus on subduing Russia. The Russian elite considers China the greater long term threat, simply because they share borders and there are over 1 billion Chinese. I just gave you what they think in a nutshell.
@TechGuy
Ohh yes, you continue to keep EU “addicted”. Gas “addicts” always ask for more and some of them can even pay more.
Tech guy, because Russia likes to have a diversified customer base. The Russians also think the British could be a handy ally. And it costs a lot to lay pipe out of Yamal. It’s permafrost terrain.
http://www.dailymail.co.uk/news/article-2933765/Russian-nuclear-bombers-Britain-scared.html
Fernando,
If Russia wants to become a British ally they are expressing it in a curious way.
I don’t consider people that fly nuclear bombers at me as my friend.
In addition to the above, they are also providing Fighter jets (for free) to Argentina who is in a dispute with Brittain over the Falklands.
The Russians and the Chinese are trying to assert themselves into the energy export markets.
Do a GOOGLE search on Russia or China and any significant oil exporting country and I bet you will get a hit.
I think they have been reading Jeff’s comments.
thanks!
Fern Wrote:
” The Russians also think the British could be a handy ally. And it costs a lot to lay pipe out of Yamal. It’s permafrost terrain.”
I doubt the Russia considers the UK an ally. For the moment, Russia is “dependant” on the EU to sell is NatGas and has no choice but to rely on the EU as a buyer. Russia’s economy is very dependent on energy Exports. Once its Pipeline to Asia is completed, Russia can use NatGas as a Weapon in the EU with an embargo, and us it as leverage get the American Monkey off its case.
That said, the global economy may just throw a monkey wrench into all Western and Eastern great plans. EU still has a huge debt problem and very high youth unemployment. Greece is about to default, leaving the door open to more defaults (Portagal, Spain, Italy, Ireland) at some point. China great economic bubble is getting closer to a pin as the now it has a real estate and stock market bubble. Juggling more and bigger bubbles makes it much harder to avoid the “pin”. China just might go to war with its neighbors in a last ditch effort to avoid the “pin”.
”Why would Russia bother selling NatGas to any EU members, once this is completed:”
You don’t put all your eggs in one basket if you have a choice in the matter.
The world is probably gradually coalescing into five or six major power centers, namely Western Europe, North America closely allied of course but a separate center, Russia, China , South America , the ”Rest of Asia”.Some folks slice the global pie differently but the point remains the same.
Pragmatic leaders , whether they are fairly nice guys or hard core thugs, understand the importance of allies and good relations with neutrals.
Whatever else he may be , stupid Putin is not.His inner circle is not stupid. Reckless, maybe. They impress me as the sort of men who live to play the ultimate dangerous game-empire.
It wouldn’t be much fun if it were a SAFE game.
I agree with OFM.
Putin is no dummy.
China isn’t dumb.
They both can look at a graph a 12 year old could understand and act appropriately. That looks like what they are doing to me!
They are acting like they are commenters on PeakOilBarrel.com.
Maybe Caelan and his/her anarchy nutters are Russian spies? LOL!!!!!!!
good fun, friends.
“OPEC Shale War Leaves Big Oil Companies as Surprise Victims”
“In the first quarter, Total, BP and Chevron all spent more than they earned. The combined negative cash flow of the five major oil groups was $3.4 billion, compared with a positive cash flow of $17.8 billion a year earlier, according to data compiled by Bloomberg.”
“Big Oil is today squeezed by two low-cost producers: OPEC and U.S. shale,” said Michele Della Vigna, the top oil industry analyst at Goldman Sachs Group Inc.
WTF – low-cost shale oil? GS Groupies bankrolling foggy shale weed?
http://www.bloomberg.com/news/articles/2015-06-03/opec-s-shale-war-leaves-big-oil-companies-as-unexpected-casualty
I think i saw a slude somewhere a while ago suggesting most e&p majors needed maybe $120+ with their old capex and dividend plans. Compared to the estimated $80-100 that shale needs that’s certainly higher, however “less expensive” might be more accurate than “low cost”.
I commented on this article up thread. Cash flow negative will continue to be the theme for all US public upstream oil and gas producers that try to grow or even maintain current production levels.
As I type this, CNBC shows WTI at $57.85 and Henry Hub at $2.606. After figuring in various discounts, public oil producers will realize around $40-43 per BOE with a
70% oil 30% gas/gas liquids product mix.
I do not think costs can come down enough to make it a profitable endeavor to grow or even maintain production.
Oil prices are impossible to predict, but I’d say the situation for US production remains bleak. If the current prices hold, I would not be surprised to see oil rig count shed another 100-300 through this time next year.
US down 7 this week. Canada up 18.
SandRidge (OK/KS drilling) said that over the past year they have reduced the cost of a well from $3.5 million to $3 million. They have a goal to reduce the cost to $2.4 million. Meanwhile, Aubrey McClendon (former Chesapeake, now AEP) said that they have already reduced their well costs by 40% over the past year. In my opinion, Aubrey’s statements should not be believed until verified. Also, let’s assume that the drillers do start ramping up at $65 oil. Well, I assure you, at that point the service companies cease billing at cost, and the costs will immediately start to ramp up. However, at the peak cost, there was a lot of waste. Companies were paying as much to keep employees happy (food, shelter, trips home, etc.) as they were in actual cash salary. So, I would expect that drilling costs probably peaked in 2014 for the near to mid-term.
~10% reduction of cost rigs, dirt, labs, trucks is what the word of mouth from oil patch in Canada, and that with “kicking & screaming” 🙂
i don’t believe 40% is anything close to reality or truth. because with 40% the service people would start defaulting on their loans too. everything is interconnected .
Oil was $57.50 10 mins before NYMEX close.
It closed at $59, with zero news and no contract expiration.
If HFT is trading oil, and it probably is, the government can command the price to be whatever they want.
Watcher,
Bingo, price can be bid up to keep the oil flowing if it need be. They can move price to where ever they want up or down to suit what ever their agenda is at the moment.
I have replied to this post, and to Watcher’s post, below where the format is wide enough to post a chart of Friday’s WTI trading.
If I was operating I would shoot for 25 % CAPEX reduction. The key is to be very patient and optimize well design and actual drilling under the new conditions (for example, a cheaper rig day rate may not justify a very expensive bit).
I have read AEP is on the ropes.
I think they want to say more about overhead cost and compare those between producers and in some perspective makes sense. But is all irrelevant. It’s kind like if you have cholesterol of 8 and your buddy has 9 and you feel “good” even though the suggested upper limit is 5.2 🙂
If it is in order, then it’s the Top 5. High five! ^u^
The Baker Hughes Rig Count is our. Oil rigs down 4, gas rigs down 3. Texas down 7, Eagle Ford down 5, Permian up 1.
wasn’t there a previous thread about “data”?
“The number of active oil rigs in the United States continued to fall in May, as low prices pushed oil companies to temporarily shut down some of their production facilities. Since the end of May 2014, the U.S. rig count has fallen from 1,536 to 646, according to the energy analysis firm Platts—a 58 percent drop.
Low prices and plummeting rig counts have prompted a gusher of headlines claiming that the shale oil revolution, which by early this year boosted American oil production to nearly 10 million barrels a day, is grinding to a halt. The doomsayers, however, are missing a key parallel trend: lower prices are prompting unprecedented innovation in the oil fields, increasing production per well and slashing costs.
That’s the main reason that even as rig counts have fallen, total production has held steady or continued to rise. In the Eagle Ford, a major shale formation in South Texas, production in April was 22 percent higher than the same month in 2014, according to Platts.
In fact, some observers expect a second wave of technological innovation in shale oil production that will equal or surpass the first one, which was based on horizontal drilling and hydraulic fracturing, or fracking. Fueled by rapid advances in data analytics—aka big data—this new wave promises to usher in a second American oil renaissance: “Shale 2.0,” according to a May 2015 report by Mark Mills, a senior fellow at the Manhattan Institute, a free-market think tank. ”
http://www.technologyreview.com/news/537876/big-data-will-keep-the-shale-boom-rolling/
SHALE 2.0
Technology and the
Coming Big-Data Revolution
in America’s Shale Oil Fields
http://www.manhattan-institute.org/pdf/eper_16.pdf
We shall see. I tend to agree with Ves. It is just a matter of degree.
We haven’t seen the big reductions that the big boys claim. But ours is a whole different ball game. Not a lot of discretionary spending.
Mark Mills is still at it? A technocopian extraordinaire who never found a bubble he couldn’t surf. During the dot com era of the late 90s, he claimed that coal demand would grow forever, because data centers. Now it’s ‘shale gas will grow forever, because big data.’
Maybe he is right, that relentless innovation is getting more shale gas out cheaper. But I’ll just note that cutting back on production from marginal wells has the same effect of slashing overall costs and reducing unit production costs as this supposed technological revolution. We should know pretty soon whether it’s technological wizardry or something more mundane.
But a drillable plug with perfect seals made from recycled coke bottles and sold for $1000 is a lot more useful than getting pump data every 2 seconds.
As far back as 1985 I wanted to have well data gathered and coupled to a mimic of an artificial intelligence. That project makes a lot more sense because we have lots of young engineers (and quite a few over promoted 45 year olds) making silly mistakes. We can’t train them fast enough, middle management in general doesn’t fire on all cylinders, and we need to pass on what we know to robots.
When does the app come out? :-}
Sounds to me the guy who wrote the article doesn’t know much about the industry. He couldn’t even write drill pipe. My experience shows all that lot of data does is get people confused, and most of it is way too expensive. What we need is a sensor that lasts three years, to tell us the exact spot where water comes from, for less than 20000 usd.
I didn’t have time to read Mark Mills piece until now. I stopped when he claims near the beginning that technology and big data will cause the shale fields to lower “break even” to $5-$20 per barrel.
I guess Apple will invent an I rig and an I frac that will allow me to simply drill and complete a shale well in my own back yard. I will then be able to tweet my back yard wells’ IP, Facebook about it with all my back yard oil friends and will be able to store my produced oil and natural gas in the cloud.
Might as well go out and plug our Commodore 64 stripper wells, they will never compete will all that big data high tech oil. I’m sure that high tech oil isn’t as messy as our low tech stuff, probably washes right out of your work clothes.
Heck, they may even figure out a way to turn water into wine with this big data.
Even if technology lowers costs, that doesn’t change the geology or the available oil. It might allow more oil to be obtained at a lower price, but then it just runs out sooner and gets used up sooner.
I’ll bet everything I have that the term “fracklog” does not appear in the linked piece before I even read it. Not sure reading that stuff is the best use I can make of my time! Thanks to those that read it for saving me the time.
edit: Bingo! I went to the link and used the “Find” function of Firefox to search for fracklog. Result: “Phrase not found”. I would not have lost anything. Threw in backlog as well, for good measure. Same Result.
Connecting THIS little piece of data to peak oil would take a bit of lawyerly skill but since this forum is one, about oil in particular but also the future in general terms, and two, well populated with old GUYS ( but I bet some women with money to invest are lurking!), and three, we all need a laugh occasionally, here goes.
”It’s known that estrogen has direct effects on stem cell populations in female mice, from increasing the number of blood stem cells (which is very helpful during pregnancy) to enhancing the regenerative capacity of brain stem cells at the height of estrus. Whether these changes have a direct impact on lifespan is what’s yet to be explored. Recent studies have already found that estrogen supplements increase the lifespan of male mice, and that human eunuchs live about 14 years longer than non-castrated males.”
I learned about castration and life span back in the sixties in ”ansci” class (animal science, an applied biology course ) and have seen it demonstrated in dogs ,cats, and livestock such as draft horses.
There is NO question that the effect is real but I can’t vouch for the fourteen years or the latest age at which giving up the family jewels would likely pay off with an extra decade.
But thinking about this is going to keep ME awake once in a while. I ain’t gonna give them up but I am NOT going to be able to avoid THINKING about doing so.Sometimes things long forgotten are best not remembered, lol.
Don’t forget that they make IMPLANTS for guys just like they do for girls. 😉
The only difference is that the girls really only want their headlights to LOOK BIGGER rather than to actually work.
OFM – Were you an advisor to Bruce, oops, I mean Caitlyn Jenner?
The reality is that there is less than a fifty percent chance of being healthy during old age. I never saw the attraction after visiting nursing homes. The healthy oldster is the rarity, but those are the ones you see because they are still out and about in the community not stuffed away in some care facility.
So extending life without first finding out how to make people healthier is a punishment rather than a reward in many cases.
Marble, modern medicine just doesn’t help old people get a little older, it allows mothers not to die in childbirth, it allows children to survive childhood diseases and allows them to live a long life when otherwise they would have died as a baby. It allows middle age people to survive diseases that would have, one hundred years ago, taken their life.
I am a cancer survivor myself. I would have been dead years ago of prostate cancer were it not for early detection and an operation.
But in one way I agree with you. We should not try to extend the lives of those who, without constant life support, would die. But millions of old people, like myself, are living a good life, doing things we enjoy, long after we would have otherwise been dead were it not for modern medicine.
Ron,
Jesus is going to punish you for your sins! Get Ready!!! LOL!!
Mathew: 19:
“And Jesus said to his disciples, “Truly, I say to you, only with difficulty will a rich person enter the kingdom of heaven.
Again I tell you, it is easier for a camel to go through the eye of a needle than for a rich person to enter the kingdom of God.””
Why don’t religious right conservatives do what Jesus wants? They all seem to be wanting to get RICH!!!
Because when you are lieing to yourself and manipulating people, you don’t tell yourself what you don’t want hear
Buckle up!
Hey, don’t knock rich people! We need them to buy a lot of Tesla cars so later the rest of us can buy cheap Tesla knock-offs. :-}
LOL! Good one Marble!!
If we actually listened to Jesus, the economies of the world would collapse.
Jesus’s core teaching was to avoid material possessions and human desires because an apocalypse was imminent (within his lifetime).
We are still here aren’t we?
This would all be a hillarious joke, if it wasn’t so tragic!!!!
This site helps to keep me sane…LOL!!!
The world’s burning. Moped Jesus spotted on I50. Details at 11.” –Slashdot signature.
That’s right, we would all have to be decent to each other and help each other. The economy of the US would drop in half since the weapons industry and HomieSecurity would not be needed anymore. Plus we would be too busy living in a real community and the entertainment industry would fizzle. Just think of all we would miss.
Who am I kidding, we would probably mess that up too.
It’s been interesting watching conservatives freaking out over the Pope. What, support the poor and the environment?
Then Pope will have to be “Sepp Blaterized’ 🙂
Yes Ron, and there are many more millions who are disabled with strokes, dying of cancer, unable to breath, have dementia or Alzheimer’s, unable to enjoy life. They are all hidden away so we don’t see them. For every three or four successes there are 7 or 6 failures. Not great odds, I was talking about working on improving the odds.
Ron, I was talking about the big push to increase lifespan, not talking about eliminating modern medicine. Spring Chicken just arrived, will get back to you on that after I read it. There is a big push to increase lifespan and I do not think that the quality of life is at all guaranteed. A case of putting the cart before the horse because a few might have a successful old age. Statistics show that long life merely increases the odds of getting a chronic disease and or cancer. For men it is close to 100 percent chance of cancer if they live long enough.
Glad you are doing well, modern medicine has saved many of us. However it still has many failures and cancer is one of them. But then the dead don’t complain and are out of sight, out of mind for most, so we go merrily along thinking things are good when it’s merely poor sampling and wishful thinking.
I am a retired MD, 84.5 years old and have had a lifetime of better than average health. But during the past 1.5 years I have had two successful knee replacements, one successful cardiac pacemaker placement, one successful electro-cardioversion, and successful medical treatments. Each has been an adventure. Have cost medicare a bundle. Previously I rarely visited doctors. Not sure whether I want continue along this path. Garrett Hardin and his wife opted for a final exit and his friend L. F. Buz Ivanhoe followed within a week. But having studied population and resources for more than a half century, I would like to hang around to see if the end is near.
Hang on and in 10 years they’ll store your mind in a quantum computer driving a google car, and you’ll be a formula 1 champion.
Dr. Chandra, will I dream?
I am assuming you are joking Fernando.
I enjoy your contributions, so I come in peace! LOL!!
I work in software intelligence and the idea that we will put brains on computers is absurd.
It is nowhere near to happening. IMO, it will never happen from humans on this planet. Maybe a super intelligent race of aliens could do it, but they aren’t on this planet.
I see companies struggling to replicate basic database queries. Let alone how a brain works.
No chance in hell! IMO!
The download your brain on to a computer is way more complicated than the fantasy novels present.
No one understands the brain completely yet, so how could a feeble minded human write software that could understand it?
Easy, they can’t!!!
Lol!
The end of primitive energy sources is near. The end of nature as we knew it is well on it’s way, however nature has a way of filling empty niches.
Mankind is right at an inflection point, scratching at knowledge that is both very horrifying and very reassuring in it’s potential. Will the CERN Large Hadron Collider at it’s new higher energies open the door to knowledge that will allow humanity to free itself of primitive energy and manipulate both matter and energy in new ways for our benefit, or will it just lead to more horrifying weapons of mass destruction? Will our growing knowledge of genetics and biochemistry lead is to a re-integration into the natural world or will it just produce horrific ways to destroy ourselves. Will our increasing power of computing, robotics and material science allow robots and nanobots to farm, mine, and even terraform planets. Or will robotic creations and advanced computing just make us obsolete and we will lose control? Will we be the new cyborgs or will machines just leave us behind as just another useless animal?
We are at such a point where every turn, every direction, every effort can make amazing or horrifying new futures.
Even if we know the answers to these questions, so what? The truly important things in life are not in any of them. Humans spend far too much time missing the point and being distracted by the unimportant. We do not need any of this civilization to lead wonderful, fulfilling and exciting or interesting lives.
Hi Marble.
I have a 90 year old father and a 95 year old father in law, both active (though in obvious decline over the past two years(because, like, they’re over 90.) My mother in law is in hospital at age 90 after a catastrophic decline over the past year and a hip fracture last week.
My point?
All 3 of them lasted 25 years after retirement without a nursing home in sight.
As for Alzheimers and dementia, there is a range of effect: one size does not fit all. My mother had mild dementia for a decade and was cared for at home until her last 3 months. That was two years ago.
You mention no sources for your guess as to the number of elderly in nursing homes vs. the number who are leading lives in the community.
Until you can come up with real figures, your guesses can be dismissed.
-Lloyd
If that makes you feel better, so be it. Cognitive dissonance will take care of things. You also missed the whole point of what I was saying and interpreted it as a personal case.
If you had asked rather than dismissed me, I would have posted the references, however I don’t think you really want to know. Look for yourself if you want to, but you will not like the truth.
Marble:
You made the claim.
You provide the facts.
All else is bullshit.
Und ve do not take ze orders from da likes of you.
Will Nursing Care Take All Your Money? Maybe Not.
http://assetbuilder.com/scott_burns/will_nursing_care_take_all_your_money_maybe_not
*Note that this answer was in response to a specific question from a gentleman with significant assets, so it’s not a general answer.
One of the frustrations of our current economic system is that we need more people involved with elder care, childcare, and care of others who can’t take care of themselves, but we don’t want to pay them much.
Now, the old system had one wage earner who made enough money to support an entire family and then others in the family were available to watch the kids and grandma and grandpa.
The claims of not needing nursing home care merely mean that most of the disabled and dying are getting home care. This puts tremendous strain on the family and care givers. Nursing homes are extremely expensive and families have them stay home until hospice which is usually only a short time.
The insurance system and the medical system bring a lot of people down every year.
http://www.cnbc.com/id/100840148
Just understand that the missed mortgage payment and increased credit card debt is often related to the medical bills they are trying to pay. Whole families are wrecked by the costs of medicine.
Since most of the people on this board are, I would guess, on the wrong side of 50, and predominantly male, most of you might find the following info interesting:
I think that the two most interesting cholesterol studies I have run across are the following two studies:
Lipid levels in patients hospitalized with coronary artery disease: an analysis of 136,905 hospitalizations in Get With The Guidelines.
http://www.ncbi.nlm.nih.gov/pubmed/19081406
Fasting Triglycerides, High-Density Lipoprotein, and Risk of Myocardial Infarction
http://circ.ahajournals.org/content/96/8/2520.full
In the first study, of a very large group of patients hospitalized with Coronary Artery Disease (CAD), about half of them had normal LDL levels (less than 100), but their data implied that a low TG/HDL Ratio was a strong predictor of CAD (less than 10% of the patients had a HDL level greater than 60, or 90% had a HDL level less than 60, and more than half had HDL levels below 40). Of course, the TG/HDL Ratio increases as the HDL level falls. Predictably, the researchers concluded that we may need even lower LDL target levels, despite the data suggesting increasing mortality risks at low LDL levels.
The TG/HDL Ratio, as a strong predictor of CAD risk, was explicitly confirmed by the second study, which showed that patients in the highest quartile of TG/HDL Ratios were 16 times more likely to have a myocardial infarction than those in the lowest quartile.
And a May, 2013 WSJ Article:
Children on Track for a Heart Attack
http://www.wsj.com/articles/SB10001424127887323798104578453123376765286
Excerpt:
The late Tim Russert died a few years ago, from a massive heart attack. According to the statin industry, he had a ideal LDL level (67), but the TG/HDL Ratio strongly indicated that he was at a very serious risk of a heart attack. Here’s the link to the data:
https://baptisthealth.net/en/physicians/documents/online%20cme/dr%20jones_handout.pdf
Mr. Russert’s bloodwork:
LDL: 67
HDL: 32
Triglycerides (TG): 300
TG/HDL: 9.4
I can’t help but wonder if Mr. Russert’s tragic death was a case of death by conventional wisdom, i.e., statin treatment and a low fat diet (which would probably have contributed to the high triglyceride level). A quote by Professor Abramson, a Harvard Medical School professor and researcher:
In any case, Mr. Russsert’s sky high TG/HDL Ratio was indicating an immediate risk of a cardiac event, with a predominate Type B LDL particle size pattern (Type A LDL particles are large, Type B are the small dangerous LDL particles). The TG/HDL Ratio is an indirect indicator of LDL particle size.
Here is a link to a graph from the first study linked above (on 136,000 heart attack patients), showing where Tim Russert would be located on the LDL chart:
http://i1095.photobucket.com/albums/i475/westexas/LDLandheartattacks_zpslrrogugw.png
A post on the TG/HDL Ratio:
The Triglyceride/HDL Cholesterol Ratio. What Is Ideal?
http://www.docsopinion.com/2014/07/17/triglyceride-hdl-ratio/#disqus_thread
I think the medical industry is not paying enough attention to glycemic index and insulin levels. About 60 percent of people have the ability to produce large amounts of insulin. When the bloodstream is overloaded with glucose, the typical cellular storage is overwhelmed and more insulin is pumped into the bloodstream. Insulin in combination with glucose and cholesterol form fatty chains. These can be stored as fat for later use and can also be deposited along the arterial walls.
Glucose concentration spikes occur when ingesting sugar and/or starches. Eating low glycemic index foods and not over-eating will help prevent these surges that feed the plaque buildup cycle.
Funny how the modern diet is filled with sugar and fast digesting carbohydrates.
Great post and congratulations for making the top ten. Well deserved.
Russia exported 223 million tons of oil.
223, multiply 7.3 times 223, you’ll have the millions of barrels. 1,627,900,000 barrels of oil. Times 75 dollars per barrel, an average, in 2014, Russia more than likely was paid maybe 122,092,500,000 usd for the oil they exported.
That amount has now changed to probably twenty percent less. It’s dog eat dog, a jungle, and Russians are shrewd horse traders, they’re going to have something in return.
Oil Company A has a price of x, later on down the road, it is 1/2x, then a little while later, it is 1/10th x, then later on, it is 1/20th x, then Oil Company A acquires a loan, issues more shares, more than double, the price drops below 1/20th x,
has problems with revenues, much too little, however, Oil Company A continues operations and continues to lose money. BAU for the corporate officers, i.e. the salaries are paid, tough luck for the shareholder bagholder.
What banker in his right mind loans money to Oil Company A and continues to do so? A banker with amnesia or CRS disease, fairly obvious.
When the warrants are kaput, so is Oil Company A. Bank becomes owner of the working interest in all wells worked by Oil Company A. Some redemption in there somewhere. It’s a complete mess, no two ways about it. A fall from grace.
The lesson is learned. Don’t buy oil company stocks working the shale, you’re going to lose money, one hundred percent guarantee, buy automobile company stocks that can manufacture vehicles one after another and sell them.
Russia’s crude oil and refined products exports (mln tons / year)
Source: Central Bank of Russia
Continental Resources produced 206,829 net boepd from 2206 net wells, 69% oil, in Q1 2015. 93.76 net boe per well.
LOE per boe was reported at $5.05. This comes to $14,204.26 per month per well by my calculations. $170,451.12 per well for the year, if LOE stays flat,
$180,000,000 was budgeted for existing well CAPEX per investor presentation. That would be $81,595.65 per year per well. $6,799.64 per well per month. If treated as LOE, adds $2.38 per boe.
Lets assume in 2020 these 2,206 net wells produce 30 boe per day per well and total expense to operate is $250K per well. $22.83 per boe. Lets assume well head is $80 per barrel oil, $5 gas, 70/30 mix, so $65 per boe in 2020. Subtract 10% for severance taxes, or $6.50 per boe. $2.00 per boe for g & a.
So they clear $33.67 per boe. 24,155,700 boe produced for the year. $813,322,419 of income before taxes and interest.
These 2,206 wells currently secure over $7 billion of long term debt. Who knows how much, if any gets repaid between now and then? Lets assume none is. So assume 5% interest or $350,000,000 of interest expense.
Now we are at $463,322,419 before income taxes. Assume we have used up DD&A on these wells by 2020 and effective income tax rate is 35%. So net cash flow is $301,159,572 on wells still securing $7 billion of debt.
I guess I am wrong to assume they will not use the income from these wells to reduce debt principal in the interim? Hasn’t happened yet.
Would like feedback. Thanks
Shallow, looks like a pretty realistic projection to me. You didn’t include non-completed wells, but completing those would also add another cool billion to costs. Also, you seem to assume 90$ WTI, as CR has a WTI differential of about $10.
> I guess I am wrong to assume they will not use the income from these wells to reduce debt principal in the interim?
So far Hamm hasn’t given the impression of wanting to slow down and reducing debt.
I was surprised to read in their 2015Q1 that much of their cash outflow was still related to the 2014 drilling program. Looks like they have pretty good credit at the suppliers? I had assumed most drilling would be paid upfront. It also means that in the next quarter there will be a large outflow, as they continued pretty strongly in Q1.
”So far Hamm hasn’t given the impression of wanting to slow down and reducing debt.”
I have often heard it said that when really rich people ” go broke” they continue to wear the same clothes and eat the same foods and never lose any weight. I have had very little personal contact with rich people but I have noticed that this appears to be nominally true.
If Hamm goes broke I expect the loose change under his sofa cushions, so to speak, will dwarf my total assets and the assets of most members of this forum.
He got to the top by gambling big.
I believe he is continuing to gamble on the price of oil going up again before he runs out of easy credit.
Personally I believe this is probably a fairly safe gamble for him, given that my own layman’s opinion is that oil will be back at eighty or ninety bucks within a year or so.
Rust and depletion never sleep, courtesy of Matt Simmons.
The overall economy just keeps on surprising all us pessimists , doesn’t it?
The efficiency of oil use is improving fast even as the population of people and especially automobiles continues to grow. You can drive a new Corvette today, if you have the necessary cash or credit, that will go as far on a gallon of gas as some econocars used to go.
There are still a lot of old jets in service that use twice as much fuel per passenger mile as the newest models.Heating oil is a dead man walking business sure enough, it already SMELLS like a zombie.
And pure electric and plug in hybrid cars are nibbling the oil market like rust on poorly painted steel. Pretty soon they are going to be taking up some market share. When they hit just two percent of market share that will wipe out very roughly one percent ( eyeballed ) of the demand for oil. At first glance this says ” cheap oil” due to reduced consumption, but reduced ( forced by depletion )production says ” expensive oil” and such cars will enable drivers to afford gasoline.
Most likely the overall economy has at least one or two more rallies left it it before it rolls over and dies.Time enough for Hamm and people like him.
Lets just hope the eventual baked in ride off the down side is gradual rather than abrupt. A fast decline will DESTROY the bau economy.Just about everybody agrees on this.
A slow gradual decline might not. There is an incredibly large amount of space available to adapt- given time.
Enno. Oil price is always the biggest wildcard in these types of projections.
Would you be willing to give me your opinion as to what those 2,206 wells will produce in boe terms annually from 2015-2020?
I am not going to include refracs or fraclog because I do not view those actions as profitable at current oil and natural gas prices. Those actions in my view only add more debt.
I realize we are dealing with some lower decline (Red River units) plus OK unconventional (SCOOP, etc.). So maybe 80 for 2015, 70 for 2016 60 for 2017 50 for 2018 40 for 2019 30 for 2010. I think that is generous to CLR, and even think 30 in 2020 is generous, given that is net, so 37 would be gross boepd.
As to oil price, could just use the strip, and that would make things look impossible for CLR, but I am willing to try that or other figures.
Also, maybe OPEX will fall per well? There will be less water hauled, and maybe failures decrease in frequency as wells are only pumped part-time?
I am up for suggestions on these variables. Taxes might be tough, I bet if they completely stopped drilling, there would be lite DD & A after 2015 or 2016.
If I have time later, I could run suggested variables, or for that matter, someone else could, there are people here with much better math skills who use spread sheets, etc.
CLR is really a pretty simple company when you get down to it. At then end of Q1 they had 2206 net wells, all onshore, all in the USA, with a 70/30 oil gas mix. With slight exceptions, they have sold all of their pre-shale boom production, and are betting the farm on it, with little to no conventional to mess up projections. (For example, Whiting still has their CO2 flood, which is less than 10% of current production, but is about 20% of reserves, has a low decline but higher OPEX).
I think this is a valuable exercise. It is a what if so show what happens to CLR, one of the stronger US shale companies, if bank and investor liquidity were cut off. I’ll see if Enno or anyone has production decline suggestions, and then later try to work up something.
Again, if anyone sees anything wrong in my simplistic approach, please comment.
I ran a quick calculation for years 2015-2020 on the 2,206 net wells assuming full year production averaging 80 boe per day per well in 2015, and then decreased 10 boe per day per well to 2020, where I end at 30 boe per day per well.
For $ realized per boe I started with $45 for 2015, then increased $5 per year through 2019 to $65, then kept constant at $65 in 2020.
I assumed $350 million annually in interest expense and an effective tax rate of 25%.
From 2015 through 2020, the properties generate free cash flow of $5,699,099,000.
So, assuming the above parameters, CLR exits 2020 with net debt of $1.6 billion and 66,180 boe per day.
Very simplistic calculations, but if WTI and natural gas rises slowly the next 5 years and then flattens in 2019, this company’s 2,206 wells as of Q 1 2015 are still in the hole.
Paying down principal and reducing interest payments, I agree, would help. I’ll maybe work on that later, but need to get going today.
Feel free to play with the numbers. I think I am correct that shale needs a price spike soon.
Shallow,
If I assume that all Continentals production declines in a similar fashion as the production from all its wells in ND ( with the same age distribution), which I think is reasonable as still about 70% of their production comes from ND, then I come to the following projection. Gas numbers might be off, as I think they own some gas producing properties elsewhere that might have a different decline profile.
Enno, thanks. I will try to run those numbers later. I will say that they are not as generous as mine, especially in years 2016-2019. So result will be more in the hole.
I will assume they use free cash flow to pay principal rather that putting in the bank or dividends to shareholders, so that should help.
Enno. Thanks again for the production estimate.
I used it and recalculated, paying down debt principal at the end of each year. The result is in 2020 CLR exits with $1,781,739,000 in long term debt. This is assuming OPEX and oil/gas prices set forth above.
Of course, the current strip is much worse than the prices I assumed.
Hi Enno,
What did you assume was the average age of the wells?
We don’t know how many wells were brought online each year, although you could do it with your data base, but it would be a lot of work. Did you find the number of wells for each month (or each year) and multiply ny the well profile? Or did you assume the wells were on average x years old and do a simpler calculation?
Hi Dennis,
I use a large matrix:
I start with the production number for wells grouped by their age (in months), and then applying the correct (historical) decline curve to each of these starting amounts depending on where they are on the decline curve. That gives me the projected production for each well age group, which is summed up to give the monthly totals. Using the right tools, this is very easy to do.
Hi Enno,
Very cool, nice work. I don’t have the skills you do, it would mean considerable work for me putting that all together.
Shallow, Enno
Just read an interesting post on the Eagle Ford forum where an operator supposedly incorporated a gas lift system in the original well completion design. Re-injected gas is recovered at bout 80% rate, recovery might go from 8% to 12%, compressor is powered by well’s own produced gas.
If it proves viable ongoing, it could significantly impact much of the LOE issues you have raised with other AL systems.
Quick aside … you (ss) had asked my views way back on pricing and I consistently refrained from projecting due to the many variables involved. That said, the events ongoing in the ME – most specifically the political intrigue in KSA – bodes for significant volatility in oil production, and, perhaps, long-standing political entities.
My 2¢.
Coffee, gas lift mandrels are installed in wells during the initial completion if the intent is to use gas lift later in the well life.
I can’t discuss the technical details….we use gas lift valve dummies in wells where we dont have a good idea about the well performance, and later run the valves on wireline. Gas lift avoids all those pump issues, but it doesn’t draw bottom hole pressure too far down. However, that’s a non issue in a low productivity well.
It works really good in multi well pads, because the gas lift is distributed from the compression system using a manifold.
Fernando
Thanks for the feedback.
A few months back, some operator gave a wide ranging interview that touched upon a great many issues shale-related in regards as how the industry has addressed many shortfalls in this still-emerging field. (BTW, your ideas of effectively designing a drill/production program in the Bakken are already being precisely implemented as described in a recent WSJ article “Future of Shale Drilling” by Liberty Resources, a small, top notch operator).
The operator described, in the interview, stuff like high decline rates, increasingly effective frac’ing designs, and how the industry has been having to adapt traditional, vertical drilling procedures to one and two mile long laterals, 10,000 feet down.
He emphasized vigorous research is being applied to better extract resources, in particular via different artificial lift processes.
Still an ongoing work in progress.
Coffee. I have read some articles about Liberty. I agree they appear to being doing things the right way operationally, and with private money as opposed to through the public markets.
It is interesting that Liberty Resources is not drilling or completing any wells in the Bakken at present. This is yet further confirmation that almost all wells completed in the Bakken in the current price environment are doomed to economic failure.
The ones in charge are more likely making decisions based on economics of the well because they are using their own money.
Shallow
Cue the previously described joke by Boone … “Could be worse … could be our money”.
Coffee, I got the impression they need to visit western Siberia and see the giant multi well pads. Visiting an old offshore field, or the horizontal well heavy oil waterfloods in Canada will give them ideas they can modify and copy for surface solutions. I learned a lot visiting fields all over the world and seeing how they did it.
Hi Shallow sands,
Thanks to Enno Peters, I have North Dakota data to estimate the average North Dakota Bakken/Three Forks well profile.
The average well profile for 2008-2014 North Dakota Bakken Three Forks wells is shown in the chart below. Also an excel file is at link below:
https://drive.google.com/file/d/0B4nArV09d398X0Z4MExlZE02Rk0/view?usp=sharing
How old are these wells? How many are in which formation? Do they publish a production forecast for oil, gas, and ngl over the next five years?
Fernando.
For Bakken, well age would be 2004-2015, with more being 2011-2014 than for the other years. I have not seen a forecast of oil production for the next five years. Would need to look at 10K. They have reserves estimates, but there is no engineering report that I have been able to find showing annual PDP. I’ll look again.
I’ll look up the breakdown for wells by field.
Fernando, 1,393 net wells in Bakken, 259 net wells in Red River Units, 554 net wells in OK, including SCOOP
Bakken accounts for 65% of boe per day, Red River Units 7%, SCOOP and other OK 28%.
I guess the decline is lower in the non bakken reservoirs. And the older bakken may decline less. I would need to do a spreadsheet with the individual well streams to see if the cash flow analysis is right. I mention it because these guys must be preparing something to convince people to buy their shares. Do they put up presentations to the stock pickers?
Yes, go to their website. CAGR is now a big term, due to the ability of capitalized annual growth rate calculations to mask uneven growth.
CLR says they will be cash flow neutral by mid year. I think they may achieve this through a dilutive stock issuance.
A NYT article on what in Texas we call the “Rule of capture” in regard to California’s rapidly depleting groundwater supplies. 60 Minutes had a program earlier this year on global satellite gravity measurements that were indicative of the global drawdown in groundwater supplies.
California Farmers Dig Deeper for Water, Sipping Their Neighbors Dry – NYTimes
http://www.nytimes.com/2015/06/07/business/energy-environment/california-farmers-dig-deeper-for-water-sipping-their-neighbors-dry.html?hpw&rref=business&action=click&pgtype=Homepage&module=well-region®ion=bottom-well&WT.nav=bottom-well&_r=0
The 60 minutes segment was first broadcast last November but was re-broadcast last Sunday. It is well worth anyone’s time to watch it. It shows what is happening all over the world to our groundwater.
This “60 Minutes” Report On The Planet’s Groundwater Depletion Will Leave You Quenched
One mans poison is another mans meat.
I AM NOT argueing that California running dry is good for the country or the world. FAR from it.
BUT it is never the less true that as water resources dry up in areas dependent on irrigation opportunities expand for farmers in places where irrigation is not needed.
MY property borders a substantial stream very near its headwaters. Nobody upstream is going to be using much of the water in it as it comes out of a very rough mountain area a large part of which is owned by the National Park Service.
So I can irrigate to my hearts content- if it becomes necessary – at least until local laws and regulations change substantially. This is very unlikely to happen within my own lifetime if ever.
The increased cost of containers and trucking has already resulted in local farmers being able to resume profitably growing some crops such as potatoes which we used to grow- until northern growers took those markets due to their better suited climate.They get more per acre at less cost per bushel but two dollar plus per bushel trucking wipes out their competitive advantage.
California can easily pass laws restricting water withdrawals. . They like to think of themselves as hoitty toity environmentalists, and I’m pretty sure eventually they’ll copy what Texas does when it has to.
The problem is subsidence due to groundwater removal is non-reversible. One result is you eventually lose your aquifer (forever): It’s a growing problem throughout the world. In some cases, such as Bangkok, the result is increasing seawater flooding. God knows what the long term result will be for California’s agriculture.
God knows what the long term result will be for California’s agriculture.
It is very likely that California does not have any long term future in agriculture. And it certainly does not have any long term future for irrigated agriculture.
California certainly does not have a long term future in agriculture at anything approaching the current scale for sure.
But if the population levels off and rainfall and snowfall return to something approaching the averages for the last half century or so then I can see the state still being a truly important agricultural center.
There are ways to run a farm with less water that are so far not dollars and cents practical for typical California growers.
They will have to spend a lot of money to adapt and some or most of them may have to switch to crops that require less water – or simply cut back their acreage by half or maybe even more.
IF the drought continues a few more years ………… Ron is dead on.
I can see a prosperous city running on desalinated water but I have a hard time imagining an open air American farmer being able to pay for desalinated water.
Some extremely specialized growers of herbs and spices which fetch VERY high prices MIGHT be able to make a go with such expensive water.Some greenhouse operations require relatively little water since evaporation is quite limited – unless the weather is sunny and HOT.
So MAYBE a greenhouse operator could afford desalinated water … if he gets a premium price.
Lots of things become practical when you double or triple the price. And in the case of fruits and veggies – doubling the farm gate price generally raises the retail price by maybe a quarter or a third.
Most of the retail price of fruits and vegetables goes to packers,processors, advertising, warehouse and cold storage operations, shippers, shrinkage and retailers in no particular order.
Everybody along the way hires lots of help and all that help has to pay social security and income tax. The tax man gets a share at EVERY level.
Apples for instance generally bring an orchardist only about twenty to twenty five percent of the typical per pound supermarket price. Only occasionally more , often less.
The only real exception is when supermarkets run apples as loss leaders. Then the markup is less.
This general rule applies fairly well right across the board from apples to Zucchinis.
Sometimes a staple such as potatoes will sell in season at retail locations near the grower for only double or so the farm gate price- if purchased in fairly large bags- ten pounds or up.
And every ONCE in a while -you can buy a given produce item at retail for LESS than the current wholesale price. This occurs because retail management occasionally contracts way ahead and plans advertising etc well ahead too. The farm gate price can double or triple in the case of really bad weather etc after the deals are made.
Large operators generally hedge such deals. The idea is that you have those specials every week so as to keep the regular customer coming. You make up any losses on all the thousands of other items – and then some – hopefully.
The Great Plains are also at risk of losing their water.
Drying times: Could the rapidly depleting Ogallala Aquifer run dry? – haynesville.com
How long before the Great Plains runs out of water? – The Washington Post
You won’t see it emphasized to any serious extent in the msm but there are already spots around the borders that are dry and a lot of farmers have already spent serious money deepening irrigation wells.
You don’t need to be a hydrologist to understand the data, it is as obvious as the sun at high noon if you are willing LOOK at the data.
The Ogalalla IS drying up , and will continue to do so, barring climate change bringing MUCH more rain to the middle part of the country – or something putting an end to pumped irrigation.
Most pumps are diesel driven these days because the grid is not sufficiently robust to run lots of high horsepower electric motors in the deep country.Furthermore running cable from a service drop to a pump a half a mile or more away costs a fortune in and of itself. Extending the water lines a long way from a well is likewise very expensive. Moving such heavy cable or pipe very often or very far is not practical but moving a diesel powered pump is just another heavy duty chore. Moving pipe and pump is FAR easier than moving long cables.
The only practical and affordable way for now at least to move electric power very far is with bare conductors permanently mounted on insulators on permanently set poles. Basically this means a pump needs to be within a few hundred feet of the last power pole which is part of the grid.
Not being a midwestern grain grower I can’t say what the optimal spacing of wells and pumps is but there is a practical limit to the distance between wells and another practical limit to the length of power supply lines and a third limit involving the distance between a pump at a well and the discharge end of the water lines.
Wind power could be made to serve if diesel gets to be too expensive and a lot of wind machines will probably eventually be installed all thru grain country which generally has a good wind resource.
Pumping water for irrigation is a really good way to use intermittent wind and solar power. Irrigation is not at all time sensitive compared to most other electrical loads. A day or two earlier than needed or a day or two later than optimal doesn’t make a really big difference. IF the juice is cheap enough it would pay to water earlier than necessary to take advantage of any surplus wind power.
But getting the power from the home base of the farm – the place where the house and shops etc is located, and where the grid connection terminates – out to the more distant crop land is going to require installing lots of poles and miles of overhead conductors which will be needed only a few weeks out of the year at most. This will NOT be cheaply accomplished. Any given typical midwestern grain farm would need a mile or two, or more, of new lines running from the service drop to the wells scattered over a thousand acres or more of cropland. These lines would have to be high voltage – meaning a transformer would be needed at the terminal ends to get the voltage down to a level safe and practical to work with.
I suppose the electrical engineers and their professional buddies can figure out a way to make a few big turbines work scattered here and there all thru farm country if somebody is willing to pay for the necessary grid upgrades.
Somebody will eventually HAVE to pay for such upgrades if we want to keep eating the American way unless the biotech weenies strike gold and figure out how to manufacture diesel fuel for no more than say seven or eight bucks or so per gallon. I am not holding my breath but it could happen. Eventually. Maybe. Not before the aquifer is dry anyway, most likely.
Putting twenty dollar per gallon diesel fuel in a TRACTOR , if it goes that high someday , will still be cheaper than farming with a horse – but running a diesel powered pump day in and day out is another ball game altogether and can easily result in a fuel bill exceeding ten thousand bucks a month at the CURRENT price of diesel. And that’s just for a piddly little runt as pumps go these days.
Peak oil is going to have a whole LOT to do with peak irrigation.
I am unwilling to guess whether ground water depletion or oil depletion is going to cause us the most trouble collectively in the near to medium term. In the long term both are going to be KILLER problems.
In some places the ground water is already pretty much exhausted and in others the price of diesel is already too high to use it to pump irrigation water.
OFM,
I doubt that a whole lot of rain or snow coming to the High Plains would do anything for the Ogalalla. The water in the aquifer is fossil water that dates to the melting of the ice and snow on the Rockies, at the end of the last ice age; the volume was very large compared to modern precipitation, as it had accumulated over a very long time. A good deal of it has already been pumped out in the southern parts of the aquifer (the situation is not yet so dire in the northern part) and in some regions the water table has dropped tens, maybe scores of meters, costing lots of money for deepening wells and pumping water up greater distances.
Rain and snow add to the ground water at no great depth, and that water is easier to get at so I expect it to be put to use for irrigation if it becomes available.
The water table dropping tells the story: withdrawal is exceeding recharge. It doesn’t bode well.
There has been talk, over the years, of giving the Great Plains back to the buffalo. Maybe it will happen if irrigation is no longer viable.
It was a mistake to steal that country in the first place.
Doug, don’t overdo it. A shallow sand may lose a few porosity units, but the aquifer won’t disappear. And sea water intrusion is only possible if the aquifer contacts the sea. I don’t think the important California aquifers are by the sea, are they?
We had subsidence in the Houston area, the government changed the water supply rules, put in restrictions, but the fresh water wells are fine. They can be pumped, we didn’t see any collapses or anything like that (I mention it because I have a property near Houston that was connected to water wells, but nowadays we use surface water from the San Jacinto River).
No, Bangkok and other cities in Asia are sinking between 0.8 and 2 inches each year due to over pumping of freshwater from wells. It has been determined that the rise of waters in the nearby gulf as a result of global warming combined with the sinking land may put Bangkok under water much of the time by mid-century. Similar outcomes are likely in several other major cities.
The stratigraphy of much of California is such that aquifers compressed owing to overpumping of groundwater are being destroyed forever. This is not a debatable issue. It is not a simple matter of draining a sandstone layer that can be recharged in the future. Seawater intrusion (movement of seawater into fresh water aquifers) is another matter entirely.
Ok, so they got sea water intrusion in Oxnard. All they got to do is stop pumping water out. When they have excess water they can pump it in.
An aquifer isn’t destroyed. It’s contaminated by sea water. But the rock is pretty much the same, just a little lower porosity and permeability.
Rock compressibility and compaction are one of the most important factors in heavy oil recovery. I saw some companies blow their predictions because they didn’t understand the rock behavior. Not all rocks are like in Lagunillas, Long Beach, or the North Sea chalk fields.
The sea water incursion is in the Oxnard Plain, a smaller but still important agricultural area.
Dennis, try this
http://climateaudit.org/2015/06/02/implications-of-recent-multimodel-attribution-studies-for-climate-sensitivity/
Use the results from this study to estimate the peak surface temperature 300 years from now, with your estimate of worldwide fossil fuel production. Or do you think we should ask the author if he wants to write a paper about the subject?
Venezuela update: things look very unstable. Yesterday, Maduro cancelled a trip to Rome, where he was to meet with the Pope. He said he had an ear infection. But the consensus is the pope was expected to tear him down.
http://www.euronews.com/2015/06/07/venezuelas-maduro-cancels-pope-meeting-due-to-flu-amid-human-rights-criticism/
Maduro got on TV and declared that, if his government fell, there would be massacres. The Chavista Phenomenon also said the electoral commission would announce election dates “when it feels like it”.
Inflation is running over 100 %, and I’m getting reports the food and medicine shortages are terrible. A petroleum engineer friend of mine contacted me two days ago, said he had fled. I should be able to get pretty good inside view from him when he reaches Houston.
About a year or so ago, even before the recent worsening of the Venezuelan situation, I read a story about a grandfather going to about 20 grocery stores, unsuccessfully trying to find powdered milk for his grandson.
As we have previously discussed, I suspect it’s when, not if, that Venezuela puts restrictions on the ability of their citizens (especially highly qualified people like your friend) to flee the worker’s paradise in Venezuela–following in the paths taken by East Germany, North Korea and Cuba.
They already have unofficial restrictions. It’s nearly impossible to have school grades and diplomas certified and notarized. This is important for professionals so they can work elsewhere. They can’t find a legal way to move the money if they sell their home and vehicles. And in some cases they can’t find passports (I helped a physician get away and I loaned the family money in U.S. Dollars they tell me they used to “encourage” officials to issue passports).rr
But the key, as far as this blog is concerned, is that Venezuela’s oil production should continue dropping. The panic I see in Maduro’s speeches is real. Former Spanish Prime Minister Felipe Gonzalez just landed in Caracas. The dictatorship organized Cuban dictatorship style “repudiation” acts against Gobzalez, and I sense the current chaos is going to get worse.
Very good NYT article on palace intrigue in Saudi Arabia. Methinks that there are lots of unhappy Saudi princes in other branches of the royal family.
Surprising Saudi Rises as a Prince Among Princes
http://www.nytimes.com/2015/06/07/world/middleeast/surprising-saudi-rises-as-a-prince-among-princes.html
Mr. Brown
Throughout all recorded time, across all cultures of which I am aware, hereditary governing systems seem to inevitably reach the point described in the above article.
The ‘flattering’ of aging rulers by female companions pushing their own agenda causes … tension … in the halls of power.
Throughout all recorded time, across all cultures of which I am aware, hereditary governing systems seem to inevitably reach the point described in the above article.
World history isn’t an area of expertise for me.
But it seems like cultures move from tribes to kingdoms to perhaps something else. So it’s probably the nature of governing systems that hereditary governing systems break down. The hope is that they are replaced with something better rather than worse (e.g., a fascist dictatorship).
While reading the NYT article, I was reminded of the play and movie, “The Lion in Winter,” about the palace intrigue between Henry II of England, his wife Eleanor of Aquitaine, and their three sons, plus various other characters, over who would succeed Henry. It’s not an exact parallel, but the palace intrigue is similar.
Of course, in Saudi Arabia, because of the size of the royal family, there are a couple of orders of magnitude difference in the number of players involved in the palace intrigue.
A good book about Saudi Arabia that I have previously recommended, “On Saudi Arabia,” which was published in 2012:
http://www.amazon.com/Saudi-Arabia-People-Religion-Future-ebook/dp/B007MDK5GM/ref=tmm_kin_swatch_0?_encoding=UTF8&sr=8-1&qid=1433698190
Excerpt:
This is of course not a black-and-white/cut-and-dried/kindergarten issue.
Whether there was less, more or as many relative deaths/violence needs to be taken in contexts with possible tradoffs; biases; population-scales and samples; interpretations, ideologies and agendas; delayed effects; coercion/structural violence; illegitimate authority/threat of violence; emergent properties (such as of human/systemic complexity); comparisons (relative, absolute); vertical/imposed hierarchies; relative democracy and lack thereof; uneconomy; poverty; social unrest/instability; ideological victimization/indoctrination; ethics and lack thereof; landlessness; homelessness and so on.
That Pinker Quote
———
The movie isn’t over yet.
I agree that the powers that be in the US have power because we grant it to them.
Similarly, the wealthy of the world have power because we accept that the symbolic money that they hold (based on what is stored on computerized systems) entitles them to more than the rest of us.
I would like us to realize that the primary reason the Kochs have so much influence in US politics is that we let them have it.
But trying to get voters to think in different terms is not easy. We have a lot of people who believe what Fox News tells them, even if it tells them outright lies.
Now, I have no problem with intentional communities, and I think forming them is a great experiment. The ones that can succeed and expand can teach us something.
But I don’t think writing articles about the misuse of power influences the average person. And the average person, when voting collectively, can still determine politics in this country.
Now, let’s say you believe the problem is education. If we could educate our children to be receptive to a stateless society, maybe it would happen. But trying to get access to school curriculum is no easy matter. We’ve still got school boards trying to stop the teaching of evolution.
Boomer II, I am done the ‘manifesto’ for Permaea. It’s about 5000 words I guess, but maybe half of it is quotes.
I just have to tweak it a little and that’s it, and will be doing that this afternoon at a cafe.
I had thought of crowdsourcing, to the permaculture community, some of the writing, or at least editing, but thought about it only after it was about finished. My point, though, is that Permaea is a crowdsource and, as such, is about and for you, me and everyone else.
Is there a link to it yet?
Also, are you planning on getting it on the P2P Foundation website? That’s the best place I have seen for collected knowledge on various peer-t0-peer and crowdsourced networks.
P2P Foundation is part of the idea if you think it’s a good idea for people and planet.
P2P Foundation is part of the idea if you think it’s a good idea for humanity.
I’m not sure what you mean? If I think the P2P Foundation is good for humanity or your manifesto is good for humanity?
I’ve just found the P2P site a great collection of articles about alternative economics, collectives, peer networking, crowdsourcing, and so on.
It grew out of online networks, so there are a lot of discussions about that. It’s not a back-to-the-land site, though those discussions are a part of it. The hope is that electronic networks can facilitate and speed up the transition to P2P sharing. The goal isn’t to get rid of them by eliminating electricity generation.
I’d say that it’s sort of a post-capitalism site. It’s a big tent kind of place. A variety of concepts are represented.
Caelan, there is one thread running through all your googled critics of Pinker, they contain a pages and pages of philosophizing but not one iota of data. Fred Magyar wrote up thread:
Well, whether you like Steven Pinker or not, really doesn’t matter all that much. What does matter is the data. As Matt Simmons used to say: “Look at the data, look at the data again and then look at the data one more time and then form your conclusions”
Pinker, LeBlanc and Keeley quot reams and reams of data but their critics do not quote a single digit of data. The reason is obvious, Pinker is all about facts and data, his critics are all about ideology. They can all quote philosophy to support their ideology but none of them can quote any data to support their ideology.
I would suggest Caelan, that either you show some data to support your ideology or fold your tent an go home.
You cannot philosophize the data away.
Ron,
I have already assumed the data to be correct for the sake of a portion of my arguments.
Also, I question the suggestion that we need read a book for every argument we might have on something. That might be the case if we were specialists in the fields-in-question, but that may not work for the rest of us, maybe because we are not paid to do so, or we do not necessarily have enough hours in the day. So we sometimes have to rely in part on specialists/critiques/reviews/etc.. That comes with the complex society we live in.
Otherwise, why don’t you repair your computer, car, house, clothes and grow your own food yourself, while you’re reading Pinker and Le Blanc and having arguments about them online; going to work, getting stuck in traffic, raising a family and kicking back with some well-deserved leisure time?
And since we are talking about ‘common threads’, it would seem that my take with regard to Pinker et al.’s assumed-to-be-correct-for-the-sake-of-argument findings is somewhat similar to my take on climate change, which can be sort of summed up in that comic where a guy is standing up in an audience, saying something to the effect of, “What if it’s all a hoax and we create a better world for nothing?”.
IOW, I don’t care if climate change (’19’ years of no warming?) or historical violence statistics (’50’ years of less violence?) are correct per se, because I am more interested in the bigger/longer picture, holism, context and in a better world.
And I don’t see the current crony-capitalist plutarchy as a better world. I see it as worse than anything we’ve ever had.
So what that it is sunny and mild out and the temperature is in the normal range today?
It’s likely an illusion and it will come, and is coming, to bite us all in the asses.
“Look at the data, look at the data again and then look at the data one more time and then form your conclusions” ~ Matt Simmons(?)
“There are three kinds of lies: lies, damned lies and statistics.” ~ Mark Twain
Caelan I know your heart is in the right place but your head is out of sight in the sand or a worse place.
”And I don’t see the current crony-capitalist plutarchy as a better world. I see it as worse than anything we’ve ever had.”
I would most likely be dead myself except for our current economic and political systems.
Just a couple of generations back from my own, people routinely killed each other on a fairly regular basis in the neighbor hood I live in today. They went without dental care. If they didn’t have children or church to help them they died slow hard deaths as their health declined , being unable to look after themselves properly.
It is a waste of time even trying to discuss such matters with you. From here on out I will do my best to ignore you.
Caelan sounds a lot like the young activists stirring things up in the late 1960s. However, they didn’t change the world as much as they had hoped.
It’s damn hard to get people mobilized (without ordering them to do so) even if you think it’s for their own good.
And there were all sorts of alternative communities started in the 1960s, but most of them didn’t survive.
While it might be nice to think of humans as noble savages if we just take them back to a simple, natural lifestyle, getting from here to there will involve more global social engineering than we have ever attempted on such a large scale.
Wow, really? LOL ‘Just a couple of generations back’ doesn’t help Pinker, does it?
Tragic comedy aside, it’s as if some have never heard of drawdown, despoilment, or destruction before, or the untold violence committed in the name of the (un)economy and elite western imperial powers on the planet which has included native populations, pristine wilderness, and countless species. Have never heard of collapse before or why it happens.
But what with governpimp tax theft now going toward fighting ISIS/ISIL/IS; the Middle East and surrounds getting hotter (and that presumably includes temperature); increasing social unrest globally; and ‘our’ manufactured lifestyle’s stomping, dancing and wiping its feet on the backs of our descendents that may never be born, you may find that I am the least of your willful ignorances, old farmer mac.
We could surround tigers in cages, in zoos and throw Monsanto meat to them through the openings and call that era the best time to be a tiger, and the least violent ever, but it would be artificial and out of context.
We could turn the world into a park, like a golfcourse, drain the marshes, with lawns everywhere, self-domesticate ourselves into relative uselessness, overdependence and a precarious existence. Into oblivion. With dental benefits. Turn the entire planet into a zoo. And have nothing left worth living for as we pace, psychotically, back and forth in our cages, in our workplaces.
This state (de)construct may prove a blip in our free-roaming, hunting and gathering history, but a decisive one:
Should we be so lucky to return there once again. Because if we can’t get our acts straight, this is where we’ll end up. And it will be an improvement because we’re already dying.
Voluntarily converting to anarchy would be one of the worst ideas I could think of to make things “better”.
Detonating nuclear bombs on ourselves would be more devastating, so I can’t say its the worst idea I’ve ever heard.
Anarchy may be coming our way, but it will certainly be involuntary. And it will NOT be better.
People who write in confusing sentences and post irrelevant pictures, typically don’t have a very good argument. You don’t need to disguise what you say, if you have a good message.
I agree with OFM, I think Caelan’s heart is in the right place. But your ideas have more holes than a swiss cheese factory.
.
Boltz–
I think you need to increase your literacy on anarchist thought and history.
You are not alone.
I’ve pointed to resources, but one needs to put in the time, if you are interested.
It’s actually the anthesis of what you are stating.
I am always open to the evidence.
I don’t think there is any compelling evidence.
Your previous argument of the Ukraine turned out to be laughable, because as you stated, the attempt at anarchy was stopped by the “Red Army”.
That is evidence why anarchy is foolish…if you try to implement it, other countries or groups, that don’t lay down their weapons or organized militaries, will take you over and/or force their will on you.
I wish you the best cytochrome c.
thanks!
Even if we accepted that anarchy is the best option, there is no good mechanism to go from government/organization to disbanding them. Government/organization might be eliminated through war or crisis, but to have a smooth, consensus-style transition on a huge scale has never been done before.
Consensus-style communities are being experimented with in small groups and online, and they are a good learning process. But translating that into something big isn’t going to happen anytime soon.
I keep coming back to the Occupy Wall Street Movement. There was a lot of support for it, on a relative basis, and there were communities/demonstrations being organized around it. But it hasn’t grown bigger. Sure, there are a lot of people in the US dissatisfied with government at the moment, but they range in political outlook from the far left to the far right, and have various religious and non-religious orientations. Getting all of those people to work together is next to impossible right now.
If anything, the internet shows us that when given the opportunity, people pick their own little groups and get even more biased and dogmatic within them. And some of them aren’t content to live in their own little worlds and let the others do what they want. They want to convert others to their viewpoint, and some of them will even use force to do that.
At this moment the issue isn’t even about whether anarchy will work or not work. We can’t even get there if we wanted to. In order to successfully replace what is currently going on, you’ve got to have the organization and people skills to be persuasive (or the power to force people to do what you want) and that in itself requires organization and planning.
Boomer,
A basic element of anarchist thought seems to be the desire to not be forced to pay taxes, or comply with general regulations and laws.
The tax issue seems to me to reflect a basic lack of understanding of the nature of “overhead” – common costs that we all need to pay. If someone doesn’t pay those costs, they’re “freeloading” – exploiting others.
The regulatory issue reflects a lack of understanding of the Tragedy of the Commons, as well as The Race to the Bottom.
I’ve followed along with some Libertarian discussions (not quite the same as anarchy discussions), but they never adequately cover all the problems that need to be covered.
Seems like most of those who call themselves Libertarians in the US emphasize private property rights, not acknowledging that it tends to support the status quo. The Libertarian outlook doesn’t help much if you don’t have any property to begin with.
For example, one guy didn’t want to respect the claim of Native Americans that their land was taken away from them unjustly. He thinks current land holders have rights, but they don’t have to go back generations to straighten out who really should have rights to the land.
Also, part of the Libertarian philosophy seems to be that if a property owner or company pollutes and it affects others, that should be settled in court rather than prevented in the first place. So the wronged folks are supposed to sue for damages. That means not only do the wronged property owners need to prove how much damage has been done, and the polluters have to have the money to right the wrong, but we end up with a society run by lawyers and the court system, which I don’t think most Libertarians really want. So they want everyone suing everyone?
Caelyn MacI,
You might be interested in the work of K C Chang back in the 1980s. He was a Chinese archaeologist and one of the first to surface after the Cultural Revolution ended, and about the only source of information on archaeology in China available in the West at the time.
He noted that a common view of the structure over time of the Chinese state–that power and authority were the prerequisites of the Emperor because he was, in effect, the head shaman–was a good description of many other states especially in the New World: the ruler was the conduit between the spiritual and the human worlds. He suggested that the main exception to this generalization was the set of states that grew in SW Asia (Mesopotamia and environs) where power came to be in the hands of those who controlled the land and who worked with and often made subordinate the religious authorities whose realm was, in Bourdieu’s terms, symbolic power.
I just posted an update on Bakken LTO (data as per March 2015) with a closer look on developments on production and well productivity for 3 of the biggest companies in Bakken.
http://fractionalflow.com/2015/06/07/the-bakken-red-queen-is-restrained-with-more-credit/
Rune. Interesting, although when I saw you analyzed EOG, WLL and CLR, I knew what the result would likely be.
EOG is playing this down turn better than the later two, in my opinion. Will be interesting to see how the remainder of 2015 plays out for all three.
Shallow, thanks!
The key word is interesting.
I could have presented the 10 companies with the highest LTO production for Q1 15 in Bakken, but that would not have done very much for the overall impression.
As with most things; size matters!
It would have been thought provoking and selected a few of companies, built a model (which does not take long), harmonized the production data with the companies 10-K and 10-Q statements and run a few scenarios with different oil price assumptions to illustrate cash flows, the effects from the debts (assuming a retirement profile as stated in the financial information) and how profitability [expressed by NPV and IRR] may develop.
Very good job. I’m hoping to see somebody like you take one of the worst performers and analyze what will happen to it at different prices. On the other hand you probably ought to charge people to see your work.
Fernando, thanks!
I am close to completing full cycle analyses of some of the LTO companies in Bakken.
As of now not intended for the public domain, but just let me say this much; some companies obviously have (or soon will) acknowledge “The Bakken experience”.
Watcher wrote:
Oil was $57.50 10 mins before NYMEX close.
It closed at $59, with zero news and no contract expiration.
If HFT is trading oil, and it probably is, the government can command the price to be whatever they want.
Sorry to be blunt Watcher but that is pure bullshit. There are several things wrong with your statement. First the government has absolutely nothing to do with high frequency trading. Your last sentence reads as if they are in cahoots with each other. Bullshit!. And there was no out of the ordinary last minute move on Friday.
And the last thing wrong with your argument is that high frequency trades move the market only a tiny amount, a few pennies or so at the most. High frequency traders are basically front runners. They get news of a big trade, make their trade before that one is execute, then close their trade immediately after that trade is executed. Their two trades with the big buy/sell sandwiched in the middle, all take only a few milliseconds. Believing that high frequency traders moves the market in huge jumps is a serious flaw in your argument.
Edit: Actually high frequency trading does not move the market at all. If their trade before the big block moves the market up, or down if it is a sell, then closing out that position a few milliseconds later offsets any move made by their earlier trade.
Sawdust wrote:
Bingo, price can be bid up to keep the oil flowing if it need be. They can move price to where ever they want up or down to suit what ever their agenda is at the moment.
I keep hearing this shit over and over but no one has yet explained how it can be done. The only way to move the WTI futures price up is to buy a huge block of contracts. And if you do that you are taking a huge chance and can lose millions in the process. Every buy or sell contract on the NYMEX involves risk. If you buy you risk losing your margin money. If you sell you risk losing your margin money. There is no trading commodities without risk. It is absolutely impossible to move the market without risking thousands, or sometimes millions.
But I can be convinced that I am wrong if you can explain how it is done. But I doubt it. I have been giving this challenge for years and so far no one has ever even tried to explain how it is done.
On the chart below the dotted line marks the close at 2:30 Friday. As you can see the jump near the close, but not at the close, was no greater than several other movements during that day.
Those other occasions (which aren’t all that clear) have news with them? And I saw 57s prior to the move.
As for moving the price only via large contract buys, clearly not correct. You can agree to pay any price you want for a smaller number. Repeatedly, while quote stuffing the rest.
And I saw 57s prior to the move.
I am sure you did, about one hour prior to the move. Look at the chart. Every move in the market is recorded there. If it is not there then it did not happen.
As for moving the price only via large contract buys, clearly not correct
No, no, no, that’s not what I meant at all. The only way one can deliberately move the market one way or the other is to buy or sell large blocks of stock or commodities. A large amount of small trades works just as well. In fact that is what usually moves the market, more buyers than sellers moves the market up, more sellers than buyers moves the market down.
But if you want to move the market a bunch, all by yourself, the only way possible to do that is to buy or sell in very large blocks.
You can agree to pay any price you want for a smaller number. Repeatedly, while quote stuffing the rest.
That statement makes no sense whatsoever.
DEFINITION OF ‘QUOTE STUFFING’
A tactic of quickly entering and withdrawing large orders in an attempt to flood the market with quotes that competitors have to process, thus causing them to lose their competitive edge in high frequency trading. This tactic is made possible by high-frequency trading programs that can execute market actions with incredible speed. Only market makers and other large players in the market are capable of executing these tactics, since they require a direct link to the exchange in order to be effective.
You cannot do that, only the computer can do that. An it is a tactic to try to confuse the competition. It does not move the market at all but it can cause confusion or even panic where it does move the market. Only actual trades can move the market. And it is a tactic used in the equities market, not the futures market. The futures market is a different animal altogether.
The mechanism, of course, would be to trade potentially small numbers of units with subsidiaries of off shore cooperative entities (meaning, yourself) defining the price of the trade as you wish, and then quote stuff the opposition so they can’t interfere — which would need to be towards the close so that the quote stuffing isn’t countered. A LOT of asset price definition since 2009 has been happening pre open (overnight) or within minutes (or seconds, with equities) of close.
These are not the markets we grew up with. Probably not really markets at all.
Ron, it seems to me you agree that one player could move the oil market, but big money would be necessary . Any chance a sovereign could do that by placing trades with many different oil trading firms?
For example, I note that KSA and individuals from that country own a large part of Citibank. I would further note Citibank, through its head honcho on oil, Ed Morse, made the call for lower prices and has been very bearish on crude, including the call of sub $30 oil about the time. Al-Naimi was saying KSA would not cut even if the price went to $20.
Any chance Gulf OPEC, through complicit US banks, could drive the price of crude oil in a significant way?
Shallow, of course anyone with enough money could move the market up or down if they bought or sold enough contracts to actually affect the price of oil. So if KSA were to sell a large block of contracts that would push the futures price of WTI, or Brent, or whatever they bought, down.
But that would only affect the price at the moment. If ten minutes later the price moved back up again then KSA would suffer huge losses. Of course they could afford it but it still would make no sense because every contract opened must eventually be closed. If the price of oil had moved down when they closed their contracts then they would have made money. But if it had moved back up they would lose money.
But in the long run their actions would have little effect because it would not affect the actual supply of oil. Futures market moves only affect the price of oil in the short run. Only supply and demand can affect the long term trend. KSA could have a lot more effect on the market by just pumping more oil… if they could. And that would affect all oil markets, Brent, WTI, the OPEC Basket Price, the TOPEX and every other oil market and not just WTI.
Bottom line, I really do not believe Saudi would try to lower the price of WTI by buying large blocks of contracts. That would move the market for a brief few minutes but would have little effect in the long run. Only supply and demand can affect the long term market while market sentiment controls the short term swings in the futures market. Saudi buying large blocks of futures would not change supply and demand and would have only a brief effect on market sentiment.
SS – I think that the best way to think about it is this. If you have a favorite team in the Super Bowl, and you go to Las Vegas and bet on it, and keep betting, and bet billions of $ on that team, at what point to you think your bet will determine the outcome of the game? Ron probably knows for sure, but I believe that more money is “bet” on oil and product prices in the Over The Counter Markets (OCM) [which, is not public knowledge] than on the formal exchanges, which is public knowledge. So, if no one knows about the trades, except the parties to an OCM trade, how can it affect the markets? It is like you and your neighbor having an oil price wager: You think prices will go up and he wagers they will go down. No matter how much you bet your neighbor, it will not affect the price of oil.
A couple of days ago I made a comment about the MSM redefining oil which Dennis rightly took issue with concerning the definition of crude plus condensate NOT being redefined in official statistics.
I have no argument at all with Dennis.
But I was going to post a link showing how the MSM has redefined oil with the result that the average man on the street does NOT have the foggiest idea that oil production has stalled even as the price has gone up from three to five times since shortly after 2000.
Anybody who cares to look could turn up numerous such quotes in a few minutes- a lot of them more off the mark than this one.
If you read most Bloomberg stuff that is more than a couple of sentences long you will find that Bloomberg does do a little better job than this in pointing out a substantial portion of the total liquids consumed daily consists of something other than conventional crude.
I have deleted some extraneous matter from this quote that fell between the date and the part I wanted to post.
This is about the FOURTH hit down googling ”world oil consumption daily current”
”March 14, 2014 — 5:00 AM EDT
March 14 (Bloomberg) — Oil demand will be higher in 2014 than previously estimated as global economic growth recovers, the International Energy Agency said. Pressure on supplies will ease in coming months as seasonal consumption dips.
World consumption will increase by 1.4 million barrels a day, or 1.5 percent, this year to a record 92.7 million a day, or about 95,000 a day more than forecast last month, according to the IEA, a Paris-based adviser to oil-consuming nations.”
While this is more (or less !! ) true in general terms it keeps people from realizing that conventional oil production has been stalled now for quite some time.
I think it’s intentional. It’s a damn conspiracy. But I can’t figure out if they are dummy conspirators or they got some sort of really crooked deal going. It’s as if they wanted to give the people confidence that all is well, at the same time they want to cut emissions and make it harder to produce the real oil. Or maybe it’s just a stupid government bureaucracy. Something like the Transportation S.A. of Oil and Gas?
There is an opportunity for one of us in this forum to become famous as the originator of a new phrase – a phrase that identifies a phenomenon that looks like a duck, waddles like a duck, quacks like a duck, and can easily be mistaken for a duck- but nevertheless is NOT a duck in the usual literal sense of the word.
In this case I point out that there is a substantial amount of misleading information that is perhaps nominally true – some of the time anyway – concerning oil production- misinformation that has the effect of keeping the typical man on the street from realizing that peak oil is a VERY real problem.
Fernando says ,”I think it’s intentional.” There is little doubt in my mind it is intentional on the part of a great many people who say such things.
Next he says,” But I can’t figure out if they are dummy conspirators or they got some sort of really crooked deal going.” Personally it is clear to me , although I admit I could be wrong, that the vast majority of people who REPEAT this misinformation are simply parroting the business as usual line because they want it to be true- and that they BELIEVE it is true. Hardly anybody does any critical thinking.Almost everybody is too busy to bother with becoming well informed in more than a couple of subject areas plus whatever they do to earn a living. This makes them out to be ” dummy conspirators ” at the individual and community level.
Now as to the ones at the top who trade oil and commodities and run banks and brokerages etc – It boggles the mind to think they could have gotten to the top of the heap without knowing what the real figures are when it comes to crude and substitutes. They know.
But the ordinary definition of a conspiracy involves the people in it getting together and plotting it out and then putting it into effect. There is zero evidence this has happened, to the best of my knowledge, and there is no reason it SHOULD have happened. All the business as usual types who say such things knowing they are misleading the public have skin in the game and are simply all telling the same little fib because it suits their purposes to do so.
The net effect is that this apparently uncoordinated fibbing has much the same effect as if it WERE coordinated.
So -It LOOKS like a conspiracy. It acts like a conspiracy. But it is not , not according to the ACCEPTED definition of the word.
Having said this much, there is no doubt a POSSIBILITY that there is some sort of ”really crooked deal going”. We have all heard that a wink is as good as a nod and that little birds tell things to people who really listen. When the people who are at the VERY top want something to happen they have a way of making it happen without having to send out hard copy memos or emails or making a speech at a company management meeting.
If some particular underling says something that furthers their interests, all they have to do is wink and EVERYBODY within sight WILL get the message. You don’t get up to management level without being a very good listener and watcher.They can call an editor and have something to say complimentary about a particular columnist. Editors are COMPELLED to pay attention because bau management PAYS for the ads that keep editors EMPLOYED.
This might not quite fit the description of a ”really crooked game” but it no doubt has the EFFECT of keeping the wheels of business as usual turning as usual without the markets getting too jittery about peak oil etc.On second thought ”really crooked game” fits rather well when it comes to people telling outright lies about the cost of renewable subsidies and the ” off the books ” cost of burning coal etc.
SO – We need a catchy name that will go viral for ” sort of ” conspiracies that are not real in the strict sense, but exist by INTENT in some cases and by DEFAULT in some other senses, meaning accidental convergences of actions and circumstances that just look like conspiracies – while actually having the effect of a real one.
Whoever comes up with it will own a piece of history for his very own. I have been thinking about this for years but so far without success in coming up with the right new descriptive term.
Hi Old Farmer Mac,
The data we have on extra heavy oil output is not very precise because some of it comes from Venezuela and the data from Venezuela is pretty fuzzy (though Fernando may have a handle on it).
The best data is C+C from the EIA, it is far from perfect, but it is probably the best data we have ( some might even call it an estimate of actual output.)
Since 1983 C+C output has been rising by 1.2% per year on average, if we adjust “total liquids” based on their energy content (ethanol and NGL only have about 70% of the energy equivalent per barrel as the average C+C barrel), the rate of rise in output might be 1.4% (a guess).
“Conventional oil” is defined differently by Jean Laherrere and Colin Campbell, there are a multitude of definitions, some exclude LTO, polar, deep water, oil sands, and perhaps other types of C+C output, so the term needs to be used with care.
I agree with your point that C+C output has been rising more slowly than total liquids (if that was your point). The difference is pretty small, possibly close to the margin of error of the measurements.
You guys won’t believe what comes out if Venezuela. When I was writing about the rosneft deal I got a couple of slides prepared for a high level pdvsa honcho. His slides didn’t have the same production rates as the “official numbers” for the extra heavy oil. They try to keep the internal official figures a secret, but the stuff leaks out. But I think their internal official numbers aren’t quality checked, and this seems to fit a common pattern in pdvsa, everybody lies to save their behinds and hide their incompetence.
My point in the simplest possible terms is that the msm has to a great extent been substituting the total liquids figure in the place of the cplusc . The net energy is less than implied and the ngl part is not nearly as useful as crude in manufacturing liquid fuel, requiring a lot more expensive processing at the refinery.
Taken all together this leads the man on the street to think there is little or nothing worth mentioning about peak oil except to laugh at the very idea.
Hi Old Farmer Mac,
The key metric that gets the “man on the street’s” attention is the price at the pump, in time (within 5 years) those prices will be $5/gallon in the US, that will make people pay attention.
BNSF Week 21
10,265 carloads of petroleum, about the same as last week’s amount.
Somebody is buying oil, doesn’t matter from where, there is demand, if there is any to sell, there is a buyer. If the supply increases, the buyer can bid less, the seller can settle for less, the supply is large enough to realize that the sold supply is really surplus supply, don’t need it anyway and the buyer will be back for more.
Supply and Demand
Those 10,265 carloads of petroleum represent oil purchases, buyers and plenty of them it seems. Those willing to pay the price and with the means to do so.
Demand never ceases.
Supply might start to thin in the waning years of the Oil Age, so it’s time to move on to Jupiter.
Just so we don’t forget the sort of people we must deal with to import oil.
http://www.foxnews.com/world/2015/06/07/saudi-supreme-court-upholds-verdict-against-liberal-blogger-flogged-for/
PC types who constantly berate ” dead white European male” sort of societies while glossing over or totally ignoring the nature of other societies they deem as good make me figuratively vomit.
Fiddling with and watching numbers is a hobby.
Just for the record, yesterday’s number was at 5810000 exactly when the page was displayed. Kind of surprised when I saw all of those zeros in a row.
Now it is at 5817648.
Twelve days ago, a Tuesday, if I remember correctly, the number displayed was at 559abcx, forgot the last four numbers, I wrote them down, but lost the paper momentarily.
That is in the neighborhood of 220,000 visits in some 12 days.
Those numbers are a little misleading. Every time you refresh you click the number up one.
For Watcher, and others.
A Saudi firm released a report that estimates total KSA deficit this year will be $107.7 billion, not $39 billion the Kingdom estimates. Name of firm, Jawada, I believe.
IMF said bigger numbers, too. This stuff is usually one offs. Odd that the US never gets challenged on its reported def. That kind of thing can get you $1 billion fines, as S&P got, coincidentally after cutting the US credit rating below AAA. It can also get your CEO fired, as S&P’s was just a couple of weeks after the downgrade.
As the scarcity death event approaches, legitimate numbers for everything will get more and more hard to find.
Is an unfunded liability a debt? If it is then the US is looking at about 100 Trillion. Maybe that doesn’t count or matter?
” If it is then the US is looking at about 100 Trillion.”
That is financial vacuum cleaner creating its own blowback. But Doug, don’t ask difficult questions 🙂 there is lady’s world soccer cup going on right now, just relax and enjoy the game 🙂
No.
In the case of the federal govt it is a political promise in the form of future Medicare and social security payments.
The promises can be changed.
The bigger issue is that the medical systems expenses are compounding at 9%. per year and will blow the country up financially if the system isn’t changed.
A ticking time bomb.
Hey, shallow,
Does that number include the war in which they are presently engaged? (And by most accounts, losing badly)
Should this conflict continue, and the Yemenis (their military, btw, not the media described Houthis) target any FURTHER KSA infrastructure with their missiles, such as oil facilities, we may see triple digit oil price overnight.
As Ms. House pointed out in her book, “On Saudi Arabia,” once one of the 35 surviving lines of the founder’s family consolidates its power and line of succession (which, according to the NYT article up the thread, is currently happening), 34 of the 35 families will be disenfranchised–plus the ISIS and Iranian backed Shiite threats.
Coffee. Was a small blurb, didn’t say.
I know those M.E. fields are the best in the world, but mostly they are also old. I know people have very different views on Matthew Simmons, and he sometimes said some things that seemed out in left field. But I think his general thesis was accurate. The Gulf OPEC producers may be able to increase daily production, but it will cost them more and more to do so, just like has occurred in the United States and other oil producing countries. Both CAPEX and OPEX have skyrocketed, and I do not think Gulf OPEC producers are immune.
I really have no clue what they have over there in the way of remaining reserves or what CAPEX and OPEX is per barrel is in KSA, Kuwait, UAE, Iraq, and Iran. I do know that over 90% of income is from oil and gas. They are wholly dependent on this income and it does not appear efforts to diversify their economies have been very successful.
Make no mistake, these countries incomes have suffered big time $$. Likely on the order of $3-4 billion dollars per week combined, compared to the same time last year.
Shale oil and gas are not a profitable venture at current prices and likely never will be, absent a tremendous price spike. That does not matter, however. As long as money flows to these companies, they will produce more oil.
Eventually something will give and either the easy money to US shale will cease, and/or the OPEC Gulf member will get tired of losing billions of dollars of revenues.
There are many other producers, and quite a few of them have already cut back. I think there’s a tendency to look at this as a fight between a few shale frackers and OPEC and Russia. However, the others have done their best to slow down their declines. Some even increased their volumes, like for example the Gulf of Mexico, the Permian, Colombia, and of course Iraq. But all of them are gasping for air and getting beat up by low prices. And most of them had a very recent peak and seem to be headed down.
OPEC may just get the market share and $80 to 90 price they seem to target by waiting until a few weaklings go bankrupt in North Dakota and Texas, with other producers losing a small amount of capacity to create the tighter market conditions they need to have.
New Drilling Productivity Report by the EIA.
Production in the Bakken, Eagle Ford and Niobrara is estimated to have peaked in March and is projected to decline by 75 kbd (-5,7%), 117 kbd (-6,8%) and 50kbd (-10,7%), respectively, between March and July
Output in the Permian basin is expected to increase marginally by 34 (+1,7%) during the four months period.
Combined output in these four plays is expected to decline by 208 kbd
The numbers for Bakken and EFS were revised downward, for Permian and Niobrara slightly increased
AlexS. Thanks for the information. Looks like the Permian is about to roll over too, if these figures are accurate as to the trend.
Yes, it looks like Permian is actually flat
test
Has anyone else experienced trouble uploading JPG-images from a file?
it seems that files should not be bigger than 40 or 50 kb
Ron, is that true? I would like to present a graph, but it is unreadable beneeth 70kb.
I don’t understand what is going on. Must be some kind of problem at Bluehost or WordPress. But post it to me and I will insert it into your post via Photobucket.
But you might want to post under the new post that I just put up about one hour agol
Yep—
Doesn’t seem to work for me–
No problem in the past.
Yep! It seems that the file size limit keeps getting smaller and smaller… At one time I could post files in the 200 KB range then it went down to about 90 and now its about 60 KB or less.
Honey I shrunk the files >;-)
I got to the discussion late. This comment should
follow: this
thread and is addressed to Dennis, Ron, and others.
I think with respect to oil production reporting we should distinguish
between measurements and estimates. A
measurement is made with some sort of measuring equipment and the
value of the measurement is then reported. An estimate is made from
either incomplete or faulty measurements. Both measurements and
estimates can be inaccurate, but for different reasons.
A measurement can be inaccurate because
The measuring equipment is defective.
The person measuring is incompetent.
The person reporting the measurement is dishonest and lies about
the measurement.
An estimate is always based on assumptions and can be inaccurate if these
assumptions are not valid.
With these definitions, I think we can agree that the Texas RRC
reports measurments and the EIA reports estimates. The EIA breaks all
the rules in reporting estimates. Dean does an excellent job in
reporting his estimate of Texas oil production based on the incomplete
measurements of the Texas RRC. He explains how the estimates are
obtained and he includes a confidence interval. All estimates should
be accompanied by a confidence interval to give the reader an idea of
how reliable these estimates are. Jean Laherrère has frequently
lamented that the accuracy of oil production reporting is poor and
that the agencies reporting this production do a very poor job in
conveying the accuracy of their numbers by reporting 6 significant
figures when in fact only the first two figures are significant.
A great distinction between measurements and estimates. Thanks for that.
The Baker Hughes International Rig Count came out a few days ago. I have totaled the changes below, one month and one year change.