A Guest Post by Dr. Minqi Li, Professor
Department of Economics, University of Utah
E-mail: [email protected]
September 2018
This is Part 5 of the World Energy Annual Report in 2018. Links to Part 1 to Part 4 are shown below:
This part of the Annual Report provides updated analysis of world carbon dioxide emissions from fossil fuels consumption, evaluates the future prospect of global warming and considers the implications of global emissions budget (to limit global warming to no more than two degrees Celsius) for economic growth. Figures are placed at the end of each section.
In 2017, fossil fuels (oil, natural gas, coal) accounted for 85 percent of the world primary energy consumption. Consumption of fossil fuels results in emissions of carbon dioxide and other greenhouse gases that contribute to climate change. In 2017, the global average surface temperature anomaly was 1.18ºC (degrees Celsius). The ten-year average global surface temperature anomaly from 2008 to 2017 was 1.00 ºC (NASA 2018). Global surface temperature anomaly is measured by the difference between the global average surface temperature and the average global temperature during 1880-1920. The latter is used as a proxy for the pre-industrial global average temperature (Hansen and Sato 2016).
A scientific consensus has been established that if global average surface temperature rises to and stays above 2ºC higher than the pre-industrial global average temperature, dangerous climate change with catastrophic consequences cannot be avoided. According to Hansen et al. (2016), global warming by more than 2ºC will lead to the melting of West Antarctica ice sheets, causing sea level to rise by 5-9 meters over the next 50-200 years. Bangladesh, European lowlands, the US eastern coast, North China plains, and many coastal cities will be submerged. Further increase in global average temperature may eventually lead to runaway warming, turning much of the world unsuitable for human inhabitation.
Carbon Dioxide Emissions by Major Economies, 1990-2017
In 2017, world carbon dioxide emissions from fossil fuels consumption reached 33.4 billion metric tons. Between 2007 and 2017, world carbon dioxide emissions grew at an average annual rate of 1.1 percent. Figure 1 compares the historical world economic growth rates and the carbon dioxide emissions growth rates from 1991 to 2017. The carbon dioxide emissions growth rate has an intercept of -0.02 at zero economic growth rate and a slope of 1.074. That is, world carbon dioxide emissions have an “autonomous” tendency to fall by about 2 percent a year when economic growth rate is zero. When economic growth rate rises above zero, an increase in economic growth rate by one percentage point is associated with an increase in carbon dioxide emissions by 1.07 percent. R-square for the linear trend is 0.67. In 2017, world carbon dioxide emissions grew by 1.3 percent, a rate that is 0.8 percentage points below what is implied by the historical trend. This may suggest that, in recent years, world economic growth has begun to “de-couple” from carbon dioxide emissions. However, this report will show that this relative de-coupling has been largely limited to China. Figure 1 also shows the hypothetical world economic growth rate that would be consistent with the emissions reduction path required to limit global warming to no more than 2ºC (to be discussed later).
Figure 2 compares the per capita carbon dioxide emissions in relation to per capita GDP for the world’s six largest national carbon dioxide emitters and the European Union.
China is the world’s largest carbon dioxide emitter. In 2017, China’s carbon dioxide emissions were 9.2 billion metric tons, accounting for 28 percent of the world carbon dioxide emissions. China’s per capita carbon dioxide emissions surged from 2.05 metric tons in 1990 to 6.78 metric tons in 2013. Since then, China’s per capita emissions may have stabilized. In 2017, China per capita carbon dioxide emissions were 6.66 metric tons.
The United States is the world’s second largest carbon dioxide emitter. In 2017, the US carbon dioxide emissions were 5.1 billion metric tons, accounting for 15 percent of the world carbon dioxide emissions. The US per capita carbon dioxide emissions peaked in 2000 at 20.3 metric tons. During the “Great Recession”, the US carbon dioxide emissions fell sharply. Since then, the US per capita emissions have trended down, falling to 15.6 metric tons by 2017.
European Union is the world’s third largest carbon dioxide emitter. In 2017, the EU carbon dioxide emissions were 3.5 billion metric tons, accounting for 11 percent of the world carbon dioxide emissions. The EU per capita carbon dioxide emissions declined from 9.08 metric tons in 1990 to 8.34 metric tons in 1999. The EU carbon dioxide emissions stabilized during the economic expansion in the early 2000s and then declined sharply during the global economic crisis and the following European financial crisis from 2007 to 2014. Since then, the EU per capita carbon dioxide emissions have recovered slowly, reaching 6.9 metric tons in 2017.
India is the world’s fourth largest carbon dioxide emitter. In 2017, India’s carbon dioxide emissions were 2.3 billion metric tons, accounting for 7 percent of the world carbon dioxide emissions. From 1990 to 2017, India’s per capita carbon dioxide emissions increased from 693 kilograms to 1.75 metric tons. If India’s per capita carbon dioxide emissions continue to follow its historical trend in relation to per capita GDP, India’s per capita carbon dioxide emissions will rise to 3.77 metric tons by 2050 (when India’s per capita GDP is projected to rise to about 19,000 dollars). India’s population is expected to grow to 1.72 billion by 2050. Given these projections, India’s carbon dioxide emissions will rise to about 6.5 billion metric tons by 2050.
The Russian Federation is the world’s fifth largest carbon dioxide emitter. In 2017, Russia’s carbon dioxide emissions were 1.5 billion metric tons, accounting for 4.6 percent of the world carbon dioxide emissions. Russia’s per capita carbon dioxide emissions declined sharply from 15.1 metric tons in 1990 to 9.8 metric tons in 1998. Since then, Russia’s per capita carbon dioxide emissions have grown slowly but steadily, reaching 10.5 metric tons in 2017.
Japan is the world’s sixth largest carbon dioxide emitter. In 2017, Japan’s carbon dioxide emissions were 1.2 billion metric tons, accounting for 3.5 percent of the world carbon dioxide emissions. Japan’s per capita carbon dioxide emissions peaked at 10.1 metric tons in 2012. By 2017, Japan’s per capita carbon dioxide emissions fell to 9.28 metric tons.
South Korea is the world’s seventh largest carbon dioxide emitter. In 2017, South Korea’s carbon dioxide emissions were 680 million metric tons, accounting for 2 percent of the world carbon dioxide emissions. South Korea’s per capita carbon dioxide emissions rose rapidly from 5.58 metric tons in 1990 to 12.9 metric tons in 2011. In 2017, South Korea’s per capita carbon dioxide emissions reached 13.2 metric tons.
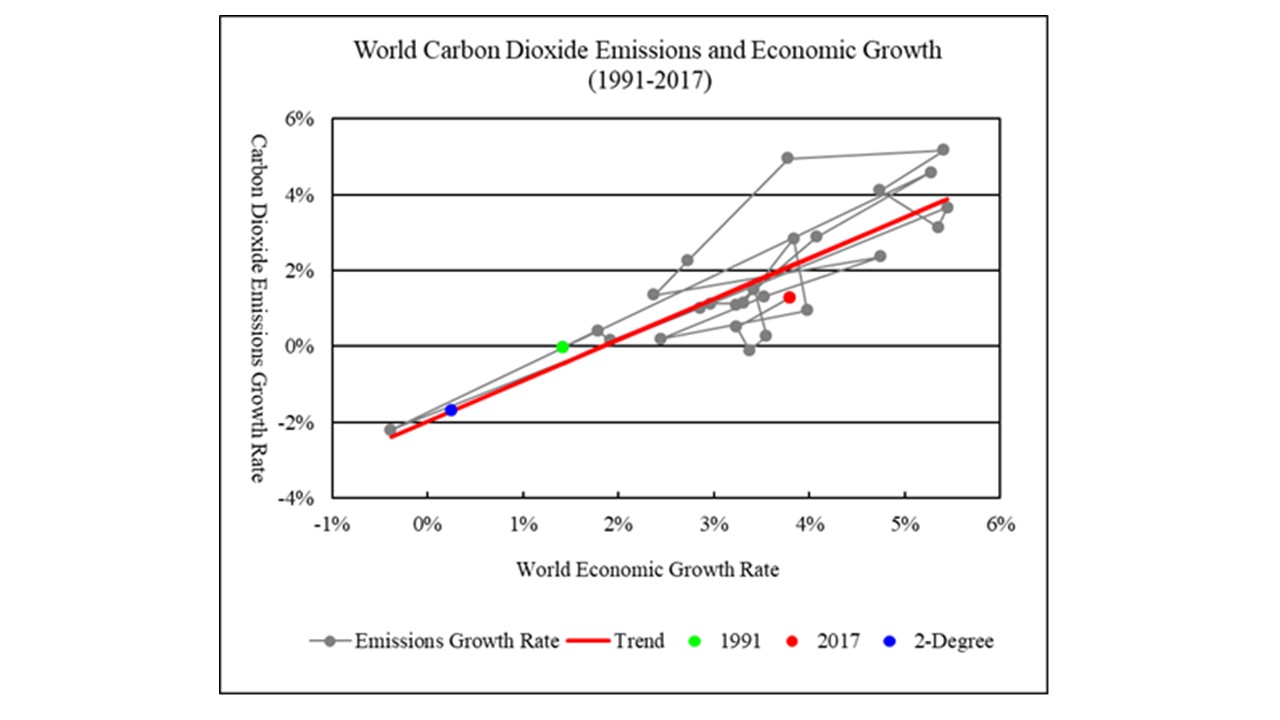
Figure 1 World Carbon Dioxide Emissions and Economic Growth, 1991-2017
Linear Trend: Emissions Growth Rate = -0.020 + 1.074 * Economic Growth Rate (R-square = 0.672)
Sources: World carbon dioxide emissions from 1990 to 2017 are from BP (2018). Gross world product in constant 2011 international dollars from 1990 to 2016 is from World Bank (2018), extended to 2017 using the growth rate reported by IMF (2018, Statistical Appendix, Table A1).
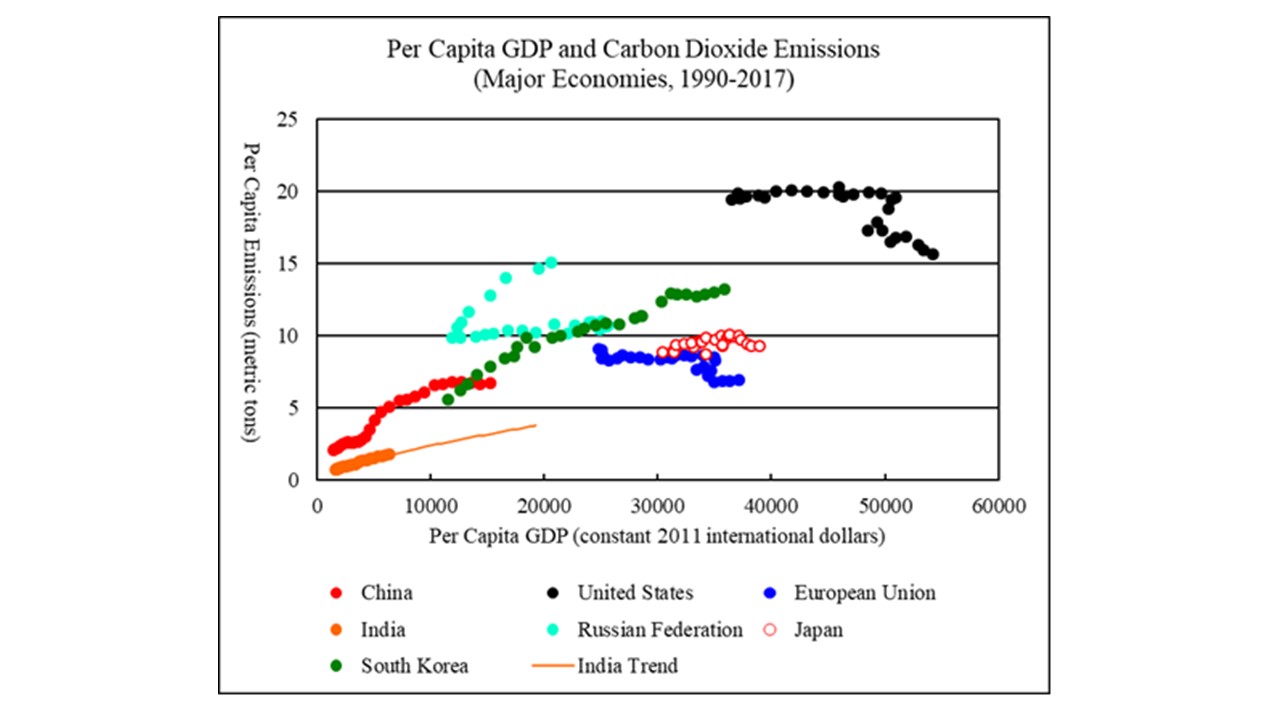
Figure 2 Per Capita GDP and Carbon Dioxide Emissions, Major Economies, 1990-2017
Sources: Per capita carbon dioxide emissions and per capita GDP are calculated using data for carbon dioxide emissions, GDP, and population. National and regional carbon dioxide emissions from 1990 to 2017 are from BP (2018). National and regional GDP from 1990 to 2016 is from World Bank (2018), extended to 2017 using growth rates reported by IMF (2018, Statistical Appendix, Table A1, A2, and A4). National and regional population from 1990 to 2016 is from World Bank (2018), extended to 2017 by assuming that the 2017 population growth rates are the same as the 2016 growth rates. To project India’s per capita carbon dioxide emissions, a log-linear relationship is estimated between the per capita carbon dioxide emissions and per capita GDP for the period 1990-2017. India’s GDP and population projections from 2018 to 2050 are from EIA (2017, Reference Case, Table A3 and Table J4), adjusted to make the projected GDP and population levels in 2017 matching the levels reported by World Bank (2018).
Global Emissions Budget, 2018-2100
According to the Intergovernmental Panel on Climate Change’s Fifth Assessment Report, cumulative carbon dioxide emissions will largely determine the global mean surface warming by the late 21st century and beyond (IPCC 2013: 27-29). Figure 3 shows the historical relationship between the cumulative carbon dioxide emissions from fossil fuels burning (not including emissions from cement production and gas flaring) and the global surface temperature anomaly. Global surface temperature anomalies are shown in ten-year trailing averages to smooth out short-term effects from El Nino and solar irradiance cycles. The linear relationship between historical cumulative carbon dioxide emissions and the ten-year average global surface temperature anomalies indicate that for an increase of cumulative carbon dioxide emissions by one trillion metric tons, global surface temperature will rise by 0.68 degrees Celsius. Regression R-square is 0.94.
The global ten-year average surface temperature anomaly is currently 1ºC. Thus, to limit global warming by the end of the 21st century to no more than 2ºC, further increase in global surface temperature from 2018 to 2100 should be no more than 1ºC. Based on the linear relationship between cumulative carbon dioxide emissions and the global surface temperature anomaly observed in Figure 3, it can be easily calculated that the global emissions budget (or the cumulative carbon dioxide emissions) from 2018 to 2100 should be no more than 1.47 trillion metric tons. Further calculation suggests that such a global emissions budget is consistent with an emission reduction path based on a uniform annual decline rate of 1.7 percent from 2018 to 2100. Figure 4 compares the historical world carbon dioxide emissions from 1990 to 2017, the projected world carbon dioxide emissions from 2018 to 2100 (assuming “natural depletion” of fossil fuels), and the emissions reduction path required to keep global warming to no more than two degrees Celsius.
If the future world carbon dioxide emissions were to follow the “blue line”, global cumulative carbon dioxide emission from 2018 to 2100 will be within 1.47 trillion metric tons and the global ten-year average surface temperature anomaly is projected to stay below 2ºC for the period 2091-2100. However, based on the historical linear relationship between world carbon dioxide emissions growth rate and the world economic growth rate shown in Figure 1, an annual decline of world carbon dioxide emissions by 1.7 percent would be associated with a world economic growth rate of 0.2 percent. Without major technological miracles in the future, global economic growth will have to virtually come to an end in order to achieve climate stabilization. Given the dependence of world capitalist system on system-wide economic growth in order to maintain political and social stability, it appears that the existence of the existing capitalist system is fundamentally incompatible with global ecological sustainability.
The projected world carbon dioxide emissions from 2018 to 2100 (the red line) are based on the future world oil, natural gas, and coal production projected in Part 2, 3, and 4 of this annual report. Oil, natural gas, and coal production (consumption) is converted to carbon dioxide emissions based on the following conversion ratios:
1 ton of oil equivalent of oil production = 2.788 metric tons of carbon dioxide
1 ton of oil equivalent of natural gas production = 2.288 metric tons of carbon dioxide
1 ton of oil equivalent of coal production = 3.909 metric tons of carbon dioxide
These conversion ratios are based on the observed ratios between oil consumption (excluding biofuels), natural gas consumption, coal consumption in 2014 reported by BP (2018) and the carbon dioxide emissions from liquid fuel consumption, gas fuel consumption, and solid fuel consumption (excluding emissions from cement production and gas flaring) in 2014 reported by Boden, Marland, and Andres (2017). However, the world carbon dioxide emissions reported by BP (2018) are smaller than the sum of carbon dioxide emissions from the consumption of liquid, gas, and solid fuels reported by Boden, Marland, and Andres (2017) by about 3 percent. Thus, to project the world carbon dioxide emissions from 2018 to 2100, I have multiplied the sum of carbon dioxide emissions from oil, natural gas, and coal consumption calculated using the above conversion factors by an adjustment factor of 0.971. The adjusted total carbon dioxide emissions are the projected world carbon dioxide emissions shown in Figure 4.
World carbon dioxide emissions are projected to peak in 2028 at 36.5 billion metric tons, decline to 29 billion metric tons by 2050 and to 9.7 billion metric tons by 2100. The global cumulative carbon dioxide emissions from 2018 to 2100 are projected to be 2 trillion metric tons, exceeding the two-degree global emission budget by about 530 billion metric tons.
Figure 5 shows the historical and projected global surface temperature anomaly from 1880/1889 to 2091/2100. Global surface temperature anomalies are shown in ten-year trailing averages to smooth out short-term fluctuations. The future temperature projections are based on the future carbon dioxide emissions projected by this report and the linear relationship between cumulative carbon dioxide emissions and the global surface temperature shown in Figure 3. The global average surface temperature anomaly is projected to rise above 2ºC for the decade ending in 2063 and will rise to 2.39ºC for the decade 2091-2100.
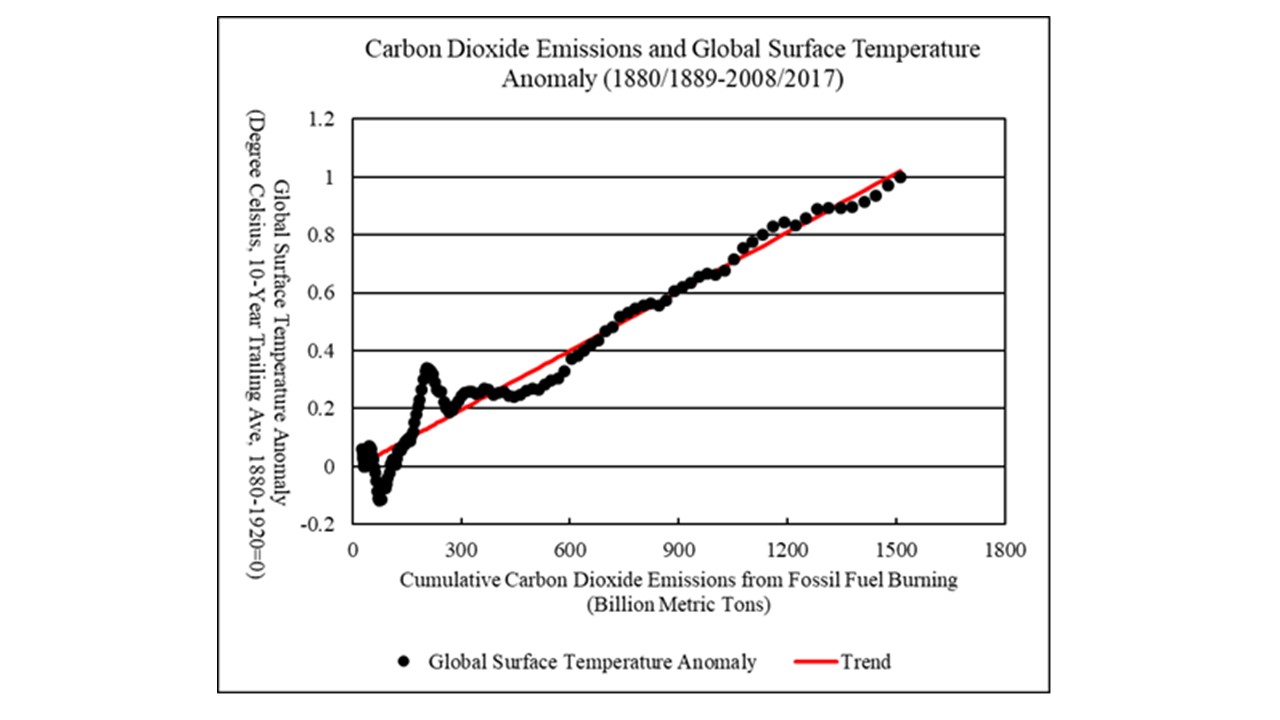
Figure 3 Carbon Dioxide Emissions and Global Surface Temperature Anomaly, 1880/1889-2008/2017
Linear Trend: Global Surface Temperature Anomaly = -0.009 + 0.681 * Cumulative Carbon Dioxide Emissions in Trillion Metric Tons (R-square = 0.942)
Sources: Historical carbon dioxide emissions from 1751 to 1964 are from Boden, Marland, and Andres (2017); carbon dioxide emissions from 1965 to 2017 are from BP (2018). Global surface temperature anomaly from 1880 to 2017 is from NASA (2018).
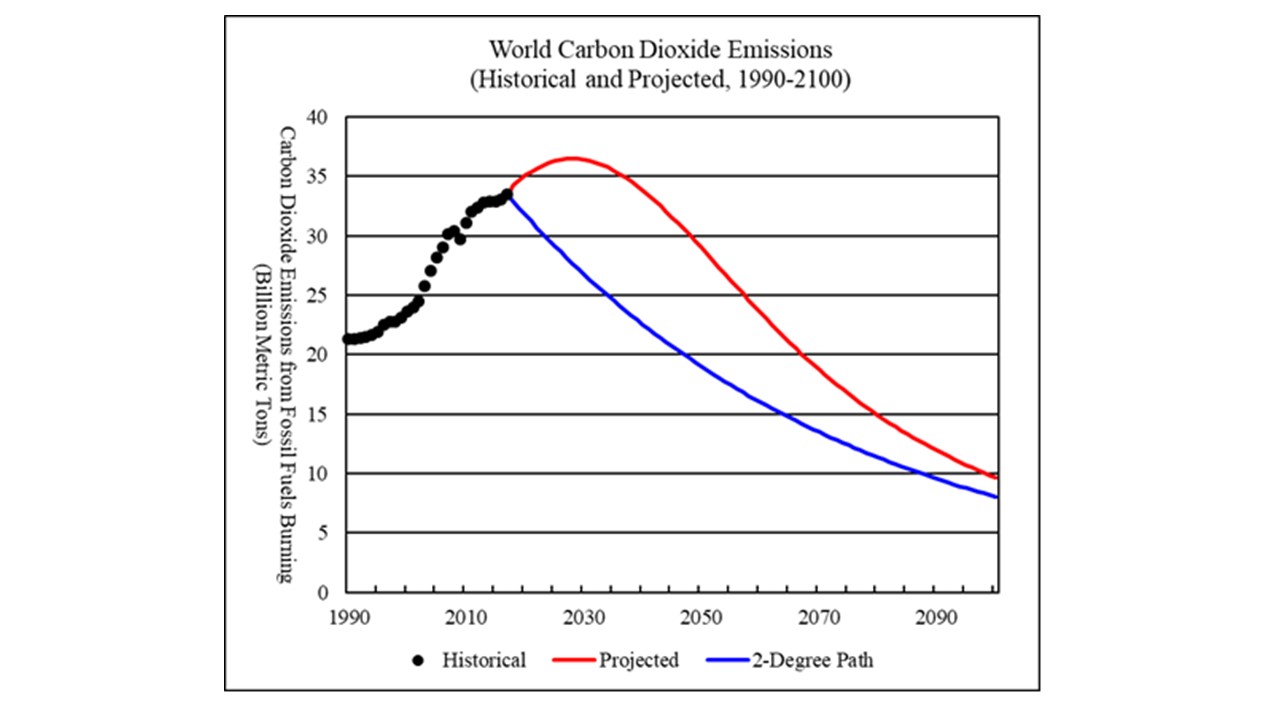
Figure 4 World Carbon Dioxide Emissions, Historical and Projected, 1990-2100
Sources: Historical world carbon dioxide emissions from 1990 to 2017 are from BP (2018).
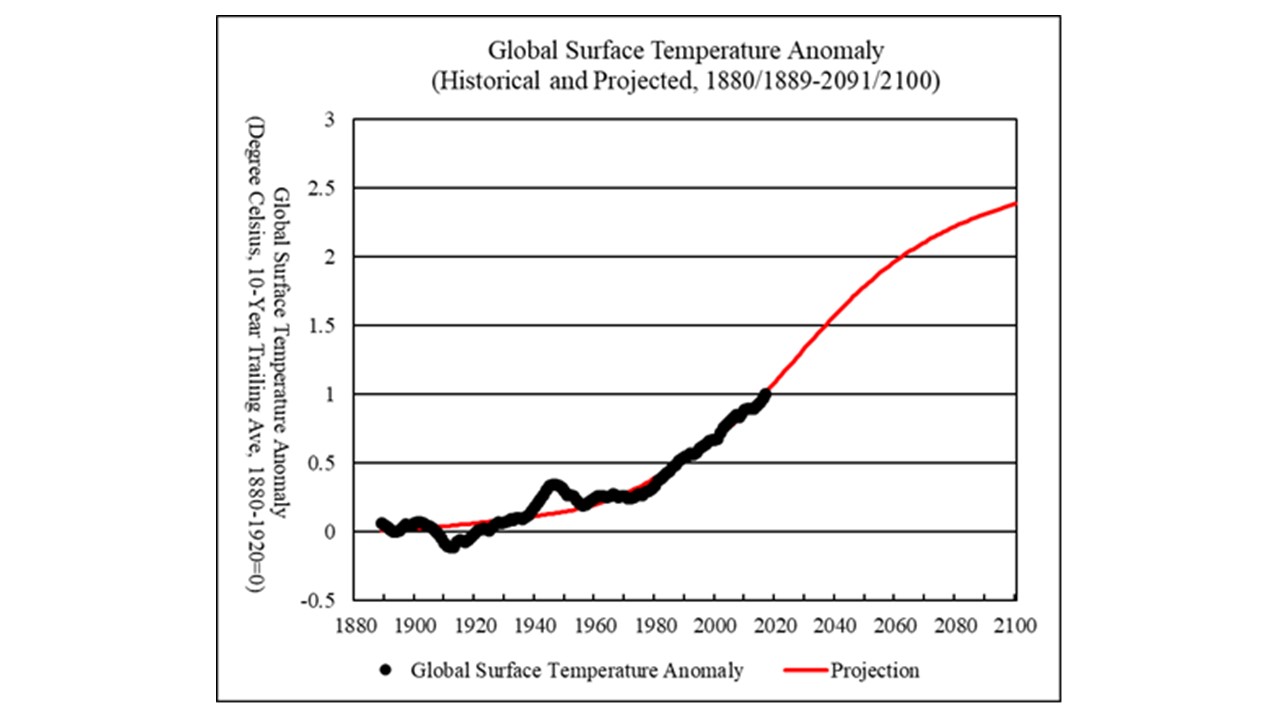
Figure 5 Global Surface Temperature Anomaly, 1880/1889-2091/2100
Sources: Global surface temperature anomaly from 1880 to 2017 is from NASA (2018).
China
The capitalist world system consists of several hundred national states. Assuming that the global emissions budget can be accepted by a sufficiently large majority of the national states (including a consensus among all the most powerful states) and enforced through a certain global governing body, the budget still needs to be divided among the national states based on politically reasonable principles.
Peters et al. (2015) proposed two approaches: the “inertia” approach and the “equity” approach. Under the inertia approach, the global emissions budget is divided among countries based on their current shares of global carbon dioxide emissions. Under the “equity” approach, the global emissions budget is divided among countries based on their current shares of the world population. While the inertia approach tends to favor the advanced capitalist countries, the equity approach is relatively favorable for the developing countries allowing them to have a bigger allowance of future fossil fuels consumption to compensate for their historical development deficits.
In 2017, China accounted for 27.6 percent of the world carbon dioxide emissions. Thus, under the inertia approach, China is entitled to 27.6 percent of the global emissions budget or 406 billion metric tons of cumulative carbon dioxide emissions from 2018 to 2100. By comparison, under the equity approach, China would be entitled to 18.5 percent of the global emissions budget or 272 billion metric tons of cumulative carbon dioxide emissions from 2018 to 2100 (based on China’s share in the world population in 2016).
Figure 6 compares China’s historical carbon dioxide emissions from 1990 to 2017 and the future emissions reduction path from 2018 to 2100 consistent with the inertia approach and the equity approach. Under the inertia approach, China’s carbon dioxide emissions will need to decline at a uniform rate of 1.7 percent from 2018 to 2100 (the same as the world average). Under the equity approach, China’s carbon dioxide emissions will have to decline at a uniform rate of 3 percent from 2018 to 2100.
Figure 7 compares China’s historical economic growth rates and the carbon dioxide emissions growth rates from 1991 to 2017. The carbon dioxide emissions growth rate has an intercept of -0.053 at zero economic growth rate and a slope of 1.091. That is, China’s carbon dioxide emissions have an “autonomous” tendency to fall by about 5.3 percent a year when economic growth rate is zero. This negative intercept is very large. However, this may reflect China’s historically very high emissions intensity (the ratio of emissions to gross domestic product) and as China’s emissions intensity approaches the OECD levels, China’s autonomous declines of carbon dioxide emissions may fall as well.
But for economic growth rates above zero, an increase in economic growth rate by one percentage point is associated with an increase in carbon dioxide emissions by 1.09 percent. R-square for the linear trend is relatively low (about 0.23). In 2015 and 2016, China’s carbon dioxide emissions declined. In 2017, China’s carbon dioxide emissions grew by 1.3 percent, a rate that is 1.1 percentage points below what is implied by the historical trend. This may suggest that China’s economic growth has begun to “de-couple” from carbon dioxide emissions. However, preliminary data indicate that China’s carbon dioxide emissions are likely to re-accelerate in 2018.
If China’s carbon dioxide emission will decline in accordance with the inertia approach, then the linear trend shown in Figure 7 suggests that China’s economic growth rate will need to fall to 3.3 percent. If China’s carbon dioxide emissions will decline in accordance with the equity approach, then the linear trend shown in Figure 7 suggests that China’s economic growth rate will need to fall to 2.1 percent. Economic growth rates in the range of 2-3 percent may be respectable growth rates for many other countries. But they fall outside the range of economic growth rates in China’s recent economic history and China’s authoritarian regime may need much higher economic growth rates in order to maintain political legitimacy and social stability.
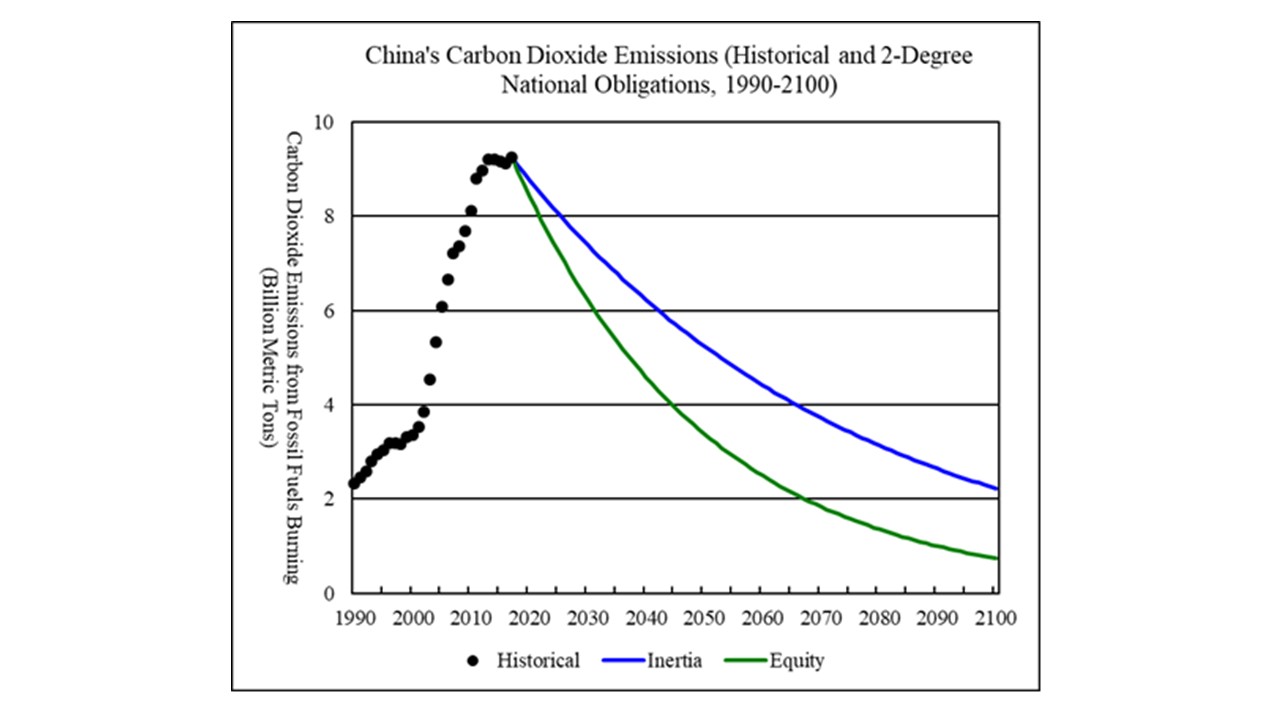
Figure 6 China’s Carbon Dioxide Emissions, 1990-2100
Sources: Historical carbon dioxide emissions from 1990 to 2017 are from BP (2018).
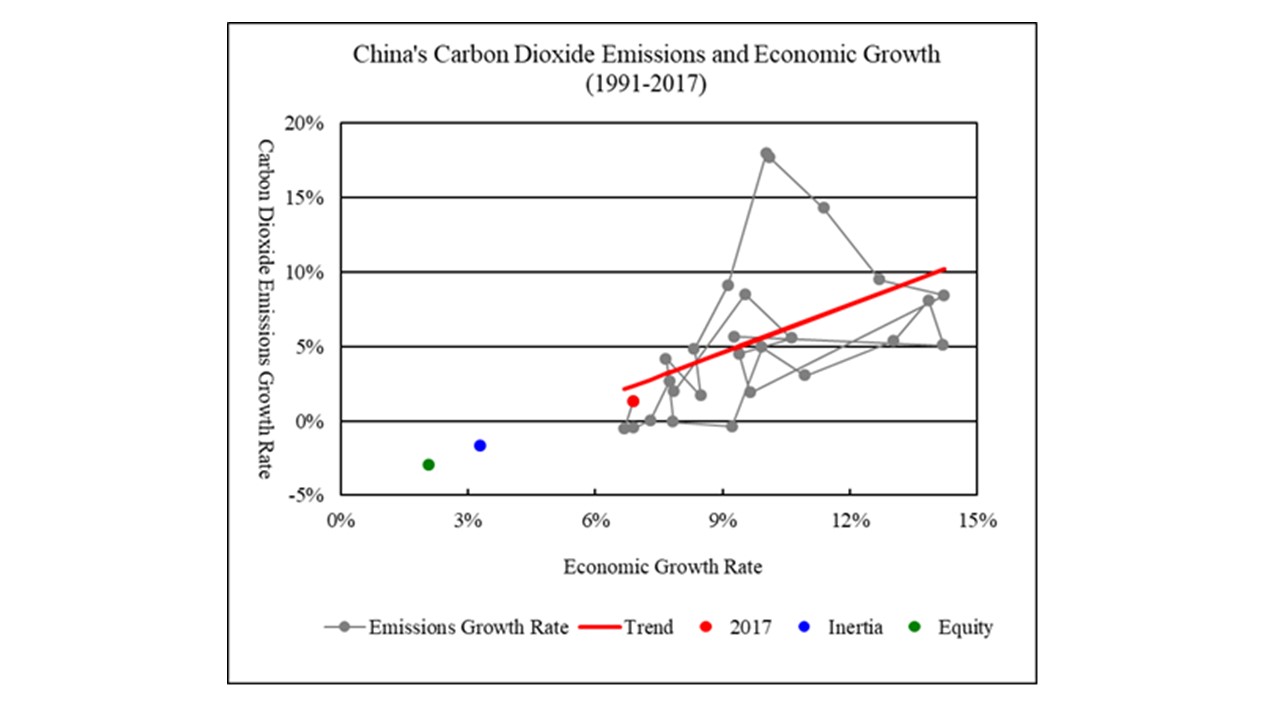
Figure 7 China’s Carbon Dioxide Emissions and Economic Growth, 1991-2017
Linear Trend: Emissions Growth Rate = -0.053 + 1.091 * Economic Growth Rate (R-square = 0.235)
Sources: China’s carbon dioxide emissions from 1990 to 2017 are from BP (2018). China’s gross domestic product in constant 2011 international dollars from 1990 to 2016 is from World Bank (2018), extended to 2017 using the growth rate reported by IMF (2018, Statistical Appendix, Table A1).
OECD
In 2017, total carbon dioxide emissions by the OECD (Organisation for Economic Co-operation and Development) countries were 12.4 billion metric tons, accounting for 37 percent of the world carbon dioxide emissions.
Under the inertia approach, OECD countries are entitled to 37.2 percent of the global emissions budget or 548 billion metric tons of cumulative carbon dioxide emissions from 2018 to 2100. By comparison, under the equity approach, OECD countries would be entitled to 17.3 percent of the global emissions budget or 255 billion metric tons of cumulative carbon dioxide emissions from 2018 to 2100 (based on OECD’s share in the world population in 2016).
Figure 8 compares OECD’s historical carbon dioxide emissions from 1990 to 2017 and the future emissions reduction path from 2018 to 2100 consistent with the inertia approach and the equity approach. Under the inertia approach, OECD’s carbon dioxide emissions will need to decline at a uniform rate of 1.7 percent from 2018 to 2100. Under the equity approach, OECD’s carbon dioxide emissions will have to decline at a uniform rate of 4.6 percent from 2018 to 2100.
Figure 9 compares OECD’s historical economic growth rates and the carbon dioxide emissions growth rates from 1991 to 2017. The carbon dioxide emissions growth rate has an intercept of -0.022 at zero economic growth rate and a slope of 1.126. That is, OECD’s carbon dioxide emissions have an “autonomous” tendency to fall by about 2.2 percent a year when economic growth rate is zero. For economic growth rates above zero, an increase in economic growth rate by one percentage point is associated with an increase in carbon dioxide emissions by 1.13 percent. R-square for the linear trend is 0.69. In 2017, the OECD carbon dioxide emissions grew by 0.4 percent, the same as what is implied by the historical trend.
If OECD’s carbon dioxide emission will decline in accordance with the equity approach, then the linear trend shown in Figure 9 suggests that the OECD countries will have to accept a uniform economic decline rate of 2.2 percent from 2018 to 2100. It is inconceivable that the OECD economic and political systems can survive such a massive and sustained economic decline.
If OECD’s carbon dioxide emissions will decline in accordance with the inertia approach, then the linear trend shown in Figure 9 suggests that OECD’s economic growth rate will need to fall to 0.4 percent. Given that the OECD population is still growing at about 0.7 percent a year, an economic growth rate of 0.4 percent would translate into absolute declines of per capita GDP.
The OECD carbon dioxide emissions peaked in 2007 at 13.6 billion metric tons. From 2007 to 2015, the OECD carbon dioxide emissions declined at an average annual rate of 1.2 percent. During the same period, the OECD countries struggled with multiple economic crises but managed to achieve an average annual economic growth rate of 1.2 percent. The emissions reduction rate required by the inertia approach is 0.5 percentage points higher than what the OECD countries accomplished during 2007-2015. A commitment to the inertia approach of emissions reduction will definitely be a difficult task for the OECD countries. But with strong political will and some luck (hope for some minor technological miracles), perhaps, it will not be economically and politically impossible for the OECD countries to reduce carbon dioxide emissions in accordance with the inertia approach.
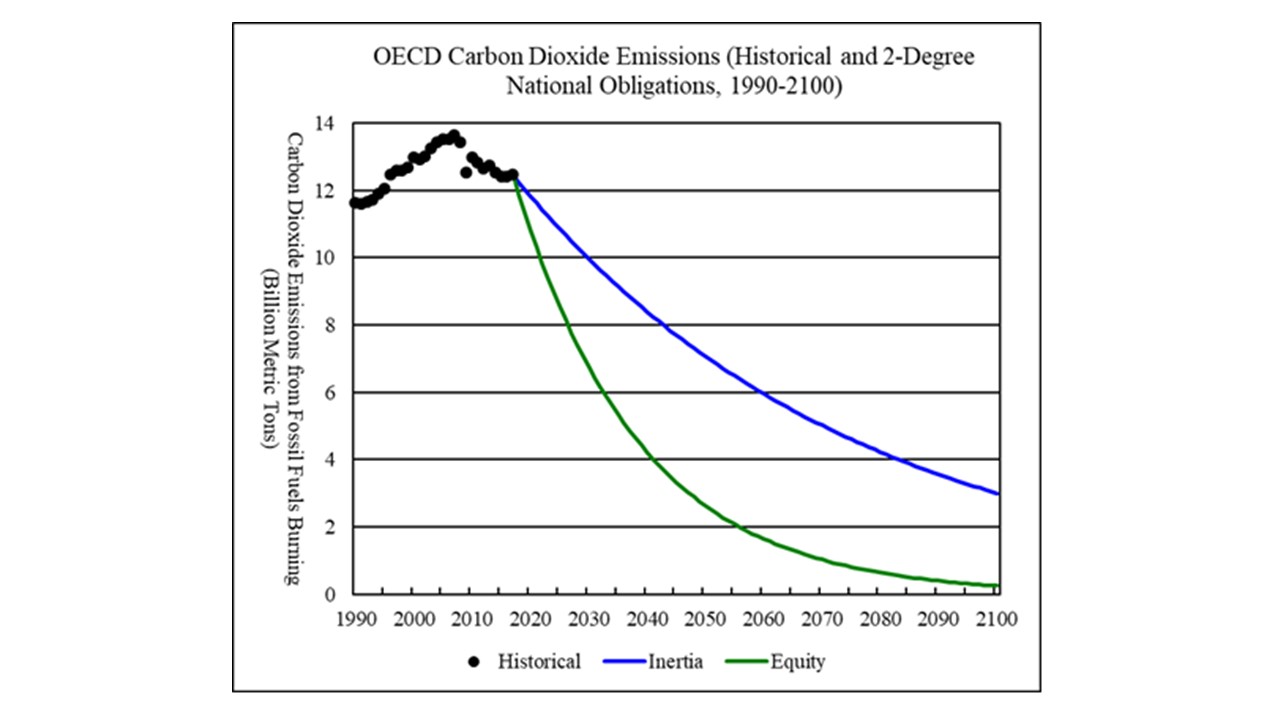
Figure 8 OECD Carbon Dioxide Emissions, 1990-2100
Sources: Historical carbon dioxide emissions from 1990 to 2017 are from BP (2018).
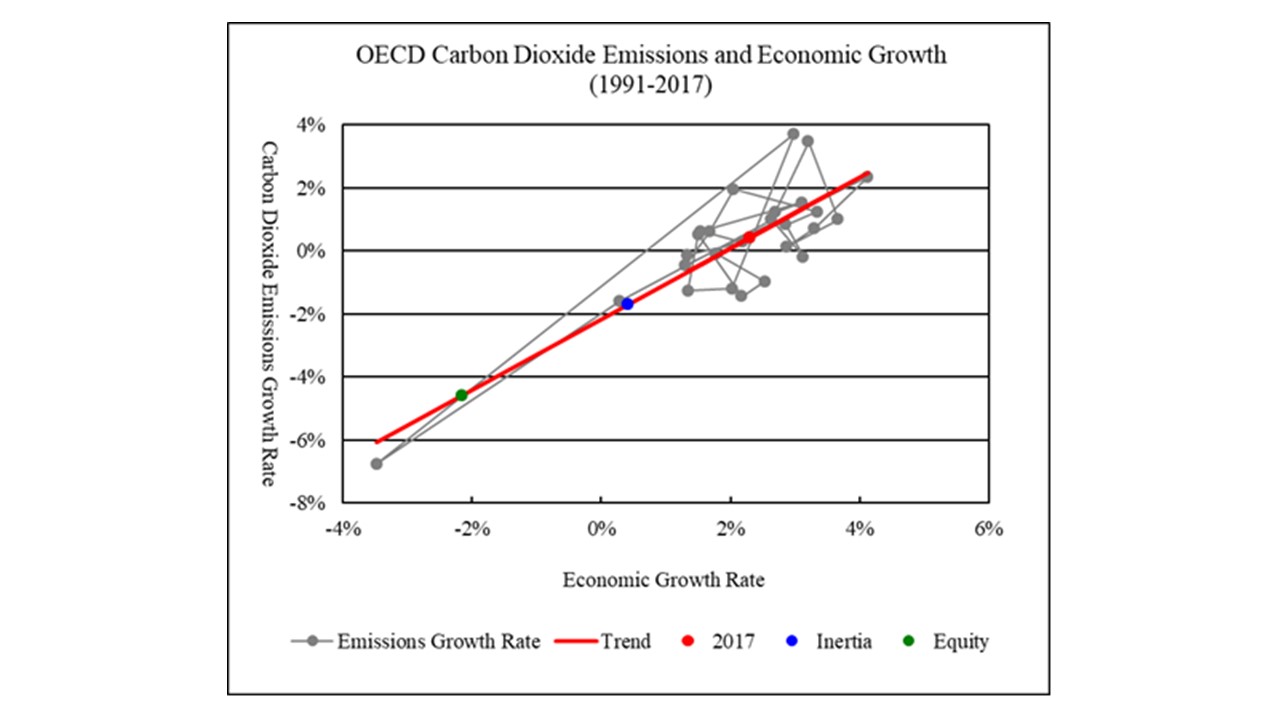
Figure 9 OECD Carbon Dioxide Emissions and Economic Growth, 1991-2017
Linear Trend: Emissions Growth Rate = -0.022 + 1.126 * Economic Growth Rate (R-square = 0.685)
Sources: OECD’s carbon dioxide emissions from 1990 to 2017 are from BP (2018). OECD’s gross domestic product in constant 2011 international dollars from 1990 to 2016 is from World Bank (2018), extended to 2017 using the growth rate for “advanced economies” reported by IMF (2018, Statistical Appendix, Table A1).
Rest of the World
In 2017, total carbon dioxide emissions by the rest of the world (total world less China and OECD countries) countries were 11.8 billion metric tons, accounting for 35 percent of the world carbon dioxide emissions.
Under the inertia approach, the rest of the world is entitled to 35.2 percent of the global emissions budget or 519 billion metric tons of cumulative carbon dioxide emissions from 2018 to 2100. By comparison, under the equity approach, the rest of the world is entitled to 64.2 percent of the global emissions budget or 946 billion metric tons of cumulative carbon dioxide emissions from 2018 to 2100 (based on the rest of the world’s share in the world population in 2016).
Figure 10 compares the rest of the world’s historical carbon dioxide emissions from 1990 to 2017 and the future emissions reduction path from 2018 to 2100 consistent with the inertia approach and the equity approach. Under the inertia approach, the rest of the world’s carbon dioxide emissions will need to decline at a uniform rate of 1.7 percent from 2018 to 2100.
To project the rest of the world’s future emissions path under the equity approach, I assume that the rest of the world’s ultimate emissions budget will be 1.42 trillion metric tons (derived by calculating the sum of the rest of the world’s cumulative emissions from 1965 to 2017, the rest of the world’s emissions budget from 2018 to 2100 under the equity approach, and a calibrated number). I assume that the rest of the world’s annual carbon dioxide emissions will continue to rise in the near future, before peaking and declining, following a trajectory that can be described by a logistic statistical model. I calibrated the parameters so that the rest of the world’s cumulative emissions from 2018 to 2100 equal 946 billion metric tons. Under the assumptions, the rest of the world’s carbon dioxide emissions are projected to peak in 2041 at 15.4 billion metric tons, decline to 14.9 billion metric tons by 2050 and to 4.2 billion tons by 2100.
Figure 11 compares the rest of the world’s historical economic growth rates and the carbon dioxide emissions growth rates from 1991 to 2017. The carbon dioxide emissions growth rate has an intercept of -0.014 at zero economic growth rate and a slope of 0.866. That is, the rest of the world’s carbon dioxide emissions have an “autonomous” tendency to fall by about 1.4 percent a year when economic growth rate is zero. For economic growth rates above zero, an increase in economic growth rate by one percentage point is associated with an increase in carbon dioxide emissions by 0.87 percent. R-square for the linear trend is 0.75. In 2017, the rest of the world’s carbon dioxide emissions grew by 2.2 percent, which is 0.1 percentage points higher than what is implied by the historical trend.
If the rest of the world’s carbon dioxide emission will decline in accordance with the inertia approach, then the linear trend shown in Figure 11 suggests that the rest of the world will have to accept a uniform economic decline rate of 0.3 percent from 2018 to 2100. Given that the rest of the world is currently having a population growth rate of 1.5 percent, the economic decline rate translates into an annual decline of per capita GDP by 1.8 percent. It is impossible for the rest of the world to find the inertia approach economically or politically acceptable.
The equity approach allows the rest of the world to emit more carbon dioxide emissions in the coming years, although their emissions growth will have to slow down after 2030 and peak in 2041, followed by rapid declines. The equity approach is more favorable for the rest of the world, at least in the short run. But it is absolutely unacceptable by the OECD countries.
Therefore, there is not a plausible way for either the inertia approach or the equity approach to be accepted by all three major regions: China, OECD, and the rest of the world. Without some large-scale carbon capture programs, it is virtually impossible for climate stabilization (defined as less than two-degree global warming) to be achieved within the existing world capitalist system.
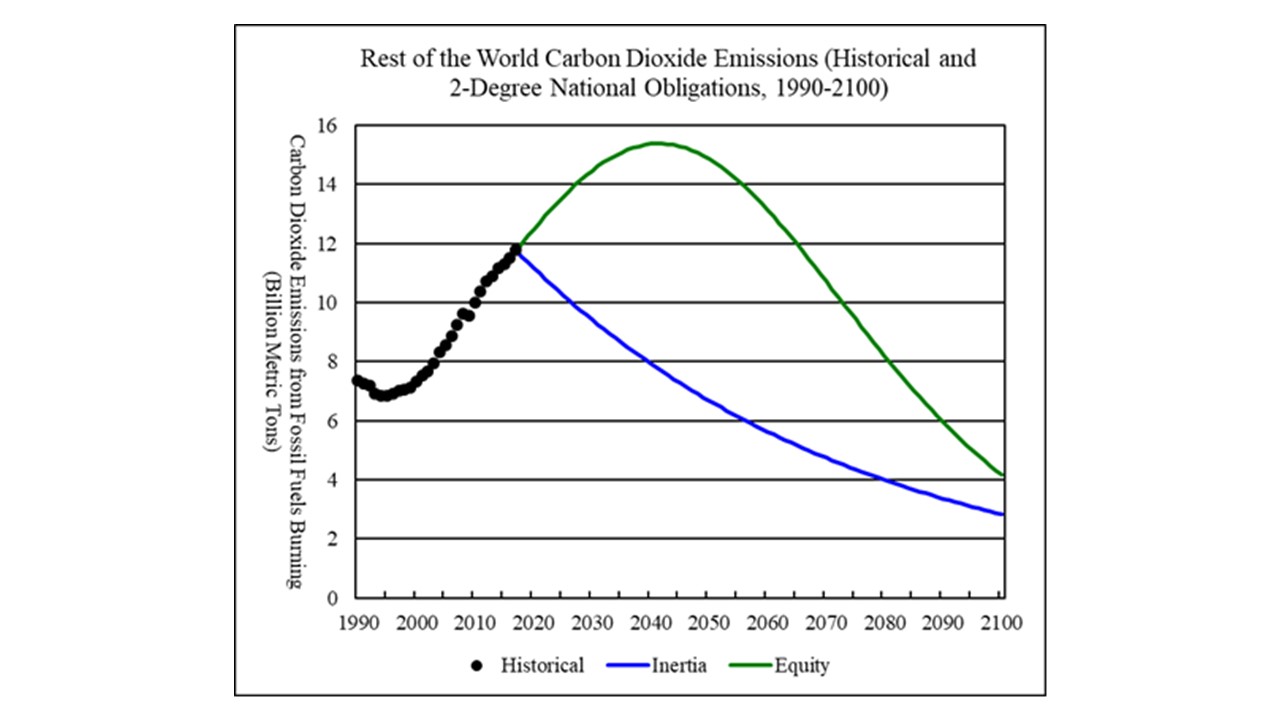
Figure 10 Rest of the World Carbon Dioxide Emissions, 1990-2100
Sources: Historical carbon dioxide emissions from 1990 to 2017 are from BP (2018).
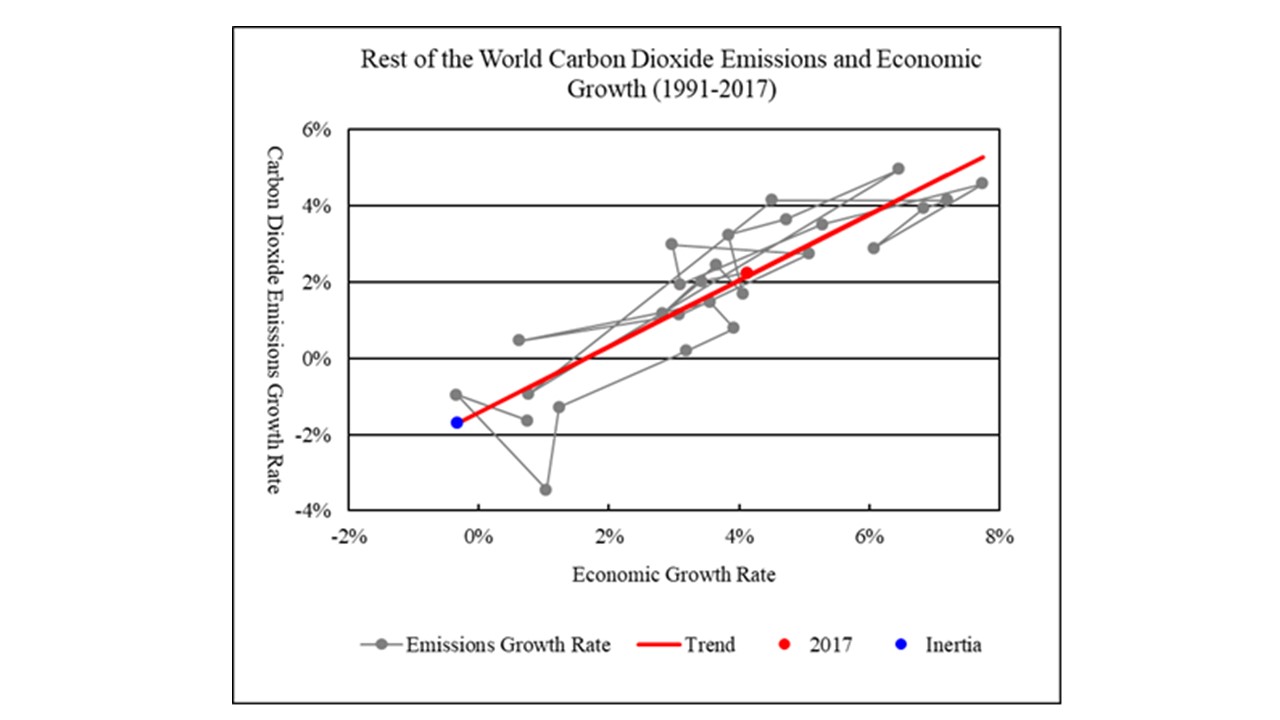
Figure 11 Rest of the World Carbon Dioxide Emissions and Economic Growth, 1991-2017
Linear Trend: Emissions Growth Rate = -0.014 + 0.866 * Economic Growth Rate (R-square = 0.685)
Sources: Rest of the world’s carbon dioxide emissions from 1990 to 2017 are from BP (2018). Rest of the world’s gross domestic product in constant 2011 international dollars from 1990 to 2016 is from World Bank (2018), extended to 2017 using the growth rates reported by IMF (2018, Statistical Appendix, Table A1).
Carbon Capture and Storage
To limit global warming to no more than two degrees, world cumulative carbon dioxide emissions between 2018 and 2100 will have to be less than 1.47 trillion tons. However, the global emissions budget has to be divided among the national states according to politically acceptable principles. Given that it is impossible for the OECD countries to accept the equity approach and impossible for the rest of the world to accept the inertia approach and China is likely to prefer the inertia approach to the equity approach, the only plausible way for a global climate consensus to be reached is for China and the OECD countries to be committed to emissions reduction in accordance with the inertia approach and the rest of the world committed to emissions reduction in accordance with the equity approach. But this means the world as a whole will exceed the global emissions budget by hundreds of billions of tons of additional carbon dioxide.
A comparison between the rest of the world’s equity approach and inertia approach suggests that if the rest of the world follows the equity approach, the cumulative carbon dioxide emissions from 2018 to 2100 will be 430 billion metric tons greater than under the inertia approach. To limit global warming to no more than two degrees, the extra 430 billion tons will have to be captured and stored.
According to EIA (2018), under the current technology, 1 gigawatt of coal power plant with 90% carbon capture and sequestration (CCS) costs about 5.6 billion dollars to build. Assuming annual depreciation, interest, and maintenance is 12% of the capital cost (depreciation 2.5%, maintenance 2.5%, interest rate 7%), the annual fixed cost will be about 672 million dollars.
With 50% capacity utilization, the CCS plant can generate 4.38 terawatt-hours of electricity in a year. CCS plant has lower energy efficiency than conventional coal power plants. The heat rate provided by EIA implies a thermal efficiency of 29%. To generate 4.38 terawatt-hours of electricity with 29% thermal efficiency requires thermal energy of 1.3 million tons of oil equivalent or 2.6 million tons of coal. Assuming a coal price of 60 dollars per ton (similar to the US central Appalachia coal price in 2017), 2.6 million tons of coal costs 156 million dollars. Thus, the annual total cost is 828 million dollars.
Assume the electricity sells for a wholesale price of 7 cents per kilowatt-hour. 4.38 terawatt-hours can sell for 307 million dollars. Thus, the net annual cost for the CCS plant is 521 million dollars (total cost less electricity revenue). Assuming that 1 ton of oil equivalent of coal emits 3.9 tons of carbon dioxide, 1.3 million tons of oil equivalent of coal emits about 5 million tons of carbon dioxide. But the CCS plant is designed to capture only 90% of the emissions. Thus, 4.5 million tons of carbon dioxide will be captured. It follows that, for each ton of carbon dioxide that is captured, the net cost will be 521 million dollars / 4.5 million tons = 116 dollars per ton.
For simplicity, I assume that the carbon capture and storage cost will be 100 dollars per ton. Thus, to capture and store 430 billion metric tons, it will cost about 43 trillion dollars. The rest of the world is unlikely to be willing or able to pay for the 43 trillion dollars. For ethical and economic reasons, the OECD countries (who have the financial resources and are responsible for most of the historical emissions) will be under strong pressure to pay for the carbon capture and storage cost required to remove the extra emissions by the rest of the world. In 2016, the OECD countries’ total GDP was about 48 trillion dollars. Thus, the total carbon capture and storage cost will be about 90 percent of the OECD GDP in 2016. But the total cost can be distributed over the remaining eight decades of this century. If the total cost is distributed evenly over eighty years, then the average annual cost would be about 540 billion dollars or 1.1 percent of the OECD GDP in 2016.
This is still a significant financial cost and there is no guarantee that the OECD citizens will accept such payment obligations even under the best political circumstances. If one or two of the major countries (for example, the United States) refuse to share their fair burden with other countries, then the entire scheme will fall apart. Moreover, there is no guarantee that the carbon dioxide emissions by the rest of the world will actually peak in 2041 and decline rapidly over the second half of the century.
References
Boden, Thomas A., Gregg Marland, and Robert J. Andres. 2017. “Global CO2 Emissions from Fossil-Fuel Burning, Cement Manufacture, and Gas Flaring, 1751-2014,” March 3, 2017. Carbon Dioxide Information Analysis Center, Oak Ridge National Laboratory, U.S. Department of Energy, Oak Ridge, Tennessee, USA. doi 10.3334/CDIAC/00001_V2017.
http://cdiac.ornl.gov/ftp/ndp030/global.1751_2014.ems.
BP 2018. Statistical Review of World Energy 2018.
http://www.bp.com/en/global/corporate/energy-economics/statistical-review-of-world-energy.html.
EIA. US Energy Information Administration. 2017. International Energy Outlook, September 14, 2017. https://www.eia.gov/outlooks/ieo/.
____. 2018. Cost and Performance Characteristics of New Generating Technologies, Annual Energy Outlook 2018, February 2018.
https://www.eia.gov/outlooks/aeo/assumptions/pdf/table_8.2.pdf.
Hansen, James and Maiko Sato. 2016. “A Better Graph,” September 26, 2016. http://www.columbia.edu/~jeh1/mailings/2016/20160926_BetterGraph.pdf
Hansen, James, Makiko Sato, Paul Hearty, Reto Ruedy, et al. 2016. “Ice Melt, Sea Level Rise and Superstorms: Evidence from Paleoclimate Data, Climate Modeling, and Modern Observations that 2°C Global Warming Could Be Dangerous.” Atmospheric Chemistry and Physics 16: 3761-3812. doi:10.5194/acp-16-3761-2016. http://www.atmos-chem-phys.net/16/3761/2016/.
IMF. International Monetary Fund. 2018. World Economic Outlook, April 2018.
https://www.imf.org/en/Publications/WEO/Issues/2018/03/20/world-economic-outlook-april-2018.
IPCC. United Nations Intergovernmental Panel on Climate Change. 2013. Climate Change 2013: The Physical Science Basis. Contribution of Working Group I to the Fifth Assessment Report of the Intergovernmental Panel on Climate Change, Summary for Policy Makers. http://www.ipcc.ch/pdf/assessment-report/ar5/wg1/WG1AR5_SPM_FINAL.pdf.
NASA. National Aeronautics and Space Administration, Goddard Institute for Space Studies. 2018. “GISS Surface Temperature Analysis.” https://data.giss.nasa.gov/gistemp/
Peters, Glen P., Robbie M. Andrew, Susan Solomon, and Pierre Friedlingstein. 2015. “Measuring a Fair and Ambitious Climate Agreement Using Cumulative Emissions.” Environmental Research Letters 10(10): 105004-105012. doi:10.1088/1748-9326/10/10/105004.
World Bank. 2018. World Development Indicators.
http://databank.worldbank.org/data/home.aspx.
358 responses to “Global Carbon Dioxide Emissions and Climate Change 2018-2100”
“The rest of the world is unlikely to be willing or able to pay for the 43 trillion dollars”
To me this is the kind of language that gives simple minded climate change deniers ammunition that solving the problem is unattainable. It sounds as if developing nations and the rest of the world need to pay the biggest polluting superpower for it’s sins. When in fact the superpower needs to develop the technology to save humanity and rise the worlds standard of living. There are only a hand full of industrial countries that have the technology to destroy humanity. It’s their duty to save it, the rest will follow as they do today.
There are two givens that are a must. We have to stop burning things and making babies.
Indeed the stop making babies part is here already.
‘Remarkable’ decline in fertility rates
By James Gallagher
https://www.bbc.com/news/health-46118103
There has been a remarkable global decline in the number of children women are having, say researchers.
Their report found fertility rate falls meant nearly half of countries were now facing a “baby bust” – meaning there are insufficient children to maintain their population size.
The researchers said the findings were a “huge surprise”.
And there would be profound consequences for societies with “more grandparents than grandchildren”.
The study, published in the Lancet, followed trends in every country from 1950 to 2017.
In 1950, women were having an average of 4.7 children in their lifetime. The fertility rate all but halved to 2.4 children per woman by last year.
But that masks huge variation between nations.
The fertility rate in Niger, west Africa, is 7.1, but in the Mediterranean island of Cyprus women are having one child, on average.
In the UK, the rate is 1.7, similar to most Western European countries.
The fall in fertility rate is not down to sperm counts or any of the things that normally come to mind when thinking of fertility.
But then there are articles like this saying if the human sperm counts don’t stop falling like they have, humans won’t be able to reproduce in a few generations.
Sperm Count Zero
By Daniel Noah Halpern
https://www.gq.com/story/sperm-count-zero
A strange thing has happened to men over the past few decades: We’ve become increasingly infertile, so much so that within a generation we may lose the ability to reproduce entirely. What’s causing this mysterious drop in sperm counts—and is there any way to reverse it before it’s too late?
I don’t have that problem. Maybe it’s the tattooing and shaving your bodies that does it? Or that feeling of inferiority you get when you go to cheer feminist abuses against men?
… pretty sure that’s not it.
Maybe your uptight arse takes some of the pressure off of your balls.
Leaving drilling pressure… from this article it looks like IEA confirms peak oil is here:
https://cleantechnica.com/2018/11/22/peak-oil-drastic-oil-shortages-imminent-says-iea/
“the superpower needs to develop the technology to save humanity and rise the worlds standard of living. There are only a hand full of industrial countries that have the technology to destroy humanity. It’s their duty to save it”
Indeed, and good luck with that.
I’m having fun reading these type of comments. All we need is “Climate Justice” posters and a Viva Marx cheer section. At least we can see clearly that global warming is now a political weapon. They are coming out of the closet.
You’re all muddled up in your head about Marx. He wasn’t interested in climate issues at all.
muddled up about so many things. damaged goods.
“Good luck with that” is an ironic, colloquial expression meaning, in essence, “ain’t gonna happen.”
Yo! Do you enjoy being an asshole or is it just your way of coping with that huge chip on yout shoulder?! Either way, you are a rather sad and pathetic excuse for a human being. I’d invite you to join the human race but I get the impression you aren’t all that interested.
… it’s an incel thing
^ This sort of remarkable and callous arrogance that sullies this blog and that I’ve come to expect from one Fred Magyar– in this case, ‘broadly defining’ another human being through the use of a mindless adolescent-level expletive and hackneyed cliche– a personal attack in response to essentially none. Of course, one can risk falling under their own terminologies through their usage. Maybe some might call it, ‘projection’.
That writ, Fernando, I’m unsure I understand how you can think that burning shiploads and shiploads of fossil fuels over a fair length of time on a finite planet with a relatively-thin atmosphere can amount to negligible effects on climate, if that’s what you’re suggesting.
In any case, there are a myriad of other serious human-caused concerns beyond just climate change.
The best way to sequester carbon is in topsoil, which already contains much more carbon than the atmosphere, but is severely degraded in many places around the world, mostly thanks to poor agricultural practices.
It is cheap and easy to stop erosion. The question is only whether we will do it, not whether we can do it.
I fully support financing family planning efforts in countries with excessive birth rates, and encouraging more births in nations with low birth rates.
… it appears that the existence of the existing capitalist system is fundamentally incompatible with global ecological sustainability.
Sounds about right, but what system is compatible – we know of one: hunter-gatherers – worked for a couple of hundred thousand years, though not in an already desolated world moving past tipping points to a hothouse condition and definitely not with 8 to 10 billion people.
1.47 trillion tonnes of carbon in the budget, but 1.6 trillion in the permafrost (plus other non ‘industry’ sources of peat, southern ocean sink reversal, soil sink reversal, hydrates etc.)
I recommended the good doctor as a Conressional witness on these topics, even though I am opposed to the Chinese brand of capitalism because I really can’t stand dictatorships.
Yes, even the very conservative and behind the data IPCC says we only have 721 billion tons of CO2e left to burn before 2C. Carbon emissions need to stop now. This whole plan to allow and encourage more fossil fuel burning is completely insane to anyone with knowledge of the physical and environmental state of the world. Forget CCS, it’s an expensive boondoggle that will do nothing, cause lots of future problems and encourage the continued destruction of the ecosystems.
We need a heavy tax on all fossil fuels right now and that tax to be used for renewable energy development, building efficiency, and other carbon reduction programs. Maybe, just maybe by reducing carbon emissions over the next decade to near zero we can avoid a greater than 4C world.
The World Energy Report plan is a guaranteed move toward an empty Eocene type planet.
Sounds about right, but what system is compatible
I guess we will either somehow have to come up with a completely new system that does work and is at the same time ecologically sustainable or we simply will not have an industrialized global civilization to speak of…let alone 8 to 10 billion humans.
BTW, just read that the Yangtze river has pretty much become a fish desert with many fish species already extinct or on the verge of extinction.
Hopefully economists will come around to the idea that all economic systems are subsidiaries of Ecosytems Inc.
Cheers!
I have a problem envisaging how a sustainable (I’d assume that means steady state, but maybe it doesn’t) civilisation with a large population would be stable based on human nature. People will always strive to get ahead of others and that is naturally destabilizing. In small tribes it can be controlled through tit-for-tat retribution, and anyway there’s less of an incentive because of the close genetic ties. In a growing civilisation then there’s a way to accommodate the ambition, in fact it’s applauded in capitalism as we’ve been sold on the rising tide lifts all boats myth. In a zero sum situation then one persons gain is another’s immediate loss, and they wont be happy about it. Averaged over time we are zero sum now, but those that are going to lose are our descendants; or if those alive now then it’s at least some (admittedly shortening) time in the future. I guess Egyptian civilisation lasted a long time without really growing but it seemed to go through continuous upheavals and wars, and maybe didn’t have a population we’d consider ‘big’.
“we’ve been sold on the rising tide lifts all boats myth”
My favorite of the capitalist bromides.
My response: “You’re still in your yacht, and I’m still in my dinghy.”
Speaking of deserts:
From Cornell Lab of Ornithology
Losing Ground: What’s Behind the Worldwide Decline of Shorebirds?
It is hard to imagine a more altered, manipulated landscape than the one that stretches south from the industrial city of Tangshan, on the Yellow Sea coast of China. More than 100 square miles of former tidal flats have been converted into an endless expanse of salt-making ponds, known as the Nanpu Saltpans—an industry with roots here that stretch back a century or more. But rarely has seawater been evaporated into salt on such an immense scale, an area the size of Tampa.
An equal area of “reclaimed” land— what was once coastal mudflat habitat, walled off from the sea and transformed for industrial purposes—now holds a haphazard mix of chemical factory smokestacks, power-plant cooling towers, wind turbines, manufacturing complexes, half a dozen prisons, and an oil drilling and storage facility. It’s a weird mix of factoryscape, briny ponds, and immense mountains of gray-white salt, all part of a massive, half-finished industrial and port complex called the Caofeidian New Area
https://www.allaboutbirds.org/losing-ground-whats-behind-the-worldwide-decline-of-shorebirds/
My basic problem with all of this analysis is that, it is based on a faulty premise. Below is a graph prepared by Auke Hoekstra, researcher at the Eindhoven University of Technology in the Netherlands. This graph shows how for at least the last thirteen years the IEA has been consistently low balling their projection for global solar PV deployment. This graph is the latest revision, including the projections from the IEA’s 2018 WEO and again, this year the IEA stubbornly refuses to acknowledge that solar PV manufacturing capacity is increasing exponentially, doubling about every four years. If one were to accept the projections in the 2006 edition of the IEA’s WEO for example, the cumulative installed PV capacity today would be less than 20 GW. Instead, it is approaching 500 GW, twenty five times more than the amount projected by the IEA in 2006!
If Prof. Li’s analysis is based on IEA projections of what the energy mix is likely to be going forward then it falls victim to the faulty projections of the IEA. One only needs to look at the graph below to realize that there is something seriously wrong with the methodology that the IEA is using to come up with their projections for PV, an error that puts almost every other projection they make into question. It is my opinion that solar PV is now at a scale where continued growth will, of necessity, result in declining use of other forms of energy. If the IEA is so grossly underestimating the growth of solar PV, they are also grossly over estimating future carbon emissions.
If one examines the US for example, from the latest edition of the EIA’s Electric power monthly, total year to date electricity generating capacity additions are at 16.2 GW while capacity retirements are at 13.8 GW, for a net gain of 2.4 GW. According to the latest U.S. Solar Market Insight Report from Wood Mackenzie Power & Renewables (previously known as GTM Research) and the Solar Energy Industries Association (SEIA), the U.S. market installed 2.3 GWdc of solar PV in Q2, 2018. This follows 2.5 GW for Q1, for a total of 4.8 for the first half of 2018, twice the net gain in US generating capacity for the first eight months of 2018! The SEIA projects that the US will install over 10 GW of PV capacity for all of 2018. This kind of scenario is bound to result in reduced carbon emissions from the US electricity generating sector going forward.
Critics of this analysis might say that this sort of growth is not sustainable but, there are a couple of factors that suggest that current rates of growth of adoption of PV might actually accelerate. First is the fact that the latest Levelized Cost of Energy (“LCOE”) Analysis from financial advisory and asset management firm Lazard, shows wind and solar as the lowest cost sources of electricity, a development I have posted to this blog recently. There is also the fact that there are several cost reductions in PV technology that are yet to be realized in the broader market leading to an expectation of further declines in the cost of solar PV. If the growth in PV capacity has been as robust as it is when it was not the least cost source of electricity, what is likely to happen now that it is?
Growth and sustainability are basically mutually exclusive in the long run, it doesn’t matter if its population, PV panels, fossil fuels, fish catches or land under cultivation. At 1% population growth then in 10000 years every single atom in the universal will be a human being. Egyption civilistaion lasted 3000 years, if they’d started with one cubic metre of ‘stuff’ and grown it at 3% (what is considered about the minimum required from pension plans) then it would have been a sphere bigger than the orbit of Neptune at the end (numbers from memory I can’t be bothered to check them). When do you think growth should end?
“When do you think growth should end?”
If you’re talking about solar PV, that would be when the use of FF has been eliminated from the electricity generation and transportation sectors. That is when carbon emissions from these sectors are essentially zero. Population growth should have stopped years ago but, sexual intercourse is too pleasurable, contraception is too inconvenient and people in general appear not to think about all the possible consequences of having sex before they do. That is the nature of the human being!
My almost singular focus is on how we can reduce global carbon emissions but in the almost three million people living on the island where live, I suspect that the number of people who share my concerns, at the level I do, is less than a hundred. I have never met anybody locally who is as concerned about the matters discussed on this blog as I am. How do we get the rest of the population to reduce their carbon emissions? Make zero emissions technology more attractive (less expensive) than carbon emitting technology. How do we get people to accept that human population levels are a problem? Heaven knows.
As has been said on this site before, the size of the human population is the root cause of our predicament and I fear that solving that problem in the short term will not be pleasant.
Somewhere a couple of years ago I read a blog that had tried to determine which personality types on the Myers-Briggs scale read blogs such as his (and this) and could be made to be concerned about the issues. Leaving aside all the issues with personality testing and how much I hate such labels, I think it came out with only about a maximum 5% of the population would even be bothered to consider it, let alone be convinced (INTJ, INFJ and INTP mostly – which I think are exemplified by engineers, architects, ‘wise-men’, counsellors – probably a close intersect with the group who already have the lowest birth rates) and so he pretty well gave up with the blog.
Hi George,
I’m pretty sure you are referring to the post “Programmed to ignore?” on the Do the Math blog (post at https://dothemath.ucsd.edu/2015/04/programmed-to-ignore/ for anyone interested). Back in the day I found the blogpost _after_ reading another blog criticising its conclusion (crazy I can’t remember that blog but I can remember Do the Math). Do the Math concluded that xSxx types aren’t interested in his blog, that there are more xSxx types than xNxx types and so his cautionary blog was not going to convince enough people to make a difference. The critical post pointed out that just because xSxx personality types won’t be convinced by a hardcore physics based rational blog on the internet it doesn’t follow there isn’t some other way to convince them.
Cheers, Phil
P.S. re-reading the blog, may be you saw the Peak Prosperity blogpost that inspired the Do the Math survey/post.
Yes, thanks. I think this post is closer to the “hard core physics” types, and I don’t see much evidence of most people being convinced by other methods.
It sort of depends on bow you measure growth. Generally people tend to assume it means making more stuff, but economists interpret is as adding more value.
For example, electronic equipment is shrinking down to zero size while increasing in value. This classic article illustrates the point well:
https://www.huffingtonpost.com/steve-cichon/radio-shack-ad_b_4612973.html
Another example is electricity. Nearly half the fresh water taken from rivers and lakes by humans is used to cool thermal power plants. But these are being rapidly replaced by wind and solar panels, which don’t use any water at all for cooling.
Electrification of transportation is another good example. Right now there is a severe shortage of liquid fuel in Germany, because the drought has lowered river levels, making transport by riverboat difficult. This is a reminder that the business of transporting fuel is itself a huge overhead which is set to rapidly disappear as EV sales ramp up.
Apple is trying to sell its phones for $1000. It’s a nice toy, but compared to a potato it is primitive and simplistic. And potatoes are basically free. There is plenty of room at the bottom, as Richard Feynman put it.
Deployment of solar panels is only part of the story. What we need is information on actual KWH delivered, and a full understanding of how intermittency is to be handled. I suggest those of you who are so focused on solar power work out a business case to put Jamaica on solar power by 2060.
As far as I am concerned, it had better happen a damn sight faster than that! In 2060 I will be 99 years old or preferably dead so 2060 ain’t cut’n it!
Luckily the prime minister seems to be warming up to the idea of more renewable energy, sooner rather than later.
Jamaica’s prime minister calls for 50% renewables by 2030
Noting that island nations are “very vulnerable to oil price movements and energy shocks,” Jamaica’s Prime Minister Andrew Holness has called for his country to aim for a higher share of renewables.
“The current policy is that 30 percent of electricity should be generated by renewables by 2030. I believe we can do better, so I have directed the government to increase our target from 30 percent to 50 percent,” he said.
The Jamaican Prime Minister can also ask that Jamaica win the World Cup by training footballers on cement courts, and build its own spaceship to send 20 Jamaican colonists to Mars.
This is what I call the Five Year Plan argument, although you are more Soviet than the Soviets and want to make a Forty Year Plan.
This argument simply boils down to an admission that fossil fuels can’t compete against solar, but they are still in the running against batteries. Fair enough, but competition between batteries and diesel power plants (like almost all of Jamaica’s power plants) has nothing to do with solar, and won’t slow its spread.
I think it’s a safe bet that diesel consumption by Jamaica’s electricity sector will decline dramatically in the next ten years. I don’t think we need central planning, it will happen by itself, because solar will make the diesel plants unprofitable and they will go belly up.
Except that the local monopoly utility is in the final stages of building a brand new 190 MW CCGT fueled by NG supplied by LNG outfit New Fortress Energy:
Old Harbour Power Plant 2-months Ahead of Schedule
Prime Minister Andrew Holness says construction of the multi-million dollar 190-megawatt power plant in Old Harbour Bay, St Catherine is two months ahead of schedule.
The plant is expected to help reduce electricity bills and improve Jamaica’s energy security.
The plant being replaced in the same facility is a 50+ year old steam plant fueled by Bunker C heavy fuel oil. The new plant should also retire other similar units such that the country should be able to stop using Bunker C. Most of the newer plants do use diesel but, I still expect that they will all be under extreme financial stress by 2030 including the new NG plant.
Already several large commercial customers have installed PV systems in excess of 100 kW in size and there are some businesses that have installed PV at every location they operate.
Yes, that’s sort of my point. Whatever the government is planning, traditional energy sources are likely to feel a serious financial squeeze in a few years from solar.
Whether or not you like solar, there’s no question it is a serious financial problem for tradition energy companies.
fossil fuels can’t compete against solar, but they are still in the running against batteries.
Don’t forget that only maybe 1/3 of solar power needs to be stored. Most of it should be used as it’s generated. Consumption should move to the daytime: EV charging and appliances can be scheduled. HVAC and refrigeration can also be shifted somewhat with modest design changes (more with more extensive changes).
We could shift probably 2/3 of overall energy consumption to the day time with tiny costs, and shifting 80% would probably be the minimum cost solution, overall.
These sorts of things apparently should have all been done or at least begun ~30 years ago by those you’ve been ostensibly implying should be doing this now– in the face of more severe ecological issues, compared with ~30 years ago. Unsure how you square that at this point, but maybe I missed some of your commentary where you went over that. If so, feel free to direct me to it.
Eating the Earth.
The total human maw size is over 50 square miles now. That’s food getting dumped down into a 50+ square mile hole each day, every day, to keep the 343 million tons of human going.
One can think of humans as one giant organism with a mouth bigger than 4 miles across and weighing over 300 million tons with giant hands ripping up the life on earth, stuffing it in that huge maw and swallowing at the rate of 17 million tons per day (or more).
That’s a lot of poop.
Add to that the huge amount of material to feed the industrial maw as well as the gigantic amount of dirt and rock moved each day by machines. Plus the huge amount of waste poured into the air, waters and ground each day.
Humans cut a wide swath.
I wonder how long the sacred cows will last in a hungry world.
Ok, so then why are you promoting solar panels?
CO2 kills. It kills the ocean life, the wild land creatures. Methane kills too.
Like creating yet more C02 by burning yet more FF’s (within the continuation of BAU and its inherent problematic ecological and socioeconomic contexts) for questionable solar panel buildouts.
How did I know you would respond like that? Oh, because you consistently use climate denier myths in response to renewable energy.
Fine, then reap the rewards of your folly and enjoy the demise of nature.
We know the earth is getting greener.
C02/methane are symptoms that the ’cause’ uses/advocates non-renewable renewable energy ‘bandages’ to treat.
Because you can predict the future, contrary to the uncertainty principle.
See also here and here, specifically the highlighted text.
…and here.
The global urgency of both the environmental damage and the effects of climate change is only fully acknowledged by far less than 1 percent of the population. Self interested individuals of low morals and even lesser comprehension, as seen on this blog, are rampantly interfering with any efforts to organize a large scale change in mental perception let alone real action. Even the organizations supposedly tasked with assessing the predicaments fall far short of reality.
Here is a more realistic assessment of the state of climate change and the latest IPCC report.
Dahr Jamail: Unpacking The IPCC Report & Abrupt Climate Disruption
https://www.youtube.com/watch?v=rOk_0usZALQ&t=14s
If just one major utility saw the light on renewables and made a transition, showing benefits on its bottom line, then solar production would go crazy. Just one would catalyse the whole thing. What utility could then withstand the investor pressure to increase returns by making the switch?
NAOM
Most utilities are building out PV plants. The latest US Pv fab plants are captive. Jinko in FL is sold out to Next Era. Q Cells in GA is for Southern. Each is over a Gigiwatt annually.
Next Era just bought the electric transmission lines to SFran for $1 B
https://www.utilitydive.com/news/nextera-buys-san-francisco-transmission-cable-for-1b/542647/
As we speak, Utility Monopoly Gulf Power is lobbing Tallahassee Florida Lawmakers and PSC to ask for a FIVE YEAR $5.00/month BASE SERVICE Surcharge for ALL customers regardless of Service Area to pay for $400 million repair cost of Micheal. Every electrical pole in Panama City was shredded! Utilities have recently wasted millions of ratepayer $$ in lobbing to increase base fees to retard customer owned Net Metering Distributed Generation. Southern company is forced to sell Gulf Power due to the financial bloodletting over execution failures in too big to fail Kemper Clean Coal and Vogtle Nuclear fiascos. Vogtle will be the most expensive man made object on the planet weather completed or not. This .4 Billion is not part of the SALE with NEE which closes Jan 1st. It’s only Fair for such REGRESSIVE fees be paid as a consumption charge – NOT charges on the back of those that can least afford it. As some politicos preach, never let such crisis go to waste. Such disasters (Like 911) are dreams come true for Lawmakers and Monopolies if customers allow. The Sunshine state imports 99%+ of it’s energy. Inform Lawmakers that unnecessary Fixed meter charges are not acceptable or fair. Time is Short.
As I see repairs of damage from summer storms being made to houses and buildings now, months later and still see remnants of destruction from Sandy and other storms, I wonder when the damage rate will exceed our ability to repair even critical infrastructure.
This is where a distributed, modular grid will help. No need to repair the whole area to get power back, just fix the parts that are needed.
I suspect another storm in 3-5 years hitting the same part of the coast as Michael may start to get peoples attention. I wonder what the effect of a double gulf coast hit would be if in one season a cat 4 or 5 hit a few miles west of Houston then another jest west of New Orleans, when would the national economy start to creak with that level of damage? BTW, have they even finished repairing New Orleans yet?
NAOM
Should coastal neighborhoods and towns destroyed in hurricanes, or flooded lowlands anywhere, be rebuilt?
Or relocated.
My vote is on abandon and relocate but it will take a few examples before the thick Herberts get the message. OTOH even with the best plans storms and other catastrophes can occur and a modular grid would help. For example, we had a sudden, quite exceptional, no warning wind storm that took out a lot of power lines and I was power off for 3 days before it got fixed.
NAOM
All it takes is people not moving back in and it becomes an instant park. Here in Nevada, we had several such places as the mines played out – they are called ghost towns. I live in one on life support.
I think between the costs of natural disasters and health care, our economy is increasingly going to be spent on damage control.
PV Array, Rails and mounting system preserves roof sections and shields roof from flying objects. Panel level monitoring provides info on which panels have been damaged. Standardized panels allow replacement in minutes. Panels are disposable costing a fraction of other roof work. Loss of 1-3 panels per system was typical in Michael due to large flying objects like trees. A panel will survive about the same blow as a car windshield.
There’s no indication that damage from storms has increased over the last 100 years once we account for population change, the movement towards the coasts, and the value of the properties involved. We do see a lot of fake data which hasn’t been homogenized.
“We do see a lot of fake data which hasn’t been homogenized”
True, the worst of it, from Fox News, needs to be pasteurized too.
Believe world volcanoes produce 3X all human CO2 production. Fix would be fertilize oceans…CO2 sequestration via plants…
“According to the U.S. Geological Survey (USGS), the world’s volcanoes, both on land and undersea, generate about 200 million tons of carbon dioxide (CO2) annually, while our automotive and industrial activities cause some 24 billion tons of CO2 emissions every year worldwide.”
https://www.scientificamerican.com/article/earthtalks-volcanoes-or-humans/
Troll alert?
Trolls usually try a bit harder than this random gibberish.
Shop here
https://www.ebay.com/bhp/nomex-underwear
If you accept these projections of CO2 as close to correct (I do), then by the end of the century humans won’t be putting up nearly as CO2 as we will over the next 20-30 yrs.
CO2 in the atmosphere should peak out within 50 yrs.
After all the damage from it is done, things will be better. In 100-200 yrs might even stabilize.
A much smaller population of people will have lots of metal and plastic to sift through.
The consensus seems to be growing that if we get past 2°C (and let’s remember scientists are always conservative) earth will be in self reinforcing feedback towards a hothouse condition so things wont be smoothing out after 2100. Sudden collapse almost always leads to undershoot – the decline in population lags the destruction of resources until there are none left – so extinction is highly likely if initial overshoot is high.
There’s no such consensus. The figure was pulled out of the air. The main threat is sea level rise, but that’s manageable
The main threat is sea level rise, but that’s manageable.
Of course it is. If the sea level gets too high we just pump some of it out.
https://www.youtube.com/watch?v=EGlo9LzmOME
This might be a good place to post this. I am less concerned about achieving economic equality than in reducing consumption. But maybe they happen simultaneously.
————
In “The Great Leveler”, the Stanford professor posits that throughout history, economic inequality has only been rectified by one of the “Four Horsemen of Leveling”: warfare, revolution, state collapse and plague.
https://www.economist.com/open-future/2018/09/10/can-inequality-only-be-fixed-by-war-revolution-or-plague?fsrc=scn/fb/te/bl/ed/howtofixinequalityopenfuture
Interesting. The big question for the present- can a fifth leveling force be applied successfully, that being Democracy. A functionally and strong democracy.
I think its possible, but it would take a very literate population to make wise choices. To know propaganda, fear-mongering, and bullying when they are confronted by it. To fight against he campaigns of the super wealthy. All you need to do is look at a hand full of the comments of Trump, or Fernando, or listen to Fox news, to see the kind messaging you would have to confront.
I think it would be a fantastic thing to try, considering the founding fathers of the US ran away from a true democracy and merely developed a new form of aristocracy called a representative republic.
Why not give it a go, can’t do much worse than we are now? Government of the people, for the people and by the people. Truth be damned.
Enjoy the day, each one is precious.
“The best argument against democracy is a five-minute conversation with the average voter.” ~ Winston Churchill
Priceless, and timeless-
“The best argument against democracy is a five-minute conversation with the average voter.” ~ Winston Churchill
Churchill was a good wartime PM, but he was never someone comfortable with people who weren’t born into his circle. Didn’t matter if they were well informed or not…
Countries ruled by communists/fascists aren’t interested in democracy. Cuba, China, Venezuela, Saudi Arabia, and Angola are examples.
And neither are people like you! You are stuck in an anachronistic outdated world view where neo liberal economic principles based on fossil fueled powered ‘Growth’ solves all problems. Based on most of your comments the impression I get is that your world view is also authoritarian and fascist, a case of pot calling kettle black if ever there was one.
On top of that you are misogynist and a denier of the consequences climate science. Not that most of that is really your fault you are just a product of our times…
Plague seems the best. The Eastern Roman empire wouldn’t have lasted as long as it did without losing half its population to it after the 536CE and later volcanos and the black death in Europe and UK lead directly to many of the political and personal freedoms we have in the west today. Mostly it’s about forcing the oligarchs into positions where they can only maintain power and privilege by granting much greater allocation of resources to the rest of the population (sudden manpower shortage is one way and also means there are fewer people to share the wealth).
With automation the wealthy can get along with far fewer people than they needed centuries ago. The wealthy don’t need so many to toil their fields, run their factories, fight their wars, etc. so the masses don’t have their labor as leverage as they once did.
I’m not sure why Professor Li brings up the ‘capitalist system’ so prominently in the article?
Perhaps I don’t know the proper definition.
Seems to me that communist or socialist systems can produce just as much CO2.
Depends more on how many people, and their level of industrialization.
The only connection I can see is debt-fueled growth.
If you maximize the economic growth with as much debt as you can muster (borrowing from the future economic production and wealth), you can grow far into overshoot. Like we have now.
Perhaps this is more likely in a capitalist system. I’m not at all sure that is true.
Capitalism is simply the default system. The history of civilization has been a history of capitalism. It has always been a dog eat dog world. To blame anything on capitalism is nothing more than blaming it on human nature.
Agree Ron.
“Capitalism is simply the default system”
I would have said capitalism is simply the natural system. Other wise I think your right on. Regulations are capitalism guard rails to a civil and successful society. Those who call for a change to a different system are just ill informed.
There was no capitalist world system 500 years ago. Even 200 years ago, it was still restricted to Western Hemisphere plus a fraction of Eurasia. In fact, even the English word “capitalism” was not yet invented then. In 1848, Marx talked about “bourgeois society”. So there is not such a thing called “natural system”
There were no humans a million years ago, not even half a million years ago. So there is no such of thing called humans. Oh I see how this works now.
Capitalism is very recent development.
First developed in Netherlands and England in the sixteenth to seventeenth centuries, and wasn’t part of the global world until colonization.
It will be gone shortly, as it needs a expanding economy.
What comes next?
Who knows?
Capitalism – an economic and political system in which a country’s trade and industry are controlled by private owners for profit, rather than by the state. Synonyms: free enterprise, private enterprise, the free market; enterprise culture
The free market has always existed, albeit at low percentage levels of total production, which was mostly subsistence agriculture or hunting and gathering. It is certainly true that capitalism has expanded greatly with the dramatic increase in production that came with widespread use of fossil fuels, but the concept of private enterprise and private trade didn’t spring out of nothing. It was always there.
There were even private markets under pre-fossil-fuel feudalism, in which the politically powerful were mostly concerned with defense and taxation. Lots of trade opportunities were given to people by the state, but they were given to private enterprises. There were also private traders operating without state support at the same time.
Even tribal groups engaged in trade, although it is often difficult to discern a distinction between “the state” and “private enterprise” in tribal circumstances.
Capitalism as a word didn’t exist but the mercantile economy (profitable trade) has been going on well before money and money has been around for 5K years.
The Grim Pollution Picture in the Former Soviet Union
https://www.huffingtonpost.com/armine-sahakyan/the-grim-pollution-pictur_b_9266764.html
Troubled Lands- The Legacy of Soviet Environmental Destruction
https://www.rand.org/pubs/commercial_books/CB367.html
It seems to me that capitalism has no monopoly on damaging the environment. I’d suggest rapidly destroying the environment is more a function of being an industrial economy, whether capitalist or some other. Non-industrial economies seem to destroy the environment more slowly.
First of all, people who lived in former socialist societies did not call these societies “communism”. That’s an American expression later imposed on the rest of the world
Secondly, 20th century socialisms were a part of the capitalist world system and had to play the system’s basic game–economic growth
Thirdly, according to the world system theory (and agreed by many others), the essential feature of capitalism is the pursuit of endless accumulation of capital.
Someone might say you can have market without growth. It is possible to have a non-growth economy if the market is not dominant, like all the pre-capitalist societies. But if the market is dominant, then you have competition everywhere and competition forces everyone to pursue growth. If you do not grow, you fail and you are eliminated. That happens both to individuals and countries
Lastly, at least a large minority of environmentalists agree that economic growth is fundamentally incompatible with sustainability. So if you agree with point three and four, you have to conclude that so long as capitalism exists, there is no hope for sustainability.
a large minority of environmentalists agree that economic growth is fundamentally incompatible with sustainability.
I would disagree. In fact, I’d say that some of the push for this idea has come from ultra-conservatives like the Heartland Institute, which hopes to discredit environmentalists.
Have you seen evidence for the idea that this is an idea held by a large minority of environmentalists?
Resilience.org
And, just under this post, there are at least a few
Certainly it’s fair to say that growth sustainability has yet to be proved unless you think we are already on a sustainability path
resilience.org
The article you provided starts with “To read the accounts in the mainstream media, one gets the impression that renewable energy is being rolled out quickly and is on its way to replacing fossil fuels without much ado, while generating new green jobs.”
That’s an explicit acknowledgement that the author is outside the mainstream.
it’s fair to say that growth sustainability has yet to be proved
I would strongly disagree. I would describe the idea that investing in renewable power and EVs would necessarily destroy economic growth as a fringe idea, outside the economic and environmental mainstream. It is an extraordinary idea, which needs extraordinary evidence.
For instance, I think it’s fair to say that Germany is both an engineering and environmental leader, and that the general consensus in German environmental circles is that a transition away from FF is compatible with economic growth.
Nick, I said “a large minority”
Yes, I understood. And…I’m disagreeing. I think it’s a small minority – a fringe.
The idea of a “large minority” suggests some degree of acceptance by the general environmental community. It suggests that this is a strong contender in the “marketplace of ideas”. As the author of the article you provided acknowledged: he’s out of the mainstream. He’s arguing to try to change that, but….his opinion is definitely outside the general consensus. It’s not generally considered a “strong contender”.
I’ve heard and/or read the so-called ‘mainstream media’ as the ‘legacy mainstream media’, the ‘old mainstream media’ and ‘a propaganda tool/arm of or for the corporation and/or state’.
So I’d be cautious about how people read into what they might say about, for example, so-called ‘renewable’ energy– including Germany’s pseudorenewable ventures.
Lastly, I’d also be cautious about, as well as be tempted to lend less weight to, comments from totally anonymous online sources, such as ‘Nick G’, as opposed to those from Minqi Li.
Nick G & the gish gallop. He thinks poor countries can up their GDP by getting the people to sing songs to one another lol
up their GDP by getting the people to sing
Nope. Not what I said.
See http://peakoilbarrel.com/world-energy-2018-2050-world-energy-annual-report-part-5/#comment-659462
and then
http://peakoilbarrel.com/world-energy-2018-2050-world-energy-annual-report-part-5/#comment-659214
Thirdly, according to the world system theory (and agreed by many others), the essential feature of capitalism is the pursuit of endless accumulation of capital.
Well not really–
The essence is:
“The capitalist mode of production proper, based on wage-labour and private ownership of the means of … who derive their income from the surplus product produced by the workers and appropriated freely by the capitalists.”
But agree– appropriate or die by the hands of those with greatest greed.
“Communism” is not an American word or idea. It comes from Europe. But it’s true that it’s gotten to be an empty word.
Communism is referred to in Marx’s writings. He explained they had to destroy society, blow it up in the air, eliminate religion, the family, and all social structures, implement a tyranny and use brute force to implement communism. It’s in the Communist Manifesto. Ever since then devoted and fanatic communists have engaged in violence, tyranny, abuses, genocide, torture, theft, looting, and war to achieve these objectives. And as they understand their ideology doesn’t work they turn towards fascism and apply ruthless capitalism. That’s what we see in China today.
I’ve stopped using the term “capitalism” because it elicits so damn many knee-jerk reactions. Of late, I always refer to “neoliberalism” and then if I feel like picking a fight, I’ll follow in parentheses (end-stage capitalism, that is). Neoliberalism is the end-stage of the global economic system, in which I include China as well, because it’s the period of total rent-seeking (completely unearned wealth) and what I like to call The Mother Of All Asset Bubbles (MOAAB).
All of U.S. energy policy since the Greatest Recession Ever, Dude began in Dec. 2007 has been fostering full-out flat-out shale production in order to squash the less-diversified energy-dependent economies such as Venezuela, Iran (where it hasn’t succeeded, yet) and even Russia (hasn’t succeeded). But it’s left the USA as the Hegemon of global energy at the present moment.
This should leave the USA in the position for loads more unearned wealth-accumulation at least until there is a bust in the fracked energy production. All this does is prolong the length of the end stage of the economic system, in my humble opinion. At some point we’ll have to reckon with the end of the end stage.
B.G.
Where is the oil focused post — even if one of those Open Thread things? I’m not seeing it.
Opec October Production
Dr. Minqi Li
Your analysis sums up how difficult it will be to get various countries to agree to cutting emissions by enough to keep global warming below disastrous levels.
You believe that if less developed countries are allowed to develop using fossil fuels, then 430 billion tonnes of CO2 will have to be stored.
However it is in many of these countries where deforestation is allowed and this should be added to any calculation.
https://psmag.com/environment/tropical-deforestation-leads-to-more-carbon-emissions
According to new studies carbon emission from deforestation is far higher than previously thought.
If continued to 2100AD this source will put another 300-400 billion tonnes of CO2 into the atmosphere.
Unfortunately there is another source of CO2 which is still poorly studied. The frozen tundras of Siberia and Canada are already starting to melt. This is allowing the previously frozen vegetation to rot, releasing even more CO2.
https://phys.org/news/2018-09-permafrost-co2-previously-thought.html
Globally we need to be carbon negative well before 2100AD.
A global wood tax to reduce consumption and replanting could be part of the solution.
https://www.theguardian.com/commentisfree/2018/feb/13/worlds-lost-forests-returning-trees
Emissions from deforestation are somewhat offset by existing carbon sinks.
According to James Hansen, emissions from deforestation are not that reliable. For the next century or so, cumulative emissions from fossil fuels burning are a sufficiently good predictor.
On the lighter side, maybe some of you will get a charge out of this.
https://www.geekwire.com/2018/one-year-chevrolet-bolt-ev-takeaways-immersion-electric-driving/
Not sure if this has been posted, but it’s summary of the future tipping points and was quoted a couple of times by the papers that criticised the conservatism in the IPCC warning paper.
CATALOGUE OF ABRUPT SHIFTS IN INTERGOVERNMENTAL PANEL ON CLIMATE CHANGE CLIMATE MODELS
http://www.pnas.org/content/pnas/112/43/E5777.full.pdf
Thank you Dr. Li for the series of articles.
All thought provoking.
Thank you for your many thoughtful comments under this post.
This article is so unrealistic that it’s hard to know where to start.
First, everyone wants their lives to get better (in other words, they want “growth”). To suggest that this has something to do with living under Capitalism vs other systems is just goofy. As it notes, China’s populace won’t put up with deliberate no-growth policies – no one would.
2nd, to suggest that an historic correlation between economic growth and CO2 emissions is meaningful is absurd: growth has been the primary thing, and CO2 has been the “dependent variable”. In other words, GDP growth has caused CO2 growth, not the other way around. Furthermore, that link is very, very weak: people simply haven’t prioritized CO2 reductions. In other words, they haven’t recognized the true costs of FF consumption, so they’ve simply used as much as was convenient. Because there were no obvious limits to FF consumption, it rose along with GDP.
The idea that rising FF consumption (or even flat FF consumption) is necessary for economic growth is old fashioned FF culture. In effect, in the current context, it’s propaganda: “drill, baby, drill”.
3rd, carbon sequestration is much more expensive than other approaches. Indeed, solar power is cheaper than *existing* Fossil Fuel plants in much of the world, and the gap is growing. In other words, it’s cheaper to build new solar than to continue to operate existing coal plants. That difference will only get bigger: fossils will get more expensive, and solar (and wind) will get cheaper.
4th, It’s likely that building solar will actually save money for developing countries. It will save out of pocket money, and including external costs like pollution will only make those savings larger.
5th, large amounts of FF infrastructure are obsolete. That is, they’re obsolete right now. From an accounting point of view, that means substantial losses from premature decommissioning, but…those loses have already happened. They’re sunk. They’re in the rear view window.
Right now we’re seeing a desperate fight by FF investors to prevent the world from *recognizing* those existing losses, which would accrue overwhelmingly to those FF investors, and not the world in general. Of course, they will try to socialize those losses: get recovery from governments, pass costs to consumers, etc.
In summary, the transition is here: the only question is the political fight over the timing, and who pays for the cost of those investors’ bad (i.e., criminally negligent) investment decisions.
Trump is primarily a symptom of that fight. There’s a reason that the Koch brothers have been corrupting our political system for decades. They’re protecting trillions in bad FF investments.
In refereed economics articles, it is not uncommon to have r-squares of 0.1 or 0.2. So I would not say r-square of 0.67 being weak.
So do not pretend the inconvenient truth does not exist
That’s not what I meant. Of course, an r-square of .67 is reasonably strong. What I meant was that the causal relationship is quite weak.
For instance, copper is known to investors (who need leading economic indicators to invest as effectively as possible) as the master commodity because of it’s correlation with the economy, but no one would suggest that copper *controls* the economy.
At the risk of stating the obvious; copper doesn’t feed engines and appliances, fertilize fields, heat homes etc etc etc Every ounce of copper that has ever been mined and put to use is still here somewhere on the planet, unless it went into space. The oil is gone pretty quick and it’s dispersed into energy and smaller bits of matter. So, long story short- your copper story sounds like bullshit. And, for instance, what’s what investors decide to call copper got to do with anything this article is talking about? Your on another planet dude.
Of course – copper doesn’t control the economy. That’s the point. But, there is still a very strong correlation between copper prices and GDP growth.
The point: correlation is not causation.
Now, you’re arguing for the idea that oil is essential to the economy. All I can say is that this was a modestly plausible idea 40 years ago, when some of these ideas were developed. Even then it wasn’t really convincing – Hubbert, for example, expected nuclear power to be the next big thing (and it would have worked, if necessary). But now….it’s just not sensible.
Nick G
One factory producing a million tonnes of steel, consuming 2 million tonnes of coal to do so.
Two factories producing a million tonnes of steel each, consuming 2 million tonnes of coal each.
I think it is quite clear that double the GDP causes double the CO2 emissions.
Since the whole world economy the centered on the production of steel, concrete, plastics, glass. The more of these things are made the more coal, gas and oil are used.
Until a way is found of storing large amounts of electricity then on demand power at night will be supplied by gas and coal.
https://www.researchgate.net/figure/Nigerias-electricity-generation-by-fuel-Source-US-Energy-Information-Administration_fig3_293329183
http://www.geni.org/globalenergy/library/energy-issues/south%20africa/index_chart.html
“I think it is quite clear that double the GDP causes double the CO2 emissions. ”
GDP of US increased by 4 times (400%) from 1971 to 2012 while the CO2 output increased by only 37%. Since 2012 the CO2 output has gone down while GDP went up.
GDP of OECD Europe increased by 237% in same time period while CO2 output stayed about the same.
China increased it’s GDP by 82 times while increasing it’s CO2 output by 10 times 1971 to 2012.
The link between GDP and CO2 output is tenuous at best. CO2 is dependent upon energy source and efficiency of the system. Some energy sources produce no CO2.
Gonefishing
The point being that for Heavy industry it has been the case that the more production the more energy is used.
This has to be viewed on a global basis as countries in Europe and the United States have simply moved their CO2 emissions to cheaper economies.
The fact is during the great recession oil consumption fell.
https://en.wikipedia.org/wiki/Great_Recession_in_the_United_States
https://www.statista.com/statistics/271823/daily-global-crude-oil-demand-since-2006/
Do you think oil consumption fell for some other reason? Do you think people who lost their jobs and no longer drove to work used more or less petrol.
Can’t use country level data. Has to be global.
The reason is quite obvious; energy intensive activities can be and often are exported to other locales.
Far and away the most robust economic chart I have is the one that plots global energy consumption in exojoules against global GDP in $trillions.
It’s a straight line for all practical purposes for the past 7 decades. The fit is 0.99.
As a minor point, a lot of the recent “GDP” in the US and Europe is simply pulled forward financialized activities. Remove the excess debt accumulation and – poof! – all that apparent, tasty economic growth disappears.
You want more economic growth? Then you burn more energy. That’s just what the data says.
Poof, energy is not CO2.
Poof, global CO2/GDP fell by 60% between 1990 and 2014.
You want more economic growth? Then you burn more energy. That’s just what the data says.
Chris, I thought your background was physics, no?!
So you of all people should know that we do not burn energy! We have been burning a lot of fossil fuels to produce energy, not exactly the same is it?
Blue Blob Bob has, to put it mildly, a bit of tunnel vision when it comes to understanding global warming within the context of also having cold days in Kansas. Quite a few also posses a similar myopia in failing to grasp global vs USA trends in energy consumption to GDP ratios. Although Bob doesn’t get overly pedantic and obtuse when you challenge him on his particular brand of hopium.
Thanks for the comment Chris. I’m very interested to see your global energy consumption in exojoules against global GDP in $trillions chart. Care to share?
Chris,
Using Global Carbon budget for carbon emissions (ignoring land use change as suggested by Dr Li) and World Nominal GDP. We find that a doubling of carbon emissions increased World GDP in current dollars (aka nominal GDP) by a factor of 8.
Yes the correlation is quite close from 1970 to 2015, though the slope over the 1960 to 1970 period was quite different.
Note this is carbon emissions rather than energy use, energy can be produced which emits no carbon and indeed the correlation between energy consumption and GDP is very good.
Note red dots are 1960-1970 data and blue are 1970 to 2015.
Click on chart for larger view.
> GDP of US increased by 4 times (400%)
You mean 300%.
4 X 100 percent = 400 percent
3 X100 percent = 300 percent
Maybe you would feel more comfortable if it stated “4 times (to 400%)”.
Alimbiquated,
300% sounds right, just as a doubling would be a 100% increase.
100 to 200 is 100/100=100% increase. Or 100/150=67% is sometimes used.
The reason for the point about causation is that for each of the products mentioned (steel, concrete, plastics, glass) there are alternative approaches that eliminate the emission of CO2: electrolytic production of steel, geopolymers for concrete, bioplastics for plastics, and electric heating for glass furnaces. We will need a lot more electrical generation capabilities. Wind and solar with canny use of transportation as the battery will handle the load.
Which goes back to the original point, doing a better job allows for a plus sum game and expansion without overshoot.
Jay Woods
It is a well known fact that we have become more efficient at using energy to produce things. However it is also a fact that demand has outpaced efficiency globally every decade for the last 250 years.
https://ourworldindata.org/fossil-fuels
Global coal, gas and oil consumption has increase by 1,000 times since the start of the industrial age.
If you think about how much energy you use. Food from around the world, flying, clothes made in almost every country. heating your house. You probably use 100 times more energy than a poor person working in a mine in 1900.
Hugo,
Jay was discussing CO2 emissions, not energy in general or energy efficiency.
Efficiency helps a great deal, of course. We could reduce energy consumption dramatically if only we made it a priority. And, it would pay for itself very quickly.
Jay,
When you mention electrolytic production of steel, it’s also good to mention that it’s only necessary for iron smelting. Secondary steel production (recycling) is accomplished with electric furnaces – that’s the great majority of steel production in the US, for instance.
Thanks for the great article Dr Minqi Li. I also quite like what I’ve seen of you in online/YouTube interviews/presentations etc.
I feel that economic contraction/decreasing FF availability/increasing FF cost/whatever, is going to result in increased deforestation/unregulated deforestation/timber poaching etc. Have you considered much about future trends in forestry? Have you ever seen one of those forestry museums in the Black Forest Germany?
Have you ever seen one of those forestry museums in the Black Forest Germany?
Heh! Funny you should mention that… I was just up there a couple days ago. I also visited a logging museum in Pforzheim where they featured the old timers floating log rafts down the rivers! Reminded me a lot of similar kinds of exploitation in the good old USA. The Germans at least seem to have learned a thing or two from their past. Also, unlike the Finns, they don’t rake the forest floor. ?
I have not studied deforestation.
James Hansen thinks data for emissions from land use change (such as deforestation) and carbon sinks from ocean and land sources are not so reliable. So it would be best to stay with the two sets of data that are most reliable: cumulative emissions from fossil fuels and atmospheric concentration. For temperature over the next century also, people generally think cumulative emissions from fossil fuels are a sufficiently good predictor.
“So do not pretend the inconvenient truth does not exist”
That is weak, you sell now correlations as causation. Of course we have seen an increased CO emission with increased economical growth, because energy was usually generated from FFs. However, there is no reason that REs could not provide the energy.
Minor issue: GDP growth can of course be generated by saving energy, esp. in developed economies which waste a lot of energy. Thermal refit of a house generates GDP and leads to 50% less annual fuel consumption….
Temperature this morning below freezing took a hot shower courtesy of passive solar using evacuated vacuum tubes and super insulated hot water storage tank… cold and sunny and windy today, great for PV and wind generation.
Cheers!
Temperature here at 16F. Crispy. Where is Blue Blob Bob?
The actual Blue Blob is over Maine right now. February in November.
Which is why NOAA is releasing a climate report on Thanksgiving Hangover day. The dual hope that it will be ignored or scoffed at by the populous, cold part of the USA.
NAOM
Indeed, the cold this morning kicked off the coldest Thanksgiving in well over 100 years. Even POTUS noticed and issued a statement about the incredible cold spell we are experiencing.
The POTUS is a total fucking moron!
Lets not put down morons— comparing them to the POTUS is a bit low.
He has no concept of the meaning of the word ‘Global’.
NAOM
I’m so glad to be fluent in a few languages other than American English. at least I can escape being considered a total moron, if only for a while.
I think Trump’s just having fun with the irony of how it’s called global warming but in fact part of the globe isn’t warm at all and actually having record breaking cold temps.
Actually it is more correctly referred to as Climate Change and Trump is a fucking idiot!
No, disrespect to any idiots…
I always remember it called global warming before becoming climate change. They are mostly one and the same thing.
@Charles
No, they are not the same thing though they are interconnected.
Global warming is the rise in the average temperature over the whole of the globe
which causes
Climate change is the effect on conditions in different places at different times and may be hotter/colder, wetter/dryer etc
which is called
Weather which is the local variability in a given area
Hence we are exceptionally warm down here while it is brass monkey weather in NE USA.
NAOM
NAOM, I like to use the term global warming because, it seems to attract the trolls, trolling the trolls you might say! I think they have spiders, (software) crawling the web looking for the terms “climate change” and “global warming”. They might have some sort of algorithm that then sorts the results for relevance.
I am intrigued by how they just pop up here, out of nowhere and then mysteriously disappear back into the ether, sometimes never to be heard from again! They certainly are not interested in any of the other wide range of topics we discuss around here, only weighing in on climate and CO2 related discussions. It kinda makes their agenda obvious!
Just because some people come and go doesn’t make all of them trolls I don’t think. I still read here several times a week but hardly post about anything anymore because many of the frequent posters are pretty arrogant with know it all attitudes who bully those who don’t see things exactly like they do.
I’m pretty sure Trump and fun/irony are mutually exclusive entities.
I’ve never seen the man emit a genuine laugh. I’ve a feeling irony is just way over his head.
Alex. Only a stupid person would quote Trump, other than to point out his lack of honesty and dignity.
So try to have just one dollar of GDP with zero energy
That’s easy.
Replace one delivery vehicle that use .1 gallons per mile with two vehicles which use .05 gallons per mile. Double your deliveries, with no additional fuel consumption.
Of course, that’s a distraction. A diversion. A “red herring”. No one is arguing that energy isn’t important to economic activity. No, the issue at hand is CO2, not energy.
The Original Post argued that the world economy would suffer if CO2 emissions were reduced. That’s unrealistic.
It’s also an argument that makes the Koch brothers very happy. And, a large part of the “push” behind that argument is coming from Koch puppets like the Heartland Institute.
Nick, in your example, after your innovation, you are still using 0.1 gallon in order to have a real GDP that is equivalent of 2 mile of travelling. Your energy consumption is obviously not zero.
Please note that my question is can you have just one dollar of GDP with zero energy input, not about how you can have “one extra dollar” of GDP
Again, that’s easy: you can give an in-person lecture (or sing a song, or deliver original, extemporaneous poetry) to a group sitting in a meadow. No extrasomatic energy needed at all.
Still, could you explain your point? I agree that a fair amount of extrasomatic energy is needed by a modern economy, but the Original Post was about GDP correlating with CO2, not energy in general.
So try to have just one dollar of GDP with zero energy ~ ML
.. that’s easy: you can give an in-person lecture (or sing a song, or deliver original, extemporaneous poetry) to a group sitting in a meadow. No extrasomatic energy needed at all. ~ Nick
Me ~ LMFAO/speechless.
All he asked for was “just one dollar”.
And, of course, it’s not important. I answered it to suggest that we need to be a bit more imaginative about energy, but…what is important is that low-carbon energy is lost cost, clean, scalable, etc.
Minqi,
Clearly we would have zero GDP with zero energy input. Though a world with zero energy input would be devoid of life, so there would be nobody to pose the question. 🙂
Well, what’s the definition of “energy”? Is it just “extrasomatic” energy, in other words energy produced by humans by burning something or otherwise producing energy?
If you include all energy, then solar power provides most of our energy. First, it produces most of our space heating: without the sun, the average temperature outside our house would be in the neighborhood of minus 400 degrees. 2nd, it produces most of our lighting: without the sun it would be pitch black outside, and our windows and skylights would be worthless. And that’s only the direct solar inputs. Indirect inputs include light for growing food, light for producing fossil fuels, hydropower, wind power, etc.
I’m perfectly willing to use the narrow, conventional definition of energy. It’s not really realistic. The realistic view is that we’re swimming in a vast current of solar energy. Fossil fuels amount to only about one month of solar input, and most of the energy we use and experience is solar. But, the narrow conventional definition is far more familiar to most people. It’s the one used in the Original Post. But this most recent question about producing GDP without energy seems to use the broader definition, which includes all energy.
So…what do we include as “energy”??
Nick,
Minqi thinks in terms of primary energy as reported by BP. This would include fossil fuels, nuclear, hydro, wind, solar, biofuels, and geothermal energy.
So it would be difficult except in deep space to imagine a zero energy input situation.
This is a little like “imagine no possessions, I wonder if you can” 🙂
Try dividing by zero in any context, if you like doing stupid stuff.
If you’re having problems with this assignment, go back to primary school and pay attention in math class this time around.
This is perhaps interesting to some here-
“loss of one species can make more species disappear (a process known as ‘co-extinction’), and possibly bring entire systems to an unexpected, sudden regime shift, or even total collapse.”
Co-extinctions annihilate planetary life during extreme environmental change
https://www.nature.com/articles/s41598-018-35068-1
Species disappear (a process known as ‘co-extinction’), and possibly bring entire systems to an unexpected, sudden regime shift, or even total collapse.”
The fact that this is not common knowledge already and even needs to be stated at all, is the main reason 99.9% of all ecologists are depressed these days!
Hasn’t everyone read Fuller’s Geometry of Thinking about synergies, and E. O. Wilson’s Half Earth?! Or is everyone just in deep denial of reality?!
No need to reply, that’s merely a rhetorical question.
And to underscore my point, for the thousandth time, all economies are subsidiaries of Ecosystems Inc.
Hmm, maybe people just don’t get how synergetic systems work.
Cheers!
For a bit of the lighter side of life
https://theoatmeal.com/comics/insight
NAOM
That’s great!
The World Energy Annual Report documents the absolute schism in thinking between petroleum-economics scientists and the climate scientists.
A new benchmark for “climate urgency” came out recently with the “Trajectories of the Earth System in the Anthropocene” (or “hothouse earth”) paper on PNAS.
http://www.pnas.org/content/115/33/8252
Absolutely no one in government (USA), at any level of govt., is paying *any* attention to that study.
No one in the World of Corporate is paying any attention, either.
Some wacky youths over in the UK calling themselves “Extinction Rebellion” seem to be paying attention. Their movement will soon perish from loss of public attention…
Cheers !
B.G.
There’s a new NOAA summary report due tomorrow which will be more USA based, though most people might be too busy queuing up for big screen TV bargains to notice. Maybe once enough devastating reports and devastating US climate events happen people will wake-up. There was a report that indicated the US government accepts 3 to 4°C is inevitable, they just wont say it is human caused.
I beg to differ. Actually corporations and cities the world over are indeed paying attention. Though I certainly agree that certain nation states such as the US are not, with their behaviour bordering on the criminally negligent, I actually see the extinction rebellion gaining steam and becoming a powerful global movement.
Time to take governments to court!
Cheers!
An interesting approach
https://www.theguardian.com/world/2018/nov/22/bamboo-house-easy-to-build-sustainable-cubo-wins-top-prize
NAOM
Google Simon Velez, have followed his work for a couple decades…
Thanks for that, interesting. What I liked about the Bamboo house is that Bamboo puts out more oxygen than trees and, as a fast growing plant, can supply large amounts of raw material while pulling carbon out of the atmosphere. What I don’t like about Bamboo is that it is susceptible to boring insects. It also gives a nice ‘look and feel’ to constructions as seen in Velez’s work. I hate seeing it sold as kitchen implements that are marked up in price because they are ‘ecological’.
NAOM
If interested, there is copious scientific information on how to treat bamboo so that it does not succumb to boring insects. Only interesting ones…?
BTW, no toxic pesticides required either!
Cheers!
Global carbon dioxide levels hit a new record in 2017, U.N. says
GENEVA (Reuters) – The amount of carbon dioxide in the atmosphere hit a new record of 405.5 parts per million in 2017, up from 403.3 ppm in 2016, with no sign of reversal in the trend, the World Meteorological Organization said in its annual Greenhouse Gas Bulletin.
“The science is clear. Without rapid cuts in CO2 and other greenhouse gases, climate change will have increasingly destructive and irreversible impacts on life on Earth. The window of opportunity for action is almost closed,” WMO Secretary-General Petteri Taalas said in a statement.
The WMO said the rate of increase was in line with the average growth rate over the last decade.
Not available at the WMO site yet though
Well if the UN is telling us to do something, you can best be sure we will do the opposite. Happy Thanksgiving.
I guess the concept of being part of ‘The United Nations’ escapes a rather large number of stupid Americans. Though fortunately that large number is still a relative minority of the population overall!!
No, the issue here is the matter of sovereignty. ‘The United Nations’ is not a sovereign entity and therefore has no authority, legally or morally, to tell other countries how to manage their affairs and business.
You really need to get out in the world a bit more.
Happy Thanksgiving to you to Adam and blessings of bounty to you and your family.
“There’s nothing viscerally tragic about living a middle class life in first world countries.
The tragedy is a slow unwinding of lost potential happiness where we are subjugated to menial jobs serving employers whom we can never escape – entrapped and coerced into an unwanted life. The American dream has always been a dream for the nothing, but the nothing is getting worse, and has been refashioned into a dream of finally not worrying about food, housing, and retirement security which is dangled cruelly in front of us in an unending cavalcade of predatory advertising.”
When one mixes BS with some reality the result is mind stew.
Your last gasp denialism sounds like a recalcitrant child screaming “you’re not the boss of me” after being refused a third helping of cake at somebody else’s birthday party.
https://www.thewesternstar.com/news/local/muskrat-falls-inquiry-hearings-start-in-labrador-241773/
One of the big recent hydroelectric projects was Muskrat Falls (Lower Churchill) in Labrador. It has gone over $6 billion (CAD) overbudget and two years late. There’s an inquiry going on now to ask why it was built and whether the overruns could have been foreseen (there’s some indication of political pressure to mask environmental and economic issues so it could be pushed through). For Newfoundland the existing power generation is from diesel, 18000 bpd I think; I’ve so far seen not a single mention on GHGs. The local paper, The Telegram, has frequent reports.
There are some people who think Labrador will do just fine with solar, even in the winter.
My gal likes warm water to bath.
https://m.phys.org/news/2018-11-greenhouse-gas-atmosphere-high.html
With regards to all the smart people deciding to soon do the right thing… I highly doubt it.
1891 — Dr. Edward L. Bernays, lives, Wien, the “father of public relations” credited with getting women to smoke & helping United Fruit overthrow Guatemalan President Arbenz; A lovely piece of humanity: “with Bernays there is no consistency, no character, no integrity, no conscience, no bravery, no truth.” A nephew of Sigmund Freud (his sister Anna’s son).
Would be perfect for the current ‘Potemkin village’ .
https://cleantechnica.com/2018/11/22/peak-oil-drastic-oil-shortages-imminent-says-iea/
LOL!
Peak Oil & Drastic Oil Shortages Imminent, Says IEA
LOL!
Sorry Fred, but that joke just went right over my head. Why am I not laughing?
Twas a sarcastic laugh at the expense of the IEA…
That discovery chart shows the problem well, I hadn’t seen it before. The big blip in deep water discoveries in the 2000s from improved technologies and higher prices contributed greatly to the subsequent glut and price collapse – and now what’s left? There hasn’t been much of an uptick in exploration despite the price rally, offshore drillers continue to go bust, leasing activity still fairly slow – the tranches get bigger as the last, less attractive bits are released but lease ratio falls, Permian dominates all news stories. Why would the recent decline curve turn around? And the biggest surprise might be that gas is just as bad as oil, so the recent boost in supplies from condensate and NGL might also have run its course.
So we need to bring on approx 40 million barrels a day by 2025 to stay flat?
Should be an interesting 7 years!
I tracked FIDs for oil through 2017, I’ve been a bit less diligent this year so may have missed some, but for greenfield conventional plus oil sands I have for the remainder of 2018 through 2025: 400, 1770, 1170, 800, 985, 70, 250, 400 kbpd added – about 6 mmbpd total, nothing after 2025, plus another 1 mmbpd from ramp ups from this year. Only pretty small projects could get done now before 2022, and there aren’t many of those left. Anything else would need to come from brownfield (in-fill), LTO or new discoveries (including existing known resources that become reserves once a development decision is made).
Thanks for that info GK
GDP and Energy consumption
The link between GDP and energy consumption is very clearly shown in the graph.
https://ourfiniteworld.com/2012/10/25/an-economic-theory-of-limited-oil-supply/comment-page-2/
High economic growth matched high growth in energy consumption and recessions saw fall in energy consumption.
Since 90% of the energy consumed comes from burning the stored energy in coal, oil, gas and wood. It is hardly surprising that during high economic growth CO2 emissions increase also.
Those who not not wish to see this link, obviously think Peak Oil is not a problem. GDP growth will continue even though oil becomes more scarce.
If oil production falls by just 1% per year, taking into account new vehicle production. The world would have to produce 90 million electric cars each year in order to prevent oil prices from destroying other users such as the aviation industry.
This year 1.5 million fully electric cars were made and according to several people here peak oil is no more then 4 years away.
Since 90% of the energy consumed comes from burning the stored energy in coal, oil, gas and wood. It is hardly surprising that during high economic growth CO2 emissions increase also
I have a hunch that we are about to see some major changes to that paradigm.
Fred
I hope you are correct, but I have done some calculations on what is needed.
According to reports around $1.7 trillion was invested in energy supply in 2017. $790 billion on oil, gas and coal supply. $320 billion was spent on solar and wind.
During 2017 oil consumption increased by 1 million barrels per day. Gas consumption increased by 3% and even coal consumption went up.
The world needs to spend about $2.5 trillion per year on wind, solar and batteries in order to meet increased energy demand and reduce fossil fuel burning by about 1% per year. This obviously depends on GDP growth being about average.
Since recent scientific observations have discovered that Greenland, the Arctic and Antarctica melting much faster than anyone thought. The shift needs to be a minimum of 2.5%. Thus a spending of around £4 trillion per year is needed.
I do not see any country spending a minimum of 12 times more on solar and wind in the next 3-5 years. It would take every country doing so.
Agreed Hugo. The world is only making token moves towards installation of the necessary wind and solar.
This coming decade will see everyone scrambling to get the equipment built and installed.
Looks like centralized planning (China) is going to beat ‘the market’ on being the primary supplier. Our ‘free’ market has tariffs on PV imported. Brilliant.
Does having a 5 (or 10 yr) plan make you communist?
Or just smart.
“The world needs to spend about $2.5 trillion per year on wind, solar and batteries in order to meet increased energy demand and reduce fossil fuel burning by about 1% per year. This obviously depends on GDP growth being about average.”
1% per year? You have got to be kidding.
The global oil consumption for transport is about 39.5 million barrels of oil per day. Using PV to drive EV transport would mean an investment of 2.2 trillion dollars in PV to provide global road transport energy.
So what do we use next year’s money for?
.
“The global oil consumption for transport is about 39.5 million barrels of oil per day”
39.5 million is only gasoline in the world. Add diesel and jet fuel and you get to about 75 million barrels a day for transportation or about 75% of oil produced.
I was specifically talking about road transport.
Argue with these guys.
https://www.statista.com/statistics/307198/forecast-of-oil-consumption-in-road-transportation/
Did you get the point? That Hugo overstated the cost of renewables to replace fossil fuels by a huge amount and understated their effect by another huge amount.
We have a couple of people that consistently do that on this site.
You may have just been talking about transport energy, but the others of us were having some back and forth about fossil fuel replacement in general.
Well, Tesla production is rising, Giga Factory 3 is starting construction, Chevy Bolt, Hyundai Kona (hey, I thought that was coffee!), a new start-up from the former McClaren people is about to go into production, Audi is launching an eSUV and Volkswagon are going electric. These are just ones I’ve seen over the last few days, I expect production is ramping up all over. We have a Hyundai hybrid delivery tuck operating here, even seen some electric bicycles in the local supermarket. Maybe there is some hope.
NAOM
Global Carbon Emissions versus Global GDP
Carbon emissions (CO2) in million metric tons carbon
Carbon emissions are fairly linear, while GDP growth is mostly exponential.
Carbon emissions rose by 3.43 times from 1960 to 2014 while GDP rose by 21 times.
There is little connection between GDP growth and carbon emissions other than both got larger (but at vastly different rates).
GDP from World Bank https://data.worldbank.org/indicator/NY.GDP.MKTP.CD
The carbon emission data from:
Global CO2 Emissions from Fossil-Fuel Burning, ***
*** Cement Manufacture, and Gas Flaring: 1751-2014 ***
*** ***
*** March 3, 2017 ***
*** ***
*** Source: Tom Boden ***
*** Bob Andres ***
*** Carbon Dioxide Information Analysis Center ***
*** Oak Ridge National Laboratory ***
*** Oak Ridge, Tennessee 37831-6290 ***
*** USA ***
*** ***
*** Gregg Marland ***
*** Research Institute for Environment, Energy ***
*** and Economics ***
*** Appalachian State University ***
*** Boone, North Carolina 28608-2131 ***
*** USA
A bit of energy history
Energy Conservation in the Home in the 1920s
https://www.youtube.com/watch?v=BBfMeFZYUH0
“and conserve coal for future generations”
Nearly 100 years and this has been forgotten.
NAOM
Casting an uncalibrated eyeball at that, it would appear that GDP has roughly tracked emissions up to the 90s then outpaced them. Would be interesting to see the same data plotted as GDP v emissions in one line.
NAOM
Gone fishing says..There is little connection between GDP growth and carbon emissions other than both got larger (but at vastly different rates)..
SO the connection is, as GDP grew carbon emissions grew.
There is also another connection in 2008 going into 2009 when GDP fell CO2 emissions fell.
The link is even clearer here
https://ourfiniteworld.com/2012/10/25/an-economic-theory-of-limited-oil-supply/comment-page-2/
But they do say you can take a donkey to water but you can’t make it drink
I tried but the ass did not drink.
We should just make more money by flipping houses. That doesn’t use any CO2.
sarc/
In addition to the Chevy Bolt, and the Tesla 3, there will be a new small EV on the market shortly that will be a strong seller, IMHO-
Hyundai Kona
https://www.forbes.com/sites/doronlevin/2018/10/11/hyundais-kona-ev-tops-in-range-with-258-miles-among-reasonably-affordable-evs/#34cfba442078
Looks very good.
This article says that Tesla has a 20% price advantage on other car manufactures on battery cost.
If true, and if Tesla manages itself well, that is a very big advantage that can make all the difference on profitability and long run viability.
https://cleantechnica.com/2018/11/21/tesla-has-20-battery-cost-advantage-on-competition-says-ubs-analyst/
https://thebaffler.com/
When it comes to the far right, ridiculous and dangerous aren’t mutually exclusive
(Scary Clowns)
Ratio of global GDP to global carbon emissions, with graph normalized to 1960 equals one.
Notice that we produce 15 times the amount of GDP per carbon emission as in 1960. GDP is not directly dependent upon CO2 emissions as Hugo stated. “I think it is quite clear that double the GDP causes double the CO2 emissions. ” . If that were so the GDP and CO2 would have the same slope. They don’t and GDP is exponential versus CO2 being fairly linear.
Interesting, plateau, rise, plateau, rise, plateau, rise.
If you have the numbers I would love to see a plot with CO2 on one axis against GDP on the other, not sure which way round will be more interesting.
NAOM
Just scroll up a couple of pages! Surely you saw it. You replied to it.
http://peakoilbarrel.com/world-energy-2018-2050-world-energy-annual-report-part-5/#comment-659044
notanoilman,
See chart below. Red dots 1960-1970 and blue dots 1970 to 2015.
A doubling of carbon emissions from 5 to 10 Pg C resulted in an increase in World GDP of 7.5 times (from 10,000 B$ to 75,000 B$). Note the different slope from 1960 to 1970, perhaps we will see the slope change again in 2025 to 2030 when peak fossil fuels causes fossil fuel prices to rise significantly and speeds the transition to wind, solar, EVs, light rail, and electrified trains. As well as nuclear and wind powered ships, and perhaps electric/biofuel hybrid air travel (though there may be better technologies, I am not up on the subject.) A quick search suggests liquid hydrogen might be one solution, excess wind and solar in a system that is built out to 3 times average load to reduce intermittency would have excess capacity that might be utilized to produce and store hydrogen in liquid form for use in aircraft.
Thanks Dennis, that is what I was after. I wonder why the change around 1970, computers?
On a totally separate note, does anyone know if Liquid Ammonia, rather than hydrogen, would be suitable as an aviation fuel? Liquid hydrogen takes up a LOT of volume and needs considerable insulation.
NAOM
Gonefishing
I used the very simplistic example of one and two steel factories to help you understand.
Obviously global GDP to CO2 is linked to the proportion of heavy and light, service industries.
However, when GDP against CO2 is studied in a variety of countries the correlation between the two is undeniable.
http://www.diva-portal.org/smash/get/diva2:1076315/FULLTEXT01.pdf
https://www.sciencedirect.com/science/article/abs/pii/004727279401449X
https://www.sciencedirect.com/science/article/pii/S0301421509005527
http://www.pnas.org/content/94/1/175.short
Obviously as more GDP is created by light industry the GDP/CO2 correlation diverges.
However because 2/3 billion people are getting richer and in the process of buying their first car, washing machine, buying their first steel and concrete house etc. They will feed the demand for high energy activity, such as mining iron ore, copper, production of cement, etc.
Just read the studies and educated yourself.
News just in on GDP- Government Accounting Office reveals that for the past 10 yrs they have included number of
‘mouse clicks, cell phone selfies, and financial transactions initiated by computer’
as contributing to the nations GDP, accounting now for 17% of the total value.
This explains much of the leveling of CO2/unit of GDP.
The official name for these are called “intellectual property right”
Yes.
My comment was a somewhat sarcastic observation that GDP is a very imperfect measure of economic activity, and it is therefore no surprise that ratios of GDP/energy consumption or GDP/CO2 emissions are imperfect indicators of the trend of reality.
And yet you hit on a reality, as Minqi suggested: “services”, including computer related stuff, are far less energy intensive than “goods”.
Goods have leveled off in OECD countries – it’s services that are growing.
This explains much of the leveling of CO2/unit of GDP – Hickory
Maybe it’s more people singing songs, as Nick has suggested is an emissions free way of generating GDP.
He is desperate to tell a rosy story.
I understand that. Just not my style of thinking.
Nah. Just being realistic: it is possible to reduce CO2 emissions, and it would be better for pretty much everyone, except for those heavily invested in fossil infrastructure.
Will we do it as fast as we should? Probably not, but…it’s a choice. We can do it, we should do it, and those who say otherwise are misinforming us.
Pollyanna. It’s laughable. Probably some kid in Silicon Valley.
You’ve said a lot of generalities, and now you’re resorting to attacking the person rather than the arguments.
I don’t know why you waste your energy on it. If you disagree, but you don’t have the time to actually say something meaningful, why waste our time as well?
You didn’t read my reply…
Yes I did. I posted the above before you had made your reply.
GoneFishing,
There is an error. The initial world GDP graph is probably in historical $ of the time.
1$ ( 1960 ) = 8.27$ ( 2017 ). See:
https://www.bls.gov/data/inflation_calculator.htm
In your reference:
https://data.worldbank.org/indicator/NY.GDP.MKTP.CD
US GDP rose from 543B$ to 19390B$ , 35.7 times nominally, but only 4.32 times (= 35.7/8.27) in real terms. It was about one third of world GDP in 1960 and about one quarter in 2017.
By the same terms, world GDP rose from 1366B$ to 80684B$ , a 59 fold nominal (US $) increase , but only a 7.1 fold real increase. It represents still a strong growth rate of 3.5% per year on average.
By this account, the CO2 eficiency of world GDP increased about twice from 1960 to 2017
Inflation, like money, is a slippery slope and a human agreement that changes with time. Because the inflation rates were so high and variable in the late 70’s and 80’s, the way the US government measured inflation changed dramatically. The variance dropped out at that point and any accuracy did also.
Using the major necessities of life in the US, I get about 5.3% average inflation rate from 1950 to now. Or you can use the numbers from the experts (expert manipulators).
Average house cost in 1950 was about $7000, average house sale in 2017 was $400,000 dollars. Average car sold for about $1600 now they it is over $35,000.
Taxes have risen too, along with the addition of a lot of sales taxes, more energy taxes and others. The cost of marketing and advertising has increased also (operational inefficiency).
A lot of additional add-ons (TV, cell phones, internet, computers, more gadgets and glitz in cars, houses and business) for the developed world are now considered standard and even necessary. thus increasing the cost of everything, along with increased use of electric.
When considering global inflation first one must normalize the various countries using PPP standards.
I think if one wants to manipulate the data using factors such as PPP and real inflation that the CO2 number will come out about 1:1 in dollars per CO2 produced. Even with efficiency increases, societal changes and the constant fight against limits of growth eats away at any real gains against the dollar ( an agreed upon medium of exchange). Human agreements and physical reality are often differ greatly. But using unmanipulated data (real dollars) is probably best since it doesn’t worry about standard of living (physics and nature don’t care about those or include those). in that case we produce a lot more dollars (versus “dollars”) for every ton of CO2 produced.
But what it all comes down to is that we are still producing a lot of CO2 and methane. Not good for any species on the planet (in general).
What is becoming evident in the last decade is the relationship between useful energy produced and CO2 produced is changing as more efficiency, natural gas and renewables come on line. In modern times the biggest product of humanity is wasted energy and various physical waste streams (now you know the purpose of humans). Useful energy and products are more of a side effect. We need to reverse that quickly, it’s stupid and harmful.
Oil price was 2.97$/bl in 1960
https://www.macrotrends.net/1369/crude-oil-price-history-chart
and was this year above 50$/bl
Inflation adjusted, oil price was about 25$/bl ( in today $ ). ( The same web address, “Inflation-Adjusted” button may be clicked on/off ).
Average house cost in 1950 was about $7000, average house sale in 2017 was $400,000 dollars. Average car sold for about $1600 now they it is over $35,000.
Hmmm. A quick look at housing price series finds varying information. A median current home price appears to be $200k, and I think the $7k figure may be a median – averages may be misleading.
https://www.cnbc.com/2017/06/29/what-the-median-home-price-of-200000-will-get-you-across-the-us.html
You might want to compare those products side by side: the average house has gotten much larger and acquired things like…insulation.
“One driver of home prices is size. In 1950, the average home size was less than 1,000 square feet with two bedrooms and one bath, according to the NAR. By the early 1970s, the average home had increased to 1,500 square feet.
Today, the median new home size is nearly 2,500 square feet, with most homes featuring at least four bedrooms and three or more baths, the Census Bureau reports. ”
https://www.daveramsey.com/blog/housing-trends
More importantly, the land under it has risen in price faster than the improvements, due the dynamics of urban pricing (where most people live – even Waco TX now has suburbs…).
The average 1950 car, if it could be sold now, would probably sell for about $5k (kind’ve like the Yugo): extremely slow, manual transmission, very low fuel efficiency, unsafe at any speed, very high maintenance costs, etc., etc.
Ok, you agree that people pay a lot more for things now. Good.
Gonefishing,
Nice chart. Is GDP “real GDP” or nominal? You are correct double the GDP does not mean double the emissions. Also a peak in emissions (2025 to 2030) will likely result in a future chart of GDP/CO2 vs time that peaks and declines.
Not what I meant, it was that graph that drew my eye. Rather than the two lines plotted against year, the two datasets plotted against each other as an XY graph ignoring year. Should show up changes in the ratio between the two.
NAOM
BTW I think the troll storm is triggered by the NOAA report and expect to see more coming in. Try to address and educate the third party reader so they are not misinformed by the troll. Fighting trolls and wrestling pigs have much in common.
Urgh! That was supposed to be a reply to Islanboy’s response to my comment above, don’t know why it ended up here.
NAOM
https://nca2018.globalchange.gov/chapter/front-matter-about/
Fourth National Climate Assessment from NOAA, it’s pretty heavy going.
https://earther.gizmodo.com/colorful-maps-show-how-weve-transformed-earths-surface-1830569936
Interesting maps showing change of land use over the last quarter century – just the amount of change either way is the most striking thing but the loss of tropical forests and gain in northern ones also jumps out as well as loss of agricultural land at the edge of deserts and urbanisation in China.
Most of forest gain in the world is places where there is some degree of recovery on ‘marginal’ lands that have been previously stripped of their native vegetation.
By marginal I mean relatively poor for farming, or intensive/repetitive logging. Even grazing ain’t great.
Too dry, rocky, cold, swampy, windswept. Thin soil, salty soil, eroded soil.
An example is the eastern forests of the USA on hilly lands. For a couple hundred yrs immigrants from Europe worked that land hard. Was diificult to even get shoes on the kids from the proceeds on land that is hard to grow corn on. Much of it has gone back to forest.
7.7 Billion people don’t retreat from productive lands.
These areas of forest regrowth will be cut for fuel if we don’t get cracking on massive renewable energy deployment and brisk population downsizing.
Excellent points Hickory. Around here most of the flat lands are taken up by “agriculture”, chemically enhanced of course and development. The hills and mountains are left to the trees. I live in the hills right near the mountains so enjoy a high degree of “natural” area.
Paris Burning over Fuel Taxes? Just wait till Fuel prices Normalize! “They are opposed to taxes Macron introduced last year on diesel and petrol which are designed to encourage people to shift to more environmentally friendly transport. Alongside the tax, the government has offered incentives to buy green or electric vehicles.”
http://news.trust.org/item/20181124101720-ghrrs
https://www.thesun.co.uk/news/7817676/police-bombarded-with-fireworks-fight-back-with-tear-gas-as-mass-riots-turn-paris-into-warzone/
Well, it is still not 1968———
Federal Climate Report Predicts At Least 3 Degrees Of Warming By 2100
The United States already warmed on average 1.8 degrees Fahrenheit over the past century and will warm at least 3 more degrees by 2100 unless fossil fuel use is dramatically curtailed, scientists from more than a dozen federal agencies concluded in their latest in-depth assessment.
Last year was the United States’ second-hottest in history, and the costliest in terms of climate-related disasters, with a record $306 billion in damages. Sixteen of the last 17 years have been the warmest on record globally.
October, the Intergovernmental Panel on Climate Change, the leading United Nations consortium of researchers studying human-caused climate change, issued a report warning world governments must cut global emissions in half over the next 12 years to avoid warming of 2.3 degrees Fahrenheit, beyond which climate change is forecast to cause a cataclysmic $54 trillion in damages.
https://www.huffingtonpost.com/entry/trump-climate-assessment_us_5bf5b31fe4b0771fb6b57ccb
The climate has always been changing, however the rate of change has been different and is a major difference at this time.
Three other major differences: the global average change is all in one direction, it’s accelerating and its ultimate cause is human generated emissions rather than cyclic variations in ‘heavenly bodies’.
I never said it was heavenly bodies or God did it. Don’t put words in my mouth.
It wasn’t God, it was Jesus.
“Christianity is the belief that a cosmic Jewish Zombie who was his own father can make you live forever if you symbolically eat his flesh and telepathically tell him you accept him as your master, so he can remove an evil force from your soul that is present in humanity because a rib-woman was convinced by a talking snake to eat from a magical tree.”
I hope that clarifies things.
Humans are basically illogical so applying logic to the unprovable is a human activity.
“symbolically eat his flesh”
Wrong.
Catholics ACTUALLY eat his flesh and the priest actually drinks his blood, so they believe.
This religion has endured in the most educated part of the world for over 1,000 years.
https://en.m.wikipedia.org/wiki/Transubstantiation
Then they have this thing against cannibals.
NAOM
You are right!
I stand corrected—
Those cannibals wolf him down!
Jesus is my favourite Jew
Paul is a close second
Paul didn’t understand most of what he was seeing. Thus the poor result (a franchise Jesus would despise). IMHO
Paul made the most significant contribution to the growth of the Christian religion.
He made it no longer necessary to join the church that adult males be circumcised.
All else being equal that’s a powerful incentive to go somewhere else to pray.
Heavenly bodies does not necessarily have anything to do with god! It simply means bodies in the heavens (also known as the sky) such as the moon or the planets. One of which happens to be earth. If you think about it a bit more you might actually figure out what George was saying…
Cheers!
Heavenly has two sets of definitions, an obvious move by the secular groups to submerge words with religious definitions.
Or it could be the old religions (pagans) getting some retribution for the Christians stealing their holy days.
Yet the religious zealot right wing wants to toss the Constitution and make the US a Christian nation. The Crusades never end.
As we witness yet again the brutal and bloody consequences of religious intolerance in the form of ISIS, we have a majority of Republicans pining for a Christian America. Proponents of converting the United States into a theocracy do not see the terrible parallel between religious excess in the Middle East and here at home, but they would not because blindness to reason is the inevitable consequence of religious zealotry.
Conservatives who so proudly tout their fealty to the Constitution want to trash our founding document by violating the First Amendment in hopes of establishing Christianity as the nation’s religion. This is precisely what the Constitution prohibits:
https://www.huffingtonpost.com/jeff-schweitzer/founding-fathers-we-are-n_b_6761840.html
I just meant the sun and earth, and I guess Jupiter. It’s just a phrase people use, they aren’t really in heaven, that’s why I used quotation marks. So I’m happy not to put words in your mouth, maybe in return you could stop insulting our intelligence by not posting any more vapid, it’s-oh-so-important-to-get-things-exactly-right, denier bullshit.
With the developed nations reducing their carbon footprints or at least slowing their growth, it looks like the only way to stop CO2 output at a high rate will be to get the developing nations to build out renewable energy and EVs along with efficiency instead of fossil fuels since they are the powerhouses of growth and development for the next few decades.
This gives an idea of what the future plans are for much of the world. Not only growth but megaprojects.
https://www.youtube.com/watch?v=CiQ874ZuIno&t=1452s
A depressing article on the expanded use of coal.
The World Needs to Quit Coal. Why Is It So Hard?
https://www.nytimes.com/2018/11/24/climate/coal-global-warming.html
It is a good article on coal. Answering your question, they say-
“So, why is coal so hard to quit?
Because coal is a powerful incumbent. It’s there by the millions of tons under the ground. Powerful companies, backed by powerful governments, often in the form of subsidies, are in a rush to grow their markets before it is too late. Banks still profit from it. Big national electricity grids were designed for it. Coal plants can be a surefire way for politicians to deliver cheap electricity — and retain their own power. In some countries, it has been a glistening source of graft.”
““The main reason why coal sticks around is, we built it already,” said Rohit Chandra, who earned a doctoral degree in energy policy at Harvard, specializing in coal in India. “
Victoria votes for solar, batteries and climate action, as Labor wins in a landslide
Meanwhile, the federal Coalition is busily reassuring itself that this was a state election, fought on state issues.
But for senior members of the party like former energy minister and current federal treasurer Josh Frydenberg, the huge swing against the Coalition in the heart of his very own inner Melbourne “leafy green” electorate must draw uncomfortable comparisons with Wentworth in NSW.
“If the message of the Wentworth by-election wasn’t clear enough, the Liberal Party have been given another reminder,” said Greenpeace Australia Pacific campaigner Alix Foster Vander Elst.
“Australians are sick of the climate denial and scare-mongering. They want action on climate change and an energy system dominated by renewables and they will vote for parties who can deliver them,”
“Of all the issues in the campaign, climate and energy policy provided the greatest difference between the two major parties. For many voters this election was a referendum on renewable energy.”
Environment Victoria CEO Mark Wakeham said the result made clear that ignoring climate change and undermining renewable energy was “electoral poison.”
“For many voters this election was a referendum on renewable energy,” he said in comments on Saturday night.
“Matthew Guy’s Liberal Party went to the polls with no plan for climate action and a plan to destroy the state’s renewable energy industry. It has cost them the election.”
Are we witnessing a backlash against regulatory capture in Australia? Regulatory capture is the process used by moneyed interests to advance their agendas by controlling (buying) governments and getting them to pass laws or set up regulations that favour their interests.
I wish!
Uh, oh. The 1 percent is losing control, something will be done to stifle that.
“It is better to die on your feet
than to live on your knees.”
— Emiliano Zapata
Well, talk about heads up their behinds. They won’t admit that they are the problem and are causing the depletion of fish stocks, so let’s kill some more wildlife.
B.C. group wants to kill seals and sea lions to save the whales and their catch of fish.
https://www.youtube.com/watch?v=oClRPuPu0PU
Chart of the day: In 2017, US had largest decline in CO2 emissions in the world for 9th time this century
1. Global CO2 emissions from energy in 2017 grew by 1.6% (and 426.4 million tons, see data here), rebounding from the stagnant volumes during 2014-2016, and faster than the 10-year average of 1.3%.
2. Declines in CO2 emissions in 2017 were led by the US (-0.5% and 42 million tons, see chart above). This is the ninth time in this century that the US has had the largest decline in emissions in the world. This also was the third consecutive year that emissions in the US declined, though the fall was the smallest over the last three years.
http://www.aei.org/publication/chart-of-the-day-in-2017-us-had-largest-decline-in-co2-emissions-in-the-world-for-9th-time-this-century/
Beware the methane.
That’s a good example of how to reduce emissions by embracing free market solutions rather than economically devastating government regulations.
Too bad it is not true, in a global warming sense. Beware the methane.
Perry. There was absolutely no information in that link, or in world of real, that supports your assertion. Please substantiate it.
“economically devastating government regulations”
Here is your average trigger phrase for a right-wing zealot.
It’s output is rather predictable once you grasp it’s apparent ideology
Shrink Theory: The Nature of Long Run and Short Run Economic Performance
The history of growth should be all about recessions
Climate change in action
https://www.bbc.com/news/world-asia-45715550
NAOM
Wind and solar power in Europe need subsidies to compete with coal and gas. This is why environmentalists have reacted with “Fury” that subsidies for solar and wind are being cut.
https://www.powerengineeringint.com/articles/2018/07/fury-at-plans-to-scrap-uk-renewables-subsidies.html
Obviously if wind and solar could stand on their own feet they would not need subsidies. An obvious statement but I know there are some people who do not understand basic capitalism.
The wind and solar industries are given a helping hand by what is known as contracts for difference.
https://www.emrsettlement.co.uk/about-emr/contracts-for-difference/
Wind and solar need a certain amount of £ per MW/hour and most of the time electricity prices are too cheap for them to compete. In order to get companies to invest in wind and solar the government says. “Never mind what the electricity price is, we will tax people and give you their money.
In the UK we pay an extra tax which goes to wind and solar providers and the wealthy land owners.
https://www.theguardian.com/environment/2012/feb/28/windfarms-risk-free-millions-for-landowners
people are getting F@@ked off that every time the government takes money from ordinary people the rich get it.
We also pay a carbon tax which as the article says killed off coal ( and destroyed many jobs in steel and other heavy industry)
https://www.bbc.co.uk/news/business-34581945
Great plan. Tax heavy industry into oblivion, never mind about destroying jobs and people lives. Then import the stuff from China. UK CO2 emission go down and green idiots happy. Global emissions up.
The only way to deal with climate change in a way that is fair is to have an internationally agreed carbon tax paid by all the producers of coal, oil and gas.
To continue to disproportionately tax poorer people who can no longer afford these taxes will lead to more anger that will boil over.
https://www.theguardian.com/world/2018/nov/24/paris-fuel-tax-protest-macron-france-poverty
Great plan. Tax heavy industry into oblivion, never mind about destroying jobs and people lives. Then import the stuff from China. UK CO2 emission go down and green idiots happy. Global emissions up.
While there is plenty of blame to be laid at the feet of the Chinese with regards global environmental damage, due to their centralized form of government, when they decide to act and change direction they have a solid track record of quickly implementing such change on a large scale and they are doing so now!
https://www.theguardian.com/sustainable-business/blog/china-future-renewables-global-warming
Time for each and every country to get off their high horses and for their individual citizens to take personal resposibility! Maybe even looking to emulate China’s idea of implementing an ecological civilization, eh?!
Fred
China is no country to emulate
https://canadafreepress.com/article/china-looks-to-increase-natural-gas-consumption-and-supply
https://www.ceicdata.com/en/indicator/china/oil-consumption
https://www.sciencealert.com/worrying-energy-chart-coal-consumption-production-renewables
I guess you didn’t read the article at the link I provide. I don’t think Chinese are saints but there is still much the west can learn from them and emulate as well!
Go back and read about their long term plan to implement an ecological civilization, at least they seem to understand the problems that are currently facing humanity.
“Wind and solar power in Europe need subsidies to compete with coal and gas.”
Did you see the latest Levelized Cost of Energy (“LCOE”) Analysis from financial advisory and asset management firm Lazard, showing wind and solar as the lowest cost sources of electricity in the US, that I linked to in my first comment to this thread? If that is the case in the US with some of the lowest cost coal and NG on the planet, I daresay the case cannot be all that different in Europe!
In case you are not aware, despite whatever “facts” are contained in your post, it sounds like the typical bleating of a FF supported, global warming denier. In my opinion, the so called inflated costs of zero emission energy technology are going to be seen as a bargain compared to the effects of global warming with it’s attendant sea level rise. Think of all that brand new high rise real estate in South Beach and Downtown Miami. Closer to you, think of the Thames overflowing it’s banks and flooding the basements of all those brand new high rise apartments I saw going up on the banks of the Thames, when I was in London in June of 2017. How much is it going to cost to try and hold back the sea from coastal cities worldwide? How much is it going to cost to relocate the billions of people that will be dislocated by sea level rise? Bear in mind that most coastal regions have been favoured by human settlements for thousands of years and the current sea levels have been more or less constant for all of human history.
Islandboy
What a childish response to very difficult issues.
These piecemeal and uncoordinated “Environmental Taxes” are not working.
They are also hurting the poorest while enriching the richest people. Only a moron or a rich land owner would not be critical of them.
as I already said I would support a global carbon tax, so keep your silly reactionary, emotionally fueled comments in check.
https://www.independent.co.uk/environment/climate-change-carbon-tax-4-trillion-save-humanity-global-warming-economists-nicholas-stern-joseph-a7763376.html
http://www.lse.ac.uk/GranthamInstitute/news/nicholas-stern-warns-current-carbon-pricing-weak-achieve-goals-paris-agreement/
An obvious statement but I know there are some people who do not understand basic capitalism.
Your much vaunted capitalism doesn’t exactly work very well when you have the likes of the invisible hand of the Koch brothers, Bob Murray et al tipping the scales very heavily in their own favour. The free market aint’ exactly free. Who exactly is making sure that the various measures that need to be taken to reduce GHG emissions come to naught?
If you think I’m blowing smoke, head on over to the following sites founded with financial assistance from Charles Koch and take a gander of the talking points, for examples of the propaganda being spewed:
The Heartland Institute
Our Mission
To discover, develop, and promote free-market solutions to social and economic problems.
Yeah right!
The Institute for Energy Research
a not-for-profit organization that conducts intensive research and analysis on the functions, operations, and government regulation of global energy markets. IER maintains that freely-functioning energy markets provide the most efficient and effective solutions to today’s global energy and environmental challenges and, as such, are critical to the well-being of individuals and society.
One of the lead articles on their home page, dated November 20, 2018:
New Study Shows How Federal Carbon Tax Would Hurt State Budgets
In a previous post, I summarized the important new study from Capital Alpha Partners, LLC, which showed that the typical “carbon tax swap deals” being bandied about would run out of money. Specifically, the study shows that using conventional budget-scoring methods for legislative analysis, a new carbon tax would only net the government some 32 cents on the dollar. This wouldn’t leave enough money left over to accomplish the other myriad goals that supporters of a carbon tax have promised to achieve.
Yet the fiscal hole isn’t just at the federal level. The Capital Alpha study also featured something I haven’t seen before in this debate: A carbon tax at the national level would severely impact state budgets. The public and policymakers alike should consider this extra wrinkle when weighing their support for a carbon tax.
So your original post complains about subsidies for renewable energy, a tactic that appears to have achieved some results. You then go on to support a carbon tax as a potentially more equitable, effective strategy for reducing emissions but from the excerpt above, the Koch brothers, through their mouthpiece, obviously disagree with you. So, bearing in mind that the Kochs want to see continued growth in GHG emissions and their bottom line, I end up totally confused! What exactly is it you would like to achieve?
My position is quite clear. I support just about anything that will reduce GHG emissions. I have very little faith that your beloved “free market” approaches will amount to much. At least not with the likes of the current “free market” supporters in the mix. You’re in some pretty despicable company as far as that goes.
PS. the only land I own is six acres in the hills ofrural Jamaica that I own jointly with my sister. The only thing emotional about my response is that I would prefer to live on a planet similar to the one that human beings evolved on rather than some unknown future state. It’s the owners of real estate threatened by see level rise who should be emotional!
PPS. See Nick G’s response to Hickory below.
On one point, I do agree with Hugo.
It is unfair to have general tax revenues used for any kind of subsidy (including solar/wind) which is deployed in a way which favors the wealthiest.
For example, any subsidy for solar should be primarily used for utility scale deployment since you tend to get about twice as much energy return per dollar spent. That money should be deployed at municipal projects that benefit communities, rather than individuals, IMHO.
On the other hand, I believe we should be tripling down on the overall level of global subsidy to provide massive stimulation to the renewable sector.
Carbon tax. Big one phased in over 5 yrs.
Equity and fairness are virtues.
But…fossil fuel interests are manipulating our desire for fairness. They attack programs that promote renewables, on the basis of fairness. It’s cynical.
There’s no question that a stiff carbon tax, combined with efficiency standards and utility portfolio requirements, would be the best thing. But…we haven’t managed to get anywhere close to that, anywhere. There a few small local carbon taxes, and that’s pretty much it. And….carbon taxes are consumption taxes, which affect middle and working class consumers more than high income. FF interests have and will attack them on that basis! We could fix that with some kind of rebate, but…that’s always the case. We could fix the inequity of home solar subsidies by reducing the fixed costs paid by all consumers, but that’s precisely the kind of change being fought most viciously by utilities everywhere. In fact, they’re fighting to increase those fixed charges in order to sabotage solar.
Until we get the perfect policies, we’re stuck with imperfect ones like subsidies for consumer rooftop solar, which are getting some results.
And really, any solar implementation should get some kind of tax break or subsidy until that carbon tax arrives, because fossils have major external costs which aren’t included in their price. So interim subsidies only level the playing field. If those subsidies go more to wealthy consumers, that’s a problem with our overall economic and tax system, not with renewables.
The perfect is the enemy of the good.
I like the concept of having large organizations do the buying and the consumer pay a fixed fee.
Suppose we let Walmart do the buying because they can purchase at such a low price and then we all can pay a fixed price to get our groceries. After all we can only eat so many calories.
1st Guardian article over 6 years old.
CFD uses 6 year old illustrations but has no date.
BBC article is over 2 1/2 years old.
NAOM
The UK has to be able to afford its subsidies to gas and coal, not forgetting a £30B nuclear plant. The whole electricity system in the UK is a mess and needs central control instead of the tangle that has grown since the days of the CEGB which was hopelessly inefficient. Loose government regulation has allowed horrendous contracts that damage the market. For many ‘landowners’ in other words farmers’ subsidies enable them to not give up farming as they get squeezed on price, especially by supermarkets.
https://www.desmog.co.uk/2018/06/04/uk-worst-g7-countries-hiding-fossil-fuel-subsidies-report
NAOM
I was reading the Brazilian constitution, this morning, specifically the paragraphs on ecological obligations of the Brazilian government with respect the preservation of the Amazon. It occurred to me that the new administration can be held legally liable should they not follow Brazilian law and there is both legal precedent and lawyers willing to prosecute should they shirk their duty or break existing laws already on the books
Maybe Trump and his administration can also be held legally liable for environmental crimes!
https://scribepublications.com.au/books-authors/books/client-earth
CLIENT EARTH
James Thornton, Martin Goodman
Environmentally, our planet lacks the laws to keep it safe and those laws we do have are feebly enforced. Every new year is the hottest in human history, while forest, reef, ice, tundra, and species are disappearing forever. It is easy to lose all hope.
Who will stop the planet from committing ecological suicide? The UN? Governments? Activists? Corporations? Engineers? Scientists? Whoever, environmental laws need to be enforceable and enforced. Step forward a fresh breed of passionately purposeful environmental lawyers. They provide new rules to legislatures, see that they are enforced, and keep us informed. They tackle big business to ensure money flows into cultural change, because money is the grammar of business just as science is the grammar of nature.
DESTRUCTION OF BRAZIL FORESTS HITS FASTEST RATE IN DECADE
Paywalled in the times but probably will be reported elsewhere. This is before the nutjob takes over and makes illegal logging a subsidised growth industry.
Rainforest destruction in Brazil reached its highest level for a decade last year, raising fears of further increases under a far-right populist president who has dismissed the effects of deforestation and claimed that Amazon tribes would prefer “blonde girlfriends and the internet” to their traditional way of life.
Edson Duarte, the environment minister, said that illegal logging had been the main factor behind the destruction of 7,900 sq km of land between August 2017 and July 2018. That area is equivalent to nearly a million football pitches and is 13 per cent up year on year.
…
Paulo Artaxo, a climate researcher at the University of São Paulo, recently told Science magazine: “Bolsonaro is the worst thing that could happen for the environment.
“I think we are headed for a very dark period in the history of Brazil. There is no point sugarcoating it.”
“I think we are headed for a very dark period in the history of Brazil. There is no point sugarcoating it.”
If it were only a dark period in the history of Brazil that would be bad enough, unfortunately the planet can’t afford to keep losing rain forests or other ecosystems. We will all have to make decisions on how to fight back against these people!
Brown coal generation hits record low, as black coal units trip in Queensland heatwave
The slump in generation came in the lead-up to the state election on Saturday, which saw a resounding victory for the incumbent Labor government, which has an ambitious program to reach 40 per cent renewable energy share by 2025 and 50 per cent renewables by 2030.
It came as black coal generators in Queensland and NSW continued to have problems, reporting multiple trips over the weekend as the ageing machines struggled to cope with heat, particularly in Queensland where the north is experiencing record temperatures.
According to The Australia Institute, which has documented coal unit trips for the past year, two coal-fired generators struggled badly in the heat over the weekend, particularly at Callide and Tarong.
Fortunately, solar was playing a key role in Queensland as the Callide plant tripped out on Sunday and was lost for most of the afternoon.
“Complete breakdown at Callide Power Station – output reduced to zero! With increasing heatwaves due to global warming, reliance on coal is increasing liability. Ironically increasing heat is being driven by coal in the first place,” TAI tweeted.
The WMO carbon budget summary for 2017 is here: https://library.wmo.int/doc_num.php?explnum_id=5455
CO2 atmospheric concentration increase is gradually rising and on trend may start to regularly exceed 3 ppm/year after the coming El Nino; CH4 and N2O increases have been fairly constant, HFCs and others are mostly falling though something odd happened to CFC11 last year.
The UK met office has projections and data for different parameters (temperature, wind, sea level rise) and scenarios (RCPs, probabilities) here:
https://www.metoffice.gov.uk/research/collaboration/ukcp/key-results
For UK only and they don’t go into consequences that is for others using the data to come up with. This is an update from 2009 report.
Consequences here (must say I was surprised by the first!)
https://www.theguardian.com/environment/2018/nov/26/uk-flooding-threat-people-moved-michael-gove-climate-change
https://www.bbc.com/news/science-environment-46343103
NAOM
OT:
BTC-USD
3,797.27
-206.88(-5.17%)
Is this over with?
Fools gold
Rivian R1T Electric Pickup Truck Shocks World In LA Debut
The all-new Rivian R1T electric pickup truck will be in a class of its own.
Several years ago, Rivian Founder and CEO RJ Scaringe initiated a plan to bring a vehicle lineup to market that has never been executed before. After years of research, planning, and development, the R1T electric pickup truck will be unveiled as the first entrant in the realization of Scaringe’s dream. Many have long-awaited Rivian’s launch and assumed the vehicle would be easily comparable to today’s trucks — aside from the fact that it’s 100-percent electric — but that’s not really the case. In fact, Rivian has gone so far as to create its own unofficial vehicle class in which its R1T fits perfectly: Electric Adventure Vehicles.
This joins efforts from Bollinger and Workforce as the list of F-150/Silverado competitors from start-ups grows.
CEO R.J. Scaringe, 35, who has a Ph.D in mechanical engineering from the Massachusetts Institute of Technology, said exact pricing will be announced later, but a basic truck with smaller 230-mile (370 kilometers) battery pack will start under $70,000. A truck with the longer-range battery will be around $90,000, he said.
“It is impossible for Tesla to build electric cars fast enough to address the carbon crisis,” Musk wrote in a 2014 blog. “Our true competition is not the small trickle of non-Tesla electric cars being produced, but rather the enormous flood of gasoline cars pouring out of the world’s factories every day.”
https://www.msn.com/en-us/money/companies/startups-old-line-automakers-aim-to-take-bite-out-of-tesla/ar-BBQ76zQ?ocid=spartanntp
The Rivian looks good. Great specs. Just what you want to see.
This is ridiculous, but the thing that gets me the most excited is the 110V plugs in the bed. That would allow the recharging of our electric mountain bikes when we are off camping for multiple days.
Not to mention running a mini-fridge, and an induction cooktop.
I wish them great success.
I agree with Bob Nickson that the Rivian looks cool.
And while EVs are a great thing, I would be much more interested to learn what the US is doing about electrifying its rail system. According to this article, the US isn’t doing a very good job. There is an obvious lack of political motivation on the national level to do anything that involves thinking about the future.
https://www.eesi.org/articles/view/electrification-of-u.s.-railways-pie-in-the-sky-or-realistic-goal
On the other hand, I visited Los Angeles twice over the last year and didn’t have to rent a car. The LA metro system has made huge strides on the local level.
In other news, Insight fails to make a new crater on Mars.
NAOM
That is quite a feat, traveling many millions of miles across space to a very narrow window of speed, location and time. Then using atmospheric breaking for reentry, supersonic parachute followed by a 12 engine fast pulsed (10 per second) set of thrusters to slow down, maneuver and land. All autonomously due to the time delay.
Everything is AOK last I checked.
Next we will learn Mars’ underground temperature, tectonic activity and a few other things.
From the photos I have seen of Mars, it makes Death Valley look like paradise.
Quite a feat indeed!
Congrats to all involved!
One of the illustrations of the journey showed the orbits of Earth and Mars with their departure and arrival positions. Departure with Earth behind Mars and arrival with Earth ahead of Mars. Of course I know these basics but I had it brought home to me later when I was sitting outside and relaxing before sleep. I saw Mars, sitting there in the sky as I had seen over many evenings but each time a little further to the West. It suddenly put together the orbits, how the planets were moving, how the probe had traveled to Mars, something that could be grokked rather than a theoretical knowledge.
NAOM
NASA GISSTEMP temp anomaly (base 1951-1980) versus latitude for October 2018
Google pays $1 billion for offices in biggest Bay Area sale of the year
(so much for moving to “the sticks”)
https://www.sfgate.com/business/article/Google-pays-1-billion-for-offices-in-biggest-Bay-13422825.php?t=7adfd3604d
So, how does expensive Bay Energy factor?
GM is in the process of closing ICE vehicle factories, reducing salaried and worker numbers. It is apparently shifting more to trucks and SUV’s while it is setting up for a flurry of EV’s in a few years.
Why GM is moving 3,000 workers from Pontiac to Warren
General Motors is moving about 3,000 employees, mostly propulsion system engineers, from its Global Propulsion Systems center in Pontiac to the GM Technical Center in Warren.
By moving them to the tech center, GM can speed up work on developing electrified vehicles, a GM spokesman said.
https://www.freep.com/story/money/cars/general-motors/2018/11/09/gm-general-motors-pontiac-warren/1941278002/
They are scared.
NAOM
They see some trends changing, but maybe they also see future oil depletion. Why base your whole business on a rickety dying system? It will take them four years to get mass production of EV’s going. They have a good base technology to work from (Volt and Bolt) so it won’t be extremely difficult.
Sad to see the Volt going, but maybe GM knows about an upcoming battery advance that makes them too complicated and unnecessary. Once EV cars hit 400 mile range and trucks over 200 at similar prices, the game will be completely up for most of the ICE world.
According to my logistic curve of growth for EV against growth of vehicles overall, the point where all new vehicles will be EV could be in 2032. After that the last ICE’s will fade away fast as support in fuel and parts collapses.
Of course that is a better case scenario. However, I expect to see a sizable portion of road traffic to be EV’s by the mid 2020’s.
Another really nice thing about EV’s is the used batteries can take on a second life as stationary backup systems where cost is more important than charge density.
Thanks for listening to the sermon. Now please stand and sing number 669, the renewable nonrenewable song.
https://www.youtube.com/watch?v=dbrv9LGBcDo
I have a Volt and really believe it is the best combination of battery and ff power for today’s market. The battery breakthrough that’s needed to change my mind is reduced charge time. Either that or we are going to need even more closely spaced chargers than Tesla is spreading around.
I managed to go 14 months without putting gas in the Volt but I doubt that I could have taken a comfortable 700 mile trip in two days in a pure EV, even here in California, as I did a few weeks ago in anything but a Tesla.
Yeah, they are not for everywhere or everyone, yet. Car companies are betting on that switch over within four years. I noticed charging stations are starting to increase in my region, so there is hope for the non-Tesla buyer.
The Volt’s demise comes about 10 years after the semi-electric vehicle’s production model debuted. The automaker trumpeted the Volt for years as a symbol of its alternative propulsion expertise, but the company has since pivoted toward building fully battery-powered cars. The Volt still had a small gas engine paired with its battery pack.
https://www.usatoday.com/story/money/cars/2018/11/26/gm-general-motors-chevrolet-volt-cruze-impala/2114114002/
Why GM CEO Mary Barra killed Chevrolet cars, approved likely plant closures ?
She saw what happens when a major, bloated corporation fails to take decisive action, admit its mistakes and pivot toward the future.
No longer. Barra has distanced GM from its old ways in a bid to propel the company into the future of self-driving cars, electric vehicles and ride-sharing networks.
https://www.msn.com/en-us/money/companies/why-gm-ceo-mary-barra-killed-chevrolet-cars-approved-likely-plant-closures/ar-BBQ9pw3?ocid=spartanntp
Hundreds evacuate from Queensland wildfires during “unprecedented” conditions
https://wildfiretoday.com/2018/11/26/hundreds-evacuate-from-queensland-wildfires-during-unprecedented-conditions/
Wildfires focus is moving to Australia. Queensland temperature anomaly is 6°C. The northern Grand Barrier Reef might be finished after this and the expected El Nino impacts through early 2019.
Yair,
Steady on mate.
This is just over my back fence and it is crook but all completely predictable . . . and it is dry and hot make no mistake.
A major issue is that this used to be cattle country and, as such, either by lightning strike or ranchers burning their ‘relief country’ it mostly burnt every year.
For many years now it has been locked up in National Parks and small ‘cocky blocks’ with no fires, no fire management, and no bloody clue.
This is sandy coastal country with (according to my thirty years of records) a pretty reliable forty inch summer rainfall and, with maybe twenty years worth of fuel buildup of course it was going to burn . . . there are houses in there actually surrounded by scrub. The firies are to be applauded and should never be forced into the situation of making the decisions they have had to make.
This is a disaster, make no mistake, and I am not trying to make light of it but it seems the old ways are long forgotten and will never be relearnt.
By old ways I mean maintained fire breaks and trickle burning parties with barbecue and home brew working all night in the winter to keep the home block safe . . . some of the old blokes I knew were legendry and it was said they could burn green grass in the rain.
Cheers.
Good to see you back. I presume ‘firies’ are the firefighters but what is a ‘cocky blocks’?
NAOM
It may be predictable but the size of them and the vast cloud of smoke looks like something out of sci fi disaster scene. Scary shit.
Talk about draining the swamp (NOT)!
FERC nominee McNamee slams renewables, green groups in Feb. video
Dive Brief:
Bernard McNamee, President Trump’s nominee for the Federal Energy Regulatory Commission, sharply criticized renewable energy and environmental groups while calling for a “unified campaign” to support fossil fuels in a Feb. 2018 speech before Texas lawmakers, a video obtained by Utility Dive shows.
McNamee, at the time working for the conservative Texas Public Policy Foundation (TPPF), said fossil fuels are “key to our way of life,” but renewable energy “screws up the whole physics of the grid.” He also portrayed industry lawsuits with environmental groups as a “constant battle between liberty and tyranny.”
McNamee’s comments come to light as the Senate considers his nomination to FERC. The former Department of Energy official told senators last week he would separate his previous policy work from his regulatory considerations if confirmed, a pledge he reiterated in a statement to Utility Dive.
Yeah, right! Are these people for real?
This guy could actually face opposition from some senators from red states if those senators show some spine and reflect the views of their constituents. Renewable energy is very popular in some deep red areas. For example, in 2010 I took a tour of west Texas wind farms as an option of the AWEA’s Windpower 2010 Exhibition and conference. The tour guide was at pains to point out how wind farms were pumping life (money) into obviously depressed rural communities through the leases paid to land owners for wind farm sites. He pointed to a brand new school in a small rural town, saying that it was being financed out of revenues from wind farms. At one point when we alighted from the tour bus to get close to a turbine, he said the locals referred to the swooshing sound as each blade spun passed the tower, as the sound of money falling from the sky.
Solar energy is also quite popular among many Republicans, with Jack Rickard of EVTV, an ardent, unabashed Trump supporter, as a prime example. Republicans should note that, they kowtow to FF interests and obstruct renewable energy at their peril.
Appointment Scorecard:
Attorney General: No interest or experience in law enforcement, and unconfirmed
EPA (1): Appointed while suing the agency, denies climate change, basically a thief
EPA (2): Coal lobbyist
Department of Energy: One of three departments the appointee wanted to eliminate but forgot.
Press secretary: pathological liar
Top advisors: Caricature nepotism
Ag secretary: Former fertilizer salesman who led a prayer for rain outside the Congress during a drought.
HUD: Opposes government efforts to eliminate poverty
Commerce: “King of bankruptcy with connections to Putin and owns several coal mines.
Education: Opposes public education
What could possibly go wrong?
Beijing to Judge Every Resident Based on Behavior by End of 2020
The capital city will pool data from several departments to reward and punish some 22 million citizens based on their actions and reputations by the end of 2020, according to a plan posted on the Beijing municipal government’s website on Monday. Those with better so-called social credit will get “green channel” benefits while those who violate laws will find life more difficult.
The Beijing project will improve blacklist systems so that those deemed untrustworthy will be “unable to move even a single step,” according to the government’s plan. Xinhua reported on the proposal Tuesday, while the report posted on the municipal government’s website is dated July 18.
https://www.bloomberg.com/news/articles/2018-11-21/beijing-to-judge-every-resident-based-on-behavior-by-end-of-2020
“… do not adjust the horizontal. We are in control”
Saw this articles too. Talk about Central Planning….of behavior.
The ‘fly on the wall’ is now you ID/payment card, your social media account content, and that moth drone that follows you everywhere.
Fred, you might find this (video) interesting.
Crows: Documentary on The Intelligent World of Crows
https://www.youtube.com/watch?v=zGYII1XbE4U
Mind of the Raven: Investigations and Adventures with Wolf-Birds
is a great read
Tks, I’ll check it out tomorrow. Just got back to Florida. was at Munich International at 4:00 AM local time. Flight was delayed because there was dense fog in Lisbon where I was connecting. Then sat on the runway in Munich for over an hour to de-ice the plane before take off. I thought ‘Global Warming was a hoax… 😉 Been a loooong day!
Cheers!
Image of silhouettes of some friendly crows hanging out right outside my place.
UK pledges £35m to Afghanistan as food crisis worsens | Global development
https://www.theguardian.com/global-development/2018/nov/27/uk-pledges-35m-to-afghanistan-as-food-crisis-worsens
Afghanistan and India will probably be the first majors over the cliff, it is just a matter of when.
I’m putting my money on Afghanistan.
Several others are a possibility——
The $2.5 trillion reason we can’t rely on batteries to clean up the grid
Fluctuating solar and wind power require lots of energy storage, and lithium-ion batteries seem like the obvious choice—but they are far too expensive to play a major role.
Don’t worry Caelan, the big plans of many companies and governments revolve around burning and continuing to burn lots of fossil fuels. Doesn’t matter much if renewables grow if we don’t change the basic structure of civilization, they will merely slow the growth of CO2 not stop it. It’s all in what we really want, not what we think we want. Join the billions on the road to nowhere.
Enjoy the ride until it derails.
Humanity’s fossil-fuel use, if unabated, risks taking us, by the middle of the twenty-first century, to values of CO2 not seen since the early Eocene (50 million years ago). If CO2 continues to rise further into the twenty-third century, then the associated large increase in radiative forcing, and how the Earth system would respond, would likely be without geological precedent in the last half a billion years.
https://www.nature.com/articles/ncomms14845
Note: that paper does not take into account many feedbacks in the system so reality will accelerate and amplify the findings
(waiting now for the IPCC bible toting thought police)
Have to head out soon, but just off the cuff; ecocide and/or effectively addressing it involves more than C02 and solar panels. I prefer looking at things systemically/holistically. You’re apparently a retired scientist and I’ve said this before, that science and other specializations have their own myopias, essentially by definition and practice. The world is a big, intertwined and complex place. Technoreductionism, if that’s a word, and magic bullets and stuff like those don’t cut the mustard.
Oh, bullshit. You brought up the topic and then you try to use it against me. Fuck off.
You try to use comments as traps to put respondents in your erroneous judgmental boxes. You also promote fossil fuels through constant attack on renewable energy and sustainable systems. Those are dastardly and wicked actions.
They are the actions of someone trying to disrupt conversation and promote chaos.
They are the actions of someone trying to disrupt conversation and promote chaos.
That pretty much sums up why I stopped reading and replying to comments from Caelan. I keep him on ignore!
Vicariously
My name wasn’t mentioned in GoneFishing’s reply to me that is being replied to here.
Well one can hope…
Religious Fervor, Retired Scientist-style?
Sounds like someone who might be taking the tack that if one is questioning something– BAU technology, like solar panels and other innaccurately-termed green/clean/renewable tech– then they’re automatically for something else– fossil fuels.
“A false dilemma is a type of informal fallacy in which something is falsely claimed to be an ‘either/or’ situation, when in fact there is at least one additional option.” ~ Wikipedia
…But, ya, yelling bloody blasphemy– dastardly, wicked, disrupting conversation and promoting chaos (oh my!)– can serve both as ad hominems and distractions and form little meat to what one might call scientific methodology. Rather, it’s more like religious fervor, perhaps like the promo of solar panels as magic bullets for anthropological climate change– maybe like pissing on a forest-fire to try to put it out.
But then, you’re retired.
(And also spouting off in the shadows behind an anonymous handle, where you can write anything you like and not be held accountable.)
See also here.
KunstlerCast 309 — Chatting with Raul Meijer of The Automatic Earth
Most of the killing has been done by agriculture and fishing up to this point. As far as the destruction from cars and electricity, much of that will reduce when we stop burning fossil fuels and do drawdown. If we don’t change, then the true level of destruction and species loss will occur in the future.
Technology is not the enemy, some technologies are harmful and need to be put aside, bu they are just tools. What is wrong and needs to be changed is the vision in people’s heads that we are masters of the planet rather than caretakers. When that changes then the tools will promote life and growth of nature.
BTW: that 200 species a day being eradicated is just a calculated number with no names attached. At 200 species a day there would hardly be any species left by now. In fact we are increasing the number of known species, since we really do not know what is out there to begin with. True, many populations are diminished, much is unknown and some are on the brink. Those are warning signs and red flags that we are doing wrong.
So-called technology (technology has embedded values for example, and too much of those contain crony-capitalist plutarchy-type values that, for example, commodify everything, like nature and people) and/or its effects is/are a ‘symptom’ of our brains/wiring.
Once we ‘extend ourselves’ beyond our bodies, perhaps especially to increasing complexity, we lose increasing levels of control over them, paradoxically.
So, while ‘technology’ is not the enemy so to speak or per se, it indirectly is if it cannot be sufficiently controlled, whether how it’s derived or used, and there remains little wisdom in what it is and does and how it affects the world around us.
It may be that in order to save ourselves– never mind the planet– and if it’s not too late, we may have to dial down technology, if we cannot adequately control it, to next-to-nothing, very little or at least to what’s appropriate– that kind of thing, otherwise, we’re toast ‘before our time’, as some of us suspect. Naturally, extinction is the norm.
Ethics of Technology
For those who troll that nuclear is great and the answer to everything
https://www.bbc.com/news/business-46301596
NAOM
Where does the auto industry go from here?
The concept of car ownership could change, too. Today, privately owned cars spend most of their lives parked and unused. Self-driving cars of the future are expected to be on the roads for a much bigger portion of the day — once they drive you to work, they can drive someone else to the grocery store. That means roads could be filled with fewer vehicles overall.
Self-driving cars will hasten the switch from gasoline-powered automobiles to electric vehicles. The sensors and computers calling the shots will need electrical power, rather than horsepower that gasoline engines provide.
https://www.msn.com/en-us/money/companies/where-does-the-auto-industry-go-from-here/ar-BBQat42?ocid=spartanntp
HuntingtonBeach,
You probably never studied computer science in depth. One probably needs a degree in electrical engineering to understand huge problems on this technological path. But some problems are visible even for mere mortals: The problem with self-driving cars is that computers are very stupid (let’s put it politely handicapped) drivers that can’t sense a lot of things that human sense. They are good only for “normal” situations and limited traffic scenarios, for example following the car in front of you at (10+your speed) or greater distance at speeds higher than 25 miles per hour. In congested bumper-to-bumper traffic with crazy from spending 4 hours on the road human drivers cutting you left and right, they are useless unless they can communicate with the car in front of you and the car behind you getting their “intentions” beforehand. This is probably possible using Bluetooth or WiFi, but is far ahead of us and requires developing protocols and standardizing actions taken by self-driving cars across various manufacturers. The maximum you can envision now is autonomous delivery of an empty car (no passengers) as a very low speed (like Google maps cars) to the driver.
I like your enthusiasm, but from an engineering point of view, this solution is less attractive than driving cars on natural gas, and biodiesel. Right now early Tesla enthusiasts are still not chased out of their expensive neighborhood, but soon they might suffer stigma and find dead cats in their backyard, especially if other people air conditioning goes out in summer, or electrical heating at winter due to their hobby ;-). Early Tesla buyers are either “conspicuous consumption” junkies or the followers some secular cult of the “Second coming of the electric cars.” Rational person right now probably would buy a hybrid. In California as far as I can tell this is mostly prestige issues that drive people to buy Tesla, especially among IT specialists. Most of those people (for various reasons including inferiority complex) are luxury car buyers anyway.
In 2016, there were about 222 million licensed drivers in the United States. Each driver on average drives 13,474 miles each year. Now assuming 0.300 kilowatts per mile please (which means no heating and air conditioning in those cars) and even distribution of those miles during the year (so each driver drives 13,474/365 miles a day) calculate how much energy needs to be produced for, say 80% of that car to be electric. Add 20% losses in transmission and charging. Now divide by 12 hours as the most car will be charged at night, right?
Two problems:
1. How to generate so much energy for the cars needed each night? Are you advocating mass buildup of nuclear power stations? Because neither solar nor wind can work without compensating nuclear (gas powered — you need rapid switch on/off) for night time in case of the electric car is owned by the majority of the population. East-West high voltage lines can help, but in a very limited way (only three hours difference). Who will pay for this giant infrastructure project?
2. Liability questions arising are very complex. The question to you: when self-driving car electronics detects a child is running directly in front of the car and determines that it can’t stop in time and will hit the child unless it crashes the car into the pole and possibly kills one of the passengers in the front seats, whom it should save: passengers of the car or the child?
No problem with energy, the energy used to drive fossil fuel industries that will be displaced will more than cover the energy needed to drive EV’s. You can add to that the decrease in power needed for residential and business due to the switch over to LED lighting.
If we get smart we could double the insulation on refrigerators, seal up and insulate houses and building, and have a much less demand for power.
EV’s are efficient and even far more efficient at low speeds and in bumper to bumper traffic. So much of those commuter miles will be far more efficient than you think.
I see Dennis’s Model 3 is getting 0.25 kWh/mile and some of the new ones are down to 0.2.
Autonomous driving is a separate subject. Not necessary but it is coming and the problems are being solved (have been solved already) very quickly. Industry leaders think all new cars will be fully autonomous by or before 2030.
If autonomous fleets show up in city areas, the number of cars on the road will fall dramatically in urban areas. Will solve some of the traffic and parking problems. They can charge anytime, day or night, as needed.
Nighttime charging? I spent a few minutes and came up with several ways around that. To start with, cars will soon extend to 400 mile range and with average commutes at less than 30 miles will only need to charge occasionally or partially, say on weekends or at work. It will all be worked out over time, it’s not like these things will show up overnight all at once.
Nuclear? Too dangerous, not scalable, too expensive.
We’re supposed to funnel a percentage of what primary fossil fuel energy currently provides into so-called renewable energy, yes?, while keeping some semblance of this fossil-fuel-constructed/honed/fueled BAU pseudo-economy limping along enough so as to make Le Transition possible, yes?
Does that mean cutting jobs and other vested interests, and with them, government tax revenue (and while increasing payouts, such as for baby boomer pensions, welfare and unemployment benefits) such as for EV/self-crashing-EV highway infrastructure (despite recent news articles that it’s beginning to crumble in the USA), and hoping everyone all goes along with it, if they can?
I presume some of you have heard of the recent Extinction Rebellion movement, or those French yellow vest guys? Maybe they can hijack and light up an empty self-driving Tesla as a police fire-block. And many more may be out of work and angry to help out.
GM worker?
NAOM
Self-Driving Cars Can Handle Neither Rain nor Sleet nor Snow
By Kyle Stock
https://www.bloomberg.com/news/articles/2018-09-17/self-driving-cars-still-can-t-handle-bad-weather
As things stand today, the driverless car of the future can’t handle more than a dusting of snow.
It’s a known problem in the field, and vaguely embarrassing when the end result is supposed to be robots sophisticated enough to navigate the uncertainties of traffic and improve on lackluster human perception. In Boston, where NuTonomy has been road testing autonomous vehicles in cooperation with city planning officials, snow and seagulls have emerged as two of the biggest obstacles. “Snow not only alters the vehicle’s traction but also changes how the vehicle’s cameras and sensors perceive the street,” concluded a study by the World Economic Forum and the Boston Consulting Group.
For the local breed of unflappable seagulls—which can stop autonomous cars by simply standing on the street, unbothered by NuTonomy’s quiet electric cars—engineers programmed the machines to creep forward slightly to startle the birds. There’s not yet a solution for Boston snow.
After years of testing, with hundreds of cars and vans deployed on public streets and private facilities, even the best autonomous-driving efforts still struggle with inclement weather. The ultimate hurdle to the next phase of driverless technology might not come from algorithms and artificial intelligence—it might be fog and rain.
That’s why the earliest self-driving vehicles set loose on the world will be mostly restricted to sunny, dry cities that look like the places they’re most often tested. The weather, along with minimal government oversight, is a large part of the reason why the companies trying to perfect autonomous vehicles have flocked to Arizona.
“At the moment, even the most advanced players will call any kind of weather ‘out of scope,’ ” Bolat says.
Weather is a problem for the next generation of cars in multiple ways. Electric vehicles can be hamstrung by cold weather because battery power is needed to heat the car to the point at which electrons operate efficiently. A deep chill can sap about 30 percent of the potential mileage from a battery.
Before you start spreading rehash of stuff that was not even relevant two years ago, maybe you should actually look up what has been going on.
Ford and others have been solving the problems with weather.
The Clever Way Ford’s Self-Driving Cars Navigate in Snow
https://www.wired.com/2016/01/the-clever-way-fords-self-driving-cars-navigate-in-snow/
Sweden’s 33% Drop In Car Sales Foretells A Coming Crash Of The U.S. Car Market
Humans don’t do as well in snow and rain either. The hairiest driving I’ve seen has been in snow, fog and rain. It is like people suddenly think that they don’t need to apply the rules they were driving to in those conditions.
NAOM
CLIMATE CHANGE DENIERS ARE BLOCKING PROGRESS, UN REPORT SUGGESTS FOR FIRST TIME
https://www.bloomberg.com/news/articles/2018-11-27/climate-change-deniers-are-blocking-progress-un-report-suggests
The assessment of human psychology, unusual for the otherwise traditional, policy-heavy report, comes five days before negotiators and envoys head to Poland to negotiate the finer details of implementing the 2015 Paris accord. The message is stark: In order to hit the agreement’s most ambitious goal, 1.5 degrees Celsius, national targets must be made five times more ambitious than those initially pledged.
After a three-year plateau, emissions rose in 2017. “Global emissions are heading in the wrong direction with no sign of peaking,” Stephanie Pfeifer, chief executive officer of the Institutional Investors Group on Climate Change, said. “The longer we leave it, the more costly and devastating the consequences. This is a wake-up call.”
Along with traditional policy solutions, the 2018 Emission Gap Report says behavioral change is critical to building support for climate policies. When it comes to selling citizens on carbon-pollution pricing, the authors say, policy makers need to confront what’s known as solution aversion, the common tendency to pretend a problem doesn’t exist if the solutions are particularly unappealing.
https://www.unenvironment.org
https://wedocs.unep.org/bitstream/handle/20.500.11822/26879/EGR2018_ESEN.pdf?sequence=10 (Summary)
The technology for a fix may be the easiest problem (but certainly not as easy as just developing a few nice looking EVs that everybody suddenly buys whether they have the money or not). There’s the psychology issues and societal organisation. It takes about ten years to design, plan, fund, build, commission and fix a typical multi-billion dollar project and the change required involves hundreds of such, plus decommissioning all the industry being replaced and redeploying millions of unhappy workers.
To understand how these people think and act it is educational to occasionally visit their favorite blogs and sites. How many outright lies, half truths and anti science myths can be found in this post alone?
https://wattsupwiththat.com/2018/11/27/geo-engineering-ignoring-the-consequences/
Then you have all the Dunning Kruger folk in the comments section for a well rounded and informed discussion about the topic.
These people are symptomatic of a large and rather dark force that that will need to be reckoned with if humanity is to have any chance of surviving. Their minds will never be changed by actual facts.
These are not the kinds of people who will willingly make personal changes for the common good they are a lost cause and a serious burden to the welfare of future generations
Cheers!
Well said Fred.
Even worse, those who are not outright deniers or sociopaths can’t seem to agree among themselves what is going on and what should be done. There is no cohesion across much of the population.
It’s the Tower of Babel problem even when we supposedly speak the same language and live in the same culture.
I am getting more convinced that trying to change these people, educate people and expecting people to come to the aid of a dying world is a waste of time. Instead we need to focus on greed and the benefits of new technologies. Focus on cheap renewable power where the consumer has control of their own prices, fossil fuel power will die its own death – we won’t need to stab it. Focus on macho electric cars that can out accelerate anything on the road, that you can text without fear of crashing then IfCE cars will waste away (see GM).
Promote cities that are quiet and don’t stink. Push all the good features and those that trigger the greed reaction then let the old ways wither. The deniers will become ridiculed.
NAOM
Helicopter Energy
That, George, while perhaps there is a religious overfocus/meme/mantra in some niches on fossil-fuel-/BAU-derived pseudorenewables-as-climate-saviours.
Of course islandboy freely admits it’s his biz, so it’s a bit of a peddle, and Fred was/is apparently in the same solar panel biz as well. This may be indirectly the case with Nick G as well. Maybe policy.
In any case, what’s left of this half-section of the site seems to make a bit of sense as to where the penny ante BAU industry players might go to greenwash and huckster their ~3% wares in (but also via) the shadow of ~85% coal, natural gas and oil.
Industry pumps, dumps and peddles notwithstanding, I wonder if this ~3% non-renewable-renewables-cum-climate-change-marketing-tacks in the face of ~85% fossil fueled primary energy is a bit like ‘helicopter’ food-drops, etc., for the starving, while the underlying policies creating the conditions for it are ignored.
India has no idea how much coal it burns.
In an efficient and regulated country each tonnes of coal mined is weighed and weighed again at delivery to the power station of steel works. India is one of the most corrupt countries in the world. Coal theft is on a grand scale and no one knows how much is used.
https://www.economist.com/briefing/2018/08/02/india-shows-how-hard-it-is-to-move-beyond-fossil-fuels
https://in.reuters.com/article/india-coal-jharkhand-dhanbad-coalindia/special-report-coal-mafia-stokes-indias-power-crisis-idINDEE94D00B20130514
In india many poor have little option but to buy very cheap coal to cook with. They do not ask if it is legal.
http://www.openthemagazine.com/article/india/thieves-on-two-wheels
Crooked Priorities?
The Renewables-Will-Save-The-Climate Greenwash
Is our global warming and climate change ‘truck’ heading for the tipping point precipice?
WRT the attached image of primary energy for 2017 and GoneFishing’s ‘argument’ above, ~3% from solar and wind isn’t going to make much of a dent in helping to curb AGW/anthropogenic climate change emissions, including because solar panels and windmills come embedded via their mining, manufacture, transportation, installation and maintenance, etc., with fossil fuels and their continued burning.