Guest Post by
Dr. Minqi Li, Professor
Department of Economics, University of Utah
E-mail: [email protected]
June 2018
This is Part 1 of the World Energy Annual Report in 2018. This author has developed world energy annual reports that have been posted at Peak Oil Barrel since 2014. The purpose of this Annual Report is to provide updated analysis of the current development of world energy production and consumption, consider possible scenarios of world energy supply over the 21st century, and evaluate their implications for global economic growth and climate change. This year’s Annual Report includes multiple parts:
Part 1 World Energy 2018-2050
Part 2 World Oil 2018-2050
Part 3 World Natural Gas 2018-2050
Part 4 World Coal 2018-2050
Part 5 Global Carbon Dioxide Emissions and Climate Change 2018-2100
Part 1 summarizes the general findings of this year’s World Energy Annual Report. Given the currently available information, world oil production is projected to peak in the early 2020s, world natural gas production is projected to peak in the 2030s, and world coal production is projected to peak in the late 2020s. Wind and solar power is projected to grow rapidly and account for about one-third of the world energy supply by the mid-21st century. Despite the rapid expansion of renewable energies, global energy supply and economic growth are expected to decelerate over the coming decades. By the mid-21st century, the energy-constrained global economic growth rates may not be sufficient to ensure economic and political stability for the existing world system. Although world carbon dioxide emissions are projected to peak before 2030, cumulative carbon dioxide emissions over the 21st century will be sufficient to result in global warming by more than two degrees Celsius relative to the pre-industrial time (assuming there will be no large-scale carbon sequestration programs).
Part 2 through Part 5 of this year’s World Energy Annual Report will be posted at Peak Oil Barrel in the coming months. Figures and tables are placed at the end of each section.
World Energy 2017
According to BP’s Statistical Review of World Energy, world primary energy consumption reached 13,511 million tons of oil equivalent in 2017 (BP 2018). Between 2007 and 2017, world primary energy consumption grew at an average annual rate of 1.5 percent.
World oil consumption (including biofuels) was 4,622 million tons of oil equivalent in 2017, accounting for 34 percent of the world primary energy consumption (BP revised the measurement of oil consumption in 2018).
World natural gas consumption was 3,156 million tons of oil equivalent in 2017, accounting for 23 percent of the world primary energy consumption (BP revised the measurement of natural gas consumption in 2018).
World coal consumption was 3,731 million tons of oil equivalent in 2017, accounting for 28 percent of the world primary energy consumption.
World consumption of nuclear electricity was 596 million tons of oil equivalent in 2017, accounting for 4.4 percent of the world primary energy consumption.
World consumption of hydro electricity was 919 million tons of oil equivalent in 2017, accounting for 6.8 percent of the world primary energy consumption.
World consumption of wind and solar electricity was 354 million tons of oil equivalent in 2017, accounting for 2.6 percent of the world primary energy consumption.
World consumption of geothermal, biomass and other renewable electricity was 133 million tons of oil equivalent in 2017, accounting for 1.0 percent of the world primary energy consumption.
According to the World Bank and IMF data, gross world product (global economic output) was 116 trillion dollars (in constant 2011 international dollars) in 2017. Between 2007 and 2017, global economic output grew at an average annual rate of 3.2 percent (World Bank 2018; IMF 2018).
World average energy efficiency was 8,617 dollars per ton of oil equivalent in 2017. Between 2007 and 2017, world average energy efficiency grew at an average annual rate of 1.7 percent.
Figure 1 compares the historical world economic growth rates and the primary energy consumption growth rates from 1991 to 2017. The primary energy consumption growth rate has an intercept of -0.012 at zero economic growth rate and a slope of 0.914. That is, primary energy consumption has an “autonomous” tendency to fall by about 1.2 percent a year when economic growth rate is zero. When economic growth rate rises above zero, an increase in economic growth rate by one percentage point is associated with an increase in primary energy consumption by 0.91 percent. R-square for the linear trend is 0.75.
In 2017, world primary energy consumption grew by 1.9 percent, a rate that is 0.4 percentage points below what is implied by the historical trend.
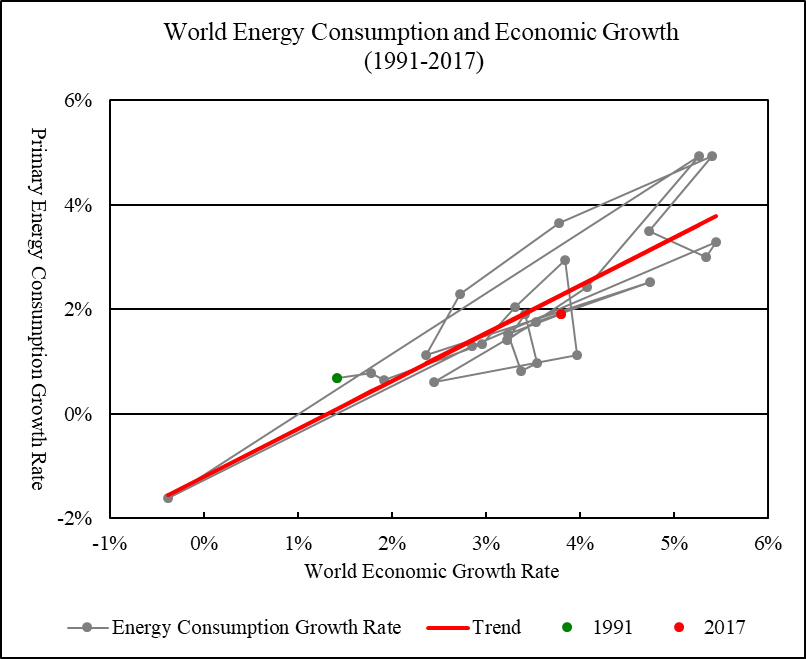
Figure 1 World Energy Consumption and Economic Growth, 1991-2017
Linear Trend: Primary Energy Consumption Growth Rate = -0.012 + 0.914 * Economic Growth Rate (R-square = 0.751)
Sources: World primary energy consumption from 1990 to 2017 is from BP (2018). Gross world product in constant 2011 international dollars from 1990 to 2016 is from World Bank (2018), extended to 2017 using growth rate reported by IMF (2018, Statistical Appendix, Table A1).
Energy Consumption by Major Economies, 1990-2017
Figure 2 compares the per capita primary energy consumption in relation to per capita GDP for the world’s six largest national energy consumers and the European Union.
China is the world’s largest energy consumer. In 2017, China’s primary energy consumption reached 3,132 million tons of oil equivalent, accounting for 23 percent of the world primary energy consumption. From 1990 to 2013, China’s per capita energy consumption surged from 602 kilograms of oil equivalent to 2.14 tons of oil equivalent. Since then, China’s energy consumption growth has slowed. By 2017, China’s per capita energy consumption rose to 2.26 tons of oil equivalent, which is still substantially below the per capita energy consumption levels of advanced capitalist economies.
If China’s per capita energy consumption were to follow its historical trend in relation to per capita GDP, China’s per capita energy consumption would rise to 5.26 tons of oil equivalent by 2050 (when China’s per capita GDP is projected to rise to about 50,000 dollars). China’s population is expected to peak before 2030 and decline to 1.36 billion by 2050. Given these projections, China’s energy demand will exceed 7 billion tons of oil equivalent by 2050.
The US is the world’s second largest energy consumer. In 2017, the US primary energy consumption was 2,235 million tons of oil equivalent, accounting for 17 percent of the world primary energy consumption. The US per capita energy consumption peaked at 8.01 tons of oil equivalent in 2000. From 2007 to 2009, the US per capita energy consumption fell sharply from 7.7 tons of oil equivalent to 7.04 tons of oil equivalent, reflecting the economic damages caused by the “Great Recession”. Since then, the US per capita energy consumption has trended down, falling to 6.87 tons of oil equivalent by 2017.
European Union is the world’s third largest energy consumer. In 2017, the European Union’s primary energy consumption was 1,689 million tons of oil equivalent, accounting for 13 percent of the world primary energy consumption. The EU per capita energy consumption peaked at 3.71 tons of oil equivalent in 2006. As the European Union struggled with both the global economic crisis of 2008-2009 and the Southern European financial crisis, the EU per capita energy consumption fell to 3.2 tons of oil equivalent by 2014. By 2017, the EU per capita energy consumption recovered to 3.29 tons of oil equivalent.
India is the world’s fourth largest energy consumer. In 2017, India’s primary energy consumption rose to 754 million tons of oil equivalent, accounting for 5.6 percent of the world primary energy consumption. As India’s economy grew rapidly, India’s per capita energy consumption grew from 225 kilograms of oil equivalent in 1990 to 562 kilograms of oil equivalent in 2017. If India’s per capita energy consumption continues to follow its historical trend in relation to per capita GDP, India’s per capita energy consumption will rise to 1.21 tons of oil equivalent by 2050 (when India’s per capita GDP is projected to rise to about 19,000 dollars). India’s population is expected to grow to 1.72 billion by 2050. Given these projections, India’s energy demand will exceed 2 billion tons of oil equivalent by 2050.
The Russian Federation is the world’s fifth largest energy consumer. In 2017, Russia’s primary energy consumption was 698 million tons of oil equivalent, accounting for 5.2 percent of the world primary energy consumption. In 1990, when Russia was a part of the Soviet Union, Russia’s per capita energy consumption was 5.8 tons of oil equivalent. As the Russian economy was torn apart by the disintegration of the Soviet Union and the neoliberal “shock therapy” (free market economic policies of privatization and liberalization), Russia’s per capita energy consumption collapsed to 4.03 tons of oil equivalent by 1998. Since then, Russia’s energy consumption has grown steadily. In 2017, Russia’s per capita energy consumption reached 4.83 tons of oil equivalent.
Japan is the world’s sixth largest energy consumer. In 2017, Japan’s primary energy consumption was 456 million tons of oil equivalent, accounting for 3.4 percent of the world primary energy consumption. Japan’s per capita energy consumption peaked at 4.15 tons of oil equivalent in 2005. Since then, Japan’s energy consumption has tended to fall as the economy struggled between recession and stagnation. By 2016, Japan’s per capita energy consumption fell to 3.55 tons of oil equivalent, lower than Japans’ per capita consumption level in 1990. In 2017, Japan’s per capita energy consumption recovered to 3.6 tons of oil equivalent.
Canada is the world’s seventh largest energy consumer and has the highest per capita energy consumption among the world’s major economies. In 2017, Canada’s primary energy consumption was 349 million tons of oil equivalent, accounting for 2.6 percent of the world primary energy consumption. Canada’s per capita energy consumption peaked at 9.77 tons of oil equivalent in 2007 and fell to 9.03 tons of oil equivalent in 2009. Since then, Canada’s energy consumption has slowly but steadily increased. By 2017, Canada’s per capita energy consumption recovered to 9.5 tons of oil equivalent.
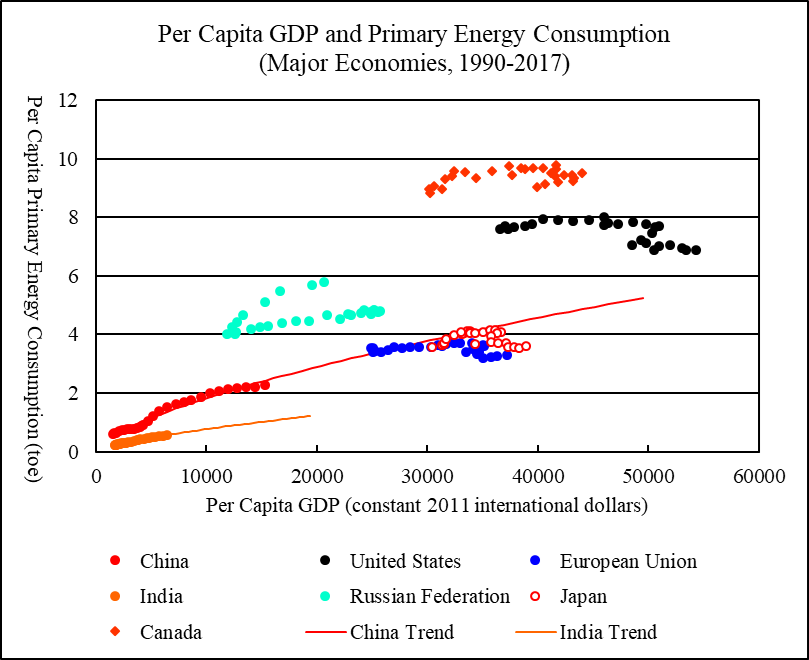
Figure 2 Per Capita GDP and Primary Energy Consumption, Major Economies, 1990-2017
Sources: Per capita primary energy consumption and per capita GDP are calculated using data for primary energy consumption, GDP, and population. National and regional primary energy consumption from 1990 to 2017 is from BP (2018). National and regional GDP from 1990 to 2016 is from World Bank (2018), extended to 2017 using growth rates reported by IMF (2018, Statistical Appendix, Table A1, A2, and A4). National and regional population from 1990 to 2016 is from World Bank (2018), extended to 2017 by assuming that the 2017 population growth rates are the same as the 2016 growth rates. To project China’s and India’s per capita primary energy consumption, a log-linear relationship is estimated between the per capita primary energy consumption and per capita GDP for the period 1990-2017. China’s and India’s GDP and population projections from 2018 to 2050 are from EIA (2017, Reference Case, Table A3 and Table J4), adjusted to make the projected GDP and population levels in 2017 matching the levels reported by World Bank (2018).
Oil: Ultimately Recoverable Resources and Peak Production
World oil production (including crude oil and natural gas liquids) was 4,387 million metric tons (92.6 million barrels per day) in 2017. Between 2007 and 2017, world oil production grew at an average annual rate of 1 percent.
Table 1 summarizes the estimated ultimately recoverable oil resources as well as the projected peak production level and year for the world’s ten largest oil producers, the rest of the world, and the world as a whole. Part 2 of this year’s World Energy Annual Report will discuss the details of oil production projections and show figures of historical and projected oil production for individual regions.
Where available data on historical production allows for the establishment of a Hubbert linearization trend with reasonably high confidence (that is, a clear downward linear trend of the annual production to cumulative production ratio can be identified), Hubbert linearization is used to estimate the region’s ultimately recoverable resources as well as the peak production level and year. This is applied to the Russian Federation, China, Brazil, and the Rest of the World.
For the other large oil producers, it is premature to apply Hubbert linearization. For Saudi Arabia, Canada, Iran, Iraq, United Arab Emirates, and Kuwait, the ultimately recoverable resources are assumed to be the sum of cumulative production and official reserves reported by BP. For the US, the Energy Information Administration’s official projection is used to project the future oil production from 2018 to 2050, extended to 2100 using Hubbert linearization (EIA 2018, Reference Case, Table A1).
World cumulative oil production up to 2017 was 192 billion metric tons. The world’s remaining recoverable oil resources are estimated to be 276 billion metric tons and ultimately recoverable oil resources are estimated to be 468 billion metric tons. By comparison, the BP Statistical Review of World Energy reports that the world oil reserves at the end of 2017 were 239 billion metric tons.
World oil production is projected to peak at 4,529 million metric tons in 2021.
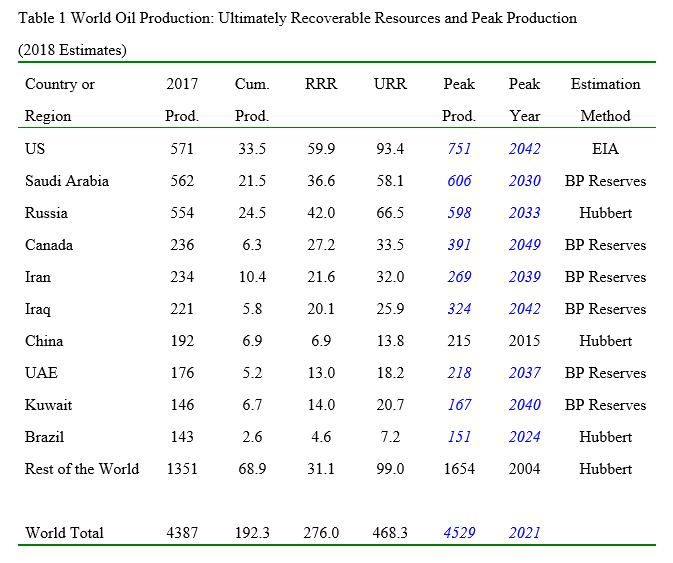
2017 Production and Peak Production are in million metric tons; Cumulative Production, RRR (remaining recoverable resources or reserves), and URR (ultimately recoverable resources) are in billion metric tons. For Peak Production and Peak Year, regular characters indicate historical peak production and year and italicized blue characters indicate theoretical peak production and year projected by statistical models. Cumulative production up to 2007 is from BGR (2009, Table A 3-2), extended to 2017 using annual production data from BP (2018).
Natural Gas: Ultimately Recoverable Resources and Peak Production
World natural gas production was 3,165 million tons of oil equivalent (3,680 billion cubic meters) in 2017. Between 2007 and 2017, world natural gas production grew at an average annual rate of 2.3 percent.
Table 2 summarizes the estimated ultimately recoverable natural gas resources as well as the projected peak production level and year for the world’s ten largest natural gas producers, the rest of the world, and the world as a whole. Part 3 of this year’s World Energy Annual Report will discuss the details of natural gas production projections and show figures of historical and projected natural gas production for individual regions.
For the “Rest of the World” (world excluding the ten largest natural gas producers), a clear downward linear trend of the annual production to cumulative production ratio can be identified for the past several years. Hubbert linearization is used to estimate the region’s ultimately recoverable natural gas resources as well as the peak production level and year.
Meaningful Hubbert linearization trends cannot yet be established for the ten largest natural gas producers. For the Russian Federation, Iran, Qatar, China, Australia, Saudi Arabia, and Algeria, the ultimately recoverable resources are assumed to be the sum of cumulative production and official reserves reported by BP. For Canada and Norway, the official reserves reported by BP appear to be too conservative. The ultimately recoverable natural gas resources estimated by the German Federal Institute for Geosciences and Natural Resources are used for the two countries (BGR 2017, Table A-15). For the US, the Energy Information Administration’s official projection is used to project the future natural gas production from 2018 to 2050, extended to 2100 using Hubbert linearization (EIA 2018, Reference Case, Table A1).
World cumulative natural gas production up to 2017 was 103 billion tons of oil equivalent. The world’s remaining recoverable natural gas resources are estimated to be 281 billion tons of oil equivalent and ultimately recoverable natural gas resources are estimated to be 384 billion tons of oil equivalent. By comparison, the BP Statistical Review of World Energy reports that the world natural gas reserves at the end of 2017 were 194 trillion cubic meters (166 billion tons of oil equivalent).
World natural gas production is projected to peak at 3,921 million tons of oil equivalent in 2036.
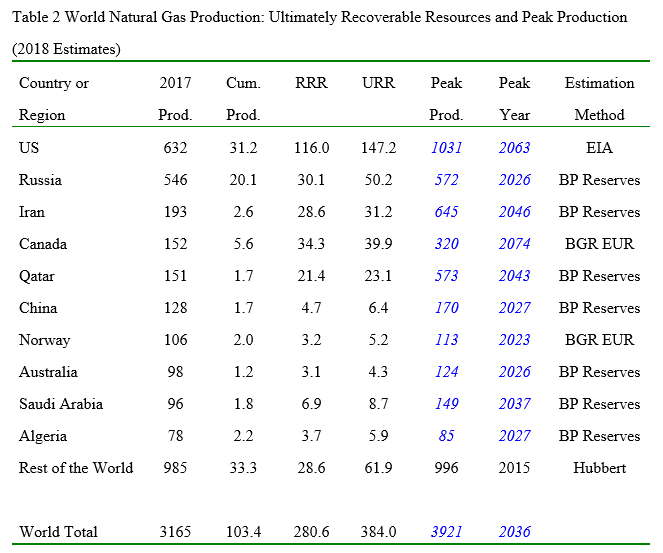
2017 Production and Peak Production are in million tons of oil equivalent; Cumulative Production, RRR (remaining recoverable resources or reserves), and URR (ultimately recoverable resources) are in billion tons of oil equivalent. For Peak Production and Peak Year, regular characters indicate historical peak production and year and italicized blue characters indicate theoretical peak production and year projected by statistical models. BGR EUR refers to the ultimately recoverable resources estimated by the German Federal Institute for Geosciences and Natural Resources. Cumulative production up to 2007 is from BGR (2009, Table A 4-2), extended to 2017 using annual production data from BP (2018).
Coal: Ultimately Recoverable Resources and Peak Production
World coal production was 7,727 million metric tons (3,769 million tons of oil equivalent) in 2017. Between 2007 and 2017, world coal production grew at an average annual rate of 1.5 percent.
Table 3 summarizes the estimated ultimately recoverable coal resources as well as the projected peak production level and year for the world’s seven largest coal producers, the rest of the world, and the world as a whole. Part 4 of this year’s World Energy Annual Report will discuss the details of coal production projections and show figures of historical and projected coal production for individual regions.
Where available data on historical production allows for the establishment of a Hubbert linearization trend with reasonably high confidence, Hubbert linearization is used to estimate the region’s ultimately recoverable resources as well as the peak production level and year. This is applied to Australia, South Africa, and the Rest of the World.
For the other large coal producers, it is premature to apply Hubbert linearization. For China, India, Indonesia, and the Russian Federation, the ultimately recoverable resources are assumed to be the sum of cumulative production and official reserves reported by BP. For the US, the Energy Information Administration’s official projection is used to project the future coal production from 2018 to 2050, extended to 2100 using Hubbert linearization (EIA 2018, Reference Case, Table A1).
World cumulative coal production up to 2017 was 192 billion metric tons. The world’s remaining recoverable coal resources are estimated to be 617 billion metric tons and ultimately recoverable coal resources are estimated to be 992 billion metric tons. By comparison, the BP Statistical Review of World Energy reports that the world coal reserves at the end of 2017 were 1,035 billion metric tons.
World coal production is projected to peak at 8,417 million metric tons in 2028.
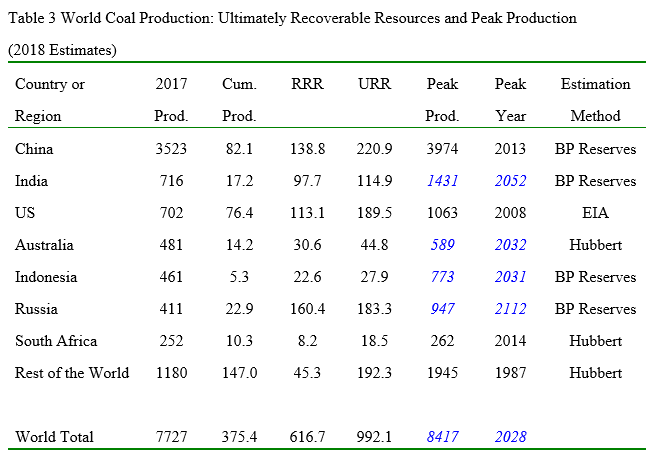
2017 Production and Peak Production are in million metric tons; Cumulative Production, RRR (remaining recoverable resources or reserves), and URR (ultimately recoverable resources) are in billion metric tons. For Peak Production and Peak Year, regular characters indicate historical peak production and year and italicized blue characters indicate theoretical peak production and year projected by statistical models. Cumulative production up to 1980 is from Rutledge (2011), extended to 2017 using annual production data from BP (2018).
World Electricity 2017
According to BP’s Statistical Review of World Energy, world electricity generation reached 25,511 terawatt-hours in 2017 (BP 2018). Between 2007 and 2017, world electricity generation grew at an average annual rate of 2.5 percent.
Electricity generation from oil was 883 terawatt-hours, accounting for 3.5 percent of the world electricity generation in 2017. Electricity generation from natural gas was 5,915 terawatt-hours, accounting for 23 percent of the world electricity generation in 2017. Electricity generation from coal was 9,723 terawatt-hours, accounting for 38 percent of the world electricity generation in 2017. Nuclear electricity generation was 2,636 terawatt-hours, accounting for 10 percent of the world electricity generation in 2017. Hydro electricity generation was 4,060 terawatt-hours, accounting for 16 percent of the world electricity generation in 2017. Non-hydro renewable electricity generation was 2,152 terawatt hours, accounting for 8.4 percent of the world electricity generation in 2017.
Renewable energies are mainly used to generate electricity. The degree of electrification will set the limit to the penetration of renewable energies from the demand side. The energy electrification index is defined as the thermal equivalent of electricity generation as a share of the world primary energy consumption. The thermal equivalent of 4.4194 terawatt-hours of electricity is one million tons of oil equivalent. This is based on the assumption of 38 percent efficiency in conventional thermal electricity generation and is the formula used by BP’s Statistical Review of World Energy to convert nuclear and renewable electricity into primary energy consumption.
Measured by the energy electrification index defined above, world energy electrification was 31 percent in 1985, 33 percent in 1990, 35 percent in 1995, 38 percent in 2000, 38 percent in 2005, 40 percent in 2010, 42 percent in 2015, and 43 percent in 2017. In average, the world energy electrification index has increased at a pace of about 2 percentage points in every five years. At this rate, the thermal equivalent of world electricity generation should account for about 55 percent of the world primary energy consumption by 2050.
The electricity de-carbonization index is defined as the electricity generation from de-carbonized sources (nuclear and renewable energies) as a share of the total electricity generation. Measured by this index, the world average degree of electricity de-carbonization was 36 percent in 1985, 36 percent in 1990, 38 percent in 1995, 36 percent in 2000, 33 percent in 2005, 33 percent in 2010, 34 percent in 2015, and 35 percent in 2017. Despite rapid growth of renewable energies in recent years, there has been virtually no progress in world-wide electricity de-carbonization since 1985. However, as wind and solar electric power continues to grow rapidly, the pace of electricity de-carbonization should accelerate in the coming years.
Figure 3 compares the historical world economic growth rates and the electricity generation growth rates from 1991 to 2017. An increase in economic growth rate by one percentage point is associated with an increase in electricity generation by 0.88 percent. R-square for the linear trend is 0.73. In 2017, world electricity generation grew by 2.5 percent, a rate that is 0.7 percentage points below what is implied by the historical trend.
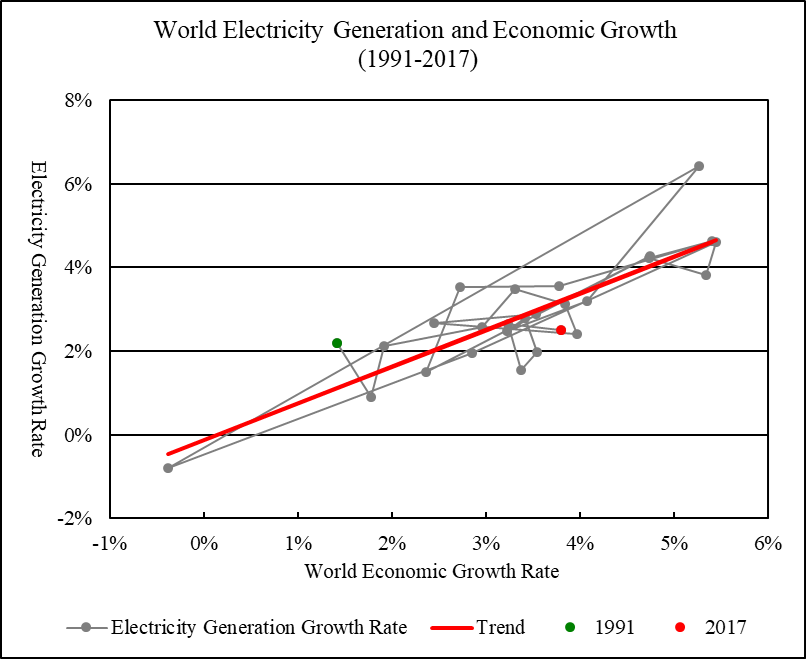
Figure 3 World Electricity Generation and Economic Growth, 1991-2017
Linear Trend: Electricity Generation Growth Rate = -0.001 + 0.878 * Economic Growth Rate (R-square = 0.725)
Sources: World electricity generation from 1990 to 2017 is from BP (2018). Gross world product in constant 2011 international dollars from 1990 to 2016 is from World Bank (2018), extended to 2017 using growth rate reported by IMF (2018, Statistical Appendix, Table A1).
Electricity Generation by Major Economies, 1990-2017
Figure 4 compares the per capita electricity generation in relation to per capita GDP for the world’s six largest national electricity generators and the European Union.
China is the world’s largest electricity generator. In 2017, China’s electricity generation reached 6,495 terawatt-hours, accounting for 25 percent of the world electricity generation. From 1990 to 2017, China’s per capita electricity generation surged from 547 kilowatt-hours to 4,686 kilowatt-hours. If China’s per capita electricity generation were to follow its historical trend in relation to per capita GDP, China’s per capita electricity generation would rise to 15,573 kilowatt-hours by 2050. As China’s population is projected to be 1.36 billion by 2050, China’s total electricity demand will be about 21,000 terawatt-hours by 2050. In term of generation capacity, this is equivalent to the electricity generation by 4,800 gigawatts of coal-fired power plants with 50 percent capacity utilization or by 16,000 gigawatts of solar electric power plants with 15 percent capacity utilization.
The US is the world’s second largest electricity generator. In 2017, the US electricity generation was 4,282 terawatt-hours, accounting for 17 percent of the world electricity generation. The US per capita electricity generation peaked at 14,712 kilowatt-hours in 2007. Since then, the US per capita electricity generation has trended down, falling to 13,160 kilowatt-hours by 2017.
European Union is the world’s third largest electricity generator. In 2017, the European Union’s electricity generation was 3,287 terawatt-hours, accounting for 13 percent of the world electricity generation. The EU per capita electricity generation peaked at 6,770 kilowatt-hours in 2006. The EU per capita electricity generation fell to 6,272 kilowatt-hours in 2014 and recovered to 6,406 kilowatt-hours in 2017.
India is the world’s fourth largest electricity generator. In 2017, India’s electricity generation rose to 1,497 terawatt-hours, accounting for 5.9 percent of the world electricity generation. As India’s economy grew rapidly, India’s per capita electricity generation grew from 331 kilowatt-hours in 1990 to 1,118 kilowatt-hours in 2017. If India’s per capita electricity generation continues to follow its historical trend in relation to per capita GDP, India’s per capita electricity generation will rise to 2,731 kilowatt-hours by 2050. As India’s population is projected to grow to 1.72 billion by 2050, India’s total electricity demand will be about 4,700 terawatt-hours by 2050. In term of generation capacity, this is equivalent to the electricity generation by 1,070 gigawatts of coal-fired power plants with 50 percent capacity utilization or by about 3,600 gigawatts of solar electric power plants with 15 percent capacity utilization.
The Russian Federation is the world’s fifth largest electricity generator. In 2017, Russia’s electricity generation was 1,091 terawatt-hours, accounting for 4.3 percent of the world electricity generation. From 1990 to 1998, Russia’s per capita electricity generation fell from 7,298 kilowatt-hours to 5,601 kilowatt-hours. Since then, Russia’s electricity generation has grown steadily. In 2017, Russia’s per capita electricity generation reached 7,547 kilowatt-hours.
Japan is the world’s sixth largest electricity generator. In 2017, Japan’s electricity generation was 1,020 terawatt-hours, accounting for 4 percent of the world electricity generation. Japan’s per capita electricity generation peaked at 9,243 kilowatt-hours in 2008. By 2016, Japan’s per capita electricity generation fell to 7,893 kilowatt-hours. In 2017, Japan’s per capita electricity generation recovered to 8,041 kilowatt-hours.
Canada is the world’s seventh largest electricity generator and has the highest per capita electricity generation among the world’s major economies. In 2017, Canada’s electricity generation was 693 terawatt-hours, accounting for 2.7 percent of the world electricity generation. Canada’s per capita electricity generation peaked at 19,624 kilowatt-hours in 2000. In recent years, Canada’s per capita electricity generation has stayed above 18,000 kilowatt-hours. In 2017, Canada’s per capita electricity generation was 18,893 kilowatt-hours.
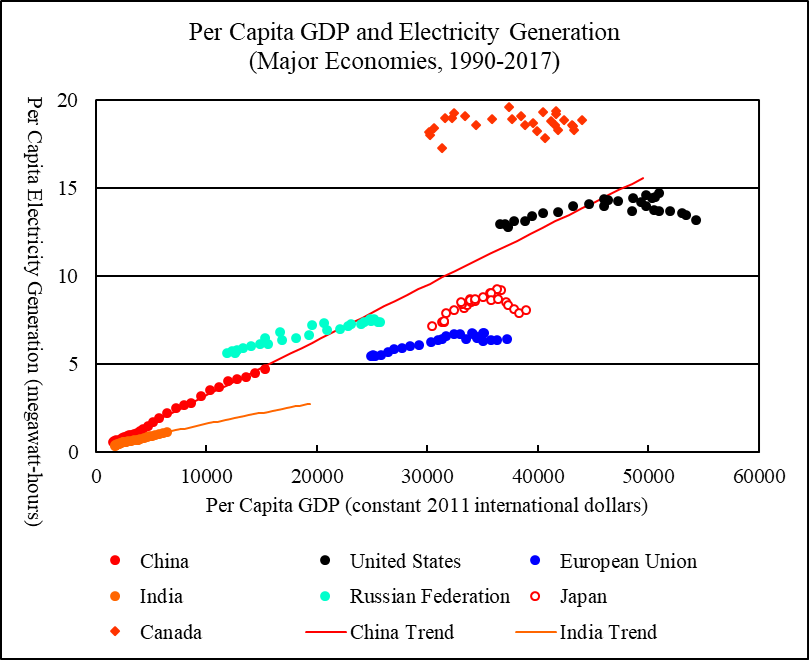
Figure 4 Per Capita GDP and Electricity Generation, Major Economies, 1990-2017
Sources: Per capita electricity generation and per capita GDP are calculated using data for electricity generation, GDP, and population. National and regional electricity generation from 1990 to 2017 is from BP (2018). National and regional GDP from 1990 to 2016 is from World Bank (2018), extended to 2017 using growth rates reported by IMF (2018, Statistical Appendix, Table A1, A2, and A4). National and regional population from 1990 to 2016 is from World Bank (2018), extended to 2017 by assuming that the 2017 population growth rates are the same as the 2016 growth rates. To project China’s and India’s per capita electricity generation, a log-linear relationship is estimated between the per capita electricity generation and per capita GDP for the period 1990-2017. China’s and India’s GDP and population projections from 2018 to 2050 are from EIA (2017, Reference Case, Table A3 and Table J4), adjusted to make the projected GDP and population levels in 2017 matching the levels reported by World Bank (2018).
Wind and Solar Electricity
In 2017, world consumption of wind electricity was 1,123 terawatt-hours, accounting for 4.4 percent of the world electricity generation; world consumption of solar electricity was 443 terawatt-hours, accounting for 1.7 percent of the world electricity generation.
Wind and solar are renewable energy resources. However, wind and solar electricity is intermittent. Integration of wind and solar electricity into electric grids requires maintaining a large backup generating capacity or large-scale storage technologies that are yet to be developed. In the long run, wind and solar electricity will also be limited by the availability of land and mineral resources.
Despite these limitations, it is not unreasonable to assume that wind and solar electricity is likely to keep growing through the 21st century. I assume that the total or cumulative installation of wind and solar electric power will keep growing in the future. However, I assume that the annual installation of wind and solar electric power (that is, the annual addition to cumulative installation) will rise to a plateau and then stabilize.
In 2017, the world installed 47 gigawatts of wind generating capacity and 97 gigawatts of solar generating capacity. Figure 5 compares the historical relationship between the annual installation of wind and solar generating capacity and the annual growth to the annual installation ratio from 2007 to 2017. The annual growth to annual installation ratios fluctuate wildly between individual years. To smooth out the fluctuations and establish a more reliable linear trend, I use ten-year trailing averages of the annual ratios. The downward linear trend indicates that the annual installation of wind and solar generating capacity should eventually approach the maximum of 566 gigawatts (where the linear trend meets the zero horizontal line). The regression R-square is very high (0.87).
The parameters of the linear trend shown in Figure 5 can be used to project the future installation of wind and solar generating capacity. The world’s cumulative installation of wind and solar generating capacity is projected to rise to about 16,400 gigawatts by 2050 (Figure 6). By comparison, the US Energy Information Administration projects that the world’s total installed generation capacity of all types of electric power will be about 9,800 gigawatts by 2050 (EIA 2017, Reference Case, Table H-1).
The future wind and solar electricity generation can be estimated using the following formula:
Electricity Generation (current year)
= (Beginning-of-year Generating Capacity + End-of-year Generating Capacity) / 2 * 8760 Hours * Capacity Utilization Rate
In 2017, the observed world average wind electric power capacity utilization rate was 26.1 percent; the observed world average solar electric power capacity utilization rate was 14.4 percent; the observed world average wind and solar electric power capacity utilization rate was 21.2 percent. From 1997 to 2017, the world average wind and solar electric power capacity utilization rate averaged 21.6 percent. These capacity utilization rates are calculated using wind and solar electricity consumption and generating capacity data provided by BP (2018).
I assume that from 2018 to 2050, the world average wind and solar electric power capacity utilization rate will be 21.6 percent.
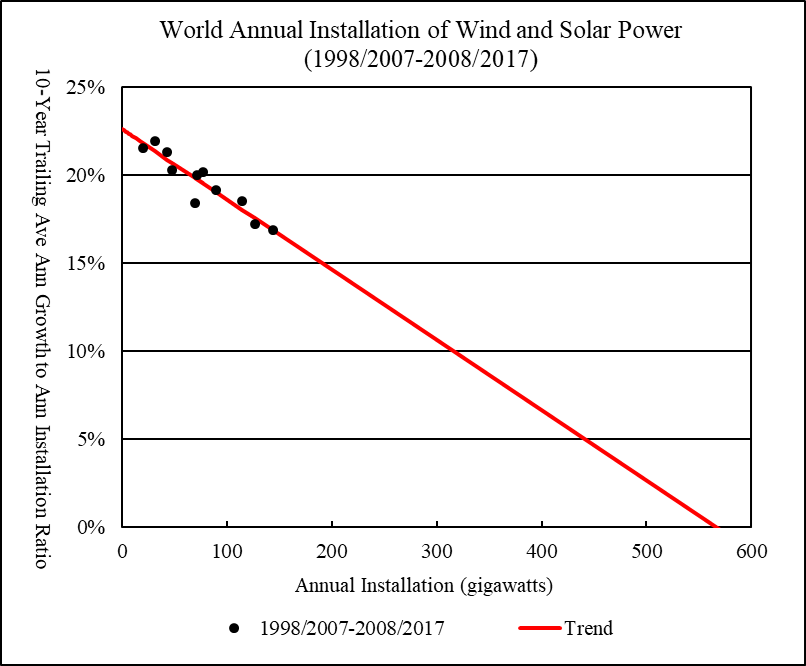
Figure 5 World Annual Installation of Wind and Solar Power, 1998/2007-2008/2017
Sources: Annual installation of wind and solar generating capacity from 1997 to 2017 is calculated using cumulative installation data from BP (2018).
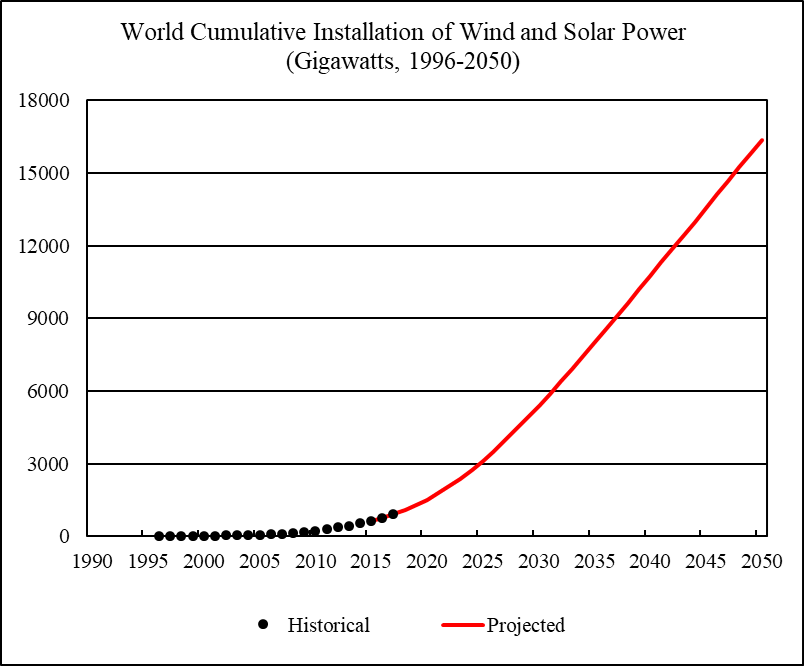
Figure 6 World Cumulative Installation of Wind and Solar Power, 1996-2050
Sources: Cumulative installation of wind and solar generating capacity from 1996 to 2017 is from BP (2018).
World Energy 2018-2050
Figure 7 shows the historical and projected world primary energy consumption from 1950 to 2050.
World historical consumption of oil, natural gas, and coal from 1950 to 1964 is estimated using carbon dioxide emissions from fossil fuels burning (Boden, Marland, and Andres 2017).
World primary energy consumption and its composition from 1965 to 2017 is from BP (2018).
World oil consumption from 2018 to 2050 is assumed to be the same as the sum of the world oil production and world biofuels production. Future world oil production is based the projections reported by Table 1. Oil in metric tons is converted to oil equivalent using the formula: 1 metric ton of oil production = 1.034 tons of oil equivalent (using the observed world average ratio in 2017). Future world biofuels production is based on the US Energy Information Administration’s projection (EIA 2017, Reference Case, Table G3), adjusted to make the projected biofuels production level in 2017 matching the level reported by BP.
World consumption of natural gas and coal from 2018 to 2050 is assumed to be the same as production. Future natural and coal production is based the projections reported by Table 2 and 3. Coal in metric tons is converted to oil equivalent using the formula: 1 metric ton of coal = 0.488 tons of oil equivalent (using the observed world average ratio in 2017).
World consumption of wind and solar electricity from 2018 to 2050 is based on the projections shown in Figure 5 and Figure 6.
To project the future nuclear electricity consumption, I use the US Energy Information Administration’s projection of net nuclear electricity generation (EIA 2017, Reference Case, Table H16), adjusted to make the projected nuclear electricity generation in 2017 matching the level reported by BP (2018).
To project the future hydro electricity consumption, I use the US Energy Information Administration’s projection of net hydro electricity generation (EIA 2017, Reference Case, Table H18), adjusted to make the projected hydro electricity generation in 2017 matching the level reported by BP (2018).
To project the future consumption of geothermal, biomass and other renewable electricity, I use the US Energy Information Administration’s projection of net geothermal electricity generation and net other renewable electricity generation (EIA 2017, Reference Case, Table H20 and H22), adjusted to make the projected sum of net geothermal and other renewable electricity generation in 2017 matching the level reported by BP (2018).
World consumption of nuclear, hydro, wind, solar, geothermal, biomass, and other renewable electricity from 2018 to 2050 is converted to their thermal equivalent using the formula: 4.4194 terawatt-hours = 1 million tons of oil equivalent.
World primary energy consumption is projected to rise to near 20,000 million tons of oil equivalent by 2050. Oil is projected to account for 19 percent of the world primary energy consumption in 2050, natural gas will account for 18 percent, coal will account for 15 percent, nuclear electricity will account for 4.4 percent, hydro electricity will account for 7.4 percent, wind and solar electricity will account for 35 percent, other renewable electricity will account for 1.4 percent.
World carbon dioxide emissions from fossil fuels burning are projected to peak at 36.5 billion metric tons in 2028. Part 5 of this year’s World Energy Annual Report will discuss the details of carbon dioxide emissions projections and the implications for climate change.
The International Monetary Fund predicts that the world economic growth rate in 2018 will be 3.9 percent (IMF 2018, Statistical Appendix, Table A1). For 2019-2050, global economic growth rate is estimated by using the linear relationship between the primary energy consumption growth rate and the economic growth rate observed for the period 1991-2017:
Economic Growth Rate = (Primary Energy Consumption Growth Rate + 0.012) / 0.914
Figure 8 shows the historical and projected world economic growth rates from 1991 to 2050. World average economic growth rate is projected to fall from 3.7 percent in 2001-2010 and 3.6 percent in 2011-2020, to 3.1 percent in 2021-2030, 2.4 percent in 2031-2040, and 1.9 percent in 2041-2050.
Since the end of the Second World War, global economic growth rate has fallen below 2 percent only in several occasions. During 1913-1950, when the global capitalist system suffered from major wars, revolutions, and the Great Depression, world economy actually grew at an average annual rate of 1.8 percent (Maddison 2010). Thus, by the mid-21st century, although the global economy will continue to grow, world economic growth rate may become too low for the global capitalist system to maintain economic and social stability.
Table 4 summarizes the main findings of this year’s World Energy Annual Report.
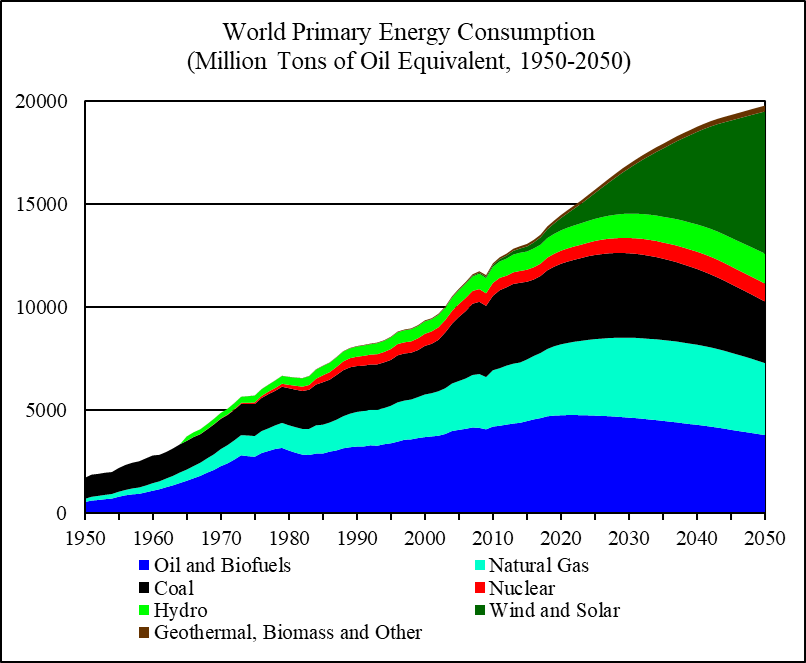
Figure 7 World Primary Energy Consumption, 1950-2050
Sources: World historical oil, natural gas, and coal consumption from 1950 to 1964 is estimated from carbon dioxide emissions (Boden, Marland, and Andres 2017); world primary energy consumption and its composition from 1965 to 2017 is from BP (2018); world primary energy consumption and its composition from 2018 to 2050 is based on this report’s projections.
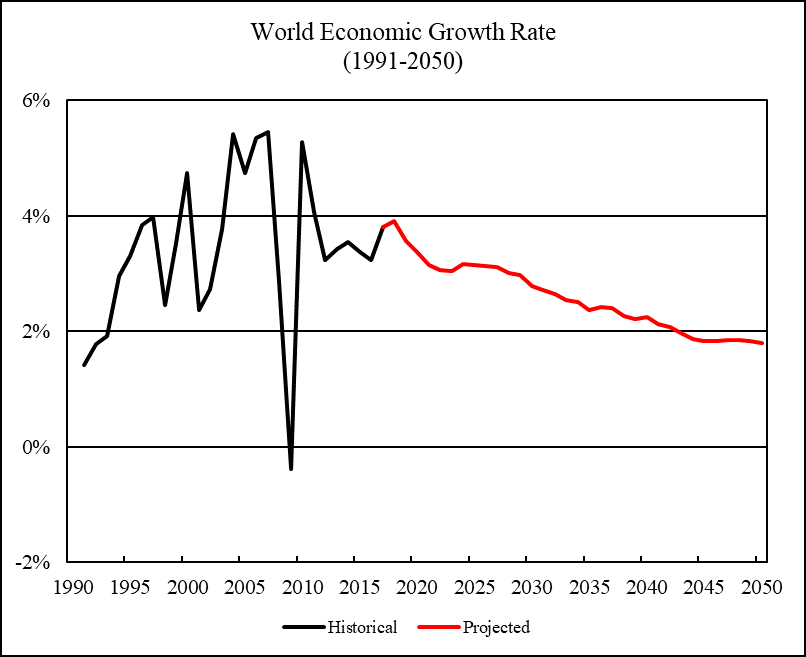
Figure 8 World Economic Growth Rate, 1991-2050
Sources: World economic growth rates from 1991 to 2016 are from World Bank (2018); world economic growth rates in 2017 and 2018 are from IMF (2018, Statistical Appendix, Table A1); world economic growth rates from 2019 to 2050 are based on this report’s projections.
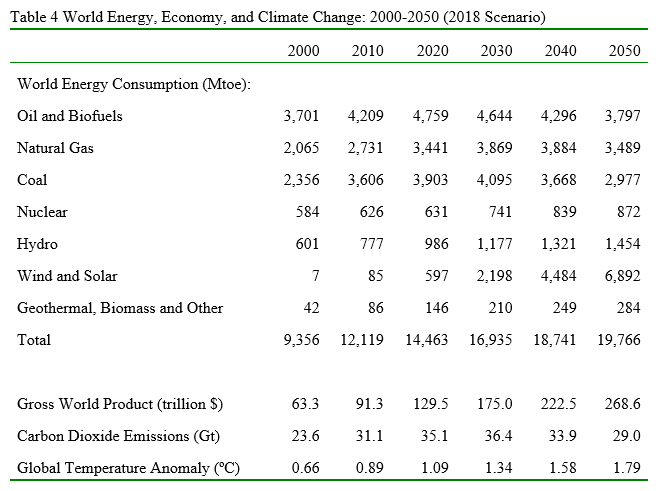
Mtoe: million tons of oil equivalent.
$: constant 2011 international dollars.
Gt: giga-tons or billion metric tons.
Global Temperature Anomaly: ten-year trailing average of the difference between the global average surface temperature and the 1880-1920 global average surface temperature.
334 responses to “World Energy 2018-2050: World Energy Annual Report (Part 1)”
I know very little about the other energy sources, except oil. That it would peak within 2021 give or take a couple of years is a good probability. Using EIA as the source and 2042 as the year for the US, should keep the thought police away, but not very original. After it peaks, it declines. The decline rates do not look as high as I would think they should look. Then again, we have never been here before, and I have nothing to measure against. Or, I guess we have been, in centuries passed, before oil, electricity, and some of the new producers of electricity. We maxed out whale oil.
CO2 and climate change continue their upward trajectory after peak oil, gas and coal peaks? What will they have to bang on after they are gone? However, if Energy production does not meet energy needs, the CO2 could come from burnt trees.
Or, India can accomplish their objective of obtaining helium-3 from the moon, and provide a source of fusion energy for centuries. Though, no doubt, that would provide its own unique dangers to the ecological systems. Nothing will stop the fact, that our continued existence and expansion on this world is an extinction process.
India is a Thorium centric country.
Another one of those– well, never mind.
Poll ranks India the world’s most dangerous country for women
https://www.theguardian.com/global-development/2018/jun/28/poll-ranks-india-most-dangerous-country-for-women
Or, India can accomplish their objective of obtaining helium-3 from the moon, and provide a source of fusion energy for centuries.
Guym, you should put a smiley face after such comments. Otherwise, some goddamn fool out there may think you are serious.
Sorry, of course there should have been a smiley face. Doing anything on the moon, other than scientific studies should be prohibited by international law. Moon mining does not fit into that, nor does colonization. They recently recovered some old data from the first moonwalk. It showed temperatures were far above normal in that area for a long time, just because we were there. We created Moonal warming?
https://amp.livescience.com/62805-moon-surface-warming-apollo-astronauts.html
Which raises the question to me, is our mere existence the major contributor to global warming?
Hi Guym, please note in Table 4 the emissions decline after 2030 (the cumulative emissions of course will continue to rise)
The actual peak emissions year is 2028 under the current projection
Details of emissions will be explained in part 5 of this report
Thank you, Professor.
Hi
How are you?
What do professor Coyne, Kaplan and Patternson think about peak years?
Oil 2021, Gas 2036 and coal 2028?
What are yours peak years?
Sorry by my language im from uruguay
Thank you
Cecilia, I will have a post coming out on July 4th on US and World production. I will give my opinion on the predictions, of oil production, then. So you will just have to wait.
However gas and coal are out of my range of expertise so I will have no opinions or predictions on the peak of these two energy sources. Actually, oil is also out of my range of expertise but I sometimes fake it. But I do have definite opinions on oil which I will give in that post.
But I am with you, I would like to hear other opinions on these peak dates. I think Dennis has already predicted 2021 as the year of peak oil. And I would agree with that. Well, somewhere between 2018 and 2021, but no later than 2021.
But what I find very interesting is the prediction that the USA will peak in 2042. I think that is about as likely as a snowstorm in hell. But you will just have to wait for my post on July 4th to give a more detailed explanation of my prediction.
Well, that will be interesting to read. I look forward to it. I’m sure it will just confuse the hell out of me.
This current article: would this be “cornucopian”?
After over a decade of reading and thinking about this (and fancying myself informed because I studied geology in college), I don’t know what the fuck to believe anymore. US peaked in 1971–no, wait: “shale” topped that–but a peak in 2042?
Poor Deffeyes in dead. I miss 2005, when it seemed the experts had a handle on this.
This one may be “cornucopian” in the sense that it makes major upward revision of projected wind and solar growth in comparison with previous reports
I myself still think this is likely to be revised down in the future. Nevertheless, the report itself is intended to show what the currently available data indicate
As is explained in the first few paragraphs, the basic theme of the report is that exponential economic growth cannot be compatible with climate stabilization
My detailed oil projection will probably be posted after Ron’s
It will be very interesting to compare these. But it is important to note that all projections are based on currently available information and certain assumptions
If you want to dance with the stars, get a good partner. EIA can’t keep a beat. The guy running it, was going to eliminate it in one of his Presidential debates, but he couldn’t remember its name. Still forgetting stuff. He thinks that SA and Russia oil additions are going to take care of Iran additions. He forgets that they are only trying to make up for existing OPEC losses. He forgets that the Permian has logistical constraints, and they are still projecting oil additions to it for 2018 and 2019, of which, more than one million barrels a day will not make it out of the ground in time for 2019. The world believes that organization, and they will get an unjust penalty for doing so. Peak in 2042 is really, really dumb. The Permian peak has a two year hiatus, but US will peak by 2024 to 2025, maybe sooner.
Every time I try to convert your tons to barrels for the US, I get too many. 59.9 billion times 7 is about 419 billion barrels of commercially recoverable in the US? Rystad recently had a dream we had 310 billion barrels. 79 years of it. I really don’t think so. If I tried to imagine hard with some good smoke, I could go 100. But, what’s the difference? It’s only numbers.
“Dumb” or not, peak in 2042 is what EIA is currently projecting
It does no harm to know what the “mainstream” institutions are thinking
It’s obvious that you put a lot of thought into this paper. I am only trying to offer constructive comments, though “dumb” should never have been used. The EIA has some good points, and some bad points. Accumulation of monthly production reports are good. They rely upon a large source of external information to get there. Projections are their weak points. Very weak. Drilling productivity reports belong in the garbage. Dennis has posted a projection on US shale which was good. I would not, personally use EIA as a projection source on which I based my conclusions on. Reference for mainstream, OK.
It would be useful if you split crude oil and NGL when you estimate emissions. I use refinery runs to calibrate the NGL out of the total figures, then account for plastics and asphalt, which leads to lower emission totals. Don’t forget the BP oil figures do include NGL (to an unknown extent).
As people who work with this kind of data know BP always report “oil production” as crude oil and NGL. There is no separate data for crude oil or NGL
EIA does report crude oil plus condensate and NGL separately, but in barrels only, not comparable to BP’s data, and (I think) for period only after 1980
One universal truth for empirical study is that you have to live with the less than perfect world (and data)
Maybe you should footnote your answer. I notice that NGL production is growing at a faster rate than crude and condensate. This is reasonable when we consider that LTO is overloaded with NGL, and that many regions are now processing gas in cryogenic plants.
Fernando,
Yes NGL is growing faster than crude, but eventually Natural gas and NGL will also peak and decline. My medium natural gas scenario results in a URR for NGL of about 300 Gboe. So my “medium” scenario has about 3700 Gboe (505 Gtoe) for C+C+NGL.
Scenario below has World C+C+NGL scenario in Mtoe/year), peak is 2027 at 4682 Mtoe/year (or 94 Mboe/d).
I don’t think the peak or peaks matter so much as when we cease to have enough cheap energy to support the global system we currently have created over the past 200 or so years, which is a result of growing fossil fuel supplies more than anything. It’s possible we are already past that point or, if not, soon will be.
I recently read a book called ‘Scarcity’, quite short though, ironically or not given it’s subject matter, could have been shorter. It presents many examples showing that as we experience shortages of resources – money, time, health etc. – we make increasingly bad, usually meaning more short term focussed, decisions. I don’t remember them going into the reasons so much but I think one explanation is that those bad decisions made now were actually the best choice in our environment of evolutionary adaption as small nomadic tribes in the African Savannah (and that would mean the only chance not to make bad decisions is not to have scarcity, and we’ve got as close to that as we are now likely to get).
Despite our overall wealth there is plenty of scarcity in OECD countries with families holding three or more jobs and still living pay cheque to pay cheque. Real shortages have been growing or covered over by increasing debt, but virtual or perceived shortages engendered by SmartPhones, social media and the advertising industries have been going exponential. Perception of conditions relative to current surroundings or history is what mostly influences behaviour, not absolutes. Therefore, I think as things continue to decline personal, local and global decision-making will deteriorate and considerably exacerbate the problems, and we won’t be getting nice exponential decay curves but extreme volatility and variation both over time and location, with little chance of recovery from each successive dip.
The other reason fossil fuel peaks might not matter is that it looks increasingly like we are past the threshold where tipping points kick in and climate change enters runaway, or at least past the point where the human race is going to choose to do anything meaningful that might prevent passing there eventually. Carbon sinks are turning to sources, ancient carbon in permafrost is starting to be released, the melting of the Arctic ice, currently only about half way complete, is already causing weather disruptions that are becoming increasingly chaotic. The collapse that will come with a 3 or 4°C warming (or more) is going to make an oil peak look like a stroll in the park on a balmy spring day. It might not happen this century but history doesn’t stop at 2100, although if Trump or somebody worse gets elected next time, which is not unlikely given scarcity based decision making, maybe it will.
ps – your English is better than my Spanish, the best I manage is just go backwards and forwards on google translate and then give up. Good luck in the World Cup – I think Uruguay is the country that has consistently punched highest above it’s weight in international competitions given it’s population.
George K said “I recently read a book called ‘Scarcity’, quite short though, ironically or not given it’s subject matter, could have been shorter. It presents many examples showing that as we experience shortages of resources – money, time, health etc. – we make increasingly bad, usually meaning more short term focused, decisions. ”
I would like to add that due to the extreme polarity of the two party system in the US the decisions on the national and sometimes state level are similar to the decision making of of a person with bi-polar disorder. Sometimes the decisions are OK (remission), sometimes they put off or ignore making decisions (depressive state) and then the manic state where they run rampant making numerous harmful decisions.
Here in the US we seem to be in the manic state after having a remission/depressed state for 8 years, after a previous 8 years in the manic/depressed state.
Recovering from the manic state harm and ignoring state is touch and go and usually is a descending downward spiral.
So how is Britain doing?
Lengthy and detailed.
2021 if the EIA “estimate” is correct about how much the US can expand production (Permian overcoming all peak/declines and to that degree???) and the various NOCs aren’t lying seems about right. Evidence has been good everyone else is tapped out and China’s declines will be large in % and large in aggregate.
The unanswerable question is what the real reserve numbers at the Gulf NOCs and Rosneft are.
Yes, even assuming EIA is “correct”, it turns out world oil production might still peak in 2021
I will show these next month
“Yes, even assuming EIA is “correct”, it turns out world oil production might still peak in 2021”
Interesting, since 2021 or 2022 is when every US Federal tax dollar will be need just to service the debt & entitlements. If I recall correctly 2021 is the year when the most (peak) Shale debt comes due. If 2021 does become as Peak Oil production, than the world is going to be filled with a lot of unhappy campers around 2022-2024.
Of course a global recession could mask peak Oil production, or postpone it a bit if the recession is deep enough to impact global consumption.
Dennis Coyne Wrote:
“My guess for Oil peak is 2023 to 2027, though possibly a plateau might be maintained from 2024 to 2030. We don’t have as good info on coal or natural gas”
Coal & NatGas don’t have the same impact as Oil, since Oil is the primary transport fuel source. It is not as if 1.2 Billion vehicles on roads today can be converted to burn coal, natgas or electricity, or converted\replaced fast enough to avoid declining production. All that infill drilling is likely going result in significant production declines in the future. Perhaps it would have been better if infill drilling was never used, global Oil Production would have probably peaked in 2005-2008, but the decline would have been considerably less, and it may have the kick in the pants for the world to get serious about migation.
Techguy,
Oil prices will rise and consumption of oil will adjust to available supply, the 1.2 billion personal vehicles turn over at about 75 million per year as old cars get scrapped, so about 16 years to zero ice vehicles if 100% of new cars were plugins, probably a realistic estimate might be 25 to 30 years to reduce fuel for personal transport to zero.
If there are 1.2 billion personal vehicles in the World and the average fuel economy is 20 MPG and average miles driven per year is 12,000, then those cars use 17 Gb of gasoline and diesel per year. In 2017 the World production of C+C was about 30 Gb and roughly half (57%) this volume was consumed by personal vehicles under these assumptions.
I agree coal and natural gas won’t impact transport very much, but they are used to produce a lot of electricity and that is important as well. That issue can be solved as wind and solar output increase.
The cost of materials to make batteries will go through the roof. I’d better work on a project to make biodegradable batteries from sugar cane bagasse or something similar.
Fernando,
As costs rise, more supply may become available as more mines may be opened and more technology applied, also more material will be recycled and in some cases substitutes may be found.
Dennis Coyne Wrote:
“As costs rise, more supply may become available as more mines may be opened and more technology applied”
Doubtful since the Debt Tsunami is going to hit. We are already seeing cracks in the debt market start to emerge. The Debt issue is going to become much more of a problem by the 2020s as boomers retire and start drawing down on entitlements, pensions, and Healthcare services.
All that extra mining & refining will need more energy inputs. Energy inputs is probably about 1/3 the costs of a battery, since it takes a lot of energy to mine, refine, assemble Lithium batteries.
If I was a betting man, I would place my bet on a long term recession\depression. People will simply to reduce consumption & living standards once energy costs rise.
Of course usually declining living standards leads to riots, revolutions, totalitarian gov’ts and more wars. Pretty much the what happen between 2008 & 2012 when oil prices were above $100/bbl.
Techguy,
A recession is certainly possible and I think likely by 2030-2035 if my peak oil scenario proves correct.
I don’t see the debt problem that others imagine at this point. There will be enough energy, prices will adjust to allocate scarce resources efficiently.
In addition, there will be a lot of opportunity for innovators in the EV, battery, solar, wind, and net zero energy home businesses. Also rail, light rail, building walkable neighborhoods, HVDC transmission are other opportunities.
How it all plays out is difficult to foresee.
Haha, battery prices have crashed with no bottom in sight and you are predicting they will “go through the roof” based on zero evidence.
The beauty of the circular economy is that you never run out of resources because you reuse them.
Hi Minqi,
The EIA’s tight oil projections are likely to be too high by about a factor of 2. if we assume a linear decline from their projection in 2050 for US tight oil over 10 years, the URR for US tight oil is about 100 Gb for the EIA’s AEO 2018 reference case (using EIA’s tight oil estimates for Jan 2000 to Dec 2017 and the projection from 2018 to 2050.) A more reasonable estimate is about 50 Gb for US tight oil URR. Remember that economists t the EIA often assume technology will allow more to be produced whereas the geophysicists at the USGS realize there are physical limitations on how much oil is likely to be produced. I go with the physicists’ estimates at the USGS over the economists’ estimates at the EIA, every time.
The technically recoverable resource(TRR) estimates for US tight oil from the USGS are about 38 Gb for Wolfcamp and Spraberry in the Permian basin and North Dakota Bakken/Three Forks, David Hughes (in Drilling Deeper) has estimated about 8 Gb for the Eagle Ford for a total of 46 Gb, other US LTO plays might have another 10 Gb of TRR. When realistic economic variables are applied (well cost, oil prices, taxes, and operating costs) the economically recoverable resources are reduced to about 90% of the TRR even under a high oil price case where oil prices reach $150/b by 2025 and remain at that level until 2045 before declining gradually to $60/b over the 2045 to 2060 period (assuming substitution of other means of transport for ICE vehicles).
The recovery limits are set by petroleum engineers and geoscientists (also known as humanity’s best friends), not physicists. I’ve never allowed one of those guys to enter the secret rooms where we do that kind of work.
Mostly they are set by politicans, banks and investors (+ silly money) how much they want to invest / throw out of the window.
There must be oil – but the decision if we drill this tier 3 tight oil field or the remote deap sea oil patch depends on money and politics.
Venezuela could produce more than 5 mb/d – with money and other politics. The stuff in the ground is there, and the engineers could be paid to get it.
Fernando,
The technical knowledge to recover the oil is in the hands of engineers, geophysics is the basis of geoscience, and my guess is that petroleum engineers know a fair amount of both physics and geophysics.
The point was mainly that physical scientists (which would include engineers and geoscientists) probably have a better handle on how much oil will be recovered than social scientists (such as economists at the EIA), or in my opinion that is the case.
Dennis, thanks for the comments on EIA
I think I tend to agree with you and I also trust David Hughes’ analysis
But as we know very well, in past Hubbert linearization tends to underestimate the URR and make premature peak oil predictions. So I think it does no harm to err on the conservative side.
Again, if EIA does substantially overestimate the shale/tight oil, that would reinforce the case that world oil production is likely to peak in 2021 (or earlier)
Minqi,
I agree Hubbert linearization tends to underestimate, that’s why my Low case for oil is based on Hubbert linearization, my high case is based on USGS estimates (which may be high for the World due to optimistic reserve growth estimates) and my medium case is in between.
My best guess remains about 2025+/-2 years for peak C+C output, if NGL is added (consistent with your analysis), it would probably be 2026+/-2 as rising Natural Gas output will increase NGL output.
Chart below has an oil shock model scenario based on 2800 Gb of conventional C+C, 500 Gb of extra heavy C+C (Canadian oil sands and Orinico belt), and 100 Gb of C+C from tight oil.
Interesting how a number of car manufacturers are planning on having a large number of EV models available around 2023, similar timing for peak oil. Coincidence or planning?
Gonefishing,
They must be reading POB. 🙂
Could be. Otherwise why the rush?
Toyota has been taking it’s time developing full EV’s even after it’s Prius success. However, even they announce at the end of last year they will have 10 full EV models available in the early 2020’s.
Could be smarts, could be just staying with the competition. Either way, it works out to have models and production ramped up during a high oil price period.
Hi Dennis,
A rough calculation suggest that your model of 3400 Gb of crude corresponds to URR of 466 billion tons, which is similar to my URR of 468 billion tons (though mine is for crude plus NGL)
I was actually looking for your post including that graph above but cannot locate it. Can you share the link here?
Minqi,
It was just a comment not a post.
It follows the reasoning of the post below
http://peakoilbarrel.com/oil-shock-models-with-different-ultimately-recoverable-resources-of-crude-plus-condensate-3100-gb-to-3700-gb/
The difference is that I have separated out both tight oil(LTO) and extra heavy oil(XH) from conventional oil.
Also it uses a separate fallow, build and mature stage with each set with an average time of 13 years (using a maximum entropy probability distribution) applied to conventional C+C (or C+C-XH-LTO).
When C+C+NGL is considered, my scenario has 508 Gboe of C+C+NGL.
Hi Dennis, you meant “5080” Gboe?
Sorry, no I meant 507 Gtoe for C+C+NGL URR for the World. 508*7.3 b/tonne=3700 Gboe. So it should have been tonnes not barrels. I have NGL URR at 300 Gboe or 41 Gtoe.
Professor.Well, it would (2021) except we have an extended hiatus on Permian production. I’d give it 2023, at least.
That’s possible.
Again, my purpose is not to show that I have any particular insight regarding the future (which I don’t)
All I want to do is to demonstrate that given a particular set of data and given a set of clearly laid out assumptions, we can say some thing like, if these happen and if these trends continue, the following will happen.
Another purpose of this study is to illustrate clearly the dilemma/incompatibility between economic growth and climate stabilization. Any delay in peak oil may be marginally better for economic growth, but it is always worse for the climate.
But I will argue that even with an “early” peak oil in 2021, it is virtually impossible to limit global warming to no more than two degrees.
Another purpose of this study is to illustrate clearly the dilemma/incompatibility between economic growth and climate stabilization.
That’s an assumption: it rests on the assumption that wind and solar power cannot replace fossil fuels.
Yes, I personally do not think wind and solar will ever 100% replace fossil fuels
But the current study has already projected a level of renewable energy consumption that is much larger than all the mainstream energy projections.
The projected sum of wind/solar, hydro, other renewables, and nuclear is about 47 percent of the world primary energy consumption by 2050.
The current world electrification index (see text) is about 43 percent. Even if we assume the electrification index continues to grow according to the trend (which may not, electrification seems to have stalled in advanced capitalist economies; and world average electrification has been driven by China and India), world electrification index by 2050 may be about 55 percent. So renewable/nuclear penetration will also be close to their limit from the demand perspective, even if we assume the electricity sector can be 85% decarbonized and the massive installation of gigawatts can be realized (without China’s building boom, given the kind of building pace you observe in the US, the projected 600 GW of wind/solar annual installation can never be realized)
Will have to encourage more nuclear power. I think building costs will cone down as the industry goes through a learning curve and we see smaller modular reactors evolve.
Minqi,
Never is a long time, but if we say “before 2100”, I would agree we probably won’t reach 100% replacement of fossil fuels (for energy use) by 2100, we may be at 95 to 99% replacement and might never reach 100%, but 99.99% will be close enough. 🙂
Often technology accomplishes some amazing things, so it’s difficult to predict what might occur.
Actually it seems the most important factor for future world oil decline is “the rest of the world”
Rest of the world, about one-third of the world oil production, peaked in 2005
Minqi Li Wrote:
“Rest of the world, about one-third of the world oil production, peaked in 2005”
Realistically Global Oil production probably would have peaked in 2005, perhaps late as 2008, without infill drilling and Shale. Post 2008, we were trying to maintain business as usual, by forcing fields output to remain steady even though they were past half-way depleted.
well-
It is unlikely that OPEC reserves are as high as given in BP Statistical Review. Jean Laherrere estimates that conventional OPEC 2P reserves are about 300 Gb less than the 1P reserves given in BP Stats, I think he is correct.
My guess for Oil peak is 2023 to 2027, though possibly a plateau might be maintained from 2024 to 2030. We don’t have as good info on coal or natural gas, but I think Minqi’s dates for those peaks are probably close. It is difficult to predict the exact shape of the output curve accurately, but if we put a 2 year window around Minqi’s estimate for coal, it may be about right.
The estimate for natural gas is similar to my medium estimate from 2015 (a peak in 2040) see
http://peakoilbarrel.com/world-natural-gas-shock-model/
I like Minqi’s estimate better than mine for peak year, say 2035+/-5 as my guess today.
See also
http://peakoilbarrel.com/coal-shock-model/
where I have a coal peak ranging from 2015 to 2045, with the medium scenario peaking in 2025, today I would guess 2030+/-5 for peak coal.
If we have a hot summer and a cold winter will we have a natural gas shortage next year?
Nah. You’ll just have to pay a little bit more for natural gas.
Flirting with low storage. http://americanoilman.homestead.com/GasStorageGraph.html
Hi Dennis,
As about peak coal, by the way, USA peaked in 2008 and China peaked in 2013. These are 2 countries with most abundant reserves in the world. Why this happened, is there any logical explanation? USA production went down a third from its peak.
The price of coal has gone up last 2 years. See:
https://www.indexmundi.com/commodities/?commodity=coal-australian&months=120
and
US coal share in electric energy production is still going down to 28%, as compared to about 40% ten years ago. Can you imagine US coal production rebounding for exports and americans making a fortune as coal exporters?
With respect to the Chinese coal, there is still a large degree of uncertainty. The remaining recoverable resources are still large. BP currently reports China’s coal reserves to be 138 billion tons. But if environment is not the constraint, the remaining recoverable could be well over 200 billion tons.
In Table 3, I did indicate China’s coal production peaked in 2013. But China’s coal production growth resumed last year and the grow seems to have accelerated over the first half of 2018. So I would not completely rule out the possibility that China’s coal production might again overtake the 2013 peak some time in the future
China is investing heavily in production of very large coal reserves in Pakistan.
For global export and Pakistani domestic use in industry, one assumes.
Eurasian belt and road expansion may bring new capital, new transport infrastructure, new coal resource exploitation.
China curtailed their coal consumption growth somewhat because they began to choke to death.
USA coal consumption peaked because of cheaper alternatives- esp fracked Nat Gas, and now wind/solar.
Thank you for the excellent presentation Prof Li.
Although Aleklett (those Swedish Uppsala people) does think the Saudi oil reserves are reasonable
Hey, if you can’t beat them, join them! 😉
https://www.theguardian.com/business/2018/jun/28/bp-buys-uks-biggest-electric-car-charger-network-for-130m
BP buys UK’s biggest electric car charger network for £130m
Erginbilgic said BP was doing more on electric car infrastructure in the UK than any other market, although the firm is also piloting chargers in Germany later this year.
The company said the rebadged BP Chargemaster would prioritise ultra-fast 150KW charging, which can add around 450-600 miles of range per hour of charging. That would mean a car such as Jaguar’s new I-Pace could add about 100 miles in 10 minutes
“I won’t slave for beggars pay.
Likewise, gold & jewels.
But I would slave to learn the way
To sink your ship of fools.”
— The Grateful Dead, Ship of Fools
The BP business model involves providing charges at cost to have customers stick around for 10 minutes to one hour, keep them consuming at the restaurant and convenience store, which will be expanded with more tables and other means to get fat profits.
Peak mining & implications for natural resource management
(embedded video, length 49:30)
Trends like this might hasten a push for driverless trucks.
https://www.washingtonpost.com/business/economy/americas-severe-trucker-shortage-could-undermine-the-prosperous-economy/2018/06/28/61c19e12-7595-11e8-b4b7-308400242c2e_story.html
Just give lots of these mexican migrants a driver education.
We have lots of truck drivers here in Europe, mostly from east europe. No natvie people do this anymore, since the wages are deeper down than for serving burgers or cleaning restrooms.
I think driverless is a bad, bad idea. But, only enough deaths will change the supposition that is wave of the future.
I agree Guym. I maintain that driverless should first be fully tested on closed, or semi-closed, rule based systems, such as railroads and commercial airways.
Level 5, fully autonomous, for trains should be simpler than the ‘wild west’ of the open road. And yet it remains relatively uncommon and tends to be used only on small rail networks that are isolated from the main network. Often cited is the argument that signalling is too expensive if ‘SPADs’ (signal passed at danger) are avoided by full automation. Well that’s good to know.
If the software and hardware needed to run an autonomous railway, where you know the position and speed of every train, and the state of every switch, is not today a comparatively straightforward exercise in logic, then I remain wholly unconvinced that it is sensible or safe to intend deployment of ‘intelligent’ vehicles onto road networks where almost anything goes. Roadworks, floods, ice, no road markings, potholes, poor signage, something falls out of the van in front – the list goes on and on. Ok, people make mistakes, but AI makes mistakes and no one can work out what went wrong or why.
And btw: they are a terrorists charter. A driverless delivery van turning up at a sensitive building or office – I think not.
Doubling or tripling Rail is the best option. Realistically just about all long haul transport should be handled by train, and reduce trucks to local delivery. The US had the best (or near best) rail system prior to 1960s when rail beds were replaced with freeways. You can beat rail for efficiency and speed. Even if trains are manned. one or two train operators can transport the same amount of goods as hundreds of trucks.
I would say prior to 1945.
They were taken down– LA had one of the best rapid transit systems around.
My father used to go from San Gabriel to the beach on the trolly in LA in the 1930’s.
We need to upgrade to a third world status in the US.
There is all this talk about electric cars and lithium batteries, and still some are able to overlook that electrifying and upgrading the rail network to haul more sets up for very efficient use of electricity. And indirectly will reduce oil consumption as well. When lack of transportation fuel starts to hurt then big changes will most likely start to occur; the low cost per kg of rail transportation and shipping will make key harbours and locations connected by railway more attractive. To secure access to relatively cheap power and transportation will be even more important for the industry than today; some will be forced to shut down or relocate because of a bad location.
We kill around 40K persons per year in the US using non-driver less technology. That should be enough deaths to think that maybe they might be a better way.
You can prevent deaths if you want to.
https://eu.freep.com/story/money/cars/2018/06/28/suvs-killing-americas-pedestrians/646139002/
The reason there is so much mayhem on America’s streets is that nobody cares.
People don’t want to be haul truckers anymore because the compensation has been driven so low it in no way justified the lifestyle costs. Those who do already have CDL are getting jobs with local construction (this is advertised nonstop in growing metro areas) or fracking trucks (which DO pay well). OTR trucking pay may sound decent at first but there are huge out-of-pocket costs from traveling all the time, physical costs (sitting all day in a cab isn’t good for you) and family stress. OTR should pay more like what offshore oil or other encampment work does.
It’s another thing to file under “I don’t pay my workers why do I have a labor shortage.”
So, we should have fleets of driverless tank trucks hauling hundreds of thousands of barrels of oil up and down the highways? Steven King would be given more to work with. Terrorists would love it.
“People don’t want to be haul truckers anymore because the compensation has been driven so low it in no way justified the lifestyle costs. Those who do already have CDL are getting jobs with local construction (this is advertised nonstop in growing metro areas) ”
Oil Patch truck drivers earn between $80K & $100K per year. Fleet truck drivers average around $70K/year. Median for all US truck drivers is about $40K/year & the Median salary for Construction Workers is about $33K/year.
I think the issue with the Truck driver shortage, is finding drivers that can pass a drug test, as most companies face drug use problems hiring workers. Some companies have abandon drug testing to fill jobs, but I believe the DOT requires drug testing.
The issue is that Boomers are retiring and Millienials don’t do blue collar jobs. To be honest, I rarely see an employed millennial outside of a retail job. This is going to continue to be growing problem as more boomers retire. Either the US is going to have to import blue collar workers or face permanent workers shortages for jobs that cannot be automated. The issue is that importing skilled\semi-skilled blue collar workers is going to also be a challenge since the rest of the industrial world has the same demographic problem as the US (or worse – Europe & Japan)
“The issue is that importing skilled\semi-skilled blue collar workers is going to also be a challenge”-
People would come here to work, if they were treated with respect and paid decently. Two big if’s. Especially the respect part.
I wonder when a combination of higher fuel prices and higher labor costs combine to raise trucking costs enough to negatively impact the entire economy.
Aerial ropeways: automatic cargo transport for a bargain
Cable Cars Are Changing the World
Image attached of various cargo/material aerial cableways in illustrative support of my preceding comment.
The data above largely comes from BP and BP just a few weeks ago said global consumption was up 1.8% and global production up much less.
Oh and heads up to the OP, BPs data for oil is all liquids. This matters. It’s not all transportation relevant, which is really all that matters (if you want to eat food that moves). So BP is presenting feedstock for plastics and fuel for cigarette lighters. They are consistent, but keep it in mind.
Projections are largely silly, of course. Consumption was larger than production last year. Drained storage? That’s a lot of storage. The 2017 difference in consumption vs production was 6 million bpd. Think about that, sports fans.
I do applaud the OP for using “consumption” and not “demand”.
The best projection is to ask yourself what happens when a country can’t consume the oil it needs to produce and move food because the oil is not available. But their neighbor did get enough to move food to the cities. What happens then? What’s that projection?
Hi, professor Minqi Li,
I noticed 2 errors in Table 1. It’s understandable that URR = Cum.Prod + RRR, as it is for all countries, except China and Brazil, where RRR and URR were swapped. With these corrections, the world RRR should be 277GT and world URR should be 468.3GT.
Thanks a lot. I will ask Dennis to correct them.
Thanks Alex.
Should be corrected now.
The EIA estimations for USA oil and natgas reserves are simply astonishing. It would imply that in USA there are oil reserves (RRR) for 105 years of 2017 oil production and natgas reserves would suffice for more than 180 years of last year’s production. Not only this, the estimations are made with less than 1% error ( 3 decimal digits ). What are they smoking?
Actually, the US “official” reserves are extremely conservative (only worth a few years of current production).
But that will not prevent EIA from “projecting” sustained growth of oil and gas in the future. The RRR listed in Table 1 and 2 are remaining recoverable resources implied by EIA projections (in the Estimation method, I wrote “EIA” not “EIA reserves”)
I guess about renewable energy that wind and solar energy should not be grouped together. Solar energy only is growing 40%/year for more than 10 years. As PV costs are going down, the trend is expected to continue.
Solar energy is already cheaper than coal! I guess, in these conditions, world coal production would go down very steep in a few years. It may be an energy disruption. I’ve seen recently a very interesting presentation by Tony Seba.
https://www.youtube.com/watch?v=duWFnukFJhQ
As about IEA or EIA predictions, he has a comment at 16:30.
Solar energy doesn’t work at night, and it barely works at all in cloudy weather. We need to invent a cheap battery or we are toast.
Fernando,
Tony Seba argues that cheap Li-ion batteries already exist, as the price for a battery pack is about 200$/kwh storage. Suppose such battery pack can be recharged only 5000 times, the price for storage is about 0.04$/kwh . It’s cheap already to use it from day to night, as the power leakage in batteries is negligible. The main problem remains from summer to winter. So, it won’t be rational to rely on solar power in Canada in winter.
But, suppose you have abundant solar power at 0.02$/kwh. You may use it to produce NH3 (fertilizers) , water desalinization where needed and even H2 from water, to be used later as fuel. The last proposal is most probably not economical, but only illustrates the range of possibilities.
“the price for storage is about 0.04$/kwh .”
Go price an offgrid battery bank using Li-ion or LiFePo and let me know if you still think they are cheap.
“But, suppose you have abundant solar power at 0.02$/kwh.”
Yeah, I am still waiting for Nuclear promise of “too cheap” to meter in the 1960’s to come true. Ditto for Fusion energy. Sorry to say: the only thing that is cheap, is false projections of cheap energy in the Future. If you find some old tech magazines from the 1970 when Oil crisis hit, or the early 1980’s you see the same silly projections of cheap energy from Solar, Wind, Nuclear, Biomass, etc. Nothing has change in the past 50 years and its not going to change in the next 50 years either. Better have a Plan B.
Go price an offgrid battery bank using Li-ion or LiFePo and let me know if you still think they are cheap.
What prices are you seeing?
I don’t believe Tony Seba. Saudi Arabia has magnificent solar exposure, they have a natural gas shortage and burn oil to keep their air conditioners running. The fact that they don’t build giant solar plants with battery back up tells me the combination doesn’t work for them. And if it doesn’t work in Saudi Arabia then it’s hardly going to work in Austria, Jamaica, or Pakistan.
Hi Fernando,
Except that they are. $200B in investment in solar through 2030, about 200 Gigawatts.
https://www.forbes.com/sites/ellenrwald/2018/03/29/saudi-arabia-to-build-massive-solar-power-installation/#61663f5577a9
They dont have battery back up. Those solar plants in the desert are intended to reduce oil use when the air conditioning load is highest.
I never wrote that solar power didn’t have potential uses in some cases. My point is that, without batteries, it’s limited and can’t replace fossil fuels or nuclear.
Of course Photovoltaics (and wind) are not feasible as stand alone productions systems for most of the world, requiring integration with other generation sources such as coal, nat gas or nuclear (and storage).
But the ‘renewables’, if deployed in vast capacity, can help make these peaking/expensive sources last longer before depletion, and/or keep the costs down. Not to mention choking to death on coal.
Why do people insist on thinking of these things in an all or none scenario?
Maybe the concern for some people is not ‘all or nothing’, but ‘all for nothing’, or ‘all for little’ (and compared with other options).
AFAIU, alternative energy requires mass buildout using fossil fuels (while maintaining economic stability) while adding new forms of toxins to the environment, etc.. Mass buildout at this late stage of the game seems ill advised.
We can extend these ‘peaking/expensive sources’ by simply using less of them (‘energy sufficiency’) and doing so is a bonus in that regard for the climate and ecosystem in general.
Installing solar power in vast capacity requires a very large capacity vault full of something valuable, like iridium, neodymium, rare earths, platinum, and excellent condition Playboy magazines.
Fernando,
Tony Seba argues that cheap battery storage is already disrupting electricity power peakers. See in his presentation from about 20:00 to 30:00 .
I don’t believe anything Tony Seba says. I consider him a charlatan selling good news to naive followers.
Hi Fernando,
Some uses of energy such as for heat can be done during the day and water can be heated and stored and then recirculated at night, also the Wind blows night and day, hydro can be pumped during the day and then used at night, also energy can be moved east (in the evening) and west(in the morning) using high voltage transmission lines.
Another method would be to use excess solar during the day to produce hydrogen or ammonia to be used as a backup fuel at night or whenever needed, this is high cost, but perhaps similar in cost to battery backup.
If we’re talking daily storage, don’t forget pumped storage, which is cheap and proven:
https://en.wikipedia.org/wiki/Ludington_Pumped_Storage_Power_Plant
excess solar during the day to produce hydrogen or ammonia to be used as a backup fuel at night or whenever needed, this is high cost, but perhaps similar in cost to battery backup.
That would work, but batteries or pumped storage would be far cheaper, due to greater efficiency. H2 or ammonia would be perfect for seasonal storage, where capital cost is critical, and efficiency is unimportant.
it is very high cost (compared to today’s numbers for hydrogen production). You will not be able to sell that hydrogen or ammonia on the grid but rather have to eat the high cost and burn them locally for power during the night.
Yeah, no one’s suggesting using H2 or NH3 for daily backup – you’d use it as “wind-gas” during seasonal lulls: perhaps a 2 week period in January when wind and solar are low. You’d generate it asymmetrically: a relatively small amount of electrolytic capacity working most of the year, with very, very cheap storage (underground, for H2). You could keep costs down by using cheap generation: ICEs or single cycle turbines instead of fuel cells.
Even so, it would be a last resort: you’d go first to imports from long distance transmission; demand side management; maximum use of overbuilt generation; etc.
Actually, the wind doesn’t blow night and day. It has a bit of a pattern but it’s erratic. I live very close to the beach and watch the ocean all day, can watch the way the waves are oriented, feel the wind coming from different directions (my condo is at 28 meters elevation), check the Spanish grid performance once in a while, etc. And I assure you, in summer we usually get a dead calm from 9 AM to about 2 PM, and then we get odd bursts. The wind picks up as the sun is falling, then it dies, and we get a reversal in the middle of the night, with a short lived breeze towards the ocean (and sunrise).
Dennis, as an example, perhaps you could also use your car less often and/or offer it to others, such as with regard to carpooling or neighborhood group errands and whatnot.
You have an EV, yes? If so, maybe you could help get others out of their ICE’s more often and/or whatever makes sense along those lines.
Right now, we are burning FF’s like there’s no tomorrow, and when I write like there’s no tomorrow, I also mean it in a way that is unconscionable, such as with regard to, say, the majority one-person-per-car traffic-jam rat races every weekday in assorted places around the globe, or the 1000+ mile imports of food that could and should be grown locally, and so on. Do you grow some of your own food?
This alternative energy debate on a site like this, if it is to be a quality site, appears to need to include other things than just switching to different (crony-capitalist) energy-technology forms– especially if these new forms are not going to quite cut the mustard and we are going to have to look more at the aforementioned energy sufficiencies anyway.
So we might as well start talking more about it, get that kind of narrative going and get used to it.
Dennis, Spain is already using hydro as a full back up for solar and wind. There’s some pumped hydro. Increasing the solar and wind contribution can’t be done unless whole valleys used for agriculture are drowned to use them for water storage, and there’s no water to store. So the idea just doesn’t work well. What you really ought to do is pick out some nations with a reasonable size economy, and try out your solutions on them. And you’ll see there’s a lot of hair in that soup.
Agree. Need cheaper/sustainable/recyclable battery to enable transition to higher degree of electrification of the system. This is a key ingredient.
Nissan is selling replacement batteries for Leafs at $118 per kWh. The insane prices for home battery storage is sheer rip-off, hit the top of the market strategy.
When one can get a week’s residential backup or three days of normal use for under $3000 there is no excuse left.
The prices for Tesla Powerwall systems is just for the rich and stupid at this point, while at the same time Musk claims he can make new batteries at under $100 per kWh. Laughing all the way to the bank.
The comparison between solar and coal depends on country. I think in China (which has both the largest coal installation and the largest solar installation), solar is still significantly more expensive (even without considering the effects of intermittency)
World solar boom has been largely driven by China’s massive installation, but this year (2018) China’s solar installation is likely to fall substantially compared to 2017 because of partial withdrawal of subsidies
Coal…in China…solar is still significantly more expensive
What costs are you seeing for coal and solar in China?
A back of envelope calculation:
1 GW of solar PV, building cost 6 billion Yuan (China’s construction cost is cheaper than in the US; in the US, this would cost about 2 billion dollars according to the EIA electricity market module)
Rule of thumb: annual depreciation, maintenance, interest, 10% building cost
Annual cost: 600 million Yuan
Annual Generation (15% capacity utilization): 8760 million kwh * 0.15 = 1314 kwh
Generation Cost: 600/1314 = 0.457 Yuan/kwh
1 GW of coal, building cost 4 billion Yuan
Annual depreciation, maintenance, interest: 400 million Yuan
Annual Generation (50% capacity utilization): 8760 million kwh * 0.5 = 4380 million kwh
Primary Energy Consumption (assuming 38% generation efficiency): 4380 / 11.63 / 0.38 = 0.99 million tons of oil equivalent = 1.98 million tons of Chinese coal
Coal Price: 500 Yuan/ton
Annual Coal Cost: 990 million Yuan
Total Annual Cost: 1390 million Yuan
Generation Cost: 1390 / 4380 = 0.317 Yuan/kwh
Minqi,
Your rules of thumb do not apply well to solar. Maintenance costs are far lower than for coal plants. In fact a big reason natural gas generation is less expensive in the US than coal is because maintenance costs are lower for natural gas.
In areas with a good solar resource (like the US Southwest) natural gas cannot compete with solar (newly constructed natural gas power plants), it is too expensive.
Also coal costs will rise as coal depletes and it seems you are leaving out the external cost of pollution from coal fired power plants. I imagine you are familiar with externalities.
Also is that capacity factor correct for China? In the US it is about 33% for coal powered capacity.
Strange, the NREL gives solar PV a 25% utilization factor.
What NREL reports is the theoretical utilization factor or what one might observe in the best sites.
I suggest everyone use the publicly available data from BP and do some easy personal calculation of the actually observed solar power utilization rates
Hi Minqi,
The capacity factor for Utility scale PV solar has been increasing see
file:///C:/Users/dcoyn/Downloads/utility-scale-solar-2016-slides.pdf
It’s gone from about 21% in 2010 to 26% in 2015 in the US.
It says the increase is due mostly due to tracking and better site selection. So if you want to have an even higher figure you’ll have to include tracking cost, and make sure the site has the right solar exposure. For example, it won’t work well in Congo.
I think they forget to factor dust, sand, bird poop, bugs, and other factors which get solar panels dirty. The solar panel wash water demand is so high that in Murcia the farmers are fighting solar industry proposals because they don’t want more draw and price increases.
Unsure what kind of space is underneath a solar panel, but it might be enough, even ideal, for some animals to find a home under. Biodiversity.
Some thoughtful kids might be inclined to throw some sticky bread crumbs up onto the panels.
I suggest you try to visit a large solar farm. They tend to be hot, kinda ugly, dark blue panels in row after row. We have some around here. If you look up Castalla and move NE, you’ll see a large white area, that’s the greenhouses where the veggies and fruit are grown. The solar panel farm is to the south of the greenhouses. I’m by the ocean, can see the greenhouses when I go to the supermarket.
I never have, they are unseen if they even exist around here in Nova Scotia, but they look that way by their pics.
I’ve also come across articles that talk about how much surface area seems to be ‘required’ (Saudi Arabia? Cities?) as well as WRT an apparent requirement to overbuild.
They’re supposed to become more efficient over time (although how far can efficiency gains and at this point be pushed?), but/so there are too many buts (as you write, hairs in the soup)…
I also have another related concern that’s been rolling around in my mind and that’s related to prioritization if the things are going to be built anyway, but will save it for a newer thread…
“Also is that capacity factor correct for China? In the US it is about 33% for coal powered capacity.”
Obviously the CF varies in different countries, e.g. we had in Germany in 2017, CF 75% for lignite power plants, 42% for hard coal power plants.
The capacity factor depends on grid design and politics. When we design for a stand alone system we usually seem to go for about 67%, but some subsystems can vibe designed for 50%. A factor lower than 50% implies that generator use is dampened by policy. I would suspect in the USA this is caused by natural gas and renewables. In the case of natural gas because it’s cheaper and cleaner. In the case of renewables because they are given priority access.
Historically, hard coal was mid-load power in Germany, therefore, most was switched off during weekends and public holidays.
Hi Dennis,
That 10% is depreciation + maintenance + interest
I suppose 5% interest rate is reasonable though there are reports the internal rate of return may be much higher (some people use 10%)
For solar, with 25 year lifetime, depreciation rate would 4%; with 30 year lifetime, it would still be 3%.
So depreciation + interest alone would be 8-9% of capital cost for solar
Coal maintenance cost is higher but depreciation would be lower (coal plant lifetime 40-50 years)
Also, there are reports that China’s coal plant construction cost is now down to 3,500 Yuan/KW, I have used 4,000 nonetheless
About capacity utilization, 50% corresponds to China’s current utilization level. I think, before 2008, US coal plant utilization used to be around 70%
A couple of problems with those assumptions. Capacity utilization is likely to fall as coal costs rise and coal power plants may not actually be used for 40 to 50 years because they will be shut down early because they will not be competitive with wind and solar power costs as they fall. Just look at the trends in coal power costs and solar power costs and it is fairly clear this will be the case, so that should be included in your assumptions about future capacity utilization as well as the life of a coal power plant, most reasonable analyses for solar power use 30 years not 25 and for coal use 40 years rather than 50.
I would say that once a coal plant is built the owner would want to use it as much as possible, even if coal costs increase. Of course, this may not happen in a grid where the system is being overbuilt and coal generated power is given a low priority for political reasons.
Conventional onshore oil output peaked in 1979. Conventional offshore oil output peaked in 2005.
http://www.theoildrum.com/node/7853
1979 was the year with the highest energy production per capita in all of history, not by chance. Also, not a coincidence, peak conventional oil was in 2005 (peak offshore meets post-peak onshore)
80% of world oil production is in decline: https://es.scribd.com/document/335917074/HSBC-Peak-Oil-Report-2017 (You already know this report, I know).
We´ve consumed 1.7 trillion barrels of oil since 1913 : https://www.theguardian.com/environment/ng-interactive/2015/apr/10/how-much-fossil-fuel-are-we-using-right-now
With all its limitations, I find this animation more useful than IEA data in tons. Oil was measured in tons in the 1850s when the first refineries went online, it´s been well over a century since then. The endless row of “tons of oil equivalent”, “all liquids”…has gone from annoying to worthless in my view. All made up stuff to hide the real situation and make it close to impossible to assess anything in a meaningful way.
So, what is exactly going to peak in 2021 or 2030 or whenever? A metric including anything from algerian light to corn ethanol? We´ve been through many peaks already.
The only thing that´s changed in the last 10+ years is the USA has gone from a Godzilla-size importer to a mammoth-size importer, at a cost, no doubt. World export capacity increased thanks to that, but it´s again as tight as can be. What comes next?
Regards
I just came back to the computer from a car accident, (fire dept). The guy looked into the sun and pulled right in front. never saw it coming. Peak oil (and collapse in general) are a little hard to predict the exact date because we a) don’t want to see / believe it will happen. B) we will do ANYTHING to extend / pretend. Even without knowing the exact date, understanding the role played by the sun and the other car is interesting. I think it is soon. m I think all the major forms of energy will peak in about the same time frame as they take down the wider system. mtc (my two cents)
https://oilprice.com/Energy/Energy-General/Can-Trump-Counter-Soaring-Gasoline-Prices.html
SPR only goes into the Gulf area. It would do nothing for the west and east coast. I can’t see where it would do anything for prices. Oil demand is global.
Trump can sign a presidential decree removing sanctions on Iran and asking them pretty please to try to go up to 4 mmbopd.
He may have to, once EIA finally admits it may have overestimated US production by one million barrels a day for 2018-2019.
Wow those peak dates are a bit suspect and highly questionable.
U.S.A 2042. Holy crap, really?
It’s what the EIA has on their site. You have to peruse it. It really is quite amusing. According to them, oil production will come out of the ground in relation to any statistic they propose.
I am very fond of this old graf.
The most significant stat here for me is the fact that my fellow Canadians consume energy at by far and away the largest rate of others on this planet. At 9.5 tons of oil equivalent per capita per annum, this is more than double most other ‘advanced’ economies. The implications of this for my country and its lavish lifestyle, in terms of peak and then falling energy production in the not-t0-distant future, is lost on most of us. We continue not just business as usual, but full steam ahead with little to no regard for what most assuredly is waiting for us just ahead: an energy cliff. As with Wile E. Coyote, we have run off the cliff and have yet to notice that the ground we think is holding us up has disappeared. The once small town I reside in, on the edge of the Greater Toronto Area, has embraced growth and pursued it with full abandon. We have gone from a smallish country town with plenty of farms and food production to an extension of the GTA, increasing our population at a rate of 10%/year over the past decade or more (and expect far, far more due to provincial growth mandates) and paving over more and more of Ontario’s limited arable lands to create a continuing spread of suburban homes. Infinite growth on a finite planet, what could possibly go wrong?
That is also one of the most interest facts for me
I was just listening to a podcast interviewing one of the authors of scientific papers that described the probable amount of migration and points of relocation over the next 80 years as sea levels rose. The number of people displaced would in total be about 100 million over that timespan.
It seemed a difficult problem to me until it dawned on me we face a much bigger problem each year as over 80 million additional people are added to the planet. That number completely overwhelms the migration problem due to sea level rise. The population increase all across the planet is the most difficult problem we have to face and the largest driver of development. It is a driving force for all the other problems and reduces the effectiveness of energy transistion and efficiency gains.
Of course having societies that are driven by money versus logic or reason is also a large problem,
I suppose you do realize that “societies driven by logic” have always failed, turned into dictatorships, created huge environmental damage, and are known for genocide, mass murder and war?
I guess someone like you might you call modern Scandinavian societies illogical then, eh?!
Of course I don’t realize it, I don’t deal in fiction.
Scandinavian societies have abandoned “socialist logic” (although they never did apply socialism as I saw applied in Cuba). That Scandinavian socialism the commies like to mention to scam people and take over government is a lie. Propaganda they use to sell Marxism, the most idiotic and evil idea to be invented in the history of the solar system.
Whatever your personal opinion may be, for the record, the Communist Party is a legally established political party in the USA. Has been for quite some time. Google it!
I never said the USA wasn’t loaded with stupid people. And evidently there’s a tiny group of incredibly stupid people who belong to communist, Nazi, and Insect Rights parties.
Yes, the modern Scandinavian societies (and Europe, in general) are illogical and increasingly so as time goes in. They have scattered ideas regarding biological reality, suffer from mass delusion and hubris, and are in population decline (except for immigration, which is another thing entirely) with increased indebtedness generally. The only thing keeping their current societal ideology afloat is 22,000 man-hours of energy in every barrel of (still cheap) petroleum, much as it is for the rest of the world. Once this goes away and reality re-asserts itself, Scandinavian countries will experience a most unpleasant wake-up call which will thoroughly re-align their expectations of what life in this world is about.
Let’s say, you Mike as typical US citizen suffer from stupidity and ignorance.
Social mobility is higher in Scandinavian countries, the social coherance is higher and these countrie are more future proof than the USA, take your blinders off.
OPEC set for one million barrel production increase
The Organization of the Petroleum Exporting Countries (OPEC) member states have agreed to increase the oil production by one million barrels per day from July 1, a decision reached at a meeting on Friday in Vienna.
OPEC member states and other world oil pumpers have jointly cut their production by 1.2 million barrels per day since 2016 to balance the oil market for 18 months. However, due to the limited productivity of some countries, like Libya and Venezuela, the actual production reduction has overpassed the agreed amount, lifting the oil prices to the maximum of 80 U.S. dollars per barrel from 27 at the end of 2016.
If OPEC, less Venezuela, increases production by one million barrels per day they will be producing even more than they did at their highest peak.
Let’s see what kind of expenses they want to lay out, so that they can get less per barrel.
Ron,
After looking on your last post on OPEC Production in May 2018, I guess most OPEC countries have no spare capacity, with the exception of Saudi Arabia and Kuwait, that stayed on their quota ceiling. Even UAE went down a bit. By the way, Iran is included in OPEC 14 Less Venezuela?
Oil prices went up today:
https://oilprice.com/oil-price-charts
Brent Crude is again over 79$/bl
Thank you.
By the way, Iran is included in OPEC 14 Less Venezuela?
Yes.
Trump wanted 1 million barrels, so they gave him 1 million barrels on paper. Looks tidy.
The traders don’t seem to believe it – Brent up 2% to almost $79.50. Maybe a couple of lines and some Cristal will calm them down over the weekend (or WD 40 for the non-humans among them).
A good range of options for them there :-). I suspect they will have some adrenaline to spare when outages arrives coming forward. With this razor thin spare capacity worldwide it is starting to look a bit like 2008 again.
Yesterday I heard that 20 to 40% of Venezuela’s skilled work force has already quit. I follow PDVSA offices’ Twitter accounts and see responses from field offices asking for food. In other words, workers are leaving because they aren’t getting enough to eat. I understand production in June is way way down.
EIA 914 survey: US crude oil production for April 2018: 10,467 kb/day down -2 kb/day from 10,469 in March (March was revised from 10,474)
https://www.eia.gov/petroleum/production/#oil-tab
The latest EIA STEO number for April is 10,630 kb/day
Baker Hughes weekly U.S. rig count, oil: -4 to 858 rigs.
Natural gas: -1 to 187
Permian: no change to 474
Eagle Ford -2 to 80
Williston -2 to 54
http://phx.corporate-ir.net/phoenix.zhtml?c=79687&p=irol-reportsother
EIA US monthly inventories of crude oil plus total oil products: down -2.7 million barrels in April month/month
Products, down -14.3 million barrels
Crude oil, up +11.6 million barrels
Not included, compressed gases: ethane, propane or butane, up +6.6
Not included, SPR, down -1.5
Charts on Twitter
monthly change https://pbs.twimg.com/media/Dg4VxOcWAAIFBeD.jpg
total https://pbs.twimg.com/media/Dg4WyrbXkAAgX_B.jpg
https://www.eia.gov/petroleum/production/
Ok, EIA monthly is out, and production is essentially flat. They are over on Texas production by around 70k, but not as bad as I thought. They were under on March’s Texas, as I had predicted, and they adjusted it this month. Month to month it only shows a 30k increase in Texas, and a 25k increase in New Mexico. I did note that George was correct, and GOM shows about a 100k temporary decrease. Bakken is up about 50k, which was reported previously. March hit the pipeline constraints of 3100k. April is pushing into the rail/truck constraint of about 150k. There may be some local refinery capacity, but you have to ask the simple question of, where were they buying it before? Is new oil going to supplant old sources, when you consider the previous sources had better API? Permian is unlikely to produce over 600k from the first of the year, until sometime late next year. That’s 600k in 2018 they will not get out of the ground per EIA projections, and, at least 500k for next year. We’re over one million short of expectations. Who cares about Iran, we are screwed, anyway.
Platts interview, Pioneer Chairman Scott Sheffield talks with Capitol Crude. Recorded before the OPEC meeting in Vienna.
https://www.platts.com/podcasts-detail/crude/2018/june/capitol-crude-062518
Yes, and there are a lot of inconsistencies in what he said. Remember, that Pioneer is not expected to come under any more constraints for the next four to six months. As they increase to their pipeline capacity, they are constantly kicking others off. They have a contract. He said the Permian is expected to add 1.4 million this year, but capacity, he stated, is 3.6. The capacity is lower than 3.6, but even if it was 3.6, it would only allow for a .8 million barrel a day growth, because the Permian was at 2.8 million the first of the year. That only differs from my estimation by 200k. It would not behoove him to indicate that the Permian was not set to grow. Remember, all Permian companies have lost billions since the news came out about pipeline constraints. Including Pioneer. I’d say his line of BS conflicts with April production reports. If the CEO of a large oil company’s lips are moving, he/she is not telling the truth.
I’ve come to the conclusion that the only way out for EIA is for a phase in of the drop. They may come out next time and say 200k is in question, and leave it that for a couple of months. Then come out with a 200k drop, and mention more may be in question. If I were doing the accounting for someone, and tried to hide errors of this magnitude, I would be staring through steel bars. The government can get away with it. It’s just a matter of convincing the rest of the world it is a gradually developing situation. After all, everyone in the world relied on their acumen. What economist would think to look at logistics? Then again, it is not only the EIA, it’s a lot of players. Conoco is one of the only ones that said I’ll wait the Permian out until transportation improves. Oxy is another, and their making free money on their pipeline contracts. On the other hand, Pioneer said we are going to sell all our Eagle Ford, and be a pure Permian player.
Libya outage update
2018-06-29 (Bloomberg) Libya: Force majeure at Hariga and Zueitina to cause loss of a further 350k b/d, leading to total loss of 800k b/d
2018-06-29 (Tanker Trackers) Three tankers were due to pick up oil from Sidra/RasLanuf but couldn’t. Only one of them (MINERVA LISA) is heading to Canada with (some) oil; but that oil was picked up from another vessel in the anchorage of Malta. A very unfortunate loss of revenue for Libya.
This Tweet: https://twitter.com/TankerTrackers/status/1012636439161470977
Wow! So, we have 320k from Canada, 800k from Libya, 300+k of Nigerian Bonnie Light off the market. Of that, only Canadian we are pretty sure is short term. Angola and Ven are to be offset by OPEC and Co, but we’re are not sure exactly when. Iran drop is unsure how much or when. The EIA is trying to keep a lid on about one million barrels that will never get out of the ground. Time to short oil price??
Well, I guess it might be, because Trump just said SA agreed to a 2 million increase, and analysts simply don’t have enough fingers and toes to count in millions.
Questions for Dr. Minqi Li
You said “Despite the rapid expansion of renewable energies, global energy supply and economic growth are expected to decelerate over the coming decades”
Not sure if you consider that a problem or not. I see the large energy efficiency advantage of renewables (PV and wind) combined with the high efficiency of electric motors allowing a much lower use of energy to achieve the same desired end. Also as the fossil fuel system is reduced, the large amount of energy to run it will not be needed. What is your view on the amount of energy needed in a mostly renewable world?
Do you see the potential of new automated/robotic methods of fossil fuel extraction extending the URR of the resources? As an example, machines can work in much smaller coal seams than men.
What is your opinion of methane clathrate as a potential fuel source?
As is shown in Figure 7, the current study projects that world primary energy consumption will increase from the current level of about 13.5 billion tons to nearly 20 billion tons.
Decelerated economic growth is not that much a problem for ecological sustainability (for that purpose, deceleration is not enough, we need de-growth) but is a problem for the stability of the existing world capitalist system. Again, even during 1913-1950 (with Great Depression and two world wars), world economy actually expanded at an average annual rate of 1.8 percent. So anything lower that for a sustained period would mean trouble for the system.
Minqi,
The appropriate metric is real GDP per capita. For 1970 to 2017, growth in GDP per capita was pretty steady at about 1.4% per year. Population growth will slow and will slow GDP growth even if GDP per capita growth remains at 1.4%/year, though as the world becomes more developed the rate will slow (some advanced nations have lower real GDP/capita growth than the world average.) Once population peaks in 2070 and then declines we will see a fall in real GDP.
Also I think your assumptions about how fast the annual additions of renewable energy capacity will reach a plateau is flawed. Keep in mind that oil and natural gas output grew at an average annual rate of 7%/year or more for 75 years.
In my view the focus should be on output rather than capacity and a scenario based on growth of wind and solar has 100% of electricity output from wind, solar, hydro, geothermal and nuclear by 2050.
Under that scenario and using mainstream climate science we may remain under 2 C above the pre industrial Holocene average temperature (10,000 BP to 1750 CE) using Marcott et al and Mann et al for temperature estimates.
Hi Dennis, you point about per capita GDP is well taken. Between 1913 and 1915, world average annual growth rate of per capita GDP was about 0.9%. According to the population projection used by EIA, world average annual growth rate of population from 2040 to 2050 will be about 0.6%, so if the economic growth rate slows down to 1.9%, the per capita GDP growth rate will be about 1.3%, not as bad as 1913-1950 but roughly comparable to the per capita GDP growth rate during 1973-1995 (a period that included stagflation, Iranian Revolution, Latin American debt crisis, collapse of Soviet Union). One major difference could be, this time, there might actually be negative growth in OECD countries.
You may have realized that compared to my previous projections, my current projections about wind/solar has moved somewhat closer towards your preferred scenario. In addition, the current projected renewable growth is probably close to the demand-side limit given plausible GDP/electricity demand by 2050.
I personally actually think my current renewable projection may prove to be too optimistic and China’s solar installation may slow down significantly in the next few years.
So on that let’s agree to disagree and watch how the events play out in the coming years.
Minqi,
On demand for electricity, there may be faster demand growth due to increasing use of renewable energy and heat pumps.
Also keep in mind that the actual exergy utilized is only about 38% of primary energy (probably less because average ice efficiency is only 30% or less and there is a huge amount of energy used in the production, refining and distribution of oil, coal, and natural gas.
Wind and solar have close to zero thermal losses, if we assume energy used to produce and distribute wind and solar are similar to fossil fuel (in reality it is probably far less), we would need at most 38% of the primary energy produced by fossil fuels in a wind, solar, and hydro focused energy regime. So total primary energy needed may be far less in the future for energy consumed per unit of real GDP produced.
This makes the task of replacing primary energy produced by fossil fuels much less difficult.
Using heat pumps instead of thermal solar collectors is a waste of money, electricity and one more addition of expensive high tech complication to compensate for inefficiencies. Thermal solar is at least 70 percent efficient at the collector and the heat can be cheaply stored for days or months making it mostly independent of weather and day/night cycles. Summer light energy can be stored for winter, plus it provides hot water too.
None of these work well if the building is not well sealed and well insulated, another big area for jobs.
“Using heat pumps instead of thermal solar collectors is a waste of money, electricity and one more addition of expensive high tech complication to compensate for inefficiencies.”
That is nonsense. The efficiency of solar collectors and PV in centeral Europe is piss poor in winter, HPs are much better.
Hi Gonefishing,
There was a guy at the oil drum named Ghung who was very familiar with both thermal and PV solar ( he had both).
I believe his claim was that PV costs had fallen so low that it made more sense to use PV and a heat pump water heater to heat water from a cost perspective. I agree heating and storing water is a good strategy, heat pump technology is not that exotic and pretty ubiquitous in some future Mad Max World maybe thermal solar water heating would be the better option, but today from a cost perspective Ghung may be correct.
Have you run the numbers for commercial products?
Most people are not going to build this stuff themselves.
Also note that for building heat, I am assuming first that the building envelope is tight and that proper levels of insulation are used. In addition as much solar collection as possible should be done with passive solar. Water heating might be cheaper with PV solar plus heat pump and a large well insulated water tank to store the heated water to be recirculated through radiators or baseboard at night (with batteries to drive the circulators) might be one way to go.
That will raise a number of accounting issues.
We can certainly count wind/solar by their electrical energy content (not by thermal equivalent)
But in that we the wind/solar share in the current world primary energy consumption would automatically be reduced by 60%
On the other hand, if we keep counting wind/solar by their thermal equivalent, that result in an automatic accounting energy “loss” by 60%
I don’t know which of the two approaches would be better. But at least we want to be consistent. So for now I just follow the BP definition for convenience.
Under this “convenient” approach, it is obvious at least in some cases, say, transportation, the electrical energy required to do the same transportation work (say, via EVs) will be much less than fossil fuels. The average ICE efficiency now is perhaps 30-40% (though some may be 50%) and I think electric motor efficiency is about 90%. So replacing ICE by electricity will save the “final” energy by 60-70%. But once you count the electricity by their thermal equivalent, the “primary energy” required may not be that much different.
I don’t know well about residential heating. But if you replace household heating by gas/coal by electricity, I doubt there will be much efficiency improvement. In some places direct solar heating/cooling might be sufficient, but for places like Russia/Canada, gas/coal may be essential for survival.
Minqi.
If we do everything in terms of exergy the shares remain the same.
62% to 70% of primary energy is wasted as thermal heat that is not put to any use. With wind and solar most of these losses are eliminated so less exergy needs to be provide by wind and solar.
In 2017 15639 TW-hours of electricity were produced from coal and natural gas, which is 56299 EJ of electrical energy. If we assume 38% efficiency on average, then 148156 EJ of coal and natural gas were used and 91857 of this energy was just thermal loss. Total coal and natural gas consumed in 2017 for all uses was 164496 EJ and 90% was for electricity production.
If all of the electricity had been produced by wind and solar only, the 62% thermal losses would be eliminated and about 92000 EJ less primary energy would be needed.
A similar exercise could be done for oil where about 70% of energy is lost through the inefficiency of internal combustion engines, moving to EVs suggests of 110000 EJ of oil consumed in 2017 only about 33000 EJ was useful energy and 77000 EJ was thermal losses in combustion. Aadding the coal, natural gas and oil thermal losses together we get 169000 EJ of wasted energy from a total of 275000 EJ of primary energy provided by all fossil fuels in 2017. Only about 89000 EJ of useful energy (exergy) was provided (about 32.3%) by fossil fuel primary energy.
Reduction of thermal losses by minimizing combustion of fossil fuel as an energy source will provide large reductions in societal energy needs.
Denis, your optimism is admirable but unrealistic. Those solar panels require huge amounts of mining/processing to obtain the rare earths used in their construction, to say nothing of the inclusion of more common materials that must be processed for their fabrication. The energy input for PV construction is something only petroleum can provide. It will never be the case where the output of one PV cell can be used to manufacture another PV cell. i.e. EROEI = 1.0
Likewise, it will never be the case that the output from one windmill can be used to make another windmill i.e. EROEI = 1.0.
For our modern society to continue as it is, we need petroleum-provided EROIEs of 1:100 such as what was available back in the early 20th century. Those are dropping to about 20:1 now, making the sustainability of the current modern industrial build-out to come into question. This current iteration of society, founded on formerly incredible EROEIs available only from liquid fuels, will not be realized with PV or Wind, although I guess possibly it could be done for a time if nuclear power is also included in the mix.
I am also incredulous at this belief that solar and wind costs must drop over time. Is this expectation drawn from what happened with computers and cell phones? Why must the developments in that area also apply here? Are advances in data processing the same thing as advances in energy production? If so, why so?
And in general, what is meant by a price drop? Does that mean that the cost of PV/Wind increases less than inflation? Or actually goes negative relative to inflation? If so, why so?
In the case of decreasing cost, value perceptions and attendant market realities can result in the commodification of a highly technical product. Commodified products often end up on government support and subsidies (as is currently the case in many jurisdictions), resulting in an artificial cost structure/life support that would not survive in a competitive market.
“It will never be the case where the output of one PV cell can be used to manufacture another PV cell. i.e. EROEI = 1.0
Likewise, it will never be the case that the output from one windmill can be used to make another windmill i.e. EROEI = 1.0.”
These are stupid assumptions which lead to very stupid results. Get real.
Electrcity is the main source of PV production, each PV farm that is added increases the PV share. What is the issue? The same for wind.
If you think about fossil fuel in the construction of PV and wind turbines and the energy that is required to replace the fuel with syn-fuel, it is obvious, that PV and wind turbines can achieve this, it affect the EROEI not much.
BTW: NO NPP can be build at the moment with energy only from NPPs, but that does not matter of course. 🙂
Further considerations to: Energy Return on Energy Invested (ERoEI) for photovoltaic solar systems in regions of moderate insolation
…for ecological sustainability…deceleration is not enough, we need de-growth
Again, the ideas that a correlation between GDP and energy consumption can be projected far into the future (not to mention the assumption that Fossil Fuel is the form of energy that really works) is an unsupported assumption. It’s also a key element of a Fossil Fuel scare campaign: “you’d better let us Burn, Baby, Burn, or the economy will crash”.
In other words: “Nice economy you’ve got here. Be too bad if something happened to it…”
Hi Gonefishing, regarding your the other two questions, I don’t know well about robotic method et al enough to answer your question about its impact on URR. Dennis can probably better address it. But based on what I read from real experts such as Dennis and David Hughes, none of them mentioned this. So I suppose it will not be a significant factor. As optimistic as several mainstream institutions are (such as EIA, IEA, BGR), none of them discussed this either.
About Methane hydrate, that’s related to natural gas. IPCC and BGR (the German Federal Institute for Geosciences and Natural Resources) include that as their natural gas resources but not reserves. My natural gas study basically ignores Methane hydrate as none is currently under commercial development.
Since surface mining and some underground is going robotic already, it only follows that most mining processes will take advantage of increasing automation and AI in the near future making the process cheaper and resources more accessible.
https://www.technologyreview.com/s/603170/mining-24-hours-a-day-with-robots/
http://www.scmp.com/news/china/article/1598242/coal-tunnelling-machines-cut-mine-risks-also-threaten-pit-jobs
And from Wikipedia
Automation of underground works in China[edit]
German company «EEP Elektro-Elektronik Pranjic» delivered and put into operation more than 60 sets of advanced automatic control for underground coal mining for the period ~ 2006-2016. For the first time completely deserted coal mining technology has been used by the Chinese concern «China National Coal Group Corp. (CME)» at the mine «Tang Shan Gou» (longwall mining, shearers, three lava, depth 200 m), and at the mine «Nan Liang» (one plow, depth 100 m). Both coal mines have coal layer thickness 1-1.7 m. Monitoring the harvesting is carried out by means of video cameras (in real time with signal transmission over optical fiber). Typically, an underground staff is required to monitor the production process and for carrying out repairs. Automation has improved the safety and economic performance.[5]
https://en.wikipedia.org/wiki/Automated_mining#Automation_of_underground_works_in_China
http://evolution.skf.com/us/robots-in-the-oil-drilling-arena/
We already have iron roughnecks. Thus far they are only economic in deep water offshore rigs and other high cost operations. It costs a lot to keep those robots up and running.
Gonefishing,
It seems doubtful that power from coal will be cheaper than power from natural gas, wind and solar. There are some people that realize that carbon emissions are a bad idea, so coal mining to use for generating electricity is likely to stop as solar an wind become cheaper as they expand and we develop ways to deal with intermittency. The robots will be used for wind and solar, rather than coal.
Dennis, you need to consider times when energy is not plentiful. Will a country or business not use coal if it is locally available or importable? It will be a long time and a lot of capital to get solar/wind/storage in place. By then, unless the population collapses or there is long term global economic collapse, there will be at least 2 billion more people on the planet and 4 billion more that are living at a higher or high standard (more energy/materials). If there is long term economic collapse the PV and wind turbines will not be installed.
To think the transistion will go smoothly, evenly and completely is just a bit naïve. A more realistic transition involves a more erratic and incomplete transistion, but you don’t think that climate change is much of a factor so I can understand part of your viewpoint.
Spot price for Powder River Basin coal is $0.70 per million BTU which at 35% efficiency produces 100 kWh or a base fuel cost of 0.7 cents per kWh. That is the EIA 6/22/18 number. Transport could raise that by 50%. At a penny a kWh for fuel I don’t see why it won’t be used.
Also from the EIA
Coal mining productivity in the United States increased 26% over the past five years, reaching 6.8 tons per miner hour in 2017, up from 5.4 tons per miner hour in 2012, according to EIA’s Annual Coal Report and data from the Mine Safety and Health Administration (MSHA). Coal productivity ranges significantly across production regions, with productivity in the Powder River Basin far exceeding productivity in the Interior and Appalachian regions.
Rising productivity, low costs per kWh, many countries building new coal plants, how can one think this will end soon? That would entail a takeover of reason, logic and moral imperative on a global scale. What we have now is economic vectors and entrenched business positions.
“The robots will be used for wind and solar, rather than coal” Transformer robots, cool! 🙂
Gonefishing,
The point is that robots could be used anywhere to reduce costs, to assume they would only be used in the coal industry is a mistake in my view.
Why do you think there are very few coal power plants being built in the US? Coal is not the lowest cost source of energy.
The productivity is rising much faster in wind and solar industries than in the coal industry. Coal has been being produced for a long time, most of the innovations have been applied that are practical, PV solar and modern wind turbine industries are relative newcomers compared to the coal industry and there is far more scope for innovation and cost reduction as the industries scale up.
In addition, there are many places where pollution is a concern and many places where leaders are scientifically literate (unlike the US). Concern about climate change and pollution may lead to decisions to reduce the development of coal fired power plants and to retire many existing plants early as the cost of coal fired electricity rises above the cost of wind, solar, hydro, and nuclear power.
See Table 2 and Table 3 at
https://www.eia.gov/outlooks/aeo/pdf/electricity_generation.pdf
It’s OK Dennis, I too am a proponent of PV and wind. Just trying to add some reality to the situation. Messing up a percent or two of the Earth’s land surface versus the whole earth including the oceans is a no brainer to me.
I think robots will be used more in the production of PV than in the installation, though that will eventually change.
True though, and sad, the use of fuels hinges a lot on pseudo-economics.
Global coal production is still 1.7 times what it was in 2000, so when it hits those levels again and is still falling I will believe that coal production might be going away.
That could be decades or if we are lucky just one decade.
Problem with coal is that it can come and go with the times and the demand. Unless there is a global ban coal mining can rear it’s ugly head again and in a few years.
As far as the US and coal plant building, it’s not solar or wind that is stifling that. It’s a combination of cheap natural gas and increased environmental restrictions.
Gonefishing,
Currently I agree mostly cheap natural gas is killing coal, but in the best areas for wind (Great plains) and solar (southwest US), natural gas cannot compete, even with the low prices of today, which will not last. The pollution regulations on coal make it expensive and hopefully these will be put in place throughout the World.
The coal resource is not unlimited, if Australia and the US taxed coal production, it might reduce World wide use further.
Not likely to happen due to current lack of understanding of science in the US (not sure if this is also true in Australia).
Dennis
When solar produces no electricity at night, what replaces it? What is the cost of building and maintaining that replacement and have you added that cost to your calculation?
Dennis, there can be no valid tax on fossil fuels.
Compare the cost to the earth for renewable energy (not biofuels or bioenergy) to the cost of fossil fuel burning. The cost of renewable energy is about 1 percent of the land area and some money.
The cost of fossil fuel burning is high levels of pollution, at least one percent of the land area directly impacted and the whole globe devastated. Loss of plankton, loss of kelp, loss of coral, loss of fish and other sea life, lots of direct land and water pollution, air pollution, huge health costs, breakdown of agriculture, mass migrations, mass deaths across much of animal life and plant life, global destruction of infrastructure, wars over FF resources, water, food, etc., etc. etc.
Since money cannot replace species or ecosystems , the cost of burning fossil fuels is infinite.
We all know that carbon capture is not scalable or practical.
So until fossil fuels cannot produce pollution and not produce CO2 and methane, there is no real economic comparison. Anyone who shows an economic comparison is selling snake oil.
Interesting and useful historical data, but the projections are highly unrealistic.
First, the idea that wind and solar will be limited by land area, mineral resources, or by intermittency, is just…well, to be polite, I’ll just say highly unrealistic.
2nd, the idea that a current correlation between energy consumption and GDP growth can be projected forward for very long…well, that’s also highly unrealistic. Just look at flat oil and electricity consumption in the US, combined with economic growth. But, I probably shouldn’t even bring that up, because it’s made irrelevant by the first point:
There are no realistic practical limits to solar power, and we’re not especially close to the limits for wind power. That such limits exist is a key assumption to this set of projections, and would need evidence to support it, if it were possible.
“There are no realistic practical limits to solar power”
I disagree with this statement. First, the intermittency issue has by no means been resolved. It still needs to be tested what is the limit of penetration of wind/solar+battery in a electric power sector of a large economy.
Second, whether wind/solar can go beyond electricity is still unknown.
Thirdly, as a practical issue, we may not be able to use, say, more than 1-2 percent of the world’s land surface for wind/solar (considering that the total built-up land that human being have developed in the entire history has been about 2-4 percent of the world’s land surface area). That may theoretically allow us to use wind/solar generating a primary energy comparable to today’s energy (and in any case within the same order of magnitude). That will be large but not unlimited
I think we are in uncharted territory here.
Nobody ever used the huge desert areas until now – because there was nothing to use besides a little traffic infrastructure to cross them.
And now it’s the dream territory for solar generation – not just very cheap ground, but the best, too.
So it is possible to build big here. If there would b an oilfield streched over 300 x 300 miles, it would get explored, too.
Storing and transporting is the big next number in solar. We could build a giant solar farm with current tech and financing into a desert, but without any use setting 100 GW+ peak power into a desert.
You’ll need hundreds of thousands of workers with brooms keeping those panels clean. Those panels in the desert can’t be washed with water. I live hundreds of km from the Sahara, and we get quite a bit of dust all the way here. And that stuff is like sticky talcum powder, with an orangey color.
There are stone deserts – anyway better than sand desert.
And this problem isn’t something new – you can use people or high tech.
High tech looks like this:
https://techxplore.com/news/2014-04-negev-solar-field-water-free-robotic.html
Fernando- we can tell you are having a miserable day. Perhaps will cheer you-
a company with robotic PV cleaning service.
http://www.ecoppia.com/
So? You’ll need hundreds of thousands of robots which require electric power at night. This means you’ll need to add a battery storage facility. There’s also the issue of robot maintenance in a hot, very fine dust environment. This will require larger more sophisticated robots to do robot maintenance of the hundreds of thousands of cleaning robots.
Plus you still need people to shovel the dust and sand that piles up at the base of the solar panel, small trucks to carry the dust offsite, so that as soon as the wind blows it can return to the solar panels.
And of course there will be a need to have a maintenance robot human mechanic, as well as a human resources and a diversity and inclusion manager with an adequate number of robot bureaucrats who will be making sure the robots are adressed with the proper pronouns.
Arguing with a cornucopian is like trying to nail jello to a wall. Its not possible to reason with someone that is an idealist & lacks critical thinking. No matter what information you provide, they will suggest an unproven theoretical method that they don’t technically understand\comprehend to counter all reason.
Not saying there is no problem here. Its all got problems. Nuclear fuel rod replacement and storage, deep water Horizon explosions, coal dust lung, toxins from batteries, tanker train derailments, PV factory stream fish kills, and on and on.
But like these other problems, dust on the solar collectors will be dealt with to some degree.
btw techguy- if you think I’m a cornucopian, well, you really don’t know me do you. I’m far to pessimistic (realistic) to be be welcomed in that club. they kicked me out in 5th grade.
Dust on solar collectors is really a minor problem – railroads must be maintained, tires of mining trucks must be changed, pipelines rust and get leaks – it’s a problem of this kind, it can be dealt with, and it is already be dealt with.
India builds solar farms in the size of square miles into the desert – now, not in a distant future. They’ll get a solution.
It’s not the kind of problem as with fusion – which doesn’t work at all at the moment.
Or with solar storage – which only works in smaller scale, or is largely unproven (power to gas).
By the way, I drove today by the test course of electric highway for heavy trucks. They build 3 miles on an Autobahn (almost finished constructing) and will soon start collecting experiences.
The surface area of solar panels needed to generate one mw of power requires 120 cubic meters of fresh water per year. Therefore a 1 gigawatt capacity plant requires 120 thousand cubic meters per year. That plant generates with 35% efficiency in the Saudi desert. Therefore a plant to deliver 1 gigawatt must have triple the panel surface area, requires a huge set of batteries which have to be kept cool in underground bunkers. This plant will use 360 thousand cubic meters per year. Additional water is needed for the personnel living in a camp at the plant site. And the water source is desalinated water which has to be transported about 100 km. As you can see solar power even with robots will have significant operating costs.
1 gigawatt PV in desert can generate about
2 billion kwh per year , assuming 2000 hours
full capacity. Assuming a price of only 0.025$/kwh, that means 50 million $/year.
Even at exorbitant water price 0f 3$/m^3, the water would cost less than 2%. Have a water sprinkler on each pannel, to be operated before sunrise. Problem solved.
The US does not build many electric power plants every year
The US currently has a total generating capacity of about 1200 GW. Average capacity utilization rate is about 40%.
The US annual installation of all kinds of power plants is about 25 GW, annual retirement is about 10 GW, and net addition is about 15 GW
Ignore retirement and let’s say all 25 GW goes to solar (the US actually built 11GW of solar last year, but let’s be optimistic)
The US solar average capacity utilization rate is 18%, but let’s make it 20%
So 25 GW of solar is equivalent to 12.5 GW of average US capacity.
With the above assumptions, it will still take 1200/12.5 = 96 years for solar to replace just the existing electricity generating capacity in the US
That’s just electricity, about 40% of primary energy consumption or 20% of final energy consumption, not counting transportation, heating, steel making et al. And I have ignored “minor” issues such as intermittency, storage, et al.
If the US were to have a Soviet-style planned economy (the euphemism for that is WWII style mobilization), perhaps there is some hope. But you know the US politics.
Minqi,
Higher costs for coal and natural gas as these deplete will change the equation in the US, in addition as the price of natural gas and coal rise the cost of wind and solar will be falling.
In the US it is already the case that natural gas and coal and nuclear cannot compete with wind and solar in the best areas (Great Plains for Wind and South West US for solar), as the price of fossil fuel rises and the cost of wind and solar falls the areas where natural gas and coal are no longer competitive will gradually widen until they are fully replaced.
In addition as the coal and natural gas industries shrink they will lose their economy of scale advantage and basic costs will rise.
Hi Dennis,
My point is not about the relative competitive advantage between coal/gas on the one hand and wind/solar on the other hand.
My question is about, given the general environment of US politics/economics/society today, how many gigawatts of whatever type of power plants the US can build each year?
China can build so many gigawatts partly because of China’s massive building industry, partly because of the sweatshop approach of the Chinese industry, and partly because of the general absence of environmental regulations / “obstacles”; no NIMBY opposition. These are not the case in the US
US net business investment is only 2-3% of GDP, about 500 billion dollars. Out of that perhaps 30 billion dollars goes to the power sector. Unless these numbers are changed dramatically, even if all the investment in the power sectors goes to wind/solar, the overall picture will stay about the same for a long time to come.
Minqi,
Consider that natural gas is unlikely to remain cheap (I don’t believe the fantasy forecasts of the EIA) beyond 2030.
Even with the very low natural gas prices in the US over the last decade, consumption of solar power (TWhr from BP) in the US increased at a 45% rate from 2007 to 2017.
From 2009 to 2017 wind in the US only increased at a rate of 14%, US electricity generation has been decreasing so this explains the lack of investment as the industry has not been growing. Higher natural gas prices in the future may spur investment as wind and solar may be far cheaper than natural gas and coal.
Minqi Wrote:
“So 25 GW of solar is equivalent to 12.5 GW of average US capacity.”
Much less than that, if comparing Solar with a Baseload plant. In the US Solar provides about 5.5 of full power (convolution of total solar output Avg. for the entire CONUS), but even that figure does not include real world conditions such as dust\dirt, snow covered panels & maintenance. A realistic estimate or real solar option is 1/6 of nameplate output, 25GW of nameplate Solar ~= 4.1 GW.
Of course Solar\Wind need storage systems. Currently the most practical is pumped hydro storage, which has about a 50% efficiency rating. So if you want to storage 1Gwh you need to input about 2Gwh of power. Also Solar & Wind sources can be out of production for days, when a storm system moves in. Some storm systems can linger for days which reduces solar output to near zero until the storm finally clears. Wind power is usually seasonal, and even the best locations can have reduced output for days, if not weeks. All that power needs to be stored or generated using fossil fuels.
FWIW: I doubt see a future with Solar\Wind replacing most of the fossil & nuclear power generation. At some point country’s including the US will use rolling blackouts and people will have to make do with much less electricity. Nuclear is dead. With the Fukishima disaster and the huge cost overruns at the vogtle GA plant under construction, there is no interest in building new nuclear plants. We also face the coming challenge of spending hundreds of billions to retire existing nuclear plants.
There are big pending economic challenges ahead! Since about 2000, the world has doubled it debt and is rapidly approaching a demographic cliff, as boomers enter retirement. Most of industrialized world had made huge promises to the boomers in gov’t entitlements & pensions that were never fully funded. The ultra low interest rates has prevented pension funds to grow savings, and forced many funds to be invested in very risk investments (ie subprime debt). We only have a few years left before the debt and demographic problems become untenable. These economic problems will make it difficult, if not impossible to start any large scale mitigation programs. Gov’t will likely focus on short term demands (paying for entitlements & pensions) over any long term plans (energy needs). The Industrialize world has largely remained short term focused and avoiding addressing any serious long term issues.
Dennis Coyne Wrote:
“In the US it is already the case that natural gas and coal and nuclear cannot compete with wind and solar in the best areas ”
NatGas is cheaper than Solar & Wind, especially since Solar\Wind never includes storage. Just about every Watt of Solar\Wind power is backed up with NatGas turbines. Power companies always keep NatGas turbines spun up to adjust for intermittent drops in Wind\Solar (wind blows less or too much, or Cloud coverage for Solar). During the night, more NatGas turbines are spun up to replace 100% of solar production. In order to support more solar & wind, more NatGas power plants will be needed. NatGas plants are the only plant that can rapidly adjust to power level changes (ie increase or decrease). Coal & Nuclear have long ramp up\down times usually taking a hour or more. Startups for Coal\Nuclear take days. NatGas turbines can startup in about 30 minutes and can alter output in less than a minute.
The biggest risk is that we are using NatGas when it should be reserved for urban building heat and DHW. Large buildings cannot be readily convert to heat pumps. We are talking very large number of buildings that rely on NatGas for heating and Domestic hot Water. (DHW). Perhaps NatGas is cheap now, but will it be in 15\25\50 years?
Thanks–
While reality is often disturbing, it is the only path that gets one where they are attempting to travel.
Thirdly, as a practical issue, we may not be able to use, say, more than 1-2 percent of the world’s land surface for wind/solar (considering that the total built-up land that human being have developed in the entire history has been about 2-4 percent of the world’s land surface area).
Well, there’s always off shore. The following short video starting at about the 0:50 min mark to the 3:30 min mark, addresses the technological advances happening in off shore wind farms being built in the North Sea in the UK. Having personally worked on off shore oil rigs, I must say, if nothing else, the immense scale of those things is rather impressive, to say the least!
https://www.youtube.com/watch?v=HYr7aGf0-wA
Winds, Waves, Trash and Solid Batteries | Fully Charged News
Offshore also needs to be “built”
See the above on US building rate
“See the above on US building rate”
As long as the RE alternative is cheaper than NEW fossil generators the RE generator (PV, wind turbines) will be build, to increase production and provide O&M should not be an issue in developed countries.
To assume that the current PV and wind turbine manufacturing capacity is the limit is nonsensical IMHO. The natural life time of a coal power plant (40 years) is the longest period of time we will very likely see for the transition.
Storage demand can be minimised with more transmission capacity, which is not that expensive and only becomes pressing at very high (>60%) RE penetration.
Please check the EIA data,
I think the US has not built more than 50GW of new power plants in a single year for many years.
The limit is not the US PV manufacturing capacity. Chinese manufactures most of the panels these days. The limit is the US building/installation/grid connection capacity and the low net investment ratio in general.
American capitalists now spend perhaps 90% of their profits either for consumption or financial “investment”, leaving very little for plant/equipment/structures.
Usually, conventional capacity has to be replaced after 40 years, in future, the new capacity will be mainly wind and PV.
Are the USA able to replace a coal power plant with a CCNG at another site? If yes, I do not see your problem.
The other aspect is that in other countries this happens without huge disruptions. Globally, only the costs of new capacity is the real arguemnet IMHO.
Fred-
I’ve spent a bit of time on off shore oil rigs. It does open ones eyes——
I did my time on and under them too… 😉
Another note: my projected world primary energy consumption is NOT based on historical consumption trend. It’s based the projected production level from various energy resources.
In the section on main energy consumers, I did include some discussion about the projected energy consumption levels for China and India. I am not saying China’s energy consumption and India’s will exactly follow what is projected here. Nevertheless, I think it is still quite useful for people to find out if China’s and India’s energy consumption follows their historical trend, what will happen.
Hi Minqi,
A problem with the assumption that carbon emissions will equate to the amount that “is possible to produce” is that at some point the likely price trajectory of fossil fuels and renewable energy will result in a demand shortfall for fossil fuels. At that point your (and mine as well) projected production of fossil fuels becomes incorrect.
My guess is that the energy transition from fossil fuels to wind, solar, hydro and nuclear power will result in much of the projection after the peak, to be much higher than what is actually realized as falling prices for fossil fuels due to lack of demand will mean that much of the resource is no longer profitable to produce.
In fact after 2050 there may be a surplus of energy, but most of that energy (90% or more) will emit no carbon.
Carbon sequestration by reforestation and cement production that absorbs CO2 and possibly even the use of excess energy to remove CO2 through production of carbonate compounds may still be needed to keep the climate from warming too much.
This can be accomplished once we have eliminated burning of fossil fuel and wind, solar and hydro energy production are abundant. Energy efficiency and recycling of as much material as possible will also be needed to minimize environmental impact. Education and access to family planning services would also help with the demographic transition in combination with economic development of less wealthy nations (which tend to increase education and access to health care if done properly.)
In fact after 2050 there may be a surplus of energy, but most of that energy (90% or more) will emit no carbon.
Questionable statement there. Too many assumptions for my liking. I think most if all projections end up being wrong one way or another, thus is the folly of trying to predict the future. Too hard, too many variable factors, too complex.
Once i see cargo carrying ships and planes running on renewables or nuclear. I will change my mind. But until then the world GDP is entirely dependent on energy and trade (which is a byproduct of energy).
Iron Mike,
Perhaps ships and planes could run on biofuels, ships could also use nuclear or wind. In addition, notice I said 90%, how much of total primary energy do you believe is currently used for ships and air transport.
I agree the future is difficult to predict, my scenario is one of an infinite number of possibilities. It may be too optimistic, it also may be too pessimistic.
I certainly could not have guessed in 1978, the changes in technology that have occurred over the following 40 years.
Had someone proposed with a straight face in 1978, the changes we have actually seen over the period from 1978 to 2018, I would have asked if I could take a hit as that was some good stuff they were smoking.
Likewise the projections I have made may seem outlandish, but perhaps (I doubt this) will be far too conservative. I actually agree with you they seem far too optimistic, I present them as an alternative too the many pessimistic projections favored by many who comment here.
One more peak, quickly?
I have to agree with Iron Mike that the complexity level is through the roof on this one. Predicting energy, economy and climate for the next 30 years. It is very interesting intellectually if I only knew where to start and what I really can hope to predict. I can have some input, but it will be more to tweak the consensus prediction, whatever that is. If being very conservative is the thing; anchoring opinions around EIA, IEA and IMF and whatever authorities there are on climate change of which I know little, any one person is sure to be wrong. The true scenario will be violent and will not look good on a graph; no smooth lines.
I think the 2020’s will look nothing like the 2010’s, especially for the global economy. The 2010’s has been a growth period when it comes to every form of energy, credit, investor confidence and asset prices that assumes growth in infinity. Peak oil in the 2020’s will make sure a negative feedback loop between the economy and energy will occur with high oil prices, high inflation, high interest rates, more realistic pricing of assets and financial crisis. Which again sets a negative environment for energy investment overall; at least for parts of the decade (I would not rule out a major part of it).
When it comes to peak oil my guess is 2019 +/- 1 year. This is in light of the negative feedback loop between the economy and energy which I think will arrive sooner rather than later.
There are good reasons for that more renewable energy over time both makes sense and can be good investments, but there are obstacles when it comes to the size (or volume) of investments, related infrastructure and space priority. And the situation for each country when it comes to types of energy and consumption both now and in the future is so different that generalisation is rather difficult. So some of the moderate views when it comes to growth rate of renewables are probably the right ones; I lean a little bit to the more pessimistic ones. But I must admit, I do not think it is realistic to replace fossil fuel fully with renewables and that decrease in energy consumption per capita and reduced standard of living is most likely. The next question is how much less energy we can consume per capita without reducing standard of living. Quite a bit for affluent countries, we are wasting too much today.
It can be argued that technology will save day to increase our energy consumption. To that it can be said that most energy transitions so far has been to a more efficient form of energy use, e.g. from steam to diesel engines, with nuclear energy as our most remarkable achievement. How did we manage to control such a wast amount of energy? There is however no clear path to more efficient forms of energy than what we have today. Solar and wind power are not more efficient in terms of energy density, sorry. Land requirements are too large for a replacement 1:1 for todays fossil energy imo. “You never know what can be achieved” is a rather weak argument. I will not deny that some progress will be made nevertheless. The revolution of access to knowledge and data would make that possible. What I think of more as a practical progress is to use all those oil rigs to drill for geothermal energy at some point; just a thought.
Hi Dennis, I am not following your comment here.
My response to Nick G is about energy consumption not about CO2 emissions. I intend to discuss emissions in detail in part 5 of my report
“First, the idea that wind and solar will be limited by land area, mineral resources, or by intermittency, is just…well, to be polite, I’ll just say highly unrealistic.”
I’ll have what he’s smokin’
I’ll have what he’s smokin’
Whatever it is, it’s still a lot better than diesel fumes… 😉
I have to agree with you Nick, the real potential of solar energy and wind energy is many times more than any complex human civilization could ever need. The limits are in the minds of those with low mental ability and no vision. If humans can’t figure out how to even use what has already been invented and proven, then they truly deserve and need collapse. I leave them to their stick figures and crayon graphs.
The limits are in the minds of those with low mental ability and no vision.
I think I’ll chalk it up to a lack of wisdom!
Summer Solstice – Peak Light, Maximum Darkness
http://questioneverything.typepad.com/question_everything/2018/06/summer-solstice-peak-light-maximum-darkness.html
Wisdom? No one is listening. Sides are being taken, lines drawn and the rule of law vanishing for the rich and powerful and soon will break down completely.
Civil war is being talked on both sides now. The rule of the mob, how democratic.
Doesn’t sound very wise now, does it?!
I think George Mobus is on the right track.
Good presentation. No one can predict the future, but you covered most of the relevant parts. At least, as of now. When I first went to college, punched cards and the IBM 360 was high tech. Since then, technology has been expanding at faster rate each year. Who knows what 2050 will really bring. Thank you for sharing.
One big take home message I take from this presentation is the massive deficit of domestic energy sources that China has. And Korea, Japan, and Germany are examples of other big economies that are extremely dependent on fossil fuel imports.
None of these economies has much fat to cut in regard to their consumption, without drastic changes in their economic life. Volunteers are not stepping forward.
The next ten years are going to be very chaotic in a geopolitical sense (scrambling for energy imports).
It will make this last 10 years look like a quiet spring afternoon.
Before the heat of summer.
Before the thunderstorms.
China’s navel buildup is almost entirely about their access to oil. They don’t need blue water carrier groups to police their shoreline and near-in territory disputes. You do need them if you want to enforce presence in the Persian Gulf.
The US doesn’t have to be concerned with it directly due to Western hemisphere supplies and its own production but I’d be *very* concerned if I was Japan, South Korea or India. China doesn’t like any of them to begin with.
Whether or not China ‘likes’ those other importers or not, they will act with all their capacity to secure energy, as would we. They will probably act with much more restraint and successful strategy than we would if we were in their position.
They’re building the fleet to strong arm their neighbors on who gets oil in case there isn’t enough exported oil. I don’t think “restraint” is the word.
“And Korea, Japan, and Germany are examples of other big economies that are extremely dependent on fossil fuel imports.”
You confuse a little bit primary energy and useful energy: It is no problem to power Germany with 50% of the current primary energy as long as the final energy and useful energy increases, i.e. after the energy transition in 2050.
In the short term there is indeed not that much fat to cut, however, Germany can afford higher energy prices and can substitute to a certain extend with public transport for cars.
In the medium term, the next 15 years, I expect already an inpact of EVs, more wind turbines and better buildings. More expensive energy motivates the people to go RE.
Yes, I will discuss more about China’s oil import demand in my next post
https://www.marketwatch.com/story/trump-says-saudi-arabia-agreed-to-raise-oil-output-by-maybe-up-to-2-million-barrels-a-day-2018-06-30
We would need all the two million. Even if Iran was able to sell all their oil. Chances of 2 million from SA, anyone?
I read, recently, that Aramco said their excess capacity has been maintained at 2 million. It has already been confirmed that the Permian is going sideways as early as April. We need all that 2 million as we will still be short. Depending on outages and what is disrupted from Iran.
Turns out Saudi did not promise to increase production.
https://www.bloomberg.com/news/articles/2018-06-30/trump-asks-saudi-arabia-to-boost-oil-output-to-offset-high-price
I don’t think playing these sort of short term games will change the oil market much. The Saudis can draw oil from storage for a while if they want to and the Iran sanctions will probably fail in one way or another (China is no longer specifying imports per country btw). And come November which is both mid term election (US) and Iran sanction deadline everything will start to revert back to how it was before the “deal”. With some permanent damage to Iran’s business relations internationally and also to SA in the form of uncovering the spare capacity myth.
If the Sauds start to export more than expected, it will anger especially Iran and Russia. They can also play a short term game of supply restrictions (I am sure of that), and it is far from certain that oil prices will fall.
If the Iran sanctions are highly successful, the oil market will be in solid deficit and oil prices will rise.
Latest news, SA produced 10.7 mbpd in June, plans 11 mbpd for July. Reuters survey with complete table of OPEC production for June will be released Monday.
https://oilprice.com/Latest-Energy-News/World-News/Saudis-Boost-June-Oil-Production-Close-To-All-Time-High.html
Are there any freely available resources which show the current oil stocks of Saudi Arabia?
I wonder how much oil they might have in storage which they can release to buffer the price from increasing too much.
Are there any freely available resources which show the current oil stocks of Saudi Arabia?
No, there is not. Everything in Saudi Arabia is a deep dark secret. Nothing is known about Saudi Arabia except what they tell us. They tell us what their reserves are, and that is a lie. They tell us what their spare capacity is and that is a lie. They tell us what the decline rate is in their old super-giant fields is and that is a lie.
But… a lot of people believe those lies. They do, they really do. BP believes them and that is what they report in their Saudi URR statistics. They report exactly what Saudi Arabia tells them. Of course, they know better, but they have no other source of data, so they just go with that. And that is very likely to have disastrous consequences in the future.
Thanks Ron, what about their crude production numbers? Do they self-report crude produced or do external agencies verify their production statistics are accurate.
They do both. The OPEC Monthly Oil Market Report gives both the number of barrels Saudi says they produce and the number various agencies say they produce. They call these “secondary sources”. In this case, the Saudi numbers are usually more accurate because the secondary sources numbers are usually adjusted a month later to closer to what Saudi says they produce.
Understand that it is much harder to lie about production because the number of barrels can just be counted later. Also tankers can be tracked.
Two guys with questionable mental faculties yakking on the phone does not make a new and by very large margin all time high for Saudi Arabia.
Overall I agree with Iraq’s mutterings of an OPEC increase being 700k if they work hard.
Elect a clown, expect a circus?
Prices to high! Infinity and beyond!
Didn’t he say “maybe up to” – good presidential clarity there.
Has there ever been a bigger disaster of a human being, in almost every way imaginable, in a position of such power?
Caligula vs Donald Trump:
“Let there be one lord, one king.” In AD 40, Caligula began implementing very controversial policies that introduced religion into his political role. Caligula began appearing in public dressed as various gods and demigods such as Hercules, Mercury, Venus and Apollo. Reportedly, he began referring to himself as a god when meeting with politicians and he was referred to as “Jupiter” on occasion in public documents.
Caligula had his horse in the Senate.
Might be an improvement with our current makeup?
Paul, as I posted above, the White House now says King Salman made no such promise.
It figures. We do call him the Liar-in-Chief
I remember this dood’s post last year drew lotsa comments, too.
Global population will likely fall sharply long before 2070.
Visualize power network. Multiple power generation plants all over a given country. Visualize an enormous installation of solar panels. Now visualize military planning and which is the easiest target to hit and wipe out a country’s power. If there are already questions about the economics, what do they look like if you try to disperse the panels to 8 different defensible country locales and fund guys to go guard them and broom sand off them.
KSA would be crazy to depend on solar. Why would they with all that fuel underground too deep to bomb?
Andddd one more time. World oil consumption 2017 was 6 million bpd higher than world oil production. 2.2 billion barrels for the year. US SPR release 2017 of 500K barrels to address some scarcity in Louisiana for a hurricane. Replaced soon thereafter when scarcity was fixed. No other reports of release of oil from any SPRs to explain the 2.2 billion.
KSA would be crazy to depend on solar. Why would they with all that fuel underground too deep to bomb??
Yeah, no one would ever think of bombing oil wells or refineries!
On the other hand…
https://www.forbes.com/sites/ellenrwald/2018/03/29/saudi-arabia-to-build-massive-solar-power-installation/#57fb48d77a90
Saudi Arabia To Build Massive Solar Power Installation
But this particular vision—massive solar power generation in the sunny desert—is really nothing new . It is part of a long-term strategy that long predates the current Saudi leadership.
https://www.bloomberg.com/news/articles/2018-03-20/why-oil-rich-saudi-arabia-is-turning-to-nuclear-power-quicktake
$50 Billion in nuclear plants spread over the Kingdom. Make the strike targetting difficult. Sounds like the Crown Prince was on a PR tour. Read that carefully.
They’ll have to build those nuclear power plants by the Red Sea or the Persian Gulf.
Watcher,
If we add biofuels production to oil production we get 4471 million metric tonnes produced in 2017.
Consumption in metric tonnes was 4470 tonnes in 2017. This is straight from “the bible” as you like to call BP stats. 1 million metric tonnes would be about 7 million barrels added to storage, pretty much a rounding error (the storage numbers are notoriously bad.)
So . . . then in your world with a surplus, prices fell last year?
Projection for wind and solar based on consumption trends, in 2050 the wind and solar output is about 40,000 TW-hr, using Minqi’s scenario and assuming capacity factor is 21.6%, output from wind and solar would be 31,000 TWhr in 2050.
Note that my scenario may be too optimistic and Minqi’s perhaps a bit pessimistic, maybe 35,000 TWhr in 2050 would be a good guess. Note that when we include nuclear, hydro and other renewables, my scenario is enough to cover all electricity generation in 2050 and coal and naural gas fired generation would be completely shut down (perhaps a bit of natural gas for backup).
Windmills, and solar panels are sinks of energy for human civilization, not sources of energy. You could make same graph with Play Station 4 sales figures, and claim that PS4 will replace coal, and natural gas. Some people here would need to read ourfiniteworld blog, because too much stupidity on this site.
Hi, btw.
Windmills, and solar panels are sinks of energy for human civilization, not sources of energy.
You apparently aren’t exactly the brightest bulb in the chandelier, are you?! Most readers here, I’m sure, are quite aware of the fact that neither solar panels nor windmills, for that matter, are sources of energy. They are merely devices for capturing wind and sunlight and converting them into useful electrical energy.
Then again, fossil fuels need to be combusted in furnaces, turbines and internal combustion engines in order to produce heat energy that can then be used for work.
All of industrial civilization’s devices are energy sinks.
Energy, in physics, the capacity for doing work. It may exist in potential, kinetic, thermal, electrical, chemical, nuclear, or other various forms. There are, moreover, heat and work—i.e., energy in the process of transfer from one body to another.
“Windmills, and solar panels are sinks of energy for human civilization, not sources of energy.”
is there any data to back that up?
http://cassandralegacy.blogspot.com/2016/06/photovoltaic-is-energy-source-not-sink.html
To be clear ‘photovoltaics’ is not quite the same as ‘solar panels’in and of themselves. Try putting solar panels in a dark room and see if they spontaneously generate electricity…
‘Photo’ = Light, usually from the sun, which can, for all practical purposes be considered the principal source of energy.
The panels are usually composed of some formulation of doped silicon embeded in an aluminum framed glass panel with the capability of allowing photons, or particles of light, to knock electrons free from atoms, generating a flow of electricity. Solar panels actually comprise many, smaller units called photovoltaic cells. (Photovoltaic simply means they work by allowing photons, or particles of light, to knock electrons free from atoms, generating a flow of electricity. Solar panels actually comprise many, smaller units called photovoltaic cells. (Photovoltaic simply means they convert sunlight into electricity.
Can’t help myself, just have to add photovoltaic panels are basically LED lights in reverse. Both are based on doped silicon. LED’s use electric current to generate light – PV panels work in the opposite direction using light to generate electric current
“Windmills, and solar panels are sinks of energy for human civilization, not sources of energy.”
You mean like in ktos is a sink of stupidity, not a source of intelligence and understanding?
ktos,
From a net energy perspective Wind and Solar are much better than oil sands or tight oil.
See
https://en.wikipedia.org/wiki/Energy_returned_on_energy_invested
tight oil about 5, oil sands about 3, wind 20 to 50, and solar (PV) 19-39.
Glad to know my wind/solar projection has by now increased to almost 80% of Dennis’s
Why I prefer to go with Genscape’s estimations. I’d love to have a subscription, but it’s not in the budget. So, I have to get it from third party repeats, but they are not always accurate.
In March of 2017, while EIA was projecting a 300k increase in the Permian, Genscape said it would be an 800k increase, ending the year at 2.8. The next year they projected about 500k. Always mindful of pipeline takeaway.
https://www.mrt.com/business/oil/amp/Rising-Permian-activity-may-bring-some-negative-11007628.php
What do they say takeaway capacity is:
Total takeaway capacity is 3.3.
https://mobile.reuters.com/article/https://www.mrt.com/business/oil/amp/Rising-Permian-activity-may-bring-some-negative-11007628.php amp/idUSKBN1JG3GI
That includes rail, truck and local refinery.
https://mobile.reuters.com/article/amp/idUSKCN1HC2L0
The Midland to Sealy pipeline was completed since that article, so when you add that to 3.175, you get about 3.3.
Permian was about 3.150 in April, which is about 350k from the first of the year. So, add another 150k, and you max out at 500k, or thereabouts.
Or, about 800k less than EIA’s June STEO. 200k of pipeline is supposed to be added the end of the year, so 2019 won’t be halved, but looks over one million total short for both years.
You can’t get any closer for estimates than exactly right for two years in a row, so that’s why they get the big bucks.
https://mobile.reuters.com/article/amp/idUSKBN1JG3GI
Second link did not work above, and it won’t let me edit anything.
https://www.spe.org/en/jpt/jpt-article-detail/?art=4321
The alternative estimate is Rystad, which estimates pipeline capacity at 3.1 million, and capacity to 3.6 to 3.7. But, I note their high end has already dropped by 100k, recently. I think Genscape is better. Actually, about a month ago, Rystad was saying 4, making Permian 1.2, so they have dropped 300k to 400k in the last month. More to go, I think, as 3.6 to 3.7 is a 800 to 900 projection increase. Genscape has capacity at closer to 500k. They can go past “capacity”, but in the 600k area, not 800. Rystad is not so great in projections, they follow EIA fairly closely.
Earlier Feb 2018, Rystad was projecting an increase in the Permian of 1.4 million for 2018 and 2019 for each year. Most had a clue by then, that pipelines would be a big issue. They don’t give a lot of credibility to work with.
https://www.spe.org/en/jpt/jpt-article-detail/?art=3897
The cornucopian Michael Lynch tweeted:
Paul,
Of course they’re renewable, but patience is needed. 🙂
About 300 million years is all we need.
We have one Lynch cite in the index.
See the graph below, which shows the US net annual addition of (all types) of electricity generating capacity from 1981 to 2016. Since 1981, in average, the US has added 15 gigawatts annually to its generating capacity. There were a few boom years. In 1989, the US added 34 gigawatts. In 2000, the US added 43 gigawatts. In 2002, the US added 57 gigawatts. But otherwise, the annual addition has been mostly less than 30 gigawatts. Since 2004, the annual addition has been at or below 15 gigawatts. In 2016, the US added 10 gigawatts.
(the graph below should be for 1981-2016)
Information from EIA electricity Table 4.5.
2017 Planned Addition
All capacity 25.1 GW (net addition 13.9 GW)
Wind 6.9 GW
Solar 5.2 GW
2018 Planned Addition
All capacity 33.5 GW (net addition 23.5 GW)
Wind 8.1 GW
Solar 4.0 GW
2019 Planned Addition
All capacity 25.1 GW (net addition 19.0 GW)
Wind 7.9 GW
Solar 2.5 GW
2020 Planned Addition
All capacity 24.7 GW (net addition 19.6 GW)
Wind 2.1 GW
Solar 2.4 GW
2021 Planned Addition
All Capacity 7.8 GW (net addition 5.5 GW)
Wind 0.3 GW
Solar 0.3 GW
Information from EIA electricity Table 4.6
Actual Additions in 2016
All capacity 28.8 GW (nameplate, net addition 9.4 GW)
Wind 8.8 GW
Solar 8.0 GW
Basically in recent years the US has been building about 25-30 GW of power plants each year (gross addition, not subtracting retirements), out of which 10-15 GW went to or will go to wind/solar.
At this pace, I think , it will take approximately a century for the US electricity sector to be decarbonized.
“At this pace, I think , it will take approximately a century for the US electricity sector to be decarbonized.”
A decade ago you could have said one thousand years. Rates rarely stay the same for developing systems.
Gone fishing, the point is that the US installation rate for ALL TYPEs of electric power plants has not changed for decades
Solar/wind may look like exponential now, but eventually their installation rate cannot exceed what the US will install for ALL TYPEs of electric power
The installation rate is not the net rate. There is ALL THE EXISTING FOSSIL FUEL and NUCLEAR plants to replace as well as ANY NEW POWER needed. So why can’t the solar power and wind turbine stay exponential for quite some time?
Coal plants are aging out, so are nuclear (three reactors closing now in NJ). Natural gas supplies will diminish and as storage comes on line natural gas plants will close or just be used as peaker/backup.
Just within a few miles of me two coal plants are closed for years now.
Most coal-fired capacity (88%) was built between 1950 and 1990, and the capacity-weighted average age of operating coal facilities is 39 years.
EIA
Natural gas plants average 22 years old and nuclear plants average 36.
Plenty of room for future expansion.
Here is an easier to read power plant age graph from the EIA, dated to 2010.
Hi Gonefishing, thanks for the graphs. That’s very nice.
I was looking for data about gross installation but could not find them before 2016
As nice as your graphs are, they still look like graphs for “net installation” rather than gross installation. Please compare the scales of your graphs with my graph. They appear to be the same, for example, both your graph and my graph having peak installation rate happening in 2002 at just under 60
In any case, neither your graph nor my graph appear to be exponential (for the total installation rate)
Those are EIA graphs, they claim it is the capacity power by date online.
Maybe I can make it clearer. The US has slightly more than 1000 GW of power production capacity. Fossil fuel powered systems comprise about 750 GW
If we install 20 GW of solar and wind capacity per year it will take over 40 years to just replace current use, probably close to 50 years just to replace FF electricity due to the rise time.
To replace nuclear would need another 5 GW per year.
However, 40 to 50 years is too long a time period if we want to have an effect on global warming, so following a logistic curve installation of renewables will have to reach at least 50 GW per year or more before going linear, then later tapering back to replacement rate.
At the same time one needs to replace or eliminate all the thermal energy used for industrial process, business,home and building heating, food processing and transport. That would need another 50 to 75 GW per annum giving a grand total of 100 to 150 GW added per annum. To achieve that rate of substitution would require on average an exponential rise of 20 percent per year for 11 years or 40 percent per year for 6 years.
The exponential rise of 20 percent overall is more likely, though less desirable.
Note: over the period new building codes can force better insulation and some solar thermal heating reducing the amount of energy needed at the PV and wind end. Also the large amount of energy needed to drive the fossil fuel industry would be eliminated.
It’s of course all supposition but since renewable energy is advancing rapidly and there are tremendous reasons to replace FF (global warming, eco-destruction, health and diminishing supply) the transistion will proceed. Different rates at different places.
EIA web page
https://www.eia.gov/todayinenergy/detail.php?id=30812
Hi Gonefishing,
20GW * 40 years = 800 GW
That will, of course, be greater than 750 GW (fossil fuels as you said) in term of nameplate capacity
But fossil fuels power plants have greater capacity utilization rates than wind/solar
Using data from EIA electricity summary statistics (Table 1.2)
In 2016, the US coal net generation 1239 terawatt-hours, net summer capacity 267 gigawatts, capacity utilization rate 53%
The US natural gas net generation 1378 terawatt-hours, net summer capacity 447 gigawatts, capacity utilization rate 35%
The US wind net generation 227 terawatt-hours, net summer capacity 81 gigawatts, capacity utilization rate 32 %
The US solar PV net generation 33 terawatt-hours, net summer capacity 20 gigawatts, capacity utilization rate 18%
So coal/gas capacity utilization rate averaged about 42% and wind/solar capacity utilization rate averaged about 29%
To replace 750 GW of coal/natural gas/oil, it will take approximately not 750 GW of wind/soar but 1100 GW of wind/solar, without even considering “minor” problems such as intermittency, storage, peak demand
Well if you don’t like 40 to 50 years, make it anything you want. You missed the point of needing exponential growth in renewables which you argued against. I am glad you accept that now. You now argued that we need a larger exponential rate of renewable development.
Thanks for the academic discourse.
Here is an interesting article on Solar capacity factor in the US that comes up with a lower value than the EIA, 25% versus 28%.
http://euanmearns.com/solar-pv-capacity-factors-in-the-us-the-eia-data/
I am not too concerned about hard numbers now since just in the last few years solar PV efficiency has risen from 16% to 24%, whopping 50 percent gain. Also prices are falling.
Similar things have happened to wind turbine efficiency and new developments are on the way.
But most of all the advent of the EV/renewable combination will reduce the excessive waste of transport energy and pollution from oil, coal and natural gas.
I also do not think we will need nearly as much power in 2050 as we do now. But that involves other factors not discussed here.
At this pace, I think , it will take approximately a century for the US electricity sector to be decarbonized.
I highly doubt the US will look anything like it does today, a hundred years from now.
I think the so called experts are expecting things to evolve along linear trends. It isn’t just exponential technological change and adoption of those technologies. I think they miss the synergistic effects of the interaction of technological change and social economic and political change, wherein the whole becomes much greater than the sum of the individual parts. Case in point, things like distributed micro grids, EVs serving dual purpose as transport and home battery storage, electrification of commercial trucking fleets, electrification of trains, buses, ships etc… Then there are factors such as disruption to agriculture due to climate change and sea level rise that will force fundamental changes in political and social systems. I expect a very different world and US!
That I agree, a very different world a century from now
The question is always in what way
Well, I’m Brazilian born and Brazil beat Mexico today to qualify for the world cup quarter finals… So allow me to celebrate at least for today… 😉
My personal opinion is that a transition to a decarbonized economy will happen much faster than most experts in the BAU paradigm are expecting. Will that happen fast enough? That I don’t know, the biggest problem I see is population continuing to increase.
Gone Fishing posted this link on the non petroleum side but I think it is highly relevant to the predicament humanity now finds itself in.
https://www.youtube.com/watch?v=jJGqv-QPvgc&t=6s
Cheers!
Under Clinton there was a small (millions not billions) African aid program that sought to help with women’s rights, and especially choices over fertility; mainly through education but with some direct provision of contraception. It did some subtly clever things like sponsoring radio soap operas that discussed some of these issues and appeared to be having some important impacts. It was all cancelled under Bush and the Republicans who preferred to see Africa as an arms market and source for smartphone raw materials. There’s probably no way of knowing but I’d guess things like that have had disproportionately huge effects on the growth in population.
China’s gigafactory – this is worth a look if you missed it last year
26 Oct 2017 (IEEE Spectrum) The Vanadium Redox-Flow Battery
The factory sprawls over an area larger than 20 soccer fields. Inside, it’s brightly lit and filled with humming machinery, a mammoth futuristic manufactory. Robot arms grab components from bins and place each part with precision, while conveyor belts move the assembled pieces smoothly down production lines. Finished products enter testing stations for quality checks before being packed for shipping.
It has been called a gigafactory, and it does indeed produce vast quantities of advanced batteries. But this gigafactory is in China, not Nevada. It doesn’t make batteries for cars, and it’s not part of the Elon Musk empire.
Opened in early 2017, in the northern Chinese port city of Dalian, this plant is owned by Rongke Power and is turning out battery systems for some of the world’s largest energy storage installations. It’s on target to produce 300 megawatts’ worth of batteries by the end of this year, eventually ramping up to 3 gigawatts per year.
Soon this technology will be the cornerstone of the largest battery installation in the world: a 200-MW, 800-megawatt-hour storage station being built in Dalian. The first 100 MW will be installed by the end of this year, with the remainder coming on line in 2018.
The first redox-flow batteries were developed in the early 1970s by Lawrence Thaller and his group at NASA, as a possible energy source for deep-space missions.
https://spectrum.ieee.org/green-tech/fuel-cells/its-big-and-longlived-and-it-wont-catch-fire-the-vanadium-redoxflow-battery
https://en.wikipedia.org/wiki/Vanadium_redox_battery
2018-07-02 (Platts) Tokyo — The Khafji oil field in the Partitioned Neutral Zone shared by SaudiArabia and Kuwait is being prepared to restart production in 2019, Japan’sToyo Engineering said Monday. “Maximum oil production rate of the fields is 350,000 b/d,” Toyo said.
https://www.spglobal.com/platts/en/market-insights/latest-news/oil/070218-saudi-kuwait-neutral-zones-khafji-oil-field-to-be-restarted-in-2019-toyo
Maybe these barrels are included in the promised 1 million bpd increase? They come in effect after the November deadline, and may only counter decline elsewhere by the time they reach the market.
Oil prices pull back on concerns about higher global production
According to Trump:
Just spoke to King Salman of Saudi Arabia and explained to him that, because of the turmoil & disfunction in Iran and Venezuela, I am asking that Saudi Arabia increase oil production, maybe up to 2,000,000 barrels, to make up the difference…Prices to high! He has agreed!
2 million extra barrels per day from Saudi Arabia??
Turns out Trump wasn’t telling the truth. The White House later admitted King Salman made no such promise.
Turns out Trump wasn’t telling the truth.
Well, he opened his mouth, didn’t he. When you see him do that then it’s a sure sign he is about to lie.
“When the rich can’t get more by producing real wealth they start to use their power to take from lower segments..”
-Dennis Meadows
I’m thinking it’s likely that Trump has told the truth at least a couple of times since he’s been in office, about SOMETHING.
It’s hard to avoid telling the truth ALL the time, when you never shut up. I don’t think he’s smart enough to manage it!
Remember that a stopped clock is right twice a day.
If you look at Table 4- World Primary Energy Consumption-
and assume the historical data and projections are close to correct,
one could conclude that we do not necessarily have a huge energy crisis on the 2-3 decade horizon.
Total energy currently used increases from 14 to 20 [Mtoe] over the next 32 yrs.
Sure there is a peak in liquid fuel on the immediate horizon, but there is a very long and slowly declining tail, allowing the world time to wean off ICE and shift towards electrified transport.
Secondly, there is a very long tail on the nat gas supply, despite peak production globally by 2036.
Third, the gradual decline in consumption of coal, and to a lesser degree nat gas, and oil, will be offset by the growth in wind/solar production, with strong growth beginning to accumulate globally over the next 5-10 yrs.
These trends are well depicted in the graph. There are assumptions that are critical to these projections and considerable pitfalls to ‘rosy’ scenario, such as-
1. war/political choices disrupting supply and export (ex- Venezuela)
2. the failure to aggressively deploy wind/ solar (ex. USA tariffs on PV)
3. progressive willful curtailment of coal due to pollution and climate instability
4. ghawar peaks hard
5. Add to the list if you please______.
Personally, I am not a ‘believer’ in the possibility of these long tails in production for the fossil fuels, but WTHDIK (what the hell do I know)?
Once again, thanks to Prof Li for the report.
Thanks for the summary. Yes, projections always depend on various existing assumptions. I personally would not be surprised if by 2050, the world ends up somewhat less rosy than is projected in Table 4
Yes Hickory, I agree that the idea of a long tail for oil is dubious for political reasons. Many oil exporters suffer from the resource curse and have failed to develop other economic and democratic institutions that will give them any resiliency once their oil revenue falls significantly. Venezuela and Libya are likely to be the poster chilren of what many Gulf states look like on the downslope of their production curves, especially with large young populations, severe economic inequality, and a history of importing food and ignoring their agricultural sector. Oil production will screech to a halt as crime becomes rampant and the oil infrastructure is decimated by neglect and theft. This may not happen everywhere, but it will happen often and regularly over the next few decades.
Saudi Arabia considers this threat to be very real. It’s what is behind their efforts to diversify the economy beyond oil welfare and, more tellingly, develop different domestic power generation even if it costs more in short-medium term.
Venezuela is the one that’s being a big drag on global potential output because they’re so far below what one would project and there’s no prospect of fixing it.
Yes, and the same degree of supply disruption could happen to any of the exporters, with scenarios that we only guess about. Who would have predicted how quickly Qaddafi fell in Libya?
The USA has spent literally trillions in an attempt to keep oil flowing out of Arabia/Persia over the last 40 yrs, with the benefit of steady inexpensive oil primarily going to our economic allies in Europe and Asia, and thus indirectly benefiting the global balance of trade and power regime in our favor.
We may be near the end-game of that story.
I believe we are witnessing now a major realignment of interests and alliances on the world stage, with energy supply being a big and growing factor.
Shuffle the cards.
2018-07-02 (Bloomberg) Saudi Arabia is delivering on its promise to try and tame crude prices, boosting output by 330,000 barrels a day in June to 10.3 million a day, according to a Bloomberg News survey of analysts, oil companies and ship-tracking data. But disruptions in Libya, coupled with ongoing supply losses in Venezuela and Angola, meant overall output from the Organization of Petroleum Exporting Countries rose only 30,000 barrels a day to 31.83 million a day.
https://www.bloomberg.com/news/articles/2018-07-02/saudis-biggest-oil-surge-in-5-years-barely-steadies-opec-output
Bloomberg tanker tracking https://pbs.twimg.com/media/DhGmHH6XUAA8xFb.jpg
I keep beating the same drum but I’m betting that is Khurais and was planned all along. The next increases, if any, will be the interesting ones – will they be sustained after the A/C demand goes away in winter and will there be evidence of decline or maintenance interruptions once all spare has been used.
The Saudis are currently going on a hiring spree in order to increase drilling activity. With increased dayrate bids and ignoring their own age limit for expats set at 55 years. No links to back up this one, as it is just a quote from someone working offshore on another forum. Probably reliable info.
Is SA oil coming from Khurais expansion, spare capacity or storage (e.g. large underground storages kept secret)? That is the black box and I would not rule out your theory is the right one.
There is a discrepancy between Bloomberg June numbers for Saudi Arabia (330 kbpd increase) and Reuters survey numbers (700 kbpd increase). Both sources rely on tanker tracking most likely.
According to Reuters survey:
There are further decreases coming from Angola, Iran, Venezuela, Libya and Nigeria as expected. Small increase from Iraq and Algeria; the large one from SA; no major changes from the other countries
Link (poor graphic table):
https://www.cnbc.com/2018/07/02/reuters-america-table-opec-oil-output-rises-by-320000-bpd-in-june–reuters-survey.html
Libya declared force majure on almost all of their exports, 850k bpd. Reason amounts to civil war. The Libyan National Army ousted Islamic extremist fighters from the area but aren’t giving it back to the government and maintain eventually they will sell whether the government wants it or not.
https://www.thenational.ae/world/mena/libya-declares-force-majeure-at-giant-oil-terminals-1.746408
That’s going to lead to some abrupt inventory draws in Europe. Major, major problem if it continues.
Why Saudi Arabia isn’t going to do what Trump claimed.
https://oilprice.com/Energy/Crude-Oil/Saudi-Arabia-Wont-Bring-2-Million-Bpd-Online.html
I don’t think anyone in the oil space paid attention to Trump on that. Brent didn’t so much as flinch. Hell, the futures market was skeptical of the actual OPEC meeting.
Saudi building out to 12 million BPD *over time* is much more plausible than the EIA’s vision of the US adding another few million *net* barrels-per-day, but that’s not saying much.
“A business that burns cash and doesn’t grow isn’t worth anything.”
http://money.cnn.com/2015/05/04/investing/david-einhorn-oil-fracking-terrible-investment/index.html
Cue Texas Tea’s jingoism
The candidates Harold Hamm is funding for the elections this year all have a good chance of winning. Further, Mr. Hamm communicates often with President Trump and is very highly respected in Washington DC. I don’t think you have much to worry about with the shale industry at this time.
What does politics have to do with bad economics or market valuation? Pioneer has a P/E of over 30 even with oil price recovery (they were losing money hand over fist before). That’s extremely high for any natural resources company.
Pioneer’s operating expenses for 2017 were 4.5 billion USD, up from 3.1 in 2014. They spend A LOT of money.
“What does politics have to do with bad economics”
probably a lot more than we’d like to acknowledge.
What does politics have to do with bad economics or market valuation?
Bad economics and market valuation are entirely two different things. I have no idea what politics has to do with market valuation but it has everything to do with bad economics. Just look at that idiot in the White House and his deliberate trade war. He thinks that is great. It is leading to massive hardship on US producers. Some are even considering moving their manufacturing plants overseas because of it.
We have an economic idiot in the White House who thinks he is a stable genius.
“Just look at that idiot in the White House and his deliberate trade war. He thinks that is great. It is leading to massive hardship on US producers.”
He’s done what Obama failed to do:
1. Raise taxes on the middle class with his revised tax code & elimination of the SALT deduction. I am just waiting for the Gomer Pyle moment “Surprise Surprise!” when taxpayers file their income taxes next spring & realize they been hit with a *Huuuge* tax bill.
2. Create a new 25% VAT tax via the 25% tariffs on most imports.
3. Destroying what left of private health care insurance to introduce single payer (ie Socialize healthcare)
4. Continued & expanded the wars in the Middle East. (although these were started by Bush (I & II) but expanded by Obama (Syria, Libya, Yemen, etc). Every new President has to invade a new ME nation during their administration.
5. Limit Illegal immigration & tariffs in support of Unions jobs while pissing off conservative farmers that rely on cheap illegal immigrants & Ag exports.
Bonus: Piss off the entire world in less than two years!
I am sure who ever wins in 2020 will be much worse and make Trump look like fine president.
“Trump himself seems to be having the time of his life. He’s constantly in the limelight, his loyal base worships his every move, he’s free to defy convention, to insult anyone he chooses, to disrupt the international economic and political order at will — whatever comes to mind next, knowing that he’s the biggest thug on the block and can probably get away with it — again, for a while, at least.
I don’t think it’s quite fair, however, to call him a liar. Lying presupposes having a concept of truth, and being in a situation where telling the truth matters. We don’t say that three-year-olds are lying if they say they saw a dragon outside, or an actor in a play. It’s also not clear that it’s tactically useful to tot up the random falsehoods that pepper his tweets and orations. That just fires up his worshipful base, providing more evidence that the hated liberal elites are trying to destroy the one guy in the political arena who is dedicated to defending the common folk — who he is shafting, with delight, at every opportunity.”
-Chomsky
Fascism:
1 often capitalized : a political philosophy, movement, or regime (such as that of the Fascisti) that exalts nation and often race above the individual and that stands for a centralized autocratic government headed by a dictatorial leader, severe economic and social regimentation, and forcible suppression of opposition.
Trump is a basically a fascist as are most of his fundamentalist Christian (in name only) supporters, that is why they seem to love authoritarians like Putin and Kim Jong- un. They are all birds of the same feather! They all love power and control.
Trump and his supporters are against everything that the United States is supposed to stand for.
It sounds like Russia wants lower fuel prices
02 Jul 2018 (Platts) London — Russia’s government has decided to compensate farmers for the hike in the prices of gasoline and diesel by using its reserve fund, Russia’s agricultural minister Dmitry Patrushev said in comments published on the Kremlin’s website.
– with fuel accounting for around 10% of agricultural sector costs, the fuel price hikes especially in May were jeopardizing the progress of the agricultural works, especially as Russia expects a large harvest.
https://www.spglobal.com/platts/en/market-insights/latest-news/agriculture/070218-russian-government-to-compensate-farmers-for-high-fuel-prices
Kazakhstan, I don’t know what the news is, I guess some sort of temporary outage? Kazakhstan averaged 1.9 million b/d during the first 6 months of 2018. The chart is only to illustrate the outage. Latest daily number is 1.64
Chart on Twitter https://pbs.twimg.com/media/DhLWoE7XcAAJw2f.jpg
PG&E (California) to install 3 large grid battery systems that will replace 3 Nat Gas generator facilities.
Capacity 2,270 MWhr!
“Storage at this scale is likely now cheaper than the total cost to run the gas plants,”
https://www.utilitydive.com/news/pge-to-replace-3-gas-plants-with-worlds-biggest-battery-projects/526991/
In US southern states solar PV + battery storage is already competitive . See:
https://www.lazard.com/media/438038/levelized-cost-of-energy-v100.pdf
probably except gas combined cycle:
https://www.ge.com/power/resources/knowledge-base/combined-cycle-power-plant-how-it-works
Coal is left behind, as no new coal power stations are built:
http://peakoilbarrel.com/eias-electric-power-monthly-may-2018-edition-with-data-for-march/
http://mazamascience.com/OilExport/
( Choose country:USA and fuel:coal )
probably no matter Administration policy. So are nuclear power plants.
Coal producing companies are in dire straits:
https://finance.yahoo.com/quote/CLD?p=CLD
(choose a 5 years or Max chart)
although on a $/MMbtu base, Powder River Basin coal would look very competitive:
https://www.eia.gov/coal/markets/#tabs-prices-2
If this is not a paradigm change, I don’t know what one would be.
Let’s consider this, Europe, an area with indisputable environmental credential and much stronger political commitment to renewables.
Can I say their installation rates for wind/solar have stabilized (if not peaked)?
Europe depends heavily on biofuels, renewable bio-waste and hydro power to meet it’s 20% goal for 2020. Quite a number of nations had already passed their goal by 2016.
Europe hasn’t peaked. At this point in time wind is growing linear and solar does so exponentially. The big solar additions in 2011 and 2012 are probably due to german subventions at that time. But now solar became cheap enough to grow on its own. We’ll see new records in the near future.
Europe hasn’t peaked.
Europe hasn’t peaked at what?
I think Westexasfanclup is saying that Europe hasn’t yet peaked with regards installation of solar and wind.
Hell, that goes without saying. Europe hasn’t yet started at solar and wind installation. If they have any hope of replacing fossil fuels they will have to expand many folds from where they are today.
But of course, that is what this debate is all about isn’t it? I just think it is not going to happen, not in the time allowed anyway.
Can I say their installation rates for wind/solar have stabilized (if not peaked)?
Certainly not based solely on the data displayed in that one graph. I’d say it’s a bit premature to come to that conclusion. Let’s look at least another 20 years of data and see where things are then.
1) To add PV and wind capacity in the picture does not really make sense, the CF of PV is in the 15% range, the CF of new wind turbines is in the 30-50% range.
2) In central Europe wind is expected to provide around 70% of the electricity, therefore, it is important that wind power is on track. Here most will come from offshore in the next decade.
3) Wind power is quite mature in Europe, no exponential growth is required, linear increase is more than sufficient. E.g. the addition of 5 GW onshore windpower in 2017 were already at 70% of the steady state (6.5 GW) required in a 100% RE scenario in Germany. To be fair I expect a reduction in the next few years as a result of changed market rules.
Simply by extrapolating from German numbers (Germany causes 25% of the European demand) my guess is that 20-25GW/a onshore wind and 10 GW /a offshore wind are sufficient as steady state, twice the current number.
https://oilprice.com/Energy/Crude-Oil/Permian-Bottlenecks-Come-At-The-Worst-Moment.html
It will not exceed capacity. It can not. Wells will be shut in. Genscape has pipeline, local refinery, train and truck capacity at 3.3. Train is only 125k with existing usage, and truck is around 25k, could be 50k. End of story. Genscape nailed it the first of last year at 2.8 ending, and 500 to 600 is max for 2018. Not 1.7. The latest STEO doesn’t project 1.7 for 2018, it’s a little over 1.3, and closer to 1 for 2019. Next year is tough, too. Until the third quarter. Eagle Ford, Bakken and Okla can go up a few hundred thousand barrels, but I would not expect much out of them until the first quarter of 2019. Permits for the Eagle Ford have not picked up, so it won’t happen this year. The EIA has totally screwed up the projection of US oil for 2018-2019, causing both IEA and OPEC’s estimations to be way off, also. No matter what OPEC does, it will be too little, too late. Oil price spike by the end of 2018, with a bigger spike by 2019.
Think oil prices will take a big enough jump by November to impact the US elections?
https://www.cnbc.com/2018/07/01/trumps-iran-policy-may-cause-pain-at-the-gas-pump-ahead-of-elections.html
Really depends on how well the Dems play it. I think Trump has ended any chance of winning any close ones, anyway, so there would be little surprise if we ended Republican majority.
But, the first spike would come as a result of any damage to Iran production and/or drop that is not picked up by OPEC. That one will happen sooner than BAC projects at $90?
The EIA fiasco will sneak up on us in 2019, because EIA will not announce they made a million barrel plus mistake. That is not politically correct. Eventually, we will be able to discern that by looking at the monthlies, but there is a big enough lag in reporting to hide that until November. They will begin by knocking off some of the projection. Maybe 200k, and spouting some sort of malarkey, that they can use later to say: “well, we told you”. But the inventory drops may get a little exciting. Production has stalled, or is stalling, and we are exporting more.
[…] Thanks to Dr. Minqi Li, Professor, Department of Economics, University of Utah for that fantastic post: “World Energy 2018-2050: World Energy Annual Report (Part 1).” […]
I nominate Dr. Minqi Li’s post, and the comments that follow for the ‘Epic Post’ award.
Outstanding.
Thank to all.
Thanks to Ron for picking up where The Oil Drum left off. Ron has created, by this vehicle, huge value, and over many years now.
These posts are a very valuable public resource.
And Dr. Minqi Li’s post is among the best of the best.
Worth a look for perspective:
https://www.bloomberg.com/news/articles/2018-07-09/russia-is-building-320-million-icebreakers-to-carve-new-arctic-routes
[…] Minqui Li, Peak Oil Barrel […]