US July Oil Production Rises on Texas & GOM Jump

By Ovi

All of the Crude plus Condensate (C + C) production data for the US state charts comes from the EIAʼs Petroleum Supply monthly PSM which provides updated information up to July 2023.

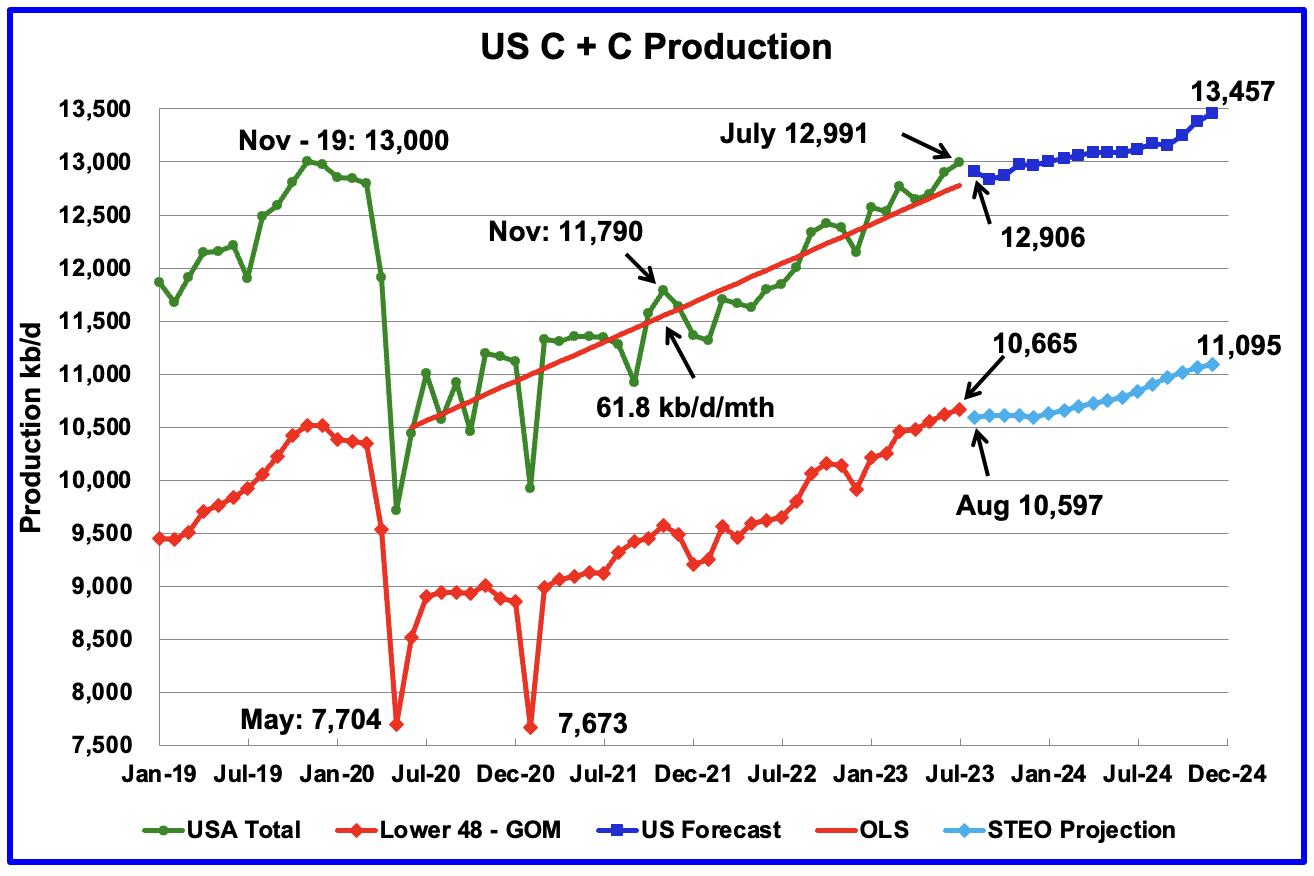
U.S. July oil production increased by 91 kb/d to 12,991 kb/d. The large increase was primarily due to a 73 kb/d increase in the GOM and a 72 kb/d increase in Texas.

The dark blue graph, taken from the September 2023 STEO, is the forecast for U.S. oil production from August 2023 to December 2024. Output for December 2024 is expected to be 13,457 kb/d which is 457 kb/d higher than the November 2019 peak of 13,000 kb/d.

Read More

US January Oil Production at Post Pandemic High

A Guest post by Ovi

All of the Crude plus Condensate (C + C) production data for the US state charts comes from the EIAʼs March Petroleum Supply monthly PSM which provides updated information up to January 2023.

U.S. oil production increased by 437 kb/d to 12,462 kb/d, a post pandemic high. For January, the GOM contributed 125 kb/d to this high. The states with the largest increase were North Dakota with 97 kb/d followed by Texas with 76 kb/d.

Read More

Winter Storm Drops US December Oil Production

A guest post by Ovi

All of the Crude plus Condensate (C + C) production data for the US state charts comes from the EIAʼs February Petroleum Supply monthly PSM which provides updated information up to December 2022.

U.S. December production decreased by 276 kb/d to 12,101 kb/d. For December, the state with the largest decrease was North Dakota with 135 kb/d followed by Texas with 65 kb/d while New Mexico had the largest increase, 46 kb/d. The December production decline was caused by bad weather in many states.

Read More

US November Oil Production Shows Small Drop

A Guest Post by Ovi

All of the Crude plus Condensate (C + C) production data for the US state charts comes from the EIAʼs January Petroleum Supply monthly PSM which provides updated information up to November 2022.

U.S. November production decreased by 35 kb/d to 12,375 kb/d. For November, the state with the largest increase was Oklahoma with 19 kb/d while North Dakota had the largest decrease, 23 kb/d. The GOM also experienced a production drop.

Read More

US October Oil Production Pushed Higher by New Mexico

A guest post by Ovi

All of the Crude plus Condensate (C + C) production data for the US state charts comes from the EIAʼs December Petroleum Supply monthly PSM which provides updated information up to October 2022.

U.S. October production increased by 69 kb/d to 12,381 kb/d to a New post pandemic high.  It should be noted that September’s oil production increase of 289 kb/d to 12,268 kb/d which was reported last month and was considered high, was revised further up by 44 kb/d to 12,312 kb/d in the current October report. For September, the state with the largest increase was New Mexico 41 kb/d, along with a number of small increases from the smaller producing states.

Read More