The Bakken and All North Dakota oil production data is out.
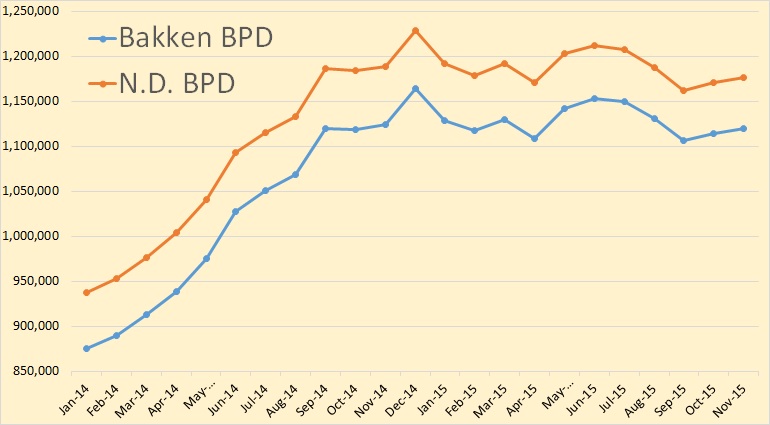
Bakken production was up by 5,166 barrels per day to 1,119,380 bpd While all North Dakt0a was up 5,195 bpd to 1,176,314 bpd.
North Dakota production has been basically flat for 14 months. Both North Dakota and Bakken production is still below their September 2014 levels.
From the Director’s cut
Producing Wells
October 13,190 (all time high)
November 13,077
10,655 wells or 81% are now unconventional Bakken – Three forks wells 2,422 wells or 19% produce from legacy conventional pools.
ND Sweet Crude Price
October $34.37/barrel
November $32.16/barrel
December $27.57/barrel
Today’s $20.00/barrel (lowest since March 2002)
(all-time high was $136.29 7/3/2008)
Rig Count
October 65
November 64
December 64
Today’s rig count is 49 (lowest since August 2009 when it was 45)(all-time high was 218 on 5/29/2012)
The statewide rig count is down 78% from the high and in the five most active counties rig count is down as follows:
Divide -77% (high was 3/2013)
Dunn -74% (high was 6/2012)
McKenzie -72% (high was 1/2014)
Mountrail -88% (high was 6/2011)
Williams -88% (high was 10/2014)
Comments: The drilling rig count decreased 1 from October to November, held steady from November to December, and decreased 15 so far this month. Operators are now committed to run fewer rigs as oil prices continue to fall. The number of well completions fell sharply from 43(final) in October to 26(preliminary) in November. Oil price weakness is now anticipated to last through this year and is the main reason for the continued slow-down. There were no significant precipitation events, 5 days with wind speeds in excess of 35 mph (too high for completion work), and no days with temperatures below -10F.
Over 97% of drilling now targets the Bakken and Three Forks formations.
At the end of November there were an estimated 969 wells waiting on completion services, only 6 less than at the end of October.
Crude oil take away capacity depends on rail deliveries to coastal refineries to remain adequate.
The drop in oil price associated with anticipation of lifting sanctions on Iran and a weaker economy in China is leading to further cuts in the drilling rig count. Utilization rate for rigs capable of 20,000+ feet is about 35% and for shallow well rigs (7,000 feet or less) about 20%.
Drilling permit activity declined October through November then fell further in December as operators continued to position themselves for low 2016 price scenarios. Operators have a significant permit inventory should a return to the drilling price point occur in the next 12 months.
The EIA’s Short Term Energy Outlook came out a few days ago. They are expecting production growth to continue in 2016 and 2017. But all the growth plus some, they say, must come from OPEC. Non-OPEC production will be down so the “Call on OPEC” must make up the difference between supply and demand.
In other words they are saying “OPEC will save us from peak oil”.
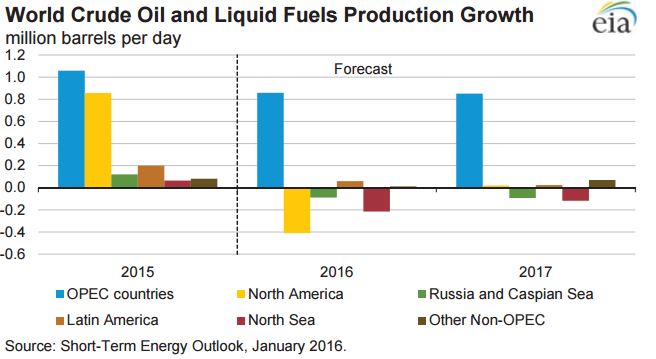
They are expecting OPEC to continue to increase production while North America takes the largest drop followed by the North Sea then by Russia and the Caspian Sea area. The Caspian area is basically Azerbaijan and Kazakhstan.
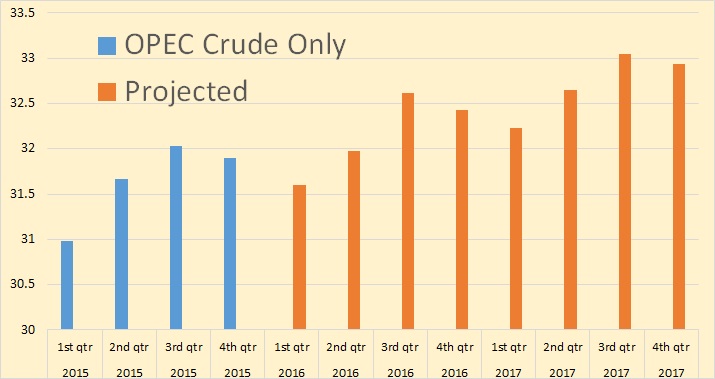
This is their quarterly expectations of OPEC. Down in the first quarter of 2016 but above the fourth quarter of 2015 for every quarter thereafter.
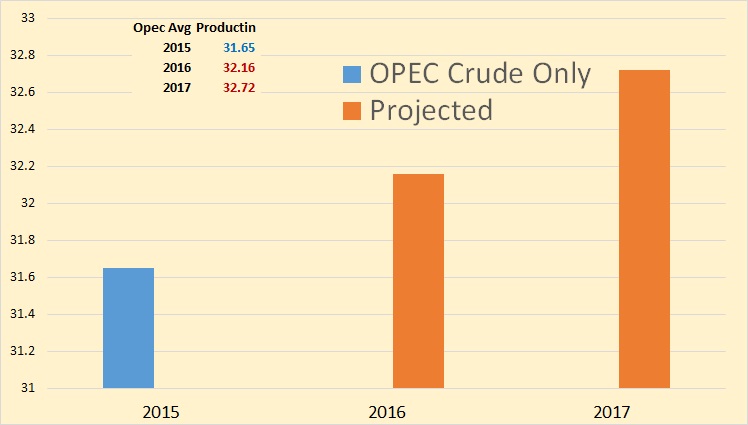
This annual chart fives a somewhat better look at what the EIA expects OPEC to do in the next two years.
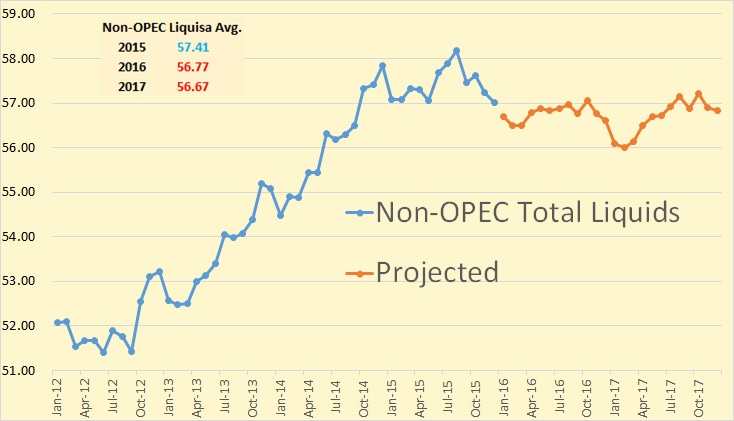
Here is what the EIA expects Non-OPEC total liquids to do in the next two years. They are expecting the Average Non-OPEC production to be down 640,000 barrels per day in 2016 and down another 100,000 bpd in 2017.
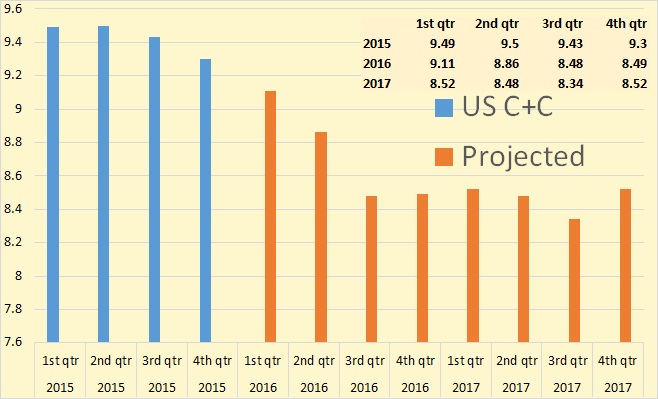
The EIA STEO gives us their Quarterly C+C numbers for the US, but not other countries. The EIA says US Crude + Condensate averaged 9.43 million bpd in 2015, and will average 8.73 million bpd in 2016 and 8.46 million bpd in 2017.
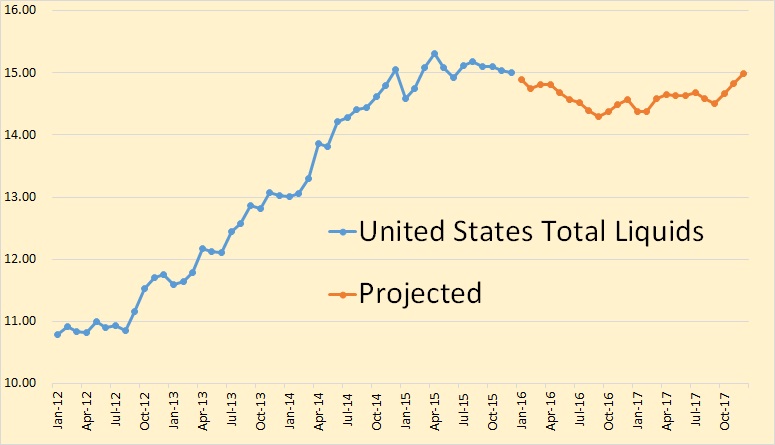
The EIA is expecting US total liquids to do a bit better than C+C. They have total liquids averaging 15.02 million bpd in 2015, 14.6 million bpd in 2016 and 14.63 million bpd in 2017. That has C+C dropping 700,000 bpd in 2016 and another 270,000 bpd in 2017. But they have total liquids dropping only 420,000 bpd in 2016 and increasing by 30,000 bpd in 2017.
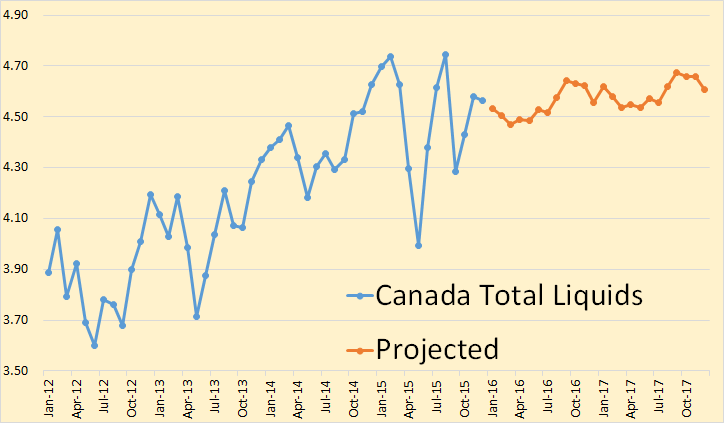
The EIA has Canada basically flat for the next two years. They have Canadian total liquids averaging 4.5 million bpd in 2015, 4.55 million bpd in 2016 and 4.6 million bpd in 2017.
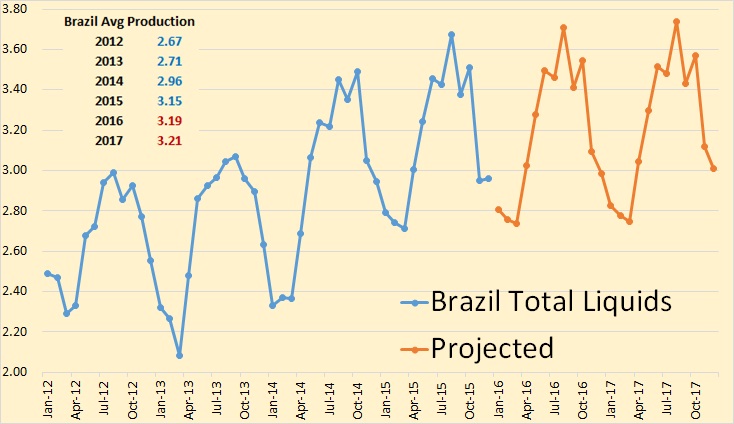
The oscillations you see in Brazil’s total liquids production is caused by their seasonal ethanol production. But basically they have Brazil almost flat but slightly up for the next two years.
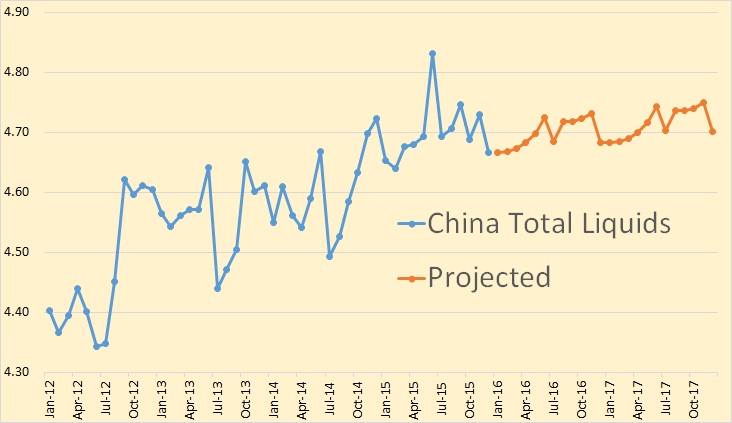
They have China total liquids almost flat for the next two years. They have them averaging 4.7 million bpd in 2015, 4.7 million bpd in 2016 and 4.72 million bpd in 2017.
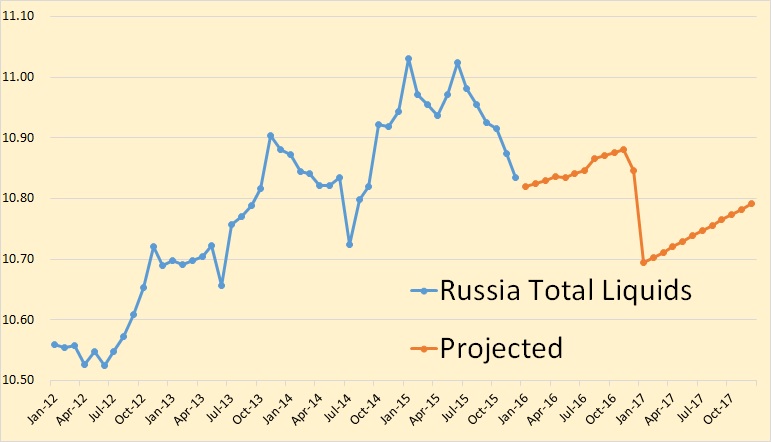
And last but not least we have Russia. The EIA has Russian total liquids dropping by 100,000 bpd in 2016 and another 110,000 bpd in 2017.
Looking at these numbers it becomes obvious that the EIA is just making a wild guess at future oil production for everyone in the world except the USA. And their guess for the USA is only a slightly better educated guess than elsewhere.
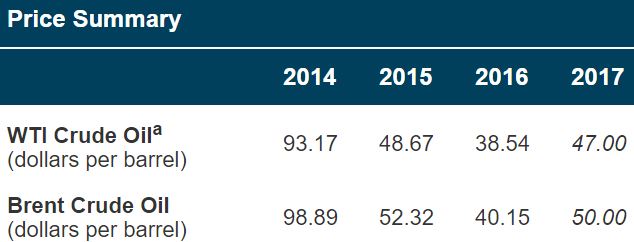
And here is what the EIA expects the price to do in the next two years.
304 responses to “Bakken up in November plus STEO”
So 113 less well. 26 new completions and production up????
This is why God gave us chokes.
You reservoir is normally not too happy though – does the same apply for shale? Seems to be very desperate approach and will hurt in the medium run
Choked ’em at $100 barrel and unchoke at $30 a barrel. Brilliant business plan.
“Looking at these numbers it becomes obvious that the EIA is just making a wild guess at future oil production for everyone in the world except the USA. And their guess for the USA is only a slightly better educated guess than elsewhere.”
Pretty much.
Yeah. Wow. I could make better wild guesses just by looking at Hubbert production curves.
If your job is to project that demand is going to continue growing and supply is going to continue meeting demand, then the “call on OPEC” is the reasonable way to proceed. After all OPEC are the ones doing their best to increase their production, growing or keeping their number of rigs and with Iran ready to start selling this month all the oil it has in tankers and increasing production.
Compared to OPEC all the rest look bleak. Nobody seems to be able to increase production significantly.
The real issue is that EIA is probably being too optimistic in judging OPEC increase and underestimating some of the rest of producers decline.
The decisive factor on oil price is the economy, whether it starts recovering from current weakness as some factors indicate or it goes down in recession as others suggest.
Javier: “If your job is to project that demand is going to continue growing and supply is going to continue meeting demand, then the “call on OPEC” is the reasonable way to proceed.”
For once, I think this is fair enough. Iran is being allowed back into the market and has the capacity to increase production. It is conceivable that Iraq will succeed in reconstructing enough of its oil industry to increase production as well. These will be sufficient to overcome depletion from existing fields – and then some.
What we need to realise is that “above ground issues” have been putting limits on production in several countries. The potential resolution of these issues does not invalidate the Peak Oil thesis.
What I’m hanging out for is to see Ghawar fail. When that happens, everyone in the market will start treating Peak Oil as a fact.
I am with Ron on this. I am of the opinion that US tight oil is going to show such reduction in 2016, that almost every producer is going to show some decline, and that Middle East OPEC is not going to be able to increase its production enough to compensate, as 2015 being the Peak Oil.
It is very possible that prices will recover, but before production recovers to a level of production above 2015 we will have a global recession sending prices, demand and production to a lower level again.
Sorry for geologists, but Peak Oil is going to be an economical event. And it is going to be misunderstood. People will be lead to believe that we still have plenty of oil, it is just that we don’t need that much anymore for a variety of reasons. Peakoilers are never going to get any recognition, and markets do not need to show any panic about it. Only the smart money will see the painting on the wall.
The stock market in the United States is in a tailspin, and the analysists at CBS news are pointing the finger at low oil prices.
Aren’t low oil prices supposed to be a boon for the aggregate economy?
You can never trust the post-hoc explanations that analysts give about what the stock market is doing.
What Javier said. Every time the market randomly fluctuates (probably due to program trading or what the traders ate that morning), analysts give a “reason” for it, but they’re incredibly post-hoc and nearly always wrong.
Sorry for geologists, but Peak Oil is going to be an economical event.
Peak oil will be, or was, an economical and a geological event. Or better yet, it will be an economical, geological and a technological event. There will always be far more oil left in the ground than can ever be recovered, given the technology and resources available to recover it.
Hi Ron,
I agree completely.
Javier: “I am of the opinion that US tight oil is going to show such reduction in 2016, that almost every producer is going to show some decline, and that Middle East OPEC is not going to be able to increase its production enough to compensate”
Agree on the first two statements, disagree on the third. Iran can increase and so probably can Iraq. The increase will be enough to compensate for reductions elsewhere. But then they will have hit the roof and have nowhere to go but down.
We will probably be able to tell in about 6 months whether the 2015 peak in oil production is developing as “The Peak Oil” or not. By then we will see how much the Middle East is increasing with respect to the US decline.
Hi Javier,
There will be a recession in 2016? Interesting. I think 2030 is more likely.
Can you tell us how serious this recession will be? More or less severe than the GFC of 2008/2009?
I didn’t say there will be a recession in 2016. I said there could be a recession in 2016. Citigroup thinks it has a 65% chance based on historic data. I think it has a higher chance.
What is your 2030 prediction based on? 22 years without a major recession speaks of a very different economy to what we have, and of strong growth that we lack.
Hi Javier,
For the World as a whole, the only year that real economic growth was not positive was 2009, over the period from 1960 to 2014, so that is one year out of every 54.
If we look at World Real GDP per capita, there were 4 recessions, 2 from oil shocks (1974-5 and 1982) and 1991 and 2009, that is 4 recessions (not the usual way of defining them though) in 55 years or one every 13.7 years.
If we take the average of these two methods of identifying recessions we would have one recession every 35 years.
If we have another recession between 2030 and 2040 (a single year would be very difficult to get right), that would be 26 years after the last global recession. Time will tell if my guess is correct, but peak fossil fuels is likely to lead to slower economic growth and I expect that peak will be around 2030 (for combined energy production from coal, oil, and natural gas).
You’re extrapolating from the wrong period. The twentieth century is an economic anomaly for several reasons including the wealth distribution (much more equitable than usual, see Piketty) and government policy (much more Keynesian than usual, probably because of the wealth distribution).
Anti-Keynesian government policies which benefit the relative position of a small elite — the norm from the Industrial Revolution until 1945 — give you a *much much higher rate of recessions*. Look at the 19th century data.
“The twentieth century is an economic anomaly for several reasons including the wealth distribution (much more equitable than usual, see Piketty)”
Apparently that started to change in 21st century:
Richest 1% will own more than all the rest by 2016
The combined wealth of the richest 1 percent will overtake that of the other 99 percent of people next year unless the current trend of rising inequality is checked, Oxfam warned today ahead of the annual World Economic Forum meeting in Davos.
The international agency, whose executive director Winnie Byanyima will co-chair the Davos event, warned that the explosion in inequality is holding back the fight against global poverty at a time when 1 in 9 people do not have enough to eat and more than a billion people still live on less than $1.25-a-day.
Extreme inequality isn’t just a moral wrong. We know that it hampers economic growth and it threatens the private sector’s bottom line.
Winnie Byanyima
Executive Director, Oxfam International
https://www.oxfam.org/en/pressroom/pressreleases/2015-01-19/richest-1-will-own-more-all-rest-2016
I hereby forecast the average oil price in 2016 will be about $65 per barrel.
Everyday that it spends below $30 means a day that it has to spend significantly above $65 to give that average. In my humble opinion on a matter on which I am far from expertise, you are incorrect, Fernando. The economy cannot resist high oil prices right now, and I doubt the economy will improve that much in the coming months. If the global economy avoids a recession and improves, we might get an average between $40-$50. If not, it will be below $35. We will be swimming in oil that nobody can sell at the same time as production craters. A nightmarish scenario.
I do not think that oil price can reach $65 this year, not to say to average $65.
But not because “The economy cannot resist high oil prices right now”.
What is particularly wrong with the global economy, that it cannot afford $65?
Do we have a worldwide recession?
China’s economy is slowing not because of high oil prices, but because of long-term structural issues. Meanwhile, China’s oil demand continues to grow.
Empirical evidence suggests that the “oil burden” (total amount of oil consumption X price of oil) becomes unaffordable for the global economy, when it reaches 5% of global GDP. At $65 it would be only between 2 and 2.5%.
The key reason for the current glut in the oil market is excess supply, not the weakness of the global economy.
Hi AlexS,
I agree $65/b average price seems too high, my guess would be $50/b for an average oil price, but $65/b by Dec 31 2015 seems possible, though I might guess $60/b for an average monthly price in Dec 2016.
Both Fernando and you know more about the industry than me, so both your guesses would be better.
Could you give us your guess for the average in 2016, it seems to be more than $30/b and less than $65/b based on previous comments, maybe $42.5/b ?
AlexS,
What is wrong with the global economy is that it is at the brink of global recession. The global economy was being sustained by strong debt-based growth in Chindia creating huge malinvestment there, manifested in ghost town projects. Whether China stabilizes or not, it is no longer capable of sustaining previous strong growth because of high indebtment and flow of capitals outside the country. OECD is in the midst of a deflationary situation with the economies temporarily stabilized by the collapse of oil prices, while all commodity exporting countries from the developing world are entering recession.
We were going directly towards a new global recession, when oil prices collapsed delaying it. But low oil prices are not a cure, they alleviate some symptoms while creating other serious problems.
I agree with Petro below that if oil price goes above $65 in the current situation, that would directly trigger a global recession. Since a global recession is the biggest fear to the economical powers of the world, oil prices are not going to be allowed to recover unless the global economy recovers.
I suppose it makes sense now why sanctions on Iran have been lifted at a time when the world does not need more oil, and when such a decision, pushed by the US and EU, was clearly going to worsen the situation of the US oil industry.
Oil prices have to remain depressed for the foreseeable future until a time when the economy improves enough to withstand higher oil prices. That time might not come. Alternatively oil prices could rise if the economic powers lose control of the situation. We definitely don’t want that to happen.
Most people don’t realize that most of the world is immersed in a deflationary crisis. A consumer crisis if you will. Due to long term unavoidable tendencies, population growth, robotics, globalization, there has been an excess supply of labor in the world. As a consequence labor has been cheated of their part of the increased wealth, and capital has retained the lion’s share of it, giving rise to growing inequality. To compensate for their stagnated purchasing power, labor increased its debt load to saturation in many parts of the world. Japan was the first to enter the deflationary hole. Despite being a remarkable country with a lot of things in their favor, they have been unable to get out. Now most of OECD is joining and will drag the world’s economy to the hole. This crisis has no solution, and Peak Oil will make sure our civilization never recovers.
There are plenty of solutions to the general deflationary economic crisis. Keynes described most of them. Most of these solutions are referred to as “socialism” in a derogatory fashion (whether they are actually socialist or not) so the capitalists running this country (and most other countries) refuse to implement them. Even the countries run by self-described socialists usually refuse to implement them… for whatever reason.
I’ll list off the solutions, in my personal order of preference:
(1) Large taxes on the billionaires, permanent direct cash transfers to the poor & middle class (a “guaranteed basic income” such as Milton Friedman supported)
(2) Cancellation of debt held by the poor and middle class, “sucks to be you” for the bondholder
(3) Printing lots of money and giving it directly to the poor and middle class
(4) Printing lots of money and spending it on building infrastruture, paying it to the poor and middle class for work
(5) Taxing the billionaires and spending that on building infrastruture, paying it to the poor and middle class for work.
The problem is essentially a political problem. Marx predicted that it could not be solved, because the billionaires would never agree to any of it, and that the result would be bloody warfare. The Tsar seemed to prove Marx right. But Clement Atlee and FDR proved that Marx was wrong. Then Margaret Thatcher and Ronald Reagan attempted to prove that Marx was right and that Atlee & FDR were aberrations.
I’m not sure who’s right about that but I’ll fight for the FDR/Atlee solution.
Robin: “Holy sharkfins, Batman!”
Batman: “That’s correct, Robin!”
Hi Fernando,
Are you serious or just poking fun at me? Even I think and average price for 2016 of $65/b is too high (the eternal optimist). I can see maybe $65/b by August 2016 (for the monthly average), but an average for 2016 of 55 to 60/b seems more reasonable, in my opinion. Though even that seems a little high, probably $50/b for 2016 would be my guess for the average 2016 oil price (WTI).
Denis, i have an equation i use to estimate forward price. When I plug in the data it says the average price one should use to evaluate well económics is $65-70 per barrel. I guess I should have explained where it came from. It’s just the number for a price deck one uses to run budgets, do económics, things like that.
Hi Fernando,
Thanks. So that is what the price should be in a rational world.
Hi Javier,
I agree the oil price will be determined in part by oil demand which depends mostly on the World economy. It is also determined by the supply of oil which depends on how profitable it is to produce oil at the prevailing oil price. Oil prices are determined by both supply and demand, each is equally decisive. Which blade of the scissors cuts the paper? The answer is both blades, just as both supply and demand determines the price.
Rising U.S. oil production is not surprising at all. Furthermore, I would contend that as the price of West Texas moves towards $20 and the Rig Counts fall by another 100 rigs, total U.S. oil production should increase towards 10 million barrels per day.
Thus, this is a huge victory for both ” Well Efficiency” and “Cost Cutting of Shale Oil production.” I would imagine as the price of oil moves even lower towards $10, continued increases in efficiency should be good for another 1 mbd addition of U.S. domestic oil production.
Which means, Peak Oil will become a complete farces as the price moves in the single digits and total U.S. production heads over 12 mbd.
Professor MudFlap
Prof – Your sarcasm is so thick we might have to mix it with Benzene to get it to flow.
Jef,
While I appreciate the witty comment… I want you to know I spend a lot of time looking over the charts. I take this analysis seriously.
That being said… I am very bullish on Chesapeake. I hear they have new Alien technology that can produce NatGas for free. I am taking all my kids college money and riding all on CHK’ s glorious return.
Prof. MudFlap
That’s nuthin!. NorthDakota sour was fetching -50c a barrel on Friday according to Flint Hills domestic price Bulletin. What they loose per barrel they will make up for in volume, thanks to new tech!:
https://www.fhr.com/refining/domestic.aspx
Hi Professor,
What we really need is for the price of oil to fall to zero because then we would have an infinite amount of oil. Yeah, we should just set the oil price to zero, that’s the ticket. 🙂
For the sarcastically impaired, the above was not meant to be taken seriously.
Mudflap,
Do u really think usa production will get to 12 mbd with oil prices dropping to 10 dollars.
This contradicts everything I have learned about the economics of oil production.
Are u serious?
Just when I thought I was starting to understand.
Where is Rockman, Mike or ShallowSand to comment? For the benefit of an honest bloke that just wants to learn…lol!
Lol! I missed the alien comment!
The EIA outlook for electricity generation is kinda interesting:
A decline in power generation from fossil fuels in the forecast period is offset by an increase from renewable sources. The share of generation from natural gas falls from 33% in 2015 to 31% in 2017, and coal falls from 34% to 33%. For renewables, the forecast share of total generation supplied by hydropower rises from 6% in 2015 to 7% in 2017, and the forecast share for other renewables increases from 7% in 2015 to 9% in 2017.
So in summary, they expect NG prices to rise relative to coal, more rain in 2016 and 2017 (more hydropower) and modest, continued growth in wind, solar and biomass.
The Baker Hughes Rig Count is out. US rigs down 14 but oil rigs down only 1, gas rigs down 13. Permian down 7, Williston down 2.
The Baker Hughes Rig count I believe misrepresents the rigs that were dropped. The vast majority of the rigs operating in the Permian, Eagle Ford, Colorado DJ Niobrara and Williston are drilling for oil not gas. This would be a total of 15 oil rigs layed down last week, not 1.
In addition, the rig count in ND should be at or below 15 by the end of March of this year. This is based upon rigs still drilling, but current contracts will not be extended.
“63 of the 89 analyzed NNRs (Non-renewable Natural Resources – essential to growing/maintaining industrial societies) were scarce globally in 2008.” “All indications are that we will attempt to reestablish and maintain or exceed pre-recession economic output (GDP) levels and growth rates, both domestically (US) and globally. We will soon discover, however, that ever-increasing NNR scarcity has rendered these goals physically impossible, and that the implications and consequences for human societal wellbeing associated with this reality are catastrophic.” Source – Scarcity, Humanity’s Final Chapter? Christopher Clugston
It is quite reasonable to assume a hard human population crash is baked in.
But with a MUCH reduced population, and the harsh task master of necessity constantly and forcibly inserting a steel toed boot into the REMAINDER of humanity’s backside, it is also reasonable to assume that some people in some places can at least POTENTIALLY adapt to shortages of non renewable resources WITHOUT giving up all or most of the truly good parts of modern life.
Sometimes we can recycle, sometimes we can substitute, and sometimes we can simply do without.
Just ONE invention- the PILL- along with other related technologies – has the potential to EVENTUALLY reduce demand for most resources by an order of magnitude. Nobody actually knows, but women with a modest education and access to birth control appear to be not only satisfied but even DETERMINED to have less than two kids on average.
The mouth pieces of the fossil fuel camp will continue to insist otherwise, but renewable energy CAN potentially at least support a new generation ” business as usual”. Call it bau lite or greenwashed bau, if you are being sarcastic, but it can at least POTENTIALLY come to pass.
Call it a religion if you please.
Now here is a truth about religions that is at the same time pie simple and yet over the heads of people who do not understand religion.
“Prayer changes people. People change things.”
If faith in technology and human enterprise together comprise a religion, that is ok, because people who believe are motivated and encouraged to ACT.
ACTIONS lead to change.
Is success assured? Absolutely NOT.
But a failure to act GUARANTEES failure.
http://blogs.scientificamerican.com/plugged-in/texas-sets-new-all-time-wind-energy-record/
Those of us who believe renewables can never shoulder the load ought to read it and THINK a little.
Nobody who is HONEST ,and knowledgeable, in advocating renewables says that going renewable means we can continue to live the way we do today.
But that does not mean that some of us cannot eventually live quite well while also living sustainably.
If I were building a new house today, it would need so little energy to heat and cool it that supplying it renewably would be a cakewalk. AND it would last, barring fire or tornado, for at LEAST a couple of hundred years. The old house I live in will last a couple of hundred years, and was built in a hurry out of oak lumber and masonry, with nothing even remotely high tech used, unless you consider steel roofing, fiberglass insulation, aluminum window frames, and glass high tech.
( The steel roof needs a new coat of paint every twenty years, instead of REPLACEMENT, and the aluminum windows were switched out for double glazed vinyl some years ago. )
I will have more to say about this link, and what it PROVES, in a later comment.
Hi I have some update graphs for Bakken. First average production profile. Confidential wells are not included, so that’s why the first 5 months of data may look strange. It´s a bit hard to see the lines but it’s just for reference for my other graphs that show gas to oil ratio and water cut. The production profiles for the different years are quite similar.
Here are the gas to oil ratio profiles. You can see that it started to increase about 8-10 months ago for all years. From 2013 and later the angle is very steep.
Either I don’t understand what the vertical axis of this graph is saying or it is just wrong. It is labeled “GOR (mcf/barrel).” 6,000 cf of gas has the energy content of a barrel of oil. The high end points of lines on the graph are around 1.5 which would represent 1,500,000 cubic feet of gas. This suggests that the gas energy content is 25 times the energy content of the oil. That is extremely unlikely, in my opinion.
Hi. mcf/barrel (of oil) is correct. It is not intended to show the energy equivalent. From what I understand, GOR is defined as mcf/barrel. I could be wrong, but anyway, the intention here is to show how the ratio changes over time and from year to year.
GOR units have to be spelled out. We engineers use SCF per BSTO when we are being picky.
The units in that graph are mcf per barrel. So if it’s 1.2 mcf/bbl then we can also say it’s 1200 cubic feet per barrel. Or 1.2 mmbtu (more or less). A barrel of oil has anywhere between say 4.8 to 6.5 mmbtu. I’m a bit tired, but I think I got it right.
The fact that 1000 cubic feet of natural gas is nearly a million BTU means that somewhat confusing terms can be used for the same commodity (1000 cf = 1 mmbtu).
1200 cubic feet per barrel would be a very reasonable 20% of the energy content of the oil.
If the m represents 1,000 in the oil patch what does it stand for? The metric system typically uses k for 1000 (kilo) and m for a million (mega)?
Don, m and mm is Roman. About 6000 cf has the energy equivalent of one barrel of oil. So if you divide the y-axis by 6, you will get the energy equivalent.
Thanks. It’s good to know what is happening with this notation.
In the oil patch, m is a thousand and mm is a million.
This is very interesting. It suggests that the quality of prospects are declining by year into rocks that have a more gas-prone source, perhaps. Gas molecules, being smaller, flow faster than oil molecules. The drive in these rocks is overpressuring caused by maturation. The more the pressure drops, the greater the preferential flow of gas relative to oil. Perhaps all the Bakken wells are going to die at once.
I found a very interesting paper called “BUBBLE POINT SUPPRESSION IN UNCONVENTIONAL LIQUIDS RICH
RESERVOIRS AND ITS IMPACT ON OIL PRODUCTION”
Link: http://petroleum.mines.edu/research/urep/thesis/2.Tuba%20Firincioglu%20PhD%20Dissertation%20Final.pdf
It´s more that 100 pages long and very technical, so I only looked through it quickly. But I found some really interesting information. First
“Capillary discontinuities and surface forces in confinement of the nano-pores of
liquids-rich reservoirs cause significant deviation from the conventional phase
behavior. The bubble-point pressure is suppressed in nano-scale pores and the
suppression amount is a function of the bubble radius and the interfacial tension.
Higher capillary pressure values (that is, the smaller the bubble radius) result in
higher bubble-point-pressure suppression. ”
So you can pump harder in an unconventional reservoir before it reaches the bubble point.
Now look at page 92:
“Predicting the GOR behavior of a well is very important from an operational perspective.
Most of the pumps that are used in unconventional oil fields are not capable of lifting fluids with
GOR values higher than 5000 scf/stb. So the GOR level in the well determines the lifespan of the
well. When a well’s GOR is low and steady like in Well_5, the life of the well is longer than a
well like Well_3 in which the GOR increases rapidly. Figure 6.18 compares the cumulative
production of the two wells in the model. With a GOR limit of 5000 scf/stb, Well_3 would be
abandoned due to pump limits after 4 years of production while Well_5 would continue
producing for 10 years. This would increase the cumulative production difference between the
wells even further. ”
Wow, so if you pump too hard the lifespan can decrease from 10 years to just 4 years! Looking at cumulative production in figure 6.17, it has decreased from about 2 million barrels to 1,3 million barrels. But of course if they can use better pumps, then I suppose they can get more oil out?
Perhaps figure 6.21 is closer to normal wells. In that case cumulative production is decreased from more than 2,6 million barrels to 2 million barrels.
Figure 6.20 is also interesting. Higher GOR gives a smal increase in oil production at first, but when GOR reaches around 2 (mcf/barrel) then oil production start to get lower than the reference.
Freddy
Now you are coming full circle back to the importance of pressurization/repressurizatin of these formations in unconventional development.
The blowout that Oasis experienced in the Bakken a few months back happened due to the increased pressure from a nearby, in progress frac.
As these laterals are placed closer together, as the amount of water used is increasing due to slickwater procedures, nearby wells are having elevated formation pressures which is increasing their output.
And here are the water cut profiles. It is also increasing for all years, but more slowly than the gas to oil ratio.
One problem with the above three graphs is that even in the last datapoint, the average input data is half a year old as they only contain complete data. So bellow graphs better show whats happening on a monthly basis.
First oil, gas and water production for wells that are 6 months old. As before oil production continue to stay rather flat compaired to gas and water production which are increasing. Oil plus water is a bit lower the last 3 months though.
And finally same as above but for wells that are 24 months old. Here we can see that oil production is actually leaning slightly downwards since 2010. This even though initial production for the wells in 2013 where higher than earlier years because of completion improvements.
Well, I got my answer. The posted price on Flint Hills Resources Crude Price Bulletin for 1/15/16 for ND sour crude oil is -$0.50.
Does this mean if you call them to haul a tank they will require payment up front, or will they send you a bill? LOL!!
Seriously, can someone explain this and if they have ever seen this before? Maybe in 1998-99??
I do think it very noteworthy that the OPEC basket is below $25 and that many crude oils both in North America and around the world are selling for under $20 per barrel, with some selling under $10 per barrel.
I suspect heavy crude in the Rockies, of which there is quite a bit in places like CO, WY and MT, is selling under $15.
“Seriously, can someone explain this and if they have ever seen this before? Maybe in 1998-99??”
Hey Shallow…
…oh, I CAN and indeed, I HAVE explained THIS to you…and you (et al.) have chosen (so far anyway…) NOT to listen…..
-There are many (including in this respected forum) ……oh, what one calls them….:
“Monday morning quarterback”, I guess….who are calling for $10 oil now, but… If you go back and read the comments (some in reply to you directly!!!!) on this forum 6, 8, 10….even 12-14 months ago, you will know the handful (…and I am being VERY GENEROUS by saying: “…a handful….”!!!!) of commentators who REALLY knew what they were talking about…
…perhaps you have learned and shall know better WHO to listen to next time….
perhaps…,…one can only hope…
Be well,
Petro
Petro, Errrr, you really didn’t say anything here, just… “I told you months ago.” Perhaps you did but I am skeptical unless you can post the link to those comments. One thing for sure, you explained absolutely nothing in your post above. Which leads me to doubt that you ever did answer the question Shallow is asking.
Perhaps I am wrong but it would behoove you to prove what you are saying.
I was just asking for an explanation about why a grade of crude would go negative, rather than just be zero $.
Petro, I had typed a long whiny response to you, but deleted it. Not worth it. So I’ll do a shorter one.
All I will say is I think an oil price of under $30 (or $50 for that matter) is contrived, the same as I felt the 2008 run up was contrived.
I care about a lot of people. I saw many lose their jobs as a result of the 2008 meltdown, which I believe was helped along by $120-140 oil spike. Most of them were not in oil. We helped keep one family from losing their home. To this day, they are grateful, but yet I am sure embarrassed to have had to ask. Hard working family, but both got canned the same month. They should not have had to be in that position in the USA.
I also have many friends now who are out of a job, and maybe a way of life, due to this crash. The ones who own leases currently have assets worth less than zero.
It’s is not a game, or something to be cryptic about. It is F’ ing real.
Have you had to fire a good worker due to circumstances out of your control? Answer that one with some cryptic BS.
Dear Shallow,
I misunderstood the question/comment. I apologize!
I was not being “cryptic” and or insensitive.
Unfortunately, when I realized, the comment was posted.
I know very well the pain is real.
I am connected to oil/energy in my line of work.
Again, I misunderstood and I apologize!
Be well,
Petro
Apology accepted.
Thank you, Shallow!
And thank you for not posting your “long, whiny response”.
It was indeed not worth it!
And I feel bad, for I had a detailed, technical answer to/for your question…but we are beyond it now, I guess…
Be well,
Petro
I don’t have any problem with reading an answer to my question as to why a price for a grade of crude would go negative, instead of zero.
Find my answer below OFM comment…
Be well,
Petro
Ron,
you are correct!
My bad.
Be well,
Petro
Ron,
my reply to Dennis’ comment below did not show up yet.
I was wondering if you can help.
It was comment-555927 , I think.
Thank you.
Be well,
Petro
Ron,
Thank you for helping with my “in limbo” comment/reply to Dennis!
Be well,
Petro
Hi Petro,
Can you remind us what you were predicting 12 months ago?
My expectation was totally wrong, I thought US output would decline quite rapidly and it did not, keep in mind, most of us focus on WTI or Brent, many other grades of oil have always traded at a discount because they are more difficult to refine.
So let’s focus on WTI, what were you saying exactly 12 months ago for prices in Jan 2016 (or the end of 2015). Did you say the oil price would be $30/b?
That is excellent, can you give us your prediction for Jan 2017? Maybe you will be lucky two times.
You should be a very wealthy man with such good foresight. 🙂
Hi Petro,
As far as I can tell you have not said anything about oil prices, as Ron said your comments are cryptic, not clear what you are saying.
Dennis,
my reply (comment-555927 i think it was) did not show up…yet…
I am going to ask Ron about it and see if he can help.
Be well,
Petro
Ah, these pesky computers, dear Dennis….
they have the naughty habit of “remembering” things…..(that is why NSAlikes to “pick” inside them!)
-So let’s see if the computers remember…
too many comments of mine on the topic, but let us start with your favorite timing, shall we:
” So let’s focus on WTI, what were you saying exactly 12 months ago for prices in Jan 2016 (or the end of 2015). Did you say the oil price would be $30/b?” ~Dennis Coyne
Well, as a matter of act I did:
http://peakoilbarrel.com/opec-crude-oil-production/#comment-485300
I suggest you scroll down to the part of the comment where I write …
“Prices are headed in the direction of 1999 again…..”
This baffled nNgass, who in response to my comment, wrote:
http://peakoilbarrel.com/opec-crude-oil-production/#comment-485461
nNgass wrote that, for my comment was indeed bizarre to him back then (January, 2015);
I was the only one on the site saying that.
You and others were busy “narrating” about the demand/supply bs and when the drop in the rig count would take prices at $100 again….and the SAD part dear Dennis, is that you are still doing that ….but this time is January 2016…
-What nNgass (and obviously you) did not know is that I had a few other comennts like that dating back in July and August of 2014 (imagine that ….right when this whole thing started and oil was at >$100/brl)
As a matter of fact -and let us see if the computer “remembers” again -I was schooling/lecturing you (and that is the correct wording, no arrogance there. You shall understand when you read the comments how truly uninitiated were you on the topic of deflation and what that meant to/for commodities – specifically oil!)….as it turns out, clearly fruitlessly:
http://peakoilbarrel.com/debt-oil-price-bakken-red-queen/#comment-418791
http://peakoilbarrel.com/debt-oil-price-bakken-red-queen/#comment-419619
…and then more recently there’s this:
http://peakoilbarrel.com/peak-oil-open-thread/#comment-545553
…and then this:
http://peakoilbarrel.com/international-rig-counts-2/#comment-555175
I have plenty more, but I think I was simple enough for you to understand my point….
You wrote:
“You should be a very wealthy man with such good foresight”.
-I worked in energy investment banking with the best in the business Dennis and was rewarded very handsomely for it (still am…).
…oh, and dear Dennis – IT IS NOT LUCK!
Be well,
Petro
Hi Petro,
Well I hope you continue to predict markets correctly. It is possible that oil could hit $10/b some day. Probably in 2060 or later when the economy has moved to other energy sources and oil has gone the way of the buggy whip,
You think you understand economics better than everyone, my guess is you are mistaken.
-Wow…quite a tone/tune change from your previous comment, ain’t it!
Those darn facts are indeed mean, stubborn sons of Bs, aren’t they?!?!
“You think you understand economics better than everyone, my guess is you are mistaken.” ~ Dennis Coyne
Boy, you have no idea how dearly I do agree with you there, and how MUCH I hope you are right….for the sake of all of us and our children!!!
Be well,
Petro
P.S.:
let us not question each others morality, integrity and intentions from now on, shall we Dennis?
Not a good idea!
Let’s debate in a healthy way and question our knowledge and input, but not our intentions and morality. This way we ALL learn from eachother.
Hi Petro,
I just couldn’t find your oil price predictions, which were that we were headed to 1999 oil prices (at some time in the future), you did not say when this would occur, so not much of a prediction really.
Anyway I am not paid handsomely for market predictions (and a good thing because I am not correct on oil prices often).
I could make a very nebulous prediction that oil prices are headed to $100/b. No doubt at some point in the future I could claim to have made a correct prediction. 🙂
Yep!
Right on brother, you got me there!
G’nite and be well Dennis.
Petro
Hi Petro,
I couldn’t find your comments, giving oil prices.
In 1999 the average oil price in 2014$ was about $25/b, and although we are not there, we have certainly headed in that direction and your guess was certainly better than mine.
Note that at the time you did not say when this would occur (the future covers a lot of ground).
So can you tell us what your expectation for the oil price (WTI) in Dec 2016 is (monthly average)? A range would be fine, say $20-30/b or whatever range you are comfortable with.
Petro.
I hope you realize this all is not just some game. I really don’t know what you are driving at. I don’t really care if you are insulting me, I cannot tell. But you seem to be trying to tell others besides me something. I think you are telling “us” that we are idiots and mocking us?
Try telling that to all the people who have been fired in the industry in the last 12-15 months.
Try telling that to my friends who have shut down their wells and are looking for any job. Guys who have been their own bosses for 20+ years, who survived 1998-99 but cannot keep things going now. They work every day of the year, and much of what they own is currently worth less than zero.
Try telling that to all the retired people who own royalties, who are seeing a part of their meager income shrink or disappear altogether.
Try telling that to the kids in college who are in petroleum engineering, who went from looking forward to high paying jobs to no job and having to change majors/go to school longer/incur more student debt.
Maybe oil is finished, will be below $30 forever, or whatever you are driving at.
All I know if there seems to be more and more economic suffering going on in this country. Boom and bust is not good for the vast majority of this country.
Most people would like to have job stability, a decent house, be able to provide for their families. My grandfathers both had 8th grade educations. But they worked hard. They had that stuff, house, food, able to provide for kids, etc. They worked the same stable jobs their whole lives. My father and uncles have done the same. You may think constant jov upheaval is a good thing. I do not. It hurts our country.
I know this post is whiny, but I don’t care. I care about people. There is a lot of lack of respect for people these days. Making fun of misery. I’m sick of it.
I have kids. They are smart, don’t get in trouble, respect others and themselves. I worry about them every day.
Dear Shallow,
if this is your “long, whiny answer”, (probably “got stuck” akin to my reply for Dennis and is showing after my apology above) – I still accept it and apologize.
I do, indeed!
Let’s get past this…
Thank you for understanding.
Be well,
Petro
I thought I has deleted that. Oh well I am over it. Hope I was not too whiny.
Since you know a lot about where oil prices are headed, any chance you can give us some insight from here?
Dear Shallow,
I will have an answer for your original question…
…after my first answer to it (mistakenly, as we established already!), I owe you one!!!!!!
One thing, though…:
if you would like to know where we are (very likely) headed, do your self a favor and “drop” your emotions with regard to the topic….
Although truly and utterly justified on a human/social level, they “cloud” your view…scientifically speaking.
M. Simmons taught me that……….
Be well,
Petro
No problem. We know pretty closely what it will cost to plug and abandon. We also know it will take quite awhile, and that we will start with the worst, first, in the event things change. That is pretty much the worst case for the oil. I’m worried about everything else if we are entering a deflationary spiral.
No emotion here on this discussion from this point, both ways, works just fine for me.
I read your previous posts.
You do not think OPEC will cut, or do you think that will not matter?
I assume you think oil demand is not increasing from this point forward?
I would note the Fed did raise interest rates, contrary to what you thought. However, it appears maybe this was a mistake, so I am not holding that one against you at all.
I agree that worldwide debt is a problem, but it has been for awhile and at many other times throughout history.
“I would note the Fed did raise interest rates, contrary to what you thought”
No, they did not!
Do not get caught on headlines…they increased overnight fed fund rates for the dealer banks in hopes of them making more loans, so that the REAL interest rates (i.e. your mortgage rates and inflation rates) increase, for pension plans and insurance companies are imploding. Fed fund rates are very different fro REAL interest rates (which are negative….still….and in perpetuity….)
-But if you have noticed since the Fed “increased rates a month ago, everything is shaking and having a seizure and MOST importantly, the 10 year treasury note (upon which every loan, or APR is based) is LOWER today than December 17.
It is a very complicated process….I wish I could be more helpful in simpler terms.
…and believe me: Fed rates (even though they will “increase” a bit more in the coming months) will FIRST go to 0% BEFORE they reach 1%
Again, do not get caught in headlines…
We are headed for NIRP (and if you read my posts, I used that term BEFORE anybody here even knew what that meant….) and “helicopter money”….
Be well,
Petro
You guys are a riot…
(Petro, where are you located?)
Chuckling aside, as a layperson here (and a good lay’ at that– nothing arrogant, mind you ;), I imagine that it’s as simple– and I know Petro has mentioned the exponential function for example– as the uneconomic machine sucking ever-harder through an ever-narrowing straw at ever-thickening dregs to power its ever-weakening sucks, yes? Well, if so, this smacks of a feedback loop. And, if so, my intuition is telling me we are in bigger trouble than what some people may realize.
‘…Now if ‘we’ could only thin out the Middle East populations a little… and take more fuller control of the oil infrastructure and area…’
I also seem to recall BC ‘forecasting’, maybe a few months to a year ago, oil around the price that it is, with a qualification, something to the effect that they thought that most on here would think they were crazy.
Of course then there’s shortonoil (apparently, AKA BW Hill) and Futilistist’s aforementioned fast-collapse contention, ostensibly through their ‘fog’ of psychological difficulties.
Just for the record, I have not kept up-to-date with Guy McPherson and whether he has revised his human extinction forecast time-frame or not.
“…my intuition is telling me we are in bigger trouble than what some people may realize…”.
Your intuition “tells” you well (as unfortunate as that may be…), dear Caelan.
I am glad you read me correctly and I am envious of your “light” and humorous understanding of things…
be well,
Petro
What’s Dennis’ (Coyne) backup plan, if you might know, if you are correct?
My ‘lightness’ seems to be tempered or balanced with some extreme seriousness. Perhaps it’s because we need balance for a healthy psyche.
Hi Caelan,
Are you asking your question to me or Petro?
I have no plan. Nobody knows what the future will bring, only that it is very likely to be different than the present.
I envision a future with lower population using energy and resources in general much more efficiently due to scarcity. Fossil fuels will peak and decline and will become more expensive, alternatives such as wind and solar will decrease in cost relative to today’s costs and become more competitive with fossil fuels and gradually will replace fossil fuels.
The transition will be difficult, perhaps impossible, there is no backup plan, society will have to adjust to the resources that are available, as it has always done.
That is unlikely to change.
So the plan is that there is no plan.
“What’s Dennis’ (Coyne) backup plan, if you might know, if you are correct?”
Caelan,
If I am correct (and I truly and dearly pray to God I am not – and Dennis is!
I have children and hopefully a few good years and grandchildren ahead of me…), but if numbers do not lie and I read them correctly…which again, I hope I don’t…
…I, or you, or Dennis, or anybody/ everybody will NOT need a back up plan.
-We shall need our family close by and pray that IT (whatever IT maybe) is quick and not too painful…
Be well,
Petro
Thanks, guys… So the small consensus between you two seems to be that no plan is good to go, yes? Why’s that?
So maintain business-as-usual? Keep shopping and driving (to work)? Let the (pseudo)government take care of the rest? Forget relocalization, resilience and related; the ‘Peak Oil 101’ stuff?
How? Is there a ‘Be Well’ plan that I am unaware?
“So the small consensus between you two seems to be that no plan is good to go, yes? ”
Yes Caelan, but Dennis and I come to that “consensus” from very DIFFERENT points of view….
…and yes, you can be well!
Try a good vintage Bordeaux and a well aged Cuban or Nicaraguan….
Petro
Hi SS,
First off, I want you and your friends and family in the oil biz to know that while I am a big advocate of electrification of the personal auto, etc, I don’t expect the world to go renewable fast enough to do much if any harm to the oil biz for the remainder of your working life. Depletion and hard times on the part of consumers might put you out of work, depending on how old you are , but it will be a LONG time before electric automobiles displace gasoline burners.
I know almost nothing about oil from a hands on pov , but being a small businessman, and one who reads a hell of a lot, I do know a little about how businessmen behave when they are short of cash and running at a loss.
Sometimes, quite often actually, you lose LESS by staying open, than you do by shutting down. A restaurant operator with a ten thousand dollar a month lease has to pay the ten grand even if he closes the doors. He can maybe stay open, and make enough on sales to reduce his overall loss for the month to less than the ten grand, maybe a lot less.
But if staying open doesn’t generate any cash, he NEEDS to close asap.
An oil producer operating as a BUSINESSMAN can be expected to shut in any production that costs him more on a day to day basis than it sells for.
So – you have shut in some wells, as is reasonable, but I am willing to bet you are still producing some, on a losing day to day basis, so long as the loss is small, in order to keep your crew together, and maybe in the hope that keeping the wells up will cost LESS than putting them back on line later, when the price goes up.
Let us suppose you are NOT a businessman, in the usual sense, but a NATIONALIZED oil company manager.
Now what are your priorities? You still need to make a profit, long term you are more or less compelled to make a profit, even if you get it in the form of a subsidy. You still balance your books, one way or another , or you WILL shut down, eventually.
But what about the short term? The government may make it impossible, or nearly impossible, for you to do what you really ought to be doing, as the manager. The fear of labor unrest, the loss of national prestige, the question of what happens next election, etc etc, may result in higher ups in the government TELLING you what you are going to do, whether it makes sense or not.
I can’t see any reason why a company with good management would sell oil for ten or fifteen bucks that COST more, in direct immediate day to day expenses to produce, except if legally trapped into doing so, as for instance to hold a lease, hoping for a higher price. MAYBE management would know in some cases that shutting in temporarily means shutting in PERMANENTLY ? and so gambles the day to day loss against possible future profits?
I think maybe the real problem is that ENOUGH GOVERNMENTS are involved in producing oil to temporarily trump the ordinary rules of the business world.
Maybe the government of country X would rather eat not only a long term loss, but also even a SHORT TERM day to day loss, rather than suffer the loss of face involved in just shutting in production. Country Y observes what X does, and follows suit.
Pride and politics might be bringing about a race to the bottom.
These remarks are intended as snack foods for thought. Maybe you or somebody else can add to them.
OFM:
This is almost word-for-word what I have been telling friends and family about oil production for about the last year.
Dear Shallow
as I said, I owe you an answer ….
I will try to avoid too much technicality and be as concise as possible, but will still be long – sorry…
I am dividing my answer in 2 parts:
-Macro-view, or overall “picture” if you will and,
-Micro-view, or more practical and directly related to your question (why crude or specific densities of it sell for -$?).
Macro-view:
First, do not get emotional. As dark and as difficult the situation you and your colleagues find yourself in is right now, it is very likely going to get worse (and, I am afraid, much worse. This is my personal view, please do not “quote” me on that).
Secondly, set aside everything you read here, or on every/any other forum/site/media/book/paper/publication/presentation etc., etc., etc., they confuse and make you “foggy”.
Now, I am NOT suggesting to not read and/or comment on this respected forum and/or others – I do it myself (and today, maybe a bit much…). I am saying to do it in a more “relaxed” manner and to enrich your overall understanding of things, rather than seek solutions.
There aren’t any!
Most importantly (and here comes the “technicality”), get OUT of your mind and forget about (literally!) concepts such as: supply/demand, market fundamentals, well-head cost, first year per well production, heavy crude cost, IEA/EIA projections, number of rigs….blah, blah, blah…..
Economic laws and fundamentals as you and I (and everybody else) have learned and known them to work before, do NOT work anymore. It sounds crazy and idiotic, but in the environment we are in, is true (hint: up-streamers are paying mid/down-streamers to “take” their stuff and everybody – and I mean: everybody in the world – is producing full capacity as prices go to $0. Is that how demand/supply works? I do not think so…but I digress).
The ONLY thing you need to know about fundamentals is this (I am going to use rough numbers here, so don’t “fight” me with the decimal points – so to speak):
-Oil above $60-$70/brl kills the economy; Oil below $50-$60/brl kills your business. Pick your poison!
Demand/supply and market fundamentals worked flawlessly before, for the above numbers were far apart. We had plenty of sub $10/brl oil in the ground up until…..oh, pick a number: 10-15 years ago let’s say.
Not so much anymore!
We burned most of the “poke a hole in the desert and gushes out” type of oil, “Ghawar, or Texas in the 1930s” type of oil. Today we are left with “Bakken and 10-mile-under-sea-Horizon” type of oil. That works only with high yield (aka: junk bonds) paper financing which is crushing as we speak…and that is why you see the paradoxes you see in the price/ production figures you see today. That is why you see shale/tar and other expensive production going exponential ONLY after 2008-2010 (hint: TARP1, TARP2, QE1…QE99…) even though fracking is a 50-60 year old technology (here’s another fun trivia for you: a lot of “prolific” commentators on this forum and others akin to it think that fracking is a new tech thingie…ha, ha, ha..).
We did never use and/or improve it before, for it did not make economic and financial sense. We had plenty of cheap conventional oil…or so we thought…
A lot of that money (QE99…ZIRP…) was used to finance Chesapeake, Occidental and a lot of other “lovely” names you hear frequently in the news nowadays.
Contrary to what most (and I think this includes you) believe, Peak Oil will not come as the consequence of physical constraints (i.e no more oil in the ground. We will NEVER run out of oil!!!). Peak Oil shall follow (I personally believe we are post-factum here, actually…but I could be and I hope I am wrong!) financial collapse (already in progress) in very short order.
And that, dear Shallow, is in short why you and I shall never see $100-$150/brl oil under NORMAL market conditions. Our problem is a demand/affordability/debt collapse problem – NOT a oversupply/glut problem.
Oversupply/glut/all-time-high production is consequence of the guys in charge who, fully aware of the predicament we are in and which I explained above (or tried to, anyhow), want to be the “last man standing” while crushing the “higher cost guy” as they produce full capacity into oblivion and as the price per barrel goes >$0 – contrary to every and any sound economic and financial logic.
Sounds familiar? It does, for it is exactly what is happening today.
On an earlier comment to you (a few posts back), while I was teasing you with Dr. Sh. Cooper, PHD (indirectly and kindly reminding you that: I indeed “…informed you thusly…”; but now that you did read my earlier comments/replies here – I know I have your attention!), I suggested to you not to worry about prices going lower, for they shall!
That is baked in – so to speak, therefore I suggest you try to make peace ( as difficult and as painful as that maybe) with that reality. Worry and run for the hills (literally!) when the prices SPIKE higher, for they will.
Caution: I did not say rise gradually, I said “spike”, because this time is going to be different. This time supply/demand and other normal market forces shall have nothing to do with it.
This time prices will go higher as the result of financial-economic-political collapse, and/or war, and/or natural-climate calamity, and/or all of the above. And when that happens, oil prices and the well-being of your family business will be the last thing you have to worry about…
Sounds a bit dramatic and dark…well let’s see:
we are now entering a deflationary wormhole (death spiral, if you will) the likes of which human kind has NEVER seen, EVER.
The closest and only one that is remotely similar (key word is ‘remotely” here, for they did not have nukes and they had vast, vast amounts of cheap resources available – you know…the ones we burned, destroyed and consumed 1500 years later- those resources; and there were far less than 1 billion of us back then !!!) to the one we are entering in, is Roman Empire during 4-5 century AD. We all know what followed afterwards, but for the uninitiated here (historically speaking): 1000 years of what we call Dark Ages. Rome (the city) which had enjoyed public baths and aqueducts (that put to shame many in parts of the world today); Rome which is the basis of every modern form of government in the world today and had more than 1.500.000 inhabitants back then , reached that glory again only at the beginning of the 20th century, more than 15 centuries later…
Draw your own conclusions….
So, dear Shallow, that is your macro view …presented in short detail and extremely simplistically
The micro-view that directly answers your question with regard to sour crude going negative, is coming tomorrow…is too late and I wrote enough today
Be well,
Petro
.
That is a difficult to read post. Try indenting and using simple and easy to read paragraphs with appropriate spacing.
If u don’t do this, no one will read it or get your message anyway.
…and that is what you have to say after what I wrote?!?!
In that case, my advice to you is: do not read it!
Clearly is not simple enough for you.
Be well,
Petro
Lol! I am an idiot but trying to learn.
I had a job one time where I thought I wrote the best sales pitch.
It was very long, well researched, and compelling arguments.
It was thrown in the trash and I never got to do another one.
I’ve never forgot that lesson. Short and sweet is the only way to have a chance to sell your ideas.
Most humans won’t strain their eyes to give a damn about ur opinion.
Thanks for your feedback petro.
Hi Petro,
I don’t have any argument with you about the world being headed to hell in a hand basket. From my own professional pov, everything you have said fits in nicely as component parts of human overshoot.
The QUESTION is not if but WHEN.
HOW MUCH LONGER do you think Old Man Business As Usual will stumble along before he collapses ?
A year or two? Five years, ten years or longer?
I am figuratively praying for five years, that would allow me to get my ducks lined up the way I want them.
Thanks OFM.
I do not have a crystal ball, so 1 day/1 month/1 year…I do not know.
But as you read above, I think everything will follow financial/economic downfall…and I believe we clearly are seeing its progression.
Will other “things” happen at the same time or will there be a lag period, so to speak – who knows.
I do not want to “disappoint” you as I did disappoint Dennis by not stating the exact amount of dollars and cents per barrel of oil 12-14 months ago and, 1 year from now – I do not want him to quote me and point out that I was wrong….just joking…
-On a serious note though, although NO ONE shall be ready for what’s coming, I believe that you are one of the most prepared (so to speak) ones. From what you write, your knowledge and practical know-how far surpasses that of 99% of populace.
I truly and sincerely mean that!
I wish my family and I were remotely close…
..and I wish I am dead wrong on what I write….
Be well and keep writing, for I indeed enjoy your cautious and well grounded optimism.
Be well,
Petro
Summerized as
his answer is in 2 parts:
-Macro-view, or overall “picture” and,
-Micro-view, or why crude or specific densities of it sell for -$?).
Macro-view:
1, going to get worse, much worse. please do not “quote” me on that
2, every/any other forum/site/media/book/paper/publication/presentation etc.,
etc., etc., they confuse and make you “foggy”.
3,Don’t seek solutions.There aren’t any
4,forget about supply/demand, market fundamentals.
5, Normal economic and fundamentals do NOT work anymore.
6, Everybody in the world is producing full capacity as prices go to $0.
7, Oil above $60-$70/brl kills the economy; Oil below $50-$60/brl kills your business.
8, Demand/supply and market fundamentals worked before, when we had plenty of sub $10/brl oil
up until 10-15 years ago but not anymore
9, Because we are left with “Bakken and 10-mile-under-sea-Horizon” type of oil. That
works only with high yield (aka: junk bonds) paper financing
10, That is why you see shale/tar and other production going exponential ONLY after 2008-2010 (hint: TARP1,
TARP2, QE1…QE99…) even though fracking is a 50-60 year old technology
11, Was never use and/or improved before because it did not make economic and financial sense
12, QE99…ZIRP… was used to finance Chesapeake, Occidental and a lot of others
13, Peak Oil will not come as the consequence of physical constraints (i.e no more oil in the ground.).
14, Peak Oil shall follow financial collapse (already in progress) in very short order.
15, (we) will never see $100-$150/brl oil under NORMAL market conditions because the problem is a
demand/affordability/debt collapse problem – NOT a oversupply/glut problem.
16, Over supply production is consequence of the “last man standing” to take out the higher cost oil
by producing at full capacity so the price per barrel goes >$0
Therefor prices will go lower
17, The prices will then spike as the result of financial-economic-political collapse, and/or war,
and/or natural-climate calamity, and/or all of the above.
18, we are now entering a deflationary wormhole (death spiral )remotely similar is Roman Empire
during 4-5 century AD.
and as Petro stated
…presented in short of detail and extremely simplistically
Still wtg on micro view I guess
Corrections anyone ?
Forbin
Thank you for enumerating my sentences and inserting spaces between them!
Very synthetic and concise of you…
Be well,
Petro
Hi Petro,
I do not agree with your analysis.
On point 6, everyone always produces at full capacity in the oil business, CAPEX has been cut back and supply will fall as output declines, nothing new there.
One difference is that OPEC is not regulating the oil market, that is the main difference, move along these aren’t the droids your looking for 🙂
On point 7 there is very little evidence that oil above 60-70 per barrel kills the economy. From 2011 to 2014 with average oil prices over that period above $100/b (Brent) the World economy was doing fine. Europe not so much as they seemed to have forgotten the lessons of Keynes.
On point 10, yes the fracking and horizontal drilling are not new technology, output went up because oil prices were high and because interest rates were low. If interest rates had been at more “normal levels” (10 year treasury at about 5%), the LTO boom might not have gotten out of hand.
On point 13 anybody that has passed an introductory economics course understands that peak oil will depend on both supply and demand for oil.
On point 4, I strongly disagree, in the short term markets can become unbalanced, but in the long run businesses go bankrupt and supply and demand balance.
On point 18, there does seem to be a downward trend in World inflation levels (based on IMF data), the 1996 to 2014 trend in inflation rates goes to zero in 2044 if extrapolated. Not sure why there would be a permanent lack of aggregate demand Worldwide. A few things have changed in the past 1500 years so the Roman Empire collapse seems a bad comparison. That was a local event in Europe, not a World wide event.
Dear Dennis,
you have to address this to Forbin.
He made the numbers/point trying to “simplify” my comment to which he (Forbin) replied…how nice of him, don’t you think?!
Be well,
Petro
Total oil production is up in ND from 1171 kbo/d (Oct) to 1176 kbo/d (Nov). There were 77 new wells producing (72 in Sep), while 93 new wells were spud (122 in Oct). These newly producing wells do seem to have had a good first month on average.
Still, the biggest surprise is that the decline in older wells (> 2 months) was not more – they should typically decline by about 50 kbo/d per month (for the front month), but in November they just declined by 25 kbo/d. I suspect that the reason is, as Lynn Helms mentioned during the webcast last month, that operators tried to produce as much as possible before the feared OPEC meeting early December. There was a similar low decline in older wells the month before (Oct), while the decline was above 50 kbo/d in every earlier month this year, except in May (30 kbo/d).
Below a graph that shows this. The difference between the green and red line represents the total growth/decline of oil production in ND.
If this interpretation is correct, we may see bigger declines in the following months.
Overall production in ND
50% of the oil is from wells < 2 yrs old.
Note that some of the 2013 wells are also less than 2 years old, those that started producing in December 2013. So for wells 23 months old or less, it is 50% of output, which is exactly what you said <2 years is the same as <=23 months.
Note that your statement has been true for at least 7 years (which makes it a very good statement!)
There is a sense that this should be a more powerful reality than it seems to be.
Any chance you know what the typical equivalent is for a conventional field?
If I understand you correctly Enno, you believe that shale production in the US will begin to decline shortly (in the coming months) due to inherent depletion of existing wells. What will that do to the surplus in world petroleum production and to prices?
LJ,
In my posts, I like to focus as much as possible on the data, instead of making projections. I do think the data from ND & the Niobrara shows sufficiently clear that both plays are on a downward path. Even with the excellent data from especially ND, it is already clear how difficult it is to make accurate projections just a year out. That should make everybody humble about the capability to make accurate projections about supply from larger regions, inventory, and prices (assuming that demand can be more easily predicted, which is also doubtful).
I guess I am not the only one who is highly surprised that just a relatively (in % terms) small surplus was capable of creating such a huge price drop. I do think a large part of the price action can be attributed to market participants who do not have a stake in the production or processing of the oil. They’re just good at front running everybody else. I therefore expect to keep seeing extreme price volatility.
Although I have considerable contempt for the economics profession as practiced by individuals, because most economists seem to be scientifically illiterate, the basic theory of supply and demand holds up as well as an anvil in my estimation.
All the way back in the sixties, in the FIRST introductory courses taught in econ, at my university , the text, which was HUGE, and the professor, who expected you to read EVERY line, twice, VERY carefully, both covered the concept of price elasticity in great detail, with plenty of examples.
It is not at all unusual for the price of a commodity to crash by half or more if the producers keep bringing it to market in quantities greater than the market “desires”.
The typical user of oil, be that user a commuter, or an airline, can find a use for only a LITTLE MORE oil, at any price, in the short term.
So the price crashes.
We aspiring PROFESSIONALLY trained farmers learned that in the VERY first “ag econ” course, first quarter. Incidentally that course was taught by a professor in the business school, in the same hour, in the same classroom, as the business and econ majors took it. But the ones of us who grew up on farms learned it the hard way, seeing our GROSS revenues CRASH in years we made bumper crops, and our gross revenue SOAR when we made a short crop, nationally.
The three or four best years we ever had, we had only half a crop or less, but got triple or even quadruple the usual price, wholesale.
The ONLY difference is their transcripts say “Econ 201” whereas mine says “Ag Econ 201”.
Bottom line, supply and demand theory is amply SUFFICIENT to explain the price of oil. Supply has outrun the end users immediate needs, end users are mostly unwilling to store oil products, and even if willing, UNABLE in ninety nine percent of all cases. A price crash has resulted.
Being a farmer, I am the ONE out of hundred people able to store a significant amount of oil.
The recurring situation in farming is actually tragic: very small overproduction can cause complete collapses in price — AND it’s very hard to store the stuff for later because it rots! This is a market failure, and the damage to the farming industry is a bad thing.
The same situation in oil is socially beneficial, as the damage to the oil industry is a good thing!
(P.S. The kings of ancient Egypt managed grain farming as a centrally planned economy, storing excess production for lean years, while paying the workers the same rate every year — and they managed farming far better, from a social utility point of view, than any of our “market” economies do today. Which is absolute proof that central planning can be superior to “free markets”…. for some things.)
I see that the increase in oil production came mainly from the 2015 wells. Pre 2015 wells together decline a little.
Thank you Enno,
Do your stats show that the number of DUCs in North Dakota is declining? Maybe this is one of the factors contributing to the resilience of ND Bakken production?
Also, how the operators were able to reduce the decline rate of the old wells?
Alex,
“Also, how the operators were able to reduce the decline rate of the old wells?”
In the following overview you can see the monthly change in daily output, by wells that started producing in a certain year. What this shows is that in Nov, the growth from 2015 wells was quite large, while the declines from wells from earlier years was quite low. How they do this, I don’t know – maybe with chokes, and producing older wells for more days?
Thank you, Enno.
Would be very interesting to know what they are actually doing.
Maybe refracs also help to maintaing production at the old wells.
The chart below from Rystas shows that there were about 110 refractured wells in the Bakken in 2014 and ~70 wells in January-August 2015, more than in any other shale play.
source: http://www.ogfj.com/articles/print/volume-13/issue-1/features/refracking-the-shale-plays.html
Very interesting article, thanks!
This is what I got with my recent analysis (see graph below). It shows that, as I mentioned at the time, I was being conservative (underestimating refracks), to make sure I didn’t overestimate the effect from the refracks on the decline of the average well.
It also means in my opinion:
1) that I slightly overestimated the gain from refracking, as I took the wells with the best gains as having been refracked.
2) that I slightly underestimated the decline of wells in the far tails (after 7-8 years). Including refracked wells into the average well performance has an out-sized effect, especially at the far end of the tails where the typical daily output is low.
3) that the mentioned “halo-effect” from Coffeeguy, although it probably exists in certain cases, has a very minor effect on the overall well performance & decline.
Therefore, I strongly belief that in order to analyze the well decline correctly, one has to take into account these refracked wells. Currently, about 6% of the completions in 2015 are refracks, compared with about 4.1% in 2014.
Producing days are actually down slightly from the month before. GOR did not increase much either. So don´t know either how they did it. The new wells in October and November where quite good though.
Thank you, Freddy
The webinar is available. Helms mentioned that many marginal wells were shut in (which explains the drop in producing wells), while a number of MB+TF wells that were shut in started to produce again.
Besides this, I suspect that operators may have some levers to increase/decrease the output from wells slightly from month to month.
This so far hasn’t changed the broad trends (like the average well performance), but it may give surprises on the high/low side on a month-to-month basis.
Production from the 77 wells that started production was indeed good, as the graph below shows.
If refracs are not occurring to flatten the declines, the only other reasonable explanation is the installation of a ESP – Electric Submersible Pump. The ESP will be installed with a down hole gas separator and pressure monitor. A VSD (Variable Speed Drive) will be installed at surface. This will enable an operator to speed up or slow down the ESP. The VSD will enable an operator to remotely measure downhole pressure and produce every barrel of oil the well will give up. The operator can also program the VSD to speed up and slow down the pump based upon the current downhole pressure.
This procedure will maximize production in the initial installation, but will steepen the decline later. The steepness of the decline will be a function of bottom hole pressure and how soon the ESP is installed after the frac.
In addition the ESP may be placed in the horizontal section which will also give an initial large spike in the production. This process will boost production even more than installing the ESP in the Vertical section of the well.
It also will lead to a steeper decline and move the EUR reserves to the left of the curve and ultimately reduce the EUR dramatically.
I believe this slight of hand is not understood by the operator’s shareholders or their lenders.
Carl. Thank you for your post.
I might add that ESP’s usually are very expensive to operate. More oil may be recovered earlier in the life of the well, but also maybe at a much higher cost. Very high electrical costs, plus I am sure pulling one, repairing or replacing, and running back in is not cheap. Also, if for some reason, electricity goes down, solids tend to sink to the bottom of the hole, gumming up the works. I also wonder how one flushes the salt buildup, which I understand has to be done often with fresh water, with an ESP down hole?
Operational issues, many of which are probably thrown into CAPEX.
The operational cost are higher than conventional artificial lift.
The capex is approximately 250k for the initial installation. The run times vary between failures. The high temperatures, high GOR and Frac sand make run time a major factor in the economics. Economics however don’t matter to the North Dakota Shale drillers. Their only concern is to maximize production regardless of a significant loss on every barrel of oil they produce.
Salt accumulation is generally not a significant problem in the Bakken. Weekly or Bi-monthly truck treatments for scale and corrosion with 20 BBLS or so of fresh water would be adequate.
Carl, thanks for the information. What is the approximate cost to repair an ESP failure?
Also, from my review of Bakken lease operating statements, it looks like a down hole pump failure costs in the $30K range to repair, and a tubing leak will run $70K range. I know those can vary widely, but what do you think for a ballpark guess?
Also, I have been using $14K as a monthly average for OPEX/LOE for Bakken wells, which does not include repair of down hole failures. I have seen as low as $3K and as high as $30K, but seems like from $10K to $18K is more common. Sometimes it is tough to split the G & A out.
One thing I will also say is the larger the operator, the tougher to read their JIB statement. Thunderbird, who I assume is a smaller private firm, has the easiest to follow. OXY seems the worst.
How do they run a pump through a tight turn in such a well? I would lean to using gas lift in higher water cut wells, but I’m used to it from when I worked in Louisiana and offshore.
Plunger lifts works well when the production levels decline to less than 50 BOPD especially with increasingGOR’s. Gas lifts can be expensive if you don’t have access to a high pressure gas line and need to use compressors.
The ESP will work well as long as the drift of the pipe gives you adequate room for the equipment. The ESP equipment becomes extremely expensive in 4.5″ liners. The build of the horizontal well can also be a problem in installation of an ESP
No kidding. I wonder if the pipe diameter and the turns allow an ESP to survive that environment. My experience is that to have the well done right we have to set up a torture room for drilling supervisors, where we punish them if they don’t watch the doglegs. Just showing them the iron maiden isn’t enough, you got to use it a couple of times before they get it right.
Alex,
“Do your stats show that the number of DUCs is declining? Maybe this is one of the factors contributing to the resilience of ND Bakken production?”
I have the DUCs increasing again in Oct & Nov. Given the current rig count, I expect that we will start to see a decline again in DUCs from Jan onwards, and probably accelerating during the year with a further declining rig count.
Add 1 to the years on the x-axis..
Enno
Thanks, as always, for your contributions.
I just posted on the last thread, but will repeat here … I stumbled upon a method to determine if refrac’ing has occurred.
Go to Fracfocus.org, click ‘Find a Well’ tab, enter API of suspected refrac’d well, and it will show up with lots of data.
I did it for several Bakken wells that I knew were refrac’d and they were all listed.
If it is not listed, another reason for increased output would be necessary, the halo effect most likely, IMHO.
That, also, could be proven if a nearby well was frac’d coincidental to the suspect well’s increase.
The new frac would also be listed.
Thanks for the info Coffee.
If someone would like to volunteer to check the wells I have marked, I can send him/her the list of wells + well APIs.
I checked 1 well from Marathon:
– ID 17176
– API 33-025-00750
Started production in 2008, and indeed was refracked in 2014.
But this is not . . . “refracking”.
Let’s create a definition here.
A refrack is a revisit of a well, with proppant and fracking pump BUT NO EXPANSION OF STAGE COUNT.
2008 wells were not fracked 30 stages of horizontal length. Maybe they were drilled that length, but back in 2008 pricey Chinese ceramic proppant was being used and thus maybe they fracked only 5 stages.
This “refracking” is a new well, with perhaps 25 more stages than was done in 2008, using sand, not ceramics, but just happens to use the same vertical? Must be careful not to celebrate some spectacular output from a “refrack” that is actually a longer frack, not a refrack.
Hi Enno and Freddy W,
Thanks for all the information. Interesting that 77 new wells kept output flat, I remember when some thought 130 new wells per month was too high a number.
My estimate seems to have been too high (I had estimated 130 new wells to keep output flat about 12 months ago.) I still think this month is an anomaly and expect 120 to 130 new wells per month will be needed to keep output in the Bakken Three Forks from decreasing.
Also on your DUC count. The spudded but not producing wells minus the estimated fracklog are wells that are in the process of being drilled? The number (roughly 400) seems pretty large considering only 60 to 70 rigs. Is the drilling a two stage process so these 400 or so wells have stage one in process or finished, but are waiting on stage 2?
Just trying to learn here, I am not familiar with the entire process, I thought the wells were drilled and then fracked, but it is not likely to be that simple.
Hi Dennis,
I agree with you that it looks like an anomaly, which can happen from time to time, as operators do have to levers to pull.
With an estimated (based on current rig count) 70-80 wells online per month, I expect a gradual decline towards 1 million bo/d by the end of the year for ND.
“The spudded but not producing wells minus the estimated fracklog are wells that are in the process of being drilled?”
I can’t see exactly what their status is, just that: They have been spudded, but are not yet producing.
I show 2 estimates of the fraclog (left hand side):
1) spudded but not yet producing. These wells have all been spudded, but are not yet producing. This is very similar like the DUC estimate from Helms, although he will include a well just after it finished drilling (I don’t have that info).
2) estimated fraclog : these wells have been spudded at least 5 months ago, but are not yet producing. Based on historical lead times, these wells could already have been completed, but are not yet. Therefore, these wells are quite clearly being kept from completed, so these are in my opinion a better estimate for the actual DUCs. This is around 550-600 wells.
“I thought the wells were drilled and then fracked”
The issue is that there is typically a lead time of 2-5 months before a well is completed, after being drilled, due to all the activities that are required.
Thanks Enno,
I know you have explained this before but I forgot the distinction, between your higher and lower estimate, the 5 month delay is the key fact I was forgetting.
Hi,
I was thinking about the GOR increase. If you install a pump in a well then, correct me if I´m wrong, I would expect the GOR to go up immediately to a high level and then decrease slowly as the gas gets depleted. The reason the average well in my graph above has a linear increase in GOR must be because they don´t install pumps or pump up the oil faster or whatever they do, in all the wells at the same time. I would expect the GOR to eventually stop increasing and start to decrease instead as they run out of wells to install pumps in or they can´t pump up the oil any faster. Around that time I would also expect the decline rates to start to increase. If you pump up the oil faster, then naturally you produce oil now that should have otherwise been produced later. So this should result in increased decline rates later. If less than 130 wells are needed now, but then maybe more than 130 wells are needed later when the decline rates increase.
GOR doesn’t have to change when one drops bottom hole pressure. But in these type of wells it sure does. In general, if reservoir pressure is below bubble point then GOR increases as the well gets pulled harder. In these reservoirs the concept of reservoir pressure is a bit spooky, because there’s a steep pressure gradient in the rock system. But I would say that indeed if you pull it harder the gas ratio ought to increase a bit. GOR shouldn’t stop increasing, though. I don’t think the reservoir ever gets to that point. Before it does that well ought to be below 10 BOPD. In which case the well gets shut in and opened once in a while. At least that’s the way I’ve seen it done all my life, and I’ve worked with really crappy wells like these.
Ok thanks for the info. So when do you think we should see a negative impact on oil production if a well is pulled too hard and it reaches bubble point?
Thank you for the update, Ron.
Be well,
Petro
$29.74.
What were some people saying about price supports? I truly don’t understand how that would work. Is there evidence that some sort of price support mechanism has been triggered? What does it look like?
“What were some people saying about price supports? ”
GS is talking not about support but a reversal, but talk is cheap 😉
=== start of quote ===
The crash in U.S. oil futures — which sank back below $30 a barrel on Friday to a new 12-year low — will send the nation’s shale-oil boom spinning into reverse in the second half of the year, the bank said in a report. As U.S. production slumps by 575,000 barrels a day, global oil markets will tip from surplus to deficit, Goldman predicts.
“The key theme for 2016 will be real fundamental adjustments that can re-balance markets to create the birth of a new bull market, which we still see happening in late 2016,” analysts Jeff Currie and Damien Courvalin wrote.
http://www.bloomberg.com/news/articles/2016-01-15/goldman-sachs-sees-oil-bull-market-being-born-in-today-s-crash?cmpid=yhoo.headline
A price support/resistance line is a price point where in the past the trend reversed. A price support is a psychological barrier. A price point where the number of players betting on a reversal of a trend gather in higher numbers. It is a sort of market memory. They are statistically so relevant that common people can see that they are real without statistics. When a trend reverses it is very often the case that it does so at a support/resistance line (price point). But when the trend does not reverse the support/resistance is broken.
A “psychological barrier”?
But I thought markets were all about rationalistic calculations by egoistic actors, not “animal spirits,” as Keynes put it. ?
Southern California Edison won approval from state regulators Thursday to develop a $22-million pilot program that will increase the number of electric vehicle charging stations by as many as 1,500.
Edison plans to place charging stations at locations where drivers typically leave their cars parked for four hours or more: workplaces and fleet facilities, multi-unit dwellings and destination locations such as parks and shopping malls. Single-family homes are not eligible.
Ratepayers will fund the cost of all paneling, conduits and wiring.
http://www.latimes.com/business/la-fi-electric-vehicle-pilot-program-20160114-story.html#nt=outfit
http://www.edison.com/home/our-perspective/charge-ready-a-plan-for-california.html
The utility proposes to build up thirty thousand charging stations, which is a hell of a lot, but STILL only a drop in the bucket compared to the number of cars on the road in Southern California.
I suppose each one of them could reasonably be supposed to be used three times, on average, per day, if located in a public spot such as a supermarket , but this is only a wild ass guess. Some people would charge for four hours, some for an hour or less. Some might get used ten times or more per day if located at 24 hour shopping centers, for up to an hour or so each. Payment by the minute could be easily arranged so as to not hold up a person ready to leave the premises after shopping.
A charger at an office park or factory, for the use of employees, would likely get used very heavily, maybe most of the day most days, with a rule saying you have to move your car at lunch time so somebody else can charge till quitting time etc.
Now if THAT many publicly accessible chargers are built by SCE alone, the rest of the business community may feel compelled to follow suit, in order to maintain customer loyalty. A California nerd would most likely opt for an apartment complex with charging stations, everything else equal, and the cost of a station, compared to rents, total incremental dollar sales at stores and restaurants, etc would be small.
A restaurant operator may eventually feel compelled to add charging stations in order not to lose significant business to a competitor across the street or down the block who DOES have charging.
When the number of charging stations gets up towards fifty thousand, or more, S C drivers will probably be confident enough to start buying electric cars in large numbers, so far as charging goes, because most people are going to charge at home , most of the time.
This is going to be a gold mine for the electricians , who will make megabucks installing chargers, and a big new market for the utilities, who otherwise are looking at peaking demand.
Public chargers probably won’t be used that much, actually – at least “opportunity” Level 2 chargers at retail facilities. The will be a “nice” service to offer, but not critical to EV adoption.
US average daily driven miles is less than 40 miles, which a Volt can do all electric with a home charge. BEVs with at least 100 mile range will, on average, be able to drive 90% of their days with just home charging. 200-mile range – it starts to hit 95%. That’s what Tesla has learned with their Model S. Teslas use about 92% home charge, 5% Supercharge for long distance, and 3% local “opportunity” charging. If the 200-mile-range BEV like the Bolt becomes “standard”, then about the only public charging will be fast-charge DC for longer inter-city trips or Level 2 AC charging (up to 7.2 kW) for urban BEV vehicle owners who don’t have access to home charging.
The SAE has been studying this a while, using extensive data from the manufacturers. Example – GM provided 3-5 years of free Onstar membership for all Volt and Spark EV owners specifically so that they would have access to detailed trip and daily driving information for all GM EV’s on the road and could prognosticate what future EV’s will realistically require for charging based on various battery configurations.
Fast chargers on the highways and interstates, and L2 chargers at hotels for their overnight guests. That’s what the EV future needs for BEV’s to go really mainstream. And 110 volt 20/amp outlets at apt parking lots for apt/condo dwellers to use for home charging. That’s it. Really, it’s that simple.
Hi HVAC,
You may well be right about the amount of use public charging stations get.
But I think just the fact that they are OUT THERE , or will be out there, is going to be enough to go a LONG way toward convincing people on the fence that they can get by ok with an electric car.
And down the road, imo, there will be MILLIONS of electrics with so called ” worn out ” batteries that will run them ” only ” let us say forty or fifty miles.
That will be FAR ENOUGH for millions of relatively poor people to get along fine with these older electrics in need of new batteries, especially if they can top off the charge while shopping etc.
The fossil fuel club membership likes to forget that an old Volt that will go only fifteen or twenty miles on battery power will still go FAR ENOUGH on the battery to allow tens of millions of real world drivers to cut their gasoline consumption by eighty percent or more.
Californians are certainly paying a hefty price to be out front in the fight against those horrible, dastardly, evil fossil fuels.
But I suppose it’s a small price to pay when one is doing God’s work.
Still at it, still cherry picking your data, GS.
http://www.eia.gov/electricity/monthly/epm_table_grapher.cfm?t=epmt_5_6_a
Uncle Sam says different, that the California residental rate, most recent, is 14.98, and that Connecticut, Maine, Mass, Rhode Island , and New York all pay MORE. Penn pays almost as much. I FORGOT Alaska and Hawaii, lol.
The big plains states where most of the wind farms are all pay a LOT less.
Texas is getting to be known as the NATIONAL LEADER in wind and will likely within the next few years capture the sun title as well, but the media in this country for some reason don’t like to talk about the REDNECK BACKWARD REPUBLICAN ( sarcasm directed at the media) state of Texas in favorable terms, so most people don’t realize just how big wind is in TEXAS.
Texas pays 11.41.
GOTCHA AGAIN !!
These are residential rates, the most recent month available.
It is interesting to note , if you move over to the industrial column, that industrial customers get substantially lower rates here in the USA than residential customers. It’s not just in Germany that industry gets a favorable rate.
BUT of course GS will never mention such an inconvenient fact when” on the clock” doing his best to convince everybody that they need not worry about ever running short of fossil fuels, or dying young from air pollution, or in a resource war.
I will continue to make sure the debate is half about you, until you start posting some comments that indicate an open mind and a willingness to recognize all the facts, rather than insisting the ones you that don’t support your agenda don’t exist.
High tech has MADE the California economy. Californians as a whole can EASILY afford to pay a little more for electricity, given that so many of them work in the high tech industries making big bucks.
There IS such a thing as economic trickle down, although a lot of people don’t want to admit it. LOL
I should not leave out NC, a state that is way up front in building out solar power.NC pays 12.11, if you care to look.
It will not escape the notice of the audience that I put up a link that gives us the rates ALL over the country. I don’t need to hide any cherry picking.
oldfarmermac,
The 17.05₡ figure is a yearly average rate, which I believe gives a better reflection of what’s going on rather than just picking out one month of the year.
The residential price in September, 2015, for instance, was 18.38₡ per KWh. (See chart below)
https://www.eia.gov/electricity/data/browser/#/topic/7?agg=0,1&geo=000000000004&endsec=8&freq=M&start=200101&end=201510&ctype=linechart<ype=pin&rtype=s&maptype=0&rse=0&pin=
“The residential price in September, 2015, for instance, was 18.38₡ per KWh. (See chart below) ”
This does not prove California pays a noticeably higher rate than other states will LESS or hardly any wind and solar power.
And Californians have a cleaner , healthier place to live, not to mention more jobs, even if they aren’t top dollar jobs, as a result of having emphasized renewables.
Your chart shows that California rates dip substantially some months.
Might that be due to wind and solar power displacing fossil fuel generation ?
Methinks this is true to a substantial extent.
At any rate, one must be scientifically illiterate to assume that fossil fuels will always be abundant and cheap.
It COULD be that husbanding a depleting natural resource so as to stretch the life of the remaining supply is a GOOD policy.
oldfarmermac said:
OFM, how many times do you plan on trotting out that straw man?
Can you show me one single place where I have ever denied peak oil or its consequences?
oldfarmermac said:
Texas would certainly be my choice of how to do renewables right. How or why Germany and California ended up being the poster children for clean energy is beyond me.
Germany produced 13% of its electricity in 2014 from wind and solar. Texas 10.6%. But Texas has achieved that on about 5% of the public expenditure that Germany has. You can say what you want about those backwoods Baptist rednecks, but they sure to hell know how to run a railroad.
Being from Texas, I always thought it was exceedingly corrupt. But the corruption in Texas is nothing compared to that in California.
Austin Energy, for instance, inked a PPA with Resurgent Energy back in May, 2014 for power from Resurgent’s Roserock PV facility in Pecos County, Texas. The price: a whopping 4.5₡ per KWh.
Austin Energy is currenly soliciting bids for another round of solar power, and has received bids for as low as 4₡ per KWh.
Now compare that to California.
Nobody really knows what utilities in California pay for solar power, other than the insiders, because that is classified, “confidential, market sensitive” information.
However, an article in the New York Times has it from “a person familiar with the project” that when P.G. & E. inked its 25 year-term PPA with NRG in 2011, it was for 15₡ to 18₡ per KWh. That was for power generated at NRG’s California Valley Solar Ranch facility.
The rates of return to NRG were phenomenonal and, because everything is guaranteed by the government, risk is non-existent. NRG’s president gushed that “I have never seen anyhing that I have had to do in my 20 years in the power industry that involved less risk than these projects.”
http://www.nytimes.com/2011/11/12/business/energy-environment/a-cornucopia-of-help-for-renewable-energy.html?_r=0
Then there’s Warren Buffet’s Topaz Solar PV project. It ties for being the largest utility PV in the world. Again, nobody knows what P.G. & E. is paying for electricity from the project. The only information released by the California PUC reads:
Last year when Fitch rated the bonds on the project, it only commented that “The revenues of Topaz are anchored by an investment grade utility off-taker, Pacific Gas & Electric Company (PG&E, ‘BBB+’; Outlook Stable), under a long-term, fixed price power purchase agreement (PPA).”
http://www.businesswire.com/news/home/20150320005887/en/Fitch-Affirms-Topaz-Solar-Farms-LLC-Senior
“However, an article in the New York Times has it from “a person familiar with the project” that when P.G. & E. inked its 25 year-term PPA with NRG in 2011, it was for 15₡ to 18₡ per KWh. That was for power generated at NRG’s California Valley Solar Ranch facility.”
Nobody to my knowledge who is intellectually honest and is ordinarily street savvy has argued in this forum that solar power was cheap five or six years ago, or that sometimes businessmen in ANY line of work can occasionally get a sweetheart deal out of government.
The JUSTIFICATION for subsidizing solar power was and continues to be to force rapid growth of the industry, so as to MAKE solar cheaper, due to advancing technology and economies of scale.
Recent purchase power agreements have been made at SUBSTANTIALLY lower rates.
I hold that the subsidy policy has worked as intended.
And for what it is worth, fifteen to eighteen cents might turn out to be a BARGAIN rate within twenty more years, given that it will be available at the time it is needed the most, to help hold down peak rates, namely hot sunny days when nearly every air conditioner in the utility service area will be running on “HIGH”.
Peak demand juice can be VERY costly.
oldfarmermac,
If you don’t see anything wrong with the state of California conducting the people’s business with folks like Warren Buffet under a veil of secrecy, I really don’t think there’s any hope for you.
oldfarmermac said:
That’s true.
It’s the extreme that Germany took it to, however, that has raised eyebrows.
“It’s the extreme that Germany took it to, however, that has raised eyebrows. ”
It is true that German industry gets a better relative deal than in other countries, but otoh, the German economy is utterly dependent on exporting German industrial production, and the German people seem to be satisfied, for the most part, to pay more domestically, while using electricity very efficiently. And the electric bill is not a burden to a typical German family or household.
The fact that Germany has some poor folks is not exactly relevant, as just about EVERY country has some poor folks who have problems paying for electricity. Germany seems to have a fairly comprehensive welfare safety net, so far as I have investigated this question. Germans certainly live better by a long shot than most people in the world, and Germans are going to be better positioned later on to deal with the problem of paying for ever more expensive fossil fuels.
TEXAS pays less than twelve cents, and just went seventeen straight hours at forty percent wind. NO blackout, no brownout, no problems. It can be done, it is merely a question of deciding who pays for the infrastructure and the management of it. Legacy plants that will be needed as back up, or new plants used mostly for backup have to be staffed, fueled, and paid for,everybody knows that.
http://blogs.scientificamerican.com/plugged-in/texas-sets-new-all-time-wind-energy-record/?wt.mc=SA_Reddit-Share
Texans are going to enjoy spending the EXTRA money they make selling oil and gas to other states, rather than burning so much themselves.
OFM,
Texas really has been a phenomenal success story when it comes to wind.
Much of this has to do with geography and climate. But I think it also has to do with good management, because southern California has an equally good climate as West Texas does, and look at how badly they’ve fucked up the renewables rollout.
Texas established its renewables mandate in 1999, seven years before California passed its 2020 renewables mandate in 2006.
There are, however, some cracks now beginning to appear, especially with the ERCOT grid and controversy over how much renewables, including distributed PV, should pay for grid service. Grid problems grow exponentially when renewables penetration grows to where it’s more than 10%.
If you’re interested you might want to read these articles:
“Wind Power’s Growth In Texas Triggers Challenge To Renewable Energy Mandates”
http://www.fronterasdesk.org/content/10055/wind-powers-growth-texas-triggers-challenge-renewable-energy-mandates
“‘Mission accomplished?’ Inside the battle over Texas renewable energy incentives”
http://www.utilitydive.com/news/mission-accomplished-inside-the-battle-over-texas-renewable-energy-incen/389444/
“True costs of wind electricity”
http://judithcurry.com/2015/05/12/true-costs-of-wind-electricity/
“What should renewables pay for grid service?”
http://judithcurry.com/2015/04/21/what-should-renewables-pay-for-grid-service/
“Wind Power’s Growth In Texas Triggers Challenge To Renewable Energy Mandates”
http://www.fronterasdesk.org/content/10055/wind-powers-growth-texas-triggers-challenge-renewable-energy-mandates
I urge anybody interested to read this link.This link makes the case for wind power, and acknowledges that there is a time coming when wind should stand on it’s own generating towers so to speak, and subsidies done away with.
I say again, oil, gas and even coal will not always be cheap and readily available.
Building out wind and solar power where local conditions are favorable is a no brainer decision, and avoiding wind and solar in places where the resource is poor is also a no brainer, at the proximate level.
A person in Virginia who contributes a few cents to solar and wind in other states via a federal subsidy will most likely get it back with a bonus, eventually, because the tech is maturing faster, and will be economically viable in Virginia SOONER. And anything that reduces the consumption of coal and natural gas ANYWHERE has the effect of LOWERING the prices of coal and gas EVERYWHERE.
Hard figures are hard to come by, but I strongly suspect that since we are getting about five percent of our electricity nationally from wind and solar power now, we are already or soon will be COLLECTIVELY getting back the money spent on subsidies in the form of LESS EXPENSIVE coal and gas. Keep in mind that coal and gas are critically important inputs into several heavy weight industries, such as steel and agriculture. Cheap gas means cheap nitrates which translate into cheap food.
Insofar as the Judith Curry links are concerned, it would take me all day, to pick thru them.
Suffice it to say that they are OBVIOUSLY written to prove we should stick with fossil fuels, because they mention nothing or next to nothing about the benefits associated with renewable power.
They remind me of a friend who is a cop, who has this to say about domestic disputes. There is HIS STORY, HER STORY, and THE STORY.
Judith Curry runs a site dedicated to telling the fossil fuel story, as best I can tell.
Bullshit arguments, carefully cherrypicked, always take a paragraph or two or three to deconstruct, and show them for what they are. These long links consist of one cherry picked argument after another. Factual distortions are frequent, and outright falsehoods appear to be present at first glance, although I am not at this time interested in digging thru them to be sure, as it would take a couple of days, and I have other things I need to do.
Anybody who has an open mind, and knows a little about environmental and natural resource issues , can read them for himself and judge for himself whether I am telling it like it is.
If any body wants to pick out ONE particular argument in one of those links, I will have something to say about it.
Insofar as the Judith Curry links are concerned, it would take me all day, to pick thru them.
Suffice it to say that they are OBVIOUSLY written to prove we should stick with fossil fuels, because they mention nothing or next to nothing about the benefits associated with renewable power.
Curry has openly admitted she receives funding from the fossil fuel industry. While there is nothing wrong with her doing that, it probably makes it a tad more difficult to be impartial with the facts… The old saw applies:
Upton Sinclair — ‘It is difficult to get a
manwoman to understand something, whenhisher salary depends on his not understanding it.’Texas has gas turbines to offset the wind drop. It also has very good wind conditions. Louisiana simply can’t perform as well. I’ve decided to ignore anything in Scientific American related to climate or renewables. They have a serious problem.
Fernando,
I agree.
The guy who wrote the Scientific American article is so stupid he couldn’t pour piss out of a boot if the instructions were written on the heel.
It’s the kind of over the top cheerleading, in his case for the wind industry, that turns a lot of people off to the entire renewables enterprise.
Instead of pushing more wind, he should be pushing more solar, because it’s during the peak summer demand months that solar is at its peak production. Something tells me the folks at Austin Energy know that, and that’s why they’re shopping around for more solar to try to meet their peak summer demand.
For a great discussion of the need for gas turbine backup, from someone who actually knows something about grids and power generation, I highly recommend:
“True costs of wind electricity”
http://judithcurry.com/2015/05/12/true-costs-of-wind-electricity/
Without some miraculous new breakthrough in electricity storage, there really isn’t any way of getting around the need for fossil fuel or hydro backup that can be flexed.
Fossil fuel or hydro back-up is absolutely necessary because there really are days, and sometimes days on end, when the sun doesn’t shine and the wind doesn’t blow.
If the Scientific American article you guys GS and Fernando , are referring to is the one I linked, you are making fools of yourselves, in condemning it out of hand.
Perhaps there are errors in it. There are also some obvious truths in it.
Would you like to go thru it and point out the problems with it and allow me a chance to respond?
I have never heard any serious advocate of renewable electricity deny that fossil fuel back up is going to be necessary for a long time, maybe EVEN permanently.
BUT only a FOOL could possibly believe that using up our fossil fuel endowment faster than necessary is good policy.
Renewables have the potential, combined with improving efficiency, and changing lifestyles, to enable us to continue to live the good life quite a bit longer than otherwise, even if we NEVER achieve a renewably based industrial economy.
Who is dumb enough to spend his life savings, unless he is suicidal, after his earning years are over, in five or ten years, unless forced to do so, when he expects to live with a little luck maybe another twenty years ???????????
This one is for Doug, although he has probably seen it already, and all the other hard science fans.
http://www.theatlantic.com/science/archive/2016/01/rare-supernova-crab-nebula/424125/
Thanks Mac,
Yeah, no way I wouldn’t be on top of that fellow. Fact is, it may turn out that ASASSN-15lh, a super-luminous supernovae, may be powered by a magnetar, a special type of neutron star (extremely powerful magnetic fields) with the magnetism providing engine for the immense luminosity. It will be studied intensely for decades.
Reference: ASASSN-15lh: A highly super-luminous supernova. Science, 2016; 351 (6270): 257-260 DOI: 10.1126/science.aac9613
Maybe the supernova isn’t that bright. What’s the red shift in the supernova light itself?
It’s 3.8 billion light-years away so z (red shift) = 0.29 By comparison, the edge of the observable universe is about 14.3 billion parsecs (46.6 billion light years) But of course it’s bright, the brightest object yet identified, by a long shot.
I assume the distance is set by the red shift, and not the other way around. So what’s the speed at 0.29 red shift? 100,000 km per sec?
Also, does the supernova have a 0.29 red shift? Or do they assume it’s inside that Galaxy because it’s in the same line of sight?
Ron says: “Looking at these numbers it becomes obvious that the EIA is just making a wild guess at future oil production for everyone in the world except the USA.”
I wonder if the EIA has a database of global oil and gas fields and new projects, and if their forecasts are based on a bottom up analysis of all those fields and projects.
Something tells me that no. So probably their forecasts for most countries outside the U.S. are indeed just wild guesses.
Hi AlexS,
Yes wild guesses with a nice measure of wishful thinking 🙂
I think they forecast demand and then make up supply numbers that make their price forecasts look reasonable. They have an economic model which cranks out a GDP estimate and a model that correlates energy demand with GDP to give them energy demand. The price forecast is based on the futures market. If the futures market says prices are low, then there must be too much supply relative to demand so they just make up supply numbers for every country except the US that creates too much supply.
I agree with Ron that their US estimates are somewhat better (though still on the optimistic side in my opinion.)
In short I agree, wild guesses outside the US, but made so the overall World total fits their demand and price forecasts.
Dennis,
It’s not all that clear with the USA production either. Although I agree that the quality of forecasts is better. Leonard Brecken from oilprice.com used to be probably the most prominent skeptic:
http://finance.yahoo.com/news/eia-capitulates-under-cover-darkness-161735523.html
http://oilprice.com/Energy/Crude-Oil/U.S.-Oil-Glut-Story-Grossly-Exaggerated.html
http://oilprice.com/Energy/Oil-Prices/Forget-Rig-Counts-And-OPEC-Media-Bias-Is-Driving-Oil-Down.html
As the EIA, on a weekly basis, uses a proprietary model to estimate U.S. oil production and then on a monthly basis uses actual data to revise those figures he asked an important question, if the game is systematically to overstate the US production in weekly reports.
His reasoning was along the following lines: if production is being overestimated and demand being underestimated you can create the “perceived reality” of “oil glut” even if overproduction is really minor and transient. And as soon as the price drop started under certain circumstances is can obtain its own dynamics due Wall Street induced positive feedback loop independently of events on the ground.
To him it looks like in some cases EIA acts a corrupt arbiter in a football game between supply and demand, not as an independent source of unbiased information upon which the nation can depend in formulating the energy policy.
We know that the EIA systematically underestimates solar and wind installations, solar and wind production, and basically everything to do with solar and wind. (They’ve underestimated every single year for decades.) As such I wouldn’t be at all surprised if they’re doctoring the numbers on the oil side too.
It would of great interest to me to get any informed commentary from this group on which of the north american energy companies in the oil and gas business have the best chance of weathering this storm-
who has got the best combination of conservative management, manageable debt load, expertise, and fossil fuel reserves?
Thanks in advance. BTW, my guess is that somewhere between 6-18 months we will see a firm bottom in this market, unless some big new instability hits the exporting countries sooner.
A second question- any thoughts on when the big Argentinian shale deposit will be coming to market?
Boring, but for US companies ExxonMobil followed by Chevron.
There are very few US public E & P companies, I’d speculate, that have more PDP PV10 value at the current strip, than long term debt.
In other words, they owe more on their oil and gas than it is worth, based on the future income it will generate at current futures prices, adjusted for quality and transportation.
The question is when will OPEC cut? That is really the only thing, other than major political event, that will cause the price rebound necessary for most public producers to survive. 1986, 1998-99 and 2008-09 were all resolved with an OPEC cut.
Keep $20 oil here a couple years, and if banks follow lending guidelines, most will US public E & P will be bankrupt by the end of 2017, many will fail in 2016.
We give the companies a hard time here for being reckless. However, we easily forget all the good employees who are being thrown out of a job. It’s a really bad deal, because these people were making really good money.
I read a comment that they can go put up solar panels for $15-20 per hour. I guarantee most in the oil patch were doing much better than that.
OFM, a lot of the reason we still have SOME production running is to try to keep the remaining guys we have in a job. They average over 30 years each of field experience. They have insurance with us. They work mostly unsupervised and do a hell of a good job.
When I think about that, I do think this crash really sucks.
$20 for putting up solar, but “much better than that” for doing, unsupervised and very well, something far more complex. Sounds right.
But what about the rest of us? Which one of these activities do US the best job?
According to lots of elite scientific institutions and the Paris agreement, The rest of us should get off oil asap and on to solar or something less toxic to us. Us includes all the young ones and the ones after them to the last syllable of recorded time.
Around here, it’s coal we are getting off of, fast. I think the right thing to do, and I am working for it, is to give some sort of boost to all those laid-off miners, who I know for a fact are good people, good workers and do what they do very well.
My own favorite idea of the moment, which well may be proven to be nodamgood at all, is to build up a pyrolyzer industry, in which solar-driven plant material is turned into usable gas and carbon, which goes back into that hole that the miners have dug out over the last century or two.
Remember that PV10 is discounting at 10%. If the interest rate on a company’s average debt is below 10%, then they are better off than the PV10 would indicate.
Clueless, very true. Just using a standard valuation metric.
Due to low interest rates, banks started using PV9.
I still believe oil and gas is risky enough to warrant PV10 as a valid metric, especially with the price volatility witnessed in the last 18 years.
Further, I would put LTO on at least the mid point of risk re oil production, due to high cost.
A 2% return is fantastic on an FDIC insured deposit. IMO, it is not on an LTO well, which could be a dud, could quickly develop a casing hole, or have been drilled just crooked enough to cause an average of four down hole failures per year.
shallow sand said:
The oil and gas industry has always paid its workers well.
I found these figures in the Houston Chronicle. They’re from 2011.
http://work.chron.com/average-salary-oil-rig-workers-9120.html
Here’s an indication of what a Solar Energy System Installer currently makes.
http://www.payscale.com/research/US/Job=Solar_Energy_System_Installer/Hourly_Rate
No industry ever pays more than necessary to get the people needed.
People in the solar industry are generally damned glad to have the jobs they do, because jobs are scarce these days.
Hardly any of them have more than a very few years of experience, so far.
The wages they earn are in line with the wages earned by other people doing comparable work in comparable trades such as carpentry, in the places where they are working.
The oil industry pays more BECAUSE IT HAS TO, in order to attract workers to work under oil field conditions, and because bigger companies can almost always pay more. A typical roustabout probably has four or five times the seniority of a solar installer.
As best I can tell, most solar installers work for very small companies that have mostly been started within the last five or six years. Nickel and dime startup businesses cannot be expected to pay top dollar wages.
Wages in the industry can be reasonably expected to go up, as the industry grows, and as the people in it get the necessary experience and seniority to be WORTH more.
Right. Around here, I know most of the solar people. Two installers have been around about 15 yrs, and the others are just a couple of years along, and are very small.
I did my own installation, with help from a local. He has now gone into solar business for himself, has more work than he can do, and so has hired a couple of helpers.
I paid my guy $20 because he was very good and very fast.
and had an astoundingly pleasant personality capable of getting along with crotchety geezer.
My original point was that given everything else, solar has got to get more busy, and coal has got to get less so. Right now, here, the ratio is already 2/1 in favor of solar/wind against coal, with coal going down very fast.
Sorry Mac, can’t agree with you here. The nature of the solar PV business is such that it is unlikely to ever pay the same kinds of rates that oil field workers get. With oil, you are working with one of the most energy dense fuels available from the earth’s crust, being extracted in significant volumes from each well. The fact that people are willing to spend upwards of $8 million on a single oil well indicates the (perceived) value of the fuel that will be extracted.
With solar you are dealing with a far more dispersed energy source with an available power of about 1 kW per square meter. The best PV modules available are approaching 21% efficiency so, we could assume that it will take at least 5 square meters to harvest a kW. To match the available power available from a 100 horsepower (75kW) ICE would require a minimum of about 375 square meters, roughly half the area of a soccer field.
Additionally the skill level required to assemble a PV array is not particularly high. The highest paid field workers in the solar PV business are probably the electricians and again, the nature of the PV business is such that the electrical work is not significantly different from other electrical work. A great deal of effort is being spent in the PV arena to get the soft costs down, reducing the need for each system to be a custom design job with all the attendant permitting and approvals processes. Operation and Maintenance requirements are minimal and robotic systems are being developed to clean very large arrays in areas that don’t get enough rainfall.
While there are potentially many more jobs to be neede in the solar PV business, they are likely to be much lower paying jobs than oil field service jobs. Question is, would you rather have 100,000 folks employed earning an average of $60,000 with a a certain amount unemployed or 300,000 folks earning an average of $30.000 with 200,000 less unemployed?
I agree that solar installation jobs will most likely never pay very well compared to the oil production industry, for all the reasons you mention.
But such jobs might pay BETTER, relatively speaking, compared to oil, than they do now, as the industry grows up, and the little nickel and dime companies go broke or merge with bigger ones.
I agree that a job at thirty grand is a LOT better than NO job at double or triple that.
And a couple who manages their money well can live ok on forty thousand dollars or so in many parts of the USA- including my area.
And most likely a solar installer can stay in his home town, and sleep with his wife, and see his kids, etc on a regular basis.
Oil workers may have to move frequently , and live in man camps and hotels a good bit of the time.
We run our house and our car on PV covering far less than half a football field.
~.75 kWh Daily per sq m Annual Average around here, Nice thing about PV is you know cost and you know Production. What’s your roof worth? http://pvwatts.nrel.gov/ Does not including energy saved by shading from the array.
Ahhh! But you’re not using 75 kW of power, not that many houses ever do.
A Volkswagen Golf can travel 25 miles on a gallon of gasoline that might take a few seconds to put in the tank. A Volkswagen eGolf (electric) uses about 290 Wh per mile so, to go 25 miles would need 7.25 kWh and to get that much charge in say one minute (if it were possible to charge that fast) would require 435 kW or an array about the size of six football fields!
Of course, the real value proposition for solar PV is that, you could charge your eGolf from empty to full and drive 83 miles every day, with the amount of electricity harnessed by a 6kW PV array (24 kWh). Assuming the array lasts for twenty years, that would be 83x365x20 = 605,900 miles of driving from a 6kW array. The gasoline fueled Golf would need 24,236 gallons of fuel to cover the same distance so you could say the 6kw array is worth 24,236 times the average price of a gallon of gasoline over the next twenty years!
I’ll admit that the above is a gross oversimplification of the situation but, it highlights that with gasoline, what we are really paying for is the convenience of “fast recharging” baring which, one could argue that, a 6kW PV array is worth more than 24,000 gallons of gasoline.
Wonder why people don’t grab the thought that investment in solar means security.
My 9kW array will give this house a solid energy income way past my going despite the twists of the oil market. My daughter is happy to move right in.
We have put out close to nothing for house conditioning, cooking and car for a couple of years so far, and are totally happy with the deal.
Well, I keep watching the sharp price declines for solar power: frankly my electricity isn’t that expensive where I live, and the longer I wait the better deal I get on solar panels.
I think if solar prices hits a plateau for a year or two (which they might do five years from now) we’ll see a lot more of the ‘smart money’ dive in.
What time scale are you looking at?
In the 5 year + timescale, I have been looking for oil and gas companies which do not do ANY exploration. Which don’t drill wells at all. Which don’t frack or do any other well “juicing” or “stripping” techniques, either. Just pump the sludge out of the old gushers, sell it, and issue dividends.
I haven’t found a single one.
I expect that ExxonMobil, Chevron, Shell, etc. will set fire to every dollar of profit they earn — set fire to it in the name of “exploration”. So I’m completely out of the entire industry now.
The death of the Alberta dream
A good article on the current situation in Alberta, the tar sand province.
Last Days of Chavez’s Legacy: The Fall of Chavismo in Venezuela:
https://www.youtube.com/watch?v=p5ot_ri1Ox8
No doubt, Fernando will be compelled to comment.
I just watched it, and it is a Maduro /Chavez propaganda piece.
Watch it, and then click thru it, at random, at one minute intervals, and you will see for yourself.
The opposition gets MAYBE a couple of minutes, the regime gets all the rest. The couple of minutes the opposition gets is obviously there for fig leaf purposes, so the regime can as usual pretend to be playing fair.
Typical of a one party regime more interested in staying in power than anything else.
There are apparently NO reporters on the scene who work with the usual major msm media.
What does that tell you, folks? Is anybody stupid enough to think the OPPOSITION would not like to have reporters on the scene?
Only a government can keep reporters OUT. Some are always ready to go into dangerous places to get a story, and the reputation that goes with getting it.
The BBC can barely come up with a couple of paragraphs. No bylined articles in any major paper by a REPORTER ON THE SCENE that I can locate.
But here is something worth reading.
https://www.washingtonpost.com/news/worldviews/wp/2016/01/15/venezuelas-oil-based-economy-is-about-to-flatline-then-what/
And something else from the WP. The WP seems to have developed a LITTLE interest in this country that has maybe the world’s largest oil reserve.
https://www.washingtonpost.com/world/the_americas/venezuela-acknowledges-inflation-at-historic-high/2016/01/15/e677dbb4-bbf0-11e5-85cd-5ad59bc19432_story.html
It’s government financed propaganda. I need to watch it carefully to see if I can figure out where and by whom it was made. I will send the opposition leadership and email linking it.
Later: I saw the first 10 minutes. It has Zulay Aguirre, the DEFEATED District 2 candidate, discussing her campaign. Zulay is Robert Serra’s mom. Serra was murdered by his homosexual partner, the killing was pretty horrible. When his corpse was found it was wrapped in duct tape and the eyeballs were missing.
The regime had put Serra on a pedestal because he was one of the few Chavistas with brains. But the guy was a bit of a psycho, after his murder it came out that he was molesting teenagers, and raped a 16 year old.
Anyway, the video is very one sided. They spent a lot of time inside 23 de enero, a Chavista stronghold – where the Chavistas were defeated very easily by a young woman who had no financing, no fancy computers or the 1300 hundred paid helpers. She simply walked the streets and asked people to vote for her to change things.
Fernando, I know you and OFM think this was a propaganda video for the Chavistas, but I came away with the feeling that they would get no votes at all if they didn’t pay for them somehow.
Greenbub, it is propaganda. The outline follows the typical Chavista line. Also, there is no way in hell they could get inside 23 de Enero without regime AND colectivos approval. That district has been off limits to police for years. And I simply don’t see a film crew flying to Caracas to make that video unless they were financed out of Venezuela’s London office.
The Venezuelan regime is known to have stolen about 200 billion USD over the last 17 years. The money is all over the place, a lot has been used to finance left wing parties, media, talking heads, bloggers, etc.
The scope of the theft, which went on in parallel with the drug trade, is being unraveled and documented by a five nation police and financial task force. For example, one of the investigations led to evidence of cash transfers from the Venezuelan Chavista Mafia to Iran then via a series of money laundering schemes to the Chavista party in Spain, Podemos. This mornings paper here says the police have enough evidence they passed the money flows to the tax authorities, which will now track it to see if the Podemos chieftains declared the income they were being funneled from Iran.
On Friday the ex-governor of the Mexican state of Coahuila, Humberto Moreira Valdés, was apprehended in the airport in Barajas, in Madrid, Spain.
He is currently being held by Spanish authorities without bail on numerous charges, including money laundering, bribery and organized crime.
Spanish authorities believe he illegally funneled more than 2 billion Mexican pesos (about $170 million at exchange rates of the time) into Spain between 2005 and 2011. Spanish authorities allege the money first passed though U.S. banks before eventually being moved to Spain.
http://www.elimparcial.com/EdicionEnlinea/Notas/Nacional/16012016/1044287-Detienen-en-Espana-a-ex-Gobernador-de-Coahuila.html
Moreira Valdés is ex-president of the PRI, the same party of Mexico’s president, Enrique Peña Nieto, and after his governorship ran the successful 2012 presidential campaign of Peña Nieto.
Meanwhile, the saga of the world’s most notorious drug lord, Chapo Guzmán, along with Kate del Castillo and Sean Penn, unfolds.
The collusion which exists, or existed, between the US-backed Peña Nieto regime and Chapo Guzmán’s cartel is on everybody’s lips in Mexico these days.
Penn undoubtedly has a dog in this long-running fight for moral one-upmanship between Latin America’s right and left, and if he can demonstrate collusion between the infamous drug lord and Mexico’s US-backed, right-wing government, this would be quite a blow to the right.
https://www.youtube.com/watch?v=-FBPyRFIA50&feature=youtu.be
Less than a year ago President Obama spoke glowingly of Peña Nieto and his government:
As part of the full court press to bolster Peña Nieto’s image (polls show he never had much of a popular mandate with the Mexican people, and his popularity has now sunk to all-time lows), Time Magazine in 2014 did a cover story on the Mexican president which it titled “Saving Mexico.”
This is funny: Nelson Merentes, socialist president of the Venezuelan National Bank, had $300,000 and 40000€ stolen from his seaside apartment in Naiguatá. The apartment was equipped with security cameras, the police captured the culprits, who it is said were the parents of Merentes’ 17 year old girlfriend.
Greenbub,
You evidently believe fervently in one party politics.
Have you ANY CONCEPTION of what has been going on in Venezuela for the last fifteen years?
It IS true that the Chavista and Maduro regimes did or have done some very good things, but it is also undeniably true that they mismanaged the economy of the country to an extent that would put a dime novelist to shame.
” get no votes at all” without buying them in a country with runaway inflation, major shortages of damned near everything, a country with plenty of agricultural potential unable to feed itself, etc, etc, etc?
The only people I have ever met capable of such devoted partisanship were or are true believers, as for example many fundamentalist members of my own family.
God is always behind them, and on their side, even as he supposedly could instantaneously cure their cancer, or the cancer of their dying little kid.
If you want to believe Maduro and company are honest, ethical and competent, no amount of evidence will EVER convince you otherwise.
As one missionary doing medical work famously said, We are watching fifty thousand kids starve, while we are saving a thousand. God could sent the rain, and save the fifty thousand, except this missionary knew HE had no intention of doing so. I don’t know if the missionary eventually gave up his faith, or not.
I once had faith, as would be expected of a child growing up in my childhood environment, but I lost mine when my well intentioned parents bought an encyclopedia for us kids, at substantial sacrifice to themselves, as we were poor back in those days.
Most assuredly they would never have bought it, had they known the CONTENTS of it, but they wanted us kids to escape the poverty they knew, and were still struggling with at that time.
( Incidentally, one really GOOD reason so many people believe in the socalled American Dream is that in has come true for so many of them, including my parents. They started dirt poor, but made it into what some people refer to as the middle class, meaning they had a nice house, a paid for farm, a new vehicle occasionally, a vacation occasionally, and money enough to sent their kids off to university, although they themselves never had a chance to go to high school. My old Dad is still living.I talk about Momma, and all his other friends and family in Heaven with him quite often, because he believes he will be joining them before long.This doesn’t cost me anything. )
” one really GOOD reason so many people believe in the socalled American Dream is that in has come true for so many of them, including my parents.”
This is of course why pretty much nobody under the age of 40 believes in the so-called American Dream.
It came true for people during an era of totally different government policy. Since Reaganism started, it doesn’t come true any more.
http://www.eia.gov/electricity/monthly/epm_table_grapher.cfm?t=epmt_6_07_b
Check out these tables, and compare the figures in them to the figures quoted by fossil fuel shills.
The ANNUAL capacity factor for utility scale solar was almost twenty percent in JANUARY, and twenty five percent for the year. Pathetic compared to nuclear of course, but I sure would LOVE to have a truck that would run twenty percent of the time without having to buy fuel for it, lol.
Table 6.7.A. Capacity Factors for Utility Scale Generators Primarily Using Fossil Fuels, January 2013-October 2015
I looked at the above table for comparison to “Table 6.7.B. Capacity Factors for Utility Scale Generators Not Primarily Using Fossil Fuels, January 2013-October 2015”. For 2014 the average capacity factor for coal was 61.0% and NG combined cycle gas turbine (CCGT) was 48.3%. What is probably of concern to coal interests is that, the trend in 2015 is towards more use of CCGTs and less coal as evidenced by the figures for October 2015, with coal at 46.8% and CCGT at 53.7%.
What is also interesting from Table 6.7.A, is the very low capacity factors for everything outside of coal and CCGTs. If a 4% CF can be taken as an average of just under an hour a day, the fossil fuel sources other than CCGTs and coal are used on average less than 5 hours per day and in some cases less than half an hour per day. It would seem that these generators with very low capacity factors will be the prime candidates for replacement with utility scale batteries.
Another interesting observation is how electricity generation varies throughout the year. There are peaks in summer and winter with dips in spring and autumn. The summer peaks are probably driven by air conditioning demand and the production profile of solar matches the summer peak demand quite nicely, a fact that seems not to have escaped the utilities, especially those in the desert south west of the US.
The FED oil and gas production index (see below chart) for December came out yesterday along with general US production data. This index is interesting as it covers total oil and gas production and – although revised frequently – gives more actual data than monthly Bakken and RRC Texas data which are still from November. Although at first sight the production decline looks minuscule (around – 3% year over year) the underlying trend shows an acceleration of the monthly decline rate towards -2.5% (from -2%) which is around 30 % annualized. More important is the current development, which indicates a dramatic slump of the US high yield bond and equity market for oil and gas companies. In my estimate the US corporate default rate will rise from 2.5% to 3.5% in 2016, which is one of the worst within major economies. This will make it very difficult for companies to raise fresh capital for new drilling in the months ahead.Where should new production come from when the complete corporate infrastructure extincts? The recent bond and equity crash is not baked into most production forecast models and in my view the decline rate will be much higher than in most estimates.
If someone had asserted in early 2014 that oil prices in early 2016 would be below $30 and that Donald J. Trump would be the most likely GOP candidate for President of the United States, I wonder what we would have said?
Which makes one wonder what will be happening in early 2018.
Prediction: Sometime between now and 2018, OPEC figures out that they can produce all their oil forever and make a profit at $30 bbl, but that is meaningless in the long term, maybe 3-5 years. Because by then their citizens will realize that their countries are rapidly running out of the money that they depend on for their well being.
It is like if person says “I can work for $10/hour for the rest of my life and make it.” But, what if that person has house payments, car payments, a spouse and two kids that depend on them? Then $10/hour will not cut it after they blow through any savings that they had.
I think that the Saudi oil guy underestimated the effects of his decision by an order of several magnitudes [as did most of us]. At some point, he is going to realize that the King, or somebody, will have his head.
I have read that many people in the mideast believe that their oil is a gift from Allah and will never run out. If they get to see production declining and also being sold for less, I expect that they will be pissed.
I have read, and heard, that many analysts are increasingly concerned that a 30 year old, Mohammed bin Salman, is calling a lot of the shots in Saudi Arabia. And there have been widespread reports that members of the royal family are increasingly unhappy about the current regime.
Two princes in Saudi Arabia battle for one throne (October, 2015)
http://www.news.com.au/world/middle-east/two-princes-in-saudi-arabia-battle-for-one-throne/news-story/da3360ebc933b416f2de654c4f81c78b
Jeffrey, there is still a technical projection for WTI at ~$24-$25. Producers/commercials/hedgers are still fully hedged in anticipation of lower prices for H1 2016.
But WTI in the mid-$20s takes the CPI- and US$-adjusted price of oil back to the 1960s-70, 1930s, and 1880s-90s. The price is likely getting close to the bottom of the barrel, so to speak. 🙂
However, with US oil consumption to final sales and the differential change rates of consumption and final sales at the secular trend rate of real final sales per capita near 0%, WTI at $30 is still not yet “cheap”. We would need to see WTI in the $20s for five or more years before oil would be historically “cheap” WRT oil consumption to final sales and the secular trend of real GDP per capita.
But we can’t have “cheap” oil, accelerating (un)economic growth, AND awl production at 9Mbd and consumption at 19Mbd. Something has to give, which will be real GDP growth and oil production and consumption.
Mr. Brown
There is news now coming out that the king is planning on abdicating in a few weeks, appointing his wackjob son as new king, and giving bin Nayef the boot.
The KSA palace infighting may well explode with worldwide repercussions.
Coffeeguy,
Got any links?
OFM. I am not good with links, but Google Saudi King abdicating and you will find several reports. Also sounds like the Saudi oil minister Ali Al-Naimi is being replaced.
One story indicates the King is spending hundreds of millions of dollars within the family, trying to buy support for a change from lateral succession to direct succession.
As I have previously noted, “On Saudi Arabia” (published in 2012) is, in my opinion, an excellent book about the inherent instabilities in Saudi Arabia. Following is the Amazon link and an excerpt from the book:
http://www.amazon.com/On-Saudi-Arabia-Religion-Lines/dp/0307473287
I understand that 30 year old Mohammed bin Salman is the son of the king’s most recent wife, and she has reportedly been pushing hard for her son to be the heir apparent.
Surprising Saudi Rises as a Prince Among Princes (June, 2015)
http://www.nytimes.com/2015/06/07/world/middleeast/surprising-saudi-rises-as-a-prince-among-princes.html
No, actually, we have to drop below $20/bbl to get the CPI-adjusted price of oil back to the 1928-1972 levels. I am pretty sure this won’t happen, or if it does it won’t last for more than six months.
Oil first became cheap in 1879. There were spikes in 1895 and 1899 for reasons I don’t understand, and leading up to 1920 probably because of WWI. After that oil stayed cheap until 1972. It has *never been cheap again* and never will be.
2008 Oil Price Decline Vs. 2014 Oil Price Decline
Monthly Brent spot crude oil prices:
https://www.eia.gov/dnav/pet/hist/LeafHandler.ashx?n=PET&s=RBRTE&f=M
In 2008, after crossing the $100 mark on the way up, the first month below $100 was 9/08, when Brent averaged $97. The monthly low was only three months later, in 12/08, when Brent averaged $40. As prices recovered, subsequent months in 2009 were all higher than $40, and the 12/09 price was $75. The monthly price exceeded $100 again in 2/11, when Brent averaged $104.
Arguably, if we measure the oil price decline as the number of months below $100 to the monthly low, the price slump was only four months long in 2008. Prices were in a recovery phase from 1/09 forward.
In 2014, the first month below $100 was 9/14, when Brent averaged $97. The initial decline was much slower than 2008, but the current decline has been much longer than the 2008 decline, in terms of the number of months below $100, until we see a sustained price recovery (four months for 2008 versus 17 months and counting for the current decline). When Dennis predicted that the monthly low for the current decline was 1/15, when Brent averaged $48, I thought that he was right, and for several months it looked like Dennis was right. Unfortunately, for folks in the Oil Patch Depression, we have subsequently seen lower lows. Whereas monthly Brent prices rose from $40 in 12/08 to $75 in 12/09, monthly Brent prices fell from $62 in 12/14 to $38 in 12/15.
Following a “V” shaped oil price decline in 2008, it took about two years for the total US rig count to again approach 2,000 rigs. I wonder when, or if, that the US rig count will again approach the 2,000 mark. As I have frequently noted, a reasonable estimate in my opinion is that at current levels of US production, we need about 1.5 million bpd of new C+C production and about 17 BCF/day of new gas production every year, just to offset declines from existing wells.
I am surprised at the balls of the investors that are still short this oil market. With respect to what Jeffrey just pointed out, let me posit a hypothetical, and anyone can guess.
What would happen to the price of oil if the Saudis made this announcement? “We have been closely following the oil market since our decision 16 months ago. Much of the existing surplus and, more importantly, much of the projected future surplus from that point has been eliminated. We believe that at this time a “shared” cut of 1.5 million barrels/day will balance the oil market. Therefore, if there is support for this position, we will be in favor of an emergency meeting of OPEC.”
I would expect an immediate increase to $45, and then to $60 if they actually held a meeting and cut. But, this is just wishful thinking.
EIA data show that Saudi total petroleum liquids + other liquids production declined from 11.1 million bpd in the 4th quarter of 2008 to 10.2 million bpd in 2nd quarter of 2009, a decline of almost a million bpd. As noted above, the monthly low for the 2008 oil price decline was December, 2008.
From the 4th quarter of 2014 to the 2nd quarter of 2015, EIA data show that Saudi production increased from 11.6 million bpd to 12.0 million bpd, an increase of 0.4 million bpd.
Annual Saudi total liquids consumption for 2008 was 2.2 million bpd* (EIA) and annual total liquids consumption for 2014 was 3.2 million bpd (BP).
*BP was 2.4 for 2008
Clueless. I agree. My paranoid mind believes that big money with inside information, which would be OPEC ties, is extremely short, but has tricked the stupid money retail investors into shorting oil through ETFs. That, combined with the constant MSM drumbeat, which has also happened during times of high prices, could cause those retail investors to again lose their shirts.
I have always thought, maybe condescendingly, that a large chunk of the US population should not be managing their retirement funds. That probably includes me. For example, a friend of mine once told me that his 401k eliminated a high beta small cap mutual fund from possible elections because fully 30% of contributions were being directed into it by participants, and that percentage was too high by a magnitude of six. But, despite repeated warnings, they couldn’t get employees to back off, so they just removed it as an election, due to liability concerns.
This may be wishful thinking on my part, but if I controlled OPEC, and owned a large chunk of many of the money center banks, such as Citi, I would at least be trying to make some money behind the scenes when I knew I was going to drive the oil price down.
Also, I agree that KSA didn’t see this dramatic of a collapse. Almost no one did.
https://app.box.com/s/4hw6itg9g451ho50kbvu2x4fynrz0rkh
The US economy probably entered recession at some point between Q2 and Q4 2015.
Employment growth YoY is being overstated, perhaps by as much as 1% or more.
Were the historical cyclical pattern to repeat, full-time employment will be down 1.75-2% a year or so from now and the 4-qtr. average for real GDP will turn negative in the next 2-4 to 6 qtrs. from the current 1.7% rate (~1% per capita).
Stock up on those beans, rice, and tortillas at your local Wal-Mart before it closes.
Running a nice supermarket in a run down part of a city is a really TOUGH job. The community wants a nice store, with all the fresh veggies and fruits, etc, but the community generally does not BUY enough of this desired large variety of nice fresh fruit, etc, to make profitable operation possible.
Expenses relating to theft, absenteeism, bad checks, etc are much higher as well.
So far none of the mommie nannies have been able to figure out a way to keep the good citizens, in the economic sense, in a bad neighborhood. Anybody who can afford to leave, LEAVES. The folks who are left spend their money on booze, cigarettes, and the sort of stuff that can be bought at a one horse semi convenient store with barred windows and door. I used to live in a city, and paid close attention to such things, as my living and even my life depended on my doing so. A single mile can make all the difference in the world.
Walmart is not closing any stores with big parking lots and a hundred thousand square feet of sales floor space. The company lost the bet on small stores in less desirable locations.
US oil prices: http://crudeoilpostings.semgroupcorp.com
A lot of pipe out there ready to go to build the Keystone XL.
That’s impressive. Many U.S. grades trading in the $14-19/bbl range
Canadian heavy already below $10
http://www.bloomberg.com/news/articles/2016-01-13/crude-at-10-already-a-reality-for-canadian-oil-sands-miners
OPEC basket below $25, many global crudes well below Brent/WTI $29.
So at $8.35 per bbl, they are still making $ on an operating basis? Article seems to imply this.
I very much doubt.
From Suncor’s 3Q15 report:
“Oil Sands operations cash operating costs per barrel(1) decreased to $27.00 for the third quarter of 2015, which was the lowest achieved since 2007. This decrease was driven by strong production of 430,300 barrels per day (bbls/d)
despite planned maintenance at Upgrader 2, lower natural gas prices and the company’s cost reduction initiatives.”
And yet they had a net loss of 21 mn in their Oil Sands division.
Rystad Energy estimates Canada’ median opex per barrel at $22, but this includes conventional production.
It is not clear what they mean by cash operating costs. This could be only the direct operating cost as opposed to the “All-in” operating cost. Attached is the “All-In” cost per barrel (Cdn) breakdown for Canadian Oil Sands, the company that Suncor is currently trying to pickup through a hostile take over. Note the direct operating cost is $37.14, including energy, and the expected average sale price for a barrel of synthetic crude is $64.68 for 2016. Note that today, $US 1 = $Cdn 1.45. Synthetic crude usually sells close to WTI, sometime with a small discount, sometime with a small premium.
I have modelled the direct operating cost for this company and it is related to how many barrels they produce in a given quarter. The model for production cost was close to:
Cost/bbl = [$200,000,000 +$16*(Production bbls)]/(Production bbls)
To this add the Energy cost per barrel. As I understand, the effort now is to reduce the $200M by reducing contractor costs.
Note that taxes are NA because the earnings will probably be a loss, hence no tax.
Cash operating cost = total operating cost less non-cash items (depreciation and amortization, impairments, etc)
It is not clear what they mean by cash operating costs. This could be only the direct operating cost as opposed to the “All-in” operating cost. Attached is the “All-In” cost per barrel (Cdn) breakdown for Canadian Oil Sands, the company that Suncor is currently trying to pickup through a hostile take over. Note the direct operating cost is $37.14, including energy, and the expected average sale price for a barrel of synthetic crude is $64.68 for 2016. Note that today, $US 1 = $Cdn 1.45. Synthetic crude usually sells close to WTI, sometime with a small discount, sometime with a small premium.
I have modelled the direct operating cost for this company and it is related to how many barrels they produce in a given quarter. The model for production cost was close to:
Cost/bbl = [$200,000,000 +$16*(Production bbls)]/(Production bbls)
To this add the Energy cost per barrel. As I understand, the effort now is to reduce the $200M by reducing contractor costs.
Note that the taxes are NA since the earnings will probably be a loss, hence no taxes.
Two years after the Season Effect Model was published here for the first time, I would like to announce you the model is still exactly on track. The oktober production number was 0.9% below prediction. The november production number was 0.8% above prediction. If the data stay on track with the model, ND Bakken will lose 100k barrels per day over the course of the next 6 months.
IRAN NUCLEAR DEAL: MINISTER SAYS SANCTIONS ‘TO BE LIFTED’
“International sanctions against Iran are to be lifted today, the country’s Foreign Minister Javad Zarif has said…….The sanctions have cost Iran more than more than $160bn (£102bn) in oil revenue since 2012 alone. Once they are lifted, the country will be able to resume selling oil on international markets and using the global financial system for trade. Iran has the fourth largest oil reserves in the world and the energy industry is braced for lower prices. Iran will also be able to access more than $100bn in assets frozen overseas….”
http://www.bbc.com/news/world-europe-35330064
From Reuters:
Iran has 22 Very Large Crude Carriers (VLCCs) floating off its coast, with 13 fully or almost fully loaded, mapping data on Thomson Reuters’ Eikon showed, carrying enough crude to meet India’s import needs for almost a week.
A senior Iranian source close to supply negotiations said that the country – which has the world’s fourth-biggest proven oil reserves – was targeting India as its main destination for crude.
“Indian crude demand is growing faster than other Asian countries. Like our competitors, we see this country as one of the main targets for Asian sales,” said the official, who spoke on condition of anonymity.
Iran hopes to raise its exports to India by 200,000 bpd, up from the 260,000 bpd currently shipped under sanctions’ restrictions, the official said.
At the right price, Indian refiners said they were keen to import more from Iran, as demand for fuel soars on 10 percent annual growth in car sales, a rate that is now faster than China’s.
The Iranian official said there was not much room for major export increases to China, South Korea or Japan due to slowing demand and also because of a shift there towards more non-Middle East crudes.
A South Korean refinery source confirmed he did not expect a big increase in Iranian supplies, largely because of plentiful alternatives.
A Japanese refiner said that his firm could only take Iranian deliveries once it had insurance in place, which could take time.
Iran already trades limited amounts of oil mainly with Asian buyers legitimately under sanctions, but its crude exports have fallen to just over 1 million bpd, down from a peak of over 3 million bpd in 2011, pre-sanctions.
The Iranian official said Tehran planned to revive supply deals with European partners in order to ramp up exports.
Prior to sanctions, Iran was exporting up to 800,000 bpd to Europe with the main buyers being oil majors Royal Dutch Shell, Italy’s ENI and France’s Total Greek Hellenic Petroleum and Spain’s Repsol and Turkish firms.
Most former buyers have repeatedly said they would be happy to resume imports but commercial details could be discussed only after sanctions are lifted.
Iran’s Mehr news agency quoted officials from the National Iranian Tanker Company (NITC) as saying on Friday that as soon as sanctions are lifted some 200,000-220,000 bpd would be exported to France, Britain, Italy, Spain and Germany.
In a cut-throat market, Iran may also find it difficult to sell its oil as the heavy grades it mostly offers are in low demand.
Latin American suppliers who produce similar heavy crudes have been seeking new buyers in Asia.
Within the Middle East, traders said Iran’s main competitor would be Iraq, which has successfully returned to Asian markets in recent years, with exports rising above 3.5 million bpd.
In Europe, traders said Iran’s crude would compete mainly with Russian Urals and Iraqi grades, which are competitively priced.
In China and India, strong passenger car sales are fuelling gasoline demand, while a slowdown in Asia’s heavy industries means slower demand for diesel, which heavy crudes are often used to produce.
Iran does have light crudes, but needs them for itself to reduce gasoline imports.
http://www.reuters.com/article/us-iran-oil-exports-idUSKCN0UT098
Access to 100 billion previously frozen is nice and will help to upgrade their oil infrastructure “in a long run” as well as upgrade some other vital infrastructure. But with that amount of cash in hand why they are so pressed to sell their strategic resource at rock bottom prices? They are better diversified then Saudis and sanctions helped to increase this diversification.
I am wondering why BBC and other MSM are pushing this event so hard in the direction of increasing “oil glut”. This this pure old GB colonial greed? During the latest OPEC meeting Iran was one of the countries that was for cutting output, not increasing it.
Iran has already access to all growing markets in Asia, especially India and China. As for European market the question that BBC did not eve try to answer is “To whom can they sell their oil without undercutting Saudis?” So why Europe makes any sense at all to them. I would let Saudis to waste their resources as long as then can. Their suicidal policy should be punishable.
Saudis recently even tried to kick out Russia from Polish oil market, by undercutting their price despite the fact that Russia has a pipeline to Poland, so transportation costs are much lower. Their behavior is really strange, as if they to get rid of oil as fast as they can is the primary goal of the new king and his “Margaret Thatcher of Saudi Arabia” neoliberal son, who wants to privatize everything in sight. In was actually the son which got Saudis in Yemen civil war.
I think that currently Iran might be able to sell their condensate to Japan at a huge discount, and may be a couple of other Asian countries able to process it, but that’s about it.
Before sanctions were imposed on Iran in 2012 “the top destination for Iran’s crude oil exports in the six months between January and June 2011 was China, totaling 22% of Iran’s crude oil exports. Japan and India also make up a big proportion, taking 14% and 13% respectively of the total exports of Iran. The European Union imports 18% of Iran’s total exports with Italy and Spain taking the largest amounts.
Sri Lanka and Turkey are the most dependent on Iran’s crude exports with it accounting for 100% and 51% of total crude imported, respectively. South Africa also takes 25% of its total crude from Iran.”
http://www.theguardian.com/news/datablog/2012/feb/06/iran-oil-exports-destination
Does anybody know how much it costs to build crude oil storage from scratch? Steel, concrete , and labor are the main inputs, and all are fairly cheap right now, just about anywhere in the world.
Some people, it is impossible for me to guess how many, are storing physical crude expecting the price to go up. I am wondering if any new storage is being built for that specific reason.
I think most strategic storage is underground. Article focus is India but includes US, Japan, China and EU.
STOCKING UP, UNDERGROUND
http://indianexpress.com/article/india/india-others/stocking-up-underground/
Thanks Doug,
This article really say just how much per barrel or meter of storage the cavern costs to excavate.
But it does make sense that v excavated caverns might be cheaper, and a lot more secure, than above ground tank farms.
Governments store oil for reasons involving SECURITY, rather than profits, and the costs of caverns is hardly going to matter to a government in need of a strategic oil reserve, they are just going to go ahead to the extent money can be found.
Now let us suppose a business man willing to do some SERIOUS gambling is willing to excavate a cavern, and fill it with oil. Excluding taxes and opportunity costs, he might (MIGHT!) fill his cavern for twenty five bucks a barrel, and sell it for a hundred three years down the road.
Or he might sell it for thirty or forty bucks a few years down the road.
If I were really rich, and could excavate a cavern for say twenty five bucks per cubic meter, I would think about owning a cavern full of oil.
The cavern itself would likely always be worth a good bit to somebody else interested in storing oil, so you could recover part or maybe even all the cost of construction in a future sale.
Hi all,
The Iraq oil in storage is already accounted for in the storage numbers. Can they increase actual output, maybe by 500 kb/d in the near term, this will be more than offset by declines in the US, Canada, and Brazil, my guess is that World output falls by 1 Mb/d on average for the year in 2016 relative to 2015, if oil prices remain at $40/b or less on average for 2016. If oil prices continue to fall, supply will fall and oil prices will rise. Oil prices at $30/b or less cannot be sustained for more than 2 months in my opinion, by March the average price for the month will be more than $30/b and prices will increase from there.
The predictions of $10/b for oil are nonsense. It is as simple as that. Maybe in 2060, but not before 2030, not for a monthly average oil price for WTI.
Let me get this. Are we expending money and energy extracting oil from underground, to expend more money to put it back underground?
Homo sapiens is overrated.
It cost approximately $16 per barrel for large storage tanks.
If this figure of sixteen dollars per barrel of storage for tank construction is accurate, and includes the necessary additional infrastructure, or that additional infrastructure is already in place, then I can see why a LOT of oil COULD BE going into newly built tank farms.
Interest rates are near zero, and there are certainly some people around who have plenty of cash.
Consider that they might be getting a special deal on taxes because the home country is interested in having ample storage inside the borders, and that government and business may be conjoined twins ( Russia, China, many other countries fall into this category ) .
I do not have money to gamble on more than one lottery ticket at a time, and better sense than to buy that ONE, but if I did, I would take the gamble of buying a good quality crude at say thirty bucks and having fifty bucks total including storage tie up in it, in a nice new storage tank near a refinery.
If that thirty dollar crude goes to sixty or more within three or four years, you would have a very nice profit. And if oil were to go back to eighty , ninety, a hundred…….
Suppose the future market REALLY goes haywire,and naked bets turn sour, and with oil selling at say eighty, they can’t pay up on their bet it would be selling for only fifty.
HOW MANY people might not be able to pay, and HOW MUCH might they owe?
Is it possible that the financial markets might have a heart attack as a result ?
The rules and procedures that are supposed to prevent this sort of thing from happening might not be adequate to the job.
There are additional good reasons this strategy might make sense in China.
The construction work would help keep Chinese steel mills and Chinese construction guys busy, at a time when the economy is turning sour, and while the Chinese currency is relatively strong but probably going to depreciate soon, at least according to some folks who follow currency markets.
So far as I can see China has a zero chance of ever being self sufficient in oil, and oil in hand might make a lot better sense to a Confucian commie than electrons in cloud.
Unprecedented 4 Sure – This from Ilargi
“people are finally waking up to the reality … ”
“Alarm bells in the desert.”
“Squeeze oil and you squeeze the entire economic system”
“The consequences of all this will be felt all over the world, and for a long time to come. All of our economic systems run on oil, so many jobs are related to it, so many ‘fields’ in the economy, and no, things won’t get easier when oil is at $20 or $10, it’ll be a disaster of biblical proportions, like a swarm of locusts that leaves precious little behind. Squeeze oil and you squeeze the entire economic system.”
http://www.zerohedge.com/news/2016-01-15/re-covering-oil-war
“Interestingly, people are finally waking up to the reality that this is a development that first started with falling demand. China.”
This guy does not know what he is talking about.
http://www.reuters.com/article/china-oil-demand-idUSL3N14W2UQ20160112
=== Start of quote ===
“The government-backed association also predicted the country’s demand for crude oil will rise 4.9 percent this year to 570 million tonnes, or 11.37 million barrels per day (bpd).”
… … …
China’s oil demand – refinery runs plus net imports – moderated in 2015, with November demand dropping 2.5 percent from the year ago period, according to Reuters calculations.
Even with demand moderating, stockpiling in government and commercial tanks has propped up growth in China’s crude oil imports, which were up nearly 9 percent Jan-Nov.
Perhaps many think it’s Crazy not to acquire at these prices – if you have a place, use or capacity to convert.
Is this what watcher has been talking about?
“Exclusive: Dallas Fed Quietly Suspends Energy Mark-To-Market On Default Contagion Fears”
http://www.zerohedge.com/news/2016-01-16/exclusive-dallas-fed-quietly-suspends-energy-mark-market-tells-banks-not-force-shale
Yes it is, secret federal intervention. Clearly situation in LTO sector is very, very bad, FED need do secret things to not make panic, like 2008.
Do you think somebody actually knows what Watcher is talking about? ?
Don’t get me wrong, I love Watcher’s posts.
Doug, I think I know. The banks are not going to call the oil producers’ loans, nor take losses on them on their books, despite the terms of the loans, and despite banking regulations.
For example, as I have discussed previously, the value of almost all US LTO producers’ assets are currently worth less than long term debt. If Bank A is owed $100 million on oil assets now worth $50 million, they are normally required to make a provision for loan losses. This provision goes against the banks’ earnings, which reduces earnings. The bank reports losses, share price goes down. If it is a big bank, like Wells Fargo, all bank shares fall in sympathy, and maybe the stock indexes drop a great deal as a result.
Likewise, most bank loan terms include a borrowing base. The base is the amount of principal the oil producer may borrow. It is determined by the value of the oil producers reserves, with proved developed producing being the primary component. Proved undeveloped are more speculative in nature, and are discounted, or should be.
The borrowing bases are redetermined semi annually. All borrowing bases should have been cut tremendously since 2014. But they haven’t been. Now, producers owe much more on the borrowing bases than what those bases should now be set at. This, of course, triggers default, foreclosure, bankruptcy, etc. But, apparently, the banks are being told to pretend the assets values have not dropped, and extend the bases to the fall of 2016.
So, for example, if Bank A has an oil producer borrower which owes $100 million on assets now worth $50 million, the bank should be required to cut the borrower’s base to $30-35 million. If the producer cannot raise the money to pay off the overage, default is triggered.
The Fed apparently is hoping OPEC will cut soon to, and in a big way. Maybe they know something?
The problem is that remaining CNC, Cumulative Net Cashflow (from producing properties), is depleting an at accelerating rate of decline, subject of course to what oil price assumptions one uses (but the production decline from existing wells marches on):
http://peakoilbarrel.com/us-oil-production-finally-starting-to-decline/comment-page-1/#comment-530205
Just a couple of days ago, BOK (Bank of Oklahoma, controlled by multi-billionaire George Kaiser and huge democrat, who inherited Kaiser Francis Oil Company from his father) said that they had to revise expected 4th quarter profit down by $20 million because a large independent oil company’s loan had been impaired by the decline in the price of oil. Article in the Daily Oklahoman.
Borrowing bases are being cut and more importantly covenants have been tightened significantly.
Borrowing bases that were just set in December are getting reduced now. The banks are asking for a early redetermination of the oil & gas asset base. This will continue at a rapid pace with the drop in prices since the first of the year.
Yeah, Watcher’s inscrutability is suddenly a lot more scrutable.
I am glad the U.S. Government and Fed aren’t propping up the banks and markets…. like the rest of the world.
Right Ron?
Prof. MudFlap
I have no idea what you are insinuating Mudflap, but if the US government and/or the Fed, is trying to prop up our markets right now, they are really doing a piss poor job.
We’ll get to see geological reality when there are gasoline lines at gas stations and the emergency meetings don’t include anyone from Yellen’s staff.
International Sanctions against Iran lifted
Despite official rejoicing by the negotiating partners, implementation comes at a particularly inauspicious time for Iran and the United States.
Oil is at its lowest price in more than a decade, in part because of expectations Iranian crude will flood the market, and Iran’s currency has declined precipitously. Tehran will be getting far less income than it anticipated when the negotiations took hold in late 2013, making it difficult for the government to deliver the jobs and economic boom Iranians have been told will ensue. Many think it will take years to repair the country’s decrepit energy infrastructure in order for oil to flow at its pre-sanctions rate.
Any bets on what this will do to the price of oil next week? Or oil production in the next few months? I am betting… not much. Though there might be a further drop in the price of oil next week, but I am betting not a lot.
But my bets are often wide of their mark.
I think the market already anticipated the increase in Iranian exports, so the impact on the price should be limited.
AlexS. I have communicated with many conventional producers and service people today. A couple are with very large private companies.
It seems unanimous that WTI is headed below $20. No one really knows anything out here, that is just the mood.
US conventional will be shut in en masse at sub $20 WTI.
Shallow,
Several financial analysts have said that some 70% of American trades are high frequency trading. So it’s not people but computers will decide how low market goes. If trend is down it will be amplified.
A privately owned North Dakota operator shut in 200 wells last week due to low prices.
This has already been occurring with conventional production. When wells develop operational problems the operators just leave the wells down unless the lease requires the well be returned to production
Never been a believer that Iran was all that constricted by it all. There’s too much politics in sanctions — it’s almost an Obama doctrine — sanctions rather than anything else kind of thing, so there was always a political impetus to show they were successful — which was particularly easy to do if successful had no definition.
Lotsa talk about Iran exporting condensate in big quantities all during the sanction period. That was income and condensate then may have brought in more money than crude would now.
Article yesterday saying Iran was going to reprice whatever they export — something other than currency. Ominous precedent.
Obama not only uses sanctions for anybody who does not agree with his administration policies, his administration and he personally also is complicit with this bonanza of unlimited financing for shale patch:
=== quote ===
Senator Barack Obama: “I mean we send a billion dollars every day to foreign nations because of our addiction to foreign oil, and in the bargain we drive up our gas prices because of high demand, so it’s hitting you in the pocket book. ” (Senator Barack Obama, Remarks At A Campaign Event At The University Of Alabama, Birmingham, AL, 1/26/08)
Iran has been exporting more crude than most people think. Their black market sales have been significant.
The oil market will react positively once the Iranian oil starts flowing and the volumes are known. Uncertainty of the volumes has been a major contributor of the negative sentiment that traders have used to drive prices to $29 a barrel.
It may take 9 months before Iran exports any oil at all:
http://www.wsj.com/articles/iran-tempers-expectations-on-oils-return-to-global-stage-1453033634
Considering they’re not even opening their projects to bidders until late february that sounds about right.
Does this quote below from above mean that the sanctions have helped Iran if the frozen cash was in US dollars?
…. “and Iran’s currency has declined precipitously.”
There is an old saying:” Buy the rumor, sell the fact”. In the particular case of Iranian supplies I would say: “Sell the rumor, buy the fact”.
Additional volumes from Iran are already priced in. And if the increase in Iranian supplies is not much bigger than anticipated, the market reaction will be muted.
There could be even an upward correction next week. The oil market is oversold after two weeks of sharp declines. Short positions are at record levels. So traders may decide to take profits on short positions.
That doesn’t mean, however, that the market has reached the bottom. Prices will remain very volatile during the course of 2016, and will likely test new lows in the next few weeks and months.
But in the second half, in my view, the market will start to rebalance, and prices may reach the $40-50 range.
In other words “The devil is not as black as he is painted.”
― Dante Alighieri, The Divine Comedy
AlexS. $40-50 range in second half of 2016 will not save most LTO.
I assume your view excludes an OPEC cut in 2016.
Hi Shallow sand,
I think that AlexS agrees LTO output will decline at these prices, but that increases elsewhere will make the decline in world output modest (maybe 500kb/d), the excess oil in storage will take some time to draw down to average 5 year levels, about a year if this estimate is correct, so it will take some time for oil prices to rise.
I mostly agree with AlexS’s analysis (if I have it right), the only difference is that I expect World decline in 201 to be about 1 Mb/d so stocks return to normal levels more quickly, and oil prices rise more sharply, maybe to $60 to $70/b by Dec 2016 (monthly average).
What do you think/guess?
Dennis,
I agree with you first paragraph, but disagree with the second. 🙂
As regards the EIA price projections, I know that they are based on futures, and that oil futures have never been good predictors. But this time the EIA’s analysis of the oil market in 2016 looks reasonable to me. The only difference is that their WTI price forecast for 1Q16 ($36-37) is too high, in my view; and for 4Q16 ($42-43) – a bit too low. Also, I expect a slightly steeper price rebound in 2017.
Hi AlexS,
Thanks, so a 500 kb/d decline in World C+C average output for 2016 sounds reasonable, but a 1000 kb/d decline in average World C+C output in 2016 seems too high, even if oil prices average under $40/b in 2016?
I think either oil prices will average more than $40/b for 2016 (closer to $50/b) or the decline in oil output will be more than 500 kb/d (average for 2016 vs 2015), it is unlikely that output will decline by such a small amount at such low oil prices, but time will tell.
Dennis, I have no clue, so I wont guess.
Sorry.
Hi Shallow sand,
Nobody has a clue, but my guess is that your guess would be better than mine. No need for apologies, the smart man does not profess to know the future.
Indeed you are a much smarter man than me, and I doubt anyone would disagree.
shallow sand,
– “$40-50 range in second half of 2016 will not save most LTO”
Yes, I think the LTO industry will remain in a surviving mode, and many players will not survive. There will be more bankruptcies, distressed asset sales, and LTO production may decline by some 0.5-1.0 mb/d (depending on the ability and willingness of financial institutions and the government to help shale players). But this decline is already anticipated in most forecasts. Thus, the EIA expects U.S. onshore C+C production to decline by 0.8 mb/d this year. And even “shale optimists” and oil price bears, like Goldman and Citigroup, are projecting a 500-600 kb/d drop.
As regards conventional oil industry, it can survive at $40-50. While these price levels lead to sharply reduced investments and project delays, they cover operating costs and maintenance capex for most conventional players worldwide. For conventional oil, there is a big difference between $25-30 and $40-50. Therefore, I believe prices can remain at today’s levels only for a few weeks, (no more than 2 or 3 months), but the period of $40-50 oil may me much longer (up to 2 years, in my view).
Given that there are many projects at final stages of development, they will largely offset declining production in the old fields, so this year there will be only modest decline in non-OPEC production ex-US. But projects delayed in 2015-16 will significantly impact production levels by the end of this decade and especially beyond 2020.
– I assume your view excludes an OPEC cut in 2016
Yes, I still think the probability of an OPEC cut in 2016 is less than 10%.
1) It simply doesn’t make sense for the Saudis and their allies (UAE, Qatar, Kuwait) to change their strategy without having achieved their goals. If they cut production, shale companies will quickly increase drilling and output volumes, taking large part of OPEC market share. And that would eventually again lead to lower oil prices. By contrast, if prices remain low for 2 or 3 years, the situation around LTO may change drastically. There will be more pain, more bankruptcies, even sharper cuts in investments and drilling activity and continued declines in output volumes. That would not kill the shale industry, but will make is much less arrogant, more cautious, more financially responsible, and less growth-oriented.
2) An OPEC cut actually means Saudi cut, as the so called price hawks, like Venezuela and Iran, usually tend to cheat and not to cut production. Furthermore, Iran has stated very clearly, that they will not participate in OPEC cuts, as during the period of sanctions Iran’s market share was taken by the Saudis and others. Iraq also says that for many years they have been producing well below their potential and now they are implementing long-term plans to increase production capacity. Hence, an OPEC cut would result in Saudi Arabia (and to a lesser extent Kuwait and UAE) taking the burden of balancing the market through lower production, while their market share would be taken not only by LTO, but also by Iran and Iraq.
3) The current tensions between Saudi Arabia and Iran make any accord on output cuts within OPEC even less probable.
4) The Saudis can afford 2 or 3 years of low oil prices thanks to their foreign reserves and access to foreign capital markets. And by that time the oil market will rebalance itself without any help from OPEC.
shallow sand
You and OFM actually pointed out a factor that is supporting oil production even if it is loss-making: high abandonment costs and the need to retain workforce.
Also note that most conventional producers are in a much better financial situation than LTO. Only a few of them (like Petrobras) have large debt levels.
AlexS. I think maybe many LTO/gas companies are at the capitulation stage right now.
I follow several, but full disclosure only own XOM and COP, and not a lot of either. COP is having trouble, with a recent closing price of $39.36 and s dividend yield of 7.18%. They really need to cut the dividend. However, the stock could really collapse if that happens. It was in the 80s not long ago.
When the price started falling in 2014, I made a list of the LTO and MLPs. I listed 55, which I am sure is not all of them.
29 of the 55 are trading under $10 per share.
Of those 29, 21 are under $2 per share.
5 have been delisted. 7 more are under $1, meaning delisting is coming.
One I pick on frequently is CLR. As of 9/30/15 They had $17 million of cash v $7.1 billion of debt. For perspective, it is the same ratio as s family having $17,000 cash and owing $7.1 million dollars. Their DD & A has been running $21-22 per BOE. Today they are realizing gross revenues of about $15 per BOE. This is before deductions for severance taxes, OPEX and G & A.
Practically every US public oil producer is paying bills with borrowed funds.
Does OPEC really need to keep oil under $40 through 2018 to achieve its goals with US shale?
Hi Shallow sand,
I think AlexS thinks (and I agree) that the low oil prices will be temporary and will rise to higher levels,OPEC may also think this is true and sees no need to cut.
I think oil prices will rise to higher levels than AlexS, because I think oil supply will fall more quickly than he does. In the past I have been wrong on how quickly this would occur, this may continue in the future, time will tell.
I just don’t think a lot of oil investment will occur at an oil price of $45/b (where AlexS thinks oil prices will remain for a few years, maybe 2015 and 2016). I expect at that oil price we might see non-OPEC oil output decline by about 5% (roughly 2 Mb/d). That in turn will balance oil markets and cause oil prices to rise, possibly by mid 2016.
Shallow, my opinion on this is virtually worthless, but whereas I previously predicted that they would not cut in December, I now think they will cut (even without cooperation) within the next six months. Things are starting spiral out of control and they have already poisoned American LTO, just waiting for it to take effect.
Greenbub. My thesis from the beginning of the price drop was that LTO needs a high, stable price. Unlike LTO, Gulf OPEC can much more easily live with price volatility.
When OPEC did not cut Thanksgiving, 2014, I was not surprised. Nor was I surprised that US rig count fell off a cliff in response.
What did surprise me was how US production did not drop. I now realize some of that was due to GOM. However, much is due to the continued completion of high IP, low high decline LTO wells. North Dakota Bakken is the best to see this, as we have the best data.
I think this surprised OPEC also. I looked for prices in the $50s-$60s to stall LTO, then cause it to fall. I was wrong.
What I also did not see coming was OPEC boosting production as they have. Same with Russia. The Iranian issue was not expected either.
I did not enjoy $40-$55 oil the first half of 2015, but could live with it. Could live with it in 2016 also. I think we are more like OPEC in that regard. I think that was what OPEC foresaw. But they didn’t realize that LTO would keep getting money to drill. For example, CLR, with $7.1 million of long term debt as of 9/30/15, and only $17 million in cash, still has many rigs drilling. They should have zero under normal circumstances.
$30-40 oil hurts us, but again although losing money, it is survivable.
We are now at $24.XX per barrel, which is devastating. I have to think it is also devastating for both OPEC and Russia.
How much in reserves does KSA burn when they sell oil at $25?
One thing I wonder about. Say prices stay here awhile, sub $30. If the LTO money from the banks does freeze up, and prices rebound to $50-60, do we see a big rig spike? Wont most LTO have been too damaged?
As I have previously noted, if we define the duration of the 2008 oil price decline as the number of sub-$100 months until monthly prices exceeded the monthly low price (12/08 for Brent), the duration was only four months–until we saw a sustained price increase in excess of the monthly low, and the monthly Brent price rose from $40 in 12/08 to $74 in 12/09 (Brent exceeded the $100 mark again in 2/11):
http://www.eia.gov/dnav/pet/hist/LeafHandler.ashx?n=PET&s=RBRTE&f=M
Using the same metric, the current oil price decline is more than four times longer (17 months and counting).
However, it took about two years for the US rig count to again hit the vicinity of the 2,000 mark, after falling below 1,000, in response to the 2008 “V” shaped price decline. I wonder when, or even if, the US rig count will again approach the 2,000 mark.
And another absolutely crucial difference between the 2008 price decline and the current price decline is that the volumetric loss of US Crude + Condensate (C+C) production in 2008 was probably only about 0.25 million bpd per year whereas it is plausibly around 1.5 million bpd per year now.
Hi AlexS,
One problem with your analysis is that there will be very little investment in conventional production in non-OPEC countries at prolonged prices of $40 to $50/b. I agree that already producing wells will not be shut in at these prices, but new wells will not be drilled. OPEC output is around 33 Mb/d and World output about 79.5 Mb/d in 2015, so if non-OPEC oil output declined by 5% due to lack of investment that would be about 2 Mb/d.
My estimate foe a 1 Mb/d decline is only half this estimate (in part because I expect your $45/b price estimate is too low).
Do you really think World oil output will be maintained at and average oil price of $45/b in 2016? So far recent non-OPEC oil output increases have been from the US and Canada, these will disappear at $45/b and overall non OPEC output will decline at those oil prices. Output increases from OPEC (aside from Iran) are also unlikely at $45/b.
It will be interesting to see how this plays out and thanks for sharing your views.
Clearly you follow this very closely, I am just less optimistic about long term C+C output at $45/b than you are. I think EIA, IEA, and OPEC forecasts also tend to be a little on the optimistic side. 🙂
Dennis,
At $40-50, non-OPEC conventional capex will be significantly reduced, but not to zero levels. Most of investments in new conventional projects will be postponed, but this will affect production 4-10 years from now.
Maintenance capex and brownfield developments (such as infill drilling) will be maintained. There is also a lot of new field start-ups scheduled for 2016-18, which will not be postponed (a good example is GoM). Note, that most conventional producers have strong balance sheets and can afford overspending their cashflows for 2 or 3 years. We have already seen that low oil prices had no effect on non-OPEC ex-US output in 2015. The effect will be minimal in 2016 and will only gradually increase from 2017. But continued growth in demand will help to rebalance the market, and prices will start to recover from the second half of this year. I think the recovery will be much slower than in 2009-11, so the EIA’s forecast of $50 average in 2017 looks reasonable, although a bit conservative.
Thanks for sharing your well-informed, well-balanced views Alex, much appreciated.
AlexS,
I think we may be surprised where the reductions in production come from in 2016. The capital that was deployed in the last 6 years certainly will lead to some minor spikes in production as those projects come on line.
Below are just two potential places where even $45 oil will not arrest these declines.
LONDON, Oct 13 (Reuters) – Global offshore oil production in ageing fields will fall by 10 percent next year as producers abandon field upgrades at the fastest rate in 30 years, in the first clear sign of output cuts outside the U.S. shale industry, exclusive data shows.
There have been few signs of how cost cuts of around $180 billion will impact near-term production until now.
In three major offshore basins — the Gulf of Mexico, Southeast Asia and Brazil — infill drilling dropped by 60 percent between January and July this year compared with the same period last year, according to the Rystad Oil Market Trend Report, whose data is based on company data and regulatory filings.
The drop dramatically exceeds previous downturns in infill drilling going back to 1986, the data shows.
http://uk.reuters.com/article/2015/10/13/oil-declines-idUKL8N12916120151013
http://www.telegraph.co.uk/finance/economics/12100609/Glimmers-of-hope-for-oil-as-Russia-poised-to-slash-output.html
On the demand side China is a shinning star even as their economy slows down. The used car market is now allowing many of the 900 Million people working in China to obtain an automobile much earlier. This trend is accelerating and will for some time. The lower middle class will soon own a used auto. In addition, their new car sales continue to grow at a slower rate as more individuals participate in China’s move to a more internal consumption based economy.
http://news.yahoo.com/china-2015-auto-sales-growth-hits-three-low-104950517.html
http://blogs.ft.com/beyond-brics/2015/06/30/chinas-new-car-market-goes-ex-growth-as-used-car-sales-take-off/
China is alive and well and will continue to grow as long as their society continues to save money, educates their children and works hard. It took the US a long time to lose this philosophy about savings, education and hard work. China outworks, out saves and out educates our country. There really are winners and losers in China. They keep score in education, business and sporting events for their children. China teaches their children to win, not just participate.
It seems like the market-share competition between Iran on the one hand, and the fanatical nuts currently running Saudi Arabia on the other hand, prevent any form of OPEC coordination.
I now suspect that Saudi Arabia will pump flat out until the “idiot son” who started the Yemen War is ousted in a palace coup. I do not dare to predict when that will happen.
Debt Man Drilling – having to produce enough oil to service their debt, which pushes prices lower, or stop producing and go out of business. He ultimately sees oil prices staying low until we see bankruptcies and massive liquidations in the energy space, forcing production offline. Subscription to Listen.
http://www.financialsense.com/financial-sense-newshour/james-bianco/oil-prices-low-bankruptcy
Just read that Gulf stock exchanges crashed today, in first day of trading since last Thursday. Hit multi-year lows.
Texas RRC data for November are out. As Ron will probably elaborate more on this, I just wanted to show in below chart the great predictive power of the year over year change rate. It predicted the massive rise of condensate production in 2014 already in 2010/2011. The recent steep year over year decline of close to -30% predicts in my view a further steep decline in the year ahead.
Thanks Heinrich, I had no idea it was out. I checked it late yesterday and saw nothing. I will have something out late today or early tomorrow.
Ron,
I always look forward to reading your interesting posts.
Does anybody know what percentage of total world oil production is coming out of deep water ?
Out of shallow water?
With a ten percent projected decline rate for the coming year due to lack of investment , this could mean a big drop in total daily production next year.
OFM,
7 million barrels is deepwater and around 20 million barrels is shallow water.
Oil price woes deepen as Iran vows to add 500,000 barrels a day
Does anybody here believe that Iran can just open a few taps and instantly produce 500,000 additional barrels/day? Or are they just going to shift existing exports to another part of the word? Or is the whole thing just talk?
All of the above, but if the market is fully supplied presently, then where would it go — or more to the point, who would place orders for it if they already have enough, which is the same question in play for pre Iran post say March 2015. Who places orders for oil they intend to store — and if they intend to store it then that is a motivational demand in and of itself and does not constitute oversupply.
tra la tra la
Looked at Whiting’s Third quarter, 2015 press release. Fourth quarter guidance midpoints were:
OPEX. $8.25
G & A $3
Interest Expense $6.10
Using guided crude and gas differentials results in realized per BOE at 1/15/16 close of trading at $19.64. Plugging in guided production taxes results in same being $1.71 per BOE.
This means, pre hedges, WLL would be clearing .58 per BOE, including debt interest. The do have 3 way collars on 38% of current oil production, which as of 1/15/16 brings that up to almost $8 per BOE that they are clearing. Of course, none of this includes CAPEX, which drowns out everything.
Very fortunate to have hedged, but they are three way collars, so as the oil price continues to sink, so do the value of the hedges.
OAS did straight SWAPS. They will realize higher prices.
I think CLR is merely being held up due to low float as HH owns 68% of outstanding stock. I estimate they are receiving about $18.50 per BOE effective 1/1/15.
These three account for over 400K BOEPD. They are only able to pay bills as long as the banks let them. As they are still drilling and completing wells, they are still burning lots of cash.
ZH on a roll. Big article that goes like this . . . . oil sellers funded sovereign wealth funds. Big numbers 800+ billion for norway.
When those SWFs grow, they gotta put the money somewhere and drive up stock markets. When oil revs are too low to fund govt spending, they gotta sell those stocks to raise cash to spend. It’s like reverse QE.
http://www.wsj.com/articles/the-trouble-with-sovereign-wealth-funds-1450836278
http://www.swfinstitute.org/fund-rankings/
Can’t say I’ve ever noticed Mr Cramer Booyah such instruments
Do US States also issue such financial WMD’s ?
Goat me some Dakota fund for my 401K right now.
Ron
thankyou for your work!
Petro – a couple of questions if I may?:
if we assume “typical” shale decline curves, and a (now) lack of willingness of banks to lend to oil co’s
1. how long can prices remain depressed (ie how far out do the swaps / financial instruments go)
2. I understand ETN’s and reverse futures spread (Andy Horne business model), someone has to carry the can for the debt that has been issued against forward production of quite a few of the shale players…..ideas as to whom ?
3. I note you said “prices to spike” ……can I assume you believe this is “after” any debt for equity swaps ?
4. finally – is it “possible” for some/any/all of these energy derivatives to be closed out quickly ?
thankyou, and regards (from sunny Oz)
simon
Sandridge Energy is a little less than $0.06 per share today, down more than 99.9 percent. It just don’t look too good. What could go wrong?
Conversation between General Custer and Jack Crabb in the movie ‘Little Big Man’ just before General Custer launched his attack at the Little Big Horn (of course, it is all in the movies):
Jack Crabb: General, you go down there.
General Custer: You’re advising me to go into the Coulee?
Jack Crabb: Yes sir.
General Custer: There are no Indians there, I suppose.
Jack Crabb: I didn’t say that. There are thousands of Indians down there. And when they get done with you, there won’t be nothing left but a greasy spot. This ain’t the Washite River, General, and them ain’t helpless women and children waiting for you. They’re Cheyenne brave, and Sioux. You go down there, General, if you’ve got the nerve.
General Custer: Still trying to outsmart me, aren’t you, mule-skinner. You want me to think that you don’t want me to go down there, but the subtle truth is you really *don’t* want me to go down there!
http://www.imdb.com/title/tt0065988/quotes