This is a guest post by Rune Likvern. His web site is:
FRACTIONAL FLOW
Growth in Global Total Debt sustained a High Oil Price and delayed the Bakken “Red Queen”
The saying is that hindsight (always) provides 20/20 vision.
In this post I present a retrospective look at my prediction from 2012 published on The Oil Drum (The “Red Queen” series) where I predicted that Light Tight Oil (LTO) extraction from Bakken in North Dakota would not move much above 0.7 Mb/d.
- Profitable drilling in Bakken for LTO extraction has been, is and will continue to be dependent on an oil price above a certain threshold, now about $68/Bbl at the wellhead (or around $80/Bbl [WTI]) on a point forward basis.
(The profitability threshold depends on the individual well’s productivity and companies’ return requirements.) - Complete analysis of developments to LTO extraction should encompass the resilience of the oil companies’ balance sheets and their return requirements.
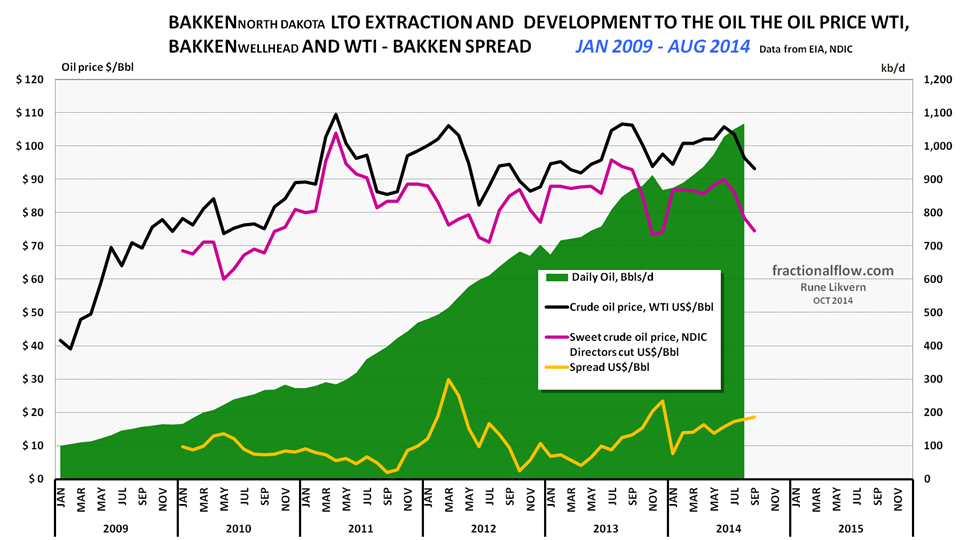
Figure 01: The chart above shows development in Light Tight Oil (LTO) extraction from January 2009 and as of August 2014 in Bakken North Dakota [green area, right hand scale]. The top black line is the price of Western Texas Intermediate (WTI), red middle line the Bakken LTO price (sweet) as published by the Director for NDIC and bottom orange line the spread between WTI and Bakken LTO wellhead all left hand scale. The spread between WTI and Bakken wellhead has widened in the recent months.
What makes extraction from source rock in Bakken attractive (as in profitable) is/was the high oil price and cheap debt (low interest rates). The Bakken formation has been known for decades and fracking is not a new technology, though it has seen and is likely to see lots of improvements.
LTO extraction in Bakken (and in other plays like Eagle Ford) happened due to a higher oil price as it involves the deployment of expensive technologies which again is at the mercy of:
- Consumers affordability, that is their ability to continue to pay for more expensive oil
- Changes in global total debt levels (credit expansion), like the recent years rapid credit expansion in emerging economies, primarily China.
- Central banks’ policies, like the recent years’ expansions of their balance sheets and low interest rate policies
- Credit/debt is a vehicle for consumers to pay (create demand) for a product/service
- Credit/debt is also used by companies to generate supplies to meet changes to demand
- What companies in reality do is to use expectations of future cash flows (from consumers’ abilities to take on more debt) as collateral to themselves go deeper into debt.
- Credit/debt, thus works both sides of the supply/demand equation
- How OPEC shapes their policies as responses to declines in the oil price
Will OPEC establish and defend a price floor for the oil price?
I have recently and repeatedly pointed out;
- Any forecasts of oil (and gas) demand/supplies and oil price trajectories are NOT very helpful if they do not incorporate forecasts for changes to total global credit/debt, interest rates and developments to consumers’/societies’ affordability.
Oil is a global commodity which price is determined in the global marketplace.
Added liquidity and low interest rates provided by the world’s dominant central bank, the Fed, has also played some role in the developments in LTO extraction from the Bakken formation in North America.
As numerous people repeatedly have said; “Never bet against the Fed!” to which I will add “…and China’s determination to expand credit”.
Let me be clear, I do not believe that the Fed’s policies have been aimed at supporting developments in Bakken (or other petroleum developments) this is in my opinion unintended consequences.
In Bakken two factors helped grow and sustain a high number of well additions (well manufacturing);
- A high(er) oil price
- Growing use of cheap external funding (primarily debt)
In the summer of 2012 I found it hard to comprehend what would sustain the oil price above $80/Bbl (WTI).
The mechanisms that supported the high oil price was well understood, what lacked was documentation from authoritative sources about the scale of the continued accommodative policies from major central banks’ (balance sheet expansions [QE] and low interest rate policies) and as important; global total credit expansion, which in recent years was driven by China and other emerging economies.
I have described more about this in my post World Crude Oil Production and the Oil Price.
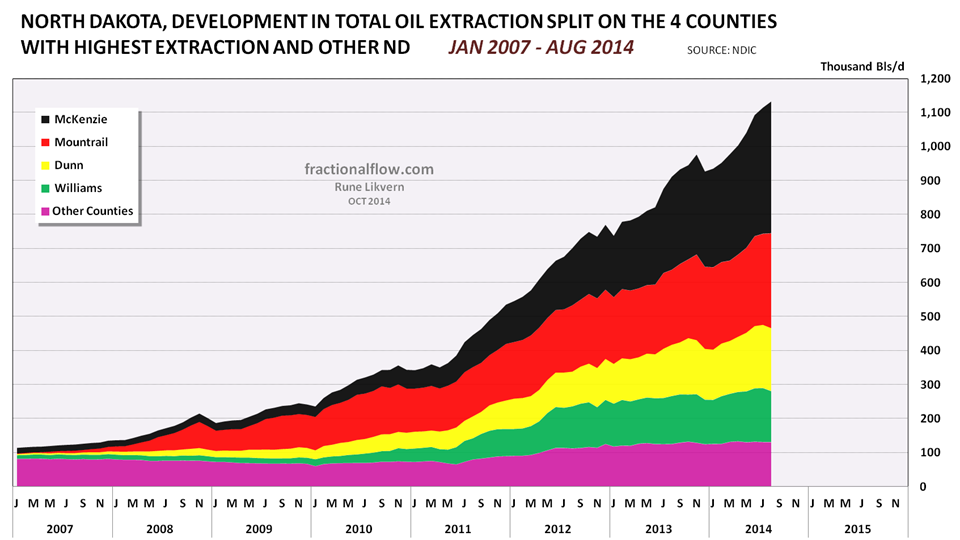
Figure 02: The chart above with the stacked areas shows developments in all oil extraction in North Dakota as of January 2007 and of August 2014 split on the 4 counties with the highest extraction and the rest of North Dakota. Growth in oil extraction in North Dakota is now primarily from McKenzie and Mountrail counties.
Summer of 2012
With oil prices at the wellhead in Bakken at $70/Bbl in the summer of 2012, the companies netted back around $45/Bbl.
In the summer of 2012 monthly LTO extraction was on its way towards 19 million barrels (Mb).
The total monthly net cash flow from the LTO extraction generated thus about $850M ($45/Bbl X 19 Mb) which could fund monthly additions of 85 – 95 wells (if the companies’ cash flows unabridged was used for well manufacturing).
This level of well manufacturing was estimated to sustain an LTO extraction level of 0.7 Mb/d in Bakken(ND).
The companies had, by then and based on a low end estimate, added a total of $14 Billion in external funding, primarily debt, refer also figure 03.
Summer of 2014
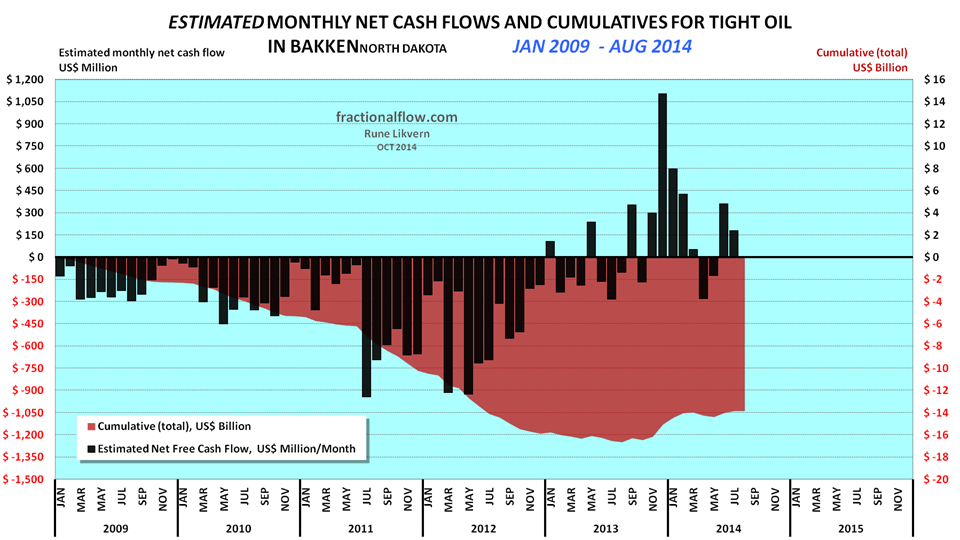
Figure 03: The chart above shows an estimate of cumulative net cash flows post CAPEX in manufacturing of LTO wells in Bakken (ND) as of January 2009 and as of August 2014 (red area and rh scale) and estimated monthly net cash flows post CAPEX (black columns and lh scale).
The assumptions for the chart are WTI oil price (realized price which is netted back to the wellhead), average well costs starting at $8 Million in January 2009 and growing to $10 Million as of January 2011 and $9 Million as of January 2013. All costs assumed to incur as the wells were reported starting to flow (this creates some backlog for cumulative costs as these are incurred continuously during the manufacturing of the wells) and the estimates do not include costs for non- flowing and dry wells, water disposal wells, exploration wells, seismic surveys, acreage acquisitions etc.
Economic assumptions; royalties of 16%, production tax of 5%, an extraction tax of 6.5%, OPEX at $4/Bbl, transport (from wellhead to refinery) $12/Bbl and interest of 5% on debt (before any corporate tax effects).
Estimates do not include the effects of hedging, dividend payouts, retained earnings and income from natural gas/NGPL sales (which now and on average grosses around $3/Bbl).
Estimates do not include investments in processing/transport facilities and externalities like road upkeep, etc. The purpose with the estimates presented in the chart is to present an approximation of net cash flows and development of total use of primarily debt for manufacturing of LTO wells.
The chart serves as an indicator of the cash flow for the aggregate of oil companies in Bakken.
Since the fall of 2012 and until the summer of 2014 oil prices at the wellhead in Bakken oscillated around $90/Bbl (ref also figures 01 and 04) which netted back around $60/Bbl to the companies.
This makes a material difference to the companies’ net cash flows from LTO extraction and they also added an estimated $2 Billion (low end estimate) in debt since the summer of 2012. The companies had thus considerably improved their abilities to fund growth for and sustain a high level of (monthly) well additions which provided for growth in LTO extraction.
In the summer of 2014 monthly LTO extraction was on its way towards 32 Mb.
The total monthly net cash flow from the LTO extraction generated thus about $1,900M ($60/Bbl X 32 Mb) which unabridged could fund monthly additions of 190 – 210 wells (no dividends paid out and/or down payments of debt). This is close to the number of monthly well additions reported by NDIC since the harsh winter loosened its grip.
Note in figures 03 and 04 how the (low end) estimates for total debt has more or less remained flat since last winter.
Now (fall 2014)
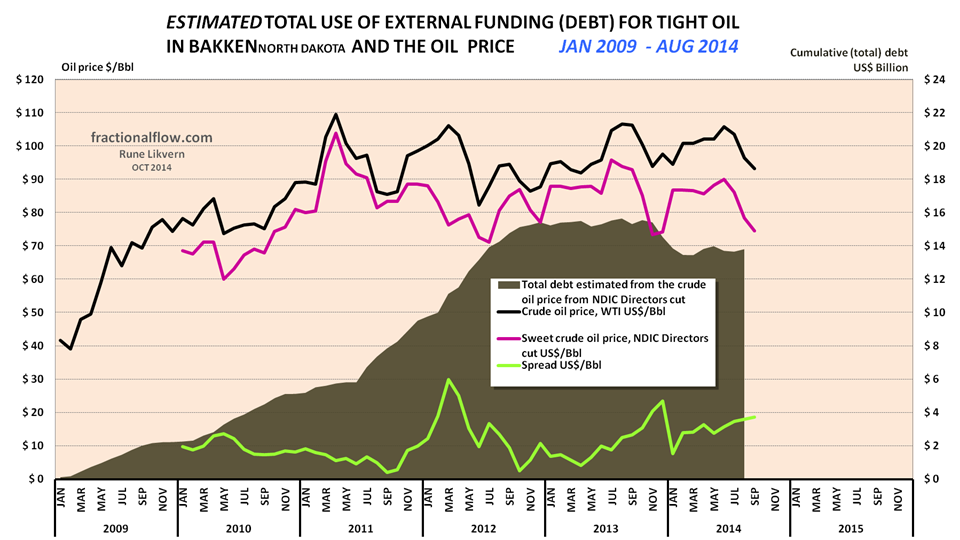
Figure 04: The chart above follows the same methodology as presented in figure 03 for estimates of changes to total debt (dark green area and right hand scale) with the difference that the wellhead price published by NDIC in their monthly reports has been applied.
In the chart is also shown the developments in the oil price WTI (black line), at the wellhead (dark red line) and the spread between WTI and the wellhead price (light green line), all left hand scale.
Since last summer world oil prices have come significantly down and I hold it likely they will remain low or decline some more if not OPEC curtails its supplies. As of writing the wellhead price in Bakken is $63/Bbl(sweet and as of Oct. 30th) and the “average” point forward breakeven is estimated at $68/Bbl (at a 7% discount rate and at the wellhead).
The effect of the low oil price causes a noticeable reduction in companies’ total netted cash flows which now is estimated below $1,400M/month.
This ($63/Bbl at the wellhead) cash flow could unabridged fund 140 – 155 wells/month.
However the world does not work as straight forward as this.
Companies in Bakken had levered up (used debt) likely under the expectations that oil prices would remain high(er). It was the expectations of sustained high cash flows that (primarily) was/is used as collateral to assume more debt. Various covenants may dictate the companies to continue to manufacture wells. A higher leverage (from declining cash flows) results in relative higher debt carrying costs.
A lower oil price shrinks the debt potential on their balance sheets and some will deleverage (reduce their total debt) as a response to the lower oil price.
Their sources of income to reduce their debt; a portion of their cash flows from their operations and/or sales of assets.
The dividend policies vary amongst public companies and oil companies have been facing mounting pressures from impatient investors who looks for yield.
For public companies, there has been an additional powerful factor at play after the Fed started QEing, key phrase: Companies’ Market Capitalisation, refer also figure 10.
Investors in companies involved in LTO extraction had no reason to complain as there was growth in LTO extraction and QE “buoyed everything” with little relation to the actual underlying fundamentals.
My model (also presented in the “Red Queen” series at The Oil Drum) estimates it now takes around 130 net well additions/month in Bakken (ND) to sustain present LTO extraction levels. This could be funded with a wellhead price around $60/Bbl, if the companies’ net cash flows unabridged were spent towards well manufacturing.
However the financial capacities of the companies becomes impaired from a sustained lower oil price and these will start deleveraging, thus reducing their capital expenditures which, and with a time lag, entail a down scaling of their well manufacturing.
This change in strategy is often presented under the euphuism of “targeting financial performance”.
If monthly net well additions drop below the “Red Queen” number (now estimated at 130 – 135 wells/month), Bakken(ND) LTO extraction is likely to decline.
A sustained lower oil price, thus:
- Impairs the companies’ abilities for well manufacturing (reduces funding from cash flows)
- Drives the need for deleveraging (which reduces the funds which otherwise could be allocated towards well manufacturing)
- May give priorities to complete wells that are drilled, but not completed as there exists a big inventory of wells drilled and not completed and funding for the completions comes from the cash flows. These wells represent “cheap” flow additions.
The LTO Break Even Price
Another parameter which is important to keep an eye on is the development to the break even price that meets the companies’ return expectations. The wells come with individual designs (costs), flow rates and EURs and the break even price is subject to a range of return requirements [my presented numbers are discounted at 7%].
I have used actual well data from North Dakota Industrial Commission (NDIC) to make estimates of what I will continue to refer to as the “reference/average well”, refer also figure 07.
Since I started following the Bakken LTO developments this “reference/average well”, and notably since 2013, has experienced some improvements to its total first 12 months cumulative LTO extraction (refer also figure 07) and the judges are still out there if the deployment of improved (and likely more expensive) technologies allows for some faster extraction and/or increased total extraction (higher EURs).
Changes in the oil price are the dominant source for changes to the financial returns of the wells.
Those who does not worry about returns (that is a discount rate at 0% of full life cycle costs) would now achieve this with around $50/Bbl at the wellhead.
Who are willing to put their money at risk for a 0% return? (Putting the money in the mattress gives the same return.)
A sustained oil price below $70/Bbl (at the wellhead) is, with a time lag, likely to slow drilling activities as this is the profitability threshold for the “average” well. Should the oil price (at the wellhead) remain below $70/Bbl the oil companies will focus on drilling those wells expected to meet their return requirements. If wells meet their expectations is not known before after it has flowed for several months.
One early indicator for changes in activity levels is to follow the development of the number of rigs drilling.
Well productivity Developments
Longer laterals, more use of proppants, more fracking stages, has with time lead to documented improvements in well productivity (here defined as total LTO extracted during the first 12 months of flow) for the “average” well in the Bakken formation in North Dakota, refer also figure 07.
More advanced wells may, however, mask the possibility of extraction growth from areas with poorer geology.
Developments as of Aug 2014
Three of the charts below have expertly been produced and provided by Enno Peters, who agreed to let me use them in this post.

Figure 05: The stacked areas in the chart above show developments in LTO extraction of the population of wells by vintage.
Chart by Enno Peters.
The strong growth in LTO extraction happened while the wellhead price in Bakken was above $70/Bbl, refer also figure 01.
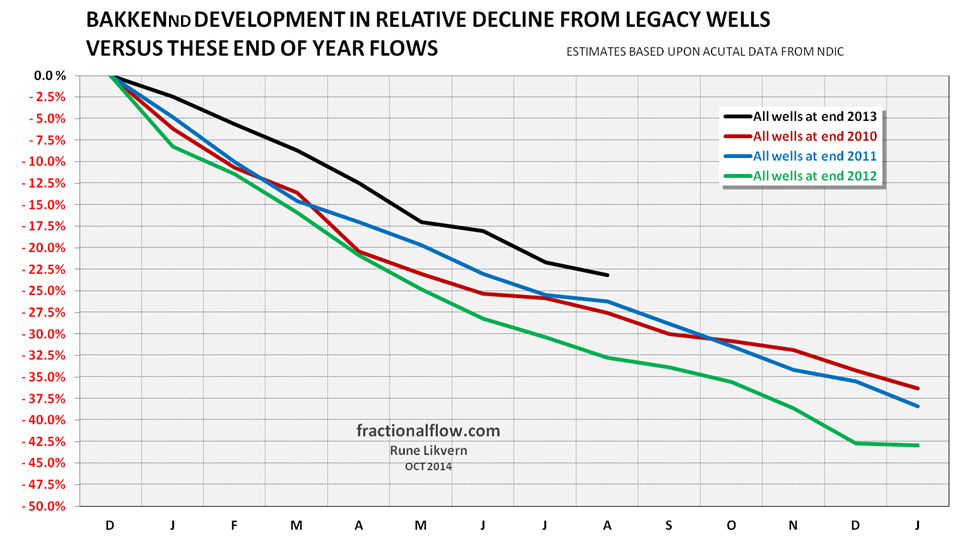
Figure 06: The chart above, based upon the NDIC data for figure 05, shows how LTO extraction in Bakken declines by vintage [end of year].
If no wells were added the total LTO extraction from Bakken would decline somewhere between 30 – 40% after 12 months. On August 2014 LTO extraction was approaching 1.1 Mb/d, which would result in a decline of 0.3 – 0.4 Mb/d after 12 months if no more wells were added.
This illustrates that LTO as a source of sustained oil supplies requires to stay on the drilling treadmill. The LTO extraction level is sensitive to the oil price, the companies’ return requirements and the strength of their balance sheets.
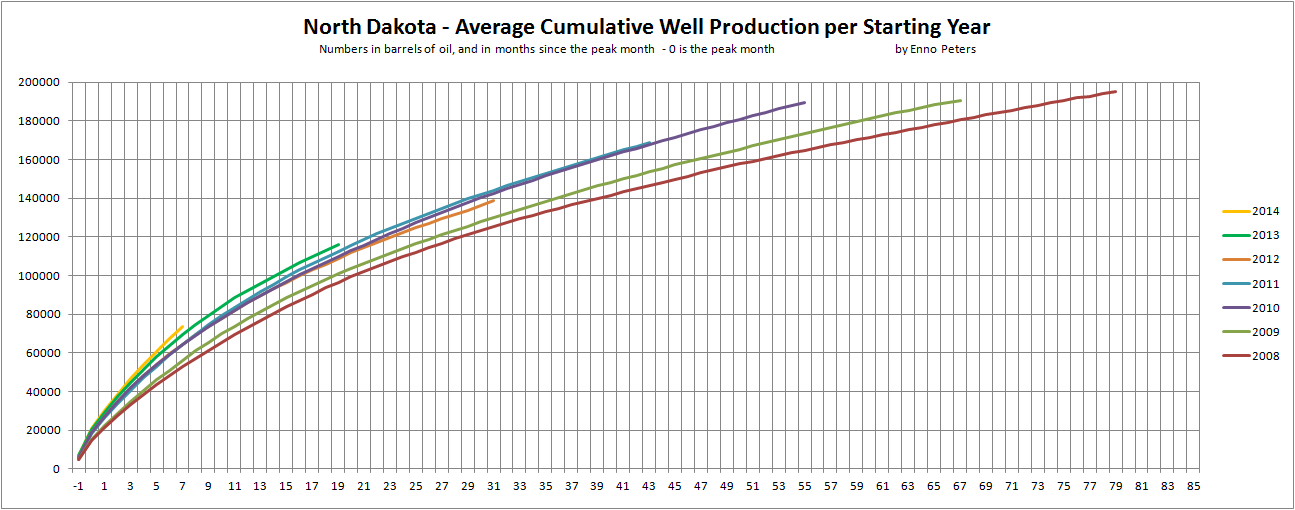
Figure 07: The chart above shows how cumulative LTO extraction for the “average” well by vintage [calendar year] develops with time.
Chart by Enno Peters.
Total LTO flow during the first months in 2013 and so far in 2014 has been higher than in the years 2010 – 2012. What remains to be seen is if this over some time results in increased total recovered oil or if the most recent and advanced wells extracts the oil faster. Note how the cumulative for the early wells from 2013 now converges towards those of the previous years.
Total Extracted Liquids from Bakken Wells has grown with time, led by Produced Water

Figure 08: The chart above shows development in the water to oil ratio for the “average” wells by vintage [calendar year] in Bakken. Produced water (brine) is separated and transported to dedicated disposal sites.
Chart by Enno Peters.
A noticeable trend from the chart above is that produced water to oil ratio has increased with time (total liquids [oil + produced water]).
Some Supplementary Information
To me what we are now witnessing is the most telegraphed correction in history. The end of Fed’s QE and higher Fed’s fund rates in the near future.
I will briefly present two macroeconomic sizes that helped sustain a high oil price.
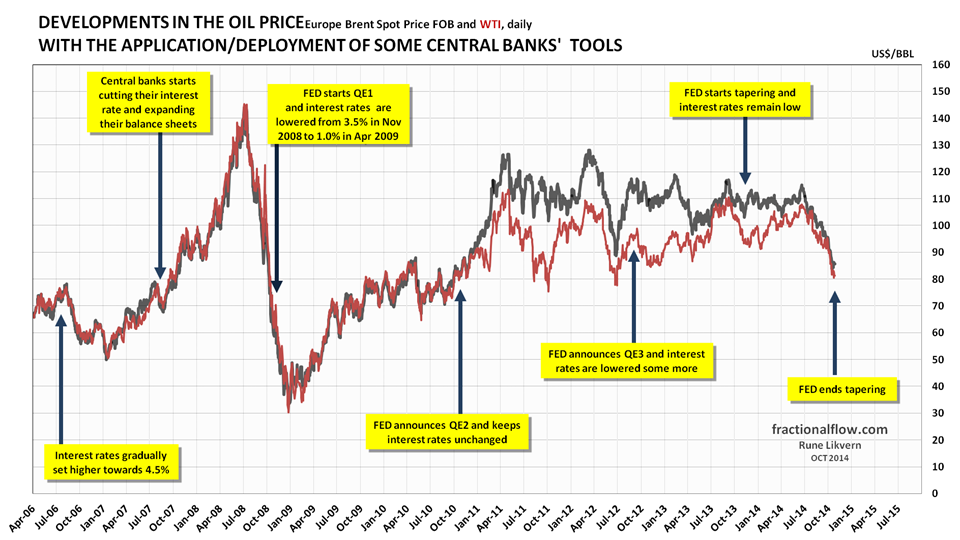
Figure 09: The chart above shows the developments in the oil price [Brent spot; black line and WTI; red line] and the time of the Fed’s announcements/deployments of available tools to support the global financial markets which the economy heavily relies upon. The financial system is virtual and thus highly responsive.
The chart suggests causation between Fed policies and movements to the oil price.
Some of the money from QE found their way as loans to emerging economies to fund economic growth and thus also supported oil demand and the oil price.
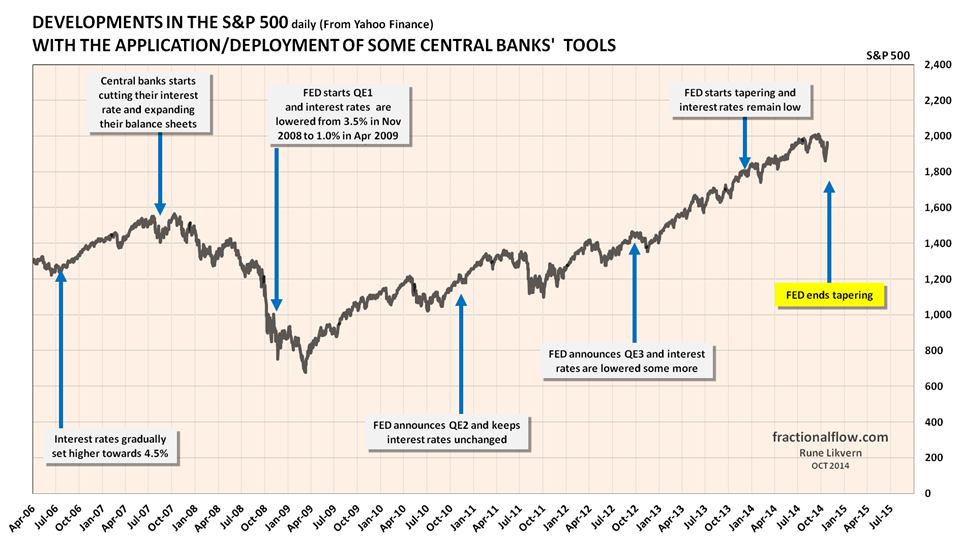
Figure 10: The chart above shows the developments in the stock index, S&P 500, and the time of the Fed’s announcements/deployments of available tools to support the global financial markets which the economy heavily relies upon.
The chart suggests causation between Fed policies and movements in the stock index.
Several of the listed companies active in LTO extraction are included in the S&P 500 index, thus these were given an uplift from the general bull market and investors in LTO saw their share prices rise.
The common features of figures 09 and 10 are that they show possible causations from Fed’s policies. Added liquidity and low interest rates also supported the oil price and the stock market.
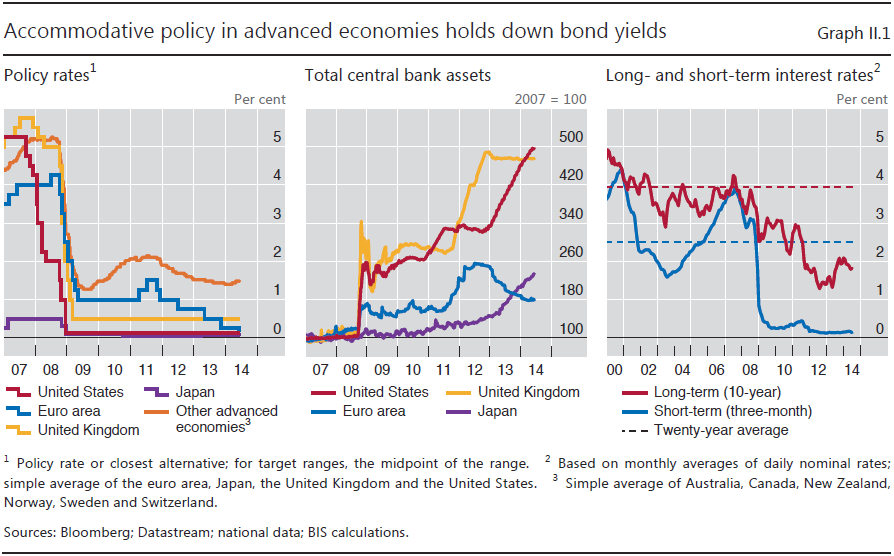
Figure 11: The chart above shows [left panel] how advanced economies’ central banks in concerted efforts lowered their interest rates following the Global Financial Crisis (GFC) in 2008.
The middle panel shows the relative growth (expansion) of the balance sheets (assets) for US Federal Reserve (Fed), European Central Bank (ECB), Bank of England (BoE) and Bank of Japan (BoJ) post the GFC. Note the growth of the Fed’s balance sheet since 2012 (middle panel).
The right hand panel shows the development in long and short term interest rates together with the twenty year average.
Chart from p 24 in BIS 84th Annual Report, 29 June 2014.
The middle panel in figure 11 which has been lifted from BIS 84th Annual Report.
So what about China?
Oil is a global commodity. China has in recent years had strong economic growth, which has been facilitated by a rapid credit expansion. This has allowed China to steadily grow its oil imports and consumption (refer also figure 14), which thus supported growth in global oil demand and a higher oil price.

Figure 12: Chart above shows Chinese leverage, changes in total debt to GDP. Note the growth of this metric since 2011.
Figure 12 has been lifted from p 70 of the Geneva 16th report “Deleveraging? What Deleveraging?” made public 29 September 2014.
Note the rapid growth in Chinese debt post 2008 in figure 12 and note the growth in Chinese petroleum consumption and imports since 2008 in figure 14. China continued good economic growth post the GFC by aggressive credit expansion.
According to data from the Bank for International Settlements (BIS in Basel, Switzerland) China saw its annual growth rate in private, non financial sector debt accelerating from around 10 Trillion Yuan as of Q4 2010 to 18 Trillion Yuan (about US$3 Trillion) as of Q1 2014. (100 Yuan approximates USD 16)
The Shift in Oil Consumption

Figure 13: Chart above (areas are not stacked) shows developments in OECD total petroleum consumption (grey area), production (green area) and net imports (red area) since 1965 and as of 2013 [rh scale] together with the oil price [Brent, black dots and lh scale].
The chart shows that the higher oil price stimulated for more supplies within OECD (dominated by LTO extraction), and at the same time the high oil price and the effects of total debt loads reduced consumption.
- The oil price has in recent weeks significantly weakened and if a higher demand/consumption within OECD fails to materialize from this weakness, this strongly suggests influences from other structural forces.

Figure 14: The chart above (areas are not stacked) shows developments in China’s total petroleum consumption (grey area), production (green area), net exports (blue area) and net imports (red area) since 1965 and as of 2013 [rh scale] together with the oil price [Brent, black dots and lh scale].
Post the GFC it was primarily credit expansion in China (refer also figure 12) that saw to it that global oil demand continued to grow in the face of a higher price. China is also filling their strategic petroleum reserve.
Summary
The spectacular growth in LTO extraction in Bakken in the recent years happened because of a sustained high(er) oil price and the use of more cheap debt for funding. Now it appears this development nears a crossroads.
LTO developments are flexible and allow for rapid adaptation to changes in the oil price and each well represents limited capital requirements, as opposed to large capital intensive oil developments that takes years to bring on line.
It normally takes 4 to 6 months from a LTO well is spudded until it starts to flow.
The prices at the wellhead in North Dakota is now around $63/Bbl (sweet) and should oil prices remain low (or go lower), the future developments of LTO extraction in Bakken will move into the twilight zones between profitability (return requirements), reduced capital expenditures (from declines in cash flows which shrinks the companies’ debt capacities), deleveraging, dividend policies and OPEC policies.
It is from this twilight zone the Bakken “Red Queen”, for some time outrun by the high oil price, cheap debt funding, growth in global total debt and low interest rates will emerge and catch up.
From here it will be most interesting to follow the continued race between Bakken LTO extraction and its “Red Queen”.
347 responses to “Debt, Oil Price and the Bakken “Red Queen””
Hi All,
I am not quite sure what I am doing incorrectly, but I get lower breakeven costs. Note that 5% interest on 14 billion in debt amounts to about $2/b in interest costs at a ND Bakken output level of 1 million b/d which is 365 Mb per year. If we take 5% of 14 B that is 700 million in interest per year using simple interest rates.
My breakeven cost for the current average Bakken well (see chart below) with oil prices assumed to rise over time from breakeven to $119/b in 23.5 years (life of the average well abandoned at 200 b/month output), transport cost=$12/b, OPEX=$5.5/b, other costs=$3.5/b, royalties and taxes=27.5% of wellhead revenue, and a real discount rate of 7% is $57/b at the wellhead and $69/b at the refinery gate.
If anyone is interested in finding my errors a spreadsheet with the breakeven calculations for the average north Dakota well can be found at the following link.
https://drive.google.com/file/d/0B4nArV09d398b2tILXkwUTBwWWc/view?usp=sharing
I am trying to reconcile the difference between Mr.Likvern’s breakeven of $68/b at the wellhead and my result of $57/b at the wellhead, I believe that his average well (from previous analyses that I have read) is more productive than what I use, this would tend to make his breakeven price lower than what I would get with a new well EUR of 320 kb.
“My breakeven cost for the current average Bakken well (see chart below) with oil prices assumed to rise over time from breakeven to $119/b in 23.5 years….”
What exactly does the above imply?
Should it be understood as the oil price starts at some level and over time grows to some specified level?
Hi Rune,
Yes the price starts now at the breakeven price and rises over time at an annual rate of 2.43% (o.2% per month) for 23.5 years (which is the life of the well).
If we assume the price is fixed over the life of the well (oil prices remain constant for 23.5 years) the wellhead breakeven price is $66/b, which matches your result fairly well.
Note that the EIA estimates that real oil prices will rise to $140/b in 2012$ in their reference scenario and they have tended to underestimate future oil prices.
Your method is likely the standard way that this is done, but assuming that real oil prices will remain $78/barrel for 23 years seems unrealistic so I assume they will rise over time by 2.4% per year on average, this would result in a real oil price of $130/b in 2040 if we start at $69/b in November 2014. Note that $69/b is the refinery gate breakeven price, using this method with oil prices rising over time.
For those that think real oil prices cannot rise above $120/b, I can keep real oil prices under $120/b until 2040 by reducing oil price inflation to 0.15% per month, the breakeven price (refinery gate) rises to $71/b ($59/b at the wellhead) and real oil prices are $114/b (2014$) in 2040.
Dennis,
So you have a break even price that grows with time. …..interesting, never seen that before.
There is no way to confidentially project the future oil price without accounting for global total debts, interest rates, households developments in affordability etc.
How many foresaw the recent steep decline in the oil price?….and what was their reasoning for it?
Hi Rune,
I did not expect prices to fall, I believe that you did and you were correct.
I absolutely agree that the future path of oil prices is unknown.
Note that the choice of no change in price is also an assumption, which may be proven incorrect. Do you think if oil prices fall to say $69/b that the most likely future path of oil prices is for them to remain at $69/b? If so, I guess I am just more optimistic, the assumption of an average 2%/ year rise in oil prices from $71/b to $102/b in 20 years time (2034) strikes me as pretty conservative.
Off course I am correct!
The break even price is what is required to meet certain financial assumptions. It does not foretell anything about future developments, but should be considered as a required weighted price over the economic lifetime.
Anyone trying to guess the oil price 20 years from now is in for a lot of disappointments.
Hi Rune,
I meant that you had predicted that prices would fall and you were correct on that call. You are also correct on the breakeven price, so you are correct on two counts.
You do see that the financial assumptions are simply different. The correct breakeven price assumes that real oil prices will remain at the breakeven price for the life of the well. If we make the financial assumption that the WTI oil price will remain at say $80/b in 2014$ for 20 years, and further assume that the world economy will not collapse when liquid energy output (C+C+NGL+biofuels in Mtoe) declines, then an assumption of $80/b for 20 years is as likely to prove false as an assumption of oil prices rising at 1.8% per year on average for 20 years.
Time always answers these questions.
Your main point, that oil prices are unpredictable is undoubtedly correct, it is also possible that oil prices will fall further to $70/b (or lower) and remain there indefinitely. If that happens, then the peak in liquids fuel output may be behind us.
Hi Rune,
On further thought, a single price makes the most sense, for the simple reason you gave, we do not know future prices. The breakeven price is supposed to be very conservative by its nature.
It asks the question, what constant oil price level under current cost conditions and at a given discount rate will result in the NPV of future net revenue being equal to the cost of the well?
For a $9 million well with OPEX of $6/b, other costs of $3.5/b, transport costs of $12/b, royalties and taxes of 27.5% of wellhead revenue, and a real discount rate of 7%, the answer for the average Bakken well (at and EUR of 320 kb) is $66.50 at the wellhead and $78.5 at the refinery gate, fairly close to your estimate of $68/b.
BTW sports fans, have a look at Rune’s China consumption. 11 mbpd looks likely for 2014, yes? Isn’t that exciting?
Hi Watcher,
The Chinese economy is growing rapidly, the OECD is growing anemically by comparison, one would expect that economies that are growing more rapidly will increase their oil consumption more rapidly as well.
Yes,
but also look at China’s credit expansion. Could there be a relation?
Hi Rune,
China has a tendency to oversave (by western standards), the credit expansion may just be China modernizing, as long as buying on credit is not overdone and payments can be managed, this tends to expand the economy, clearly this can be overdone. In times of recession, it makes sense for governments to run deficits, when the economy returns to health the debt can be repaid, western economies have been doing this for quite a while.
I think the debt problem is not as bad as some think.
See
http://www.economist.com/news/leaders/21625785-its-debt-will-not-drag-down-world-economy-it-risks-zombifying-countrys-financial
China has a low public debt.
There are lots of good analysis about China’s credit expansion and common for them is the total debt load is now of concern ref also reports from BIS and Geneva 16th report.
It appears as the less one knows about China’s total debt and credit expansion the less worried people tend to be.
To me it appears as you Dennis is in the camp that believes that everything will be fine (let us consume more hopium) because there are only small fissures appearing that will be fixed.
And all will be fine…until it is not!
Hi Rune,
Usually the analysis by the Economist is pretty good, but they make mistakes. There are many respected economists that think the debt worries are overblown, but you can always find other economists who think the opposite.
The World was only able to escape the Great Depression by an expansion of credit to fund World War 2. A credit expansion in response to the Great Recession is the correct response as well.
If one prefers less economic growth then tight fiscal policy and tight monetary policy is the way forward. That way there will be less credit expansion, less real investment and more unemployment.
Oh I don’t care why China’s oil consumption is rising. I just notice that it is.
Often. By much. They should seek a per capita consumption equal to the US.
Then we’ll get the curtains up on this show.
Hi Watcher,
The Chinese will try to expand their oil consumption as much as they possibly can. The Chinese are less apt to be fooled by the idea that fossil fuels will never deplete.
They may pivot to nuclear, wind, and solar in a big way and in so doing will in the future leave the OECD in the dust (or at least those OECD countries like the US that refuse to prepare for the coming peak.) I hope I am wrong, but it will be great for the poor in China who may be lifted out of poverty. That is of course unless World War 3 starts because someone thinks the proper response to poor economic policy, is not to change your economic policy, but to use nuclear weapons to wipe out the competition.
People who think in those terms have not really considered carefully the notion of unintended consequences.
Yes, the consequence would be that there’s more oil to burn for the winners. The unintended consequence would be that the manufacturing China was doing will now have to return to America.
Hi Watcher,
Only in your world is that the likely outcome.
Very simple math here…if per capita oil consumption in China grew to that of America, China would consume every single drop of oil on Earth at current production rates. I think you are correct and China does not believe that it is even remotely possible to achieve this.
Hi CaveBio,
Clearly China’s per capita consumption cannot rise to US levels. They will try to increase consumption as much as possible until they transition to other forms of energy.
My guess is that they realize that coal resources are not unlimited and will begin to slow down the growth of coal fired power plants as well.
Hi.
Good analysis, and important to run.
Two things, the first of which is that the cost of capital as of Oct 2014 for energy companies was ~ 7% but it’s been moving up smartly of late. It could go back down or it might rocket higher. You might want to re-run the break-even under a variety of interest rate assumptions to check the sensitivity, as usually this is among the most sensitive of factors.
Second, I think the EUR needs to be fiddled with mainly on the basis of OXY seeking just $3b for 335,000 core Williston acres. Assuming just one well per 160 acre spacing, and an average of $20 in net profits per barrel (from your analysis and $77 oil) this measn OXY was seeking to sell $12.5 billion in potential profits for $3 billion.
Either I have to assume OXY is full of idiots (which it is not) or they know something about that acreage which does not square up an an EUR as high as is generally modeled and assumed.
Chris,
Hello and thanks!
I have run through a range of assumptions (well profiles and other variables), but one parameter has been, is and will continue to be dominant: THE OIL PRICE.
I went through the financial statements of several companies, and I take it that your reference of about 7% is typical for medium/smaller companies (may be even higher for smaller with low equity). Companies (big integrated) with good credit rating (AA or similar) I found had a weighted interest just shy of 5% (economics of scale).
I have checked for several interest rates, but there is one additional important issue, and that is when debts are due to be retired (debt redemption profile). I opted to use a conservative approach (for the public domain), assuming debts were retired as fast the revenues allowed and low interest rates.
Your point is valid and important.
We need to dig deeper into OXY’s numbers to understand their asking price. How much of that acreage is developed? What is the quality of remaining acreage? What is present production and how is this projected to develop?
There is no way to make a value assessment of the numbers you present.
OXY is in reality selling a projected future net cash flow profile.
The question to ask is not to focus on the price, but why are they selling their acreage. (There may of course be several reasons for this.)
Gentlemen, it seems I recall this Oxy sale included an estimated 80 million BOE of “developed” reserves, proven, I believe, with 16,000 BOEPD of existing production on the acreage being offered. For the record, at the time of the announcement of the sale WTI was still trading above 90 dollars. The very next day prices starting sliding.
In the Eagle Ford here in Texas I have seen much smaller trades made based on dollars per net acre, which I never quite understood. That price per acre could be anywhere from 10,000 to 40,000 dollars an acre, I guess based on the production that came with it and how sweet, or unsweet the area was.
At 90 dollar WTI there use to be an 85,000 – 100,000 dollar per net barrel of oil number floating around for buying shale oil production; I reckon that number has now gone adios.
It will be very interesting to see how a now very wobbly shale oil industry starts dumping assets; for how much and to whom.
Mike
Mike, Thanks!
80 MBOE of developed, proven reserves gives us a number and let us assume it is all LTO.
Further that LTO on average fetches $70/bbl at the wellhead, which after taxes, royalties, OPEX, financial costs nets back roughly $43/bbl.
That would have an undiscounted value of $3.4 Billion. Tight oil wells decline, so most of this production comes early and the discount effect will reduce the Net Present Value (NPV) and the higher the discount rate the more the undiscounted value “shrinks” (lowers the NPV).
Then add the value of undeveloped reserves +/- uncertainties to proven, developed, which may be hard as this is very much related to future developments in the oil price and how these reserves are developed over time.
Normally any remaining depreciation remains on the books of the Seller.
It is not about the stock, but the (cash) flow!
If the numbers for developed reserves (80 MBOE) and the asking price ($3 Billion) is close (based on media I presume), I would say the asking price is too high.
Has the company in question completed a transaction for its acreage?
Rune
Rune, here ya’ go: http://bakkenshale.com/tag/oxy/; I was close anyway. I would guess 80% of the estimate would be liquids.
No sale yet that I have heard. It won’t be me, I assure you.
Mike
Mike, I posted below before I had read the link you provided.
From NDIC data there is about 1 Mcf of gas per barrel of LTO. 1 Mcf approximates 0.17 BOE.
Based upon the numbers in the article linked to there is about 75 Mb with LTO and 12 MBOE with gas. Gas fetches around 5 – 7 % on a BOE basis. So sticking to 80 Mb with LTO gives a slight positive bias as well as using 6 Mb/a (It should be a and not d as presented) of LTO to the estimates I provided.
Sorry,
on a BOE basis gas fetches around 30 – 35 % of LTO.
ADDENDUM
As Mike kindly provided numbers on developed proven reserves of 80 MBOE (still assuming all of it, LTO) and a flow of 16,000 BOE/D which roughly is 6 MBOE/a.
The number tells something interesting as this translates into a Reserves over Production ratio (R/P) of about 13 -14 (which theoretically means that an extraction level of 6 MBOE/a could be sustained for 13 to 14 years (a rectangular profile). Further, it tells that the production has come some way down along its decline profile (getting long in its tooth).
In the real world, it does not work that way so what follows is a simplified estimate based upon a triangular production profile starting at 6 MBOE/d and declining to about 0 after 25 years. This should be a close approximation to what should be expected.
@ $70/bbl at the wellhead
Net Present Value (NPV) at 7%: $2,0 Billion
Net Present Value (NPV) at 10%: $1.7 Billion
@ $90/bbl at the wellhead
Net Present Value (NPV) at 7%: $2,6 Billion
Net Present Value (NPV) at 10%: $2.2 Billion
Mr. Likvern, from your Oxy evaluation I have learned something once again, thanks.
I am a little perplexed by Mr. Martensen’s comments, actually. I believe he is assuming that all 335,000 net acres in the Oxy sale is productive at typical Bakken EUR; correct me if I am wrong but that would imply all the acreage is proven, developed. One of my favorite shaleisms is the term “de-risked;” drill a shale well in an acreage block and the entire block magically becomes proven, developed reserves based on projected well inventory. Its an accounting principle that separates the real oil industry from the shale oil industry, IMO.
In any case, you suggest the NPV10 of the Oxy production included in the sale is $1.7 billion at 70 dollar oil. Personally, I would not buy it for that if you gave me the money but I agree with the evaluation. Regardless, it further suggests the value of remaining acreage for sale not already allocated to a well(s) is $1.3 billion. Mr. Wald suggests that acreage may be goat pasture. I’ll eat my hard hat if Oxy gets $3 billion dollars for that.
Why this is all important, at least to me is that, as you have pointed out, it is a long standing tradition in the oil business to kick the cost of plugging and decommission down the road by selling production to smaller companies who think there may be some magical “upside” to the purchase. I am not so sure that is going to work in this shale stuff. Also, how shale oil production is bought and sold is going to give us an insight into it’s real value, as opposed to ‘booked” value, and may cause a lot of financial institutions footing the bill for shale development great angst. Or should I say, greater angst. I always like to remind people that the E in EUR stands for estimated; tinker with it all you want, its still a guess, especially in tight shale with nano darcies of permeability. Just from a practical standpoint I never bought into all those long, fat tails; no, sir.
Lastly, in any large production sale, there must be a willing buyer, generally with a very willing banker ready to finance it. The shale oil industry desperately needs to de-leveraging its massive debt; if selling assets is one of the ways to accomplish that it is going to require even more borrowed dollars, in my opinion. I am not so sure that’s going to work, either. I think the folks funding this shale stuff are already getting the heebie jeebies. There will be some big “losses” in shale oil production deals and really big tax write downs.
Its going to be fun to watch how this mess sorts itself out.
Mike
Hi Mike,
It will be interesting. If prices remain under $80/b it will be a mess. If oil prices rise over time by 1 to 2% per year from current levels, the mess will come later (2017 to 2019) in the North Dakota Bakken/Three Forks.
I imagine the entire oil industry in the US is suffering at $80/b, though you would know better than me.
Mike,
Your comment should be put in bold red letters and be designated as required reading before anyone is allowed to comment on LTO. Next, the following two sentences should be inscribed in blood: “…drill a shale well in an acreage block and the entire block magically becomes proven, developed reserves based on projected well inventory. Its an accounting principle that separates the real oil industry from the shale oil…”
I know absolutely nothing about LTO but, based on years of work on conventional plays, I’m continually amazed at the way terms “reserves and proven reserves” are tossed around in the shale industry.
Dennis, you are right; whenever it happens it is still a mess. I don’t think very many people know how big a mess it actually is.
I would say, from someone who produced a great deal of oil at $9.00 a barrel, the conventional oil business is still very healthy at 80 dollars. To maintain fairly predictable decline rates of existing conventional resources thru EOR and infield development, etc. we need for rig rates, labor, services, all costs to go down. The LTO business has had an easy time of it the past 5 years; let them eat fish heads for awhile and maybe costs will go down.
Mr. Leighton, well said; it is essentially two entirely different business… the young, over- leveraged LTO business that everyone is now so enamored with, and the old, traditional conventional resource business that is still reliably providing the majority of hydrocarbons the world relies on.
Mike
Hi Mike,
I guess time will tell. I am sure oil will continue to be produced at $80/b, but in the US at least at $80/b not many new conventional wells will be drilled (nor many new LTO wells). So my expectation is that overall US output will be flat to declining by 2016 if oil prices don’t rise.
My guess is that at $9/b you would be abandoning a lot of wells. At $80/b there are probably some wells you might shut in that are profitable at $90/b.
I am not suggesting that no oil will be produced, just that at lower oil prices there would be less oil produced.
Mike, thanks!
The OXY estimate/evaluation is, call it a “back of the envelope” estimate, based upon the data from the linked article.
The magic word today is GROWTH!
A couple of years back (just after my first “Red Queen” piece at The Oil Drum) I was involved in discussions (with industry professionals and petroleum specialists (like professors) from academia) about understanding the connections between the LTO production curve (cumulative versus time) and cumulative Net Present Value (NPV) for call it the “average” LTO well.
Now view it from two participants,
A) Seller who got in early and tries to sell at some optimum point (maximizing profits/earnings or NPV).
B) Potential Buyer
What is important to understand is how the time value of money works (NPV) with the geometry of the extraction curve for the LTO well.
The Seller A will by his number crunchers (oil companies of some size have very good number crunchers in their staff) find out that the optimum time to sell is some 5 to 8 years after they got started.
What A sees is that the NPV additions (to the cumulative) with time hits an optimum.
Remember B starts out at time 0 (or 1 whatever preference, there is in the timeline) which for B may be some 5 – 8 years after A got going.
This may be illustrated that for the well (it goes for a conventional field as well) used to illustrate this is that after 8 years an estimated 60% of the wells EUR had physically been recovered while cumulative NPV was 75% – 85%.
The point is the connection or disconnection between physically recovered and financially recovered.
This is something few are aware of.
So if this observation had anything going for it, this would mean that some 5 – 8 years after the LTO activities really got started some companies aware of this effect would start to look for buyers for their LTO assets.
Remember this is also much influenced by the oil price and how the production profile develops, but it gives some idea of the financial dynamics involved.
Look around now and see how many companies (preferably of some size) that has been looking to find buyers for their LTO assets.
Needless to say, the potential Buyer has less financial muscles than the Seller.
Oh and there is more, transactions of LTO acreage involves the finance industry and the dynamics described above (due to the NPV thing) requires growth in total debt.
OXY consistently drills some of the worst wells in the Bakken. Completion techniques and well management have been implicated as potential problems, but the bigger issue is probably that the company simply doesn’t have very good acreage, geologically or economically. The announcement of wanting to get out of the Bakken wasn’t much of a shock.
Earlier this week came the announcement that MDU Resources d/b/a Fidelity Exploration & Production is looking to sell all its acreage in the Bakken as well. MDU Resources is essentially a local company (headquartered in Bismarck) but never really seemed comfortable drilling in the Bakken, plus, as a relatively late entrant, was unable to secure much prime acreage. Management has indicated that there is more money to be made in the midstream sector of the Bakken, so that is where more of the company’s resources are to be concentrated. To that end, the company is involved in the new 20,000 bpd refinery in Dickinson expected to open next month. Construction of another 20,000 bpd refinery somewhere else in the Bakken is also being studied (it would be tenth [10th] such refinery proposed for the region; the Dickinson refinery is the only one to date that has actually gone to the construction phase).
Hello,
I will now do something I seldom do, because Chris Martenson’s comment demonstrates poor understanding of petroleum economics, shale developments and some pompousness.
”Two things, the first of which is that the cost of capital as of Oct 2014 for energy companies was ~ 7% but it’s been moving up smartly of late. It could go back down or it might rocket higher. You might want to re-run the break-even under a variety of interest rate assumptions to check the sensitivity, as usually this is among the most sensitive of factors.”
Note how Mr Martensen tries to suggest that I did not check out several interest levels (for debt) when preparing the article.
And then subtly wants me (for free!!!) to check out the break even price for different interest rates.
First Mr Martensen gets access to work for free and then follows on and asks for more freebees (where I come from we call these kind of people for >freeloaders), which he then likely turns around and tries to commercialize.
And no, interest rates is not a dominant factor, THE OIL PRICE is.
Second, I think the EUR needs to be fiddled with mainly on the basis of OXY seeking just $3b for 335,000 core Williston acres. Assuming just one well per 160 acre spacing, and an average of $20 in net profits per barrel (from your analysis and $77 oil) this measn OXY was seeking to sell $12.5 billion in potential profits for $3 billion.
Note how Mr Martenson suggests to fiddle around around with the EUR (which likely is a favorite for some of his background).
EUR means Estimated Ultimate Recoverable.
Mr Martenson: What kind of EUR number are you wishing for?
Further the data used are actual data (from every flowing well) from NDIC (which was stated in the article, so perhaps Mr Martenson should take his time to read and digest the article before suggesting anything).
Mr Martenson continues to demonstrate his lack of insights into petroleum economics.
Either I have to assume OXY is full of idiots (which it is not) or they know something about that acreage which does not square up an an EUR as high as is generally modeled and assumed.
As for what I have presented in the article and in the comments in this thread OXY clearly is not full of idiots.
The idiot has willingly and voluntarily presented himself to the public.
As for Mr Martenson he might find it useful to read
Lessons from Dunning-Kruger
Lessons from Dunning-Kruger
“What’s curious is that, in many cases, incompetence does not leave people disoriented, perplexed, or cautious. Instead, the incompetent are often blessed with an inappropriate confidence, buoyed by something that feels to them like knowledge.”
With the best of intentions
Rune Likvern
Hey Chris, thanks for the freebie.
Feel free to take some time out from your busy schedule and drop in once and awhile, won’t ya? ^u^
Well done, Mr. Likvern. I trust this will receive the media attention it deserves.
I assure you the Eagle Ford Red Queen race is well under way also. We are awash in LTO at the moment; prices have declined and price volatility has returned. The shale “revolution” is likely little more than an uprising. T. Boone is correct, the shale oil industry shot itself in the foot.
Thanks again for your good work, sir.
Mike
Mike,
Thank you!
Honestly I think what we are witnessing is sad as it may be a precursor to something …call it difficult.
I understand consumers relief from a lower oil price, but on the other hand you need healthy oil companies that can bring oil to the market, even if that increasingly becomes more expensive.
RUNE,
Great work. I especially enjoyed the graph showing the relationship between the OIL PRICE & the FED QE POLICY. This has to be one of the most important graphs in the article. Very few people have put together the realization that without the FED MONETARY STIMULUS, the market as a whole cannot afford this expensive unconventional oil.
Japan has just embarked on the same kind of Hyperinflation monetary policy as the German Weimar Republic back in 1920’s. They only difference, the Japanese aren’t printing actual notes, rather they just add trillions of more yen digits. This is the last stage before the once great Japanese Business empire goes down the toilet.
Right now, the U.S. Dollar is enjoying strength due to the death of the Japanese Yen, but this won’t last long. If the FED doesn’t continue with QE4 & QE infinity, then we head into a deflationary collapse. So, I doubt the Bankers & Elite will allow this to happen.
Again, without the FED & MEMBER BANKS propping up the entire market with monetary stimulus from hell, the United States and most of the world would have never come out of the collapse of 2008-2009. Also, I believe we would have seen a peak of unconventional SOONER rather than LATER.
steve
Wall Street is in deep in the Bakken and for that reason alone, it is not going to shut down.
Cash flow to them won’t stop.
The TF is a conventional oil reservoir under the impervious lower Bakken Shale that contains fissures and cracks that leaks out the Bakken oil and deposits into the Three Forks, it contains Bakken oil. The Middle Bakken is the source rock, the hydrocarbon system, and if you read Leigh Price’s paper, you will read that as oil is extracted from the Middle Bakken Shale, the kerogen begins to form new oil.
Wall Street analysts are well aware of what is going on and the development of the Bakken will continue well into the future.
Suffice it to say that the development of the Bakken will be funded and financed until the cows come home.
You do realize that if this were true no one would be hauling an entire train load of sand to drill a single TF well? They would just drill a much cheaper, conventional, non horizontal and non fracked well to access TF?
There is no company or organization called “Wall Street”. There are Wall Street bankers, oil company investors, ETFs and other types of funds, brokers, brokerage houses, speculators, hedgers, insurance companies, stock exchanges and… that’s all I can think of right now but I am sure I left some out.
You need to be more specific. Which of the above named organizations will keep the Bakken up and running full steam ahead?
Goldman Sachs
http://oilandgas-investments.com/2013/energy-services/bakken-oil-three-forks-formation/
Lines of credit:
http://www.bizjournals.com/denver/blog/earth_to_power/2014/07/sm-energy-to-acquire-61-000-acres-in-bakken-for.html
Five of the continuous AUs and one conventional AU are in the Bakken formation, and one continuous and one conventional AU are in the Three Forks formation (Figs. 3 and 4). The Bakken AUs are similar to those defined for the 2008 assessment; modifications reflect geologic insights gained during the past 5 years of drilling activity.
http://www.ogj.com/articles/print/volume-112/issue-1/exploration-development/bakken-three-forks-largest-continuous-us.html
dood, where have you been the last 3 months. You realize all those links were from the time of $110/b oil?
I heard Lynn Helms say himself that breakeven is at 30 to 40 dollars per barrel.
Maybe true or maybe not, it remains to be seen.
Where have you been?
Helms said that? Or Kudlow?
BTW with horizontals and fracking 20 yr old technology, why would it take til 2008 to start going after NoDak oil if breakeven is $30?
What you will find is people say “some of our wells are profitable at $30. True, if they are already drilled.
What you will find is people say “some of our wells are profitable at $30.
They me be cash flow positive, but not necessarily profitable.
“With oil prices at the wellhead in Bakken at $70/Bbl in the summer of 2012, the companies netted back around $45/Bbl.”
70 minus 45 equals 25. The breakeven is at 25 dollars according to what is in Rune’s analysis right here in the today’s post.
http://www.resilience.org/stories/2014-01-09/red-queen-update-in-bakken-nd-it-is-now-mostly-about-mckenzie-county
Here is what it says at the link:
For what it is worth the model estimated that total production from the producing wells (Bakken (ND)) as of October 2013 to October 2014 (year over year) would decline by 318 kb/d or 37%.
Doesn’t look like that happened at all.
It doesn’t seem reasonable that with horizontal drilling and fracking 20 year old technology that it took til 2008’s $147/barrel to get NoDak underway– if they could have made money at $25/b.
Additionally, with that alleged profit margin CLR and EOG would be funding new drilling from cash flow, not 6% high yield bonds. And further, CLR and EOG would not have their bonds rated less than investment grade (aka junk) by Moody’s – which they are — if those margins were there.
Hi Village idiot,
Rune’s analysis suggested that if no more wells were drilled after Oct 2013, that the decline would be 37%, this was to get a handle on how many new wells would be needed to keep output flat at Oct 2013 levels.
Also note that the netback is the net revenue a company receives after paying royalties and taxes, transport costs, and all operating expenses (including interest and overhead).
The company still has to pay back the principle on any loans and have funds to drill new wells and has to earn a 7% real rate of return on money invested. The breakeven price is the oil price needed to make this happen.
Today the breakeven price is between $66.5/b (my estimate) and $68/b(Rune’s estimate which may be the better estimate).
Mike from S. Texas, who knows much more than I about the real oil business suggests that my estimates probably underestimate many of the real costs of producing oil, so I think he would like Rune’s higher estimate of $68/b and might even add a couple of dollars for stuff that Mr. Likvern (who also knows more than I do about the oil business) may have left out.
A big problem with many of the analyses by investment firms like Goldman Sachs, is that they take the well profile presented in investor presentations as their starting point. That “average well” produces 450 kb over a 60 year lifetime.
When you look at the actual well data from the NDIC and consider that rising water disposal costs for older wells will result in abandonment when the well produces less than 7 barrels per day, then a “real well” will produce only 320 kb over about 24 years. This raises the breakeven oil price.
Also note that if we assume the well is not abandoned until 30 years (at an output of 3b/d) the EUR only rises to 330 kb and the breakeven oil price falls to $66/b at the well head, not that this is equivalent to a WTI oil price of $78/b.
Yesterday the Dec 2014 futures contract for WTI closed at $78.54 on the NYMEX exchange and my “realistic” estimate suggests $78.50 is the breakeven oil price, with Mr. Likvern’s estimate at $80/b (prices at the refinery gate which is equivalent to the WTI.)
http://www.marketwatch.com/investing/future/crude%20oil%20-%20electronic
breakeven $30-$40?
ahahahhha
AHHHAHAHHAHAHA!
maybe on 10-20% of wells
if you read Leigh Price’s paper, you will read that as oil is extracted from the Middle Bakken Shale, the kerogen begins to form new oil.
That’s crap. Kerogen forms oil if cooked at “coffee pot” temperatures for a few million years, or in just a few hours if cooked at about 650 degrees F.
The Middle Bakken is at “coffee pot” temperatures. The kerogen there may still be turning into oil and gas but it is an extremely slow process, one would not be able to notice any change over the course of one human lifetime.
Capitalists aren’t going to fund anything at a loss. They’ll cannibalize current cash flows to stay afloat, sure, but no one is investing in something with an expected negative return.
Now, we’ve established that bankers will lie straight-up about the return and the risks (see housing) but that just means that when the investments fail – and a lot of them will fail at these prices, because they were marginal-to-Ponzi to start with – interest in these investments plunges and you can’t give them away.
This has happened to the oil industry before.
Idiot,
I actually agree with you. The system is driven by MONETARY HEROIN, if you pull the drug, the entire system crashes.. with possible death. So, yes… the FED & Wall Street will continue to prop up the Bakken and Shale Oil & Gas market because a continued ENERGY SUPPLY is necessary to keep the Fiat Monetary Dollar system alive.
Death of one, is Death of the other.
Who knows how long before the system finally cracks, but when it does… I wouldn’t want to be anywhere near a major city or metropolis.
steve
Hi Steve,
I will reply here for the interest on the debt comment below, for the field is very crowded down there…
Fed has been buying the majority of longer maturity treasuries, because the interest on the $18T debt is not a LINEAR, simple math one, otherwise we wouldn’t be able to pay it even now. If you would like me to expand on the details of that (the steepening, or widening of the yield curve and what those concepts mean) I’ll do it on your site, for it takes a long time. Most of the national debt now is under 5Years (actually mostly under 2years maturity) with a much lower interest and it will stay that way until the whole thing goes “kaboom”. There will be NO interest rate increases (actually the yeild on treasuriesWILL go lower – contrary to common sense belief!) Fed will not let it! When that happens (rate increase), that means they lost control and is time to run for the hills (literally!) and pray. Also, the low interest payments on the NATIONAL debt are NOT the principal reason(as you say in your comment, Steve) why the fed keeps rates low, they are a cool bonus …Rates are kept low to keep the total outstanding consumer/corporate credit/debt (which FAR exceeds the national one) from collapsing and MOST importantly: for enabling more borrowing! In order for our system to continue, we need more borrowing more than we need air to breathe…really!
2. And this is for Dennis Coyne as well as you:
going to gold standard is extremely DEFLETIONARY not inflationary (again, details to explain far exceed the space on this blog’s comments, so I won’t go there) If we go to gold standard (hypothetically speaking) we WILL have the mother of all margin calls and enter a deflationary death spiral …and Dark Ages …in very, very short order…and it will not be like the one following the fall of Rome, for they did not have nukes!
Whoever truly believes that (gold standard) in today’s environment i.e. Jim Sinclair, Richard Russell, etc., knows nothing of the modern economics and money. The very few ones who really know, i.e. J. Rickards, say it for OTHER reasons.
After the fall of Breton Woods in 1971, the ONLY chance we had to go back to gold standard (and afterwords undo the ills we’d done to make us go off of it in ’71 and do things right – which we would have never done anyway and makes the point an oxymoron and mute!) was when gold reached $800+ in 1980, or so.
We have crossed the Rubicon…strange and bizarre as it may sound, today we should pray that ol’ grammy Yellen is able to stretch this longer, for it is bonus time for ALL of us and we should enjoy!
hard to fathom, but true. Indeed!
Be well,
Petro
P.S. : very good post Rune. Thank you!
Hi Petro,
Thanks for correcting me. That makes perfect sense, gold would be in short supply which be like a contraction of the money supply, this would drive interest rates up, but would lead to a deflationary spiral like 1929 to 1933 (in the US) along with economic collapse a la the Great Depression.
Essentially a gold standard would cause credit to dry up and would be like throwing sand (or super glue) into the gears of commerce.
…in a nutshell: bingo…but in over, over, over …………drive.
-Great depression is a kindergarten spooky Halloween brunch compared to what’s coming. Very few people know the details of this, and I am lucky (damned…) to be one of them…but seriously: at this stage of the world economy and credit markets, pray that gramy Yellen is able to go to the mics every month and speak what all of your fellow commentators here and most of pundits out there call bullshit, for that means They are still in control…still.
-Bizarre, ain’t it!
The die has been cast! No matter who is president or fed chairman or…(you put the name here..) even Ron Paul (who truly does NOT understand that, the hole we’re in is inescapable! He should have been president after Kennedy and most definitely BEFORE Reagan…that way we might have had a small chance today…) The difference between one, or another will be ONLY timing – NOT the outcome. Peak energy is closer at hand and might be mingled (or instigator of) with the financial calamity, but for most of us the climate catastrophe might be the Thing we will not see…of course the ones of us who are going to be “lucky” to be alive afterwards will have to deal with the wrath of Mother Nature….so consider writing and reading at this site, or wherever just fun and do not take it seriously. It got me nowhere eventhough I know financial and economics matters like a handfull few and profited handsomely for it…
So, whoever tells you that we are going to have money backed by gold/silver (or any hard, “unprintable” commodity for that matter!) after it all collapses, is a dummy (99%), or a liar (1%).
Pray for yellen, kuroda, draghi and co. to give all of us more time….I am, every day!
What I told you is NOT representation of “Stockholm Syndrome” and hope it helps! With the risk of being a presumptuous prick, I dare to say is the best advice you will ever get and I was generous enough to give it to you for free..I need to redeem my past sins…some anyway…You are welcome!
Go to Europe, smoke that old Cuban you been hiding, crack that Chateau Margaux open, cash that 401k and Be happy and well.
Petro
P.S.: next stop: negative iterests rates (NIRP vs. ZIRP))and cashless society…interesting times! Ha, Ha, Ha…
Meanwhile, over in Asia, following his latest election shellacking delivered by a minority of lost souls who bothered to vote, the formerly most powerful leader in the world, Barack Obama, will star in a thriller this weekend, appearing in the same room with Xi Jinping, Shinzo Abe and, drum roll please – Russia’s Vladimir Putin.
Yair . . .
Brisbane is in Asia?
Cheers.
The whole capitulation to the governpimps is in a sense one glorified Stockholm Syndrome.
Petro,
Thanks for the explanation. Yes, I realize the FED has been sucking up the long dated Treasuries, and a result is a lowering of the annual debt payment. I do realize this is a BONUS, and not the stated goal of the FED.
I also do realize the FED will never raise rates or the whole system would collapse. However, the borrowing you are talking about is mainly by the large corporations and banks… not JOHN Q PUBLIC.
Lastly, as to your reply to Dennis, I do realize the collapse of the Fiat Monetary System and the FED could push us into a new Dark Age. Unfortunately, with the Nitwits running the show now, I don’t see an alternative.
So, I really don’t give a rats azz if the world went back on a Gold Standard, I just like to discuss it for the sake of argument. However, when the Great Paper Ponzi Scheme comes down, I would much rather be holding onto precious metals than just about all of the paper garbage masquerading as ASSETS.
Basically, its how to protect oneself after the collapse and not how to try to fix the system that can’t be fixed.
steve
Hi Steve,
Wouldn’t we see very high inflation rates if there was a gold standard?
Would that be a positive attribute of such a system?
Has real GDP grown at the same rate as the growth of gold supply over time?
Dennis,
Yes, the market would experience relatively high interest rates compared to the near zero interest rates today… artificially manipulated of course. However, the U.S. Govt cannot afford high interest rates as it would push the $350 billion in annual interest payment on the debt to probably over $1 trillion.
Which is the reason interest rates CAN NEVER RISE until the entire system collapses.
Dennis, if we were on a real gold standard, I do not believe it would allow the production of most unconventional oil sources. Nate Hagens also believes this to be true. Under a true gold standard, the kind of debts we are experiencing today would not be allowed.
Thus, debt has allowed us to steal oil production from the future that we really can’t afford today. Sounds strange… but that’s the common sense of it all.
If the world backed their fiat currencies with gold, the price per ounce would be north of $10,000 and more like $15,000-$20,000. The price of silver would rise to $200 or more.
Which is the very reason the FED & MEMBER BANKS have been destroying the paper price of gold and silver over the past 3 years and especially the last week to put negative pressure on the Swiss Nov 30th referendum vote to back the Franc 20% with gold.
The SNB and the Swiss Govt do not want this vote to pass, but the polls say the public has a 45% YES and 39% NO. I would imagine if the fiat monetary authorities can push gold down to say, $1050-1,100 by the end of November, this might be enough to get a NO VOTE.
Lastly, I don’t believe the U.S. has had real GDP growth since 2007. We consumed 101 Quad BTUs of energy in 2007 (at the peak) and now we are at 97 Quads currently. How does GDP Grow if energy consumption falls?
How? You get the Magicians at the U.S. Govt to under-report inflation which over reports GDP Growth.
steve
Hi Steve,
I will try to be more clear.
You think a gold standard is a good idea. You also seem to think debt is a bad idea. I disagree. Too much debt is a bad idea, no debt would mean economic collapse.
Let’s do a thought experiment and imagine the Bretton Woods system had remained in place. Ignore interest rates for the moment and focus on inflation rates. What do you think would have happened to inflation rates if we had not dumped the Gold standard? Either economic growth would have been much slower or inflation would have been much higher?
So by advocating a gold standard either you would like to see slower economic growth or higher inflation, or some combination.
Note that I am talking about the World economy and the assumption is that all major economies ad never left the Gold standard.
Dennis,
Let me see if I can explain this way. The Western Roman Empire collapsed due to a falling EROI which was experienced via their debasement of their Silver Denarius. However, the Eastern Roman Empire lasted for another 1,000 years as it did not debase its gold coin… the Byzantine.
Even though the Western Roman Empire collapsed in a huge part by debasing their currency… they had relatively little debt.
The U.S. System not only debased its currency, the U.S. Dollar, we are up our eyeballs in debt… which we must remember as peak oilers… are nothing more than ENERGY IOU’s.
Dennis, the Bretton Wood’s gold standard died in the 1960’s when the western countries joined a GOLD POOL to dump gold and the market to suppress the price. This is why Nixon dropped the Gold-Dollar peg in 1971 and a great deal of our gold went overseas.
However, if we were on a real gold standard, ACCOUNT DEFICITS would not occur. Gold is the ultimate distinguisher of debt. So, even though we may have had some debts, it would be a fraction of what they are today… this goes for the rest of the world.
And.. you must remember, all the BONDS and Govt’s balance sheets aren’t ASSETS, but also future ENERGY IOU’s.
Lastly, Peak Gold production would have occurred back in the early 2000’s if we were on a real gold standard. Which means Global GDP growth would have also peaked.
steve
Hi Steve,
So you think economic growth is a bad thing?
So you think economic growth is a bad thing?
Good or bad isn’t even the right question anymore, it is simply physically impossible going forward!
However for what it’s worth, I do think it is a bad thing as it is currently destroying every single ecosystem on the planet. Now my question to you is, do you think destroying every ecosystem is a good thing?
And before you answer that question go climb a tall tree and sit on a large branch and saw off the branch between yourself and the trunk of the tree… let me know what happens!
Over at The Oil Drum, perhaps you, too, recall some discussion about economic growth and how an economy could still ‘grow’ but it would be growth of a different kind, like maybe how plants grow; growth modeled on natural growth.
Yes, I do recall those conversations, however all growth, even so called natural growth is eventually limited by the laws of thermodynamics. Tom Murphy of Do The Math blog, has a great presentation on this topic called ‘Growth has an Expiration Date’.
Cheers!
Rings a bell. I’ll check it out.
About Tom Murphy, I don’t think he is actually predicting the end of economic growth. He is predicting the end of growth in energy consumption only.
Um, try that again — he is predicting the end of growth, but he is assuming growth requires energy and not providing much evidence that it is true, except correlations from past economic growth.
he is assuming growth requires energy and not providing much evidence that it is true,
Actually, he isn’t assuming anything! He is unequivocally stating, based on the laws of physics, that there no way in hell that growth, of any kind, can exist without energy!!!
To me at least, this is so obvious that I have a very difficult time wrapping my mind around anyone’s arguments to the contrary. Basically we are both staring at a black square and you are telling me it is white! Sorry to disappoint you but the damn square really is BLACK!
How does GDP grow as energy use falls? First it has to be looked at on a world basis because embedded energy flows with the flow of goods. When looked at on a world basis, increasing energy efficiency can lead to a higher rate of growth of GDP than the rate of growth of energy consumption.
Chart below shows a very slight improvement in energy efficiency around 1990,
as fossil fuels deplete, wind, solar, and nuclear will need to be ramped up or economic growth will have to slow. Reduced population growth and an eventual peak in World population between 2050 and 2100 will allow economic growth to slow down with continued increases in GDP per capita.
Not without a lot of bumps in the road.
Dennis,
Here’s the chart that says it all by Gail Tverberg. You can’t have REAL GDP growth if the energy supply growth goes negative. It’s really that simple. And, I never said you had to believe Shadowstats.
However, only an IDIOT would not consider the $4+ trillion of monetary stimulus sitting on the Fed Balance sheet as not INFLATIONARY. Instead of allowing this inflation to go into the precious metal and commodity markets, it was siphoned into the Bond and Stock Markets
Which is a DIRECT IMPACT on why the Total U.S. Retirement Market increased to $24 trillion in Q2 2014 from $23.1 trillion Q4 2014.
Unfortunately, Americans have been brainwashed into thinking DEBT & MONETARY PRINTING is good. Which is why they continue to contribute into the biggest paper Ponzi scheme in history.
REPEAT… we have had no NET GDP GROWTH since 2007. It’s all been Accounting Smoke and Mirrors. I am not saying you should believe… I am just saying… wait around a few years and it will proven true.
steve
CORRECTION: According to the ICI – Investment Company Institute, the total U.S. Retirement Market increased from $23.1 trillion in Q2 2013 to $24 trillion in Q2 2014.
Also, this is up from a lousy $14.s trillion in 2008. Americans are sitting on the biggest stinking pile of paper garbage.. and they have no fricken idea.
steve
Fer Chrips sakes….LOL
That’s $23.1 trillion Q4 2013 to $24 trillion Q2 2014.
RON WHERE THE HELL IS THE EDIT FUNCTION….LOLOL
Hi Steve,
http://krugman.blogs.nytimes.com/2014/11/09/keynes-derangement-syndrome/
One of my favorite quotes in economics comes from Frank Graham, who wrote that disorder is the sole substitute in social science for the controlled experiments of the natural sciences. What he meant was that drastic events, outside the normal run of experience, offer a much better way to test competing theories than day-to-day events, which aren’t too hard to shoehorn into various dogmas.
So it was with the global economic crisis, and especially the monetary policy response. Broadly speaking there were two views about what would happen when central banks hugely expanded the monetary base. On one side, those with a more or less Keynesian viewpoint saw this action as harmless at worst, possibly somewhat helpful, because they expected most of the new bank reserves to just sit there given near-zero interest rates. After all, that is what happened during Japan’s attempt at quantitative easing after 2001:
see chart below from the Krugman piece
On the other side, many people were quite sure that explosive inflation was just around the corner.
Steve:
Again, great analysis, info and commentary putting the whole puzzle together!
Hi Steve,
I do not agree on the under reporting of inflation, the BLS statistics are good, the Shadowstats stuff, not very credible.
Lastly, I don’t believe the U.S. has had real GDP growth since 2007. We consumed 101 Quad BTUs of energy in 2007 (at the peak) and now we are at 97 Quads currently. How does GDP Grow if energy consumption falls?
This is completely nonsensical. You have you own private definition of what the economy is, but you shouldn’t expect anyone else to be on board. energy is less than 10% of the economy.
There is no connection between physics and economics, just as there is no connection between ethics and cosmology (God rested on the seventh day, so go to church). You are simply muddled in your head, trying to equate two very different things.
What you need to do is ask yourself where the value of things comes from. For example, an IBM XT personal computer consumes a lot more energy than a iPad tablet. Does that mean that it has a greater economic value? Obviously not. In fact, one of the economic benefits of tablets is that they consume less energy. Not consuming energy makes things more valuable.
You get the Magicians at the U.S. Govt to under-report inflation
Lemme see, the price of oil fell from $115 to $78, you think energy controls the entire economy and you’re still complaining about inflation? Shouldn’t you be claiming we are experiencing massive deflation? You are not thinking this through very carefully.
You grew up in an era when inflation was a serious problem. You need to get your head around the fact that times have changes, and inflation is no longer a serious problem. Instead, you cling to the bugbear of the 70s and try to twist reality around to make it fit.
There is no connection between physics and economics,
Whiskey Tango Foxtrot!
I guess you think there is no connection between ecosystem thermodynamics and economics either, right?!
Connecting energy and thermodynamics directly to economics leaves out the real story — information. Economic growth is adding information, not adding energy.
Of course there is a lower limit to the about of energy you can consume to process a single bit of information. So without improvements of the underlying method of adding information, economic growth looks like adding energy.
We are nowhere close to the theoretical limit of the amount of energy we need to add information. In the past, energy sources have come on line so quickly that there was little reason to attempt to do so. That is why historical analysis seems to show that growth requires additional energy. In fact, all those charts just show that adding energy was the easiest way to grow, not the only way.
As fossil fuel consumption because more problematic (for environmental reasons or because they are getting scarcer or more expensive) we are shifting more and more towards growth through more efficient use of energy.
Because increasing energy consumption has traditionally been the easiest way to grow, discovering new energy sources has led to rapid growth.
The same is true for farmland. when North America was discovered by Europeans, world farm output increased rapidly. By the mid 20th century, there wasn’t much new farmland left to discover. But farm output continued to increase rapidly thanks to better strains, improved infrastructure and more inputs of fertilizer etc.
Adding resources is one way to enable economic growth. Another way is improving technology. Technological excellence is hard to measure, but I am sure you could gin up a chart showing that it is driving economic growth, just the way you can create charts showing added inputs are driving growth. Neither chart is complete.
The “Green Revolution” of the mid 20th century is now reaching its limits as well. to maintain farm output, we will have to reduce energy inputs and focus more on maintaining the land and water than we have to date. On the other hand, technology continues to improve.
Furthermore, the current economic system is vastly wasteful. Almost everything we produce is thrown away barely used. It is particularly ironic to see the Americans on this site denying there are ways to save energy without damaging economic growth. The goldfish can’t see the bowl from the inside.
Stanislaw Lem joked back in the fifties that by the end of the 21st century, if you wanted cheese for breakfast you would just sprinkle powder on the lawn the night before and collect the cheese at dawn. Seems unlikely, but I can’t think of a thermodynamic reason for doubting it.
I am neither a cornucopian nor a doomster. I do not know what the world will look like 100 years from now. I see that resources we have traditionally relied on are rapidly running out. At the same time, and technology is improving at a mind-boggling rate. The question is who will win the race.
Connecting energy and thermodynamics directly to economics leaves out the real story — information. Economic growth is adding information, not adding energy.
The following discussion is admittedly above and beyond my pay scale but I think one cannot unequivocally state that information can be added to a system without taking into consideration the second law!
http://arxiv.org/ftp/cond-mat/papers/0703/0703235.pdf
Information Loss as a Foundational Principle for the Second Law
of Thermodynamics
T. L. Duncan
Center for Science Education, Portland State University, Portland, Oregon 97207-0751,
USA and Department of Physics, Pacific University, 2043 College Way, Forest Grove,
Oregon 97116, USA. E-mail: [email protected].
J. S. Semura
Department of Physics, Portland State University, Portland, Oregon 97207-0751, USA.
E-mail: [email protected].
Another line of thought connecting entropy and information is related to Szilard’s 1929
thought experiment involving Maxwell’s Demon [9]. Szilard’s example highlights the
physical nature of information, which is important to our argument. His thought
experiment led to the realization that the seemingly abstract concept of information must be included in the accounting of entropy if the second law is to be universal. Otherwise, if there is no entropy generation associated in some way with handling information about the state of the system, then a Maxwell Demon could defeat the second law by sorting molecules based on the information gathered. This perspective was later clarified in more detail by others, including Landauer [10], Bennett [11,12], and Penrose [13], who pointed out that erasing (more accurately, resetting to a standard state – see e.g. the discussion in [14]) is the key step in information handling that links physical entropy and information.
This has become known as Landauer’s Principle: Resetting (“erasing”) 1 bit of
information increases the entropy of the environment by at least kBln2 (i.e. resetting is an inherently dissipative process). The bottom line from this perspective is that one is faced with a choice: either the kind of abstract information we deal with intuitively is subject to the laws of thermodynamics; or if information is independent of thermodynamic restrictions, then it can be used to violate the second law. So, since the familiar kind of information is subject to second law, maybe the second law is fundamentally all about information.
As I remarked, we are nowhere near the minimum level for information processing.
In other words, our most efficient processes use much much more energy than theoretically required.
So yes, energy input is needed to add information but (in theory at least) much much less than we currently use.
Dennis,
For example…. Let’s use back of the envelop simple math. The U.S. current debt is nearly $18 trillion. This is the debt based on 3 different simple interest rates:
2% = $360 billion
4% = $720 billion
6% = $1,080 billion
So, if the average U.S. interest rate in which the Government pays its annual interest payments on the debt went from the current 2% today, to a more realistic 6%, the annual interest payment would explode to over $1 trillion.
GOD HATH A SENSE OF HUMOR…
steve
Hi Steve,
Sometimes I think Watcher is right when he says that Tight Oil plays won’t be allowed to fail, at least on the short term: Simply, it’s such a huge component of the American economy. I can easily imagine states waiving fees for this and that, ignoring flaring rules, etc. Perhaps you guys know how big LTO is compared to Chrysler or General Motors?
Doug,
I agree. As I stated several times, the U.S. DOLLAR FIAT SYSTEM can only survive in a stable (with huge monetary stimulus) or growing energy supply. Once global oil production heads SOUTH FOR GOOD, then we can kiss a way of life forever.
I don’t know how long this will go on, but I would imagine the FED & WALL STREET will continue kicking and screaming to the end.
steve
Hi Steve,
There are other energy sources besides oil, such as natural gas, coal, wind, solar and nuclear. It is correct that GDP growth requires energy growth, oil is not the only form of energy.
Anyway, the Fed does not believe that energy is key to the economy. If anything, they underestimate the problem.
The Fed has a big econometric system which is hundreds of linear equations in hundreds of variables they use to understand the economy. You can use a system like that to ask what would happen if the price of oil doubles, but it won’t tell you what would happen it oil ran out.
The entire question of Peak Oil isn’t even on the Fed’s radar. They adopt the ‘”economic” argument that if prices get high enough, more effort will be invested in drilling, and consumption will fall at the same time.
Economists would also think there would be substitution.
Very peak oil quietly, the headlines on the first GOP issue to be pushed (for some reason) is the pipeline.
THAT IS A BAKKEN SUBSIDY. It would reduce transport costs. How quaint.
LTO extraction will for 2014 be around 1.5 Billion barrels (4 Mb/d). At$90/bbl that is roughly $135 Billion.
US GDP is at $17 Trillion. In other words LTO is now something close to 1% of GDP.
If oil prices are sustained at say $60/bbl, LTO extraction may decline a little to a total of say something around $90 Billion. A decline of say $50 Billion or something around 0.3% of GDP.
This becomes offset by cheaper imports of oil as the US imports something close to 3 Billion barrels annually (that became $30/bbl cheaper).
There is other oil production as well in the US.
I find it hard to see that a considerable decline in the oil price does much harm to the US GDP.
Money not spent on oil is likely to be spent on other purchases.
The theory is based in the sheer activity surrounding the industry. Since it’s borrowed money funding it, the amount of oil flowing doesn’t describe the GDP thereby associated.
Hi Steve,
Interest rates will increase if the economy reaches capacity in inflation goes up.
When that happens incomes will be higher, tax revenues will be higher and we will be able to afford to pay the higher interest rates.
Remember that a lot of the debt is money owed by wealthy people to other wealthy people, if these assets were reduced by half, some of the rich get poorer (those holding assets) and the other half get richer (those who are in debt).
Pssst, 4 of the 18 trillion is held by the Fed. They refund all interest to Treasury.
Steve,
What I sense has meaning is the real interest rate.
People may wonder why with low interest rates and lower oil prices things appears unaffordable (declining income is part of the picture).
If God has a sense of humor maybe that explains ebola. Be that as it may, He hates interest (and commercial farming):
You must not lend them money at interest or sell them food at a profit.
Leviticus 25:37
This proves that quantitative easing is in accordance with God’s Law.
GDP (Gross Domestic Product) measures the volume of financial transactions and has little to do with the gold production, but gold production adds to GDP.
Rune,
The subject of Gold as a SOUND MONETARY POLICY are no longer understood as the FED has its monopoly of monetary science that is taught in the major universities. This is not a conspiracy, but actual fact.
Regardless, Antal Fekete, the master on Gold and the Real Bills Doctrine states that GOLD is the ultimate extinguisher of debt. Why should debts and account deficits continue to increase. THEY DO NOT UNDER A GOLD STANDARD.
The world has been brainwashed to believe FIAT MONEY is a viable financial method for trade. However, I would like to remind all the mortals here that 100% of all fiat currencies went to ZERO. BAR NONE.
Unfortunately, the understanding of why Gold and Silver are wealth compared to the $100+ Trillion of Global Paper Mache Garbage of conventional assets has been forgotten by the masses, or else they would be doing like the Chinese, Russians and Indians.
The West will soon GET GOLD RELIGION, but it will be when most of the gold has gone from WEST to EAST.
steve
Steve,
I am not a gold bug, never will be. Gold, apart for use in some industrial applications, has, just as paper money (or computer digits), no intrinsic value.
If you do not believe me, try this thought experiment.
If you were to become isolated on an island (or in the middle of nowhere) would you rather have a ton of gold or hundred barrels of products (diesel, lubricants etc) from crude oil?
Our economies are billions of transactions between a Buyer and a Seller. Money (colored printed paper/computer entries) is used to settle these transactions. Credit is money created out of thin air.
Actually, it does not matter what we agreed upon as a medium of exchange (money) it could be colored paper with numbers on, gold, sea shells, tally sticks etc.
Credit and the amount of it has changed this game for some time.
I will stick to transactions here because we are conditioned to believe that it is only about money. It is not.
Our economies are thermodynamic flows.
In other words, each transaction involves goods/services and has some embedded energy in it. Unseen and unrecognized by almost everyone.
The challenges we face are not an energy shortage, but an expectations crisis. Most in the western world could do fine with less consumption, that is not a life threatening event.
Our real currency is ENERGY, but this is not recognized! It is as energy becomes scarce and/or less affordable hopefully more people will start connecting the dots.
Gold has some use for industrial applications, which is wealth creation. And some expensive “stuff” like jewelry. Thus gold extraction, that goes beyond the need for wealth creation, is actually wealth destruction as it involves using our most precious capital, ENERGY.
There’s a building here in Shelburne, Nova Scotia– the old Cox Warehouse– on the harbor on Dock Street. They did a few films there not too long ago.
I like the building… I mean, it’s just a long 4-storey-or-so classic vernacular warehouse/barn with good post-and-beam timberframe bones, but it’s just standing empty, cold, dark, unkempt, apparently waiting for funding-money to come along and rescue it, at least, if recalled, according to a pitiful little sign attached to the corner of it. Can you see the writing on it?
But the town has all the people, supplies, skills, knowledge and tools to fix up and occupy the building next month. Money is a hamstring.
“In 1992, Dock Street was the location for the filming of Mary Silliman’s War, based on a true story depicting Fairfield, Connecticut during the American Revolution. In 1994, Dock Street and area was the location of a major film, The Scarlet Letter, based on Nathaniel Hawthorne’s novel depicting Puritan New England in the mid 17th century… Other movies made in Shelburne were Virginia’s Run and Wilby Wonderful… In 2009, filming for portions of the 2-part TV miniseries Moby Dick was carried out in Shelburne. The Whaleman’s Chapel was recreated on the waterfront and the Spouter’s Inn recreated in Cox’s Warehouse. The series stars William Hurt as Ahab, Gillian Anderson as his wife Elizabeth, Ethan Hawke as Starbuck and Donald Sutherland as Father Mappel.” ~ Wikipedia
When I am there, walking its old main streets, it almost feels like another time. It’s a nice, curious feeling…
But the town has all the people, supplies, skills, knowledge and tools to fix up and occupy the building next month. Money is a hamstring.
Which is a really good example as to why our current economic system is a major roadblock to actually rolling up our sleeves and getting anything done.
Hi Fred, yes, it gets pretty ridiculous. And these kinds of effects are of course also why many are talking about local-currencies vis-a-vis local/glocal resilience and why I also suspect that gold may be just another kind of hamstring.
Given our attachments to the current currency mode, when the banksters roll over, some of us get squashed.
Great big picture analysis and commentary!
Steve,
To me the role of credit/debt in the economic growth equation has been poorly understood.
Credit/debt allows to pull demand forward in time and pay for it. Credit/debt comes due at some point in time.
So, I doubt the Bankers & Elite will allow this to happen.
To which we should be grateful (whatever we might think of Bankers & Elite).
Tell that to Cyprus.
Try to imagine the economy without an operational financial system.
I did not imply anything about it being fair and people getting hurt in the process.
There is a saying that goes like”In order to save the village we had to burn it!”
Rune,
Yes, we can thank the Bankers for removing Gold and Silver from the monetary system and creating the most out of balance transfer of wealth in the history of mankind. Just as Goldman Sachs CEO Blankfein stated, “They (bankers) were doing Gods work.”
REMEMBER: Debasement of the monetary system is a TAX on the Poor. The wealthy don’t care if goods and services cost more due to the debasement of the currency. Their biggest concern for the FAT CATS is the waste of time it takes to fill up their Mercedes with gas.
When I see just how much of an AVERSION the public has to gold and silver… we can surely see how successful the FED was by indoctrinating the Colleges and public into believing in the Fiat Monetary System.
Every time I hear someone say, “Gold is just a stupid piece of metal”, I realize again…. just how successful the Fed & Bankers were in removing SOUND MONETARY SCIENCE in the colleges and schools.
AMEN BROTHER…
steve
SOUND MONETARY SCIENCE
Now there’s an oxymoron, if ever there was one!
As for gold, try eating it or running your machines with it. I suggest you invest in tulips instead. In case you are interested I have a bulb for a very rare black tulip that I can give you in exchange for a house and a ten year supply of food and clean water…
Fred,
Yes, you can’t eat gold, however you also can’t eat U.S. Treasuries, 401K’s, IRA’s, CD’s, Pension Plans & Etc. However, 98% of Americans who are invested, are invested in one of these paper pieces of garbage.
Funny, the world has been using gold and silver to TRADE FOR FOOD for nearly 2,000 years. So, while you can’t eat gold or silver, you can most certainly trade food for them.
steve
Steve, unsure about this, but what happens when, over time, more and more of certain, limited groups and individuals amass most of the gold?
While gold has traded for a long time, perhaps the times, gold’s contexts, etc., have changed.
“you can’t eat gold”, but gold fillings might help you eat. Take some gold to the dentist for parts and labor.
Good point… Is gold coinage the same kind of (percentage of) gold as the kind used in fillings though?
…But maybe some could be melted down and at the same time, education provided in preventative oral measures… But it reminds me of an (albeit, likely ignorant and naive) idea I had of grinding down donated teeth, putting that powder in some kind of chemical solution that, with electricity and/or time, might slowly bind, via orthodontic-tooth-mold, and like a stalagmite/tite, to a tooth-cavity still in the mouth.
REMEMBER: Debasement of the monetary system is a TAX on the Poor.
It was cute in the 80s when Reagan called everything he didn’t like a tax. But Mark Twain once asked how many legs a dog has if you call his tail a leg. The answer is four — even if you call his tail a leg, it’s still a tail.
Japan has just embarked on the same kind of Hyperinflation monetary policy as the German Weimar Republic back in 1920’s
This isn’t even remotely true. You need to get the Nazi ghosts out of your head.
Ilambiquated,
Excellent try… however the NAZIS weren’t around in the 1920’s. So, in reality you point is actually quite stupid.
steve
Actually they were around in the 20s — the party was founded in 1920.
You have the Weimarer Republic on the brain because the Nazis came up in that era. You really need to try to think of some new things to think about, you’re running around in circles.
And my point was that the current policies of the Japanese government are not even remotely similar to those of the Weimarer Republik. The claim is absurd, my point is far from stupid.
Ah, yes, T. Boone Pickens. A ‘billionaire’, sure he is.
Here’s one of his comments in answer to a question about wind power:
Fast Company: And you’ll do all this on your beautiful 68,000-acre ranch?
Pickens: I’m not going to have the windmills on my ranch. They’re ugly. The hub of each turbine is up 280 feet, and then you have a 120-foot radius on the blade. It’s the size of a 40-story building.
http://northeastwindmills.com/critics-and-supporters-agree-giant-wind-turbines-are-ugly/
Not in my backyard and if it’s in yours, too bad, sucker.
What a mess.
Village Idiot,
Spot on. Furthermore, Pickens was part of pushing the GREAT LNG GAME in the United States. Clean Energy Fuels constructed a lot of LNG filling stations around the country in Truck Stops. I can tell you that where I live, three of the three stations I have come across are sitting idle with barricades around them to keep trucks from entering the fuel island.
So… I would imagine we have a great deal of these Clean Energy Fuels LNG filling stations sitting idle around the country. Talk about BOONDOGGLE.
steve
The latest from Boone – item #2 http://www.politico.com/magazine/story/2014/11/oil-prices-are-dropping-so-what-112607_full.html#.VFu1UUuTTKe
I got a new theory on water cut.
The longer stage count increases the probability that a downward pointing frack hits a water supply. Water presence has a much higher probability than oil presence. And, per recent discussion, water flows through a given permeability easier than longer oil molecules.
So more stages in a non linear way would increase water flow vs oil flow?
I cannot imagine any reason for Bakken wells to (suddenly) start increasing their water cut.Isn’t each well there an independent beast in a tight host-rock formation? Traditionally, sometimes such water comes from cross flow, or high-permeability water channels but that shouldn’t be the case. Obviously, if you’re doing water flooding in a conventional field, as reserves deplete water becomes an increasing problem. Perhaps your theory(s) is indeed correct. People working there MUST know the answer. Just analyze to water and identify its source(s). Whatever, high water production increases lifting and water disposal costs, while it reduces production. It will be interesting to follow this statistic.
What got my attention was a recent indication on the graph that cut boosted based on year drilled moreso than age of the well? The main variation of things by year drilled would be stage count. They are doing more stages now.
Good call on disposal costs. Curious about where those disposal wells are drilled. How do they know the pores of the rock there are empty and just waiting for water to be pushed down into them? I thought imagery can see pores but not content. Maybe not.
Doug, it isn’t happening (suddenly) at all. And it’s only new wells. Wells that are drilled further from the center of the sweet spot or wells that are drilled too close to another well.
The water source? It is ocean water from when the shale and algae deposit was laid down about a hundred million years or so ago. The water was always there. What happened was the algae was turned into kerogen and then into oil. The oil formed right where the water already was.
In conventional reservoirs, the oil, being lighter than water, rose up until it hit a barrier and then stopped. That area was called “reservoir rock”. But this “source rock” is not porous enough so it just sits there, going nowhere. And the water is going nowhere either.
When they move further away from the center of the sweet spot, you will just naturally get less oil. But the water is always there so as you get less oil you will just naturally get more water.
As far as down spacing… too close, as the combination of oil and water is removed, more water and less oil moves in to take its place. That is IF that is part of the reason the water cut is increasing. But I am not sure that is the cause. It could be just the sweet spot playing out.
Well at least I did put the “suddenly” in brackets Ron! But PLEASE, not the brief lecture on ocean-source water. Although I’m mostly an exploration geophysicist, I do have a Master’s Degree in geology as well — though it may not sound like it at times. [yellow face in here].
PS: No quibble otherwise!
Hi Doug,
Ron may be giving this information to the general audience who knows less than you, I for example, learned something from Ron’s comment and appreciate it, not everyone is a geologist.
I appreciate Ron’s educating the masses like myself.
Sorry Doug, but if you don’t want a simple answer then don’t ask a simple question.
For instance this question: Isn’t each well there an independent beast in a tight host-rock formation?
How can you be serious? Or perhaps a better question is “Are you serious?” Hell, I really don’t know. I am afraid to answer because I don’t know whether or not you are joking. However now I am sure you were. But for others, (don’t read any further Doug, because every geologists already knows this), although each well has has its own tiny reservoir, as you move further away from the sweet spot the water cut in that new general area will be higher.
A smiley face is made with a : then a – then a ) though the – for a nose is not necessary. But it will come out like this: 🙂
I´m merging the water cut threads. I have attached a graph showing the water cut profiles for Mountrail. It has a small pay area with mostly sweet spots. So any change in water cut should not be beacause of moving away from the sweet spots. As you can see 2010-2013 are rather similar. So the increase in water cut for Bakken as a whole those years (except 2013), are propably because they drilled more holes in counties with more water content. 2014 stands out and has noticeable higher water cut for Mountrail. My guess its because they start to use alot more water and proppants.
However, there are fewer data points for 2014. So maybe its just a coincidence its a bit higher at the moment.
Good data.
Thank you. I changed my mind. The increase in 2014 is not that big. So it could be beacuse of downspacing; drilling already depleted areas. Because as you can see on the graphs, watercut is increasing slighty as the well is producing. So for 2010 -2013 I believe you are right Ron. Looks like its because of moving away from the sweet spots. For 2014 maybe downspacing also starts to kick in.
Hi Freddy,
Thanks for this data.
The changes from 2010 to 2013 are pretty small and note that 2013 is somewhat lower than 2012, the jump up in 2014 may be due to fewer wells in the sample, or due to changes in well design (more proppant and associated water in the fracking process and/or more stages) leading to a higher water cut.
It would be interesting to see the 2010 to 2013 average water cut (maybe as a dashed black line) added to your chart.
By just looking at the graph, the average for 2010-2013 should be somewhere where 2011 is. If we exclude 2013, then it looks like the water cut increases a little every year. In that case 2014 just follows that trend and 2013 is a bit of a mystery. On the other hand, if it´s just a coincidence that 2010-2012 seems to increase every year and they are just changing a little from the average. Then 2014 is noticeable higher so far.
One more thing. The graph contains data up until August. In Ron´s last post he showed that the first 24 hour water cut has increased for September and October. So I expect 2014 to move upwards as we get the data from those months.
Would not the first 24hr water cut increase with more fracing stages? More water pumped in, more to come out.
NAOM
NAOM, more fracking stages should not affect the water cut. It could only potentially increase the number of cracks. More water could however, I believe, increase the water cut in the beginning of the production if some of the new water does not create new cracks but instead only increases the pressure. In the graphs however this does not seem to be the case. The month zero water cut for 2014 should in that case be much higher at first and then drop quickly.
If the cracks go into the non source rocks, I think water cut could also increase.
Actually liquids don´t compress that much under high pressure. So I take back the high pressure theory.
Doug
Oil and water flow rates in a rock are dependent on the concentration of each fluid in the rock matrix itself. A rock with more water in it will have a higher water flow rate, and oil with more oil a higher oil flow rate. The curves vary for the type and saturation of a rock, but the general principle holds.
It might simply be that the new areas where wells are being drilled have less oil saturation than the older areas.
True but it seems odd that in a play like the Bakken where each well is essentially a closed system in a “tight” formation there would be systematic change in water cut over time — assuming there is. Or course there are facies changes and other variables so who knows. Perhaps migration of well into (slightly) different geology (away from sweet spots?) is responsible. This isn’t a big deal to me, just idle curiosity.
Actually Sam commented on this. Sweet spots. You find them with imagery, yes? But the imagery can only tell if the rock is porous and has some natural fracks. It doesn’t identify if the pore content is oil vs water?
If it doesn’t, then in keeping with “drilling the sweet spots first”, you somewhat can’t. You don’t know where the water is vs where the oil is.
Unless . . . test wells told them.
I am not an engineer but I have to play one in real life every day; my respects to Mr. Taylor because I think he has it basically correct. The difference in bound water and moveable water in a rock is a very complex relationship between water saturations, oil saturations, capillary pressure, porosity, permeability and wettability of the fluid; I barely understand that relationship in clastic reservoirs and I would not pretend to understand it in shale as dense as a concrete parking lot. Lower oil saturations (perhaps in flank areas, as Mr. Taylor and Mr. Patterson imply), declining oil saturations from depletion and changes in capillary pressure often make bound water more mobile, consequently OWR increases.
In conventional reservoirs there is often underlying water (connate water) below an oil column. No so in a shale bed. So the length of the lateral, or the inclination of the lateral, or the number of frac stages in the toe of that lateral have nothing to do with increased water production. Increasing the number of frac stages requires more induced water, yes.
A typical 25 stage frac requires about 150,00 BW to perform, or more depending on sand concentrations. I am told 50% of that induced water is generally recovered during flowback and production over time. Things must change in the rock (shale) that makes natural water more moveable as depletion occurs; OWR then starts inching its way up again. Y’all can goggle stuff like this ’till the cows come home.
Because the area drained by a wellbore in a tight oil reservoir is only as big as that reached by the frac radius around the lateral, it is indeed pretty much a “closed system.” It will then be fascinating to me to watch OWR data going forward.
My apologies to people much smarter than me.
Mike
So, as I’ve said I mainly work in marine seismic looking at conventional reservoirs, so take what I say with a grain of salt.
I think that until very recently (possibly even still now) seismic was just used to image the location of the shale beds, and then people just drilled in spots that looked thick and easy to get to. I recall seeing a map somewhere on here showing the locations of shale wells over time, and they seemed randomly places to start with, and over time zeroed in on the sweet spots. This kind of makes sense if they can’t image sweet spots well.
Sweet spots are mostly areas in which the rock has the right mechanical properties that it will fracture well, and more oil will thus be released from the fractures. To some extent you can map this bycalculating seismic attributes, such as poissons ratio, which you can calculate if you have the right data available. However I’ve read papers that seem to suggest that different geologies have sweet spots which show up differently from one attribute set to the next, so what works in the bakken might not work in eagle ford for example. So it’s hard to know just how much seismic is helping in this regard. The well location maps would again suggest that it’s all been trial and error so far.
I don’t really know how much attention the industry has paid to figuring out the geophysical and petrophysical properties of shales, as until fairly recently I don’t think they’ve been all that important.
http://headlines.ransquawk.com/headlines/colombia-oil-output-was-1-002mln-bpd-in-october-06-11-2014
This looks down a smidgeon from Ron’s non-OPEC charts.
Here are some other juicy Ransquawks of the last several hours:
WTI and Brent continue to decline as the market digests OPEC statements that OPEC is not panicking and has no plans to intervene
OPEC has no target oil price, according to Secy Gen Badri
Badri says OPEC expects a price rebound will not take place until H2 2015
(!!!!!!!!!!!!!!!!!!!!!!!!!! goodbye Bakken)
Hi all,
A new Bakken scenario with well cost increased from $9 million to 10 million and conservative oil price assumptions.
Economic assumptions for scenario above, real oil price on right axis, NPV(net present value) of future output, well cost, and profit on left axis.
Selling and G&A for CLR is on finance.yahoo.com. They plan on all their fields to do 200K bpd this year.
The division gives $8.90/barrel just for SG&A.
Hi Watcher,
The costs are about $24/b(including transport cost), plus 27.5% royalties and taxes on wellhead revenue for a total of $42.7/b, if the refinery gate price is $80/b, so the net is $37.3/b used to pay back the principal on a $10,000,000 loan for the well. It would take 268 kb of oil to pay back the loan if prices remain $80/b in constant dollars for 14 years (the time it takes for the well to produce 268 kb), I doubt that oil prices will remain at $80/b for 14 years, I expect they will slowly rise (maybe at 2% per year or so in real terms.)
I have not added the $3/b earned from associated gas net revenue if I had added this to income other costs would have been $6.5/b rather than $3.5/b. I checked the Continental Resources(CLR) 2013 annual report and these costs match CLR’s cost numbers pretty well.
Gas has its own costs. No pipelines for most wells etc. I vaguely recall fines for flaring too, that were chosen to endure.
Hi Watcher,
Using the Continental Annual report as a guide, I assumed $1/MCF transport costs and looked at the natural gas sold in the bakken by CLR relative to oil sales, as this is associated gas, the costs are wrapped up in the OPEX of the oil well, these are not separate gas wells, this is the gas which comes up with the oil and has to be separated anyway, based on the CLR 2013 annual report I found Mr.Likvern’s estimate of $3/b of income from natural gas sales to be conservative and used that estimate.
When using CLR numbers and assuming $1/MCF for transport costs the number was more like $4/b of additional net income from natural gas sales in the Bakken.
Chart below shows assumptions about decrease in new well EUR for the Bakken scenario above.
This is very speculative, nobody knows in advance when new well EUR will begin to decrease and how quickly it will decrease once it begins, the scenario above matches the USGS mean estimate for the North Dakota Bakken/Three Forks (TRR=9.5 Gb).
Great. I see that Enno Peters got a similar graph over water cut as I got, which I posted in the last post. So then they must be fairly correct. What do 2012 and 2013 have in common as their profiles are the same? Completion technique?
Yes, as I mentioned to Watcher above, this water cut business is a mystery to me as well. There must be a simple explanation but I’ve yet to hear anything plausible (sorry Watcher); anything plausible except Watcher’s theory.
That was when stage count started to expand. Ditto the switch from expensive ceramic proppant to cheap sand.
haha one does hope the disposal wells are far enough away. They pump that water down hard and it is said the water pumps are the source of the little earthquakes in Oklahoma.
Anyway that would be cool, that previously disposed of disposal water is coming back up.
There are approximately 100,000 naturally occurring earthquakes each year with a magnitude of 1.0 and greater.
Happens all of the time.
OPEC Oil Basket Price Falls Below $80 to Least in 4 Years
OPEC members’ average crude price fell below $80 for the first time in four years as Saudi Arabia and other members of the group supplying 40 percent of the world’s oil maintained output amid slowing demand growth.
The OPEC basket, the best measure of what the oil exporters earn per barrel, fell to $78.67 yesterday, the group said by e-mail today. That’s the lowest since October 22, 2010, according to data compiled by Bloomberg.
The OPEC basket price fell another 56 cents overnight to $78.11.
Rune,
I recall that in a comment on fractional flow you mentioned that you’re expecting we’re likely heading into a period of ‘nonlinear dynamics’. I tend to agree, and am not anticipating it with any great relish. Did you have a timescale in mind when you made the above comment?
I do not have a specific timescale for when things will happen, but to me there are now several worrisome signs.
To stick to the subject, the recent steep decline in the oil price while interest rates are low ought to get some attention. Total (global) debts, sluggish economies, declines in households disposable incomes etc.
The system is very complex and honestly I do not think anyone can predict anything with any certainty and then there are contagions which may be perceived, but hard to quantify.
A fully operational financial system is the important one going forward.
Rune’s work was fabulous!
Steve’s big picture commentary helped to tie it all together!
Thanks Ron for educating the world on peak oil!
The Russian Ruble has been falling like a stone this year. Their central bank had been buying to try to prop it up, but has given up support and is letting it float.
http://www.google.com/finance?q=CURRENCY%3ARUB&sq=ruble&sp=2&ei=BNxbVLicKOm6iwLw2oGoAw
Maybe the current low oil pricing is somehow being manipulated to go after Putin.
The Saudis would not mind breaking Russia in half. Russia backs Iran and Syria. Saudi hates those guys.
The Russian currency situation is getting nasty.
This link may or may not depending on one’s opinion with peak oil and the current price of oil.
But it is well worth the time needed to read it for what it has to say about economic growth in general over as extended time frame.
http://www.economist.com/blogs/buttonwood/2014/11/secular-stagnation
This rather expensive book is to be released next week http://www.amazon.com/The-World-After-Cheap-Oil/dp/1138806374
And what is the authors definition of cheap?
It would be more telling to substitute cheap with affordable.
I have no idea. The book has yet to be published. I posted this information only because of the reference to Gail. Heinberg also states: “If you are already familiar with the peak oil literature, this book will provide you with a comprehensive, up-to-date summary that covers nearly every relevant topic within this field. If you are new to this discussion, prepare to have your world shaken.” –Richard Heinberg, Senior Fellow, Post Carbon Institute.
— “Affordable” makes good sense but “Cheap” might have more impact in a title if the purpose is to sell books. When I first became interested in what is now called peak oil, I considered cheap to be significantly less than two dollars a barrel. Really cheap was during my early childhood when oil flirted with ten cents a barrel, leading to riots in Oklahoma.
— Thanks for the excellent post and discussion
Thanks,
and it may be about semantics.
To me it is important with regard to the concept people hold in their heads of words (words have power).
$10/bbl oil may sound cheap, but not so …if you do not have $10.
This is for the person posting as Village Idiot (and a response to one of his comments further up)
Perhaps you would be so kind to enlighten us on the principles about how the net back and break even prices are estimated?
For what it is worth the model estimated that total production from the producing wells (Bakken (ND)) as of October 2013 to October 2014 (year over year) would decline by 318 kb/d or 37%.
This decline refers to the extraction from the population of wells as of October 2013 (which apparently most readers understood). And to be sure it did not imp anything of well additions post October 2013.
I understood the implication.
Let’s look at the numbers.
October of 2013 had a Bakken/TF well count of 6656 and a monthly production of 27,288,299 barrels. A 37 percent decline rate would have reduced the monthly production of those wells to about 18 million barrels.
The August of 2014 well count for the Bakken is 8287 and the monthly production was 33,095,890 barrels.
With the less 9 million predicted from the well count in October of 2013, the monthly production would have about 9 million barrels less than the 33 million plus reported in August of this year. Just using figures that apply now, the real numbers, you are still far off of the mark of your prediction published at resilience.org.
https://www.dmr.nd.gov/oilgas/stats/historicalbakkenoilstats.pdf
I referred to October 2014 (not August 2014) for the decline for the population of wells of October 2013.
Nice try!
So what is your estimate for the same?
Are you still working on the definitions of break even price and net backed price?
I know, it is only ten months.
There is the six additional percentage points for the remaining two months not yet reported. Fair enough.
You are still 7 or 8 million barrels short of the actual production.
A well cost of 9 million dollars needs 90 thousand barrels of oil at 100 dollars per barrel to pay for the well expense. That is one year’s production at 7500 barrels per month.
A high amount of production, yes, for a well in the Williston Basin.
25 years of production at 1500 barrels per month/50bpd is going to be 450,000 barrels.
25 years of maintenance costs at 35,000 dollars per year is 875000 usd.
9.875 million, 450,000 barrels of 25 years of production works out to a breakeven at 20 usd if the oil company gets it all.
Add in 25 years of interest charged to amortize the 9 million borrowed to drill, at 5 percent loan rate, you have a simple interest of 450,000 dollars for the banker. Add another dollar. 21 dollars.
Royalties at 20 percent of production is going to subtract 90 thousand barrels for royalties. Participating mineral owners might increase that number to 18 million dollars or 40 dollars.
Add 20 dollars per barrel for royalties paid to the lessors, 40 for the mineral owner who wants all of the oil, which all of it belongs to the mineral owner, he is kind enough to let you drill for oil and pay for all of the responsibility of his portion of the costs. The oil company writes the check with tears in their eyes.
41 dollars, a shot in the dark, but it looks like that might be an estimate that works if it is all leased, 61 dollars if the owners of the oil want it all.
One mineral owner in western ND is receiving 120,000 dollars per month from a Bakken well site on his land. That breakeven might go to 70 dollars or more if the land owner participated.
Am I there yet?
If they are receiving royalties, they will receive payments for 1500 barrels per month at 80 dollars. The production has to be at least 7 or 8 thousand barrels per month. Probably more.
I know several people who receive checks amounting to 9 grand per month each.
It is not uncommon for a mineral corporation to receive checks for 50 grand per month on 640 acres of mineral acreage if the participate.
Gettin’ there, but I know I missed a few costs, but the idea is there.
Production from the Bakken well population as of Oct 2013 was 27.3 Mb, decline of about 30% would bring it down to 19.1 Mb by Aug 2014.
Aug 2014 production was 33.1 Mb, and from Oct 2013 to Aug 2014 a total of 1,630 wells was added.
If my estimate of the decline is in the neighborhood, these 1,630 wells added 14 Mb from Oct 2013 to Aug 2014. That translates into 8,600 bbl/well/month.
If Village Idiot’s claim stands that I am 7- 8 Mb short, this would mean that the total production from the well population as of October 2013 stood at roughly 26 – 27 Mb [19.1 + (7-8)] Mb in August 2014.
Dear Village Idiot,
Your number suggests that the population of wells as per October 2013 declined collectively by roughly 4% by August 2014. Ref also figures 05 and 06 in this post.
The 1,630 wells added from November 2013 to August 2014 thus added 6 – 7 Mb or on average 4,300 bbl/ /well/month.
This compared to the “old” population of wells in Bakken as of October 2013 (6,660) in August 2014 produced 26 – 27 Mb (as per Village Idiot’s claim) or 4,050 bbl/well/month.
Do you have any documentation that supports that the “average” well will get to 450 kb after 25 years?
Tight oil wells deplete rapidly.
A well cost of 9 million dollars needs 90 thousand barrels of oil at 100 dollars per barrel to pay for the well expense. That is one year’s production at 7500 barrels per month.
Gross, yes. But in the real world OPEX, royalties, taxes, debt service, G&A, etc are paid from the revenue stream.
What about costs for acreage acquisition and plugging and abandonment?
What kind of return do you use for your investment? 0% apparently.
Wellhead prices in the Bakken are now around $60/bbl.
9.875 million, 450,000 barrels of 25 years of production works out to a breakeven at 20 usd if the oil company gets it all.
Undiscounted (time value of money) and before royalties and taxes. And what kind of royalties and taxes have you used?
Add in 25 years of interest charged to amortize the 9 million borrowed to drill, at 5 percent loan rate, you have a simple interest of 450,000 dollars for the banker. Add another dollar. 21 dollars.
Per your example interest (interest rates are pro anno) payments amount to $450k a year and with a first year production of 90 kb that amounts to $5/bbl, which gradually increases as the production declines.
Royalties at 20 percent of production is going to subtract 90 thousand barrels for royalties. Participating mineral owners might increase that number to 18 million dollars or 40 dollars.
Which means 90 kb of oil less to spread the investment, interest expenses etc on (which per your example drop from your 450 kb to 360 kb).
Am I there yet? NO, you have not even begun!
Gettin’ there, but I know I missed a few costs, but the idea is there. NOPE!
Village Idiot, if you have faith in your estimates you should take all your savings (and the kitchen sink) and lever up and invest according to your estimates.
Of course the numbers are sloppy.
They’re on a piece of paper, not a spread sheet. So what? Not a big deal. My numbers are wrong. I can admit it right now, but they are much closer than what was predicted.
Look at the very bottom number provided by the NDIC. They’re there at the link at the bottom of my post. They are the numbers I use. Not a difficult task to work out what is there.
The average was 3994 in Aug of 2014. October of 2013 was 4100. The 6656 wells were producing 41oo barrels per month per well, the decline rate of those wells at 31 percent would have dropped those wells to an average of about 2900 barrels per month or 18,829,824 barrels for those 6656 wells in the month of August of this year. It did not happen. Your prediction fell far short of the production that did happen. Those new wells had to add 15 million barrels had your prediction been on the money for the 6656. The numbers don’t work out, the math is fuzzy.
Add in the new wells, 3994 barrels per month for Aug of 14, the 1,630 wells, added 6.5 million barrels.
33 million barrels minus the 6.5 million from the new wells is still 26.5 million barrels, a loss of one million barrels on the 6656 wells, the production is an average of 3981 barrels per month per well, not even close to the losses predicted in January of 2014.
Add the 18.9 million barrels that the 6656 wells would have produced at the 31 percent decline up to August of this year, you’ll have 25.4 million barrels per month. The production was not reduced by that much, it did not happen.
24.5 million barrels is what the predicted production should have been with your estimate. They’re just plain old wrong.
A difference of 106 per well daily production from 4100 to 3994 is all the loss is. Not even 3 percent.
Nice try, not quite, though, not even close.
“A difference of 106 per well daily production from 4100 to 3994 is all the loss is. Not even 3 percent.”
106 barrels per month decline, not daily.
Hi Village idiot,
A fundamental concept that you are missing is that the 37% decline assumes that no new wells are brought online after Oct 2013. If that had happened, that would be how much the decline would have been, it was not a prediction of future output. Rune has presented a scenario with future output if 150 wells per month were added from 2013 to 2014 with output reaching 975 kb/d at the end of 2014 using the 2011 average well in the simulation, this is a pretty good estimate, nobody knew in Dec 2013 how many wells would be added in 2014?
Rune’s analysis is ground breaking, take a close look at the green dashed line in figure 2 of Rune’s post from Oct 2013
http://fractionalflow.com/2013/12/23/in-bakken-nd-it-is-now-mostly-about-mckenzie-county/#more-738
You should quit while you are behind, Village Idiot.
Rune and DC know what they are doing, while you have shown nothing except putting up sloppy numbers.
Hi Paul,
Thanks. Rune definitely has this right. I got off on the wrong track with breakeven price, it should be done with oil prices fixed over time. This is the way that Rune does it and it is standard practice in the oil industry.
I have updated my spreadsheet with the breakeven calculations (now done in the standard way) for the average Bakken well with a 30 year EUR of 330 kb, it is at the link below.
https://drive.google.com/file/d/0B4nArV09d398S3g3SWh5ZGxNU0E/view?usp=sharing
Perhaps people can learn something about how breakeven costs are calculated by looking at it.
Note that as Mr. Likvern has pointed out the initial spreadsheet I posted near the top of the comments is incorrect, and I appreciate Mr. Likvern correcting my errors, any continued mistakes are my own.
The difference between my result and that of Mr. Likvern in breakeven costs may be due to a difference in our estimates of the EUR of the average Bakken well, my estimate is 330 kb over 30 years, Mr. Likvern’s estimate may be lower.
If anyone sees glaring errors in the spreadsheet above, please let me know.
Hi all,
I said “breakeven costs” above on two occasions and should have said “breakeven oil price” instead.
https://www.dmr.nd.gov/oilgas/stats/historicalbakkenoilstats.pdf
2013 10th month, 27,288,299 barrels production. 880,268 daily production, 6656 wells.
2014 8th month, 33,095,890 barrels of oil, 1,067,609 each day, 8287 wells.
http://www.resilience.org/stories/2014-01-09/red-queen-update-in-bakken-nd-it-is-now-mostly-about-mckenzie-county
“For what it is worth the model estimated that total production from the producing wells (Bakken (ND)) as of October 2013 to October 2014 (year over year) would decline by 318 kb/d or 37%.”
The model constructed by Mr. Likvern.
What really happened?
Had the model been true, the amount of the daily production should have fallen precipitously. 880,288 minus the 317,000 reduction in production is 563,288 barrels of oil each day for those 6656 wells.
The total production adding the 1630 wells as you can see was 1,067,699 barrels each day.
Those 1630 wells did not produce 440,000 barrels of oil. It was more like 200,000 barrels each day.
All I am doing is using the numbers published by Mr. Likvern and comparing and contrasting those numbers to the actual production, which is well above the the constructed model from the material published at resilience.org.
That is all I did. I didn’t pull numbers out of the blue.
Obviously, the model was incorrect.
The facts tell a different story. They won’t budge.
Hi Village idiot,
Look at the average bakken well profile and realize that each month the output declines, you cannot calculate the output by taking the average yearly output and multiplying by the number of wells because the newest wells have very high output. Think of it this way, lets say the first month output is 15000 barrels, month 2, 12000b, month 3, 8800b, 7900b, 7200b, 6600b, 6100b, 5600b, 5300b, 5000 b, 4700b, and 4400b for month 12.
Now assume 133 wells are added each month.
In month 12 the output from these wells is 393 kb/d, this is pretty close to the 440 kb and I did not use the actual number of wells added each month, I just took 1600 and divided by 12 to get 133 per month. The model will not match output exactly as every well is not an average well, it is an estimate, we cannot make exact estimates of future output.
Spreadsheet at link below:
https://drive.google.com/file/d/0B4nArV09d398SDBZNERsbjdHRnc/view?usp=sharing
There were about 1600 wells added over 10 months so it should be 160 wells/month added rather than 133, also Rune estimated a 37% decline over 12 months rather than 10 months. I redid the spreadsheet with 160 wells per month, after 10 months the 1600 new wells added produce 424 kb/d in month 10.
Spreadsheet at link below:
https://drive.google.com/file/d/0B4nArV09d398cDNCX0hCcExfdFE/view?usp=sharing
For my model I get about 8% less of a field decline at 10 months vs 12 months, if Rune’s model is similar that would be 404 kb/d of decline after 10 months, so if the same applies to Rune’s model it is on the money, which I would expect.
”The average was 3994 in Aug of 2014. October of 2013 was 4100. The 6656 wells were producing 41oo barrels per month per well, the decline rate of those wells at 31 percent would have dropped those wells to an average of about 2900 barrels per month or 18,829,824 barrels for those 6656 wells in the month of August of this year.”
Prove your claim that the wells as of August 2013 did decline, as per your estimates, using actual NDIC data for the population of individual wells as of August 2013!
Have a look at figures 05 and 06 in my post because that is based upon individual actual well data from NDIC.
Apparently you do (as one among very few) not recognize the actual decline rates of LTO wells.
Village Idiot, there is one easy way to settle this:
Use your experiences, talents, knowledge etc. together with the NDIC actual well data and write a rebuttal of my article/estimates posted here. List all your assumptions and methods to facilitate transparency and facilitate third party verification.
Do this under your real name (which would be a manly thing to do!), forward it to the host of this blog, Ron (or any other site, media outlet of your choice).
Well, Mr. Likvern, it is difficult to see eye-to-eye.
I’ll use my real name. Now everybody knows.
Without a doubt, you do good work, but I just find it hard to agree when the numbers do tell a different story.
From now on, I’ll use my real name.
Ronald,
Have a thorough look at figure 05. That shows the production developments of wells by vintage and total production. Note how the production from all the wells as from the end of 2013 (steel gray area) declined and how wells added as of January 2014 (green area) and as of August 2014 both offset the decline from the pre 2014 wells and built production.
The figure is based upon actual individual well data from NDIC. (They are not estimates!)
My forecast on the decline was for the total population of wells as of October 2013 (assuming no additional wells added!) was done to illustrate the decline of the total population of wells as of Ocotber 2013 towards October 2014.
NOT to make a forecast for total production development for Bakken/Three Forks towards Ocotber 2014.
Hi Rune,
The average well profile is based on data, In Dec 2013 you did not know what future output from Nov 2013 to Oct 2014 would be so you estimated future output by assuming the output would follow a similar pattern of the well data you has at that date. It is the best way to estimate, and it is based on past data, but it is an estimate of the future.
And it is the best estimate I have seen.
Hi Ronald,
I am now confused, do you also post as the village idiot?
Ronald,
Also see my reply to the village idiot above. I explain some of this in an earlier post.
http://peakoilbarrel.com/oil-field-models-decline-rates-convolution/
As in: Village Idiot here: I will apologize for being an intolerant, pigheaded fool. I will raise my tolerances and settle for being a pigheaded fool. It’s the least I can do. The biggest room in the world is the room for improvement, so there is some hope.
Ronald Walter here:
Sometimes, charts I look at are what you get when you use a gas chromatograph using a known, you know what the results are going to be.
However, analysis like I read here is worth its weight in gold. A very rare commodity, takes its lumps, but never fails.
You’re not just winging it, the work here is topnotch.
I had to, wanted to, re-read Dennis Coyne’s analysis several times, seldom do I re-read, it is not worth the time.
To all here who have not been there, go to:
http://peakoilbarrel.com/oil-field-models-decline-rates-convolution/
I am not trying to find fault, cash in the faults like a book of S&H green stamps, be cynically critical, just trying to learn some more.
It is done here. Your eyes will be opened.
A ‘thank you’ is in order. I do expect the excellent work to continue.
Thanks Ronald.
It is Rune’s excellent work that started me on this journey, but I don’t always get it right.
Hi Ronald,
I responded to you above.
http://peakoilbarrel.com/debt-oil-price-bakken-red-queen/comment-page-1/#comment-421648
I also should mention that along with Rune Likvern, Paul Pukite (aka Webhubbletelescope) has done some interesting analysis on the Bakken, see
http://oilpeakclimate.blogspot.com/2013/05/updated-well-profile-for-north-dakota.html
and
http://theoilconundrum.blogspot.com/2012/07/bakken-dispersive-diffusion-oil.html
Paul also has a Bakken model at Context earth (last time I checked, it worked with Google Chrome, but not Internet Explorer).
http://216.160.43.30/context_bakken/navigate
No, it will remain Ronald Walter, but if you want, Village Idiot can be used, but ‘Ronald Walter’ will be who ‘says’ from now on.
If I refer to myself as Village Idiot, it will be only in the content of any comment I make.
I have long pondered the usefulness of credit in enhancing economic growth and in the end I have concluded that credit is very useful if borrowed money is spent on things that improve efficiency or productivity. Money spent on credit on new machinery or a better location or specialized training can usually be repaid profitably in a business environment. No surprise there at all of course.
But consumer credit is another animal altogether.In some instances it may actually enhance productivity depending on the circumstances of the individual consumer. There is no doubt that when my long gone Mom got an electric range so she could quit cooking on a wood fired range it enhanced her productivity more than enough to make the range a useful investment although it may have been bought on an installment plan at an outrageous rate of interest.A new car or truck if it enables a worker to reliably get to a distant but much better paying job on time may be a good investment.
But I am not able to come to a conclusion about credit when it is used to buy consumer goods that do not enhance the consumers earning power.
Lots of easy consumer credit certainly allows people to buy lots of stuff in the short term and maybe in the medium term – and this buying obviously must have a beneficial effect on putting people to work manufacturing and selling whatever the consumer is buying.This undoubtedly has a pump priming effect in terms of getting the economy up and rolling -at least temporarily.
But on the other hand I know plenty of people who have never bought anything or hardly anything in the line of a consumer good on credit and they in the end seem on average to be noticeably more prosperous than the folks with new cars, new electronic toys, big mortgages, and maxed out credit cards.There are certainly plenty of people who are CURRENTLY buying less than they would otherwise because they are paying a couple of thousand bucks annually in interest to the banksters on their plastic.These people are in deep economic doo doo if they suffer any significant earnings reductions.
It seems to me this risky excess consumption of everything from beer to McMansions is certainly in large part responsible for economic down turns because of undesirable positive feedback effects- which result in a period of growth topping out and a period of contraction following.
So- the question is does the pump priming effect outweigh the bad effects of too much credit? I conclude that in the short term it does but that in the long term a lot of consumer credit (including for big ticket items houses and cars etc ) is a blight on the economy.
This leads me to the question of too much credit pulling oil production and consumption into the present time thus not only reducing the amount of oil available in the future but also reducing the ability of the future consumer to pay for it.This argument which is basically the one Rune is making here today seems water tight to me.
BUT – and this is a big old but- I don’t think credit actually brings things into existence in any fundamental sense.It merely concentrates resources that already exist in particular times and places so as to result in a new mushroom patch of mcmansions for instance.The carpenters already exist, so do all the other workers and all the materials used in a very real sense.
Now if for some reason the mushroom patch of houses are not sold or if sold are not paid for then the people who loaned the money lose some or all of it.
BUT MONEY IS ONLY A CLAIM AGAINST REAL ASSETS.A hundred dollar bill is about as useless as the tits on a boar hog in and of itself but it is damned useful in filling up the fuel tank of my backhoe or buying a couple of hundred pounds of grass seed or a few bags of groceries.
Now my point is this- Money badly spent is money only and represents a loss only to the people who don’t get it back after loaning it out.The physical world of lumber and farm land and trucks and houses and so forth still exists.The net debt of the world truly is zero so far as I can tell. Every debt is SOMEBODY’s asset.
So – While bad debts may without a doubt bring about a lot of grief and hardship involving most or all people maybe in the end the debt simply doesn’t matter in any truly fundamental sense.Money not repaid may have been spent on frivolous purchases ranging from cosmetics or a cosmetics company to houses to far from jobs that are too costly to heat and cool and maintain so this sort of bad debt would be a real net loss to society-because such things consume real resources that could have been better utilized.
But other bad debts might actually result in infrastructure of lasting value being built.We may not actually have need of all the roads in this country and certainly would not need so many if we were more conservative in choosing places to live and in managing our personal affairs. But the roads – most of them any way- are going to be useful more or less indefinitely.
If this ramble does not make much sense it may well be because I am trying to get my head around an argument that just conceivably have some merit- that argument being that in the long run debt doesn’t really matter.I can’t quite close the circle but closure seems to be possible.
Debts have been extinguished many times in the past as the result of war, locally collapsing economies and inflation..The people and the physical world has continued right along.
I can’t see debt piling up forever but at the same time after trying hard to examine the debt elephant after the fashion of another blind man I can’t clearly see an end to the amount that can be piled up before the economy simply seizes up like an engine with no oil in it.
Maybe the people like Watcher who think the govt. can continue to prop up business as usual are right- at least for the short and medium term.
The BIG question then becomes one of how long fundamental economic problems can be papered over with printed money.Five more years? Ten ? Twenty? Or six more months?
Will a general default necessarily take place ? If so will it result in governments toppling right and left? War up to WWIII? Or will the various central banks manage to just gradually extinguish existing debt by inflating it away while still maintaining order and at least keeping the lights on and the water and sewers flowing and beans and bread in the markets?
The owners of this debt fall for discussion purposes into two convenient classes. One class is rich people and rich organizations such as big banks and insurance companies.The rich people can suffer a ninety percent loss without a meaningful reduction in their standard of living and so their problems don’t concern me at this moment.A busted insurance company might be a big problem if it can’t pay off on policies after a hurricane.
The other class of debt holders are the people themselves, the hundreds of millions and billions of us who are expecting to collect old age benefits and other such goodies that may well not be there for us. I took my SS benefit at 62 not because I couldn’t have gotten more over the rest of my life by waiting till 65 but rather because I thought a check in the bank spendable immediately was worth more than a bigger one that might not last out my lifetime..
“BUT MONEY IS ONLY A CLAIM AGAINST REAL ASSETS.”
This is what changed since 2009. It’s not. It’s not anything more than an essentially whimsical choice by central bankers, and it was not always thus.
It used to be what you somewhat think. It used to *reflect* the financial/economic well being or power of a given country. But not anymore. That stopped because rates went to zero and central banks lost that management tool. Now money is created to try to *define* (not reflect) the financial condition of a country.
Normalcy and rational approach is all gone, and it’s not coming back. We can’t really blame them because the circumstance was forced on them. But don’t think what you understood in the past still works. It is gone. Forever.
”It used to be what you somewhat think.”
I suppose I could have been a bit more careful in stating that money is only a claim against real assets and said ” theoretically a claim ” or something to that effect. I am not actually agreeing with you but simply trying to get my head around your argument that money is now irrelevant or mostly irrelevant. It has a certain amount of appeal but it just doesn’t quite add up so far as I can see.
I am not getting the circle to close. Printed money is just as good a claim on assets as any other money since the government is basically the source of all fiat money – the fed and banks are privately owned it is true but they are in this case silmantaneously the servants and the owners of government.
If you think you can turn down a printed dollar you are badly mistaken. The law says you will accept Uncle Sams dollars and if you refuse them you are out of business.And in the last analysis there is no way the person accepting a dollar can tell if it is one that was issued in good faith or just conjured out of thin air. They are indistinguishable once put into circulation.
My contention is that the more dollars are printed without offsetting economic growth the less the value of each existing dollar.This loss of value can be manifested in various ways. If for instance a given industry or class of people get a handout of printed dollars then that industry or group of people can buy more of whatever it needs or wants from steel and concrete to beer and potato chips.
This means in essence that every body else has to compete for a smaller share of the available steel and concrete or beer and chips. This may not actually be experienced by everybody else as rising prices because in a slow economy the price of steel and concrete should actually be falling at least a little or maybe a lot.Ditto beer and chips for that matter. Excess capacity should result in lower prices.
Nobody has made a coherent argument in my opinion that printed money does not enhance the purchasing power of the people who get it and that as a consequence every body else loses a bit of purchasing power. Actions result in reactions. Give a billion to a particular company or person and the other three hundred million of us probably in effect collectively lose three point three bucks in purchasing power each.Of course this three point three bucks is only an average. If I need a lot of steel my loss might be into the hundreds or thousands where as somebody who never buys steel may lose only pennies because some steel is used in just about every industry and we all buy stuff.Price changes in commodities are passed thru and borne by customers or ”eaten ” by suppliers.
Now the logical conclusion of the printed money argument is that while it may help maintain business as usual in the short or medium term excess printed money is like a habit forming drug and once hooked on such a drug the individual or society needs and wants more and more of it even as individual or societal productivity suffers. In the end the printed dollar will be worth essentially nothing if the habit cannot be broken. The price of bread has on some occasions gotten to the point that it took a bread bag of money to buy that same bag full of bread.
“I am not actually agreeing with you but simply trying to get my head around your argument that money is now irrelevant or mostly irrelevant. It has a certain amount of appeal but it just doesn’t quite add up so far as I can see.”
Of course it doesn’t add up. One sees what I just laid out — whimsical monetary policy intended to define country prospects rather than reflect a country’s economy — and then one goes to one’s portfolio and is forced to deal with money as if it truly meant something because it funds life.
The hypocrisy is forced on us. It wasn’t always like this. It wasn’t like this for decades upon decades of my life. It meant something at a personal level and at a macro theoretical level — mostly because the CBs had non zero interest rates with which they could go about their business of defining country prospects.
That was taken away from them and it revealed the meaninglessness of what goes on. And hey, this doesn’t mean anyone who understands swaps and deflation would refuse to do the same thing they are doing. They may have no choice. Richard Fischer, governor of the Dallas Fed and I think heir apparent to Yellen, recently said something like this:
“Oh, make no mistake here. We don’t know what is going to happen as a result of this asset buying we’ve done. It is entirely new territory. None of the smart guys we have on our staff who try to do econometric models has any idea what is going to happen from this money we’ve created. But it was forced on us so we proceeded. Conventional thought now is that the Fed failing to act is what made the Great Depression so bad. We tried to avoid that, but we do not know what the eventual price will be.”
There is no one “Money”. Writers such as Elgin Groseclose during the 30’s pointed out that money wore multiple hats. Are there not elements of oversimplification in some of the above posts? This Wikipedia entry is reasonable.
— “Money is any item or verifiable record that is generally accepted as payment for goods and services and repayment of debts in a particular country or socio-economic context.[1][2][3] The main functions of money are distinguished as: a medium of exchange; a unit of account; a store of value; and, perhaps, a standard of deferred payment.[4][5] Any item or verifiable record that fulfills these functions can be considered money.”
https://rbnenergy.com/stop-in-the-name-of-opec-why-u.s.-shale-crude-production-won-t-halt-overnight
Hey, I have just thrown this in as it is the current topic with Ron and RBNenergy. Same topic, 180 deg different conclusion. I believe RBN have dealt a few off the bottom of the deck with this post. Supporting industry I suppose. My vote is with Ron and Rune, but it is always interesting to get the alternate view point.
RBN’s staff has shaky credentials. It’s always worrisome when a credential is “has been writing about oil for xx years”. No mention of geology or petroleum engineering. Unless they upgraded.
The same question arises . . . the technology is decades old. If breakeven is so low (and btw it wasn’t in quotes 6 mos ago) then why did it need 2008’s prices before it got seriously underway? Why not in 2004 or 2005?
And why is there such a rush to the microphones now to announce such findings? They should have been known for years to compute profit margins for companies. These breakeven articles should have appeared at $110/barrel to show spectacular profit and attract money to equities. They didn’t. This is suspicious.
Oh, and one more item.
Weeks ago or maybe even months ago I went and looked up Moody’s rating on Continental and EOG’s issuance. Both were less than investment grade aka junk.
And they were that at one helluva lot higher oil price than now.
If these low breakeven points were legit and accurate, then how at $100+ does their issuance fail to achieve investment grade? Oh and let’s also note their debt is rising. They are not retiring the bond that funded the well when the well started flowing. Got to be a reason for that — and one possible reason is that the breakeven is not at these recently ballyhooed low levels. Those bonds would be getting retired hand over fist in the first year of production if it was possible.
Moody’s does this stuff for a living. They say it’s junk, and they said that at $100+.
I recall trying to check the equivalent S&P rating and Fitch too, but I failed for some reason. Probably got lazy.
A lot of the double-talk on breakeven is calculating completion spending only, as opposed to sunk costs. It might only be profitable at $82/bbl, but if you already spent most of that, you might as well get something and pay some of your bills, rather than defaulting outright and getting squat.
This is misdirection since the problem in shale oil is the decline rate and so you can’t go long without entirely new spending.
The correlations between economic growth and fossil fuel use are not nearly as deterministic as many here seem to believe. For instance, Rune’s post looking at “The Powers of Fossil Fuels” does show the scale of the substitution problem but I believe it simply brushes off the current market changes thereby ignoring exponential growth and the recent arrival of these techs to “cost parity” with fossil fuel. There is every reason to believe that exponential growth will continue. Wind is now the cheapest electricity generating source generally and solar is on pace to eclipse wind. The rate makes all the difference. Likewise, LED lights have doubled in efficiency in two years. They are now twice as efficient a CFLs and despite much longer lives, and preferred light are approaching CFLs on purchase price. Likewise, batteries will reach purchase price “cost parity” with petroleum combustion for light vehicle propulsion within roughly 5 years and they are already competitive with petroleum combustion for some uses as is shown by Tesla’s success in the high end of the light vehicle market and the Outlander or Leaf in the lower end. Looking solely at liquid fuels, technologies such algae oil were capable of $10 a gallon gasoline two years ago and yes, trucks, trains, planes and farm equipment can run on alcohols or bio based petroleum substitutes. (Coal to gasoline isn’t that expensive if the downside problem is that dire and as long as bio has an energy out to in greater than 1 it is effective. Heck, even if it is less than 1 if it turns a less valuable energy into a more valuable energy it is effective. We’ve been using land to grow flowers and wood for centuries. We can feed the world and still grow fuel.) And these are just the direct energy alternatives. There are many other opportunities such as car-pooling, biking, multi-use development, efficient home design, etc. In short, there are alternatives both in energy sources, use modes and efficiency opportunities. Economic growth without increasing fossil fuel consumption is easily possible, and, yes, the global economy can certainly adjust to petroleum declines without a dystopian apocalypse. The only question in the ability to do so is the time scale and cost. Most changes take time and as Rune correctly notes affordability matters. The affordability is improving dramatically but we need time.
Alternatives to fossil fuels are too expensive to sustain economic growth if you include all the costs. Also scalability is a problem.
And opprotunities such as biking or car-pooling, will be more widespread only if people become poorer. And if people become poorer there won’t be economic growth.
Quoute:”Likewise, LED lights have doubled in efficiency in two years. They are now twice as efficient a CFLs and despite much longer lives, and preferred light are approaching CFLs on purchase price.”
And still between year 2003, and 2013 worldwide electricity consumption grew by 37%. In just 10 years!
http://en.wikipedia.org/wiki/Khazzoom%E2%80%93Brookes_postulate
Stan,
Eventually renewables will be cheaper than oil. This is not in doubt. The issue becomes “at what price point does this transition occur” for the different services provided by different fossil fuels in different locations. Let us remember that storage is not yet viable on a large scale for many intermittent sources, and adds a significant cost both in financial and EROEI terms, and that many renewable energy sources presently piggyback on infrastructure which is only made possible through use of fossil fuel energy (distributed grids, long supply chains, communications systems etc).
The vast majority of infrastructure in developed economies was constructed assuming that energy would remain at roughly the same level of cost, or cheaper, and thus is only really viable at this level. If the price transition for renewables vs fossil fuels comes at too high a point, it seems likely that much of the infrastructure would become unviable. Presently I am unaware of plans to build mines, solar PV or wind turbine factories which are powered solely by renewables. This is the large challenge we face, and which I believe will be insurmountable due to the relatively low EROEI and low quality of energy delivered by renewable sources.
Biofuels represent a large waste, to me. When we eventually hit the downside of peak oil, we will need to use a lot more land to grow food than fuel, as global supply chains contract. The EROEI of biofuels is also around 1, so it has little benefits.
Coal to liquids in the US, and globally, will be hamstrung by both the huge infrastructure cost, as well as the extremely large amounts of water required for the process. It is unrealistic to expect anything other than a very small % of US oil consumption to be produced by CTL.
So when you say ” Economic growth without increasing fossil fuel consumption is easily possible”, I would respond that this is a very nice theory, and thus far an assertion which is unproven by experiment. I believe renewables have much to offer in terms of fossil fuel extension, and smoothing the inevitable energy decline, but we must be realistic about their actual potential to avoid making poor decisions which will harm us in the long run.
Hi Sam,
It seems that a combination of wind, solar and nuclear would work well. I agree that biofuels are probably a waste for now, though in the future biodiesel for air transport may be needed.
Have you ever seen the U Deleware study on renewables?
http://www.udel.edu/udaily/2013/dec/renewable-energy-121012.html
There is a link in the news release above for the full report (an excerpt below:)
The authors developed a computer model to consider 28 billion combinations of renewable energy sources and storage mechanisms, each tested over four years of historical hourly weather data and electricity demands. The model incorporated data from within a large regional grid called PJM Interconnection, which includes 13 states from New Jersey to Illinois and represents one-fifth of the United States’ total electric grid.
Unlike other studies, the model focused on minimizing costs instead of the traditional approach of matching generation to electricity use. The researchers found that generating more electricity than needed during average hours — in order to meet needs on high-demand but low-wind power hours — would be cheaper than storing excess power for later high demand.
Dennis,
It’s an interesting read, but my question would be where on earth are we going to find the spare money and energy to build out infrastructure sufficient to deliver about 2.5 times peak load, let alone the task of balancing such a grid with all the inherent fluctuations that such a setup would entail. I’m unsure just how practical such a setup would be
“…where on earth are we going to find the spare money and energy to build out infrastructure sufficient to deliver about 2.5 times peak load…”
Good question. The last two times I was in the States (Seattle area and NY) I drove along some terrible highways (Seattle) and saw a lot of bridges that looked about ready to collapse (NY). Besides, the subway in NY is looking pretty long in the tooth: This is super-rich America! I would have thought these are rather important infrastructure issues.
Hi Sam,
The 2.5 times peak is installed capacity, the wind rarely blows everywhere at the same time, there would be some backup with natural gas and excess can either be stored in batteries, fuel cells, electric car batteries or simply dumped to ground. When widely dispersed the fluctuations balance out to some degree and day ahead weather forecasts would give the power companies some idea of likely wind output. Remember that the load fluctuates as well and the grid is able to deal with it, this would add another variable, but with modern technology I doubt it is beyond our reach. There is already a lot of capacity in the grid, if needed it can be expanded.
Dennis,
I understand what the paper is getting at in terms of installed capacity. More my point is that there would be a very large build out associated with their reference plan, which would only supply power 90-99% of the time. Given the scale of the build out that this would entail, plus infrastructure duplication, and the complexity it would introduce I find myself wondering whether it would be feasible or a sensible use of resources, and whether lowering our expectations might be more profitable in the long run.
Hi Sam
costs will come down for wind so that electricity costs would be lower with wind.
the 90% of hours is 99% of total load. Backup can be handled by natural gas or nuclear.
If the price transition for renewables vs fossil fuels comes at too high a point, it seems likely that much of the infrastructure would become unviable.
Solar for electricity is at price parity compared to fossil fuels right now. Look what Bloomberg has to say…
While You Were Getting Worked Up Over Oil Prices, This Just Happened to Solar
http://www.bloomberg.com/news/2014-10-29/while-you-were-getting-worked-up-over-oil-prices-this-just-happened-to-solar.html
Sam,
Certainly renewables are already “cheaper than oil”. Utility prices in the few remaining areas that generate electricity from burning oil proves this. The question then becomes, when will renewables be cheaper than coal, and natural gas? I suspect that time is soon upon us. At least one investment bank has downgraded utilities because of this fact. I believe that gas shares fell quickly after Edison’s light bulb was developed, as well. Another “disruptive” technology.
http://blogs.barrons.com/incomeinvesting/2014/05/23/barclays-downgrades-electric-utility-bonds-sees-viable-solar-competition/
With regards to “the down side of peak oil”, that time may be soon upon us as well. And is manifesting itself as an ever declining oil price, in the face of competition from alternatives.
A transition to renewables through substitution for fossil fuels will require massive debt financing.
How should this be accomplished as it is the total global debt load that now makes the growth slow?
Solving a massive debt problem with more debt?
Many promoters of renewables just want to promote continued economic growth through other means of harvesting energy. This fails to recognize the powers of the fossil fuels stocks which has allowed for energy on demand 24/365.
”The affordability is improving dramatically but we need time.”
The income for most western households has been in decline for years, so how is that a sign of improved affordability?
We have bought and still is buying ourselves time through the financial system and has that time been used to prepare for a massive scale of transitioning societies to other systems for energy supplies?
Perpetually too much talk about US and Europe behaviors.
CHINA IS EXPLODING CONSUMPTION OF OIL. They will hit 11 mbpd for 2014 and they are NOT SLOWING DOWN, nor would you if you had 1.2 billion people trying to elevate GDP.
You guys want to peddle this renewable this and renewable that then take weapons to China and force them to do it at gunpoint. The Chinese govt has issues “goals” that sound ever so pleasant but the oil consumption continues up and they buy 21 million cars a year with less than 0.5% electric.
Besides which sportsfans, you don’t get GDP by obsessing over what kind of lightbulb you turn on. You get GDP by hauling stuff.
Hi Rune,
This is exactly the thinking in the US early in the Great Depression, the problem was debt, we needed to tighten out belts, have you ever read Keynes? The problem is not too much debt at present, it is government austerity in the US and Europe that is the problem. Note that all the monetary stimulus in the world will not restart an economy when we reach the zero lower bound for interest rates, it is like pushing on a string.
Fiscal policy is what is needed, spending on light rail, and grid upgrades and possibly tax incentives for rail expansion and wind and nuclear would be best. Anything would help, we could improve roads and bridges or spend more on weapons. The key is not to create more money, it is to spend more money, preferably on productive assets.
Dennis,
The problem is not letting bad debt default and instead taking it onto the public balance sheet. Debt represents future obligations that, at this point, cannot be met. The sooner we recognize this and act on it the better.
In order for the government to spend money it must tax existing money or create new money through borrowing. Borrowing of course just digs a deeper hole. There are various ways to deleverage depending on how society wants to spread the pain but mindlessly adding to the pile of debt and future obligations is not the answer.
Hi Woody,
It is not done mindlessly, read the General Theory of Employment, Interest, and Money by John Maynard Keynes.
Government debt is the appropriate response to a severe recession, mild recessions can be handled with monetary policy.
Dennis,
Here’s the thing, this isn’t a severe recession. We have primed the pump too many times with borrowed money and covered it by progressively lowering interest rates. We are now at the point that even with 0% interest rates, the pump can’t be primed.
What is left is default. This can be done through bankruptcies and defaulting on loans, reducing future obligations, and/or monetizing debt. The least painful path is probably some of each.
I agree with you in that it does require a fiscal policy rather than relying solely on monetary policy.
Learn how swaps have forced governments to disallow defaults.
Dennis
Many advocates of mmt ( modern monetary theory) kind of side with you on this issue, at least regarding government debt. However their assumptions only work where money availability is the sole binding constraint on things, and by increasing money supply sufficient real resources can be brought to bear such that unemployment etc is removed.
If we are in a situation where availability of resources such as energy or water is a binding constraint then the approach you describe may not work.
Sam,
Good point. We are well past the point of diminishing returns. Manufacturing and worker productivity increases no longer make up for resource depletion so productivity has been declining in many areas for quite awhile. Debt has masked the effect for the last couple decades but 0% interest is telling us that the free lunch is over.
Sam,
You are correct that when we reach the point that there are hard resource constraints, no expansion of fiscal policy or monetary policy will help.
Do you think that energy resources are currently a hard constraint?
As fossil resources deplete and the price of fossil energy resources increase, more wind, solar and nuclear energy will be used and will be substituted for fossil fuel. Ugo Bardi raises the problem that all mineral resources are becoming depleted, again as this happens, the price of these resources will rise and more minerals will be recycled rather than deposited in landfills.
Does this mean that there are no limits, that we can expand to infinity and beyond. No.
Population will peak and decline, fewer resources will be needed as population declines to sustainable levels. Recycling, efficiency in resource use, the use of wind, solar and nuclear and birth control will enable things to continue for a while.
Three years of gasoline cost (at current prices) for an average gasoline car will pay for solar panels to power an electric car for the same number of miles per year for the rest of your life.
So we can pay off that loan pretty fast.
”We can feed the world and still grow fuel.”
I follow the lead of professionals on the technicalities of the oil industry and never contradict the geologists or drillers or engineers who comment on sites such as this one unless I think they are fibbing due to having skin in the game.
I have a profession of my own and I generally hold very much to the mainstream views of the people in it.
Now there are plenty of farmers and professional agriculturists of various stripes some of whom do seriously believe we can ” grow fuel” -people who don’t know any better- and some who are perfectly willing to lie about it due to having skin in the game.
We can grow SOME fuel. We could grow enough to supply our own on the farm needs and maybe enough more to fuel up the trucks needed to haul our production to market but there is not a snowball’s chance in hell that we can grow fuel enough to support Business As Usual and the pros in the field who are willing to tell the truth are pretty much in agreement on this being a solid rock fact.
Agriculture as it stands already is totally dependent on the oil industry.Farmers collectively the world over will be lucky indeed if they can put their hands on enough diesel and fertilizer etc in the future to maintain production let alone increase it by orders of magnitude.
Totally agree with every word. Although I know screw all about agriculture I travel a lot. And where I’ve traveled I have seen good agricultural land being destroyed at every turn: turned into desert, covered with asphalt, turned into something else (golf courses, strip mines, topsoil simply blown away, housing developments). One might ask, how much farm land is disappearing owing to depletion of groundwater reserves around the world? Meanwhile we’re busy adding a couple of billion people to the planet who will all have to eat — or starve!
Didn’t mean to be Anonymous Mac.
They gotta do more than eat. If they want decent lives, they gotta burn oil.
Yo, farmerguy, talk to us about heirloom seeds and Monsanto. A shutdown scenario is very very very month dependent. Shut down oil in early November and harvests are already completed and in a silo or something and THAT community won’t starve that winter. Shut it down in July and you can’t harvest and they die.
What about the November shut down (and it stays shut down, of course) for that farming community and here comes April and they are going to have to use horses to try to keep THAT community going, but is that possible without a Monsanto shipment?
The real threat to our future is peak water
http://www.theguardian.com/global-development/2013/jul/06/water-supplies-shrinking-threat-to-food
“The bottom line is that water constraints – augmented by soil erosion, the loss of cropland to nonfarm uses, a plateauing of yields in major producing areas, and climate change – are making it more difficult to expand world food production. The question raised is this: Is it conceivable that the negative influences on future food production could one day offset the positive ones, leading to a cessation in the world grain harvest?”
Given that I am not a world traveler it is impossible for me to personally say how fast we are losing cropland to erosion, salt accumulation, development , desertification, and the depletion of aquifers and Sky Daddy alone knows what else .But everything I read indicates we are indeed losing it pretty fast.
My seat of the pants guess is that we probably could feed the world population for a few more decades- maybe even until it peaks- using modern industrial techniques IF the ESSENTIAL inputs were available and affordable in sufficient quantities.But it appears that while there MIGHT be ENOUGH land there may well not be enough water in the places it is most needed for irrigation.Water supplies are iffy to an unpredictable degree due to climate change and ordinary weather variability as well as development.
There may well be some water wars as well as oil wars fought within the next few decades.
A die off of a substantial part of our species before 2100 is in my opinion virtually baked in. The technical ability to produce enough food to feed another three or four billion people is not the same thing at all as actually doing it.Somebody is going to have to pay when the inevitable short crop year happens and the people who are unable to pay are probably going to starve in substantial numbers given the size of the potential shortfall in food production in a bad year.
I just don’t see us Yankees giving up hamburger and steak and eating bread so the grain we feed to livestock can be diverted to feeding people on the scale that would be necessary.
When I was a young guy we were plagued with excess carry over of grain from one year to the next. I can’t even remember the last time I read anything about a big carry over crop although there may be more corn to carry over this year than usual in recent times.
One very real reason we have been able to avoid widespread famines in recent times has been more the ability to transport food long distances in vast quantities than higher yields- because the modern industrial production system is quite as prone to a bad year as the old traditional methods.A drought can wipe out Iowa or Nebraska farmers any given year just as surely as it can wipe out farmer in Africa.
Without substantial carry over if there is a really bad year globally there simply is not going to be enough food to go around even if the means can be found to pay for it.
Such a bad year on a global basis is sure to come sooner or later and it may well come a lot sooner given the ominous nature of recent weather and the number of globe trotting tourists. One day one of them is going to inadvertently bring home a new pest that will wipe out a major staple crop.
The woods around my part of the world used to be dominated by the American chestnut tree which was one of the most useful trees in the entire world, producing a bountiful regular crop of excellent large nuts and some of the highest quality of lumber ever made into houses and furniture.
They never got as big as some western species but there were plenty of specimens that got to be six to eight feet in diameter and tall and straight and sixty feet or more to the first limb sometimes.
An imported blight wiped them out in the space of less than a generation.
Farmerguy, you got any input on Monsanto and the oil shutoff scenario above?
If you are asking about a theoretical failure of the big ag companies such as Monsanto not delivering the seed we use these days I have no reason to think they will fail to deliver, any more than Exon and Chevron etc will fail to deliver the diesel.
If for some reason the hybrid and engineered seed were to be unavailable without substantial prior notice we would most definitely be up shit creek without a paddle.
There are in actual fact still plenty of sources of heirloom or traditional variety seed available but the actual supply available would probably not be even five percent of what would be needed to produce the years crop.And the only way five percent would be a realistic guess is assuming we could buy most of it from people who would ordinarily use that seed for as food for themselves and their own live stock.The poor farmers of the so called third world don’t necessarily love arrogant yankees.
But if the hybrid seed supply were to disappear over a period of three or four years then farmers who could initially put their hands on fifty bushels of traditional wheat or corn etc could be supplying their own seed within that three or four years.Conventional corn can easily yield over a hundred bushels per acre.
The total staple crop yield would fall off substantially using traditional seed varieties, perhaps as much as a third or maybe even half. It is very hard to say because there are so many variables and ways to tweak the production system I can’t even make a serious guess.. Whatever my grandfather got using conventional seed I could get half again more ( wild ass guess) due to other improvements in technique and inputs.
There is a zero chance of our growing a substantial amount of food using draft animals in the developed world in any short term or medium term scenario.
First off draft animals don’t even exist in significant numbers and while fifty bushels of conventional corn can be multiplied into 2500 to 5000 or more bushels of seed in twelve months fifty brood mares can only produce fifty colts in a year which then must grow up and be trained to harness which takes another year or two……
With the possible exception of a few Amish and back to the earth types and a handful of relics such as yours truly there isn’t even anybody left who knows how to train a horse. I suppose the last time I harnessed a horse to a plow myself was over forty years ago and even then it was to only plow up a tiny garden spot for old time’s sake and to remind the horse that the harness and plow still existed.
Horse era farming is out of the question. Totally. Even thinking about it is out of the question.Accomplishing it would require moving tens of millions of people onto the land, providing housing for them, training them to do the work, etc.
This country is well armed and it just ain’t gonna happen. The girls would use their spike heels as weapons before they would give up their urban and suburban lifestyles. God only knows what the men would do but a good account of Chairman Mao’s revolution would be a good place to start if you are looking for insight.
And for what it is worth- there are communities in places such as the southeast that produce a wide enough variety of food stuffs to supply local needs if the inputs remain available.
But the average guy who raises corn or wheat in the midwest or citrus in Florida or veggies in California would starve or die of malnutrition without a supermarket handy.
People who gross a million bucks running a commercial farm don’t have chicken coops or kitchen gardens or root cellars. They have checkbooks and cars and get their food at supermarkets.
If their wives are old school there might be a few tomato and pepper plants in corner of the back yard kept partly as a hobby and partly so as to have a really fresh tomato or pepper occasionally.
Otherwise if Momma is involved in growing things she drives the combine and runs the spreadsheets and applies for the loans.
She might have a very impressive flower garden given that there is plenty of room and all the equipment needed is on hand.She might even have a little vineyard and make few cases of wine as a sideline if the farm is located in wine country.
But growing food for personal use is no longer part of life on a farm except for the most down and out sort of farmer who is barely hanging on by working forty in town.
There are a few exceptions that prove this rule of course.I know of a few small farmers who produce a rather large variety of crops and manage to sell most of their production at retail thus bypassing the wholesale markets. That sort of rare individual actually eats a home grown meal once in a while.
If you enjoy it and have no better use for your time gardening and putting up food is an excellent strategy in terms of good health and economical living. But like everything else farming is subject to economies of scale.
It is a waste of time and resources growing your own food from a business point of view when you can earn the money to buy it in much greater variety a hell of a lot faster.
The only real reason I keep a small kitchen garden is habit and enjoyment. I can buy my food cheaper than I can grow it on such a small scale if I count my time as valuable.
Supermarket tomatoes aren’t as good as homegrown but on the other hand I can get tomatoes at the supermarket any day of the year. From a garden here mid June till mid October with the best of luck and usually very late June to early October.During the peak season I can get them at thirty cents a pound from a local commercial grower if I wanted to can some.
Interesting. I read through all of that, but it’s clear that you didn’t follow the scenario.
Oil cut off. Govt rations at first and that fails and then so do the govt(s). With no oil, you ship nothing. Forever.
The question is really about how common heirloom seeds are in farming communities. Not distribution nodes, because again, no shipping.
What happens DNA wise if a field planted with Monsanto last year now needs to be heirloom planted, and horses (there are lots in Wyoming) would be intended to feed just that community. Don’t think in terms of current production because it can’t be shipped anyway.
So . . . does a field planted in Monsanto seeds last year contaminate and sterilize heirloom seeds planted this year? Because if so, that community dies in year 2.
”does a field planted in Monsanto seeds last year contaminate and sterilize heirloom seeds planted this year? Because if so, that community dies in year 2.”
Very little in the line of crops harvested remains on or in the ground in the form of viable seed from year to year.Not much is missed by modern harvesting machinery and nearly all that is left behind will rot or be eaten by various bugs and birds etc. Beyond that the amount that did sprout and survive would be minuscule in terms of the amount of seed planted to grow the following crop.
There would be some interbreeding but not enough to matter a whole lot and the vast majority of harvested traditional variety would have little or nothing in the line of genes from the former hybrid or engineered crops planted in previous years.Hybrids and genetically engineered crops are like hot house flowers or race horses. They just can’t survive except in environments managed by the farmer.With the loss of outside inputs that management reverts to the old time system of the survival of the fittest.The first year you would see a lot of looking grains of corn here and there the second year hardly any and the third year the purge would be about over.
The real problem would be whether your hypothetical farmers could put their hands on any conventional seed in adequate quantity that first year. Most likely they could not- very little is produced because there is very little sale for it.
And while I have the old horse drawn plow that belonged to my maternal grandfather I doubt if more than one farmer out of a hundred these days possesses such a hand me down.
Now if you are in a situation where you have plenty of hybrid seed not intended for replanting and plant it anyway you will get a crop but it will fall far short of the initial intended yield. But unless there is an inserted death gene the seed of hybrids are viable and most of them will sprout and grow and make SOMETHING. This something will sort itself out very rapidly in three or four generations in the field since survival of the fittest works pretty damned fast.In four or five generations you would have a more or less conventional line of corn as it reverted to self sustaining gene pool.
Remember the original rule that crops only grow under management. Cultivated corn will vanish in a landscape within three years except if the farmer is out there , conventional lineage or not.
Wild corn is not even recognizable as such except to experts. I wouldn’t be able to identify it myself without a book with pictures.It is a scrawny plant that looks more like the grass it is than corn as we know it.
Apple trees which are widely cultivated here where I live are not able to reproduce except with constant assistance. Even the oldest conventional trees that have been left around old house sites that have dropped thousands of apples with viable seed have died and vanished because a seedling apple can”t compete with the wild flora.Ya keep it hoed and keep the shade off or goodbye apple seedling.
The farmers themselves in your scenario MIGHT manage to grow enough food for themselves and their immediate families and neighbors but that would be about all if they were suddenly without purchased inputs.
A man on a thousand acre farm in the middle of wide open country without seed potatoes is not apt to get any unless they are delivered by truck.
More than likely he has nothing to work with that is not geared exclusively to the production of grain.I have my great grandfathers cradle handed down but nothing with which to grind flour or meal.I guess I could improvise something using a couple of rocks.
Never had any but I hear horse is pretty good eating.In a place with plenty of open country and plenty of cows the locals won’t starve unless the guvmint or raiders were to come and take the cows.
In the event something halted industrial agriculture dead in it’s tracks raiders would cease to be a problem within a year. They would either be the new owners or dead of starvation.Most westerners live within week of going without food. That is about how long the stocks on hand of food in stores would last.
If you ever suspect that the shit is in the fan and no mistake the best strategy would be to put your hands on a large truck IMMEDIATELY and hit the local farm supply assuming there is one nearby and buy everything in sight in the line of feed and fertilizer and seed and pesticides.High quality bagged dairy feeds and horse feeds etc will keep indefinitely and are jam-packed with minerals,calories and protein if not exactly what you are used to eating for breakfast.
There isn’t any point in going unless you get there before the rest of the community and store management figure out what is going on.
Anything that might stop industrial agriculture dead in it’s tracks will stop everything else as well including the grid and water and sewer systems.
Any survivors would have to be very lucky, tough,and resourceful —–and prepared to defend themselves first and not even worry about asking any questions later.
We are only a few emp bombs or a possible unprecedented (within the last hundred fifty years or so )in modern history giant solar storm of such a scenario.
So far as I have been able to find out nobody knows what the probability of such a storm is. All we know is that there hasn’t been one big enough to wipe out the grid since there has been a grid to wipe out.
Those interested can google the Carrington Event.
That’s all good perspective, and data.
That was my general impression too — that modern farming communities don’t keep heirloom seeds around.
I am surprised at your perspective on the “weakness” of the Monsanto variants. There were lawsuits Monsanto brought against farmers that did not use their seeds. Their fields were next to fields of farmers who WERE using their seeds. The pollen spread and the seeds from the non Monsanto crops became Monsanto like in their seeds for the following year. They didn’t need weeding or spraying. Monsanto sued and won. That non Monsanto farmer was getting the benefit of the Monsanto research expenditures.
It’s my understanding all Monsanto seeds are sterile. They all have the death gene?
Your thought that after 3 generations the Monsanto aspects of the seeds will be diluted away seems . . . at odds with the above. Or maybe not. Since they all only have 1 generation in them, they can’t last long enough to contaminate everything.
Still, personally, I’d be afraid to plant heirloom seeds where Monsanto used to be for a year or three. You might get away with it, too. Don’t need 5000 acres planted for just your small community.
And again, Farmerguy, month. If the fuel shutoff happens in November, community prospects differ a great deal from a shut off in July.
Old farmer mac, I hope you’re right about Monsanto vis-a-vis my concerns about ‘genetic pollution’.
For the past 4 summers or so, I have been studying wild edibles and medicinals, and by about now, might be able to survive, at least food-wise, hunting-and-gathering and ‘growing wild’ alone. I actually got into some mild trouble with a local town here when I decided to grow out the front lawn one summer to see what was growing wild so that I could create a wild-edible/medicinal garden around the house. It was worth it. What was growing? Off the top of my head; self-heal, speedwell, bedstraw, plantian, dandelion, hawkweed (and related species), wild carrot, fleabane, oxeye daisy, barberry, clovers, yellow wood sorrel, strawberry, yarrow, raspberry, and many others that I forget. This doesn’t include other plants found in the surrounding woods and on other people’s properties, such as wintergreen, sweetfern, autumn berry, cattail, ghost pipe, bunchberry, and on and on. And I have yet to touch on most of the trees, bushes and mushrooms… next summer.
We have a selection of nowhere near that nutritious and diversified a fare at the local corporate grocery stores.
…Too say nothing of no-till agro; vertical, food forest gardening; beekeeping; cider/beer/wine-making/distilling and communities that become true communities again.
I am also willing to eat arthropods, which are actually very good for you and many people around the world already do. Maybe some of them taste like the other arthropods, the crustaceans, like crab or crayfish. Maybe they could be added, for example, along with a yellow wood-sorrel garnish (nice lemony taste), and seasalt-roasted, to the top of a wild petite salade for a nice complimentary crunch. Yum! ^u^
Oh yes, almost forgot; I may have eaten horse, if it is also called something like, ‘chevaline’ (French?). If so, it is like beef only stronger. I made a spaghetti meat sauce with it.
The wild edible stuff, have you performed a computation of calories/acre and how long does it last into winter?
“The wild edible stuff, have you performed a computation of calories/acre and how long does it last into winter?” ~ Watcher
Mu.
“The word… is used fancifully in discussions of symbolic logic, particularly Gödel’s incompleteness theorems, to indicate a question whose ‘answer’ is to un-ask the question, indicate the question is fundamentally flawed, or reject the premise that a dualistic answer can or will be given.
‘Mu’ may be used similarly to ‘N/A’ or ‘not applicable’, a term often used to indicate the question cannot be answered because the conditions of the question do not match the reality. A layperson’s example of this concept is often invoked by the loaded question ‘Have you stopped beating your wife?’ to which ‘mu’ would be the only respectable response.” ~ Wikipedia
‘u^
My friend went on a taekwondo tour of North Korea last year. He took a photo of 5 men pulling a plow. Everybody was nice there. He placed a bottle of jack Daniels on the founder of taekwondo’ grave.
Sacrilege.
It should have been a bottle of some kind of unprofit stuff, like moonshine or cider.
(I would have sneaked back and taken the offending JD bottle, hide its contents in my belly, scraped the logo off, cleaned and washed the bottle, and, arms outstretched holding said bottle, placed it back on the grave with a genuflect.)
OFM,
They’re getting ready to plant out a hybrid chestnut that resists the fungus. It’s being put through all the tests of all the Federal agencies.
It’s taken a long time, but it appears they’ve finally done it.
Mac, (and other posters)
We aren’t commercial farmers by any means (and never will be), but my wife and I save all our own seed and rarely buy any except for a few hybrids. I have been using the same garlic stock for 35 years and grow enough for about 10 families and still throw lots away. We use the same tomato, cukes, lettuce, potatoes, etc year after year. We usually grow way too many spuds which we could ultimately live on if we had to. I had a christmas tree plantation on about 8 acres and have finally finished thinning them so they will one day be excellent saw logs or firewood. For now we have 12 acres in woodlot with some fir, cedar, and balsam up to 3′ diameter. 6 of the acres are in good sized alder which we laughingly call ‘summer wood’ as we prefer to burn fir or hemlock. The rest is elk pasture, as I try and entice them into full time residence by creating an elk friendly habitat with a good browse and grazing. My point is that in moderate climates a few acres would support a good sized family. For those living urban I would imagine food will become extremely expensive if the industrial ag model falters. Maybe people will have to use ration cards and line up for most things as per USSR. Who knows? Everyone puts down modern ag as being terrible in all ways, but unless a person actually grows their own food and understands the labour and effort involved they should never put down the modern food industry. People bitch about it, but grocery store food is cheap cheap cheap compared to the time and effort inherent in home production.
My relatives were farmers and except for a few with dairy quota they never made any money to speak of. They always had town jobs to support the farm. I used to make a few thousand a year with my christmas trees, but hauled them into town on my way to work so there was no extra transport cost. When I quit formal employment the trees didn’t pay for the effort and were simply a hassle. As for using horses? Forget about it. They are beautiful to look at but all consuming and expensive to own. I simply don’t have the skills or pasture. Besides, the elk around here get the hay we would need. I would rather dig the crops in by hand than use horses, and would walk/bike/row before using them for transport.
I’ll pay easy $20/gal for gas if it allows me to keep my chainsaw and tiller running. (We use a BCS walk-behind, a Belarus Titan, and a Mantis) I’d pay $50 per gallon. I might ditch the lawnmower and get sheep again, or use a chicken tractor to keep the grass down but would pay almost anything for a little unleaded regular.
Enjoyed reading the analysis this entire post…all 200+. Thank you, all.
Paulo
Solar horse
http://www.solarcarandtractor.com/*/Golf_Cart.html
http://www.cnbc.com/id/102163020#.
This article has an OPEC oil minister talking bullshit about speculators controlling oil prices.I occasionally disagree with our fine host Ron but usually only as a matter of degree.
Ron is dead center in the ten ring about oil prices being determined by fundamentals ( including politics in my estimation ) and not by speculators. Prices are ALWAYS determined by supply and demand in the most basic sense. Fear or optimism or pessimism can run up demand or reduce demand temporarily. Government policies such as rationing can reduce supply while silmantaneously maintaining a low price except for what ever oil finds its way into the black market at higher price of course.
But in the end the final customer will buy as much as he wants or needs at the prevailing price. If he can’t afford that price he simply cuts back.
For a speculator to control the price of any commodity he must have control of either the SUPPLY or the DISTRIBUTION of that commodity.
Nobody who talks about speculators in the oil industry controlling the price of crude or diesel or gasoline is ever able to point a finger at some particular person or company and say THERE IS YOUR SPECULATOR.
The reason for that is very simple. The only people and companies with the ability to control oil supplies either crude or refined product are the people actually in the oil industry.Calling out OPEC as a ”speculator” would look just a little too ridiculous even to the people who believe in speculators.
Nobody will accuse Putin and company of being speculators in oil and gas if they cut deliveries for any reason.Everybody knows that the Russian government controls Russian industries and that therefore Putin can act as the defacto OWNER of the Russian energy industries.
I am not argueing that a speculator can never gain temporary control of a local market for a given commodity. If there is only enough fuel oil in a given country to meet the demand for the next few weeks and one company manages to get control of the supply it can temporarily at least run up the price since the customer must have heating oil.
But taken all the way around talk about speculators controlling the price of oil is purely and simply the result of ignorance.
Even the producers and sellers cannot control the price except in places where there is a government operated or at least government tolerated monopoly in supply and distribution.
Gasoline doesn’t sell dirt cheap in Venezuela because the national oil company WANTS to give it away.
Nobody I know of has ever accused the Venezuelan government of being an ”oil speculator”.
More oil is coming to market right now than the world wide consumer has been able and willing to buy at the recently higher prevailing price and that is why prices are falling.
No further explanation is necessary.
Occam’s Razor is not ALWAYS the very best tool to cut thru a knot of misunderstanding but it is always the first one a well informed person reaches for.
I have lost a lot of casual friendships by pointing out that if three and four dollar gasoline is the result of oil companies holding back that they would have been holding it back when it was thirty cents and getting a dollar.
Citi group have just released a report on shale oil and the US’s energy position. It’s an interesting read, coming to markedly different conclusions than here. It’s available here:
https://ir.citi.com/rBWYa6YM4Scr4LsmpuQB8DZubx61JU8NqGw5jsCxMMfxMRxBp4u4gwbWrQgfNlfhzMSpx1Jv3qA%3D
I’m not a finance guy, so I’d be interested if anyone could pick apart where their assumptions might differ from Rune’s.
You don’t need to pick things apart. Citi wants assets under management. You don’t attract those with doom and gloom.
Hi Sam,
Looking only at the Bakken and Eagle Ford estimates from the citi report, it looks like they believe the sweet spots are uniform throughout all of the Bakken/Three Forks and Eagle Ford, the EIA realizes this is not the case. A simple exercise is to look at the Bakken scenario I showed above which uses the USGS mean estimate from 2013 as a starting point and then applies economic assumptions to estimate an ERR (economically recoverable resource) to 2040 of 7.6 Gb, note that scenario assumed oil prices would rise from about $75/b today at a 1.8% annual rate until 2040.
If we assume new well EUR remains at 320 kb until 2030 (no decrease in new well productivity over time). we get the scenario in the chart below. I do not think such a scenario is likely.
An alternative scenario where EUR decreases starting in June 2015 reaching a maximum rate of decrease in Dec 2015 of 7% per year (same as my first scenario with ERR of 7.6 Gb). Two new assumptions: well cost $9 million (it was $10 million in the 7.6 Gb scenario), and real oil price is constant at $80/b (2014$).
The ERR falls to 4 Gb and peak output is in 2015 with a rapid fall in output and no new wells added after April 2017 (total wells producing is 12,900 wells at most).
Forgot to mention that the point is that oil prices make a big difference in future output as do assumptions about if and when new well EUR(estimated ultimate recovery) starts to decrease.
There is not much question about the “if”, new well EUR will decrease at some point in the future.
When this will happen and what the rate of decrease will be are big questions, any answers are highly speculative. I use the USGS estimate of technically recoverable resources to constrain my guess. If one assumes the EUR decrease will be soon (June 2015), the rate of EUR decrease can be moderate (7% per year) and conform to the USGS 9.6 Gb TRR estimate.
If one assumes the EUR decrease begins in June 2017, the rate of EUR decrease
would be steeper at 9.7% per year.
There is no way to know in advance when this decrease in new well EUR will begin.
Thanks, Dennis
Thought it would be something like that.
You can normally make money shorting Citi’s forecasts.
Working natural gas in storage ended October at 3,571 billion cubic feet (Bcf), a record increase of 2,734 Bcf during the April 1 to October 31 injection season, and within 7% of the average of the last five end-of-season storage levels. While end-October natural gas stocks are at a five-year low, increased natural gas production, which has reached an all-time high, and new pipeline projects will help meet winter natural gas demand.
From the EIA
Watcher,
Natural gas production is subsidized by high oil prices. Take CHK – the biggest producer in the Marcellus area – where oil provides just one sixth of production (10 mb per month versus a total of 66mb), yet nearly half of revenue. As oil plunged CHK has currently no profit and has to curtail production significantly. Oil and natural gas prices moved in tandem over decades, yet during the last few years the correlation turned inverse. Natural gas has already reacted to the fall of oil by rising strongly. If the oil prices falls further, natural gas can go much higher especially under the recent scenario of a returning polar vortex.
AND THE MADNESS CONTINUES….LOL
Greenspan’s Stunning Admission: “Gold Is Currency; No Fiat Currency, Including the Dollar, Can Match It”
http://www.zerohedge.com/news/2014-11-07/greenspans-stunning-admission-gold-currency-no-fiat-currency-including-dollar-can-ma
TETT: Do you think that gold is currently a good investment?
GREENSPAN: Yes… Remember what we’re looking at. Gold is a currency. It is still, by all evidence, a premier currency. No fiat currency, including the dollar, can match it.
——–
Can you believe it? Greenspan said the two HORRIBLE FOUR letter words… FIAT & GOLD in the same sentence….LOL.
Again, on top of it, it he stated this at a recent CFR – Council of Foreign Relations meeting.
steve
Greenspan has dementia.
Gold and Economic Freedom
By Alan Greenspan, 1966
http://www.constitution.org/mon/greenspan_gold.htm
http://headlines.ransquawk.com/headlines/us-president-obama-authorizes-1-500-more-us-military-personnel-for-iraq-however-white-house-press-secretary-says-troops-will-not-be-in-combat-role-07-11-2014
Haha. There was a casualty just the other day. 1500 is a double, btw.
Test– I’m having some posting issues
Well, just discovered why I didn’t look at S&P’s and Fitch’s bond ratings for CLR and EOG. Requires a login to search. I think I have a Moody’s account.
Regardless, scrolled thru issuance by EOG. Wide variance in maturities, and that’s a heads up for Rune. Some of those bonds have near term maturities. They, of course, would do that to hold down their average interest rate (some of them were 6.9%). There is some 4ish% paper on the books but it looked like less than a year maturity. Average for the company was 4.8ish% — but that can’t be applied to Bakken wells because their primary focus is Eagle Ford, and it’s not really a meaningful number for the breakeven stuff.
The overall point is retiring bonds is not all that discretionary and they don’t have many years to carry them by choice vs early payoff.
Also, EOG pays a modest dividend, but CLR does not, nor does KOG.
The sh+t starts to hit the fan in US shale oil drilling (even according to Bloomberg):
http://www.bloomberg.com/news/2014-11-07/rigs-seeking-oil-in-u-s-drop-to-11-week-low.html
Went through that and was about to wave my hand at it per seasonal winter slowdown — but the count seems mostly in Texas. They don’t get cold for a while yet.
This looks real.
Looks like part of engineered contraction.
Paul Krugman says we can have continuing growth even while energy is declining:
Slow Steaming and the Supposed Limits to Growth
So where does the notion that energy is somehow special come from?
Got that? Energy is not special at all. All we have to do is become more efficient energy users.
Ugo Bardi says that is pure bullshit.
Paul Krugman and The Tortoise: Why the Limits to Growth Are Real
Professor Bardi makes a great argument, far better than I could make by just posting a clip from it. So I do hope you will take the time to read it.
Ugo Bardi is one man I really miss from the old TOD days.
I posted this reply in the comments section at the original site.
“”
Krugman is a an alpha priest in The Church of Eternal Growth who knows about as much about the realities of the physical sciences as my hound if you judge him by his public pronouncements. In reality he probably does know better and merely speaks with the forked tongue.
But we must admit that it is possible for the economy to continue to grow on less energy per unit of output for some time yet. How much longer is the more important immediate question.
The hard limits are there and we are probably pretty close to finding out where they are as of this decade or maybe the next.
Ugo Bardi will agree with me that there is still plenty of energy wasted and that we can squeeze a lot more utility out of our remaining fossil fuel resources for a few more years yet.
Changing the mind of the world about eternal growth is going to have to wait until energy and other resource shortages smack Joe SIxpack (- the man on the street-) and economists upside the head like a muggers brick.
Even then the economists will not change their minds anymore than a fervent Christian will change his mind about God being merciful while he watches his own innocent little kid die of some painful disease.
The Church of Eternal Growth has countless believers including many who hold prestigious positions at our best universities but it is still a church.
Having said all this it is technically conceivable that we can skinny thru the fossil fuel bottle neck and that renewables will save us.But the odds of our being so lucky are pretty slim in my opinion.My personal belief is that the technology ambulance we are counting on to get our collective butts to the energy and resource hospital is going to run out of gas a long way short of the emergency room entrance.The consequences are going to include resource wars and a very deep depression even in some currently rich countries that might just get worse and worse until things like personal automobiles are fond memories and even food is hard to come by.
But I don’t expect things to get this bad in the US and other similarly situated countries within the easily foreseeable future. We still have plenty of everything we MUST have to get along ok for quite some time yet- longer than I expect to live personally.When push comes to shove we are for better or worse capable of pushing and shoving to a greater degree than any other country and resources will flow in our direction so long as our economy is strong enough to maintain the military industrial complex.
A LARGE part of the developing world is going to turn into a hell hole before this century is out barring miraculous breakthroughs in renewable energy technology and deployment.
Realistic people do not pin their hopes on miracles.”
I was checking my logical brain at the door and reading some science fiction tome titles ‘Starship Century’, the book being a collection of essays and short sci fi stories from various authors, all attempting to show the reader the potential for the glorious star traveling future of humanity…like I said…escapist sci-fi.
I read this essay from Robert Zubrin (some of you may have heard of him and his book ‘The Case for Mars”…and my jaw dropped and stayed slack for a while.
I would like to call him delusional, but I will settle for flat-out wrong.
His core premises were:
– energy does not produce technology, but technology produces energy.
– the advancement of technology is proportional to the population level (more the merrier).
– standard of living per capital follows increases in technology.
-ergo, the more population, the greater the technology, the more energy produced, and the high the per capita standard of living.
– He ‘proves’ his case by showing us how much lower per capita standards of living were in the past, commensurate with the smaller populations!
– His fantasy is for humanity to become a ‘Type II’ civilization, commanding all the resources of the Solar System.
– He does some back of the envelope math, using the Apollo program and the amount money it took as a fraction of GDP, and extrapolates that in order for humanity to achieve Type II status the world will need more technology, more energy, and therefore will need to grow to as many as 30-50 Billion people to make that happen…all easy-cheesey (and good for the environment too) in his mind…then Humanity can take on the Challenge of Type III civilization (commanding the resources of the Galaxy), infinite growth, amen.
My head hurts…because I know people who otherwise seem superficially reasonable, who buy this load of dung.
Mac, you are right…it will take the sack up the side of the head with the muggers brick…and maybe not even that would dispel the need to believe…
I found an article from Zubrin online that is rather similar to his screed in Starship Century:
http://www.nationalreview.com/articles/281802/welcome-child-seven-billion-robert-zubrin
As an aside, I filled my tank for $$2.65 yesterday. With Keystone XL, maybe it will be $1.65! Or, maybe it will be $5.65 in three years…who knows?
At least LM Skunk Works will be riding over th hill on their white horses with ‘Mr. Fusion’ ready to mass-produce!
–
Sails!
It might be possible to build a fleet of sailing ships, much smaller in size by a factor of 5 or 10, increase the number of ships ten fold, you’ll save a lot of diesel fuel. A navy of nuclear powered submarines to protect them all.
Equip them with electronics, intelligent controls, a generator when something might go wrong, don’t want to lose one because you forgot the generator, solar arrays to generate electricity, some diesel fuel for the generator, turn them into robots with gps, you’ll be good to go.
Be a good use of resources and energy to build it all.
Sails, wind will do wonders to save a mountain of oil.
New jobs, new way of doing it all. Call me crazy.
Shining lights in the halls of Shang-ri la.
Sail’s biggest problem is refrigeration. Even on liveaboards.
Yeah, and I’d like to see a massive oil tanker, white sails aflutter, happily moving south along the BC Coast from Alaska, threading its way past rocks and between islands, Westerly onshore winds gusting to 100 knots. Of course I’ll never see it because it will NEVER happen. But why fret, North Slope oil will be gone before long No need for those tankers after-all — much less ones powered by wind.
Oh, I do think sail has a future. Rice has to go from Bali to Shanghai to feed the survivors, but the SWIFT network will have failed by then so paying for it will be dicey.
And, of course, the meteorology spacecraft require station keeping commands, and they won’t be issued, so ships will sail into hurricanes. Often.
The one percent have all of the babysitting coupons, the hoarders that they are, and the 99 percent have to babysit the one percent 100 percent of the time! The one percent are the biggest babies in the world, they cry all of the time.
Paul Krugman doesn’t know if he is afoot or horseback.
What Mr. Krugman failed to realize is that the coupon exchange in the babysitting co-op was really an indictment of a fiat system.
Economists are garden variety village idiots, they never get it right.
Gold at 1150 fiat dollars, coupons, oil at 80 buys more than 14 barrels of oil right now, the bargain of the century at the moment.
Gold is the real money on the table. Hint: leave the gold on the table and take the 14 barrels of oil, it’ll pay, the work you can do with the oil will be able to buy back the gold used to purchase the oil plus lots more, providing the oil is used appropriately.
Use pennies, zinc pennies with a tiny amount of copper on the top of the zinc.
100 pennies, one dollar, 115,000 of them buys an ounce of gold. They’ll contain 44 pounds of zinc. Do the math. A gallon of oil for a pound of zinc, more or less, if you include the slosh. It’ll work, but it is much harder to drag around 44 pounds of zinc rather than have an ounce of gold in your pocket. Wait a minute, 44 pounds of zinc worth 44 dollars is equal to an ounce of gold? Holy Smoke! Those zinc pennies are the way to go, keep the gold, use zinc pennies, you’ll keep the gold, buy the oil with 44 pounds of zinc and you’ll be buying oil at 44 dollars a barrel. Something is rotten in Denmark.
Eight thousand pennies buy a barrel of oil. The amount of energy you get from 8,000 pennies is the cat’s meow if you buy a barrel of oil with them. A 55 gallon barrel drum filled with cream.
A solid copper penny weighs 3.1 grams. Copper sells for three dollars for a pound. 27 pounds of copper is worth 81 dollars, a barrel of oil. 150 old copper pennies will weigh one pound plus. 27 times 150 equals 4050 pennies, all copper, it’ll buy a barrel of oil. If you pay for oil with all copper pennies, you’ll pay double for the oil if you fork over 8000 all copper pennies for it. You’re losing big time. Stick with zinc in poundage and by your barrel of oil for half the price. Hell, I don’t know. It gets so confusing, your brain explodes.
Fairly substantial price drop in terms of sheer numbers alone if you pay the real price, 4050 of all copper pennies. About half. That’s how it is right now. Keep the gold, keep the copper pennies, use zinc to buy the oil. Oh no, oil is going to fall to 44 dollars? Say it ain’t so.
Cognitive dissonance on display.
Metals are far better than 80 pieces of paper, fiat fail.
Nothing to see, so move along.
I made a gross error. Everybody makes mistakes. I have to correct the mistake.
It should be 633 lbs of zinc for an ounce of gold. Zinc on the CME is a dollar, so the gold will have a value of 633 dollars, not 44. 44 lbs for 8000 pennies, not 115000. too many numbers swirling around, didn’t take enough time to examine the numbers and correct the errors.
Please pass the crow and humble pie.
Still just over half of the asking price gold when there is 115,000 pennies to equal the value of an ounce of gold.
Yes Pauls article shows that he has not understood the problem. Nothing is more important than energy. Everything you want to do takes energy. Building, running and doing maintenance on ships also takes energy. He completely missed to take that into the equation. How slow can you go before the energy cost of using more ships get bigger than the save on fuel? Being more efficient is good. But it can only do som much.
Canola can yield 2500 lbs per acre, 3000 if it is a good crop. At 50 percent oil content, you’ll have 1250 lbs of oil after crushing, 6.2 lbs per gallon will yield 200 gallons of oil per acre. 1000 acres of canola will yield 200,000 gallons of canola oil.
1 million acres will yield 200 million gallons of canola. Just under 5 million barrels, in 4 months time, it will be there. Forget all auxiliary inputs, oil, fertilizers, pesticides, etc. for the moment.
10 million acres, 50 million barrels. 100 million acres, 500 million barrels. 40 million hectares, 4o million tons of canola oil.
One billion acres, 5 billion barrels of canola oil. It will take 300 trillion gallons of water to grow the canola to maturity. Might want to consider tapping Lake Baikal for some of the water you’ll need.
1 000 000 000/640=1,562,500 square miles of land to grow 5 billion barrels of canola oil. Half of the land area of the US to grow enough bio-oil to have a 71 day supply of oil, minus all of the oil used to complete the planting and harvesting of the crop, you’ll be working very hard to grow it, and all of the canola oil will be gone in no time at all. Machinery and labor costs will be astronomical. The resources required will be prohibitive.
times ten is 50 billion barrels. 50 000 000 000/70 000 000=714 days of supply. Ten billion acres, 15.6 million square miles of land,
The land surface of the earth is in the neighborhood of 58 million square miles. One third is desert. One quarter, mountains. All of the land available for habitation will have to be sacrificed.
Good luck getting the job done.
Might as well drill a hole in the ground and see if there is oil underneath it all. It is an extremely important commodity, the job to retrieve it is even more important. A piece of cake compared to what it will take to harvest bio-oil.
This line or two from the FT is worth a minute to ponder.
http://www.ft.com/cms/s/0/de459900-6664-11e4-8bf6-00144feabdc0.html#ixzz3IU3tTgrA
”One country to watch closely will be Venezuela. It needs an oil price of about $160 to balance its budget, the highest of any Opec member, and there has been speculation that it might be forced to default. A previous oil price slide helped Hugo Chávez come to power in 1998. The coming year is shaping up to be another test of Venezuela’s resilience.”
I posted an item from the WSJ a few days ago about shortages of basic food items in Venezuela. One anecdotal account is illustrative–A grandfather said he went to about 20 different stores trying (unsuccessfully) to find powdered milk for his grandchild.
Not sure what there is to test. Venezuela has hyperinflation already, a cold civil war and they can’t bond anything to coved the budget because they’re a loony socialist government that is already screaming default.
Venezuela is also the poster child for stupid policies killing theoretical production.
I suppose that the next step for Venezuela is to put restrictions on emigration, in order to keep their citizens (especially their most productive citizens) from fleeing the socialist workers’ paradise, following in the path of the Soviet Union, East Germany, North Korea, Cuba, etc.
Jeffrey J B,
That exodus has already occurred for Venezuela’s oil industry. Chavez brought that about; Colombia, for one, profited from the incoming expertise, and has a viable oil industry.
Ron and crew, Perhaps this is the start of the trend towards the lowering of LTO production. Courtesy of Bloonberg: Rigs targeting oil sank by 14 to 1,568 this week, the lowest since Aug. 22, Baker Hughes Inc. (BHI) said yesterday. The Eagle Ford shale formation in south Texas lost the most, dropping nine to 197. The nation’s oil rig count is down from a peak of 1,609 on Oct. 10. Every new beginning cones from some other beginning’s end? This beginning appears to lead slowly down the dirt road…. to Pa Ingall’s little spread! Short gasoline long corn, oats, mules and the droppings produced by said draft beast for fertilizer. So much for profitability at low prices? Press the stopwatch button. Tick Tock.
Meanwhile, over there:
CHINA TO ESTABLISH $40 BILLION SILK ROAD INFRASTRUCTURE FUND
https://ca.finance.yahoo.com/news/china-establish-40-billion-silk-road-infrastructure-fund-105119351–business.html
“China will contribute $40 billion to set up a Silk Road infrastructure fund to boost connectivity across Asia, President Xi Jinping announced on Saturday, the latest Chinese project to spread the largesse of its own economic growth.”
“ Xinhua said it would focus on China’s Silk Road Economic Belt and the 21st Century Maritime Silk Road initiative, which aim to build roads, railways, ports and airports across Central Asia and South Asia.”
“Last month, Xi unveiled the $50 billion China-backed Asian Infrastructure Investment Bank, seen as a challenge to the World Bank and Asian Development Bank, both multilateral lenders that count Washington and its allies as their biggest financial backers.”
Ahem.
And we sit back and let them burn oil that will inconvenience us someday.
Who cares, we don’t need oil and (gas & coal). We have all that endless magic energy to call upon don’t we? Well, after awhile perhaps. Truth is, in the past month I’ve been passed by thousands of huge trucks (all diesel), thousands of “small” trucks (gas and diesel), thousands of cars (mostly gas, some diesel), hundreds of Harley Davidson “Bikes” (all gas) and maybe one electric car, maybe but I really doubt it. Perhaps the leather clad bikers discuss converting their Hogs to electricity during their private clubhouse meetings. After all it would make them so much much quieter wouldn’t it? [am I supposed to add a yellow face here now?]
The fundamental problem with the electric people. They immerse themselves in delusion.
There is usually a political or ideology problem that gets in the way, too. A hatred of private gun ownership. But. . . those without them will be slaves, assuming they can offer anything of value in return for scarce calories.
Then the sequence of thought is . . . well I can’t bear to imagine that likelihood, so it won’t happen — but there is a discomfort knowing “it won’t happen” means BAU. Then THAT realization forces them to find a future that is some happy left wing medium of no guns, just enough food, but no, not BAU.
That’s evaluating things on the basis of preference, not probabilities.
Any body who constantly knocks the success of personal electrically powered ( read BEV) now is going to have to eat his words in ten years or so unless the economy has a heart attack before then.
Oil is down for the moment , true,but rust and depletion never sleep.Inflation only catnaps and the state is ever hungrier for revenue – read higher taxes on motor fuels. The higher taxes will pass when fewer people are driving and more are walking, biking and taking the bus.The population is growing.
Batteries are getting cheaper by about half every five years or so and the battery manufacturing industry – the part of it that manufactures big ones – is hardly out of diapers yet.
If the batteries hold up ok a battery electric car that is properly rustproofed will last just about a lifetime in terms of being cheaper to fix it that it is to buy a new one.
I am talking cheaper to buy and cheaper to run and longer lasting than an ice car.
The range limitation thing is just a matter of perception. The public will get over it in a hurry and people who are prosperous enough will own a second ice car for trips. Everybody will own the first one for the savings involved if money is an important consideration.
Look folks- this is a peak oil forum and we either believe in it or not.I personally believe in oil hitting a hundred forty or fifty bucks in a decade on an average annual basis. I believe higher taxes across the board are baked in.
I believe oil wars are baked in.
I believe in environmentalists making unholy whoopee with big businessmen.
The politics will get right when the next oil crisis hits and the politicians in power are determined to DO SOMETHING even if it is wrong to prove to the voters that they deserve to be reelected.Look for a bubble in wind and solar installations and the manufacture and sale of battery powered cars.
Anybody who believes it cannot happen should contemplate the ethanol bubble.
Unfortunately in some respects ( such as my own preferences) I will be too old to buy a new car and drive it in fifteen years if I am even still around.
dum de dum
http://www.greencarreports.com/news/1095200_elon-musk-vs-wards-a-sales-battle-tesla-brought-on-itself
“It all started when stock analysts circulating an estimate from auto-industry trade journal Ward’s Auto that Tesla’s U.S. sales were down 26 percent for the first nine months of 2014, compared to the same period in 2013.
It was covered in a Wall Street Journal story on the company’s new lower-cost leasing program, and Tesla’s stock price fell.
On Tuesday, Tesla Motors CEO Elon Musk took to Twitter, saying, “Article in WSJ re Tesla sales is incorrect. September was a record high WW [worldwide] and up 65% year-over-year in North America.”
. . .
Musk’s tweet was, of course, retweeted 800 times and favorited more than 1,100.
The same day, David Zoia of Ward’s appeared on CNBC to defend the estimate and its methodology.
Then the legions of Tesla faithful and Tesla doubters began to pile on.
In its most extreme retelling, this was either:
an example of a desperate CEO spinning a clear decline in his failing business of making a car that no one else will ever buy, or
yet another attempt by the Evil Auto Industry to discredit the revolutionary company and its rock-star CEO to keep the world in the greedy hands of Big Oil.”
I suspect that reporter won’t be working there much longer, but it is pretty cool that one can get serial number logs from I guess DMV to do sales estimates.
BTW notice how Wards (the industry standard data monitor) talked about the first 9 months of the year and Musk talked about September.
The electric vehicle I see the most often in Toulouse is the electric bicycle. I’m actually thinking of buying one for the wife.
Revolutions frequently start at the bottom.
Yes electric transport works best at the two extremes: extremely light personal transport and heavy grid connected Transit. And together: bikes and trains, you get extremely spatial and energy efficient urban transport for successful 21st C city economies.
Wait, what? That’s not extreme.
Extreme would be electric 43,000 horsepower engines for Maersk container ships, and btw, those ships require 2 such engines. Good luck with that.
For funsies
43,000 horsepower X 2 = 86,000 horsepower. 745 watts per horsepower.
64 megawatts. They go 20-25 knots and can go transPacific in 12 days. That’s maybe 7,000 miles. But 12 days is 12 days or 12 X 24 = 288 hours
And so, let’s see what a 64 X 288 = 18.432 Gigawatt-hour battery looks like.
First a conversion to joules. 18.4 gigawatts-hours appears to be 663 terajoules. That’s 663 X 10^6 megajoules.
Li Ion specific energy appears to be about 0.5 megajoules/Kg. So we would appear to need a battery of 1326 million Kg (*2.2) =
2662 million pounds or
1.33 million tons.
The new Triple E Maersk ships have an absolute max DWT of 200,000 tons. That’s including crew, passengers, cargo, fuel, water, and stores.
So, exciting! If you just leave all cargo and crew off the container ship, we’ll only be about X5 beyond what’s possible. And that’s not even examining dimensions to fit aboard.
BTW, it appears the next shift in fuel for ships is to LNG.
http://hhpinsight.com/
For cost as well as pollution. News regs come into force 2016, I think, concerning the amount of pollution is produced with in so many miles of the the coast. Basically, no heavy fuel oil. So expensive diesel (MGO), LNG, or all sorts of scrubbers for Heavy fuel oil.
Rig count talk in another subthread. First thought is winter. Second thought is Texas has a while yet to go for winter, so the decline is likely real.
A decline in Texas is interesting because as you note, no winter, and they are also supposed to have lower break-evens than North Dakota.
Watcher,
The current rig count is over 200 more than the same time last year and there are/were plans for this number to increase again next year. So even a stable number will mean a lowering of expectations.
I know it is awhile away yet, but a big telling point in Canada at least will be the the summer start up after the spring thaw. Basically Canada stops drilling during spring, and all new contracts start after the ground has hardened. If the price of oil stays low, then they will have a very steep decline in rig numbers.
In the US, the rigs that are currently working will be on a time base or number of wells based contracts. Either the oil company keeps drilling until the end of contract, or pays cancellation penalties to finish early. In 2008, oil companies were paying the cancellation penalties, hopefully this time things don’t get that bad.
2015 budgets will also be a big pivot point. The money for this year has already been allocated, but it will be much more difficult to get the finance people to part with their pennies, for any new rounds of spending.
Ya, good point. All those stories were were consuming 6 months ago from Total and Chevron and Exxon and RDS about how they were drastically reining in their capex for exploration work . . . what a coincidence.
Here is an interesting development…I wonder how this may affect U.S. Vehicle Miles Traveled (VMT) in the future, especially if more people get poorer, as I suspect may happen:
http://www.alternet.org/subprime-lending-car-buyers-fueling-bubble?paging=off¤t_page=1#bookmark
In a nutshell…more and more cars sold financed by subprime loans are being equipped with GPS-enabled kill switches that can be used by the lender to disable the car when the payment is late. The article says that about one quarter of all U.S. car loans are sub-prime, and that an increasing fraction of those loans are issued with the quid pro quo of the car being able to be remotely disabled.
The bonus deal (for someone, not the car owner) is that the borrower’s location can be tracked (and saved/shared with others?) all the time.
The kicker at the end of the article: This idea has become known to some in the landlord community, and thought is starting to be put to the idea of equipping apartments with remote control locks with which landlords can lock out renter who are late with their payment.
Perhaps lenders and landlords can get even more creative and equip houses with kill switches to cut off water, natural gas, electricity, and maybe even (gasp) cable TV and Internet if the renter misses a payment.
Now here’s a thought: if Vehicles of the near future can be equipped with biometric authentication devices to allow the owner to start and drive the car, then maybe folks will not be able to start any car if they do not have a license, or have an expired license. To take the idea further, if future cars can be equipped with sensors to ascertain whether the driver is under the influence of drugs or otherwise is mentally impaired enough to be dangerous behind the wheel, then the car would not start (or would turn its engine off mid-trip is such a situation is detected).
Funny thing is: These possibilities would reduce VMT significantly, all without anything to do with the availability/price of oil/gasoline/diesel.
23% is the historical subprime. Present sales are 34%. F150 series truck sales are booming.
Funny thing is…when more and more vehicles are equipped with an engine kill switch meant to be exercised by the creditors…what is stopping those switches from being used by other parties? …Also, if the vehicle owner is told that the switch has been disabled when he/she pays off the loan, how does he/she know that it is really off, and will stay off?
creditors, insurance companies, the DMV, the police, criminals, other entities…who will have or be granted or obtain the waveforms/protocols to access these switches?
I once had a modest loan with a credit union for a used car (just a few years ago)…then I received a letter from the CU partway into the loan term stating that their records indicated that I had dropped my insurance, and they were levying some terribly expensive third-party insurance (TPI) on my loan. Long story shortened, that was untrue (I have carried insurance paid-in-full every month since the distant time when I was sixteen)….I called, emailed, then went in person and revealed that my internet research revealed that their third-party insurer was under investigation in several states for colluding with financial institutions to scam hapless loan holders…I told the CU manager that I would march over to each TV station and the newspaper in town, call/write every national medial outlet, and drive to the state capitol and have an audience with the insurance commissioner and AG and end up owning a piece of their CU. The TPI was dropped from my loan immediately.
Moral of the story…don’t ever trust that business will be ethical dealing with you…and FSM help you when your future vehicle comes equipped with a radio-controlled, GPS-enabled tracking device and kill switch!
Then, of course, the day comes when your cruising through a complex eight lane cloverleaf at 100 clicks, surrounded by semis and lunatics trying to get in front of you (the bank has screwed up your payment transfer) and someone presses the kill switch for your car. Gives the word “kill” a new meaning: like carnage!
Whatcher current auto boom is a dead cat bounce. This is the last hurrah for big auto., in the west at least. History is littered with dominant businesses that look great until they don’t.
EVs for the top end will be a good biz but I doubt it will the same marques…. Remember Kodak? What did they make again?
Kodak didn’t need joules.
I do remember the buggy whip makers.
Same process at work. The 20th Century is dead, we just don’t know it yet.
Kodak didn’t die because film couldn’t be made anymore, and GM and Ford won’t die because the ICE engine no longer works… It just won’t ‘fit’ as well anymore, in the Darwinian sense.
Survival of the Fittest is misunderstood, it says nothing about strength, but refers to the organism which has the best ‘fit’ for its niche. The new better fit always looks weak, insubstantial, insignificant, till suddenly it takes over.
So it is now with the great electrical disrupters: PV, EV, and AV (autonomous vechicles: which will help kill the private car’s dominance).
Nothing to see here really, just the world inexorably moving on, blithely leaving new winners and losers in its wake. Boethius’s wheel: twas ever thus.
In my eight decades there have been few if any surprises greater than the demise of Eastman Kodak. Their x-ray film came in 100 sheet yellow boxes and were believed my many to be the best available, though there was on occasion competition from Fugi, DuPont and others. A century of research suggested that there was no satisfactory chemical substitute for silver in the photographic process. Digital photography and radiography were unexpected non-chemical substitutes. http://www.ajronline.org/doi/pdf/10.2214/ajr.131.5.926
And a Kodak employee wrote the first alogorithim for digital capture! The very tech that killed the giant.
There are more big wipe outs coming. Private cars per capita in the west have already peaked but the decline has only just started. Don’t know how long it will take take but we won’t own them soon, we’ll just share a whole lot fewer of them.
Autodependent suburbia is a value loosing proposition too. Get out while there are still fools willing to buy in….
I certainly agree that suburbia is not a great place to invest one’s money from here on out but the death of suburbia has been greatly exaggerated.
We hear about the value of tech companies being into the trillions but if they were all bankrupted there would be new ones to take their place within a few months doing the same jobs as well or better. The core of each and every one’s existence is largely based on nothing more than patents and getting the early lead in some new niche. If either APPLE or Microsoft went to a penny a share we would still not have any problems at all buying and using computers.
Now suburbia was built with a different kind of resources and cannot be replaced.All the talk about moving back into the city is mostly just bullshit- hardly anybody percentage wise wants to do so and hardly anybody percentage wise can AFFORD to move to a desirable location in most cities.Affordable decent housing in desirable city neighborhoods is not quite as scarce as chicken teeth but close.
I have lived in a city center and visited the Big Apple enough times to know what that sort of environment is like. It’s ok for those with a taste for it and it is energy efficient for sure to live in such a place.
But we have barely scratched the surface of the potential for energy efficiency in suburban living.
Given the stakes involved we are going to give up our figurative pointy stick efficiency tools pretty soon and get in there with a big diesel tractor and do some serious plowing.
The typical suburbanite places a VERY HIGH value on having a certain minimum amount of privacy and outside space to call his own as well as plenty of square footage inside his or her home and has made a huge investment in obtaining it.This investment typically runs anywhere from a hundred thousand to half a million bucks probably with as many more above the half million mark as there are below it.
Hardly anybody is going to walk away from such a huge three dimensional ” concrete ” investment. There is no ready generic replacement available in any shape or form.
The law people who lives in such houses will do what they have to to stay there and doing it will be substantially cheaper and easier than walking away from a six figure loss and into a non existent down town apartment.
The math is pretty damned simple and pretty damned compelling. Three hundred grand house too much money spent on energy.
Spend fifty or sixty grand on the house on energy conservation upgrades and some renewables which are getting cheaper fast and another thirty or forty on a really fuel efficient car.
The total monthly bill on this solution will be less than the monthly bill involved in moving to the city by a mile because in most cases the suburbanite has a house payment that is relatively modest due to having bought some years ago. In a substantial number of cases no payment at all.
The high efficiency car is a wash because the suburbanite already has a car. A Volt or Leaf is not that expensive as cars go these days and while oil is pretty expensive coal fired electricity is will be cheap – excepting the environmental costs- for a long time yet.
Now as to where the hundred grand for this solution is to come from- the NEXT BIG THING may well be a boom and maybe a bubble in the industries involved in upgrading houses for energy efficiency, installing solar panels, and building battery electric cars.
When things get really tight tight assed property owners and anally retentive government learns to look the other way. Transit will happen in suburbia and the people who live there will supply it themselves. Five or six people will be riding to their jobs in the same old second or third hand cop car.An old two thousand dollar Crown Vic driven gently will last just about forever if properly maintained and the per passenger fuel economy is not bad with five or six adults in it.
The fuel economy of an older Prius with four passengers is even better but it is going to be a while before you can buy a Prius in good running order for three or four thousand bucks.
My uncle ” Mouse” has busloads of people show up at his farm market on a very regular basis. ( It is necessary that the buses come when expected so he can have adequate inventory on hand most of which he actually buys from other farmers.)
These particular buses belong to churches and getting them out for trip to the country is part recreation and part good business sense since most of the people buy a large quantity of produce at very advantageous prices.
New organizations besides just churches will spring up and buses will get the members to the places they need to go such as supermarkets and shopping malls and yes – to the big factory or office park where the members work.
Businesses will open in houses and serve customers in the immediate neighborhood and the zoning people won’t say anything when the time comes. Check out the conversion of garages into non permitted apartments in many cities already.
I am not argueing that suburbia will last forever but suburbia is not going to just roll over and die without a fight being made by the suburbanites.
Unfortunately hard core landlords in times past used to use all the tactics mentioned although they were forced to implement them manually in person.No internet in those days.
So- the inevitable political backlash resulted in tenant friendly rent laws in most places. From a landlord’s pov way to tenant friendly. So the best and only real option landlords have these days in terms of avoiding deadbeat tenants who don’t pay and trash a property is to simply set much higher standards in terms of employment and credit history. I know a number of one horse landlords who learned this lesson in the school of hard knocks.. Getting rid of a dead beat tenant with a free lawyer can take as many months as the lawyer wants it to take if he hates landlords or is somehow getting compensated for his delaying tactics.
So now these landlords use a month to month lease and simply do not allow anybody in until checking them out very thoroughly. There are some good sneaky legal ways to check out a tenant that I will post here since electrons are defacto free in this sort of forum if Ron does not object and anybody wants to hear them. I have had a certain amount of experience in this matter.
In Virginia and some other states you can write a lease for thirty days at a time which can be terminated at will with a months notice by either the landlord or tenant with all the usual conditions and all local state and federal laws remaining in effect of course. So when you have a tenant that starts doing things you don’t like or failing to pay on time you just give him or her notice to move. It generally takes only one quick visit to court to get the sheriff to move a deadbeat at the expiration of ten days from the court date with hardly ever any way for the tenant to get a postponement so long as the landlord has documented his case in terms of fulfilling his own obligations.
No reason need be given by either the landlord or tenant for termination.Somebody that falls in love or is offered a better job a long way away or finds a hot deal on a house for sale can move quickly to take advantage of their good luck.
This restores what I consider a proper relationship based mostly on trust between the landlord and tenant in the same sense of an employer employee relationship. If both parties perform up to specs there is no reason for the tenant to move for no reason and no reason fol a landlord to evict when the landlord is making a steady income without hassles.
And this makes it possible for a landlord to accept a somewhat less creditworthy tenant.When a person renting knows eviction is fast and sure they are much more apt to pay their landlord first rather than last.
Some concerns I have with the concept of landlord is suggested by the very word, itself.
Some, maybe most if they can get away with it, so-called ‘lords– la-di-da– can ratchet up the pyramid game and ‘own your ass’, but in the end, by in part those kinds of means, it can contribute to the degradation and decay of real communities and cultural/civilizational/ecological decline/collapse, wherein everyone’s ass becomes ‘owned’.
(Credit rating?! I’d put a ‘LOL’ here if I didn’t find what’s going on so sad.)
The land/Earth is for everyone, Old farmer mac.
Hi Caelan,
I share your your perspective from the point of view of what I would PREFER. Any community in my estimation would be a better place if everybody owned a piece of it physically and literally- meaning they owned property or property rights and a business or a stake in a business operating locally.This would give everybody on the scene plenty of reason to really care about the community and everybody in it.
But unfortunately a very large part of the human race is too irresponsible to take proper care of their own business.And another large part of it has good reasons to rent such as an intention of moving soon or putting their capital into a business or further education.
More people beyond these two groups are well enough off that they just don’t want to be bothered with owning and want all the problems except writing the rent check to be somebody else’s problem.
Now we could give some thought to having everything owned communally. That apparently worked in some fairly primitive societies still in the hunter gatherer stage.But as we say about democracy- it is the worst possible form of government except all the others-
I believe ownership of private property is the worst possible way to run a society except for all the other ways.
Some of us are willing to work. Some of us want to work. Some of us don’t and won’t except when compelled by dire necessity.. Take away the opportunity to accumulate property and that ambition does not go away. It is channeled into accumulating power.
I have had plenty of experience sharing responsibilities with people who did not want to pull their weight. In a socialist society there are damned few ways to compel such people to do their part.
It is said that Stalin owned nothing except a few uniform jackets – but he was one of the most powerful men in the history of the world.
I hope who ever wants me to not mention Hitler will take note that I know about some other bad guys too lol.
The problem with socialism is that pretty soon you run out of other people’s money – courtesy of Margaret Thatcher among others.I have neighbors who get rid of their trash by tossing it out of the car window and spend their discretionary income on beer and cigarettes and fast food.It would never occur to them in a thousand years to give up cable or satellite tv and save the money towards a down payment on a house of their own. That sort of people if you give them a house free and clear will sell it in a heart beat and spend the money on a new motorcycle and a fancy truck and fast living and be back on welfare in a few months. Unfortunate but all to true.
Assuming we survive as a species, after the Great Shakeout, it appears that some of us may yet get to eat our pure/direct-democracy-cum/and/or-‘tribal-anarchism’ cake and have it too.
Latest Canadian underground NG storage chart is out…
There’s an EIA report upthread a ways that says all is well. Hmmm.
The Canadians have continued to sell gas to the US all the way through the Summer, so someone was thinking they were getting a good deal at the time, instead of putting the same gas in storage for the Canadian winter.
In the next few years, I can see Marcellus gas pushing out Alberta gas from the eastern side of Canada, but not sure about this year?
I recall reading in the G&M business section that storage in Eastern Canada was at normal levels and that storage in Western Canada was quite low. Not really sure how this affects the dynamics.
I’ve learned over the last few years to just see what comes. Swinging from non-winters to Polar Vortex winters as we have recently makes things interesting, but you just can’t know what winter will be like in November.
EX-USSR LEADER GORBACHEV: WORLD ON BRINK OF NEW COLD WAR
http://www.bbc.com/news/world-europe-29966852
“At an event to mark the 25th anniversary of the fall of the Berlin Wall on Sunday, Mr Gorbachev said the West had “succumbed to triumphalism”.”
Yawn…
Gorby and Vlad will love the new bosses in Congress! If there is a President elected in 2016 of the same stripes, then the fun will be even greater!
The beat goes on…
Vald The Bad will play them like a violin.
I was in Europe in 89, and it was one of the few times hope (not always a good emotion) was present.
http://www.eia.gov/petroleum/drilling/pdf/bakken.pdf
Pay no attention to the legacy field decline, it means nothing.
Curiously enough, the legacy declines seems to have been a factor in Louisiana’s natural gas production:
http://www.eia.gov/dnav/ng/hist/n9050la2M.htm
They showed a net decline of 20% their annual production from 2012 to 2013. They averaged 8.2 BCF/day in 2012. In August, 2014, they were down to 5.3 BCF/day. Note that this was the net decline, after new wells were added. The gross (legacy) decline from existing wells, e.g., the decline in production from wells put on line in 2012 and earlier, would be even higher.
In any case, at a given decline rate, as the volume of production increases, the volume of production lost to declining wells increases too. What we have seen in the US is an increase in the annual volume of declining production from existing wells due to: (1) An increase in production and (2) An increase in the underlying decline rate as tight/shale production accounts for an increasing share of total production.
Jeff, two questions:
(1) Is there a convenient graph showing the number of holes drilled each year in the US specifically looking for gas? I’ve never really paid any attention to this before.
(2) Is it reasonable to assume that gas specific holes are more-or-less comparable year-on-year or do progressive productivity improvements mean that current holes cannot reasonably be compared with those drilled say five-ten years ago? Or, in other words, is it easier or harder (more/less costly) to find and bring new sources on line than it used to be?
What I’m trying to do here is get a feeling for how effective a ramp up in gas specific exploration/development would be now as opposed to earlier times.
Presumably, the primary reason for the sharp decline in Louisiana’s gas production was due to a gas price related decline in drilling in the Haynesville Shale Play, which I believe is a predominantly dry gas play.
My guess is that companies will pretty much focus on the wet gas plays, until they are largely developed, and then go back to the dry gas plays. In other words, given a choice between large volume of NGL + gas versus small volumes of NGL + gas, I suspect that they will tend to choose Door #1, regardless of the gas price.
In any case, as noted above, as production rises and as an increasing share of total US oil & gas production comes high decline rate tight/shale plays, it’s becomes increasingly difficult for US producers to offset the volumetric decline from existing wells.
As I have previously noted, the decline in Louisiana’s gas production provides pretty strong support for the premise that the Citi Research estimate of a 24%/year rate of decline in gas production from existing wells is accurate, and maybe even conservative.
With a US dry production base of 70 BCF/day, in order to maintain 70 BCF/day, at a 24%/year decline rate (17 BCF/day per year), over the next 12 years the industry has to put on line 17 + 17 + 17 + 17 + 17 + 17 + 17 + 17 + 17 + 17 + 17 + 12 = 204 BCF/day of new production, or the productive equivalent of the approximate current production from 12 Marcellus Plays, or the industry has to replace the productive equivalent of current US dry gas production, times three, over the next dozen years, in order to maintain current production for 12 years.
Should read: 17 + 17 + 17 + 17 + 17 + 17 + 17 + 17 + 17 + 17 + 17 + 17 = 204 BCF/day of new production,
Well there’s a lot of hype about 227 trillion cubic feet of gas on the North Slope coming on line in the not too distant future so perhaps that will mitigate things for awhile. However, unless I’m wrong, when all of Canada’s proven natural gas reserve is 60 trillion cubic feet you have to wonder about the accuracy of that Alaskan figure. But even if the 227 trillion number is correct, that much gas isn’t really going to be earth shattering in the total scheme of things.
Doug,
Check on the new development going on in the Duvernay and the Montney, up in NE British Columbia (and adjacent Alberta?)
This is just recent memory bubbling up, but I remember talk of the Duvernay eventually supplying the NG needed for the oil sands.
Thanks, checked it out and got a sort of ying-yang result: Nut shell, Montney reserves 449 trillion cubic feet of gas, 14.5 billion barrels of natural gas liquids and 1.12 billion barrels of oil but the basin may expect turbulence as Malaysia’s state-owned company Petronas, which is closest to finalizing its LNG project on the Coast, has cast doubts on its development, citing regulatory delays and cost uncertainties. Makes my statement re Canada’s gas reserves above look kind of silly.
Or to carry it out a little farther in time, at 24%/year decline rate from existing production, in order to maintain 70 BCF/day of US dry gas production for the next 20 years or so, the US would have to put on line the productive equivalent of the current global dry gas production.
Well we’re scaling renewables in the South Pacific, even in Australia which now has a carbon junky as PM who is so absurdly science denying that the best you can say for him that he must be allowing Canadians to feel better about themselves by taking that record off Harper.
http://reneweconomy.com.au/2014/south-australias-270mw-snowtown-takes-wind-energy-to-new-highs-43971
I get a forbidden access or no access message at this link.
The right to steal electricity (katiyabaaz):
http://royal.pingdom.com/2009/04/03/a-gallery-of-electrical-cabling-gone-wild/
Another all-time monthly record, as October beef exports hit 122KT
By Jon Condon, Beef Weekly, 04 November 2014
It takes this culling of breeding animals longer to affect the market than most people would expect but everything else equal it will result in much higher prices for beef starting a year or so from now and persisting for three or four years afterward depending on how fast the herds can be built up again.
With extended drought conditions possibly lasting for years on end perhaps due to climate change the supply of beef may be more or less permanently reduced.Moderately poor folks can eat chicken and poor folks can eat beans and bread and the really hard up can just starve.
It’s a Darwinian world. I don’t have much as Americans go but I will do my part to help somebody hard up to survive- somebody close to home where there will be no loss of purchasing power between whatever I donate and the person who gets the donation.
A couple of rides to the doctor or a pickup load of firewood or a few hours spent tutoring a kid who has a desire to learn can make a bigger difference than a thousand dollar donation that gets eaten away by auditors bookkeepers rent advertising fund raising phone bills insurance receptionists salaries managers salaries conferences lobbying politicing daydreaming and generally just taking it easy on the donors dime.
The folks who run nonprofits are not noted for their miserly salaries or office accommodations as a rule.
Shoulda mentioned that meat eaters ought to make a point of enjoying the relatively cheap beef while it lasts of course.
http://www.rollingstone.com/politics/news/the-9-billion-witness-20141106?src=longreads
I am not much into conspiracy theories as a rule but I do firmly believe the big banks are run by crooks who are generally a few steps ahead of the law. I believe the rot is so deep that the Obama justice department is about as honest as the Ocare propaganda such along the lines of ”you can keep your policy” and ” you can keep your doctor”.
Now I don’t see why it surprises anybody anymore except maybe somebody terminally stupid that the big banks routinely manipulate any market they can.Gold would of course be one of the easier ones since the actual quantity of physical gold involved is small and most people don’t want to be bothered with actually keeping it in storage personally.
But while I have not read the link Watcher posted it would appear at first glance that a conspiracy to manipulate or maybe just speculate in gold has been proven rather than disproven.
I strongly suspect some big banks are on the wrong end of some large trades and desperate to make up their shortages before somebody with clout enough to make the demand stick demands possession of their gold- physical possession rather than a piece of paper .
Back when I was a young man I would never have believed that I would be reading the Rolling Stone for basic news beyond what the military was up to.Nowadays the mainstream media clearly seems to be so much a mouth piece for big government and big banks that you are just about compelled to go to alternative media such as blogs and purely partisan papers to find out a lot of stuff everybody ought to know.
“…the big banks are run by crooks who are generally a few steps ahead of the law…” ~ Old Farmer mac (OFM)
The banks are the law (so to speak).
As for ‘
thetheir law’, it is fundamentally unethical, too, anyway, and your following statement works well regarding its depth (rock-bottom)…“I believe the rot is so deep…” ~ OFM
…Like the proverbial flapping of butterly wings turning, over time and chaos, into hurricanes…
“I think as the years roll on, more and more people will understand that we actually need to change the DNA of this country to have any chance. I think that as the ball starts rolling faster, more and more people will clearly see how the structure of law operates and the necessity of changing it.” ~ Thomas Linzey
For a good laugh head over to the Archdruid report, some feminists r going crazy after a german pointed out that women warriors are a myth.
HOW about a link to the particular Archdruid column with this discussion? The date will do fine.
The post Peak world with a sharp descent will eliminate 20th century women’s rights.
The importance of muscle, walking behind a plow, will re-elevate to become again all important. Women will lose their capacity to broadly contribute to society and with that, their “rights”.
I read your comment to my wife who said she can shoot a gun as well I can. Its not true of course.
Any micro society that decides to denegrate half (or more, given their low inherent mortality rate) of the population will be easy pickings for a more “enlightened” one.
IF GOLD IS JUST A STUPID PIECE OF METAL…. than why are banks manipulating the gold market??
Another “Conspiracy Theory” Bites The Dust: UBS Settles Over Gold Rigging, Many More Banks To Follow
Sadly this too conspiracy theory just was crushed into the reality of conspiracy fact, when moments ago the FT reported that alongside admissions of rigging every other market, UBS – always the proverbial first rat in the coalmine, to mix and match metaphors- is about to “settle” allegations of gold and silver rigging. In other words: it admits it had rigged the gold and silver markets, without of course “admitting or denying” it did so.
http://www.zerohedge.com/news/2014-11-09/another-conspiracy-theory-bites-dust-ubs-settles-over-gold-rigging-many-more-banks-f
——————
Just wait until JP MORGAN loses the ability to rig the precious metals market.
steve