North Dakota has published January production data for the Bakken and for all North Dakota.
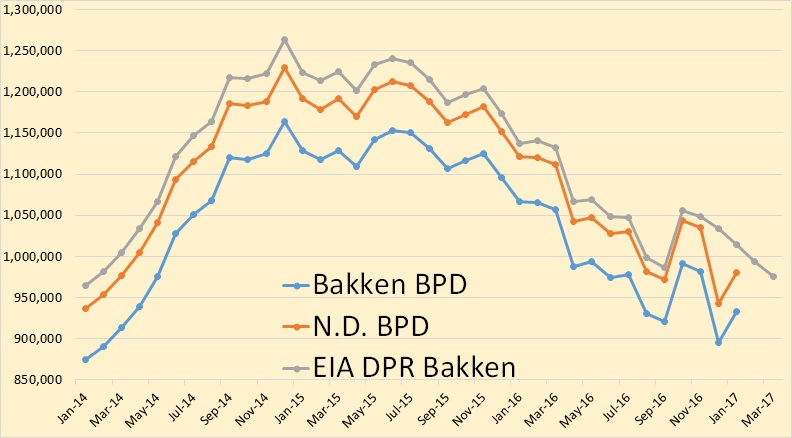
Bakken production was up 37,617 bpd to 932,817 bpd while all North Dakota’s production was up 37,972 to 980,294 bpd.
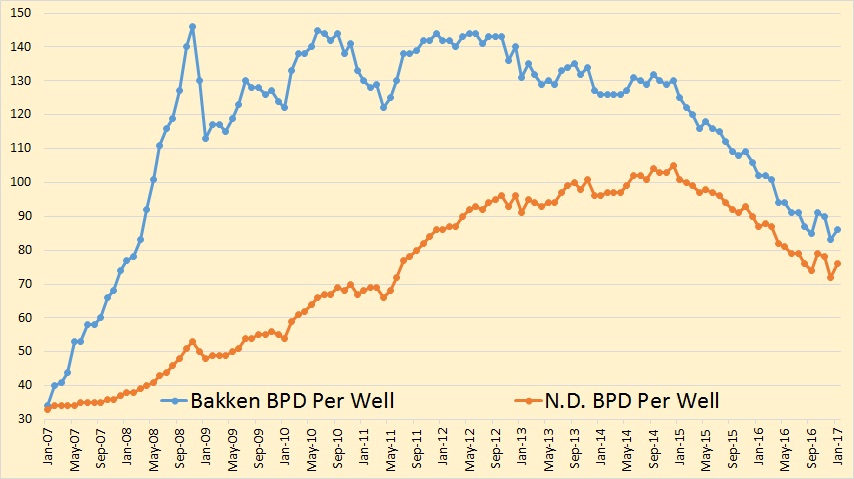
Bakken bpd per well was up 3 to 86 while the average bpd per well for all North Dakota wells was up 4 to 76.
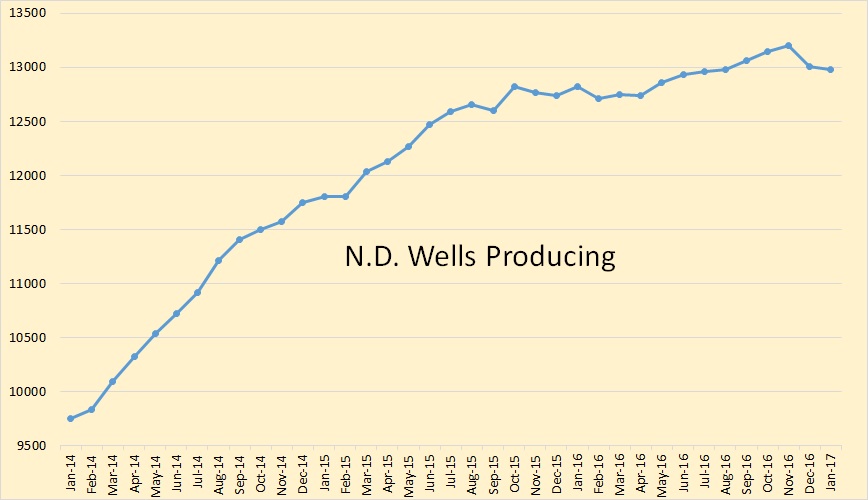
The North Dakota stats have “Wells Producing” dropping by 189 in December and dropping another 35 in January for a total decline of 224 over the two months. The total number of producing wells in North Dakota in January stood at 12,976.
You will notice these numbers differ quite a bit from Lynn Helms’ numbers below. I have no explanation for this.
From the Director’s Cut:
Oil Production
December 29,211,993 barrels = 942,322 barrels/day
January 30,389,117 barrels = 980,294 barrels/day(preliminary)
(all-time high was Dec 2014 at 1,227,483 barrels/day)
Producing Wells
December 13,337
January 13,333 (preliminary)
(all-time high was Nov 2016 at 13,520)
Permitting
December 35 drilling and 0 seismic
January 81 drilling and 1 seismic
February 45 drilling and 1 seismic
(all time high was 370 in 10/2012)
ND Sweet Crude Price
December $39.93/barrel
January $40.51/barrel
February $42.74/barrel
Today $41.50/barrel
(all-time high was $136.29 7/3/2008)
Rig Count
December 40
January 38
February 39
Today’s rig count is 44
(all-time high was 218 on 5/29/2012)
Comments:
The drilling rig count decreased two from December to January, then increased one from January to February, and is currently up 5 from February to today. Operators are shifting from running the minimum number of rigs to incremental increases throughout 2017, as long as oil prices remain between $50/barrel and $60/barrel WTI.
The number of well completions decreased significantly from 84(final) in December to 54 (preliminary) in January.
Oil price weakness is anticipated to last into the second quarter of 2017.
There were two significant precipitation events, five days with wind speeds in excess of 35 mph (too high for completion work), and eleven days with temperatures below -10F. The first half of January was as bad as December 2016, but the last ten days of the month the weather was dry, warm, and a little windy.
More than 98% of drilling now targets the Bakken and Three Forks formations.
Estimated wells waiting on completion is 802, down 5 from the end of December to the end of January. Estimated inactive well count is 1,678, up 105 from the end of December to the end of January.
Okay, but what is the rest of the USA doing as far as oil production goes. The data below is from the Petroleum Supply Monthly and goes through December 2016, not January as the above North Dakota data does. The data is in thousand barrels per day.
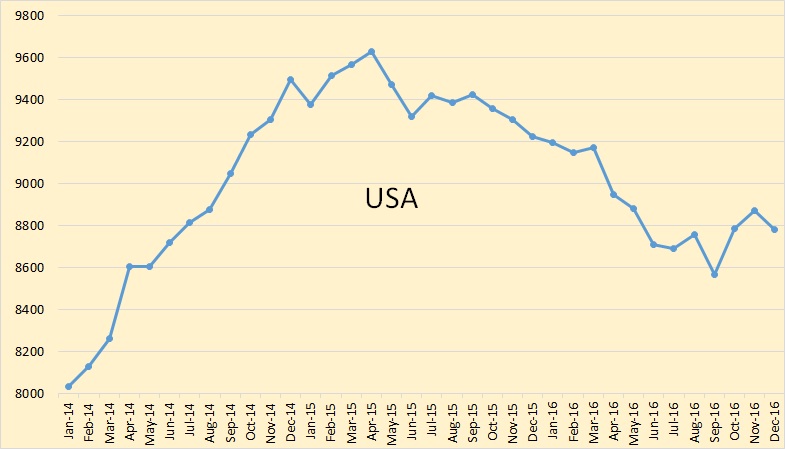
US C+C production was down 91,000 bpd in December. Most of this drop was from North Dakota which they have down 89,000 bpd in December.
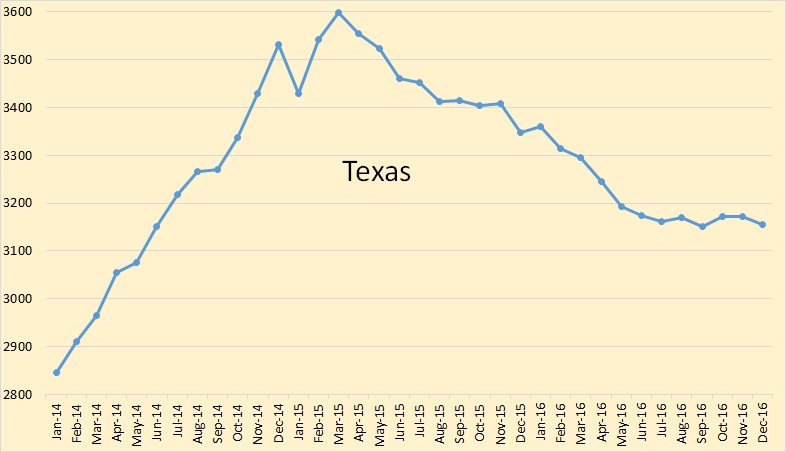
The EIA has Texas down 17,000 bpd in December. Notice that they have Texas virtually flat for the second half of 2016.
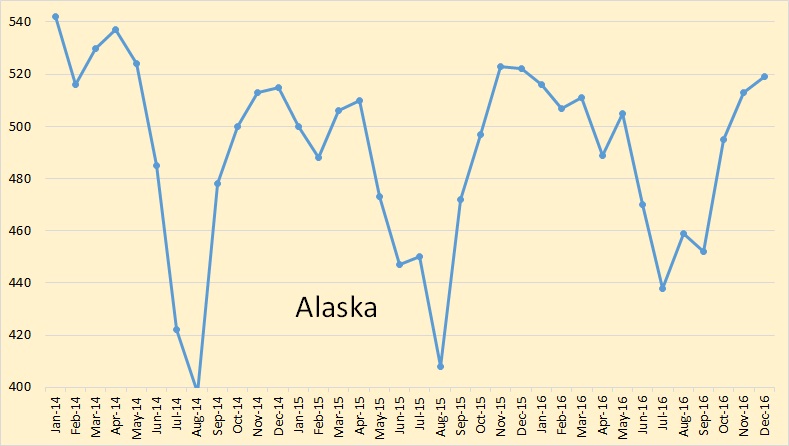
Alaska has stopped their decline, temporarily anyway. Alaska was up 6,000 bpd in December.
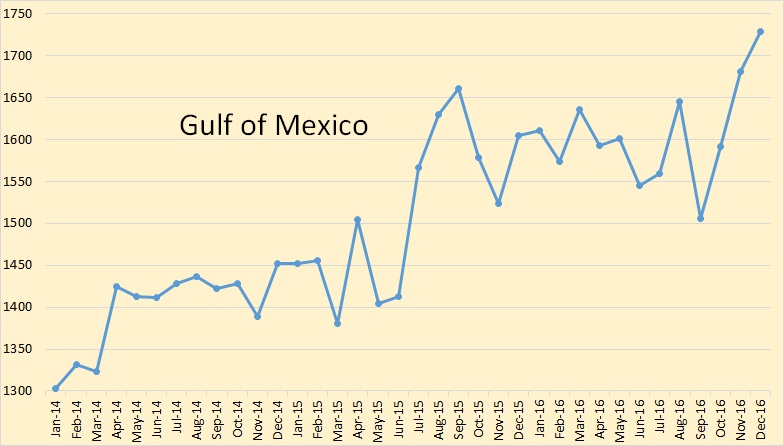
The EIA says the Gulf of Mexico was up 47,000 bpd in December.
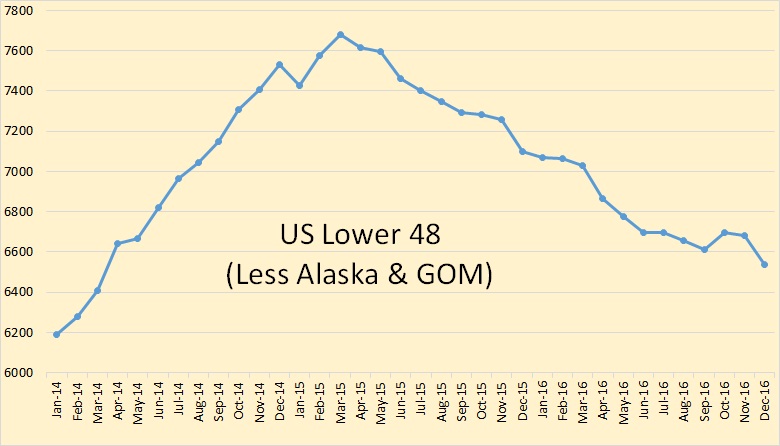
So I just subtracted Alaska and the GOM from total US production to see what the the Lower 48 was doing in December. They were down 144,000 barrels per day. 89,000 of that was from North Dakota. Therefore the Lower 48 less North Dakota was down 55,000 bpd.
242 responses to “Bakken January Production Data”
OPEC's Houston Huddle Deepens Oil Cuts Dilemma – Bloomberg: “Even shale oil executives seem surprised by the speed of the recovery. If U.S. producers embark on a spending binge similar to the previous boom then production could rebound so quickly that it would ‘kill’ the market, Harold Hamm, the billionaire chief executive officer of Continental Resources Inc., said Wednesday.”
Even shale oil executives seem surprised by the speed of the recovery.
I am surprised also because I have yet to see any such recovery in the data posted by the EIA. The US Lower 48 was down 144,000 barrels per day in December, the last month from which complete data. Well, complete data estimates that is.
Hi Ron,
I wonder if the talk of “robust recovery” is based on the DPR, that report has output increasing by 120 kb/d from Jan 2017 to March 2017, all of the increase coming from the Permian basin (up 124 kb/d). I don’t think the DPR does a great job, but it has improved over time and may be in the ball park (within 100 kb/d) of actual future output.
Could be but where is the EIA getting their data? Are the oil executives surprised at what the EIA is predicting for future shale production? The oil executives have access to as much, and likely a lot more, data than does the EIA.
I think maybe many analysts did not expect robust growth at $55/b. I sure don’t, and I am skeptical of both the DPR forecast and the EIA’s weekly data. Maybe output has climbed a lot in the Permian basin.
In Feb there were 245 oil completions in the Permian based on RRC data, there were 244 oil completions in Jan, 232 in Dec, 155 in Nov, 243 in Oct, and 237 in Sept, The EIA gives LTO data though Jan 2017 and the Permian output increased by 90 kb/d based on the EIA data (rather than the DPR model estimate)from Aug 2016 to Jan 2017. An average of 222 oil well completions each month led to an average increase of 18 kb/d each month. If we make the simplifying assumption that the increased output is proportional to the wells added, then we might see a 20 kb/d rise in output each month if the completion rate remains at 245 each month.
There has been a big increase in rig counts in the Permian based on DPR data so perhaps there will be a robust increase in the Permian Basin.
Based on Baker Hughes, Horizontal oil rigs in the Permian have increased from 160 in August to 250 in February. So a 50%+ increase.
I saw a chart somewhere – can’t remember exactly – but I could probably track it down if you like.
I copied it to bring it here. The idea that struck me about it was that, in the right situations, oil extraction technology shows an experience curve just like photovoltaics, or wind turbines, or cell phones or passenger airliners.
So costs are declining, lowering the price entry point for decisions about new drilling efforts.
I might be inclined to think that oil prices will trend flat to down if this continues, especially given the competition from renewables that’s getting too big to ignore.
We might see declining prices for all energy, declining fossil fuels extraction, and replacement by renewables. It’s hard to imagine what the economy will look like after PV and wind double 8 more times, assuming the experience curve holds up. We’d have about 5-10 times the available energy per capita, at 1/10th the price per kWh.
Hi Wehappyfew,
I doubt those charts are accurate, I just looked at the Permian basin and breakeven costs (full cycle with annual ROI of 10%) are over $80/b. Eventually substitution by EVs and plugin hybrids might reduce demand for oil, but wind and PV compete only with natural gas and coal, not oil.
It is unlikely that “peak demand” for oil will be reached before 2045 as realistic scenarios for a transition from ICEV to EVs in personal transportation will take a couple of decades, one billion cars are not replaced very quickly, possibly AVs (autonomous vehicles) will accelerate the transition, but it is not clear how quickly AVs will take over. Also remember that personal transport is only about 40% of oil use, airplanes, ships, rail, and commercial trucks will all continue to increase their oil use and solutions such as electrified rail and short haul trucks and better public transport (light rail and electric buses) will also take time to implement. Even in my most optimistic moments I think it unlikely such a transition will reduce demand for oil below supply (for my medium scenario) before 2040. In the mean time oil prices will be high from 2020 to 2030 and will only fall if there is a Great Depression (my guess is 2030 or so).
personal transport is only about 40% of oil use
It’s over 50% in the US, which is close to 25% of world oil consumption. It would be nice to finetune that estimate.
airplanes, ships, rail, and commercial trucks will all continue to increase their oil use
Not if oil prices go up significantly.
Industrial/commercial users are much, much more price sensitive than individuals. If prices go above $100 you’ll see some I/C consumption literally drop overnight, as they optimize things like speed, routing, freight channel choice, logistics, etc.
A good example of I/C price sensitivity (at least in the medium term) is the taxi industry. When prices rose roughly 10 years ago, they took several years to test hybrids for operational problems, repair costs, etc. Now they’ve moved to hybrids en masse – just look at the streets of major urban downtown areas, and count the % of taxis that are hybrid. You’ll notice that the remaining pure ICEs are older, and soon to be replaced (although there will be a few ICE SUVs and boxy Scions, where there wasn’t a good hybrid choice).
solutions such as electrified rail and short haul trucks and better public transport (light rail and electric buses) will also take time to implement.
That’s certainly true for rail. But, rail is a small diesel consumer. Even buses are relatively small these days. Trucking is very sensitive to fuel prices, and the operators of large fleets (Fedex, UPS, etc) have been developing a lot of options, just waiting for prices to rise. The big Kahuna for freight is not rail electrification, it’s mode switching from road to rail (rail is hungry for freight customers, with oil and coal volumes dropping fast), and short term efficiencies, like aerodynamic modifications.
Will consumption drop fast? I don’t know – that’s partly up to psychology and politics. But the *practical* barriers like cost and technical details, are relatively small.
“It’s over 50% in the US, which is close to 25% of world oil consumption.”
Only slightly above 20% in 2016.
And main growth is occurring in developing countries
Hi Nick G,
I agree that the practical details are possible, my point is that it will take time.
Oil prices were above $100/b from 2011 to 2014, but oil consumption did not decline, so it is not clear that commercial and industrial oil consumption will drop as quickly as you assert.
Don’t get me wrong – I’m not suggesting anything simplistic. In this case, I was disagreeing with the idea that Industrial/commercial consumption would continue to *increase* even in the face of expensive oil. I wasn’t suggesting a fast or dramatic decrease in the short term.
One major factor: the difference between short term demand elasticity and long-term:
1) large parts of the world have controlled & subsidized fuel prices. Those countries had to suffer through several years of large losses on their subsidies before they decontrolled prices (e.g., India, China, KSA). Some places still haven’t gotten the idea, like Venezuela – they will take longer, but eventually they’ll have to give it up.
2) Some things, like speed and routing, can be changed very quickly. Once in place they can be implemented overnight, but they require some planning and analysis to put the proper protocols in place.
3) Large organizations, industries and corporations are very often risk averse. That means that it takes a while to develop a consensus on the need for action. Once that consensus develops, things can change pretty quickly – we’re seeing that with EVs vs diesel in Europe, and with EVs and renewables in China (which is to a fair extent an enormous centrally planned organization).
A primary source of the risk aversion of large organizations and industries is economy of scale. Like the taxi industry discussed above, they like to standardize on a tech, and within that a brand, model and even year. That reduces purchasing, operational, maintenance and management costs. That takes time to overcome. Conversely, when it moves it can move big, and we can see dramatic changes, as we’re seeing with utility-scale wind and solar.
5) Until around 2005 there was no perception of possible oil supply limits. There is still doubt among many about this. It will take several years of high prices and a production plateau to change this, but 5 years and a consistent futures “strip” would change that dramatically.
6) Much of the early growth process is hidden. A lot of industrial transition is hidden by internal planning and R&D processes and the need for competitive secrecy. Much work is taking place in “stealth” mode, and other work is simply taking place in the engineering and design facilities, announced in the form of “concept” vehicles but not visible in the showrooms or on the road.
Many of these changes started around 2005, and took time to happen. But, serious change is now underway. In particular, the move to EVs is happening pretty dramatically around the world.
Bartlett’s old quote about the exponential function still applies: things appear to start slowly, then take people by surprise. I was too pessimistic about the speed with which EVs would arrive, and I’m starting to be encouraged…
Hi Nick,
I hope your optimism is correct. I believe EVs might accelerate in adoption pretty quickly and perhaps the same will happen in other uses of oil, for the World I believe the percentage use of oil use for personal transport is lower than the US. We do not really have good data on this, but surely it is lower in Europe and even lower in emerging economies than in Europe, so pointing to US data tells us very little, US inputs to refineries of C+C is about 15 Mb/d, World output is 80 Mb/d,
I get about 18.7% of C+C use by the US.
Hmmm.
Well, a basic question is whether personal transportation fuel consumption is more or less sensitive to prices than Industrial/Commercial: I’d suspect that I/C is actually more price sensitive.
I think it would be helpful to break down world oil consumption by sector, categorizing them by demand elasticity.
Let’s break things down:
Transport: 64%
Non-energy (petrochemicals, etc): 16%
Other (ag, space heating, etc) 12%
Industry: 8%
http://www.globalpetrolprices.com/articles/39/
Now, what is the demand elasticity/substitution function for these?
We can find more detail at https://www.statista.com/statistics/307194/top-oil-consuming-sectors-worldwide/
We see some obvious candidates for substitution:
Petrochemicals (at 10%) can go to gas and coal (China primarily uses coal, I believe). Space heating can go to electricity, heat pumps, and greater efficiency.
Areas that are somewhat inelastic add up to about 18%:
aviation at 6% of the total; and
marine bunkers at 5%;
Ag is probably only about 4%; and
Marine/rail at 3%.
These areas still have very significant potential for greater efficiencies.
Hi NickG,
We do not have great data on the elasticity of demand. Even if we did this can change.
The actual experience to date is that $100/b did not reduce consumption. When output decreases consumption will decrease, whether it will be as easy to accomplish as you seem to imply is the crucial question.
I believe it will be quite difficult to accomplish and a World recession is likely to be the result.
We could have a recession after prices get high enough to reduce demand. Or we could have a recession first, reducing demand.
I am anticipating the latter. I just don’t see the global economy expanding unless there is a big switcover to renewables. Which may happen if China can swing it.
Oh, it’ll take time. But it’ll take *less time than you think*.
The time delay on the Great Energy Transition is about two things:
(1) Tech development
(2) Factory construction / retooling.
In 2011, tech development was at a level where gasoline was still cheaper to use than electricity even with $100/bbl oil.
Factory construction was at a level where there really weren’t any electric cars available at all.
What was the reaction in the 2011 – 2014 period? Electric car factory construction. Which takes years.
In the industrial sector, the same thing happened. You may not have been paying attention, but starting in 2011 industrial companies set about retooling their operations to stop relying on oil. This was an expensive and slow process which generally took *5 years* for each factory. Think about it.
Now, those factories are already retooled.
Fleet truck operators like UPS and FedEX are basically raring to go. The electric truck manufacturers have their prototypes and small-scale factories. They can spin up big factories in a couple of years given big orders. This gives you your time frame: the lag is no more than 2 years.
Nick, thanks for those breakdowns.
“Transport: 64%
Non-energy (petrochemicals, etc): 16%
Other (ag, space heating, etc) 12%
Industry: 8%”
“Petrochemicals (at 10%) can go to gas and coal (China primarily uses coal, I believe).”
The OECD mostly uses gas.
“Space heating can go to electricity, heat pumps, and greater efficiency.”
This one has strangely slow substitution. It’s been an overwhelmingly correct financial move since the 1970s but the transition is very slow, since people simply don’t think about replacing their boilers. Any excursion into high oil prices will accelerate the transition though.
“Areas that are somewhat inelastic add up to about 18%:
aviation at 6% of the total; and
marine bunkers at 5%;
Ag is probably only about 4%; and
Marine/rail at 3%.”
Marine bunker fuel is basically waste byproduct and will remain dirt cheap no matter what, unfortunately. Anyway, it won’t have an effect on pricing. Rail can electrify when they need to and are also getting more and more efficient; same with the rest of marine. Ag I don’t know much about but it is the one area where biofuel may make inroads (since the biofuel can be made on-site).
Basically airplanes are the only totally inelastic component of demand *now*. This is a change from the situation 10 years ago or even 5 years ago.
The most important point is that the vast majority of oil usage, and nearly all of the profits, are now for road transportation. You can basically ignore everything else, financially speaking.
The substitutability of oil use for road use is basically constrained by the production rate of electric cars, buses, and trucks. So watch that and you’ll know what the elasticity of demand for oil is.
In reference to maritime using junk oil. This article suggests ships might be required to start using something cleaner.
https://www.pressreader.com/canada/the-globe-and-mail-bc-edition/20170303/281887298094780
Thanks for the link, Boomer II.
I really do hope they clean up marine fuel, but the almighty dollar is powerful. As long as the bunker fuel is cheap it may be very hard to make it happen.
Commercial operations are better at calculating the maintenance costs of vehicles that private individuals are as well. Low maintenance costs are a strong argument for electric vehicles.
So I predict private transport will lag behind commercial vehicles when it comes to switching to electric.
Hi alimbiquated,
We will need more rail and eventually electrification, big projects which will take some time in my opinion.
Hi Nathaneal,
There were about 1200 million vehicles registered in the World in 2014.
Let’s make a really absurd assumption, all vehicles sold after 2016 will be EVs or plugin hybrids and the plugin hybrids will use no fuel in their ICE.
Sales will remain steady at 77 million per year, which would require 15.6 years to replace all ICEV.
This scenario seems a bit far fetched, at least to me.
Similarly scenarios that take the growth rate from 2011-2016 in plugin car sales and assume this growth rate will continue are nearly as far fetched. Diesel fuel (mostly truck use in the US) is about 27% of total energy use in 2015 in the US. For the rest of the World this ratio is probably higher (fewer cars per person).
It will be difficult to replace long haul trucks with batteries so this will require rail, which is more efficient and eventually will require electrification to eliminate fossil fuel use.
I do not think this will happen quickly, it will require 30 to 40 years, by 2050 seems realistic, though perhaps it might be accomplished more quickly. The speed will depend on many factors including relative prices and social policy.
Dennis,
Two thoughts.
1st, the recent rise in oil prices did indeed have short term effects: it flattened consumption from about 2004 to 2008, and it reduced the “snapback” in consumption after the GFC.
In fact, the sensible model is that prices rose around 2004 because production was flattening, and prices of $100-125 were what was needed to incentivize flattened consumption.
Two: there is a broad mix of responses to higher prices, some of them short term and some of them long term.
There are many short term responses, which would be deployed more aggressively as prices rose. An I/C example is water shipping slowing down: fuel consumption per ton-mile is directly proportional to speed, and high prices mean that speeds are reduced literally overnight.
For passenger vehicles, utilization rates are critical. In the US the average household has more than two cars, and useage can move literally overnight from the 15MPG SUV to the 40MPG small sedan.
On average vehicles turn over about every 3 years: new car owners buy a new car, and sell their car as a used car. The volume of used car sales is about 3x as large as the volume of new cars. And just as importantly, average utilization is very low (less than 2%!): a large percentage of the fleet is gets very low useage. There are very large opportunities for high efficiency vehicles to increase utilization, and for SUVs to be parked and used only for the occasional boat-towing.
So, passenger vehicles can be used with sharply higher efficiency in a matter of months and years.
Will these changes happen?? It depends on price incentives and social consensus. If prices rise sharply to well above $100, stay there for 5 years, and a social consensus develops in favor of rapid change, then…rapid change can and will happen.
If prices don’t rise, but a social consensus develops that recognizes external costs and risks, then we could also see rapid change. For that, though, my crystal ball is very foggy…
One more thought:
The short term responses given above are the convenient ones, that would happen if reducing fuel consumption was only a medium high priority. But, there are faster and more effective ways to reduce fuel consumption.
The average passenger vehicle only carries 1.2 people. That could be doubled relatively easily with carpooling (even now, carpooling is 3x as large as commuter rail volume!).
Think aggressive use of smart phone apps and HOV lanes: passenger fuel consumption could be reduced by 50% in months, if really desired, with no loss of travel.
Heck, if you went from 1.2 people per vehicle to 2.4, and went from 22MPG to 33MPG (just by using the more efficient vehicles in the existing fleet), you could reduce it by 66%.
It would be inconvenient (though you might meet your neighbors!), but it would certainly work.
If oil goes up and stays up, which seems altogether possible to me at least, Nick is right about freight moving from truck to train.
The potential cost savings is HUGE, and with modern communications, making it work will be a piece of cake. The only real holdup will be getting the large terminals needed permitted and built.
It takes a lot of land and such terminals have to be located where the existing major highways and rail lines meet. Suitable locations are few, and opposition from locals due to the traffic will be a big issue.
It’s really hard to say exactly why trucking companies aren’t buying aerodynamically high efficiency trucks already. I guess they are confident that diesel fuel will stay cheap for as long as they plan on keeping new trucks bought today.
Nobody will scrap a truck because it uses a little more fuel than a new one. It will be put on jobs where it runs less and sits around more. The new ones built today will still be in use twenty years down the road.
And if things get really tight, truckers will simply drive old trucks a lot slower than usual in order to make ends meet, at least in some cases. Slowing down cuts fuel consumption dramatically. An independent trucker who can take an extra hour getting there driving most of the night can save enough on fuel to make that hour well worth his while. Ditto a company driver if his company offers a decent fuel economy bonus.
Manufacturers are also gradually lowering the weight of new trucks, so that the legal load capacity is increasing a little. Regulations limit the total weight of the truck, so taking five hundred pounds off means five hundred pounds more freight per trip. It’s hard to say how far they can go with this strategy, but my guess is that they can get the weight of a typical eighteen wheeler down another ton or even two over the next few years without resorting to really expensive materials such as carbon fiber.
So far I haven’t any knowledge of it actually being done on a regular basis, but I have heard truckers talking about such tricks as loading ten tons of very heavy freight, such as for instance bagged cement, which takes relatively little space, and finishing out the load with light materials such as card board cartons packed with potato chips or other such high volume low weight cargo.
Outfits such as WalMart are probably already proficient at loading trucks this way because they have their own dedicated routes and warehouses.
I’ve read that UPS plans their routes so there are no left turns. If companies are that concerned about efficiency and cost savings they probably will maximize fuel savings, too.
Read this
http://home.uchicago.edu/~kelloggr/Papers/Kellogg_LBD_QJEFinal_wApp.pdf
The author, Ryan Kellogg, is one of the brightest and nicest persons I’ve ever met. Many years ago, before he got his PhD, I told him he needed to aim at being USA president.
The paper discusses an issue we used in our project models to evaluate how to pace the development drilling phase in mega projects. What we found using these principles (which we backed with real performance data) was that it was possible to increase production faster by pacing rigs to take advantage of the learning that engineers, geolophers and crews were getting from doing their jobs in a particular area. This applies to the “shale” industry in the USA.
Based on what I saw over the last ten years they did have a lot to learn, but they are coming up to speed. Unfortunately these learning phases do flatten out, which means they have less and less influence as time and cumulative wells go by.
When does he start his reality show?
I think he should get a tv show on Bloomberg, about energy economics, then run for congress in Texas, move up to Senator, and shoot for the presidency in 20 years.
He’s got some videos, check them out and you’ll see he has very good verbal skills.
Fernando
That piece by Kellog was excellent.
He sure put a lot of effort into it.
What you – and Kellog – touched upon, cannot be over emphasized in explaining what has been happening in this unconventional arena these past few decades … and continuing this very moment.
The drilling efficiencies HAVE started to ‘flatten’ a bit in the 6,000’/10,000′ vertical depth shale-focused targets, but now the sandstone formations, especially the Cotton Valley and Clinton, are in the early phases of applying previously learned techniques to this more porous, more permeable environment.
Recent Cotton Valley output is starting to rival Marcellus numbers.
An interesting aspect to the Clinton Sandstone is that its shallower depth is encouraging smaller operators to pool their resources and, potentially, broaden the operator base significantly up there. (Either that or probably go out of business).
On the other end of the spectrum, EQT is dedicating one specific rig to drill 6 to 8 Deep Utica wells (12,000’+) in PA/WV this calendar year to evaluate future potential. They now have 3 (out of 6 attempts) deemed successful and are confident they may ‘crack the code’ by this time next year.
If this particular venture is successful, the global impacts will be enormous.
A few weeks back, in Kentucky, a 14,000′ vertical depth well from Cimarex was fractured in 20 stages.
This is the first unconventional, production well targeting the Rogersville shale.
Results yet to be announced as of this posting.
Stepping back and viewing the broad expanse of both activity and results, from sub $3 million dollar wells in the Niobrara, development wells being gingerly introduced in the Powder River Basin, Sandstone-targeted wells in Louisiana and Ohio, true wildcats at 14,000′ in Kentucky, and massive amounts of gas to be unveiled in the huge, deeper parts of the Appalachian Basin, I would posit that people might want to re-evaluate their views vis a vis future hydrocarbon production in this country.
The fundamental problems that this “cheaper” oil production is facing are not solvable:
1 — substitutes are cheaper right now
2 — substitutes are dropping in price at a very fast rate, much faster than the oil drillers can cut costs
A key point is that $30 oil is still expensive by long run standards. $5 oil is cheap. $30 oil isn’t.
As long as gasoline is over $1/gallon, electric cars are going to crush demand — basically as fast as they can be produced. Over $2/gallon, they crush it even faster.
The problems are actually worse for natgas. It’s already super cheap. But both solar and wind can undercut it for power production. Utility-scale batteries can undercut it for peaking and backup power, as of two days ago (latest announced price). Electric is within striking range of the natgas price for heating. This is exerting heavy downward pressure on the natgas price; how do they think they’re going to make a *profit*?
Hydrocarbon extraction rates in this country will be determined largely by how many stupid investors decide to throw their money down unprofitable holes in the ground. I have no way of predicting how many investors will do this. Could be lots and lots! All I can say confidently is that it *will* be unprofitable.
I always like it when someone manages to write an academic paper with data and evidence which proves what everyone should have already known. (This is not a slur; I really DO like that. It’s important to have solid scientific backing for the obvious.)
Kellogg seems like a great guy from this paper.
I do however have to ask, did anyone actually doubt the results before the paper was published?
I think the talk of “robust recovery” is based on the EIA weekly data
EIA monthly vs weekly data
We also know that September dip was due to Hermine
Hi AlexS,
That is a possibility. The weekly data does not tell us if that increase in output is from GOM, Alaska, or LTO, we only have specific tight oil data through Jan 2017 unless we rely on the DPR or other forecasts. The tight oil data from Sept through December shows no increase in LTO output.
Weekly data only gives us total US output and in the past the weekly data has not been very accurate.
Dennis,
Weekly data for July-November was too low. That explains estimated 600 kb/d growth from July 2016 to March 2017 mentioned in many articles.
According to monthly data, the increase between September and December was only 210 kb/d, and was largely due to rising output in the GoM. But LTO production may have rebounded in 1Q17.
An 25-30% increase in shale companies’ capex planned for 2017 will inevitably result in higher production volumes. And it does not matter if oil prices stay below LTO breakevens.
In 2H17, shale companies were talking about financial discipline, but it seems that it was only talk. They will again overspend operating cash flows and cover this funding gap by new loans, bond and share issuances and non-core asset sales.
Hi AlexS,
Possibly oil prices don’t matter, but eventually investors and banks will wise up. If they can’t fund the CAPEX the wells will not be completed. Perhaps the well completion rate will rise as quickly as you believe. The model suggests a very large increase in the completion rate to get to a 300 kb/d increase in LTO output. The well completion rate would need to increase by 40 wells each month to reach 1000 new wells per month at the end of the year from 567 in Jan
“They will again overspend operating cash flows and cover this funding gap by new loans, bond and share issuances and non-core asset sales.”
This may not be the case, due to already higher than earlier debt-to-capital ratios, higher interest rates, already unloaded assets etc. Such capital raises are short-term solutions, and cannot be sustained in a rising rate environment.
Also, note that Bakken and Eagle Ford bubbles have popped, and Permian will peak by 2020 as well. This is now slowly but surely becoming apparent to everyone, including banks and investors (funding sources).
Hi AlexS,
I have come around in my thinking to agree pretty closely with your assessment.
Two things changed my mind
a. horizontal oil rig counts in the Permian have increased by over 50% in the past 6 months which suggests a higher drilling (and completion) rate going forward
b. looking at the Permian data at shaleprofile for 2015 suggests a significant improvement in the average well profile from 2013 to 2016, with the 2015 average well rising to an EUR of 269 kbo in the Permian basin.
The scenario below has US LTO well completions about 30% higher in 2017 compared with 2016 in line with CAPEX increases. US LTO C+C model output increases by 240 kb/d in 2017 in this scenario (economics was ignored, just increased completed wells by 30% for the year using past rates of increase as a guide as well as current rig count).
Dennis,
“US LTO C+C model output increases by 240 kb/d in 2017” – looks reasonable (2017 average vs 2016 average).
Yes horizontals in the Permian have more permits within the past two months. Nothing resembling “robust recovery”, but more. Along with that they have about 30% of the total wells permitted as vertical. Nothing like the 800 to 1500 per month vertical wells they were drilling up to 2015, but about 100 or so. Question: is the increase in horizontals going to make up for the vertical wells that are not being drilled now? Verticals begat low producing but, supposedly, longer lasting wells with, supposedly, only about a 20% decline. But a decline of 20% would still be a factor, as they have not drilled much of them since 2015. All these apples and oranges, and experts are mostly applying the data equally. I don’t think, at this rate, that we would see much of an overall increase out of the Permian; based upon current activity levels. May even be a decrease, eventually.
Hi GuyM,
I believe the horizontal wells are much more productive than the vertical wells at an EUR about 5 times higher for the average horizontal vs recent average vertical wells. So 1150 vertical wells would have roughly similar output to 230 horizontal wells. The vertical oil rig count went from 215 in Jan 2015 to 30 in Jan 2016 and has remained between 15 and 43 rigs since Jan 2016.
Output has been increasing over this period without a lot of vertical rigs. Horizontal oil rigs have increased from 116 rigs in May 2016 to 260 rigs in Feb 2017, in August horizontal oil rigs were at about 160 and the May to August average horizontal oil rig count was about 137.
Based on EIA data the Permian Basin has increased output by about 300 kb/d over the past 12 months, but this increase has been offset by falling output in other plays (Bakken down 194 kb/d and Eagle Ford down 307 kb/d).
The increase in rig count for horizontal oil rigs is likely to lead to increased output, maybe 200 kb/d from all US LTO plays in 2017.
And what about the decline rates from the verticals? Increased the last twelve months, no doubt, Increase in the past three months? Doubtful. Rig counts don’t translate to completions. According to a search of completed oil wells in District 8 during January, there were about 165 initial production horizontal wells completed, and about 60 vertical oil wells completed. There is only about a hundred more horizontal wells being completed now, than in January of 2014, and about 866 less vertical wells. And I don’t buy 5 times. Initial maybe 3, but the decline rate is a lot higher.
Hi Guy,
Check out the data at shaleprofile.com
where the focus is on horizontal wells and the productivity of the horizontal wells has improved a lot in the Permian Basin since 2014. Where do you get the data for horizontal vs vertical wells? I am surprised so many of the wells are vertical, interesting.
“Based on EIA data the Permian Basin has increased output by about 300 kb/d over the past 12 months, but this increase has been offset by falling output in other plays (Bakken down 194 kb/d and Eagle Ford down 307 kb/d).”
This will largely continue to be the case. Increases from Permian cannot exceed 450-500 kbd per year (until peak by 2020), Bakken will continue to drop 150-200 kbd per year, and Eagle Ford is largely flat. +300 kbd increase from shale only makes up for decline in Venezuela…
Hi AlexS,
Usually you put a lot of thought into your positions, I would be right more often if I agreed with you more often. 🙂
Oh and that increase is based on the monthly model estimates from Dec 2016 (4100 kb/d) to Dec 2017 (4340 kb/d) rather than yearly averages.
Peak Oil Exports
Great post Euan, thanks. World oil exports peaked in 2006 and no one noticed. They thought they had debunked peak oil all the while it was slapping them in the face.
The comments on your post are fantastic, especially from Jeffery Brown.
Seems that current production reporting by EIA is based on what the Short Term Energy Outlook estimates. Not sure what those experts are smoking. Texas can’t be up much through Feb., based upon the number of completions, which are already posted. Bakken is pretty sickly, so the extra barrels have to be estimated from what they imagine is happening in the GOM. It will take six months for them to realize they over estimated the GOM, again. The beginning of 2016, they estimated the GOM to be producing over 2 million by now, but they brought that back down within the past few months. Now, they are picking that back up, again. Any rate, it is not close to reality.
I got a queasy feeling the industry tends to overestimate what they can do with those deep Eocene sandstones in the deep water Gulf of Mexico. I saw what happened to the ultra deep production in Venezuela, and it had very uneven performance. In Venezuela oil columns are huge, but the rock quality changes in a fairly predictable way which many engineers seem to ignore, so they keep punching holes that fail to produce as much as they expect.
North Dakota oil production is doubtful to grow much in next few months Bold mine.
We had real good weather for putting some wells back into production,” Helms said in a conference call. “Things got back on trend.”
Still, he said production should remain flat if not fall in the next few months. In fact, he doesn’t expect monthly production to top 1 million barrels per day again until 2018’s fourth quarter.
North Dakota produced 1 million barrels per day from April 2014 through July of last year. Since then, the state has topped 1 million barrels per day only in October and November.
This was Helms speaking on a conference call. This stuff was not in the Director’s Cut.
Ron you got lots of records to keep, but NOTORIOUSLY verbal predictions like this don’t get tracked to compare to actuals at a later date. Can you park it in a folder?
This is a folder, the only one I have. Anyway it is unlikely that I will be posting anything in the fourth quarter of 2018. Hell, I don’t buy green bananas anymore. 😉
Hi Ron,
I think it is not very likely that US LTO output will increase in 2017, especially if the EIA’s oil price forecasts are correct. Perhaps output will be flat at best, but if oil prices remain at $60/b or less for 2017, as many are assuming, (not me, but typically oil prices do the opposite of what I predict 🙂 ) US LTO output is more likely to continue its decline.
From STEO March 2017
https://www.eia.gov/outlooks/steo/query/index.cfm?periodType=MONTHLY&startYear=2016&endYear=2018&formulas=x146x8
Chart below shows STEO estimate for Brent crude (blue dots), and I also show the linear price trend from 2016 extended to 2018 as well as the exponential trend.
I expect oil prices will fall between the linear and exponential trend lines and if I am correct US LTO might rise between 100 and 200 kb/d from Dec 2016 o Dec 2017. The STEO price forecast would lead to a decline in US LTO output of at least 100 kb/d by Dec 2017 in my opinion.
And prices today are:
Hi Ron,
Yes the options are under $56/b all the way to Dec 2025. The futures markets are wrong just as much as I am. 🙂 Does the STEO price prediction look reasonable to you? Let’s say you believe the IMF World Economic Outlook from Jan 2017, link below
https://www.imf.org/external/pubs/ft/weo/2017/update/01/
which has World economic growth at 3.4% in 2017 and 3.6% in 2018 (constant dollars). Doesn’t the price forecast seem on the low side if those economic forecasts are correct? The assumption seems to be that oil is plentiful and will remain so until Dec 2018. I think this last assumption is incorrect. You probably think the economic forecast is too high and you may be correct, a recession would keep oil prices low, I don’t think that is likely over the next few years unless oil prices rise much more than the exponential trend over the past 13 months, rising to $150/b by Dec 2018 for example may well lead to a recession.
Prices in the STEO are based on futures curve; it’s not the EIA prediction.
Hi AlexS,
From the STEO March 2017
EIA forecasts Brent crude oil prices to average $55/b in 2017 and $57/b in 2018. West Texas Intermediate (WTI) crude oil prices are expected to average about $1/b less than Brent prices in the forecast. NYMEX contract values for May 2017 delivery traded during the five-day period ending March 2 suggest that a range of $46/b to $63/b encompasses the market expectation for WTI prices in May 2017 at the 95% confidence level.
https://www.eia.gov/outlooks/steo/report/prices.cfm
You are correct that the forecast is based on the futures strip, but it is a “forecast” based on the text of the STEO. Generally a forecast and a prediction are considered synonymous.
fore·cast
ˈfôrˌkast/
verb
verb: forecast; 3rd person present: forecasts; past tense: forecast; past participle: forecast; past tense: forecasted; past participle: forecasted; gerund or present participle: forecasting
1.
predict or estimate (a future event or trend).
“rain is forecast for eastern Ohio”
synonyms:
predict, prophesy, prognosticate, foretell, foresee, forewarn of
“they forecast record profits”
https://www.google.com/#q=forecast+dictionary&*
It will average $63 in 2017, and at least $65 in 2018.
Hi Fernando,
🙂
I think you are pulling my leg.
Do you really think $65/b will be enough to keep oil supply high enough to meet demand through the end of 2018?
Seems to me there is not enough $65/b oil left to be produced to keep supply high enough to meet demand. Can the oil companies keep losing money long term?
Permian LTO has a full cycle cost (at a 10% discount rate) of $81/b. Other LTO plays are more expensive (Bakken because of higher transport cost). Deepwater is not cheap, do you expect OPEC and Russia will keep prices in check?
I wrote “at least” because I think it has upside. I’m starting to buy some more service company stocks.
$150 oil by Dec18 would cause a recession.
Recession is very unlikely until 2019. I expect IMF’s global growth projections to prove slightly conservative.
Hi Yaman.
I do not think the IMF expects oil prices to reach $150/b by 2019, and I don’t think that is likely either (less than 10% probability in my opinion). I do believe oil supply will become tight by 2018 and we might see $100/b by Dec 2019, however I never predict oil prices correctly. The EIA’s reference oil price scenario in AEO 2017 is likely to be too low.
They EIA STEO was interesting (p.4 March 2017): “Global oil inventories are estimated to have fallen at a rate of almost 1.0 million b/d in February.
In the United States, total commercial petroleum inventories decreased by 7 million barrels in February, the first February decline since 2013, driven by declines in petroleum products.”
This is the opposite of what is said in the media. Remember that this is February when stocks normally increase.
IEA release their monthly oil market report on Wednesday 15. It’s made available to public 14 days later and will be interesting as it contain charts of OECD stock levels in different regions. If stock drawdown in OECD outside US has continued as before then these countries will soon be back to normal levels and further drawdowns will have to come from US. Total overhang is approx. 300 mb in OECD so -1 mbd would send stock levels back to the average level at the end of this year (and spare capacity at very low level). I don’t expect this to happen but it illustrates that it can go faster than many think.
Hi Jeff,
Oil use is higher so “normal levels” of inventories should be based on days of inventories, when OECD stocks fall by 150 Mb, prices will start to rise because raising output may not be quick, US output will not bounce back quickly at low prices and neither will oil sands or deep water. Whether OPEC output in Libya, Nigeria, Iran and Iraq can rise very much above present levels is a big question.
If they can and oil prices remain low, US output won’t grow by more than 1 Mb/d over the next 3 years. When supply becomes short and oil prices rise, there may be some possible growth in US output, but only with oil prices rising above $100/b for the kind of growth forecast by the IEA (and even at high oil prices their forecast is very optimistic).
It will be interesting to watch.
Anybody know the NoDak fiscal budget schedule? Does Helms have a governmental responsibility to provide production (tax revenue) projection to the budget people so they can have enough money projected to pay state employee pensions and pretend not to have a problem?
Funny you should ask.
Here’s a Moody’s presentation dated today, March 9.
https://www.nd.gov/omb/sites/omb/files/documents/public/moodys-analytics-nd-revenue-outlook.pdf
Cool graphs on taxable sales as a function to wells available for production (what interesting phrasing)
Here’s NoDak OMB’s report with projections. They lean on oil pretty hard:
https://www.nd.gov/omb/sites/omb/files/documents/public/omb-2017-19-revenue-forecast-presentation-3-9-17.pdf
Bloomberg, and presumably oil traders, typically base their calculations on the figures for crude inventories : https://www.bloomberg.com/news/articles/2017-03-08/oil-holds-losses-near-50-as-u-s-stockpiles-expand-to-record
rather than actual production figures.
Inventories seem like a good gauge, though. If inventories keep increasing, this would suggest that too much oil is being produced, and therefore prices should go down.
But why crude when gasoline and distillate combined dropped by more than 1 mmbbl more than crude rose? And why only in the USA where storage volumes looked as if they are continually skewed by lighter oil being delivered which then needs to be exported to be refined? The rest of OECD and some significant OPEC countries have noticeably declining storage.
Hi George,
I agree, just looking at US storage levels is not very smart, oil is a World market and the change in crude storage levels for the month was equal to one days net imports of crude for the US. These oil traders are caught up in the hype of the “robust recovery” in LTO, which as Ron showed, is a mirage.
Hi Boomer,
The report states that total commercial inventories (crude plus products) decreased in the most recent week. Crude inventories went up by 8 million barrels or by less than a days input to refineries (typically about 15 Mb/d), net crude imports are about 7 Mb/d.
So much ado about nothing basically.
Yet they surely include the imports of oil to the USA? I’ve a feeling I saw that somewhere. And some argue that the estimates are misleading since shale production began.
Don’t you think the story the public will get will be the narrative that makes the oil industry and politicians look the best? So we’ll hear everything is going great until things are so bad it’s impossible to pretend that they aren’t.
We are being warned that oil production will go down until there is more investment. But are we being told that so investors will put more money in? Or as a cover for the industry as reserves decline? Or as an honest attempt to prepare the world for less oil and higher prices?
Again, I turn to this forum to get some accurate data on decline rates. What the news tells me I analyze based on what I think is happening beyond the press releases.
I think the oil company managements would really like investors (i.e. suckers) to put more money into their paychecks.
I agree boomer. I think that there is a deliberate attempt to talk up U.S. production through bolstering “confidence” and a willingness to turn a blind eye to the facts. But also plenty of commentators who fool themselves in various ways. In any case the goal of production in general is sort term gain/profit rather than long term production.
Hi Pete and Boomer,
The LTO oil companies try to talk up their outlook to get investors to buy their stocks and bonds. At the same time they hope that lack of investment in big projects with long lead times (deep water and oil sands) along with continued cuts by OPEC will lead to higher oil prices.
A lot of these analyses with low “break even” prices are ridiculous, using no rate of return on the money invested and ignoring land costs, royalties, taxes, transport along with using “typical” well profiles that are far from typical (they are often double the output of the average well).
The real breakeven oil price for an average US LTO well (including full cycle costs) is probably over $85/b, possibly $90/b when interest costs are included.
This is why the “robust recovery” of US LTO at $57/b is absurd.
I certainly don’t disagree Dennis. There was talk of halving the cost of fracking to $5m and massively increase production per well, but even with all the genuine development of techniques behind the hype, all they seem to have done is raise a few bumps on the road down so far.
There seem to be enough warning signs about the LTO bubble that there shouldn’t be any surprise when it pops and if there is any collateral damage.
The collateral damage won’t necessarily be because of investors, companies, funds, and banks losing money. But it could be a shock to the system if the end of the myth of LTO forces the country to look at its energy future.
That’s what I am speculating about. The combined decline of LTO and the lack of new reserves in conventional oil.
How long can people and politicians turn a blind eye to energy issues that will affect the country and the economy? I do have hopes that the US military will at least push for better energy strategies for itself. Now whether the GOP will fight the military on that, I don’t know. But if it comes to a point where oil producers can’t keep up with US oil demand, then I suppose the politicians have to listen.
Yeah, if it was a “robust recovery” on $50 oil, then upstream companies would be making money, and they are losing. Tells me something. I think they can make decent money at $70, but they would still just be drilling in the “hotspots”, which will never increase production. Be fools if they did. Drill up all the hotspots, and leave the places that will make money only on $85 and up, when prices are below that, is more than dumb. The press remind me a lot of the Alice in Wonderland conversations. EIA playing the Queen.
Don’t rightly know how new you are here, but it’s possible you have missed the various discussions about the definition of break-even.
You can break-even at almost any price you like if you define it particularly.
Imagine the breakeven price if you borrow money to drill and frack the well but then renegotiate the loan such that payments are defined to be lower and lower and later and later. The obvious precedent was real estate. Homeowners got behind on payments, renegotiated their mortgage, and the day the new agreement was signed, all delinquency was purged. That homeowner was up to date on his payments, even though he had not paid a cent in years.
Quite a few did this several times.
There are poor locations and good locations, and a vast range in between. If the term breakeven gets you riled, then you can make money, or lose money, dependent on the location and oil price. So, I replace the term breakeven with make money or lose money. Happy?
There are a lot of locations where the eventual recovery ranges in the 80k to 150k to within 3 to 4 years, with a small trickle after that. At 40 to 50 oil price, the win/lose determination is absolute. They are losers. At 100 oil price, you can just keep drilling, because they can’t lose.
EOG is a lot more particular. Winners make around 200k the first year, and locations to hold on to make around 100k barrels the first year. The rest they have been dumping, and they have a lot of buyers. They are obviously interested in recouping most of their drilling costs the first year to avoid financing. That’s their goal, and they will probably succeed, but they are still losing money now.
Hi Guy M,
The thing that the EIA seems not to understand, is that there might be 15 to 20 Gb (with 8 Gb already produced at the end of 2016) of economically recoverable resources (winners in your terms) at oil prices under $60/b. Perhaps there are enough of these high EUR locations left to raise output in the near term, but based on the information at shaleprofile.com the average well profile has changed very little so the high EUR locations may be running out.
Also note that the well profiles of the average well completed in the Permian basin have been increasing from 2013 to 2016, the average 2015 well has an EUR of about 269 kb and a breakeven cost (full cycle with a 10% annual ROI) of $81/b.
The increased well completion rate in the Permian basin is likely to lead to increased debt unless all the companies complete wells that are above average 🙂 .
So with lower costs to drill and complete, and a slightly smarter completion and location selection, that $81 can be lowered by 20 %, for a while? What’s 81 times 0.8?
Hi Fernando,
From what I have read current costs in the Permian are about $9 million per well, which is what I used for my breakeven calculation.
My understanding is that costs are about as low as they are likely to go right now, so as completion rates go up, I would expect costs would increase rather than decrease.
So I think a further 20% drop in well costs is not in the cards, perhaps well output will increase by 20%, but I think they probably have the optimal setup figured out by now, so further increases in new well EUR will be minimal (or that is my guess). So after 3 years with low oil prices and everyone cutting costs to the bone, you expect a further 20% cost decrease?
You cannot be serious. 🙂
Yes, but all those oil companies get to report results in the PERMIAN. Ipso Facto, they are winners, even if their income statement is atrocious. I read a earnings release by one of the smaller oil companies, where it was never mentioned what net income was. Lotta hoopla, but in the end they did mention that they had an income tax benefit. But they had rigs in the PERMIAN.
Hi Watcher,
And how did that work out?
Not very well as I recall.
in 2012, after JPMorgan Chase lost $2 billion in a single boneheaded trade, President Obama defended CEO Jamie Dimon because he was “one of the smartest bankers we got.”
“The real breakeven oil price for an average US LTO well (including full cycle costs) is probably over $85/b, possibly $90/b when interest costs are included.”
I agree with this statement; however, it is not the AVERAGE well cost that matters to prices. It is the MARGINAL well cost, which is above $100/b in less productive areas of Bakken.
Hi Yaman,
Economics tells us the marginal cost should determine price.
Oil is a little different because nobody knows in advance what the cost of the barrel will be from any well that id drilled. The cost per barrel depends on how many barrels the well produces over a period of time and each well is different.
So for any given company, they have an expected value for the wells they will drill and typically this will be the average well.
I don’t know if the marginal producer (at the oil company level) is at $100/b. Many of the marginal producers may have stopped completing wells. The completion rate is only one third of the peak rate so many of the less productive areas see lower activity levels.
Below shows days on line for producing wells. I didn’t show November as it gets complicated with only 30 days, but overall it had availability similar to October. Overall a lot of wells were knocked off line for 1 to 5 days in December, and they were still coming back on line in January. Most wells were offline for at least one day in the four months through January. There are over 1200, mostly old, wells that didn’t produce at all in the time, even though listed in monthly production data.
Thanks Ron.
I’ve also published my take on the latest data, here.
Enno don’t know if you saw it, but from your chart, and the mouseover read out of the data, I measured 2014 wells 1st yr decline rate at 62ish% as I recall. 2013 was high 50s. 2012 55% or something like that. The 2014 curve looks much steeper, but those are the numbers. 2014 decline rates were higher than preceding yrs, but they look much more so. Any chance there’s a scaling thing yr to yr?
Watcher,
Which chart did you use?
The first on the site. The one that shows output by year. “Year of first flow”
I’ve wondered who is supposed to invest so that there isn’t an oil crunch five years from now.
I’ll also ask who is the audience for these comments? Are the people who are making these comments think the oil companies need to be told to invest more? Or are these comments for public consumption?
Are the oil companies so unaware of the future that oil organizations and investment bankers need to tell them to invest? I doubt it.
So I think these predictions of an oil crunch without more investments and more spending are being made for other reasons.
I don’t doubt there will be an oil crunch down the road. I’m just not sure urging more investment is going to change that.
Hi Boomer,
If done right the investments can help to mitigate the steepness of the decline. The problem is that the economists are still claiming that oil is plentiful. It is not clear why the geophysicists don’t correct this misconception. At least those working at the USGS may not be muzzled by their employer, those that work in the oil industry may fear they will be fired if they speak honestly about peak oil, unless they own their oil company.
For economists it’s easy. If we recover only 30% of the original oil in place and oil prices increase, the magic of technology will boost the average recovery factor to 40%, when that’s not enough we move to 50%. Just use the technology wand and all wishes for more energy will be granted. /sarc off
They seem to forget that increasing recovery factor doesn’t necessarily increase rate that much. In some cases it just reduces decline rate.
Hi Fernando,
Good point. I think they also forget that costs can rise quite a bit as well.
IEA has several roles and peak oil falls between two stools. The organization is not allowed to draw conclusions such as scarcity/geological factors will constrain economic growth. However, one of their original roles is to be the “energy watchdog” of OECD-countries and assess issues related to energy security. Above ground factors that constrain supply (lack of investments, political instability, etc.) can be discussed.
Their message has changed over the years. This link provides an overview up until 2014: https://integralpermaculture.wordpress.com/2014/11/12/watching-the-watchdogs-10-years-of-the-iea-world-energy-outlook/
“The IEA World Energy Outlook has gradually moved from rosy to pessimistic reports over the last ten years, or what Stuart Staniford called “increasingly reality-based.” Over the last decade, the report’s projected oil demand has gradually decreased by 20 million barrels per day (mb/d), and the projected costs have continued to rise. Yet even their most pessimistic reports, I believe, fail to capture true reality. It seems that politics plays a strong role in what is allowed to be published.”
The quote is from 2014. IEA have become a lot more pessimistic (realistic) since then. It used to be rainbows and unicorns but I would say that unless you are blind and deaf if you get their warning by now.
Interesting. So the IEA can’t say “We’re running out of cheap sources of oil,” but it can say “We’re running out of money to get oil.”
So I suppose it amounts to the same thing if you understand its meaning.
Hi Boomer,
I think their implicit message is that we can produce more oil, but it will be expensive. And if oil prices don’t rise there will be inadequate supply.
They do not say either of these explicitly, but when they say we need more investment or there will be inadequate supply, the implicit message is expensive oil aka higher oil prices.
I believe they leave it to the World Bank and IMF to guess how high oil prices might effect the World economy, though those organizations are dominated by economists that believe oil can be created by the magic of technology. Just increase recovery factors and stop leaving 70% of the OOIP behind, just extract all of it and there will be plenty 🙂
Oil should be $30/b forever /sarc off
From this week: Shell is going more for gas and renewables, ExxonMobil might be going after Anadarko, or even BP. New oil as an investment looks to be slipping down the list of priorities still further.
Yes, I think we’re witnessing the decline of the majors as oil companies. They may be transforming themselves into energy, rather than oil, companies. Or they may be focusing on doing something else entirely with their financial affairs (like selling off what they can to keep investors happy).
I think when the oil crunch hits to such an extent that it is undeniable to everyone, the signs that it is coming will have been visible for awhile (like starting now) to those who have watched developments with these companies.
We’ve got the IEA saying there won’t be enough oil in a few years without more investment, and we have the majors backing away from that investment. Seems to me that the industry itself understands declining resources and maybe it isn’t worth going through the motions of trying to keep developing them.
The peak oil people have been focusing on this for years, but since the timing of their predictions has been off, they have been discounted. But I think if we keep our eyes on LTO decline rates, and what major oil companies are doing, we can get an idea of what might be happening, if not talked about to the public.
The majors aren’t in the business of looking after civilizations’ energy needs. They are there to make money for the shareholders – and the shareholders want dividends above all else, now more than ever as pension funds are seeing how stretched they are (actually they’ve probably known for a long time but their members are suddenly starting to realise). Shell reducing debt through sales is in response the shareholder action. Debt was taken on to maintain dividends and now any increased money needs to pay off the debt and reduce interest – also to maintain dividends. Everything gets more short term no matter what. Significant long term investment might not look attractive again until prices have been high enough for long enough to reduce most of the new debt taken on over the last few years. At which point a lot of demand might be killed off.
From a business standpoint, oil may no longer be a profitable business to be in. I suppose as long as people will pay the price for oil, some companies will deliver it, but if you are looking at all potential business opportunities, why oil?
A company’s expertise may be in finding and producing oil, but if the current generation is retiring and wants to get their money out, and if new generations aren’t interested in doing this, then there’s little motivation to go forward unless the money in doing so is very good.
They certainly seem not to know in which direction to turn at the moment (except the Permian for all). Really IOCs and large independents have two skill sets that can’t be found elsewhere and might be the reason for their evolution: reservoir departments that find and work out development plans for large oil/gas deposits, and management and financing departments that can handle multi-billion dollar mega projects. They are not doing much of the first and a declining amount of the second, certainly for oil though there’s a few big gas projects still to go.
Shell still need about $20 billion more I think, I don’t know what else they have to sell easily – it might have to be a big natural gas piece, or something downstream, or do they have bits and pieces around Africa and Asia?
OPEC CUT 40 PERCENT MORE IN FEBRUARY THAN PLEDGED IN OIL DEAL: KUWAIT
http://www.reuters.com/article/us-energy-opec-cuts-idUSKBN16F24K
“Kuwait Oil Minister Essam Al-Marzouq said on Wednesday that OPEC’s compliance with an oil output cut reached last year stood at 140 percent in February, while non-OPEC members compliance was 50-60 percent.”
Doesn’t Russian output usually have a significant drop in February? I’m not sure why it happens but can remember the pattern looking like that.
Bonga is offline in Nigeria for up to 6 weeks so another 200,000 bpd will come off March figures for OPEC, but Angola is likely to show a significant increase.
“Doesn’t Russian output usually have a significant drop in February? I’m not sure why it happens but can remember the pattern looking like that.”
Normally, some offshore projects close for maintenance in July or August.
Russian output was virtually flat in February vs. January (-2 kb/d) and down 121 kb/d from October 2016 reference level.
Russia has pledged to cut output by 200 kb/d by end-March and by 300 kb/d in April or May (vs. October 2016).
Russian C+C production (mb/d)
source: Energy Ministry of the Russian Federation
Right another senior moment, which I’ve done before and forgot all about: the curve for total production drops just because February is a short month, daily production doesn’t change.
“the curve for total production drops just because February is a short month”
Yes, if you look at monthly production in thousand tons, as reported by the ministry.
Hi AlexS,
Does the fast increase last fall look like Russia increased output as fast as possible in anticipation of cuts?
It almost looks like the cuts will put Russia back on the trend line from Jan 2013 to May 2016, you guys are pretty smart 🙂 .
Dennis,
Several new projects came onstream or ramped up output in September-October 2016. This had nothing to do with the OPEC-non-OPEC agreement.
Other new projects are planned for this year, so the output cut was due to less infill drilling in old regions and temporary shut-in of some producing wells in these regions.
According to Russian experts, if not for output cuts, the country’s oil production could average 560 million tons, or 11.24 mb/d in 2017.
So roughly flat output from the Oct 2016 level without the cuts. Is the forecast through 2030 (or 2040) for a plateau of around 11 Mb/d?
The base scenario of Russia’s energy strategy anticipates slightly increasing production until 2020 and then flat output to 2035.
But near-term projections were already exceeded in 2016
Thanks AlexS.
So 10.92 Mb/d by May 2017, if the 300 kb/d cut is met.
According to the energy ministry, October reference level was 11,247 kb/d, so
planned decline implies 10,947 kb/d.
Actual average output in October was 11,230 kb/d (using the 7.33 barrels per ton conversion factor). The ministry probably uses peak daily or weekly number as a reference.
Thoughts on Repsol’s Alaska oil discovery announcement?
Difficult development, those sands tend to be hard to water flood, and the reservoir is relatively shallow, so directional wells have to turn in a hurry. I assume they would be using several large pads and extended reach wells to reduce foot print. Will have to get access to Kuparuk, which should actually help the heavy oil development in the unit.
Hi Fernando,
Does it work at $63 to $65/b? It sounds expensive.
Dennis, I don’t know enough about it. They will have to get access to the Kuparuk and Alyeska systems, and I’m not sure what the state of Alaska taxes look like nowadays. The rocks are known to be somewhat irregular (they won’t be that well connected), and I’m not sure about oil viscosity at reservoir conditions. I haven’t consulted in the north slope for several years, so I’m a bit out of touch.
Even with optimum returns, it is a 10 days worth of world production.
(if my numbers are correct)
I read an article saying it was about four years of Spain’s petroleum needs. In other words, not very much there.
Isn’t it a bit silly to think of the discovery in Alaska as if it were “Spain’s” oil? I’ve read all sorts of comments in the press here, some even referred with pride to Spain ripping off USA oil reserves. People here in Spain don’t have the foggiest idea about the business.
That’s just how one article referred to the discovery. And I don’t think the author meant the oil was going to Spain. He was just using that expression to explain the size of the discovery. It would be enough to supply Spain’s needs for four years. Considering the size of Spain, that’s not a lot of oil.
http://oilprice.com/Energy/Crude-Oil/Iran-And-Iraq-To-Ramp-Up-Oil-Production-Despite-OPEC-Cuts.html
According to the IEA, Iraq will increase its output to 5.4 million barrels per day by 2022, which is significantly higher than the earlier estimates of an increase to 4.6 million bpd by 2021. Similarly, Iran is expected to boost production by 400,000 bpd to reach 4.15 million bpd production in 2022.
…
Iraq, which produced 4.47 million bpd in January, well above its quota of 4.35 million bpd, is capable of raising its output to 5 million bpd in the second half of this year, said Iraq’s Minister of Oil, Jabbar Ali Al-Luiebi.
…
Iran wants to increase its production to 5 million bpd by 2021. However, it needs investments by foreign investors to achieve that target. This will not be a new high in production for Iran, because it used to pump in excess of 6 million bpd in the 1970s, before the Islamic Revolution drove the western investors away. A fresh round of foreign investment is the key, which is yet to take off in Iran.
Nevertheless, with every major oil producer looking to boost production, the oil glut is here to stay.
“the oil glut is here to stay”
Is that really written in stone?
the oil glut is here to stay
Yes, forever and forever. But perhaps you misspoke. Perhaps you meant “to stay for a little while.” 😉
Those are quotes from the linked article. I expect the glut will be over by mid 2017, but if OPEC increases output at that point it might last a bit longer.
I am very doubtful of claims by the IEA that US LTO output will increase significantly near $60/b, it might increase a bit due to increased completion rates in the Permian and Eagle Ford, but continued decline in the Bakken may offset some of this increase.
The LTO oil companies will continue to lose money, at some point these companies become bankrupt, they have lasted much longer than I would have thought in Jan 2015. I do not think losing money year after year is a viable business model, but as long as investors are willing to part with their money, it will continue.
I’m curious about what you all think regarding the cartoon graph below.
It appears to me we may be in an oil price cycle driven by Opec production cuts driving the price of oil up only to be offset by US shale production gains driving the price back down. How long can this cycle continue? If oil prices drop too much will Opec cut production even more, to be offset by US shale producers increasing production even more? Will Opec be the ultimate “winner” by keeping prices in the $50-60 range, and forcing enough shale producers out of business, resulting in a steady increase in oil price, or, are enough shale operators able to make a profit at current prices such that $50-60 prices could be with us for quite a few years?
SLG – on the supply side there will be a significant change starting in the second half of 2018. That is when new conventional and oil sand production drops from over 3 mmbpd additions per year to less than one million, and falling. Look for some time a bit after Khurais expansion comes on line and Egina is installed up to when Big Foot goes into the GoM. The LTO and OPEC changes have been variations on a constant trend of new projects started in the high price era. The change in that trend will have a much bigger impact than the noise on top of it. I am not convinced all the OPEC cuts are voluntary but we might find out in a few months. There may be equally big impacts on the demand side over the next two years but I think anybody who predicts such things accurately just gets lucky, and usually only manages it once.
The megawild card is what the demand destruction rate will be in the second half of 2018. The *timing* of this is incredibly hard to predict, because very small changes at the start of an exponential ramp can move the crossover point by *years*.
I currently expect the demand destruction to hit in force sometime circa 2023, which would mean there’s one more oil price spike in the 2019-2020 period. (That would cause so much more electric car factory construction that the demand destruction starting in 2023 would be even larger, and that would be the end.) But I could be wrong; demand destruction might come early.
Somewhere up thread, or maybe in the last thread, it was mentioned that it people have been very slow to switch from oil burners to heat pumps.
Maybe so in other places, but where I live, if you want a new oil furnace, you have to place an order for it at least a month or so ahead of the desired delivery date. None of the local heating and air contractors bothers to stock even one unit any more, and wholesalers don’t keep any in local warehouses.
Heat pumps virtually own the residential space heating market now, in this part of the world, but otoh, we don’t have much in the way of utility gas. If you want gas, you have to have it delivered by truck, and that runs up the price.
I’m expecting to see the industry move to heat pumps hybrid style, powered by both electric motors and internal combustion engines, burning gas,either natural gas or propane, within a decade or so.
The heat thrown off by the engine will captured for heating hot water and for space heating during the winter. During the air conditioning season, the heat pump will run on the electric motor, except when the hot water supply needs topping off.
Folks who have their own pv systems will be able to feed any surplus into their heat pump during cool weather and store it as heat in a slightly over heated house if they can’t sell it back to their utility, or charge up their own batteries. This would result in needing less heat during the night.
$50-$60? The price hasn’t been in that range except for maybe 5 months out of the last 27.
Me being greedy wants to see $55-65, but that seems a pipe dream.
Hi SouthLaGeo,
I doubt US LTO output will increase by much if oil prices remain $65/b or less, possibly an increase of 250 kb/d so not enough to offset OPEC/nonOPEC cuts. Also the lack of deep water investment will hit output in 2020 and as oil prices increase any increase in LTO output (possibly as much as 2 Mb/d at over $100/b over a 2 year period) may not be enough to offset the fall in output elsewhere, perhaps OPEC will be able to fill in the gap, but if they are smart they will wait for US LTO output to decline, which if 6.5 Mb/d is even attained it will last no more than a year and will decline relatively steeply as even $120/b will not be enough to make the LTO plays profitable as sweet spots run out and new well productivity decreases. The EIA estimates for future US LTO output are too high by at least a factor of two unless oil prices rise above $150/b (in 2016 $)by 2025 and then gradually rise to $200/b by 2050.
By that time the transition to non-ICE personal transport and AV transportation may start reducing oil prices due to lack of demand after 2045. So I doubt we will ever see oil prices average above $150/b (2016$) over a 12 month period, also a severe recession is likely to result from any oil price spikes above $150/b especially before 2030.
Supply projections past 2030 are pointless; demand destruction will be more than sufficient to make all drilling unprofitable by then. At that point it’ll be pretty easy to make supply projections based on the curves from existing wells, but very few people will care.
It’s much harder to say exactly what year the demand crossover is going to happen. Definitely not before 2019 (and I consider 2019 highly unlikely). But definitely before 2030. I’m currently leaning towards 2023, but it could be 2027.
Investment money should dry up in advance of the demand crossover, though who knows, there’s a lot of dumb money out there.
I think both those production numbers will be considered as disappointing compared with original expectations by the respective countries. Iraq were looking at 1 mmbpd from Majnoon and about 800 kbpd from West Quran on top of 170 kbpd from Badra that is due this year (through Gazprom). They are only going to get half. The ramp up for Iran is really slow, and almost certainly they are putting an optimistic spin on it. I think IEA numbers might be relying on much higher and faster increases from these two, even if not officially. Does any of that look like the behaviour of countries with supposed R/Ps of almost 100?
Growth in oil rig count stalled in key LTO plays.
US oil rig count is up 8 units, but 6 of them are in conventional basins.
Permian: +1
Bakken: unchanged
Eagle Ford: -1
Cana Woodford: -1
Only Niobrara added 4 rigs, but oil rig count there only returned to January levels after having declined in the past 2 months.
Hi AlexS,
The Permian is where the biggest increase in horizontal oil rigs has been over the Sept to early March period at more than a 50% increase. This is more than high enough level to use up all of the increased CAPEX for 2017 (at +30% as I recall), so that may explain why rig counts have stalled.
Dennis,
Non-Permian players, like CLR, are also projecting an increase in capex and production volumes. But you are right, most of the growth will be in the Permian.
Texas permitting is going gangbusters though – over 200 a month (oil and gas combined) in Eagle Ford and over 450 per month in Permian. If maintained they will both beat 2015 numbers, though still well off 2013 and 2014.
If you go back and look at when permits increased before, it was almost a year before there was much in a pickup in completions. I mean way back. There was a backlog of about 9 months from completion of drilling to fracking and production. Services are pretty sick, right now. I look for the same.
“Aaron Brady, a senior director with IHS Energy Oil Market Services, said US shale oil production could grow by 600,000 b/d through this year.
Platts Analytics’ Bentek Energy forecast that US production will climb by more than 550,000 b/d by the end of 2017 and “higher prices would only incentivize stronger growth,” according to Jenna Delaney, an analyst for Platts Analytics.”
http://www.platts.com/latest-news/oil/washington/ceraweek-shale-boom-may-threaten-opecnon-opec-21115956
AlexS, what is Mr. Brady smoking? :)What “higher” prices? It is what-not $40 at WH in Dakota? Western Canada Select is even less. It is all hocus-pocus at this point. They know absolutely nothing. If there is no comprehensive agreement by all major producers I really doubt that oil price would be $60 by end of the year. So it is not price but availability of the sweet spots. I thought that there would be some solid agreement between OPEC and non-OPEC, including US producers with new administration, by now. But it does not look like. I was very mistaken. It is all political and it has always been.
>>They know absolutely nothing. >>
There is a TON of agenda in all things oil. Words are weighed carefully to suggest, imply, direct, insist, threaten and beg for higher prices.
They know absolutely nothing. Reporters have copy deadlines to get text filed by, so we have to hear them.
You notice how aggressively they got Michael Lewis off the radar screen? And he wasn’t even talking about NYMEX (then).
They know absolutely nothing. Some of them know nothing because they make a conscious effort to be sure they know nothing.
It’s going to be amusing to watch the scramble now to show how production was always growing and price has to fall, as opposed to maybe a week ago when the reverse was the order of the day.
So many different options.
1) The evil Ruskies hacked the NYMEX HFT engines.
2) The recent indication Trump isn’t going to undo Russian sanctions very fast . . . the Ruskies decided to resume punishment of American oil and sell oil for less. It’s just pieces of inked paper (or their digital cousins) after all.
3) KSA got mad at shale for . . . something. They can sell for any price downward that they want, too.
4) Maybe China says they won’t pay more than $48, or whatever the yuan is doing given their banking crisis.
Alaska Oil Find Small by Historical Standards | Investopedia: “Some leading oil industry observers such as IHS Markit and Rystad Energy are seeing the early warning signs of declining global oil reserves. IHS recently updated a report published last year that warns conventional oil and gas discoveries outside North America are at their lowest levels since 1952. According to IHS, 2016 marked another low, with just 8.2 billion barrels of oil equivalent discovered. Barrels of oil equivalent (boe) are a blended calculation of oil and gas measured in barrels. Rystad Energy was even more pessimistic, reporting that global oil and gas discoveries are at a 70-year low, with just 6 billion boe discovered in 2016.”
Since it’s been 9-1/2 years, 114 months, since the cusp of the last recession onset (The “Great” Recession), shouldn’t oil industry forecasters (and the forecasters in their lending companies) be thinking of potential impact on oil prices (and drilling/fracking) of the 100% certain recession in our near future? I mean, the amount of time between recessions now has been anomalous has it not? Wouldn’t the “Even Greater Recession” lead to tremendous demand-destruction and a re-visit of the $20-a-barrel WTI price? Who will be making money off $10 million wells then?
Some jokester once commented, “with enough demand destruction, technically, America can be energy-independent again!”
the amount of time between recessions now has been anomalous has it not?
Yes, but this was an unusual recession. It was a credit crunch, not the usual set of burst bubbles.
Credit crunches cause much slower recoveries. So, the recovery was unusually slow, which allows it to be much longer.
Good point, although I don’t know what will drive much of a recovery. The stock market is booming, and hiring is up, but I don’t see any reason why we would break out of a global structural recession. The only thing I see that might change global economies would be converting to renewables. Otherwise it just seems like more of the same and no new technologies to transform the world.
Traditionally, if nothing else, population growth expands economies, but in countries like the US not only is the birth rate not rising, we are planning to reject immigration as a population boost.
I am not a doomsayer who foresees economic collapse, but I don’t see a lot that is going to do for the world what electricity, antibiotics, the Internet, mobile phones, etc. have done in the past. Renewables and EVs are the only “new” thing I can see that might transform the global economy.
Yep, it’s renewable energy and electric vehicles — the “energy transition” — which are creating the next boom, which will probably eventually become the next bubble (booms always overshoot). Also efficient buildings (finally starting to happen after too many decades of talk).
Employment in those industries is booming. Should be a good boom for a while, until it starts to reach market saturation. It’s gonna absolutely kill oil, though, because these are industries which make *specific efforts* to avoid oil use for marketing reasons. Fossil fuels are the industries guaranteed to suffer in this boom.
So recession => oil demand down, and boom => oil demand down.
Dennis, the info to get to vertical vs horizontal can be obtained easily from the completions query section in the RRC site. I do not have your email, or I could send you the data I collected on the RRC site, and the Baker Hughes data I collected and sent to Ron, previously. Almost all of the 16 million per month, or so, increase in the Permian was from vertical wells from 2011 through 2015. They are low eventual recovery, as that is the way it has been until horizontal interest has picked up. There was a massive amount of these, during this time, most of the completions in Texas, during this time. My guess is that the new wells, at this level of activity, may increase the Permian for a while, but the eventual drain of the low recovery from the verticals will catch up, and flatten any long term gain in the Permian.
As a comparison, from Jan 2011 to July 2015, there were 66,271 completions reported in Texas. Of those 10,536 were reported in District 1 and 2 (Eagleford), and 46,500 reported from District 7C, 8, and 8A (Permian). I know that all of the completions in District 1 and 2 were not Eagleford, but the majority. The same with District 7C, 8 and 8A, but most. Also, most in the Permian area were vertical during that period. That is what I am referring to, when I use the term “massive” amount of completions. What we have completed horizontally to Feb should just keep up the previous horizontal wells. There is about double the amount of permits in Feb for Feb, so we could see an increase from that, but the pundits are ignoring all the verticals.
And if the oil price keeps going down, we may wind up with a lot more DUCs.
Hi Guy M,
Enno Peters estimates about 900 kb/d of Permian output in Sept 2015 from horizontal wells and the EIA estimates 1300 kb/d from all LTO wells in the Permian. So about 400 kb/d of LTO output was from vertical wells. In Jan 2011 only about 23 kb/d of Permian LTO output was from horizontal wells and the EIA estimates about 350 kb/d of Permian LTO output in that month, so about 330 kb/d from vertical wells. So over the Jan 2011 to Sept 2015 period vertical well LTO output increased by about 70 kb/d, while horizontal well LTO output increased by 880 kb/d in the Permian basin.
A lot of those vertical wells may have been conventional rather than LTO output, but the horizontal wells in the Permian and Eagle Ford have been the source of most of the increase in Texas C+C output, the vertical drilling has just kept conventional output decline rates low.
Hi GuyM,
Thanks
email is peakoilbarrel at gee male dot com.
There has been some semi-serious speculation in this forum that Tillerson took the Secretary of State job so he could sell his Exxon stock early. Currently he doesn’t seem to be doing much with the cabinet position, so maybe, once he gets his money out of Exxon, he will move on.
Rex Tillerson Might Be the Weakest Secretary of State Ever | Foreign Policy: “Tillerson’s position here is very weak. President Donald Trump has shown his lack of faith in him by vetoing his choice for the No. 2 position in his department, Elliott Abrams. Tillerson has also been absent for most of Trump’s meetings with visiting leaders. He likewise does not seem to be playing a central role in the few foreign-policy decisions that the Trump administration has made: He does not appear to have been consulted before then-National Security Advisor Michael Flynn took the White House podium to announce that Iran was now ‘on notice’ not to conduct further provocative missile tests; there is no evidence that his advice was sought when Trump huddled with Japanese Prime Minister Shinzo Abe in January after a North Korean missile launch; nor does he appear to have been involved in Trump’s equivocation on whether he still supported a two-state solution in the Middle East. Most dramatically, he has not been able to stave off Trump’s proposal for deep cuts in the budget for diplomacy and foreign aid.”
There has been some semi-serious speculation in this forum that Tillerson took the Secretary of State job so he could sell his Exxon stock early.
Can’t recall anyone but you talking about it.
There was at least one other person. I believe I know who did, but I won’t post his name in case I am wrong.
Here’s part of the exchange.
OPEC January Production Data � Peak Oil Barrel: Boomer II says:
Rex Tillerson may have left Exxon at right time – Feb. 14, 2017 “Exxon’s stock is now lower than where it was the day before Trump was elected. And it has lagged the broader rally despite an uptick in oil prices. Crude prices have surged nearly 20% since Election Day and are now hovering around $53 a barrel.”
Nathanael says:
02/15/2017 at 12:54 pm
I’ve been mentioning this since Tillerson’s first announcement of his plans to “eliminate conflict of interest”. I have said on several websites that the guy was a genius who just figured out how to cash out of Exxon, *even selling out of restricted stock*, which is quite a trick. It’s nice to see the news propagate to CNN.
I suspect he has zero loyalty to the industry. He figured out how to cash out.
Yep, it was me.
From my position as a long-time follower of *financial shenanigans*, cashing out of restricted stock is really quite a good trick. The entire point of restricted stock is to tie the CEO’s fate to the fate of the company. The Exxon Board of Directors could probably be sued for failing in their obligations to the stockholders by letting Tillerson cash out of it.
By the way, his money is now out of Exxon. Already. All of it. Within days after he was confirmed.
He has only been in the Secretary of State job for about a month though; I suspect he’ll try to do SOMETHING with the job before quitting. There are a lot of under-the-radar things he could do with that job which wouldn’t make the headlines. Possibly things having nothing to do with oil at all, but serving Tillerson’s personal agenda.
There’s been considerable speculation that the Trump administration wants to marginalize the State Department and leave positions unfilled.
But a lot of what the State Department does is to provide services for Americans overseas. If those functions get cut back, then it will affect lots of ex-pats, US travelers, and Americans doing business in other countries.
“Concerns about the glut grew after Harold Hamm, chief executive of Continental Resources, a major oil producer, said publicly that domestic production was growing so fast it could “kill” the market.”
He is known for his brilliant predictions. Also known for selling all his derivatives at the beginning of 2015, as the market was bound to go up.
This is the guy we almost had as the new Secretary of Energy. Scary. At least the current one wanted to abolish it, though he couldn’t remember its name.
Quite surprised IHS/CERA let this all happen at their week. That secretive Saudi / hedgie meeting. Production fist pumping from shale.
Maybe the industry will decide IHS/CERA are not team players and cut them off.
But is there a unified message? Is it that LTO (especially the Permian) is bringing back boom times? Or is that we’ll be running out of oil without more investment money?
Look at the fourth quarter profit from all the big players in the Permian. Add EOG to that list, now. Lot of hoopla on the Permian, but where’s the beef? Look at Texas completions in the Permian to Feb., and tell me where the leaps in production are coming from? I don’t think the capital expenditure increases are based on an oil price of $48. Apache plans on additional in the Permian, but at a cost to its GOM plans. With all the hoopla, they have convinced EIA and the rest of the world that the Permian is growing by leaps and bounds. They are their own worst enemy.
In the meantime, oil companies are selling off their non-productive areas to finance the operations, rather than borrowing. This appears to have a reverse effect to the M&A going on. If the oil price goes up, substantially, the non-productive areas will become productive, and the real winners will be the small companies who snatched them up.
I don’t know enough to speculate about the small companies, but I do feel a shift has happened with the big ones. Their actions suggest they foresee a time when oil won’t be their main business. And that’s a natural progression for any business that’s been around for decades (or a century). If you want to survive, you shift your activities from the less profitable to the more profitable.
Yeah, the wise ones define they are in the providing energy business, and not just the oil business. Most of the upstream will live and die as oil companies. They have a long time, yet, on the living stage. If they survive this downturn, that is.
” but I do feel a shift has happened”
Shifts come and go. Back in the late 70’s or early 80’s, when oil was really booming, Mobil [now a part of Exxon] decided that they should diversify. So, they bought the retail giant Montgomery Wards, which shortly thereafter went bankrupt. Mobil was not alone in trying to diversify.
But if the cheap oil is gone, and the price doesn’t appear to be rising, there’s no profit in oil. A company would be foolish to pin its business on that.
GE used to make appliances. Now they don’t and the company makes much of its money in financial services.
When you see your core business permanently declining, it’s wise to do something else.
I think we’ll see the big oil companies go the way of the big US steel and coal companies. Either diversify or decline.
Here’s something from 1981.
STEEL – TO DIVERSIFY OR REBUILD – NYTimes.com: “Other steel companies recently have shown dissatisfaction with their long-term prospects.
Some have turned to other industries. Earlier this month, Kaiser Steel announced it would abandon 2.2 million tons of steelmaking capacity at its Fontana, Calif., plant. National Steel, forgoing expansion in steel, decided instead to acquire two large savings and loan associataions. LTV, corporate parent of the Jones & Laughlin Steel Corporation, made an unsuccessful multibillion-dollar bid for Grumman. And Armco Inc., long a grand name in steelmaking, has diversified extensively and dropped the word ''steel'' from its corporate title.”
International Oil Companies: The Death of the Old Business Model | Chatham House: “The IOCs are faced with the choice of managing a gentle decline by downsizing or risking a rapid collapse by trying to carry on business as usual.”
Fossil fuels to low-carbon: Time to diversify? | Wood Mackenzie: “Why are fossil fuel companies diversifying into low-carbon energy?
To seize market growth.
To capture market upside.
To mitigate business risk.”
Diversify Or Die? Big Oil’s Dwindling Options For Survival | OilPrice.com: “It’s been said here time and again that diversification would be a smart choice for oil majors for a future where their product is not the single source of energy on the market. It’s nothing more than common sense – you need to move with the times if you want to survive.”
The difficulty with diversification is lack of expertise. Knowing a lot about one line of business doesn’t mean knowing a lot about another line of business.
Now, some investors, like Warren Buffett, know enough about a lot of lines of business, so they can diversify. There are still entire sectors — very profitable ones — which he avoids due to lack of understanding, however.
Oil companies have a competitive *dis*advantage in solar, wind, batteries, or electrical transmission. The best they can do is to invest in an existing company (like Total buying SunPower), but even that means they’re becoming investment analysts in a field they don’t know well. Oil companies do have an advantage in geothermal, but they’ve completely failed to use it.
Perhaps the best move for an oil company which sees that it’s in decline is to go full-on “slow liquidation” mode. Let the investors diversify; return their cash to them.
Stop exploring; stop drilling. Build up decommissioning and cleanup funds. Shed liabilities when possible; get them determined with certainty by insurance if not. Pump the existing wells and sell for cash. Pay off bonds and distribute dividends. Sell assets when the price is right (above the future revenue stream), and distribute more dividends. As the business shrinks and you fire geologists and oilfield workers and refinery workers, hire more property managers to figure out how to sell and rent the excess office buildings. Eventually, as the wells are shuttered and the refineries are shut down, you’ll be left with a company holding a collection of land, cash, insurance policies, and residual liabilities. Once the legacy oil business is liquidated and the environmental contamination liabilities are capped, you’ll get a cash buyout offer from an REIT or an insurance company, and can probably run a bidding war.
This is the way to get the full value out of the company, rather than burning large portions of the value on pointless “exploration”.
The oil company managements won’t do it, but I’ve seen slick moves of this sort in other industries.
Does anyone have any information about how the production cut has been accomplished. It appears that many OPEC/NOPEC countries have not appreciably reduced new drilling. Have they slowed their big producers, or shut in their most marginal wells? If we knew how they were managing the cuts it might tell us something about their reserves and future production.
As an example, when KSA made the big cuts in the 80’s they dropped their drilling to less than 10 rigs for a few years. They are now running 103 land and 17 offshore rigs a modest increase from their 2014 rigs.
I’d guess some is natural decline for part of Qatar, KSA and Ecuador, Gabon, all Venezuela, and Angola (which will now be reversed quickly); some is cutting back on overproduction when they were boosting before the cut for Kuwait, UAE, Algeria, Iraq (I think Iraq will increase now as Badra drilling is going quickly and expansion ion West Qurna might be starting); but the biggest part is from resting heavy oil fields with water flood in KSA and less so Kuwait. But I have never seen individual field flow figures for Saudi or Kuwait so I doubt it is really known outside the NOCs.
Among non-OPEC, cuts in Mexico and Azerbaijan are totally due to natural declines
Russia: shut in marginal wells and less drilling in mature regions, but greenfield projects proceed on schedule
Kazakhstan: symbolic cut of 17 kb/d due to lower output at older fields, while Kashagan is ramping up output
Oman: real cut exceeding natural decline
Thank you George and Alex.
International Oil Companies: The Death of the Old Business Model | Chatham House: “… the IOCs cannot assume that, as in the past, all they need to survive is to wait for crude prices to resume an upward direction. The oil market is going through fundamental structural changes driven by a technological revolution and geopolitical shifts. The old cycle of lower prices followed by higher prices is no longer applicable.
In this new world, the only realistic option for the IOCs lies in restructuring and realizing many of their current assets to provide cash for their shareholders.”
Great analysis from Chatham House, with some specific points about refineries.
The thing is that they *just won’t do it* — they won’t go into liquidation mode. It’s an attitude problem.
The oil companies are likely too big to attract interest, but isn’t this what buyout specialists do? They buy out a company on the cheap and sell off its assets.
Yep.
I think the IOCs are both too big for buyout specialists to target, and have deeply entrenched management. They’re also getting increasing debt loads and that makes them less and less attractive.
I’ve a new post on the Permian, available here.
Thanks for all the work.
The new permian wells look much better than the ones of 2015 and before, they really have a breakthrough there, or got new sweet spot unlocked to drill there?
Yes. Really interesting how almost all quarterly vintages, even early 2016 are right around 100K gross BO.
Will be very interesting to see if the 2015 and 2016 wells pass 200K gross BO while still producing above 100 gross BOPD.
Makes a big difference IMO.
200,000 BO x .75 (assumed net revenue interest) x $45 oil = $6.75 million.
200,000 mcf x .75 (assumed net revenue interest) x $2.50 = $375,000.
Assume $8 LOE, $3 G & A (both per BOE), 6% severance = ($2,325,500)
So, assuming the $45 well head oil and $2.50 well head gas prices, less the assumptions for net revenue interest (25% royalty assumed) LOE, G & A and severance, per BOE, at 200K gross oil and 200K mcf gas, our 2 mile lateral hz Sprayberry/Bone Spring/Wolfcamp well has paid out $4,799,500.
At this point, land costs, well costs, post completion CAPEX costs (think multiple artificial lift changes as total fluid rapidly falls), are critical, as our example well has paid out $4.8 million. We will just throw out land costs, although we know up to $60K per acre has been paid. If we assume the total CAPEX, including our post completion artificial lift CAPEX is $7.5 million, we are still $2.7 million from well payout.
This is where our long term production rates becomes so very critical. Post 200K BO gross are we producing at 200 BOPD, 100 BOPD, 50 BOPD or 25 BOPD?
Not even considering LOE, G & A, severance, the monthly gross oil income is drastically different, assuming NRI of .75 (25% royalty burden) and $45 well head:
200 gross BOPD = $202,500
100 gross BOPD = $101,250
50 gross BOPD = $50,625
25 gross BOPD = $25,313
As Enno’s figures show, most quarterly vintages are right at that 100K BO range. So, assuming .75 NRI, and assuming $45 well head oil prices, before any expenses, gross oil revenue is $3,375,000. So, by the time we deduct the LOE, G & A and severance, we are below $3 million payout for all of these vintages at $45 well head oil.
I realize there are few here who think this shale stuff is working, but it is very clear that more than 200K gross oil is needed at $45 well head to reach payout. So, it is critical that these wells stay above 100 BOPD gross oil after hitting 200K BO in this low price environment. Keep in mind the 2016 SEC reference price is $42.xx. So the 2016 well’s oil was likely sold for annual average prices of between $35-40, depending on when IP occurred (1st quarter completions could be lower).
This stuff is truly fascinating to me. I have gone beyond complaining about our personal situation, it is what it is. I am going to continue to “make more popcorn” as Enno says, as in my boring mind this is more entertaining than most movies.
Again, there are outlier wells that will payout, but that also means there are a ton that have no hope, absent a huge oil price spike.
Kind of a tale of the impossible (well payout that is).
As always, if I have messed up the numbers or made improper assumptions, please call me out on it.
I just eyeballed Enno’s graphs under well-quality. It looks like it will take 3 years plus to reach the 200K mark for the wells. By that time, the wells will hardly make 50 barrels/day. Permian appears to be a losing proposition.
and now back to the REAL world:
BP noted that cost savings is going to be extremely helpful.
“40 percent of our savings to date from our supply chain have come from efficiency as opposed to rate … around 75% are then sustainable in any environment,” Dudley said.
Suncor Energy Inc. CFO Alister Cowan also pointed towards the ability to continue to save.
“We estimate that approximately two-thirds of the savings we’ve achieved are structural ones that are not expected to come back … as crude prices rise.”
http://www.worldoil.com/news/2017/3/13/oil-executives-confident-that-energy-future-is-bright
The smell of profits are in the air….??
I’m curious. How does cost savings in these companies help you personally? It doesn’t mean oil prices will rise, only that a few companies might be able to survive on less income.
It’s the “Last Man Standing” game, as the global elite fight over the dregs at the bottom of the barrel.
Capitalism died in 2007—
Very good. Right about 2007. Maybe ’08/09.
Bernanke did more than kill capitalism. He killed money. The sense of it having meaning was undercut. He probably had no choice. People would have outright died. But . . . he did destroy it.
But you have to have oil. If capitalism won’t make it flow, then it has to flow some other way. Oil is everything. Physics says so and physics, not economics, is all powerful.
Physics says energy and especially the work that can be performed with energy is important.
Physics also says there are many forms of energy and that much of the energy in oil is wasted as heat in powering internal combustion engines, roughly 60 to 75% of the energy creates waste heat.
There are better ways to get the job done with only about 20% of energy wasted rather than 70%. I am being generous because I have left out the energy used in extraction, refining, and distribution of oil, but that would only be about 10% of the energy in an average barrel of oil, so waste goes up to 73%.
There are better ways to move people and goods, we should use them.
In the 1800s people used hardwoods for fire. Now those hardwoods are worth much more as materials for furniture than they are for fuel.
Fuel is something that has changed over time. When a current fuel becomes too expensive, alternatives are sought and usually found.
Petroleum will always have value, but if alternative fuels can be found for a lower price, chances are that’s where the market will go.
As for Watcher’s idea that people will do anything for oil, that seems unlikely. Much of what oil powers will become unnecessary if economies collapse. Oil may continue to be used for critical purposes, but anything else will go. In fact, that’s what the renewable/EV folks are suggesting now. Quit “wasting” petroleum through inefficiencies and for uses where it can be economically replaced. Think triage.
Paper money can be used to keep fires going, but paper money and even plain paper are not the best fuels for fires. Oil to burn won’t make so much sense before long.
People bombed Pearl Harbor for oil.
Pretty low threshold for “anything”.
And that’s why it’s in the best interest of countries to find alternatives to oil as soon as possible. They are strategically better off not needing it.
I mean, how wise is it to start WWIII so people can drive big trucks?
And if there is another WW, oil would just get rationed anyway. Consumer use would go way down.
Really?
BP 2013 Net Income $23,76 Billion
BP 2014 Net Income $4.03 Billion
BP 2015 Net Income -$6.4 Billion
This is what the relentless power of efficiency and technology did for them.
2016 looks like it will be a loss too when all numbers are in. The latest quarter with the highest price shows about 2 pennies positive earnings per share. With the other quarters included, loss.
And btw, cost reductions that “appear to be likely to hold as the price increases” means people have been fired and their salary doesn’t re-appear when price goes up.
Errr, if price goes up. Of course, that salary isn’t likely to re-appear when price goes down, either. Fired is fired. Errr, if price goes down.
Maybe the price will go to $28/barrel. And stay there. That would be cool.
There will not be much oil produced at $28/b, if you like to walk, it would be cool, otherwise not so much.
No evidence of that.
Hasn’t output increased as price fell?
Watcher. Texas Tea is the only one I have come across who owns oil and/or gas working interests and is happy with the 2015-2017 oil and gas price environment.
Just like I have not spoken to one farmer or farmland owner who is happy with 2014-2017 grain prices. Zero.
However, every trucking company owner I know is very happy about low diesel prices.
There is mucho denial that we could be in a decade plus long bear market for commodities. What other thing can the oil and gas CEO’s say? That we will have little to negative earnings for years? That wouldn’t help prop up stock prices that are already trading at Internet Bubble like multiples.
I can’t figure out Texas Tea. Seems like most of the articles he posts tout increased production, which will only result in lower prices.
The only thing I can guess is that he has an oil company or leases to sell and wants to convince a potential buyer that they are a good deal.
Deflation. Lower diesel prices.
But deflation kills borrowers, and one presumes those truck drivers or their companies borrowed money to buy the truck. Debt that doesn’t inflate away kills.
Or nevermind. How can it kill? Used to be government debt had no possible solution unless it inflated away. But that was pre Bernanke. He taught everyone that money was printed out of thin air. How could such a thing be allowed to kill?
A great lesson for all this has been taught us in Greece. Study the relevant wikis for a great example of how debt can’t matter.
(Psst, nor can the cost of a healthcare bill. It’s printed out of thin air.)
In other words 30% of the savings are sustainable for bp….does not sound that amazing
There are a lot of Japanese and European QE and NIRP/ZIRP refugees that parked their money in shale oil. All it takes is a slight change in monetary policy for that carry trade to start to unwind. Both the ECB and BOJ are moving away from wide open QE. They are both cutting the amount of QE done every month. Just like the FED did when they tapered QE. Soon as the currency moves against these refugees/investors they usually sell their position, at very least they are unlike to add to their position and as the unwind takes hold they are forced to sell because the currency moved against their position. There is a lot of money that has flowed into US assets out of Japan in Europe. So it’s not just a source of finance for just shale oil and gas that’s at risk of flowing right back out.
Hi. I missed that they released the data early this month. So I´m a bit late. Anyway here are my graphs. I decreased the size a little and increased number of colors instead this time. I think thats better.
GOR continued to decrease for all years except 2007, 2008 and 2016. It decreased quite a lot in several cases.
Here is the production graph. Number of production days increased, but is still lower than usual. So we see some recovery in production.
So GOR continue to decrease but oil production does not seem to be affected by it. Strange…
I found these links:
https://www.eia.gov/todayinenergy/detail.php?id=23752
http://bigstory.ap.org/article/d84e8dd2a74042ed8d9e864fdb59d069/house-poised-overturn-obama-rule-natural-gas-flaring
It could perhaps have something to do with it. Obamas regulations came into effect in January (and then overturned). It´s unclear to me what Obamas new rules were. But for ND it´s only a decrease from 22% to 15% and that was in November. Several years have seen GOR decreased around 10% from the peak. If the rest of the wells have continued to have increased GOR, then the difference is even bigger than 10%. So it does not really add up.
I checked the directors cut and Bakken capture percentage was 90% in November, 87% in December and 89% in January. So flared gas has nothing to do with the GOR decrease. So then it must be geology. Interesting…
Freddy
I thank you for the time and effort you put into your work.
I’ll explain what may be occurring and make you a collaborative offer to prove/disprove my thesis.
Virtually all wells in the Bakken from mid 2015 to today are drilled in the core of the core.
These are almost all somewhat closely surrounded by existing, producing wells that are shut down when the new wells are fractured.
When the formation pressure is elevated by the introduction of hundreds of thousands of barrels of water during fracturing, the resumption of production is almost always higher along with decreased GOR (although higher GROSS gas and oil) for a period usually lasting several months.
The halo effect.
Again, the older well would show typical decreasing formation pressure accompanied by increasing GOR.
Post frac of new, nearby well, drop in GOR.
Offer to you, Freddy … pick out any dozen or so wells that showed prominent decrease in GOR,
identify them by 5 digit permit number, and I will gladly scan the Gis map (for location/proximity purposes) and production history to determine if new, nearby well completions caused this situation.
I’ve already done this to over 100 wells with about a 90% rate of co-relation.
I think that Art Berman has a recent article on the Bakken in which he said that his analysis leads him to conclude that the amount of gas in the play is decreasing (geology), which leads him to believe that that will accelerate production declines.
If I do not remember his article correctly, my apologies to Art, and to anyone else.
Clueless and Freddy
A March 9, 2017 article in the Williston Herald by reporter Renee Jean addressed these exact issues in an interview with Lynn Helms.
Topics of GOR, increasing water cut, pressure depletion, economics, and other relevant stuff.
Short, highly informative piece.
clueless and coffeeguyzz,
Thats interesting. Then it does not look good for Bakken and the companies there. Perhaps Verwimps model could actually turn out to be correct after all.
I have created an excel sheet which you can find here:
https://1drv.ms/x/s!AhPFubtTLq-QlhxstwmKbOmpD_tJ
It contains all wells from 2014 split into two sheets, one with wells that had increasing GOR from Jul 2016 to Jan 2017 and one sheet with the wells that had decreasing GOR during the same time period. Wells with less than 5 days of production were excluded.
I had a (very) quick look and could not see that any special area is more affected. But anyone, feel free to have a look and see if you find anything interesting.
Freddy
Just quickly scanned the top dozen (ratio-wise) wells from your spreadsheet.
Weird looking gas production numbers , as in WAY low, was the only thing that seemed unusual.
(Very first well may have typo as more gas was sold and flared than produced.)
I’ll go over several more in the coming days and tell you what I found.
Once again, thanks for your efforts as this collection and collation of data must be very time consuming.
Unfortunately, my data cannot be better than the data it comes from. I suggest that you look at wells futher down in the sheet were the ratio is more realistic. Another suggestion is to sort by county and area or company instead. I think its better.
No not too time consuming. I only had to change the code a little to generate this data. My computer did most of the work. Also I think its very interesting to follow.
I created another sheet for 2014 wells here for the period January 2016 to July 2016:
https://1drv.ms/x/s!AhPFubtTLq-QliDo4C_fYjm8fb22
During that time period GOR increased quite fast. This is also reflected in the number of wells where GOR increased. By looking into which wells has been moved from increasing GOR to decreasing GOR, we maybe can find if they have anything in common.
Yeoman work, Freddy
Yeoman :)?
What does the phrase “Yeoman’s work” mean? I can’t locate a definition. What’s the history of the phrase? Thanks. Philip
‘Yeoman work’ or ‘yeoman service’ is simply good, honest, hard work.
Aha thanks.
2017-03-13 Oil industry will keep losing money, Conference Board of Canada says
The board says in a report published Monday that capital investment this year is expected to fall to $22 billion from $27 billion last year as big construction projects in the Alberta oilsands and offshore Newfoundland are completed. The peak investment level was $62 billion in 2014.
https://www.thestar.com/business/2017/03/13/oil-industry-will-keep-losing-money-conference-board-of-canada-says.html
Continental's Harold Hamm Puts His Finger On Shale Oil's (Unsolvable) Big Problem – Continental Resources, Inc. (NYSE:CLR) | Seeking Alpha: “This will end badly. I am changing my view from ‘lower for much longer’ to ‘much lower for much longer’.”
CLR’s earnings read -$1.08/sh on finance.yahoo.
It is kind of funny how Hamm is trying to revise his image. As noted in the article, he recently said that “he had been saying ‘lower for much longer’ for over 2 years.” Wrong. He was the one probably most wrong, pulling off all of his long hedges. Then, last year when oil bounced off $26 bbl to near $40, he said that he saw oil getting to $60 by June 2016, and much higher if OPEC cut. So, claiming that he has said lower for much longer for over 2 years is BS.
The quote “lower for much longer for over 2 years” isn’t attributed to Hamm. It’s the article author who has been saying that. The quote appears under a photo of Hamm, but it’s the author who is saying it.
OPEC’s Misleading Narrative About World Oil Supply | Belfer Center for Science and International Affairs: “This scenario of an enduring excess supply could be eased by a robust demand growth. But preliminary data and analyses do not portend such a development, especially because of a significant slowdown in demand growth in China and India—the two major engines of world oil consumption growth.”
Maugeri makes references to his report from 2012 that he seems proud of. He forecasted global production in 2020 of 110.6 mbd. This (and his assumptions) were criticised by many, including Jean Laherrère, see http://www.resilience.org/stories/2012-10-16/comments-maugeris-oil-revolution-part-ii/. I don´t know if he has an agenda or is just another cornucopian.
Just to be sure we have a pure experience here, we should quantify significant slowdown in growth.
Not a reduction in consumption. A slowdown in growth.
Sinopec offered up a 3.4% consumption growth estimate recently About 11.9 mbpd. BP says they already hit that 12 number, all liquids. BP will update soon.
That would be a drop of 1.6%/yr. If they are right.
This doesn’t have much to do with oil, directly, short term, but it is ample indication that the biggest and presumably some of the smartest people in the tech industries believe that autonomous cars are the NEXT BIG THING .
http://www.cio.com/article/3179459/artificial-intelligence/intel-races-ahead-in-autonomous-cars-with-153-billion-mobileye-buy.html
It seems pretty likely to me at least that fully self driving cars will be a commercial reality and available for sale in showrooms and Tesla stores on a routine basis well within a decade.
The biggest question for now might be how long it will take for people and governments to accept the technology.
Consider for instance that in deep red Texas, where Republicans and SO CALLED conservatives own and operate the state government, and where the free market is supposedly worshipped right along with Jesus, Motherhood, and apple pie, the car dealers have so far succeeded in preventing Tesla from selling cars directly to the public.
I don’t see much discussion of the political aspects of the autonomous car revolution, so far, but my money says there will be screaming headlines about it day after day, for months on end, once new cars are really ready to drive themselves. Politics could hold back the transition for five or maybe even ten years in some places.
When it happens, and it will, for sure, it will reduce the need for gasoline and diesel fuel to a serious extent, because autonomous cars will be able to serve a lot of people on combined trips. You will be able to go TO your favorite shopping center, dismiss your car, and call another when finished shopping, etc. In the meantime, the one you had will be taking somebody home or running another customer someplace else. People willing to share a ride the way we share cabs sometimes now will be able to save a dollar or two, and a dollar or two is VERY important to a lot of people.
I foresee some sort of phone app, which probably already exists, being used to guarantee the identity and therefore the safe conduct of anybody who is willing to share a ride with anybody else using the same app. The financial risks associated with accidents will be transferred to the company that runs the car rental operation, and maybe to the car manufacturer.
That app you describe is already in use for car sharing services like Uber or Lyft for years now. When you summons a car, you can opt for a cheaper fare by indicating the ride share option. I’ve been told by youngsters that it works flawlessly.
Mobileye and Tesla had a falling out about a year ago, when Tesla had a chance to buy them, but didn’t have enough money for the deal.
Scenario- in the future you get into an autonomous car…, and the doors lock. the robot delivers you to the federal lockup for intake, for failure to_____ [you fill in the blank- something like vote correctly, or pay your carbon bill].
I thought this was worth noting, Alaska says that $50 barrel is their current break-even price…
The Monumentally Expensive Quest to Pull Off an Alaskan Oil Miracle – 14 March 2017
Plenty of small explorers like Caelus are sniffing around Alaska these days, but Big Oil is still king. Giants like ConocoPhillips, Exxon and BP, the North Slope’s top producers, have the wherewithal to shoulder the high capital costs. But even for these giants, Alaskan oil is still a tough call. Costs vary, but the state estimates that it takes $50 on average to produce a barrel of North Slope oil and move it to market. At current prices, Alaskan oil barely breaks even.
https://www.bloomberg.com/news/features/2017-03-14/the-monumentally-expensive-quest-to-pull-off-an-alaskan-oil-miracle
Okay, now that’s hilarious. The wells are already drilled.
Also, in the past Alaska gave the oil industry big tax breaks but now they don’t.
Any guesses how expensive this oil will be to produce?
https://www.bloomberg.com/news/features/2017-03-14/the-monumentally-expensive-quest-to-pull-off-an-alaskan-oil-miracle
The reserves are unknown. The two test wells were not flowed. Recovery factors are unknown – they are assuming 30 to 40% but that is highly unlikely. They are planning a new test well in 2018. Most of these pieces are mainly aimed at drumming up outside investment or putting pressure on Alaska to get the tax refund for the original wells (the oil company might have a point about that). Without knowing the reserve, estimating costs is pretty difficult, but even with a high number it will be expensive. There is little infrastructure and they will need a lot of wells, possibly with fracking or other advanced completions.
EIA’s Drilling Productivity Report with projections to April is out.
The EIA sees the January rebound in the Bakken oil production as temporary. Slow decline is expected to continue in February-April.
Modest growth from March is projected for Eagle Ford.
Growth in the Permian is expected to accelerate.
Filloon just posted some recent production numbers from the Permian.
Very high output from some wells.
SEeking Alpha Filloon?
They guy who claimed 280+ million barrel wells in the Bakken?
That guy is misleading at best.
Something that I’ve learned from posters on this website is to include more than one forecast into a single chart. Seems simple in hindsight 🙂
I wish the EIA in it’s DPR would separate it’s “production per rig” statistic into it’s component parts, wells drilled per month and oil production per new well.
I seem to remember that the EIA had forecast a crude production bottom at the end of 2016 but looking at the chart they had to revise the level of the low higher.
Contrary to what many people on this website think and say, the EIA tends to underestimate LTO output and U.S. C+C production in general. Therefore, their forecasts are usually revised upwards.
Big news. The Prez just killed the new CAFE standards. He’s in Michigan to announce it.
Help for the auto industry. And his voters.
(And a delightful little uptick in US consumption)