US September Oil production

A post by Ovi at peakoilbarrel

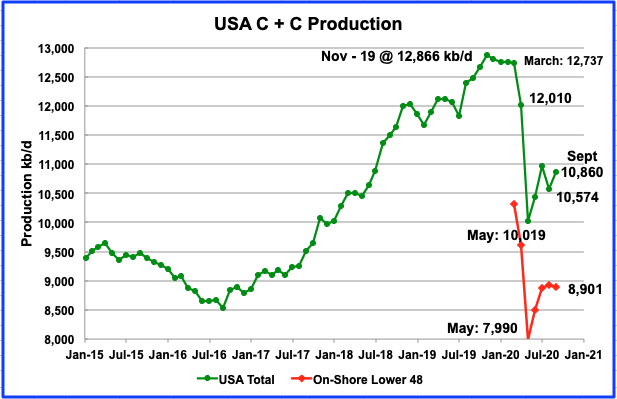
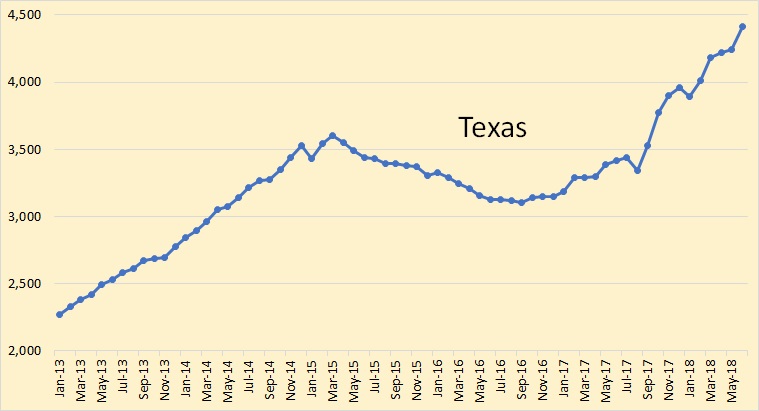
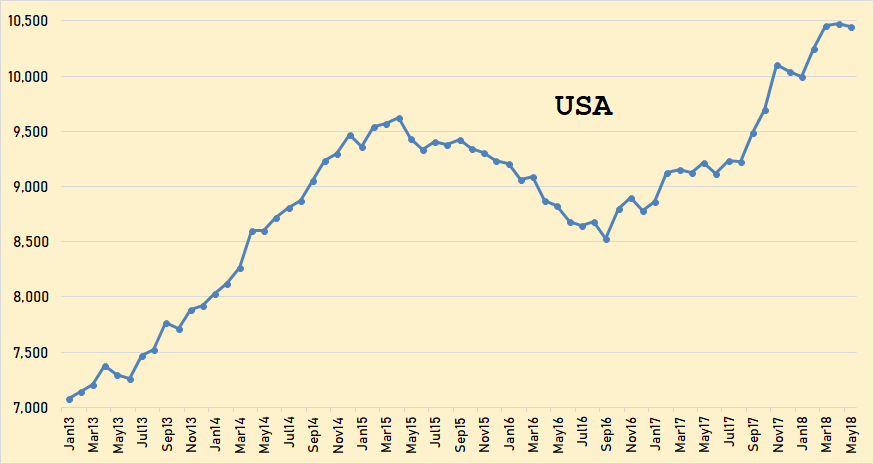
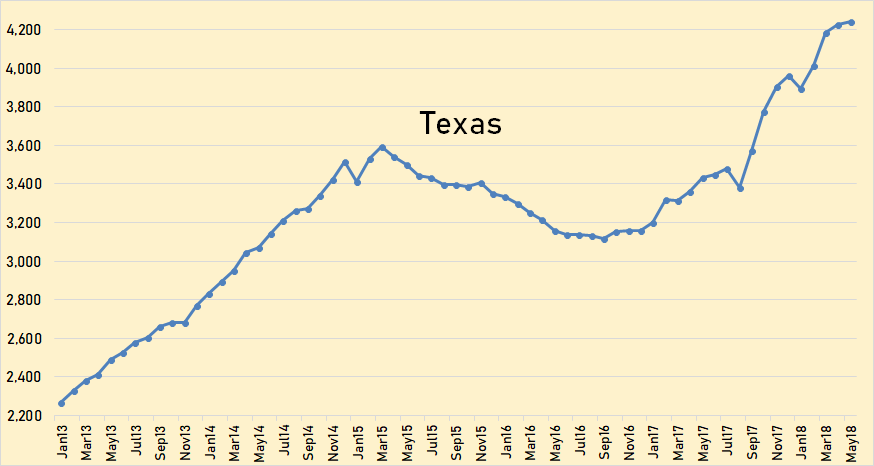
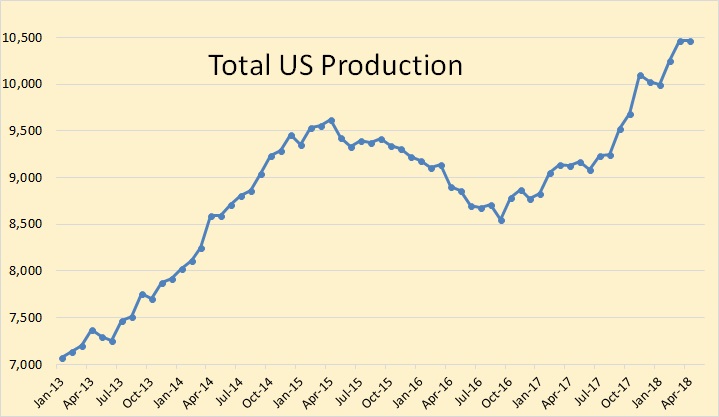
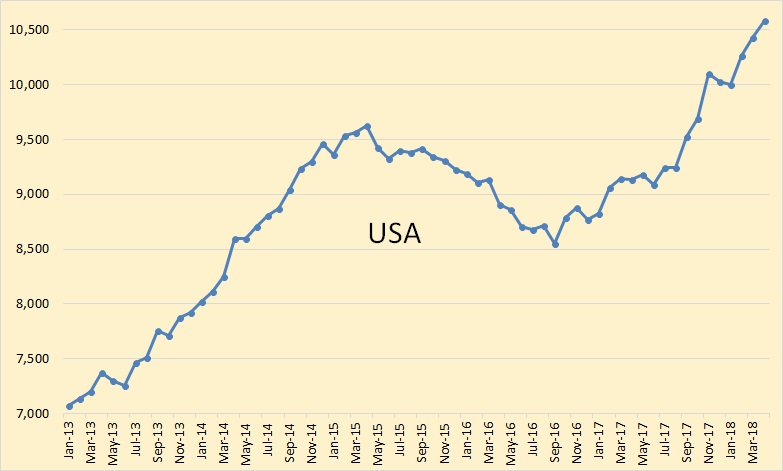
All of the oil (C + C) production data for the US state charts comes from the EIAŹ¼s Petroleum Supply monthly PSM. After the production charts, an analysis of three EIA monthly reports that project future production is provided. The charts below are updated to September 2020 for the 10 largest US oil producing states.

Read More

U.S. & World Oil Production and ExxonMobil Outlook

Here are the latest oil production numbers from the EIA. All data is in thousand barrels per day unless otherwise noted.

The USA through May 2018. The upward surge has stalled for the last two months. US production was down 30,000 bpd in May.

It is a little astonishing how close the Texas chart resembles the USA chart. Texas is, by far, the USA’s largest producer. As Texas goes, so goes the USA. Texas production was up 20,000 bpd in May.

Read More