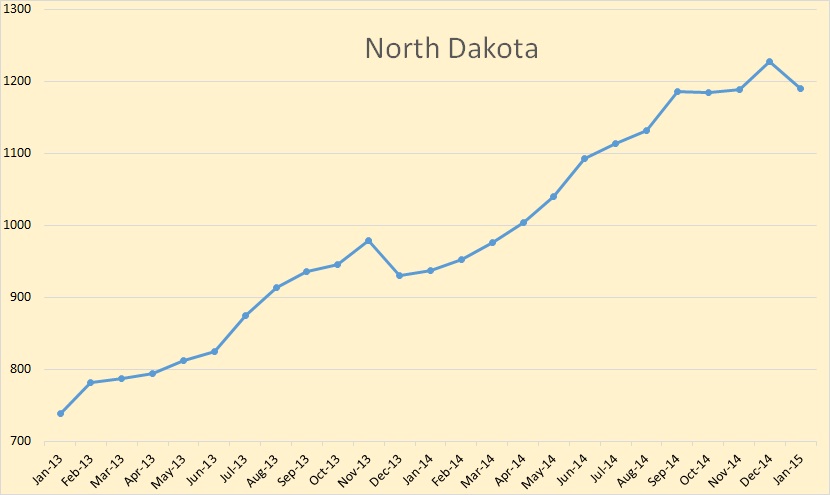
North Dakota has published January production data for the Bakken and for all North Dakota.
Bakken production was up 37,617 bpd to 932,817 bpd while all North Dakota’s production was up 37,972 to 980,294 bpd.
North Dakota has published January production data for the Bakken and for all North Dakota.
Bakken production was up 37,617 bpd to 932,817 bpd while all North Dakota’s production was up 37,972 to 980,294 bpd.
The EIA has just released its Short-Term Energy Outlook. Some of their projections should be taken with a grain of salt because they usually change every month. Nevertheless…
All US production is Crude + Condensate. All other production numbers are total liquids. The data is in million barrels per day.
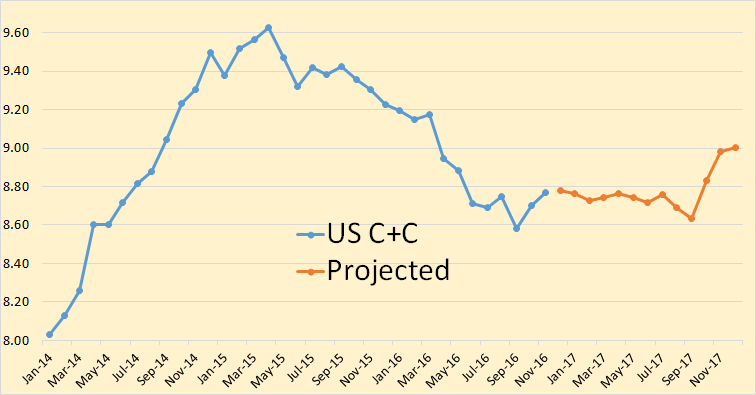
The EIA has US production leveling out at just under 8.8 million bpd until Oct. 2017.
The latest Petroleum Supply Monthly is out with the USA production numbers for January 2015. The data is thousand barrels per day with the last data point January 2015.
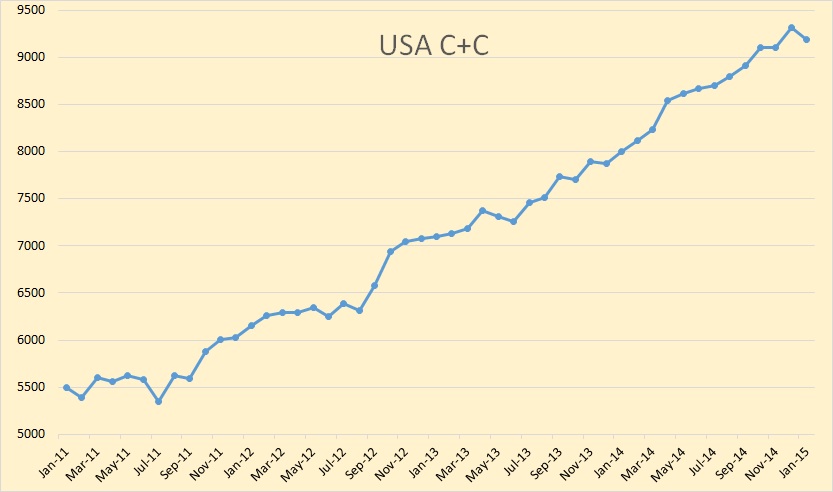
US C+C production was down 135,000 barrels per day in January. That is the biggest monthly decline since July of 2011.
I have shortened the states data to 25 months in order to give more emphasis on the January 2015 data.
North Dakota was down 37,000 barrels per day, exactly what the NDIC reported. That is because the EIA gets their data from the states.
The EIA has published their Petroleum Supply Monthly with all US production numbers through December 2014. The chart below shows the largest changes in December and Yearly production. Almost every state had a production increase. The largest decliner was Wyoming, down 7,000 bpd. Below are the biggest gainers and the amount of their production increase in thousand barrels per day for December and the whole year.
| December | 2014 | |
| US | 187 | 1366 |
| Texas | 49 | 684 |
| North Dakota | 39 | 297 |
| GOM | 68 | 157 |
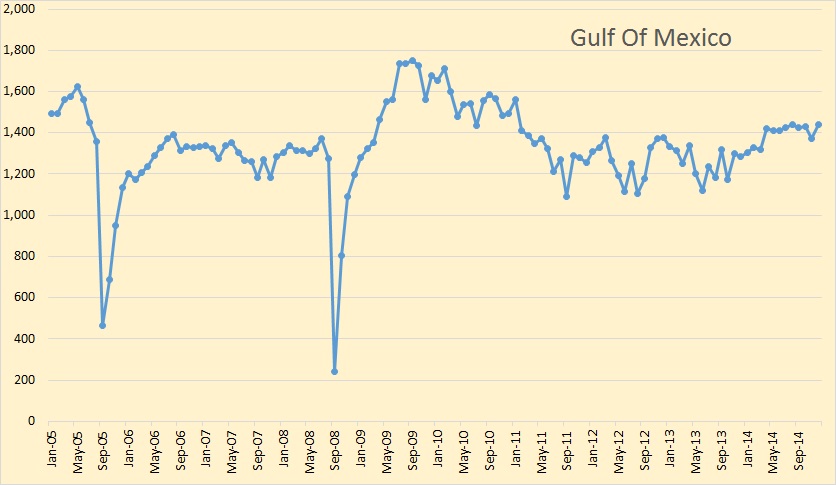
The Gulf of Mexico was up 68,000 bpd in December but was down 56,000 bpd in November. The EIA had great hopes for the GOM expecting it to hit 2 million barrels per day in 2016. I don’t think that is going to happen. GOM production now stands at 1,441,000 bpd
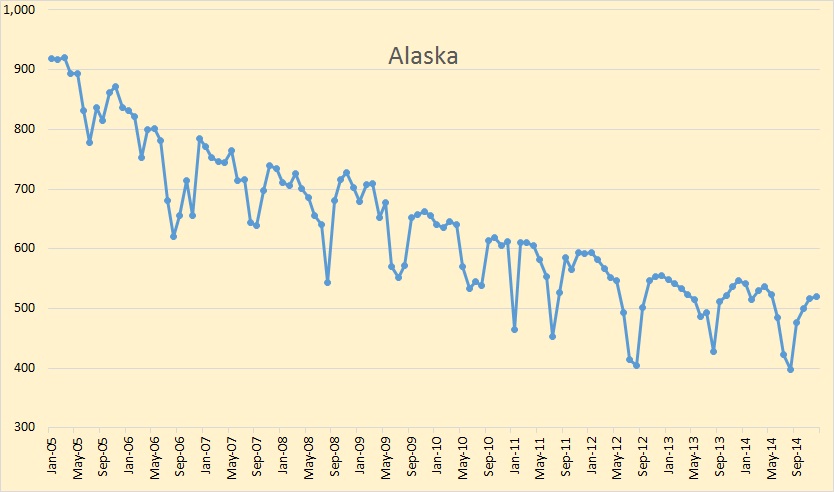
Alaska’s decline seems to be slowing down slightly. They are now at 520,000 bpd.
Even before the shale revolution got underway, US net imports were falling. The data below is from the Weekly Petroleum Status Report and is in thousand barrels per day.
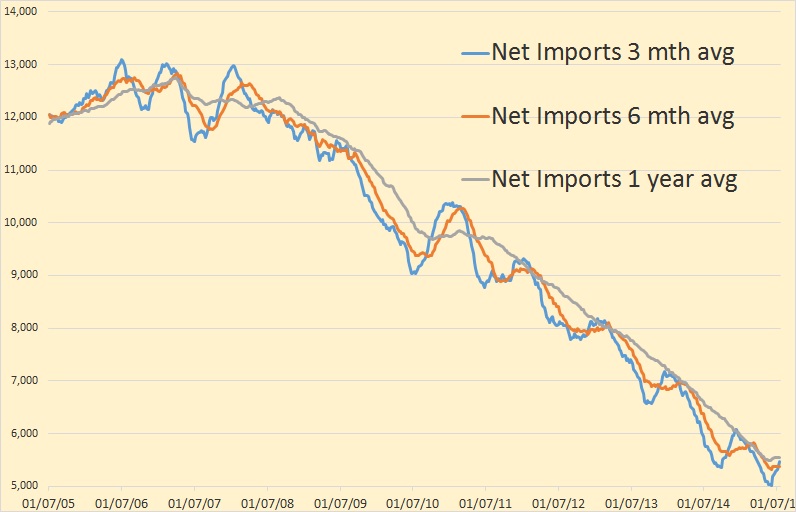
This chart shows net crude oil and petroleum products imports. Net imports peaked in 2006 and started to fall in earnest in 2008. They continued to fall until 2010 when the three month average increased sharply and the annual average leveled out for about a year. Then as the Light Tight Oil revolution got underway in 2011, net imports started to fall again.
The chart above shows net imports bottom out in late spring, March and April and heads back down again in June. Below is the last year of that chart amplified.
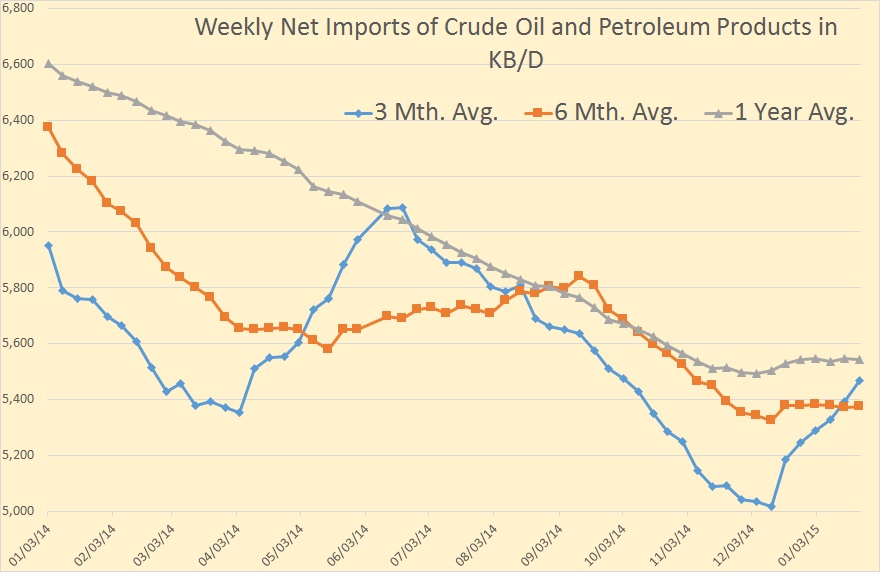
But in December of 2014 net imports broke their trend and headed sharply up, about four months earlier than normal. Much of this increase in imports had to be caused by declining US production though part of it could be caused by increased consumption because of low prices.
Read More