By Ovi
All of the Crude plus Condensate (C + C) production data for the US state charts comes from the EIAʼs Petroleum Supply monthly PSM which provides updated production information up to January 2025.

U.S. January oil production decreased by 410 kb/d to 13,246 kb/d and is down by 618 kb/d from October and was largely due to extreme late January weather. The largest decreases came from the Big 2 states, TX and NM. February’s production is expected to rebound by 450 kb/d to 13,696 kb/d according to the March STEO. Peak US oil production occurred in October 2025 at 13,864 kb/d but may be exceeded in early 2027.
According to this Article: U.S. would lose an average of 340 kb/d in January 2026 due to the cold weather. The 340 kb/d drop was a fairly good estimate since the combined January drop from Texas and new Mexico was 375 kb/d.
“Most of the remaining outages were in the Permian Basin in Texas and New Mexico, which accounts for around half of U.S. crude production, according to Energy Aspects analyst Jesse Jones, who said production there was recovering quickly.”
The dark blue graph, taken from the January 2025 STEO, is the U.S. oil production forecast from January 2026 to December 2027. Output for December 2027 is expected to drop to 13,844 kb/d. From February 2026 to December 2027 U.S. oil production is expected to increase by 148 kb/d.
The light blue graph is the STEO’s forecast for the Onshore L48 output to December 2027. From February 2026 to December 2027 production is expected to increase by 327 kb/d to 11,528 kb/d. The rising production starting in September 2026, according to the EIA, is due to higher prices for WTI and more NG pipelines being built. Note how production is essentially flat for all of 2027.
U.S. Oil Production Ranked by State
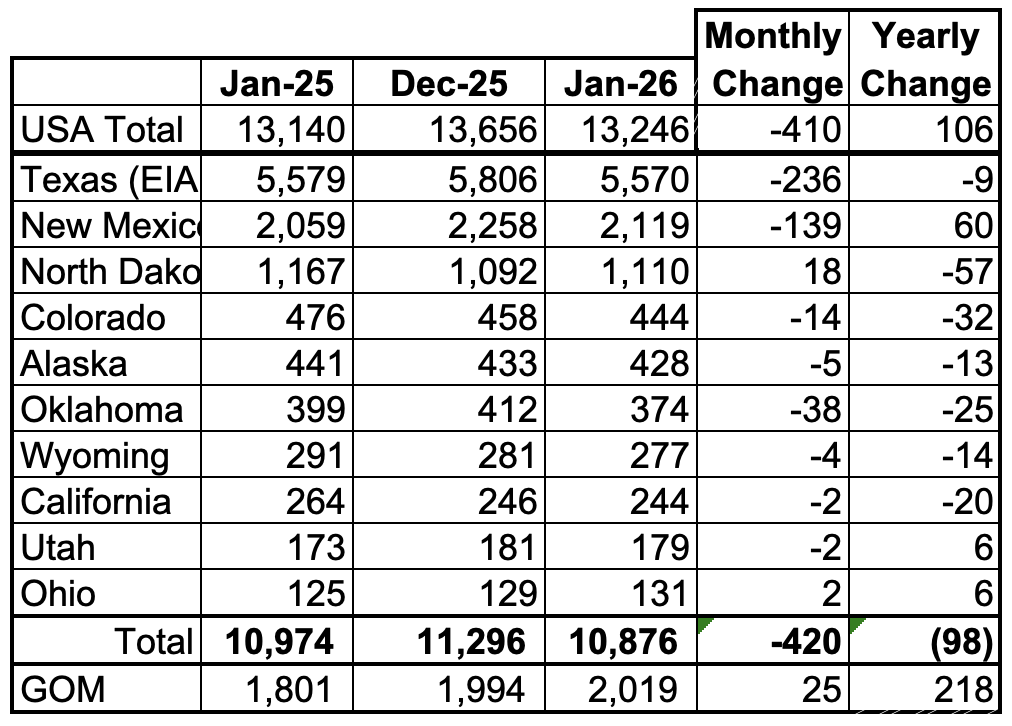
Listed above are the 10 US states with the largest oil production along with production from the Gulf of Mexico.
These 10 states accounted for 82.1% of all U.S. oil production out of a total production of 13,246 kb/d in January 2026. On a MoM basis, January oil production in these 10 states dropped by 420 kb/d. On a YoY basis, US overall production increased by 106 kb/d with the largest contributor being New Mexico and the largest decliner being North Dakota.
State Oil Production Charts
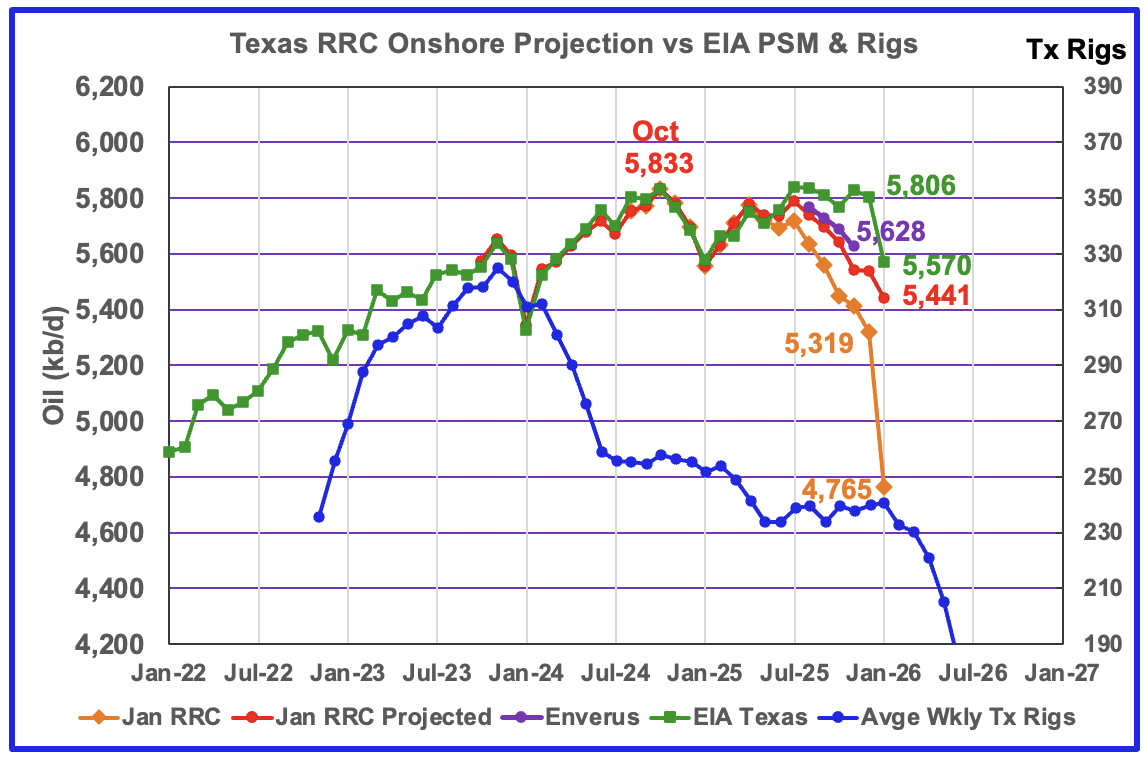
Texas’ January oil production decreased by 236 kb/d to 5,806 kb/d according to the EIA and is primarily due to extreme weather in late January.
The Texas’ RRC initial production for January dropped by 554 kb/d from December to 4,765 kb/d. The projection added 676 kb/d to raise January’s projected production to 5,441 kb/d. While the projection and the Enverus production estimate are showing declining production, the EIA’s Texas estimate shows production is in a plateau phase. It is not clear if this difference is due to late updating by the RRC. January’s projection is 129 kb/d lower than the EIA’s estimate and is 1/2 of the December gap 267 kb/d. The July 2025 gap between the projection and the EIA estimate is 51 kb/d and that gap will shrink over the next few months. Maybe the projection and Enverus estimate are too pessimistic.
The red graph is a production projection using the December and January Texas RRC data.
The blue graph shows the average number of weekly rigs reported for each month shifted forward by 10 months. So the 276 rigs operating in July 2023 have been shifted forward to May 2024. From February 2024 to July 2024, the rig count dropped from 312 in time shifted February 2024 to 256 in July 2024. That drop of 56 rigs had no impact on production up to July 2025. August 2025 appears to be the first month when the impact of the start of a flat rig count is resulting in essentially flat production. Will the rig count drop starting in time shifted February 2026 result in dropping Texas production going forward?
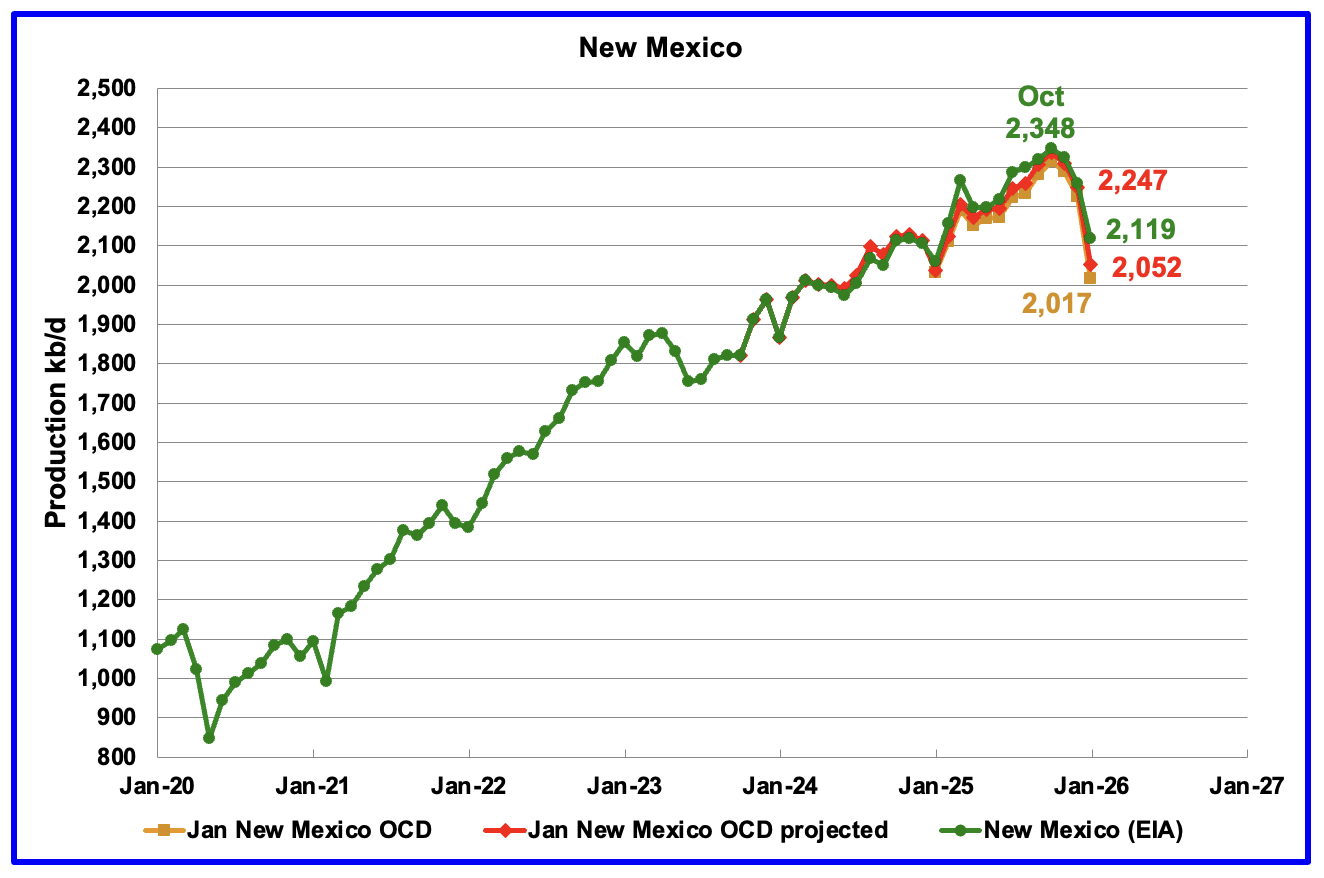
According to the EIA, New Mexico’s January production dropped by 139 kb/d to 2,119 kb/d. YoY production rose by 60 kb/d, the largest contributor to overall YoY rising US production.
The red graph shows the projected output up to January and is calculated using December and January NM OCD data. January’s projected production decreased by 195 kb/d from December to 2,052 kb/d and is 67 kb/d, 3%, lower than the EIA’s reported production. While the numbers are slightly different, the trend is the same.
The largest contributors to the 195 kb/d NM decrease came from Lea and Eddy Counties which dropped for a combined 202 kb/d. See Permian section further down.
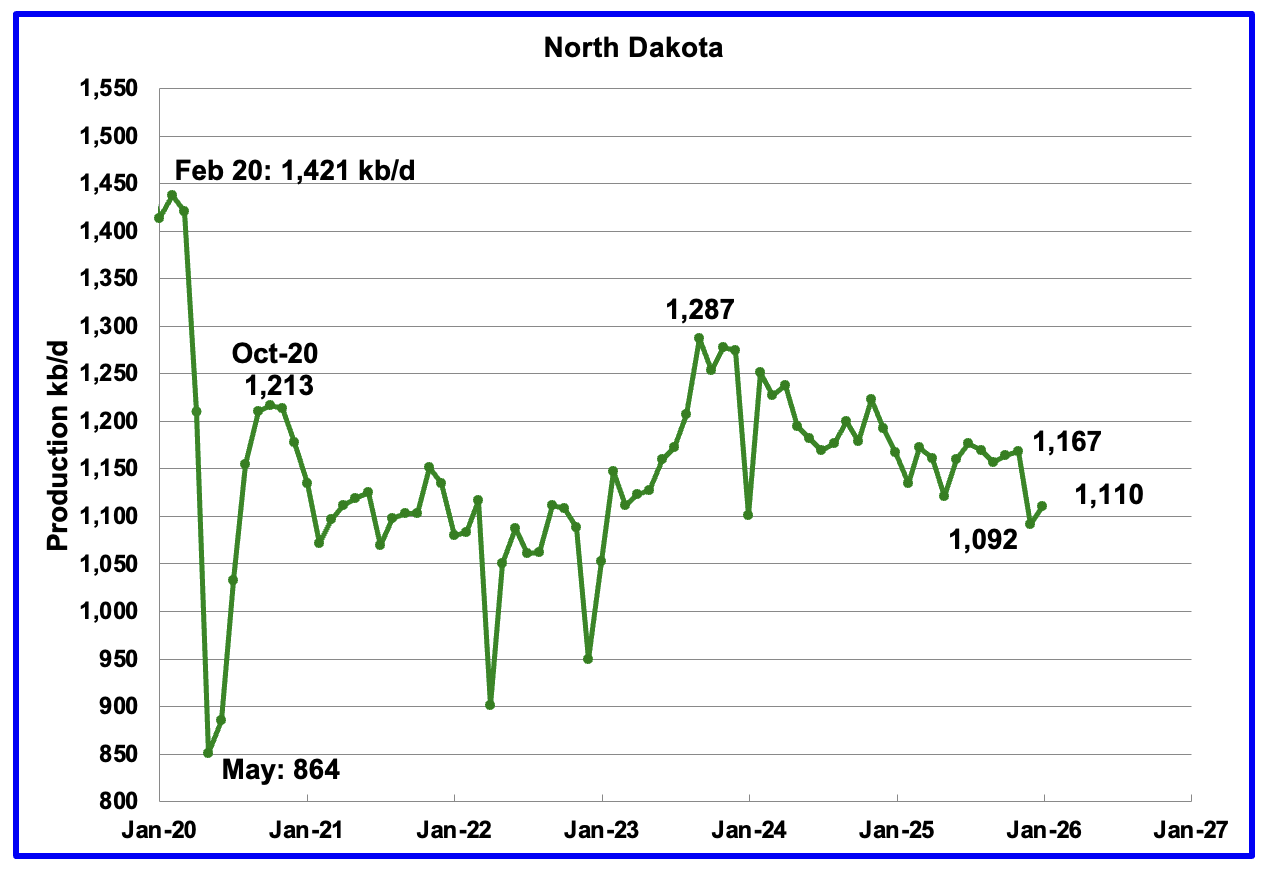
Production in North Dakota rose by 18 kb/d in January to 1,110 kb/d.
The North Dakota Department of Mineral resources reported January production decreased by 1 kb/d to 1,125 kb/d, which is 15 kb/d higher than the EIA’s estimate.
According to this Article, North Dakota operators likely to increase crude output in March.
“North Dakota crude output is expected to rise in March and the following months as operators in the third-largest oil-producing state restart inactive wells and winter restrictions are eased, the state’s regulator said on Thursday.
The North Dakota Department of Mineral Resources said, however, that the pace of activity would depend on how long oil prices stay high and that oil majors’ budgets have already been set.”
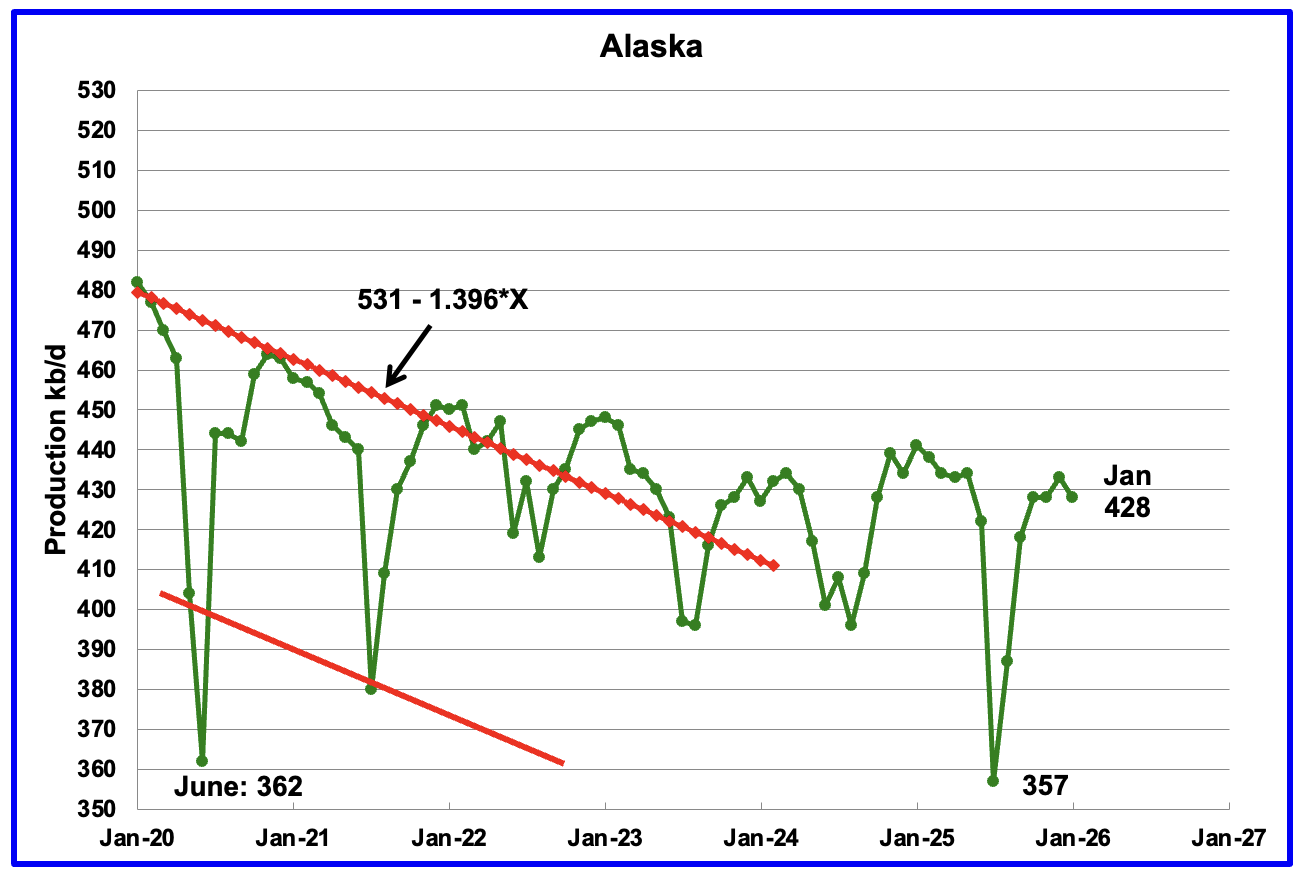
Alaskaʼs January output dropped by 5 kb/d to 428 kb/d while YoY production decreased by 13 kb/d. The EIA’s weekly reports indicated that January production would average close to 430 kb/d.
According to this Article, North Slope Oil Production Dips in January.
The 1% month-over-month decline in North Slope production was driven by decreases at several major fields, including Prudhoe Bay, Milne, and Colville River. However, the Greater Mooses Tooth field saw a major increase in output during the same period. Overall crude oil accounted for 89.06% of the 472,413 (420,727 C + C) barrels per day produced on the North Slope in January.
Alaska has recently brought new fields online to consistently have flat YoY and monthly production gains which have broken away from the earlier dropping production red trend lines. New production is expected to come online from the Picca field in early 2026.
Completion of the first phase of the Pikka oil field is on schedule with production start-up expected by the end of the first quarter, with the ramp-up to a plateau of 80,000 barrels per day anticipated in the second quarter, Santos executive Joe Balash told Petroleum News on Jan. 20.
The Alaska North Slope oil field is currently in the commissioning stage.
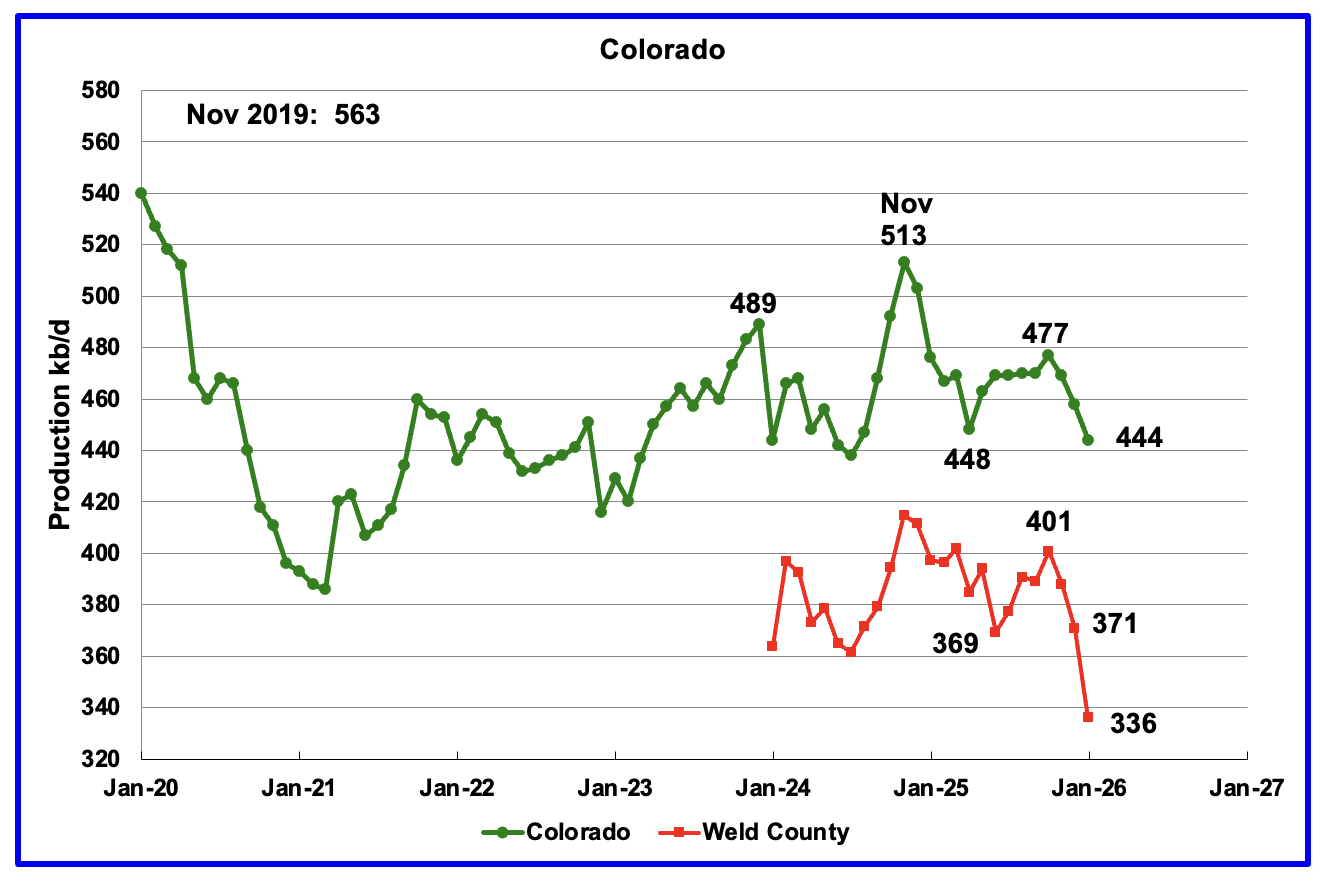
Coloradoʼs January oil production dropped by 14 kb/d to 444 kb/d.
The biggest oil producing county in Colorado is Weld County and its production has been added to the chart. The two graphs have been almost parallel over the last five months. Weld’s production dropped by 35 kb/d in January to 336 kb/d.
Colorado began 2025 with 6 rigs in January and February and peaked at 11 in October. At the end of March 2026 9 oil rigs were operational.
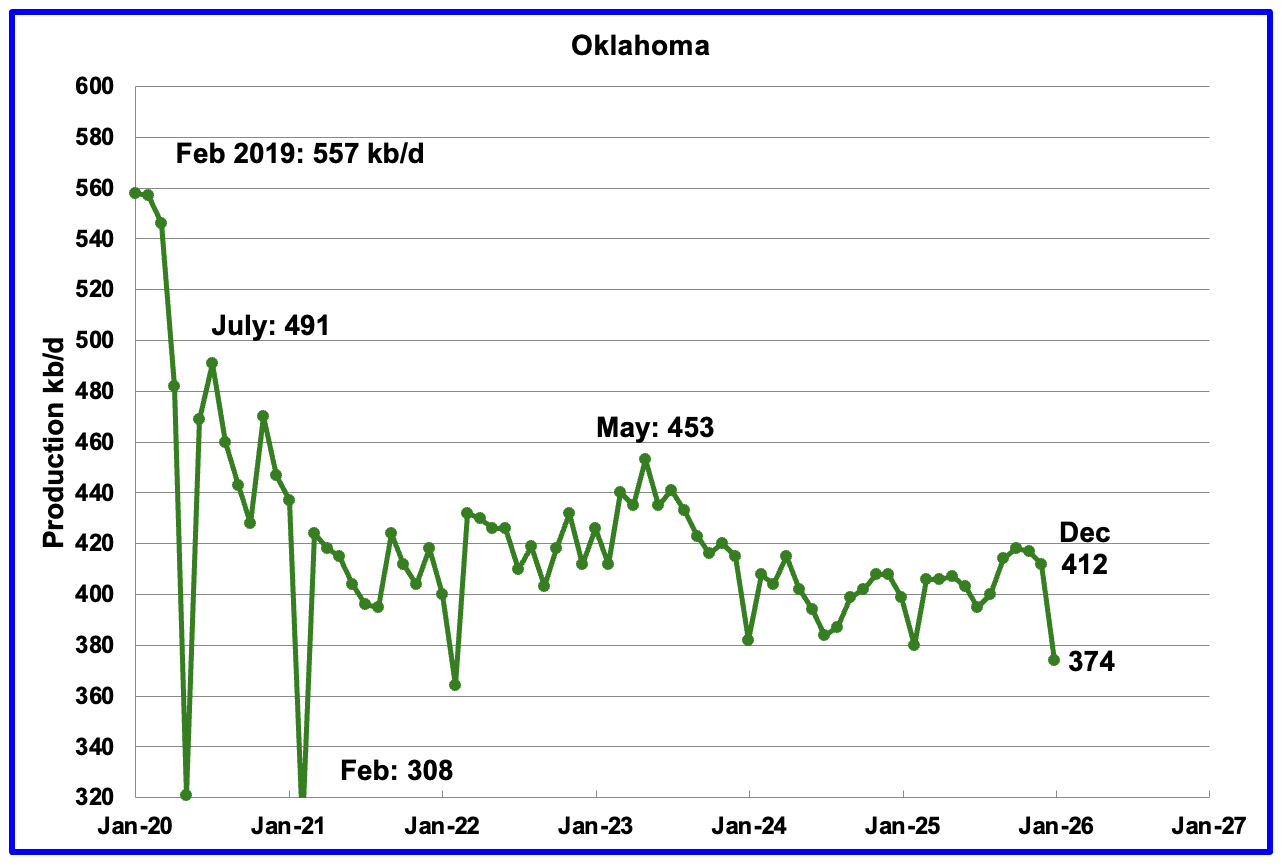
Oklahoma’s output in December dropped by 38 kb/d to 374 kb/d. Production remains below the post pandemic July 2020 high of 491 kb/d and is down by 79 kb/d since May 2023. Output entered a slow declining phase in June 2023 and now appears to be range bound around 400 kb/d ± 20 kb/d. The large drop out of the range may be due to the late January extreme weather.
Oklahoma had 51 operational rigs in May 2025 which slowly dropped to 41 rigs in July 2025. The rig count has been fairly steady around 40 from July 2025 to March 2026. The steady rig count since July may be showing up in the steady oil production around 400 kb/d.
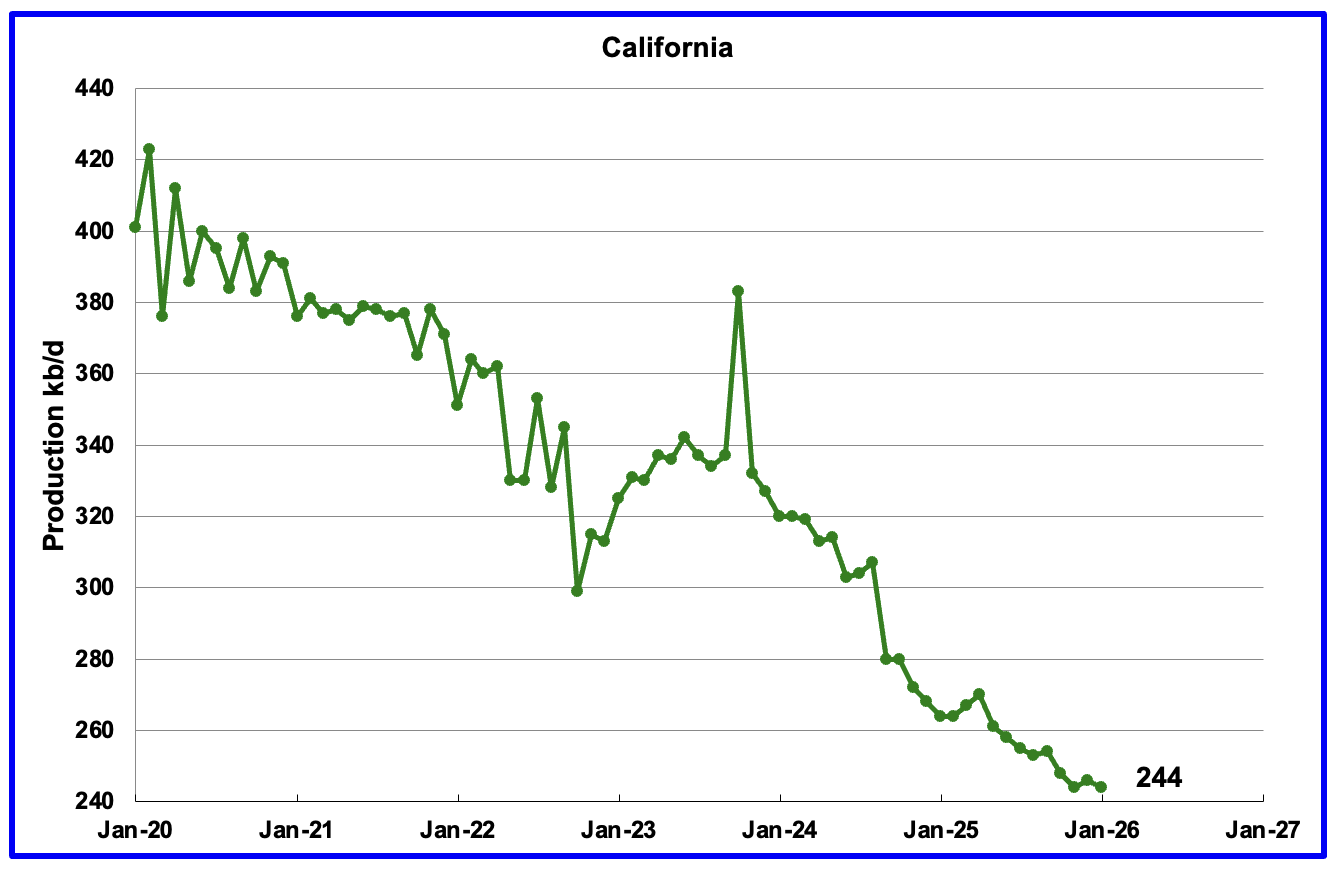
California’s overall declining production trend continues. January’s production dropped by 2 kb/d to 244 kb/d. YoY production dropped by 20 kb/d.
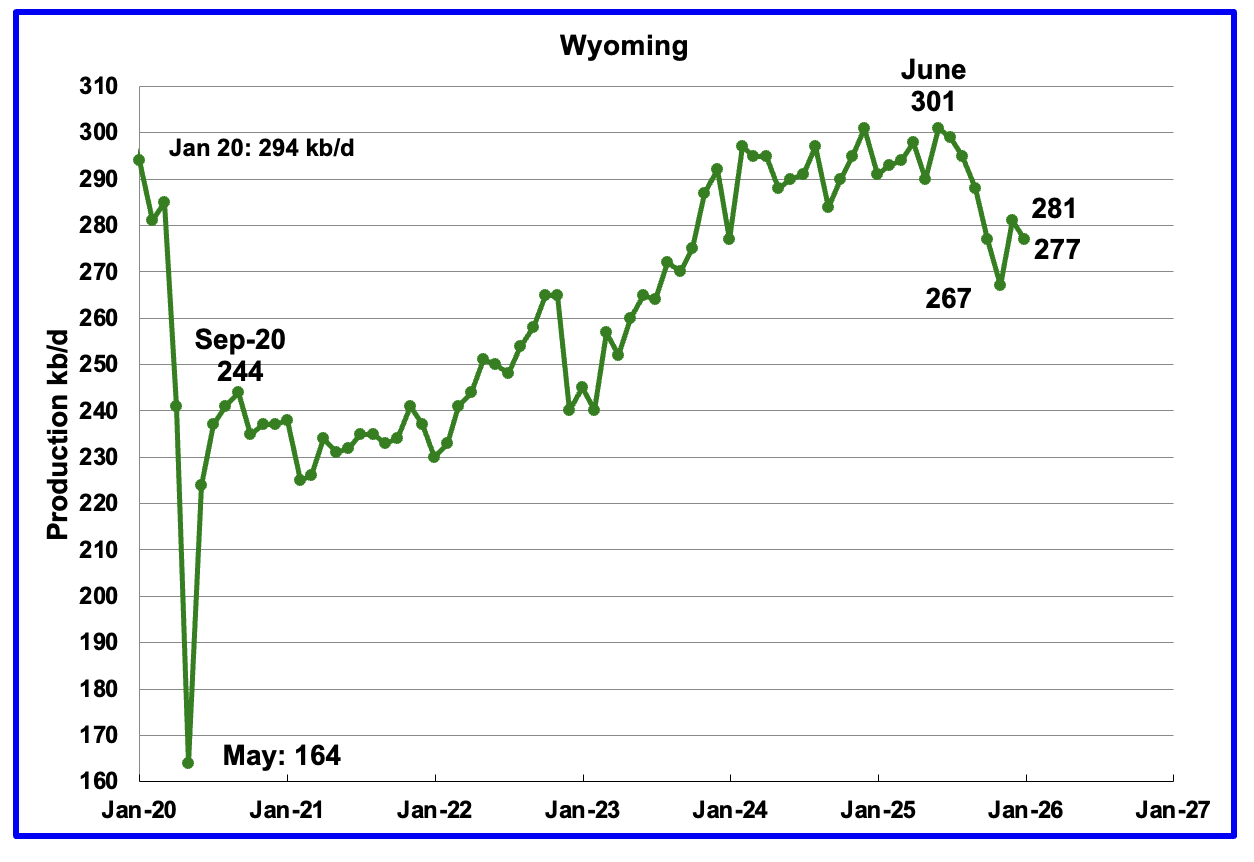
Wyoming’s oil production reached a post pandemic high in December 2024 and again in June 2025 of 301 kb/d. Production has dropped in each of the last 5 months before rebounding in December. January’s production dropped by 4 kb/d to 277 kb/d.
Wyoming dropped 1 rig in Early April a total of 13.
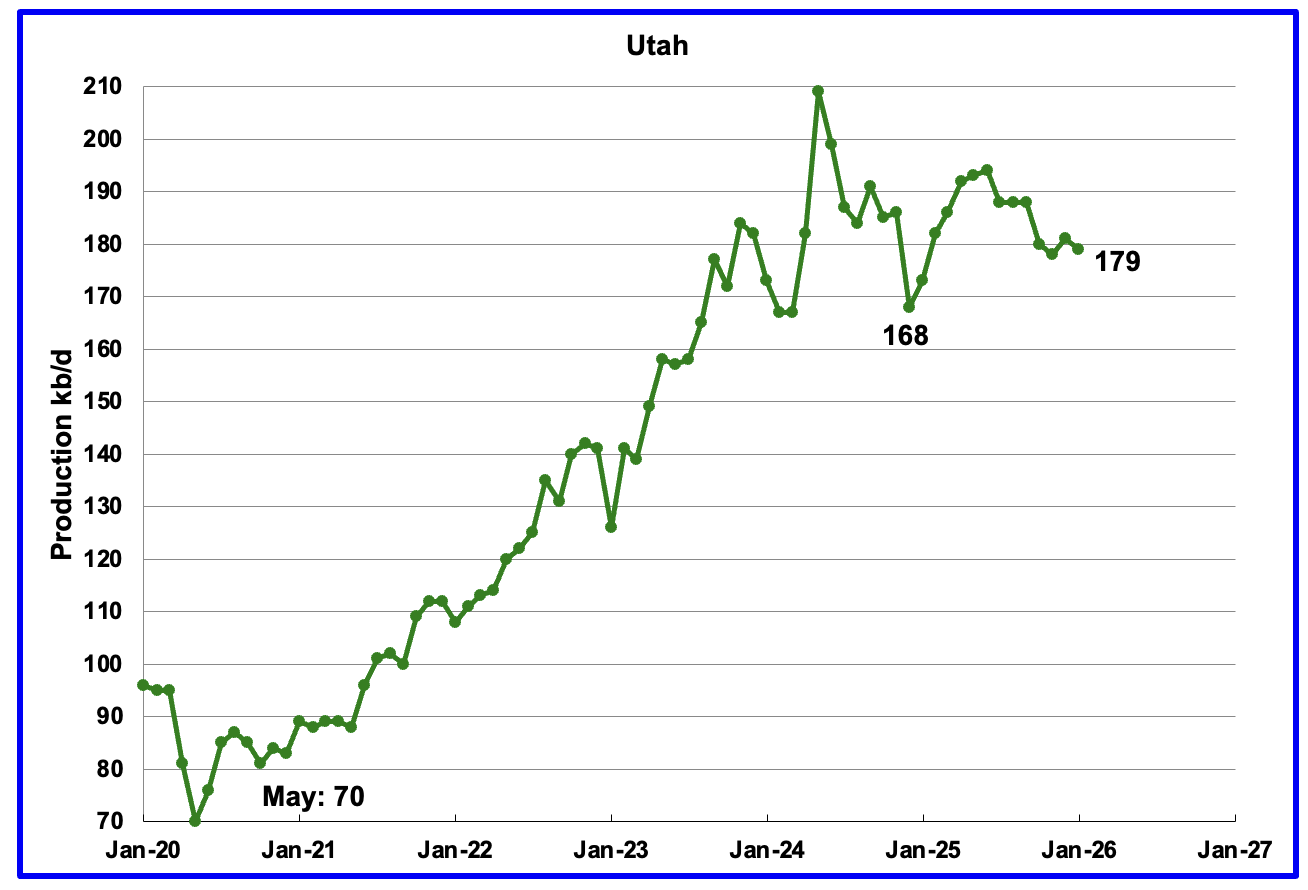
January’s production dropped by 2 kb/d to 179 kb/d. Utah had 8 rigs operating from October 2024 through May 2025 but dropped to 6 in early July 2025. By the beginning of April 2026 the rig count had risen to ten.
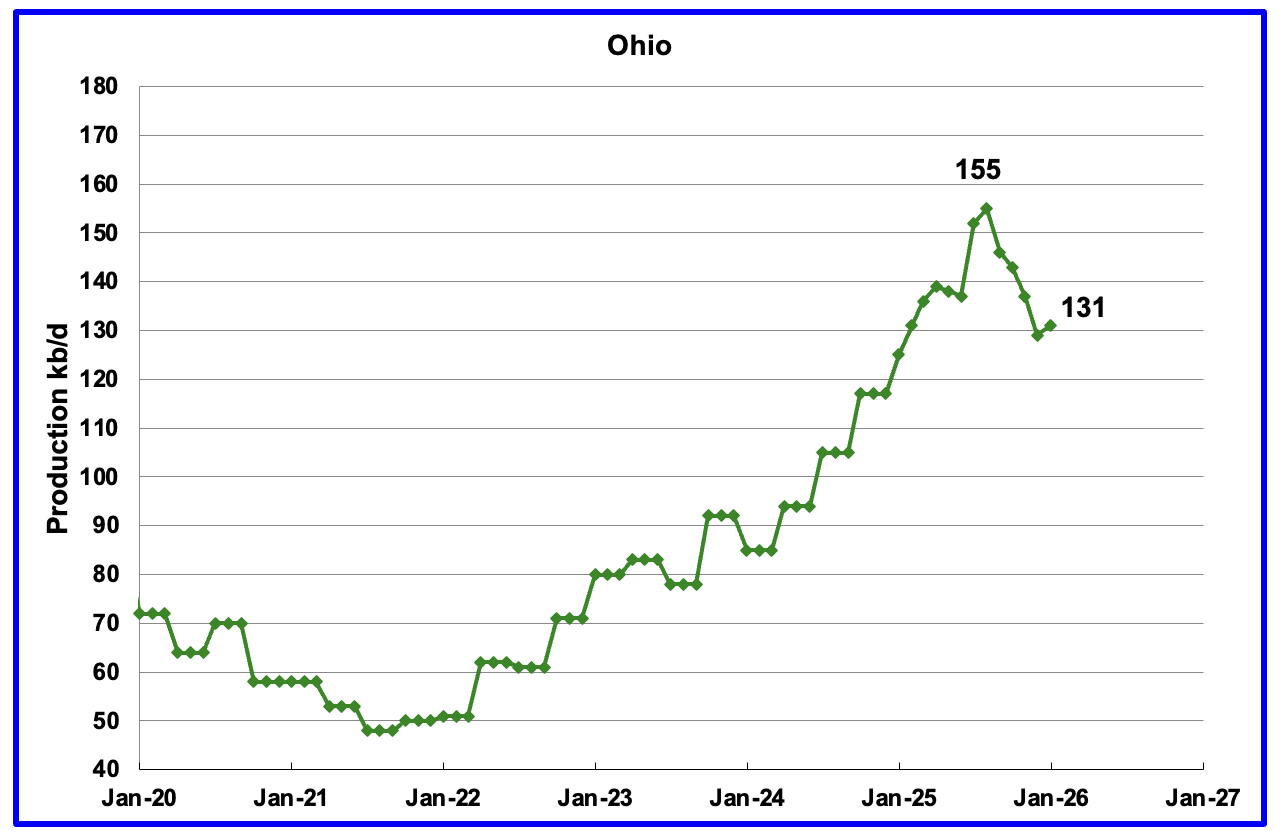
Ohio’s January oil production increased by 2 kb/d to 131 kb/d and was 24 kb/d lower than the August peak of 155 kb/d. In January 2026 Ohio had 12 NG rigs operating. At the end of March, nine NG rigs were operational along with one oil rig.
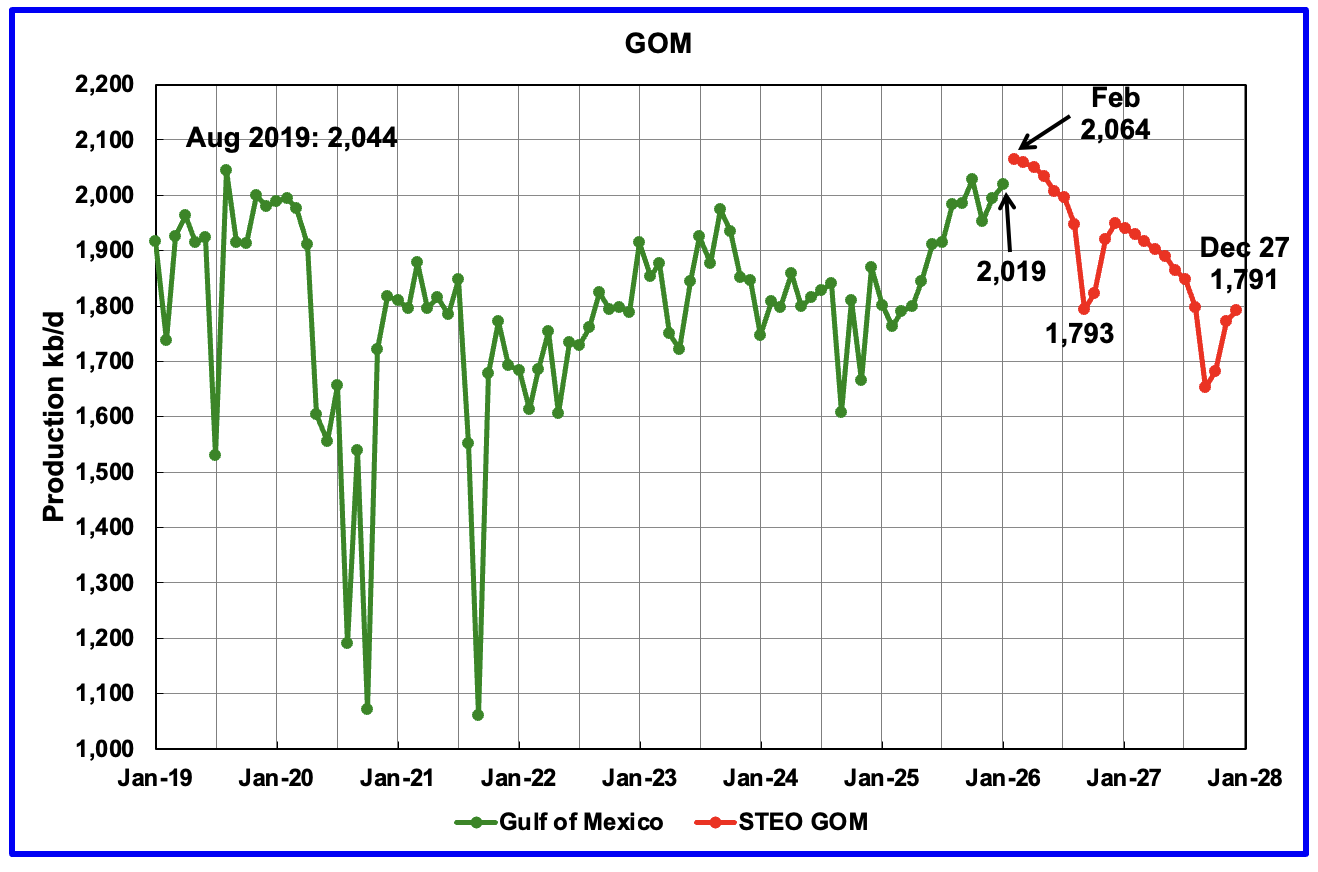
GOM production rose by 25 kb/d in January to 2,019 kb/d.
The March 2026 STEO GOM projection has been added to this chart. For February production is projected to increase to 2,064 kb/d. If the projection is correct, February’s production will be a new high, exceeding the August 2,019 high by 20 kb/d. It also projects production in December 2027 will be 228 kb/d lower than January 2026 at 1,791 kb/d.
While this Article, says three new projects have helped boost US Gulf of Mexico output since mid-2025 and will continue to add to supply, the STEO is indicating that the GOM will peak in February 2026 at 2,064 kb/d.
A Different Perspective on US Oil Production
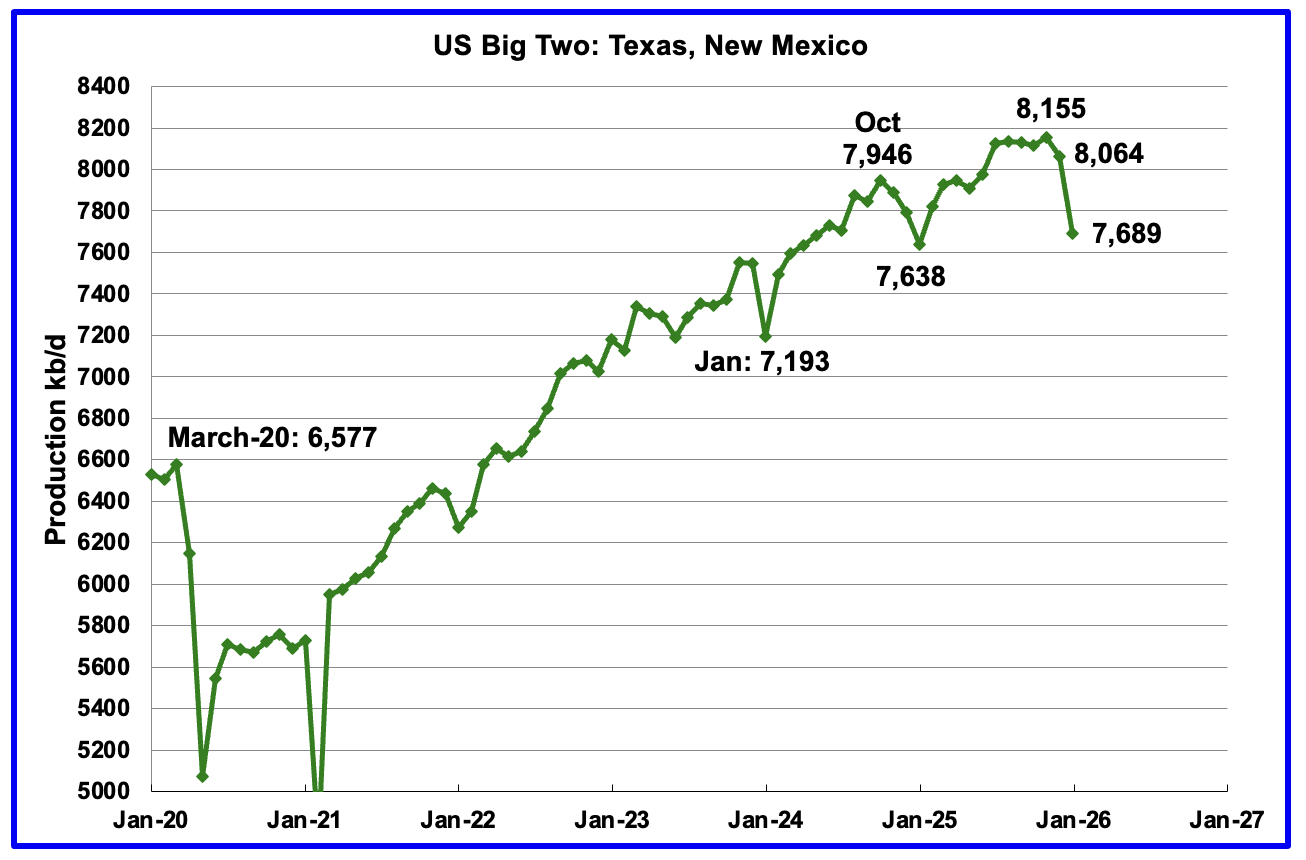
Combined oil output for the Big Two states Texas and New Mexico.
January’s production in the Big Two states decreased by a combined 375 kb/d to 7,689 kb/d. Clearly these two states were the drivers of US oil production growth up to July 2025. The essentially flat production starting in August 2025 was the first sign that production in these two states was close to peaking? The next few months will tell the tale.
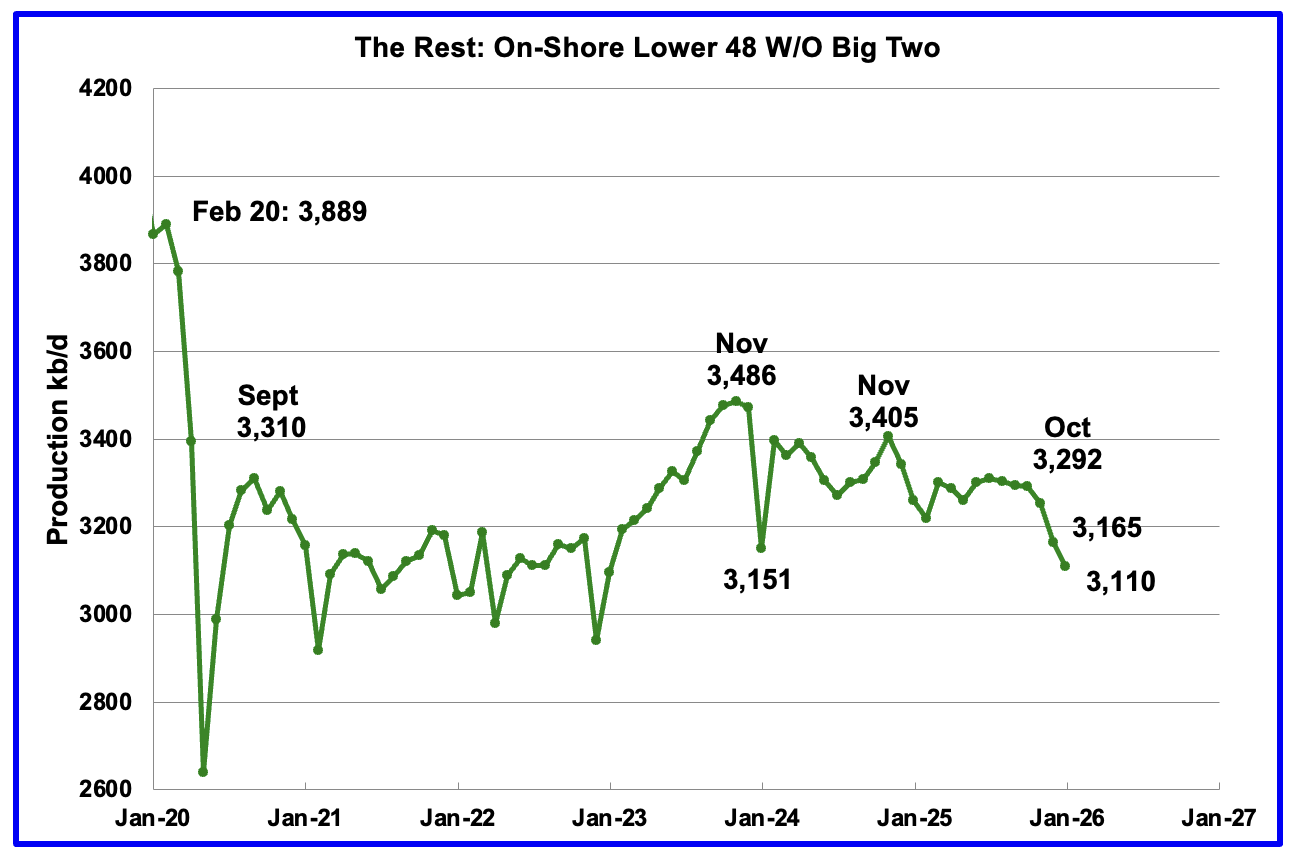
Oil Production by The Rest
January’s oil production by The Rest dropped by 55 kb/d to 3,110 kb/d and is 376 kb/d lower than November 2023.
Permian Basin Report for Main Counties and a District
This special monthly Permian section was added to the US report because of a range of views on whether Permian production will continue to grow or will peak over the next year or two. The issue was brought into focus many months back by two Goehring and Rozencwajg Reports and Report2 which indicated that a few of the biggest Permian oil producing counties were close to peaking or past peak.
A more recent report was issued and can be reviewed Here. In this report they state:
“For years now, we have outlined with what we hoped was clarity, and what we now submit was prescience, the view that U.S. shale oil, that great source of modern supply, could not grow forever. It would mature, crest, and begin its long descent. That moment, by our models and measures, has arrived: shale has plateaued, and 2024 appears to be its high-water mark. And yet, investor sentiment has scarcely been more downbeat.”
This section will focus on the four largest oil producing counties in the Permian, Lea, Eddy, Midland and Martin. It will track the oil and natural gas production and the associated Gas Oil Ratio (GOR) on a monthly basis. The data is taken from the state’s government agencies for Texas and New Mexico. Typically the data for the latest two or three months is not complete and is revised upward as companies submit their updated information. Note the natural gas production shown in the charts that is used to calculate the GOR is the gas coming from both the gas and oil wells.
Of particular interest will be the charts which plot oil production vs GOR for a county to see if a particular characteristic develops that indicates the field is close to entering or in the bubble point phase. While the GOR metric is best suited for characterizing individual wells, counties with closely spaced horizontal wells may display a behaviour similar to individual wells due to pressure cross talking . For further information on the bubble point and GOR, there are a few good thoughts on the intricacies of the GOR in an earlier POB comment and here. Also check this EIA topic on GOR.
New Mexico Permian
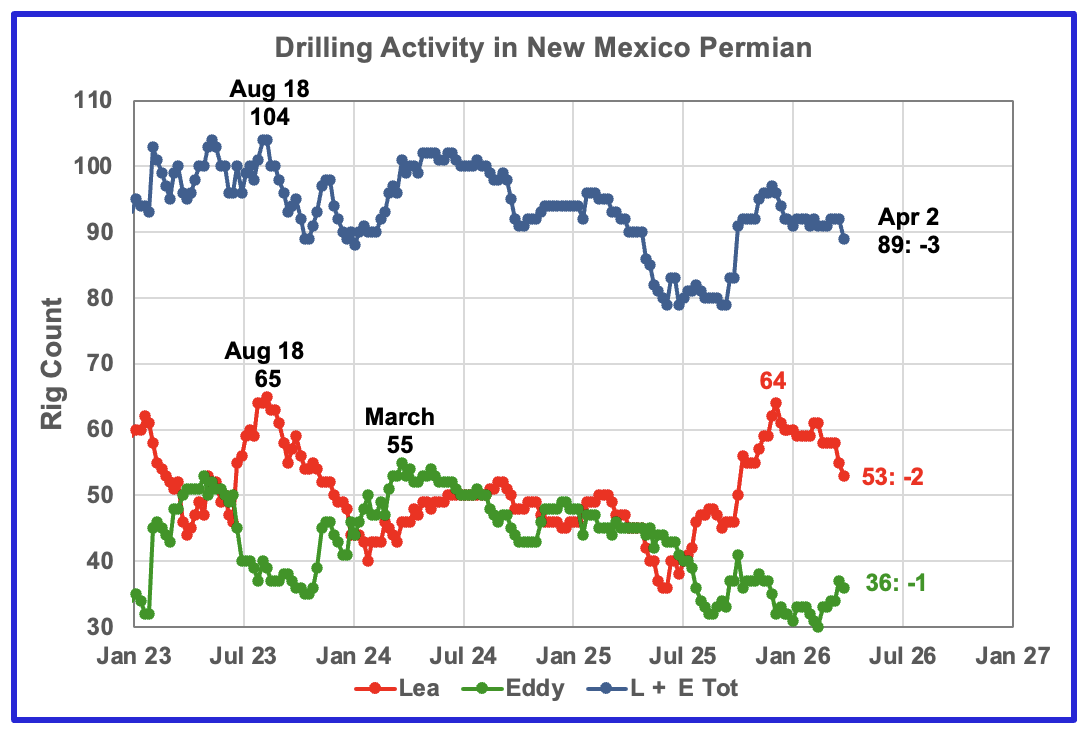
The current rig counts in Lea and Eddy counties are moving in different ways. Lea County has been dropping rigs while Eddy has started adding rigs. Over the past three months Lea County dropped 8 rigs to 53 while Eddy added 6 rigs from 30 in the first week of April. Overall NM dropped 7 rigs to 89 from December to Early April.
Oil Production in New Mexico’s Primary Permian Counties
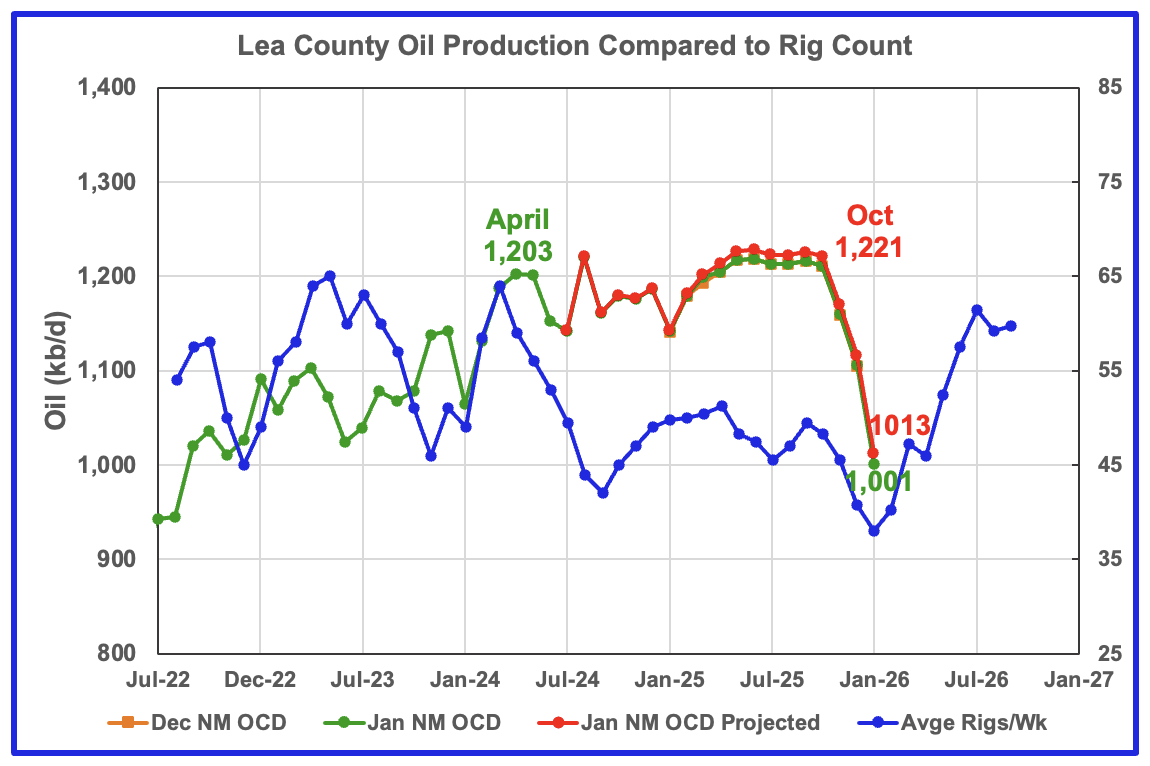
Lea County’s oil production started its plateau phase in April 2024 at 1,203 kb/d and it continued to October 2025. November, December and January have seen production drops in both the projected and NM OCD’s production. However the majority of January’s projected production drop of 104 kb/d is due to the severe January weather. A more realistic drop would have been closer to 60 kb/d to 1,050 kb/d
Preliminary January data from New Mexico’s Oil Conservation Division (OCD) indicates Lea County’s oil production also dropped by 105 kb/d to 1,001 kb/d, green graph, and is a second indictor that production may be in decline in Lea County. The November and December production drop could be associated with the dropping rig count that starts in time shifted October 2025. This raises the question of whether the rising rig count starting in time shifted January 2026 could restore production to a new lower plateau phase.
The blue graph shows the average number of weekly rigs operating during a given month as taken from the weekly rig data. The rig graph has been shifted forward by 7 months. So the 64 Rigs/wk operating in August 2023 have been time shifted forward to March 2024 to show the possible correlation and time delay between rig count, completion and oil production.
Note that rig counts are being used to project production as opposed to completions because state completion data is not available. Completion data from the Drilling Productivity report below indicates that the number of completed DUCs exceeds newly drilled wells in the Permian basin..
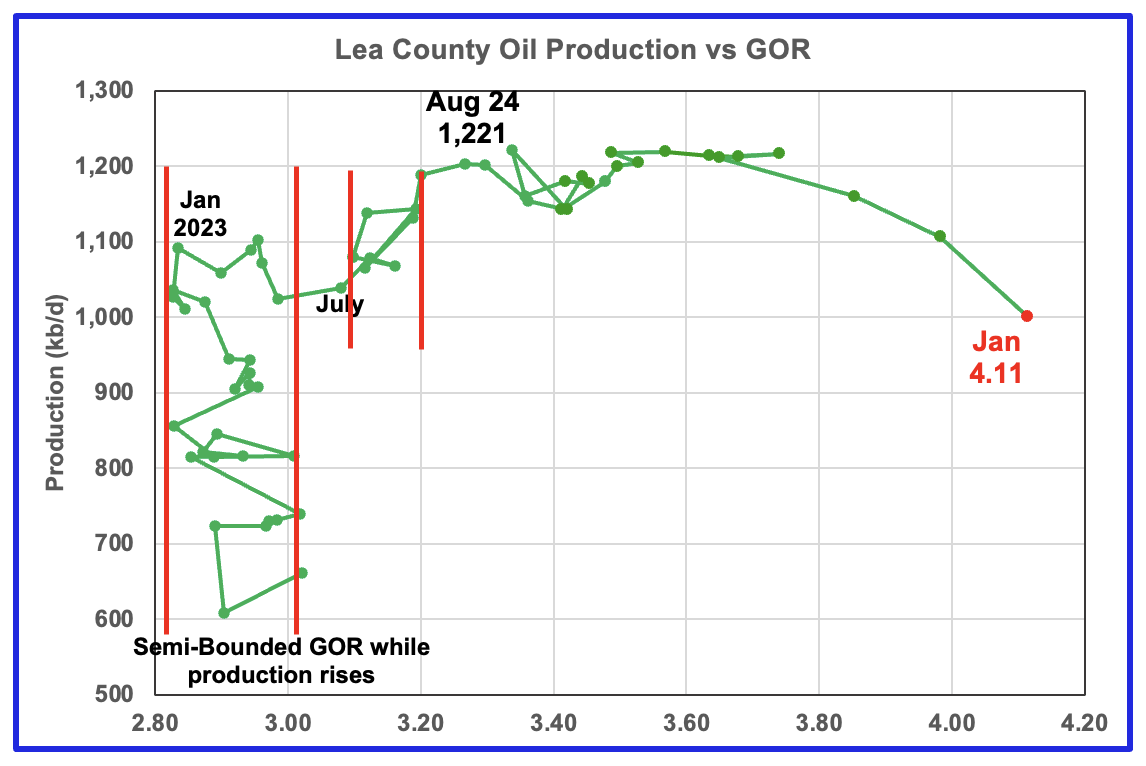
After much zigging and zagging, oil production in Lea county stabilized just below 1,100 kb/d in early 2023. Once production reached a new high in January 2023, production appeared to be on a plateau while the GOR started to increase rapidly to the right and first entered the bubble point phase in July 2023.
Since July 2023 Lea County’s production continued to increase as the GOR remained within a second semi-bounded region. This may indicate that additional production was coming from an oilier part of a layer since the GOR’s behaviour since August 2023 to March 2024 time frame appears once again to be in a second semi bounded GOR phase accompanied with rising production.
The GOR moved out of the second semi-bounded GOR region in April 2024 and production hit a new high of 1,221 kb/d in August 2024. From August 2024 to February 2025 the GOR was range bound between 3.34 and 3.53 but starting in October 2025 to January 2025 the GOR has risen every month to hit new highs. January saw both a production drop to 1,001 kb/d and the GOR increase to a record 4.11. This is another indicator that Lea County may have entered its declining phase.
This zigging and zagging GOR pattern within a semi-bounded GOR while oil production increases to some stable level and then moves out to a higher GOR to the right has shown up in a number of counties. See a few additional cases below. The rising GOR to new highs and dropping oil production in Lea county is an early indicator that production may be entering a declining phase.
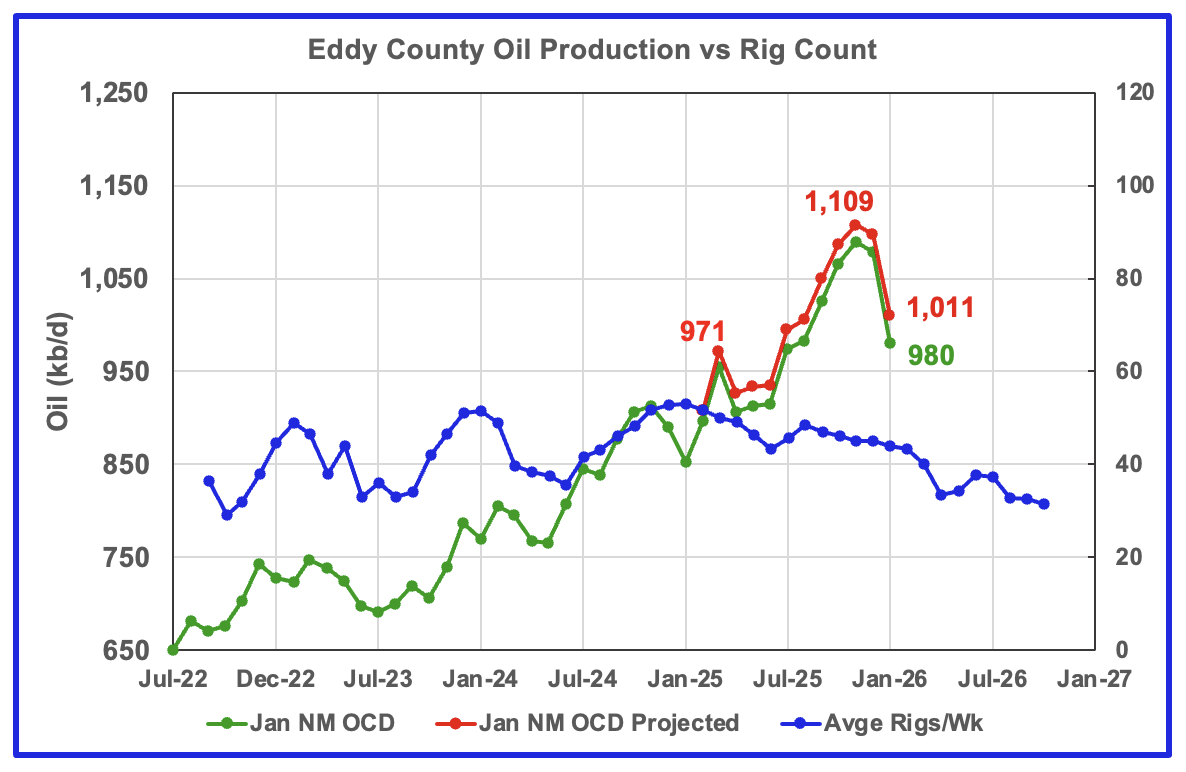
January’s projected oil production decreased by 87 kb/d to 1,011 kb/d while preliminary production from the NM OCD decreased by 98 kb/d to 980 kb/d. Again most of the production drop was due to severe January weather. Eddy’s month over month production updates are typically very few and small and primarily occur in the last two or three months which indicates that the monthly updates are close to being final, say 95% of final. A more realistic projection for January would be closer to 1,060 kb/d. February’s production data should rebound as the winter weather effects are offset.
Note that from June 2025 to November 2025 projected production in Eddy County increased by 172 kb/d. The December and January production drops may be indicating an upcoming peak.
Note that the peak production reported last month has been reduced by 80 kb/d to 1,109 kb/d due to updated November production.
The rising production for July and August could be linked to the increasing rig count starting in time shifted June 2025. However the rig count for September and October and going forward is dropping while production continues to rise. This implies that Eddy County has been drilling in some very productive areas or been completing extra DUCs or drilling longer laterals beyond three miles.
The blue graph shows the average number of weekly rigs operating during a given month as taken from the above weekly drilling chart. The rig graph has been shifted forward by 8 months to roughly coincide with the increase in the production graph starting in October/November 2023.
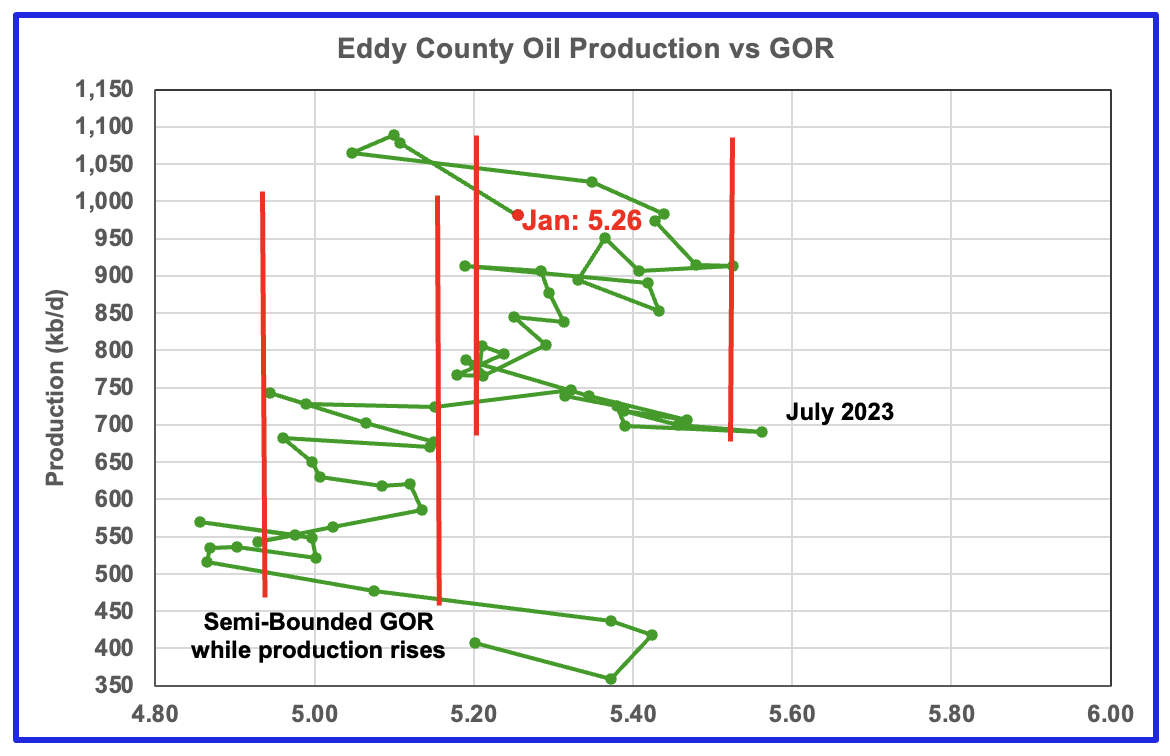
The Eddy county GOR pattern is similar to Lea county except that Eddy broke out from the first semi bounded range earlier and then added a second wider semi-bounded GOR phase. For January New Mexico’s Oil Conservation Division (OCD) reported preliminary oil production decreased by 98 kb/d to 980 kb/d while the GOR rose to 5.26 from 5.11 and moved back into the second Semi-Bounded GOR range.
Texas Permian
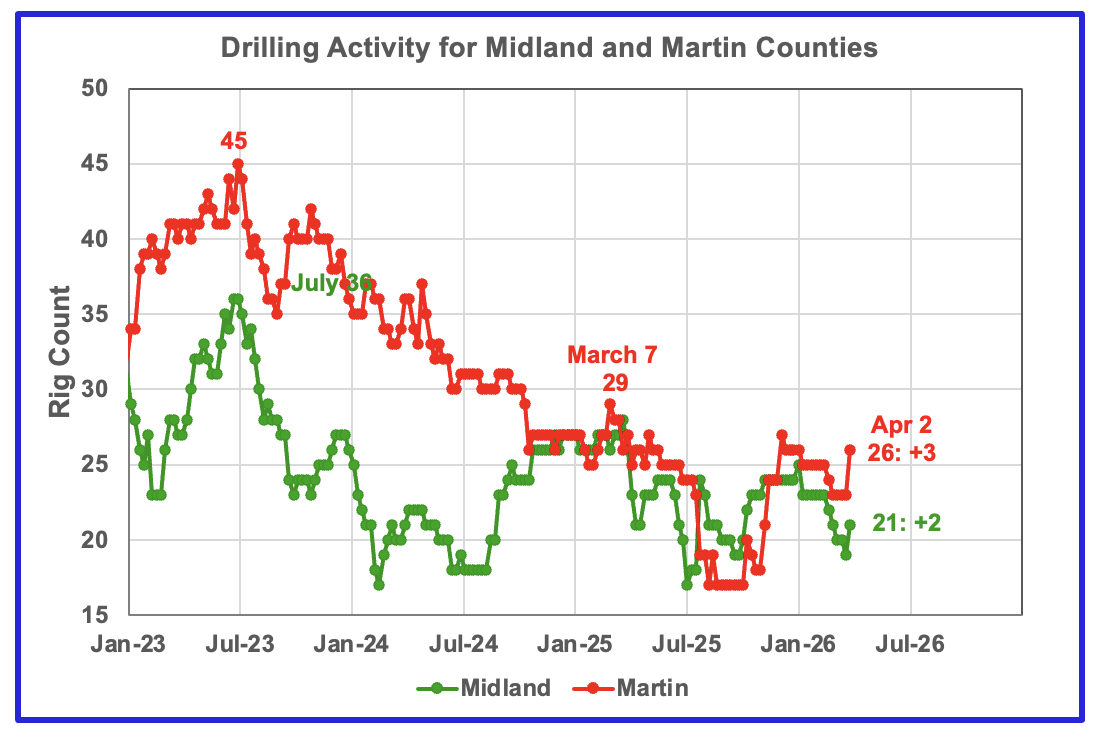
The rig counts in both Midland and Martin counties decreased over the past few months. However in the first week of April, rigs were added, possibly due to higher oil prices of $111.52/b. Martin dropped rigs from December to March but then added rigs in early April. Midland dropped 6 rigs from early January to 19 in late March and then added 2 to 21 in early April.
Oil Production in Primary Permian Texas’ Counties
Comparison Chart
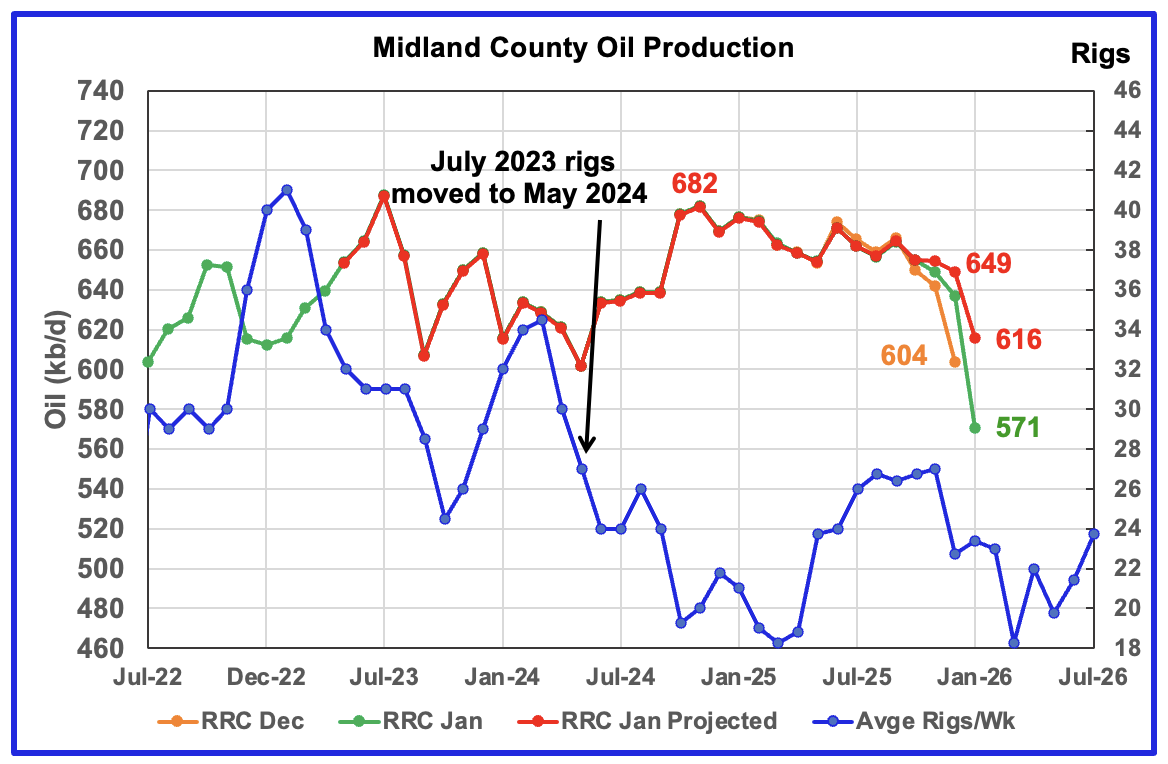
January’s projected production dropped by 33 kb/d to 616 b/d. Part of this drop is due to the severe Texas winter storm in late January. Midland county along with many others experienced this January production drop.
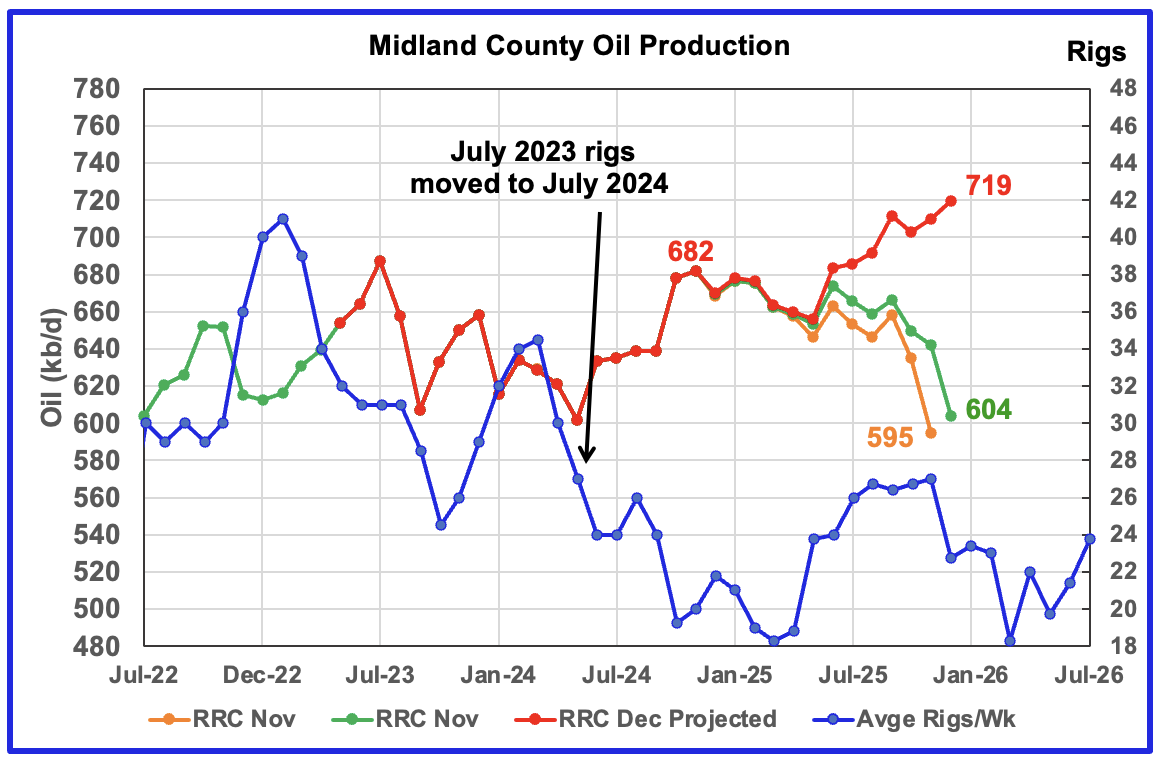
The two previous Midland reports showed projected production starting to rise in June 2025 and roughly followed the time shifted rising rig count, see comparison chart above. However for January’s update projected production began dropping in June 2025. This is quite a change and is due to better updated Texas data. Note the smaller extent of month over month production increments, compare the gap between the orange and green graphs.
This current chart shows production peaking in November 2024 at 682 kb/d. Also the projection and Texas data are very close up to September 2025. Combining the dropping production with the sharp drop in the time shifted November 2025 rig count makes me think that Midland’s oil production has entered its declining phase.
The orange and green graphs show preliminary oil production for Midland County as reported by the Texas RRC for December and January. The red graph uses December and January data to project production as it would look after being updated over many months.
The blue graph shows the average number of weekly rigs operating during a given month as taken from the weekly drilling chart. The rig graph has been shifted forward by 8 months, revised down from 10, to better align with the latest production.
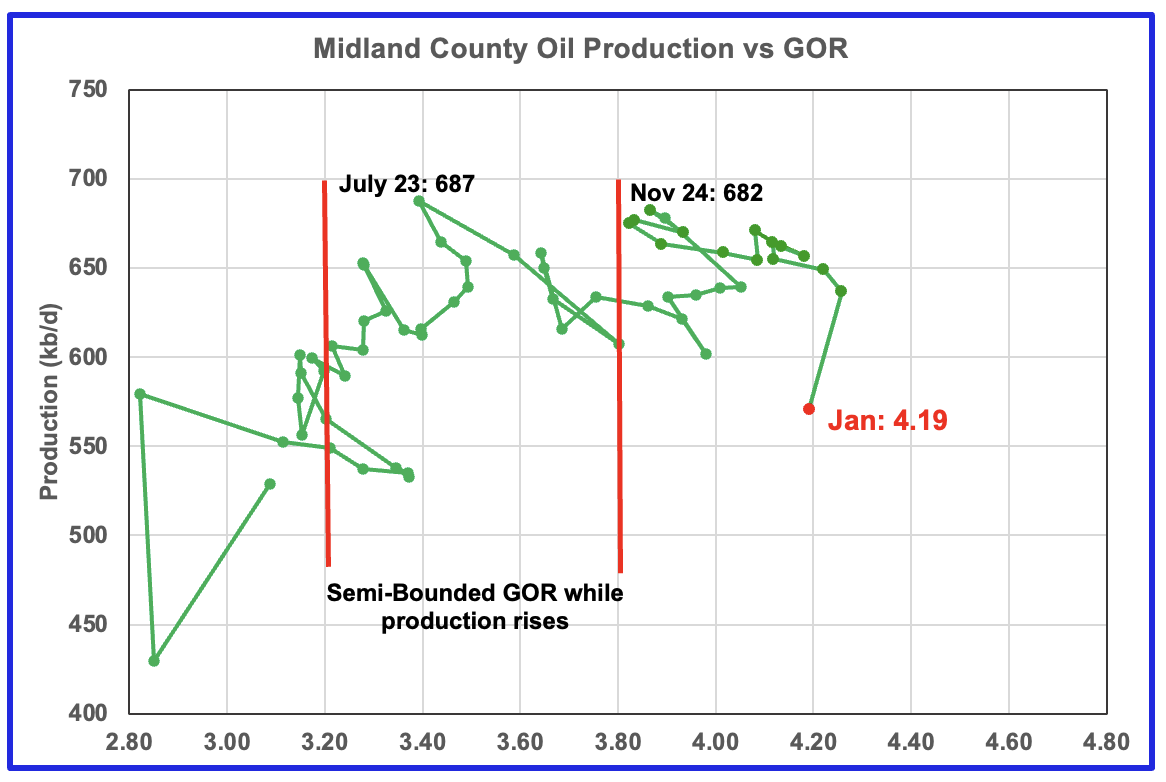
For January the Midland GOR ratio dropped to 4.19 from 4.26 in December while the reported preliminary oil production dropped by 66 kb/d to 571 kb/d.
When Midland county GOR initially moved into the bubble point phase, oil production and the GOR stayed within a narrow GOR range of 3.8 to 4.2 outside of the initial Semi-Bounded GOR region from March 2024 to October 2025. For January it has dropped back into the narrow range.
The January drop in oil production and casinghead gas was 10% and 12%, respectively. The drop in Gas Well gas was 23%. Since the GOR includes gas from gas wells, this implies more gas wells were affected/closed than oil wells and could explain why the GOR has dropped.
The overall rising GOR is another indicator that Midland County may have passed peak production.
The oil production and GOR data shown in this chart are based on the RRC’s January preliminary production report.
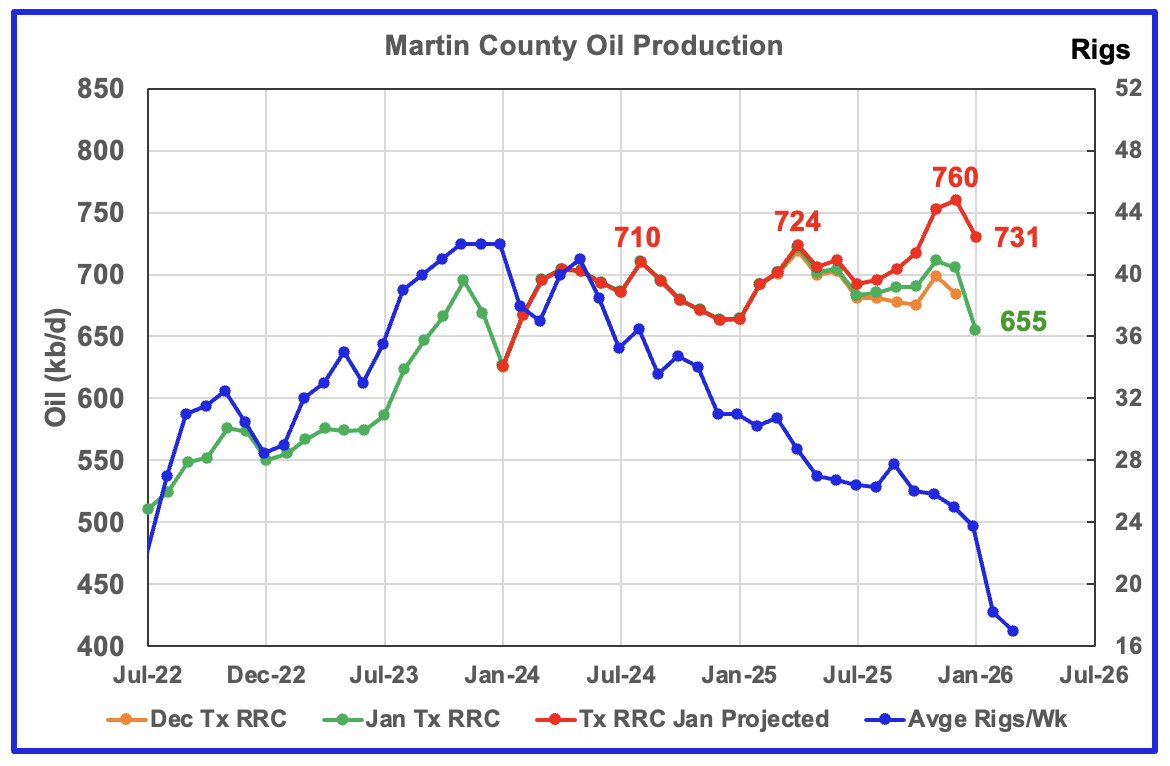
Martin county’s projected January oil production dropped by 29 kb/d to 731 kb/d. Part of this drop is due to the severe Texas winter storm in late January.
I think the December projected production of 760 kb/d is a bit optimistic due to the large revisions to the monthly increments between the Texas RRC’s January and December reports.
Considering the August 2024 and April 2025 peaks are both close to 717 kb/d and considering the falling rig count, a more realistic production estimate for December would be closer to 730 kb/d. Will the falling rig count since time shifted July 2025 begin to take its toll in 2026?
The red graph is a projection for oil production as it would look after being updated over many months. This projection is based on a methodology that uses preliminary December and January production data.
The orange and green graphs show production for Martin County as reported by the Texas RRC for December and Januart. The blue rig graph time shifts the rig count forward by 6 months.
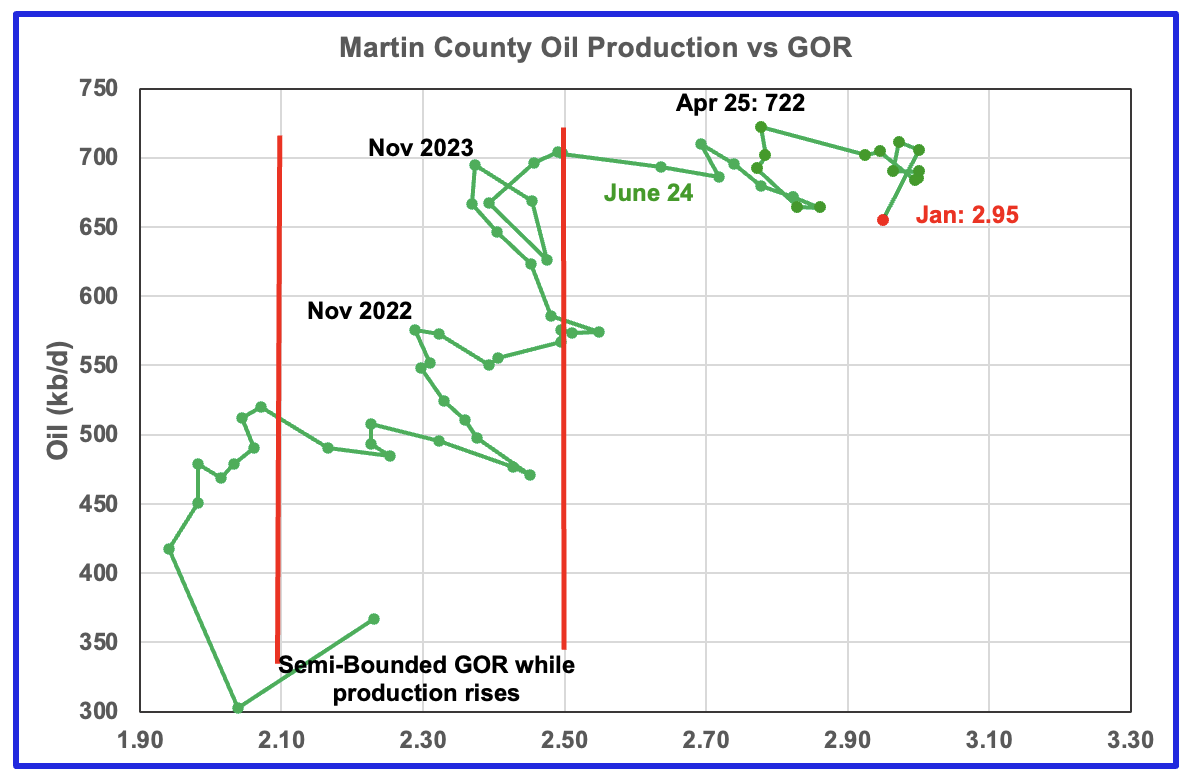
Martin county’s oil production after November 2022 increased and at the same time drifted to slightly higher GORs within the semi bounded range. However the June 2024 GOR saw its first move out of the semi bounded region. The RRC’s preliminary January 2026 production for Martin County shows a 51 kb/d decrease to 655 kb/d accompanied by a decrease in the GOR to 2.95.
Martin county has the lowest semi-bounded GOR boundary of the four counties at a GOR of close to 2.50. The January GOR is now clearly out of the semi-bounded region. Martin County has now entered the bubble point phase that should result in a plateau phase that should shortly turn into a slowly dropping oil production phase.
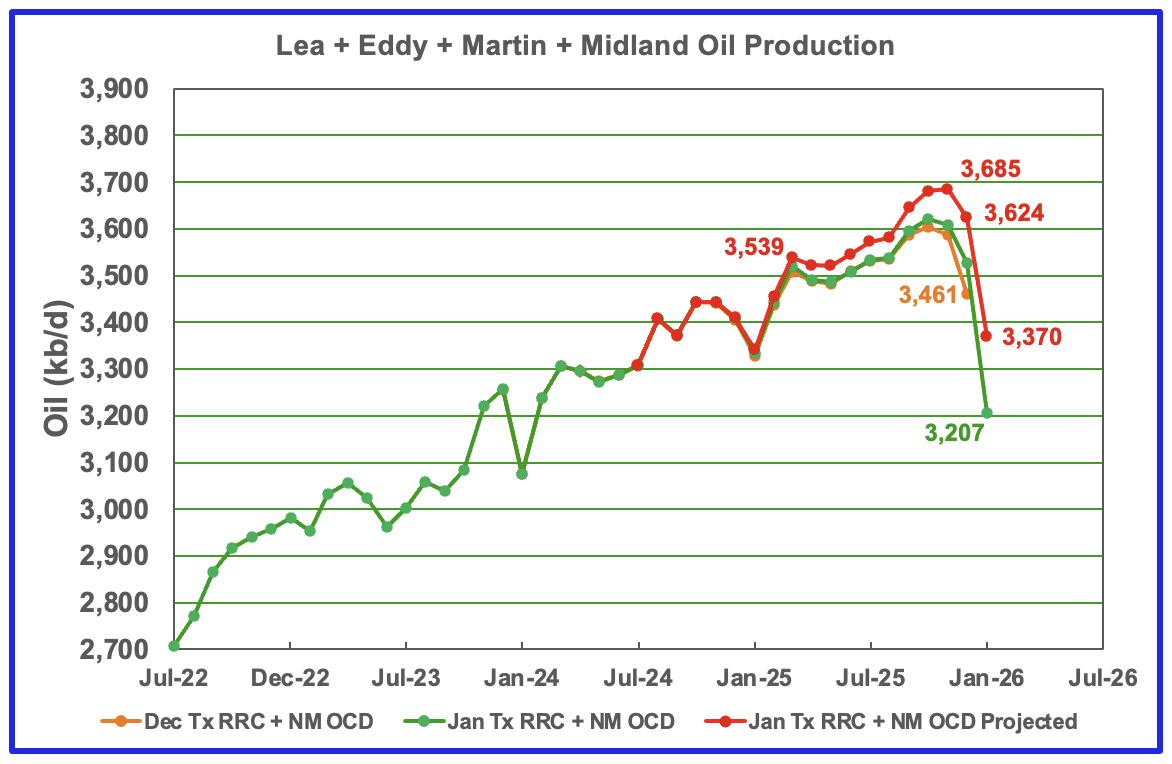
This chart shows the total oil production from the four largest Permian counties. Assuming current Permian production is close to 6,600 kb/d, these four counties account for 51% of the total.
January’s projected production decreased by 254 kb/d to 3,370 kb/d and is the second monthly production drop and is largely due to the late January winter storm. Of the 254 kb/d drop, the largest drops came from Lea and Eddy counties, 104 kb/d and 87 kb/d respectively.
Last month I wrote: “Due to the unusually late revisions from the NM OCD, I think December projected production is too high by close to 100 kb/d. In other words December projected production should be closer to 3,650 kb/d.” This month it has been revised down to 3,624 kb/d.
The December and January initial production data are shown in the orange and green graphs respectively. The red graph uses the December and January production data to project a final updated production for January.
Findings
– This month’s production drops are due to a combination of a severe winter storm and natural decline which should result in increased production in February in one or two of these four counties.
– The preliminary January production data for both New Mexico and Texas was OK and provided reasonable projections for January.
– Lea county entered its plateau phase in May 2024. While oil production is not following the rig count graph directly, the dropping rig count has resulted in Lea County production being in a steady flat plateau phase up to September 2025. However October to January had production drops which indicate Lea County has entered a declining phase. That declining phase could enter a lower level plateau phase in 2026 as the time shifted February rig count begins to increase.
– July to November production in Eddy County saw a steady increase to 1,110 kb/d. While November’s projected production increased, it was smaller than previous monthly increases and may be indicating the beginning of a peaking/declining phase. The drop in December and January production is another indicator that Eddy’s production may have peaked. The full effect of January’s severe weather on January production will not be known until February’s production is reported.
– Updated January Texas RRC production data shows that Midland County’s projected production dropped from January 2025 to December 2025. This makes me think that Midland’s oil production has entered its declining phase. However the rising time shifted rig count starting in March 2026 may indicate an upcoming rising production phase but not to a new high. The addition of six new rigs to Midland county in real August 2025 to 24 from 18 was an unexpected surprise and makes one wonder what it implies for Midland county oil production going forward after allowing for the rig count to production delay.
– Martin’s county January projected production drop indicates that its oil production may be in a plateau phase of close to 725 kb/d.
Texas District 8
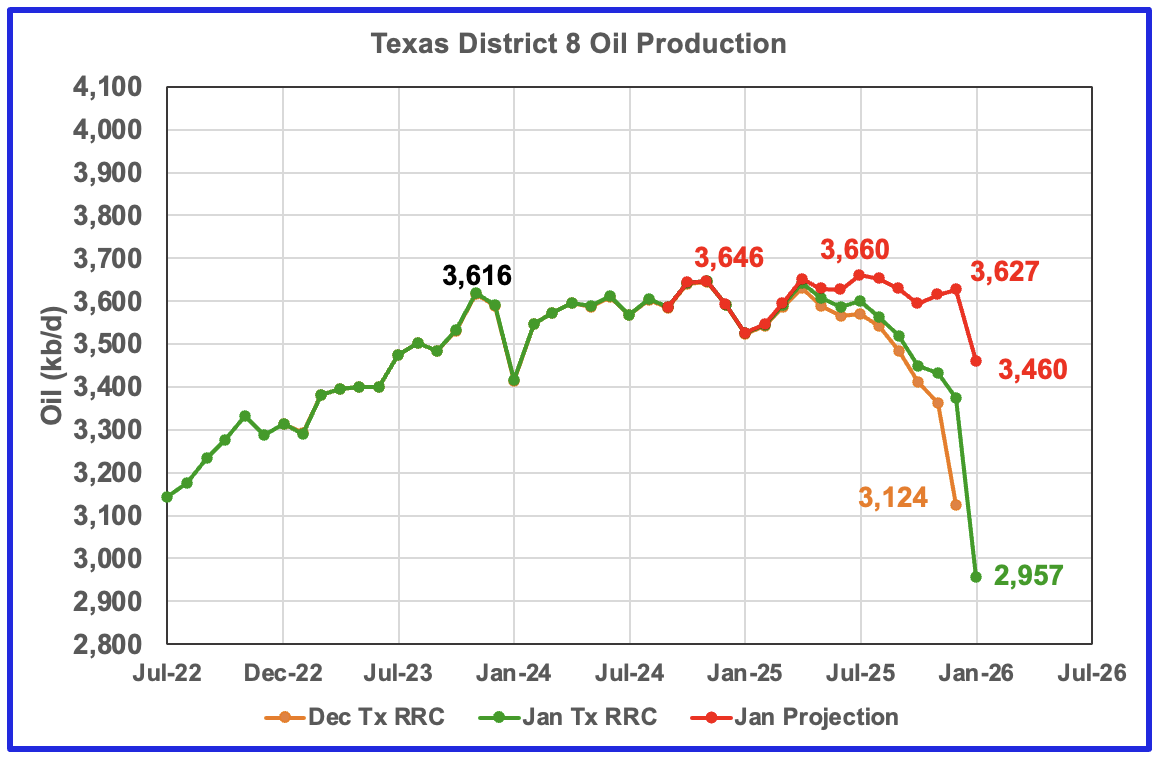
District’s 8 projected production dropped by 167 Kb/d in January. District 8 has shown 3 peaks from October 2024 to December 2025. This is a strong indicator that District 8 is now in its plateau phase before entering its dropping phase.
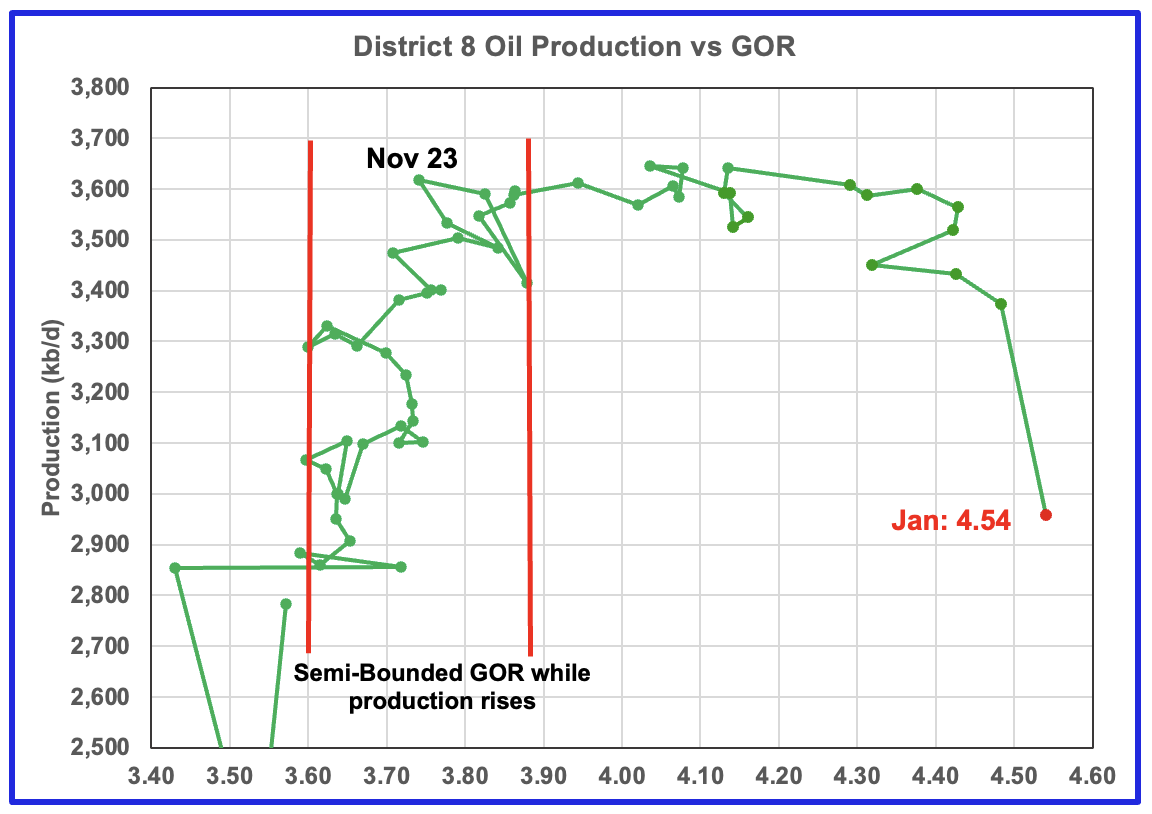
Plotting an oil production vs GOR graph for a district may be a bit of a stretch. Regardless here it is and it seems to indicate many District 8 counties may well be into the bubble point phase. The December GOR increased to 4.54, a new high, as the preliminary RRC production took a large drop of 416 kb/d to 2,957 kb/d.
Oil Production and GOR Charts for Four of the Next Larger Texas Oil Counties
Texas January data appears to be reasonable as are the county projections.
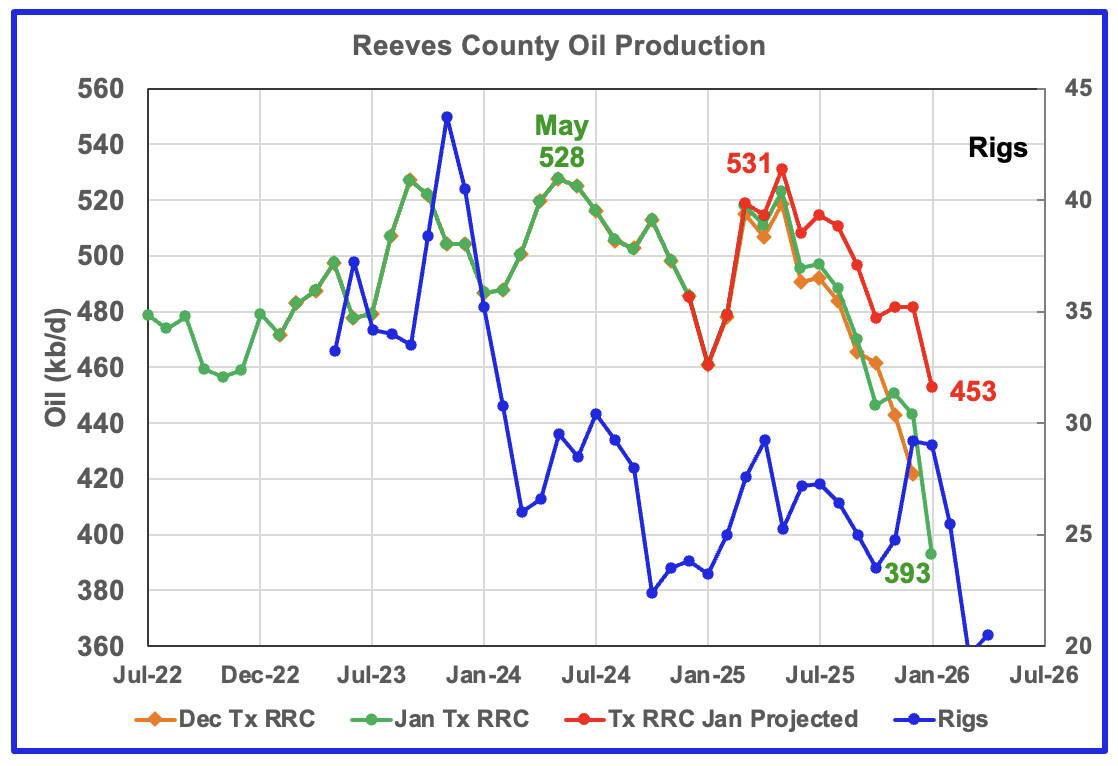
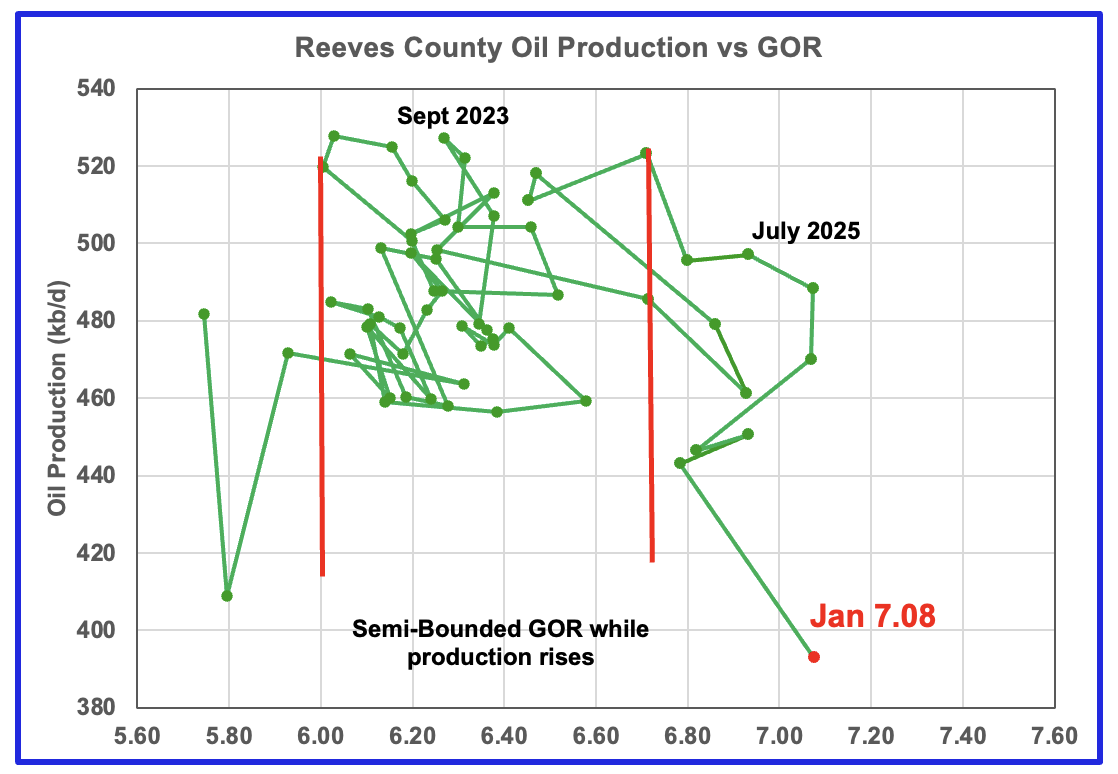
Reeves County GOR is high because it is the number one Texas county ranked by gas production. The current C + C production is almost split between crude and condensate, with condensate about 5% higher than crude.
Reeves County GOR first moved out of the Semi-Bounded region in June 2025 and in January reached a new high of 7.08 while initial production dropped to a new low of 393 kb/d.
The rig count is time shifted forward by 7 months.
In real June 2025, 29 rigs were operational in Reeves county. By late March 2026 the rig count had dropped to 11. That is a large drop in 9 months.
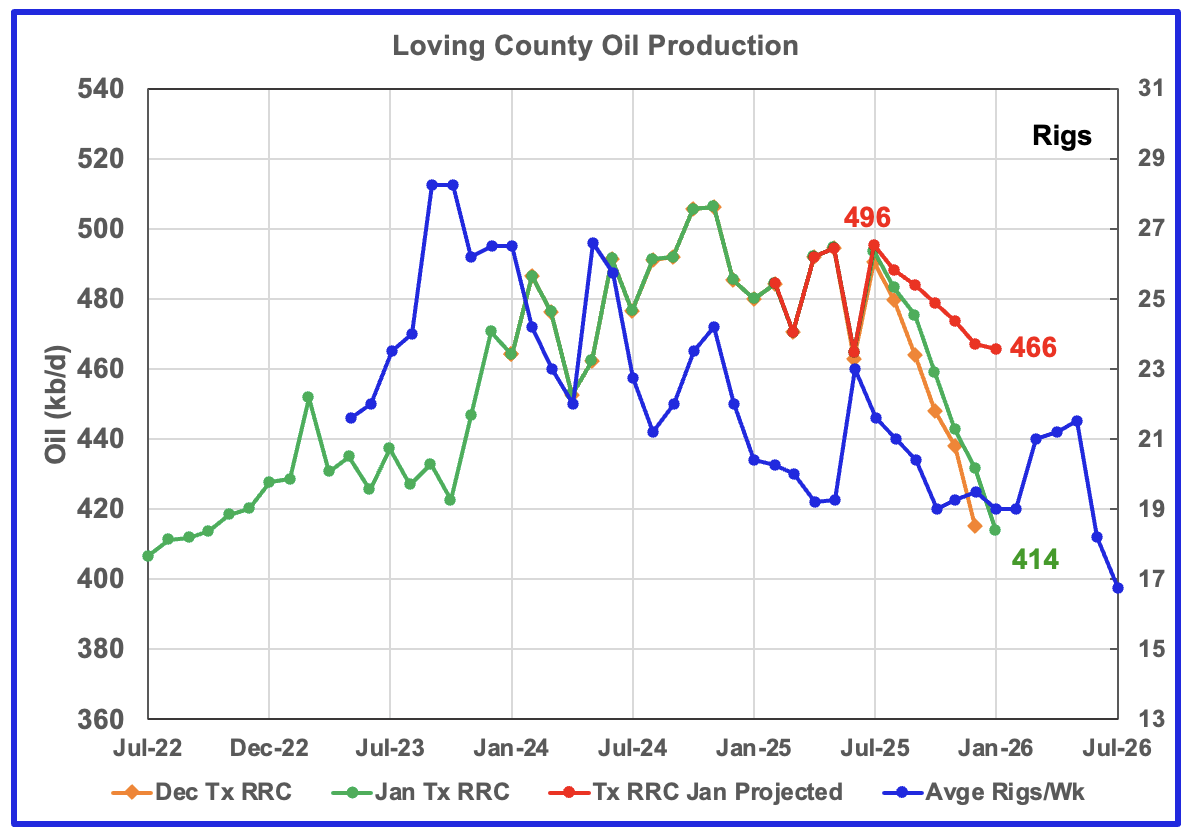
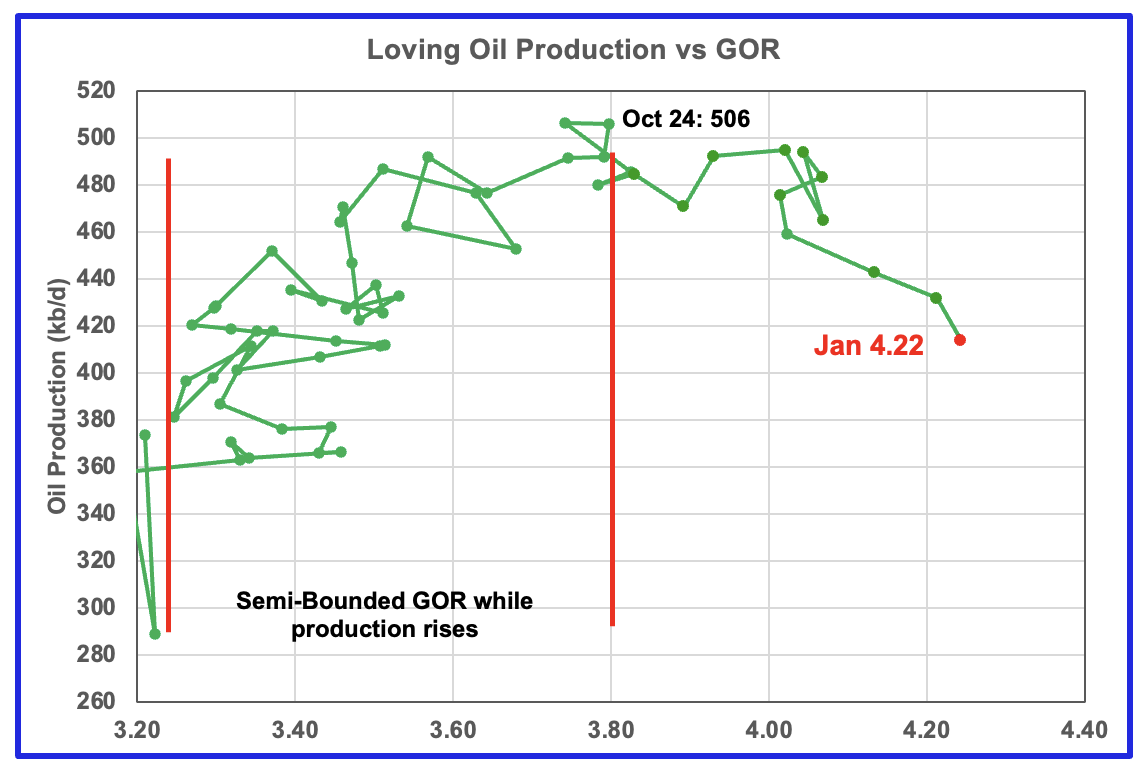
Loving’s projected production dropped by 1 kb/d to 466 kb/d in January. For January, the GOR increased to 4.22, a new high, while preliminary production has continued to drop since August 2025.
Loving’s rig graph is time shifted forward by 8 months.
While Loving had 19 operational rigs in real June 2025, they jumped by 3 to 22 in real September and then dropped to 18 in early April.
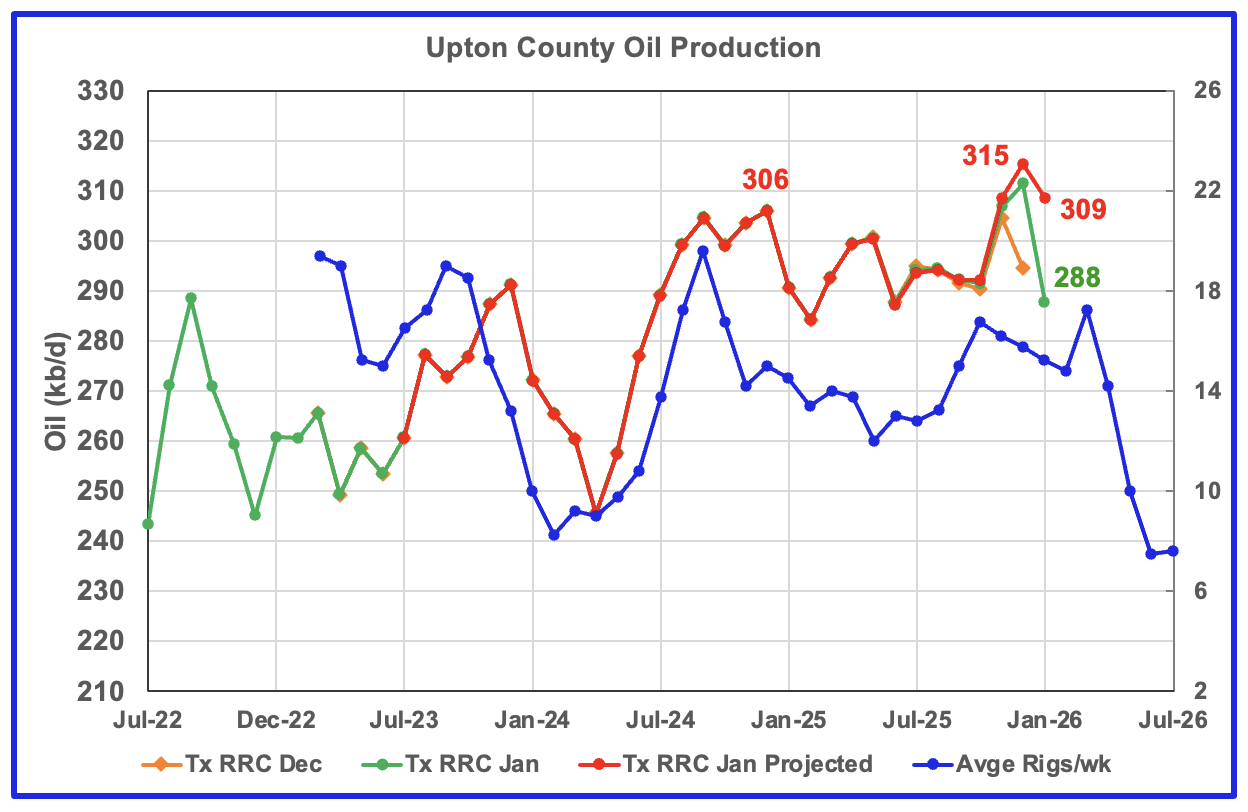
Upton’s projected January production dropped by 6 kb/d to 309 kb/d.
For the next few months Upton County may see a production increase associated with the rising rig count which started in time shifted August 2025. A decline may begin in time shifted April 2026 as the rig count begins to drop..
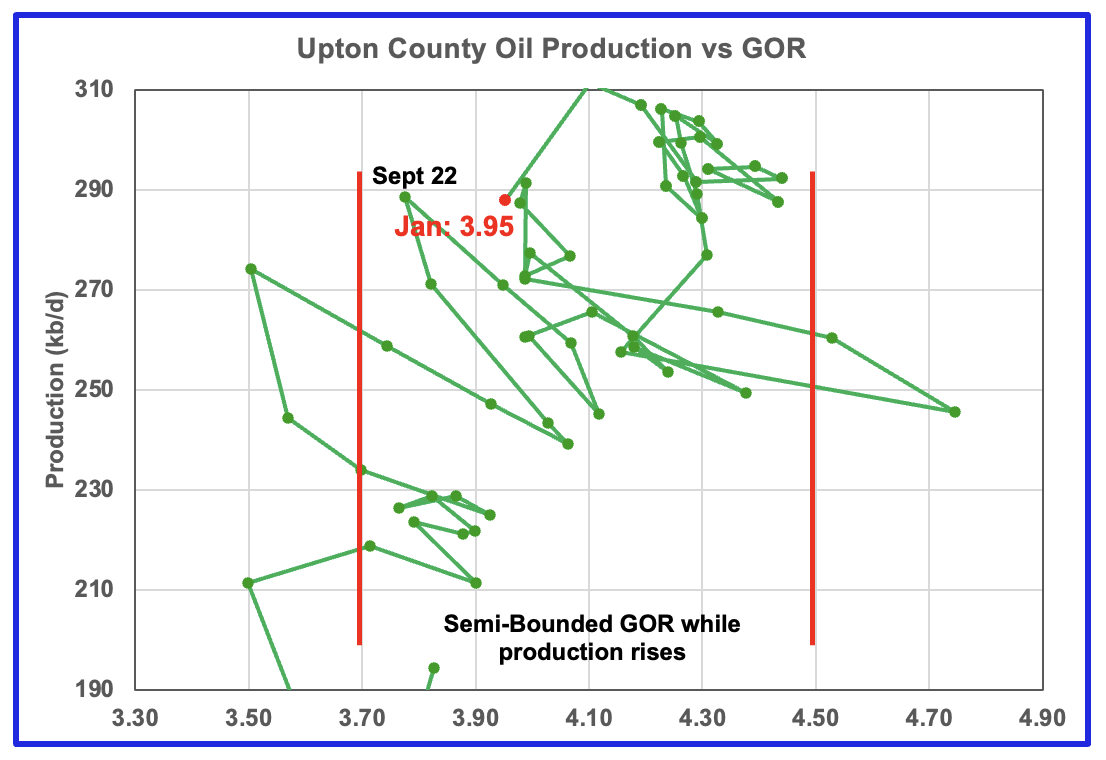
Upton’s GOR continues to stay within the Semi-Bounded region at 3.95.
Upton’s rig chart has been time shifted forward by six months. Upton began 2026 with 7.6 rigs. In real March 2026, 11 rigs were operating.
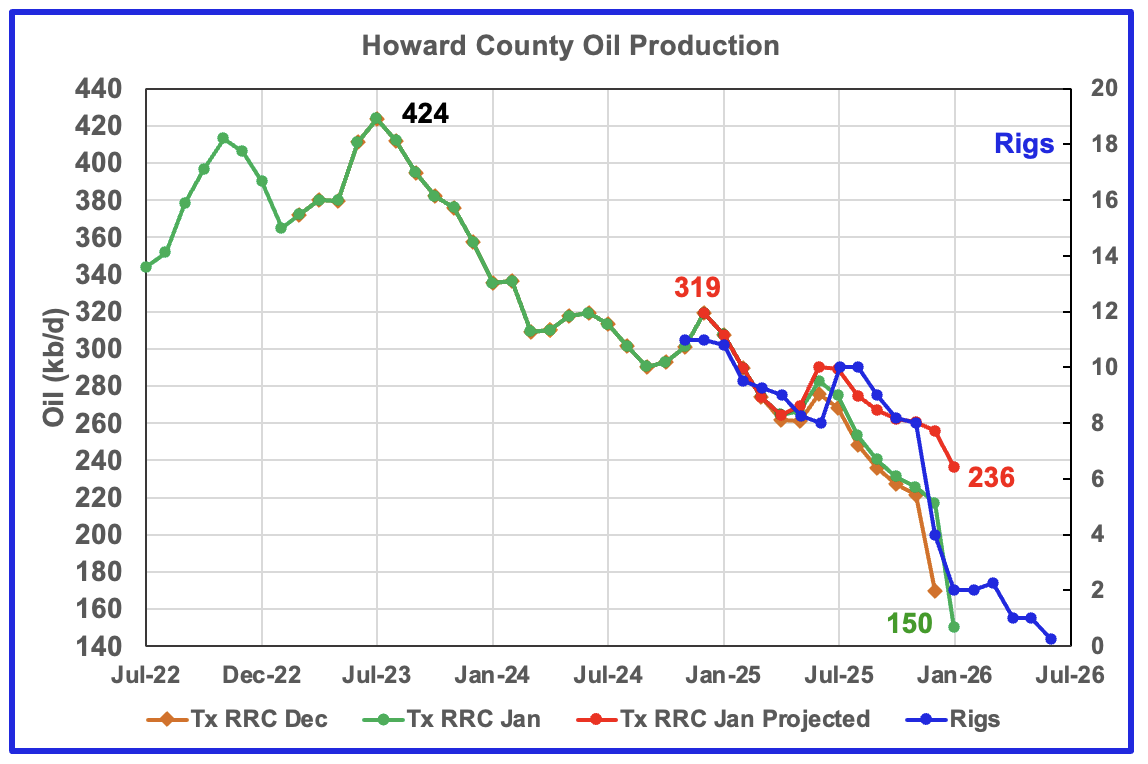
Howard County oil production peaked in July 2023 and has been in a slow decline ever since.
In January the projected production dropped by 20 kb/d to 236 kb/d.
Note the rig count in time shifted June 2026 is 0.25, i.e. 1 rig for one week in real January 2026. The rig graph is time shifted forward by 5 months.
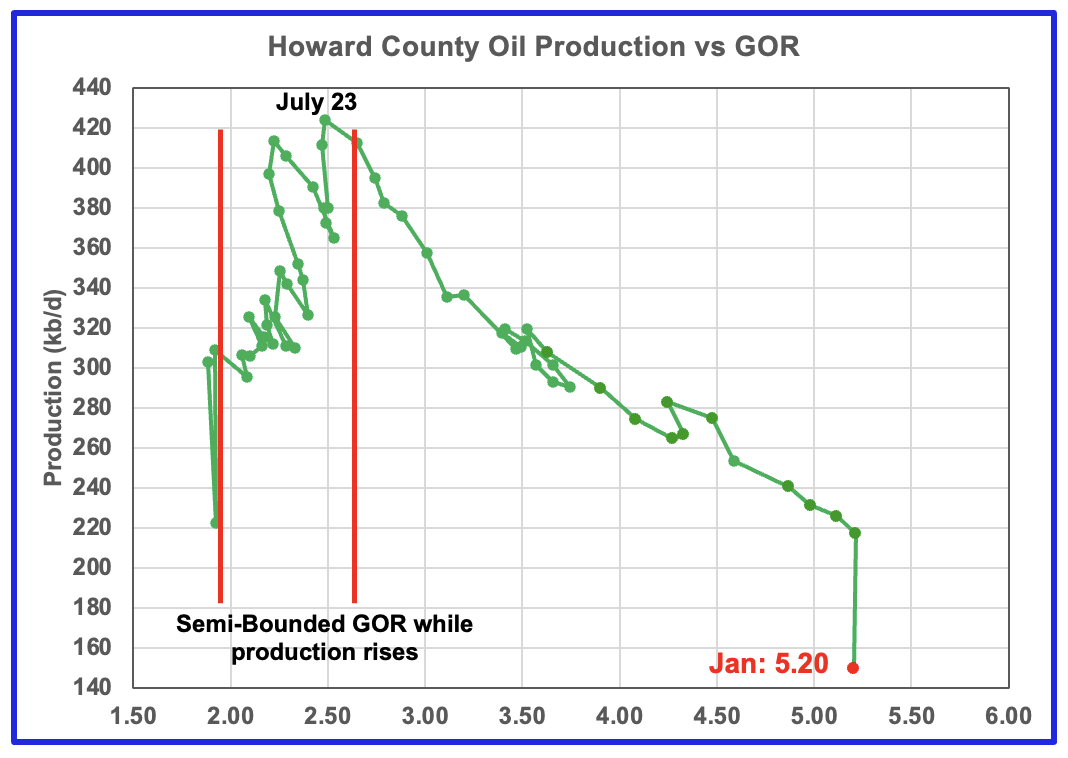
For January the GOR dropped slightly to 5.20 as the initial production dropped steeply to 150 kb/d.
Drilling Productivity Report
The Drilling Productivity Report (DPR) uses recent data on the total number of drilling rigs in operation along with estimates of drilling productivity and estimated changes in production from existing oil wells to provide estimated changes in oil production for the principal tight oil regions. The new DPR report in the STEO provides production up to February 2026. The report also projects output to December 2027 for a number of basins. The DUC charts and Drilled Wells charts are also updated to February 2026.
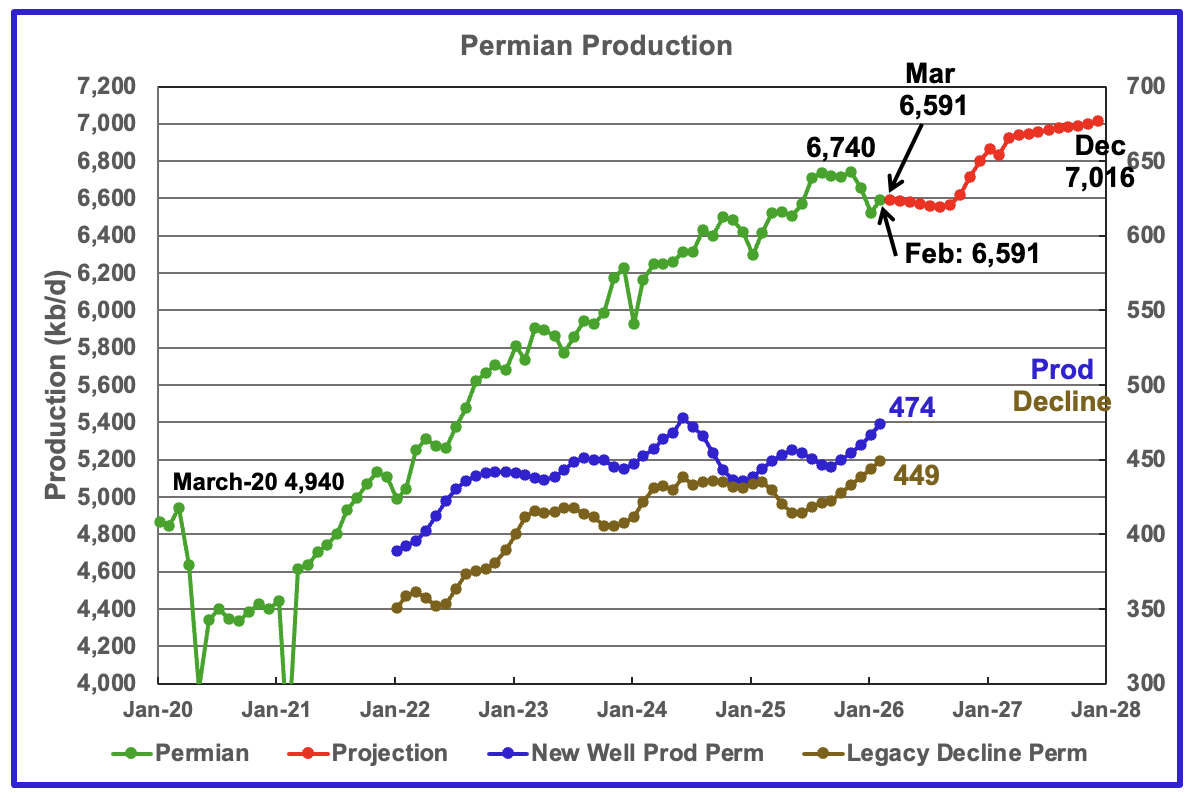
The EIA’s March STEO/DPR report shows Permian February output rose by 70 kb/d to 6,591 kb/d. The rise is due the rebound from severe winter weather in late January. March production is expected to be the same as February. From March 2026 to December 2027 output is expected to increase by 425 kb/d to 7,016 kb/d. December 2027 production has been revised up by 455 kb/d.
There are two significant changes/revisions to the March chart.
Production drops from March 2026 to August 2026. This drop I think is related to either a low number or no oil wells being brought online during the winter storm in late January. With no wells being brought on line, the steep drop in the new wells brought online in the previous two months rears its ugly head. The lack of daily new wells being brought on line during the storm are required to partially offset that steep decline. Note production never recovers to the December level. It is pretty well a slow downhill story after March 2026.
Production begins to rise steadily from October 2026 to December 2027. According to the EIA, this is due to higher prices for WTI and more NG pipelines being built. The gas pipelines are needed too capture the associated flared gas coming from new oil wells.
Production from new wells and legacy decline, right scale, have been added to this chart to show the difference between new production and legacy decline.
These numbers reflect a one year production trend and provide the production contribution from new wells over a rolling 12-month period to determine if the rate of new production is increasing or decreasing compared to previous periods. The averaging process approximately adds a six month delay.
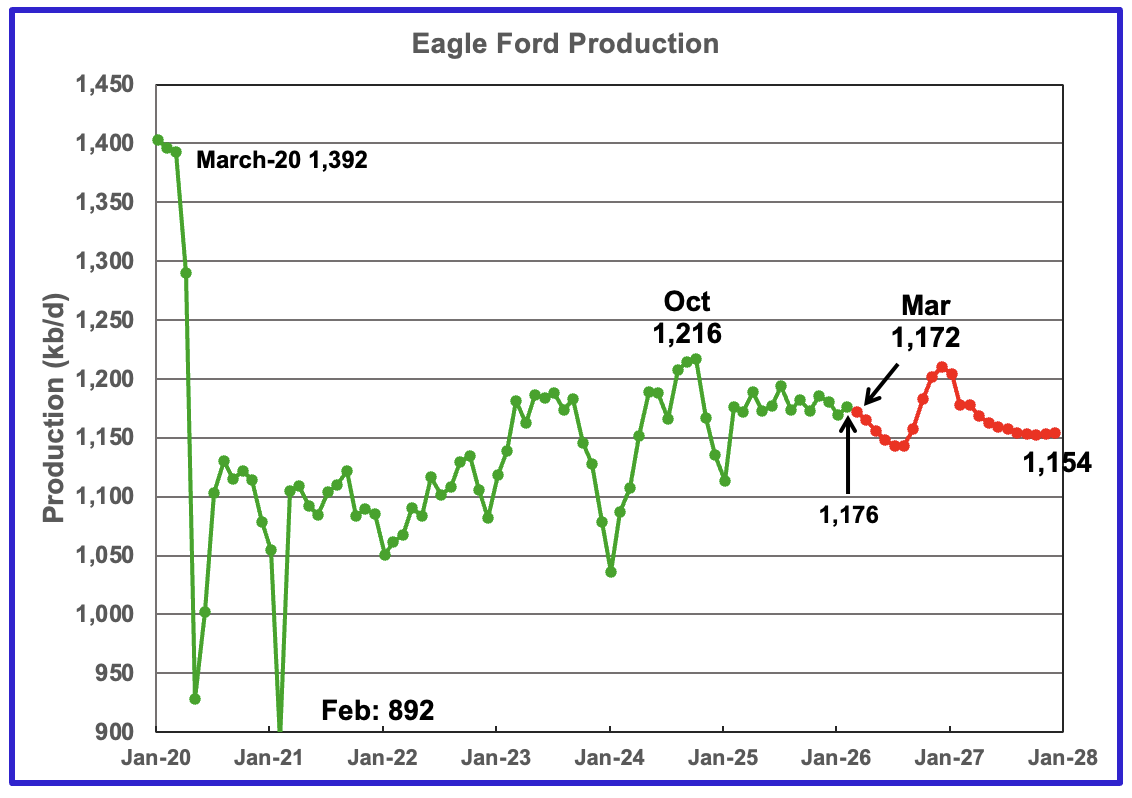
February’s output in the Eagle Ford basin increased by 7 kb/d to 1,176 kb/d. March’s 2026 production is forecast to drop by 4 kb/d to 1,172 kb/d.
Output in December 2027 expected to be 1,154 kb/d down 18 kb/d from March 2026.
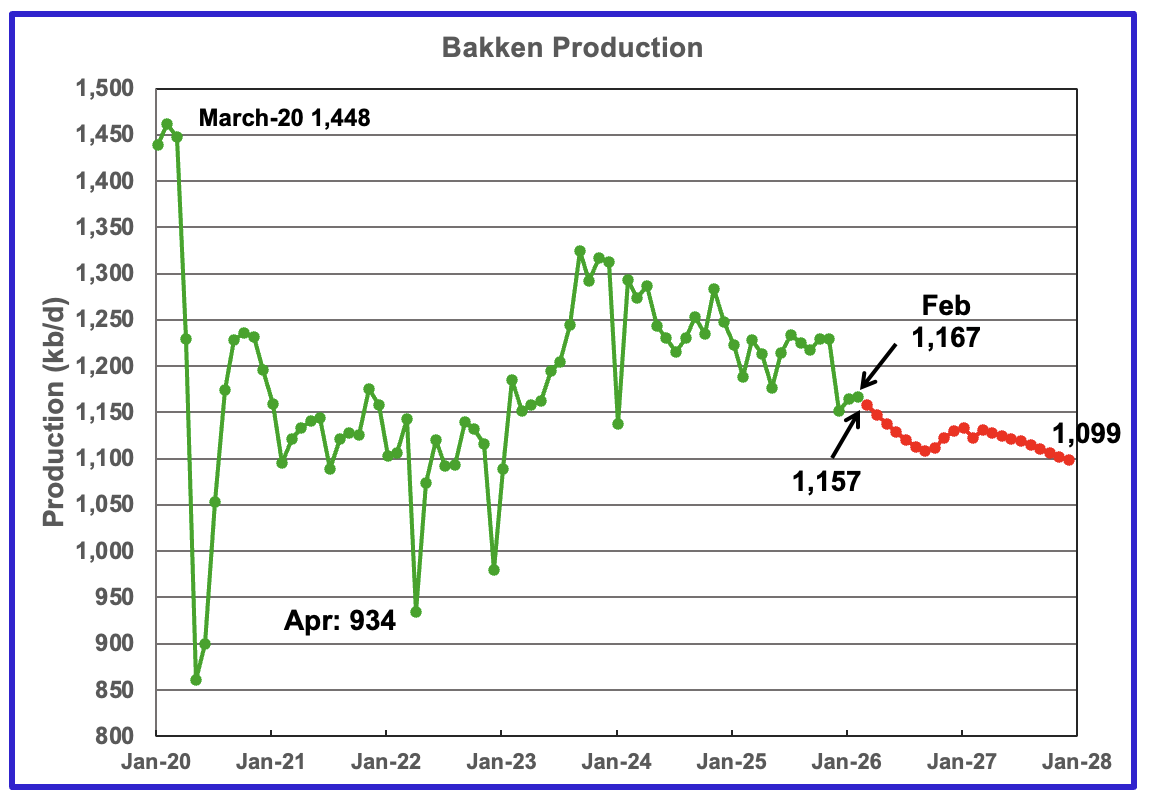
The DPR/STEO reported the Bakken’s February’s output rose by 2 kb/d to 1,167 kb/d. March 2026 production is expected to decrease by 10 kb/d to 1,157 kb/d. The STEO/DPR projection, red markers, shows output dropping to 1,099 kb/d in December 2027.
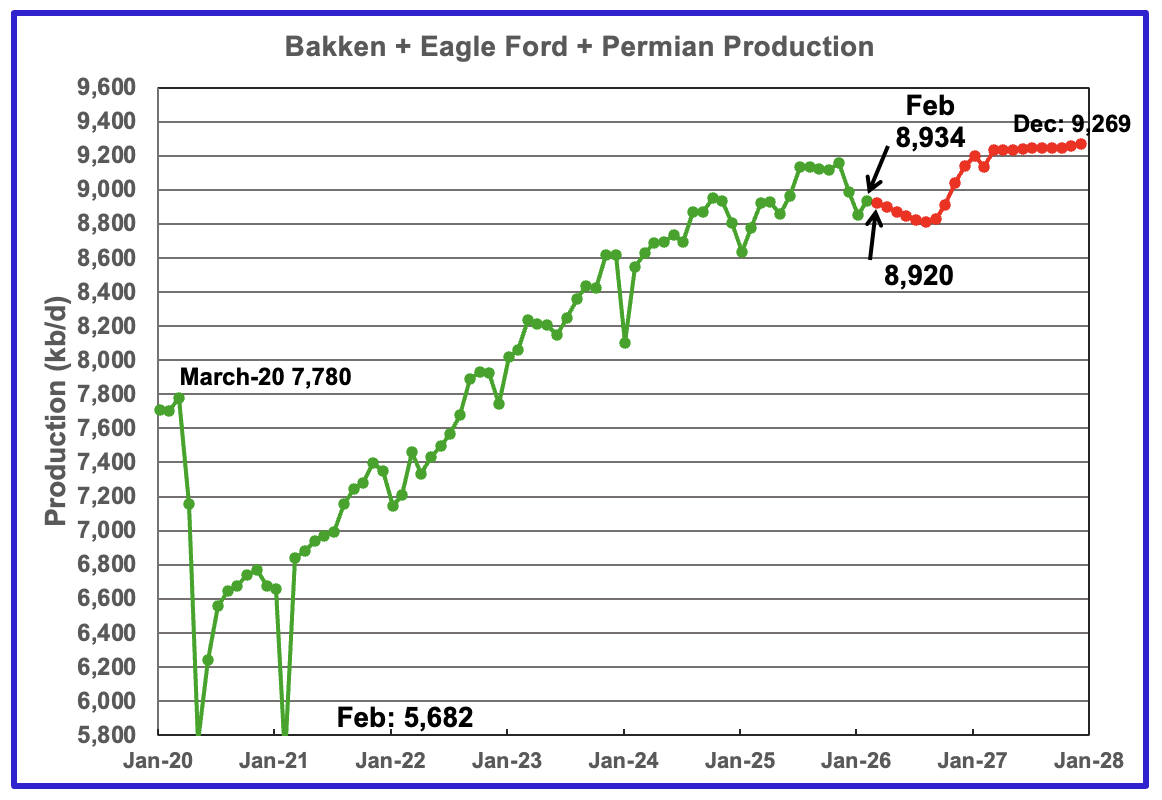
This chart plots the combined production from the three main LTO regions. February output increased by 79 kb/d to 8,934 kb/d. March is expected to drop to 8,920 kb/d. Production for December 2027 is forecast to be 9,269 kb/d.
DUCs and Drilled Wells
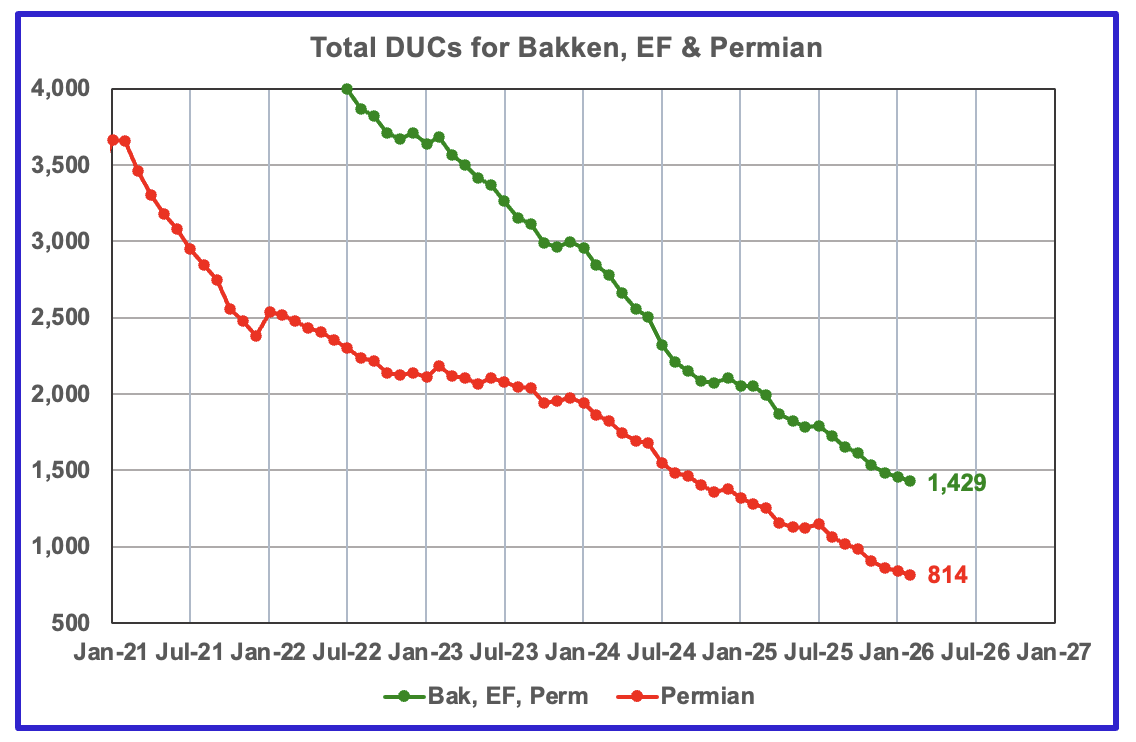
The number of DUCs available for completion in the Permian and the three major DPR regions continues its dropping trend. February’s DUC count for the three basins dropped by 29 to 1,429. In the Permian the DUC count dropped by 25 to 814.
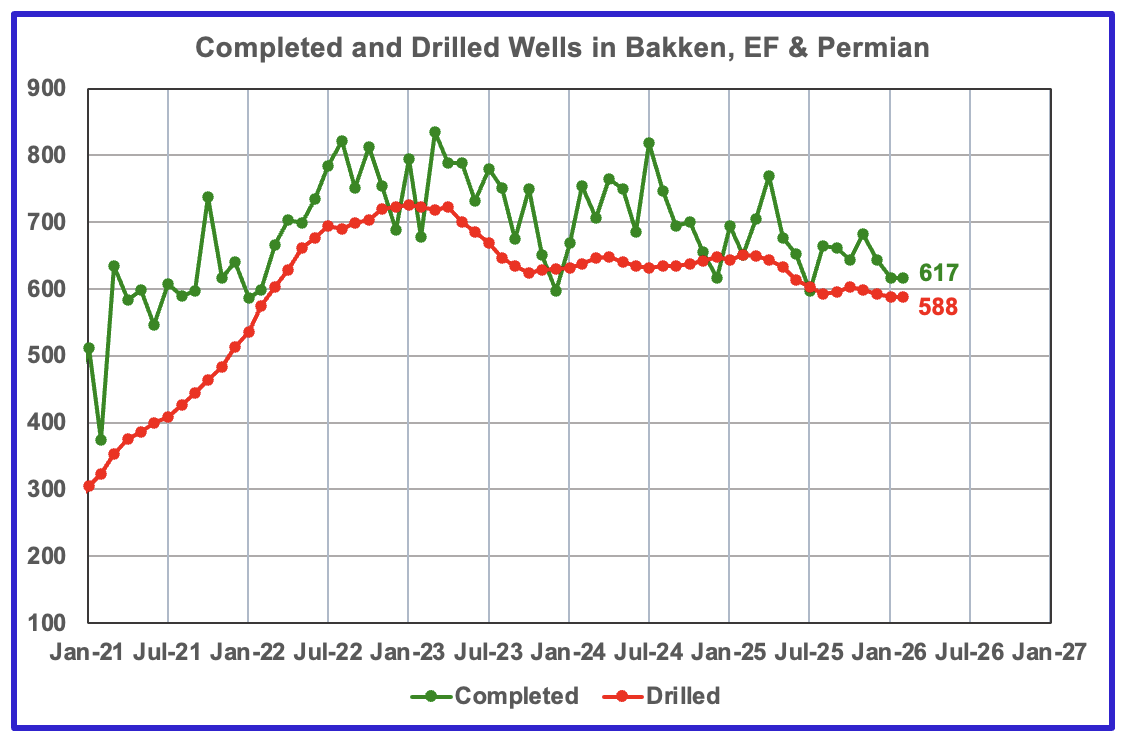
In the three primary regions, a total of 617 wells were completed in February, 1 more than in January. There were 588 wells drilled in February 2026, down 15 from October 2025 when 603 were drilled.
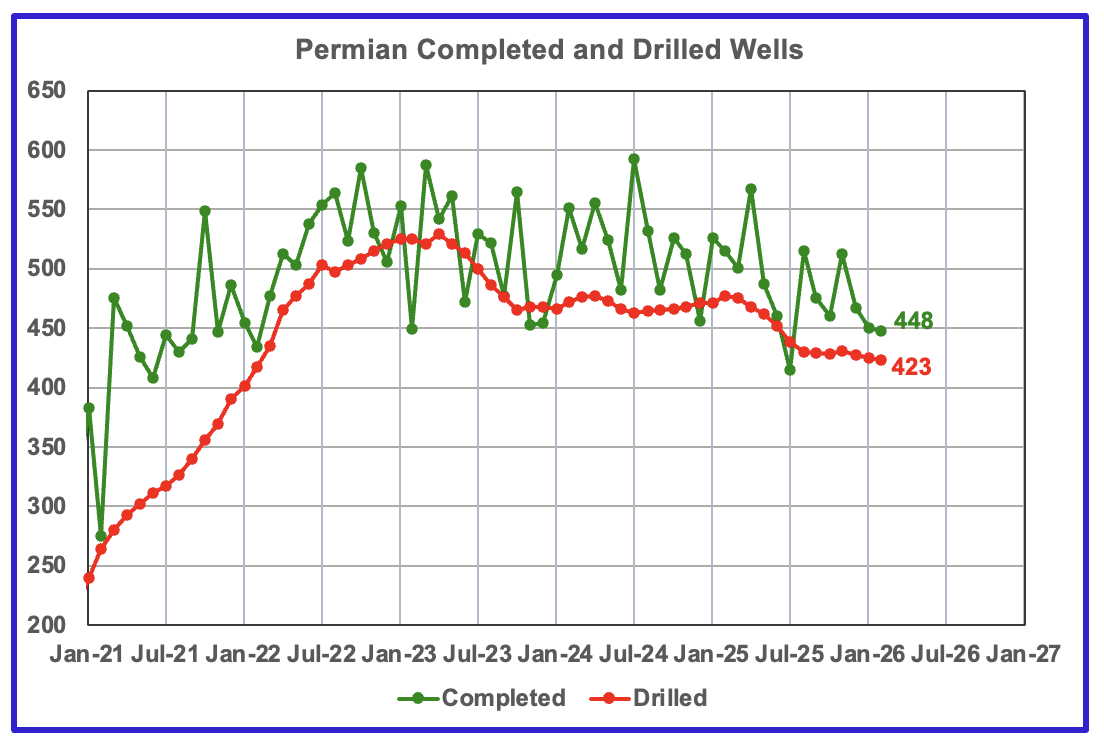
In the Permian, 448 wells were completed in February and 423 were drilled, both down 2 from January.
Leave a Reply to Ralph Cancel reply