By Ovi
All of the Crude plus Condensate (C + C) production data for the US state charts comes from the EIAʼs Petroleum Supply monthly PSM which provides updated production information up to December 2025.
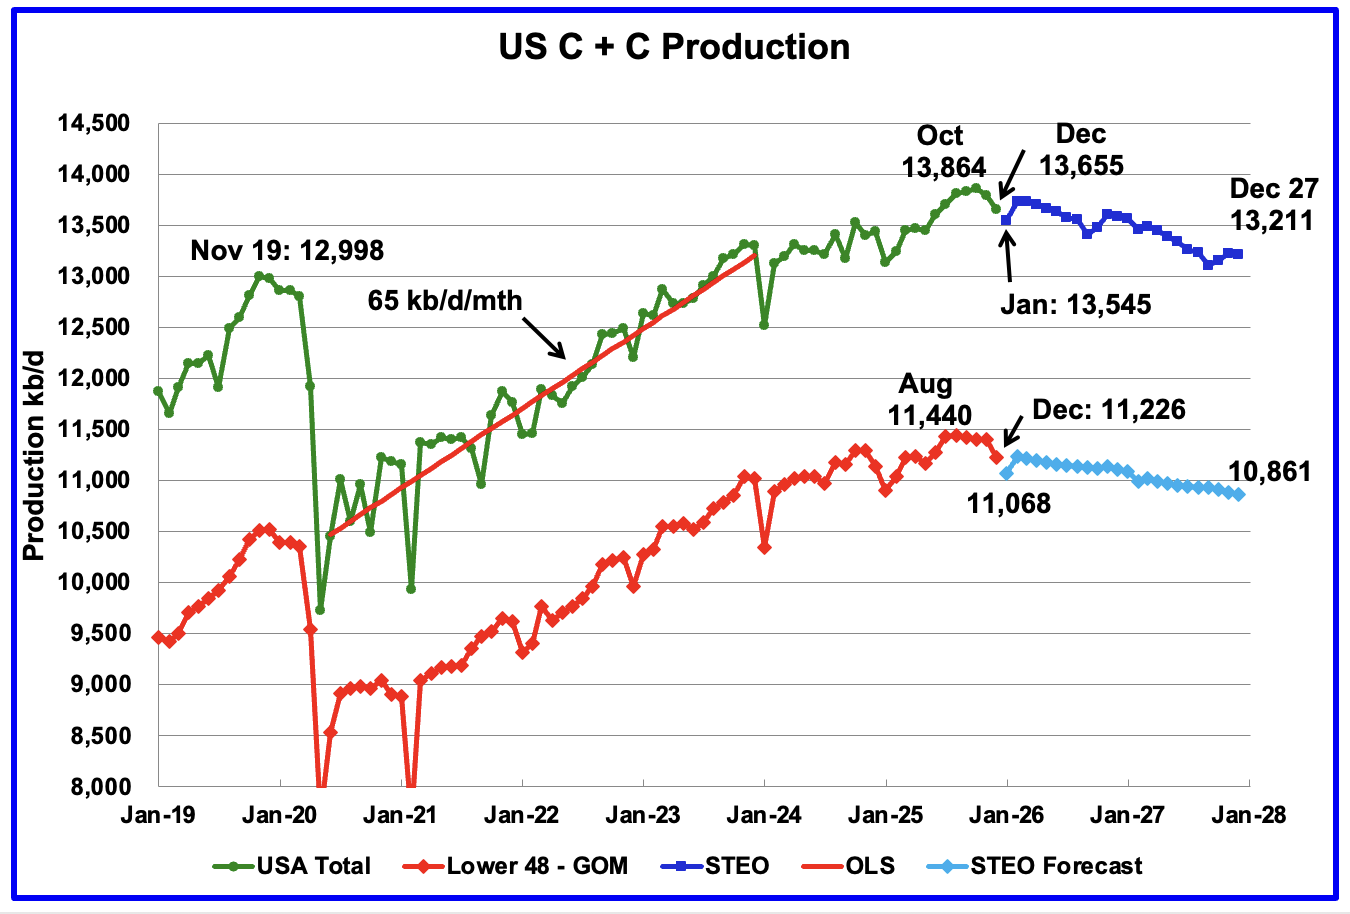
U.S. December oil production decreased by 133 kb/d to 13,655 kb/d and is down by 209 kb/d from October.. The largest decreases came from the Big 3, TX, NM and ND. January’s production is expected to drop by 110 kb/d to 13,545 kb/d according to the January STEO. Peak US oil production occurred in October 2025 at 13,864 kb/d.
According to this Article: U.S. would lose an average of 340 kb/d in January 2026 due to the cold weather.
“Most of the remaining outages were in the Permian Basin in Texas and New Mexico, which accounts for around half of U.S. crude production, according to Energy Aspects analyst Jesse Jones, who said production there was recovering quickly.”
The dark blue graph, taken from the January 2025 STEO, is the U.S. oil production forecast from January 2026 to December 2027. Output for December 2027 is expected to drop to 13,211 kb/d. From December 2025 to December 2027 U.S. oil production is expected to drop by 444 kb/d.
Note the almost flat production in the Onshore L48 from July 2025 to November 2025, 11,436 kb/d to 11,407 kb/d, respectively, red/light blue graph.
Last month I wrote: “US oil production will peak between October 2025 and December 2025. October has a chance. Onshore L48 almost guaranteed to have peaked in August.” At this point October and August are the two peaks.
The light blue graph is the STEO’s forecast for the Onshore L48 output to December 2027. From December 2025 to December 2027 production is expected to decrease by 365 kb/d to 10,861 kb/d.
U.S. Oil Production Ranked by State
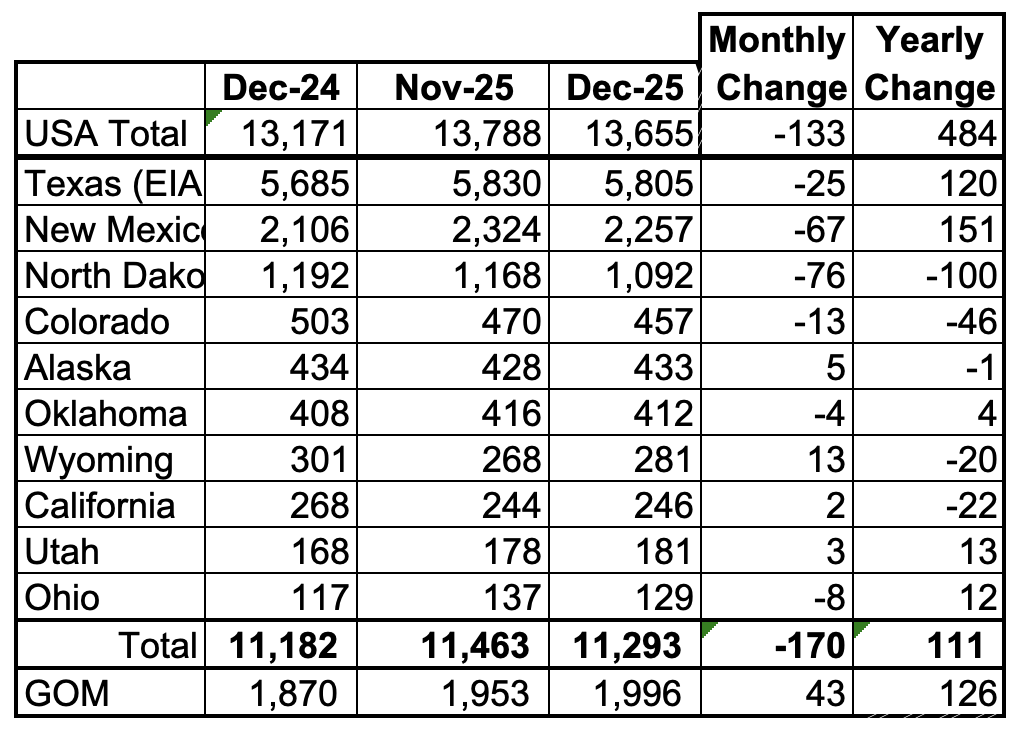
Listed above are the 10 US states with the largest oil production along with production from the Gulf of Mexico.
These 10 states accounted for 82.7% of all U.S. oil production out of a total production of 13,655 kb/d in December 2025. On a MoM basis, December oil production in these 10 states dropped by 170 kb/d. On a YoY basis, US production increased by 111 kb/d with the largest contributor being New Mexico and the largest decliner being North Dakota.
State Oil Production Charts
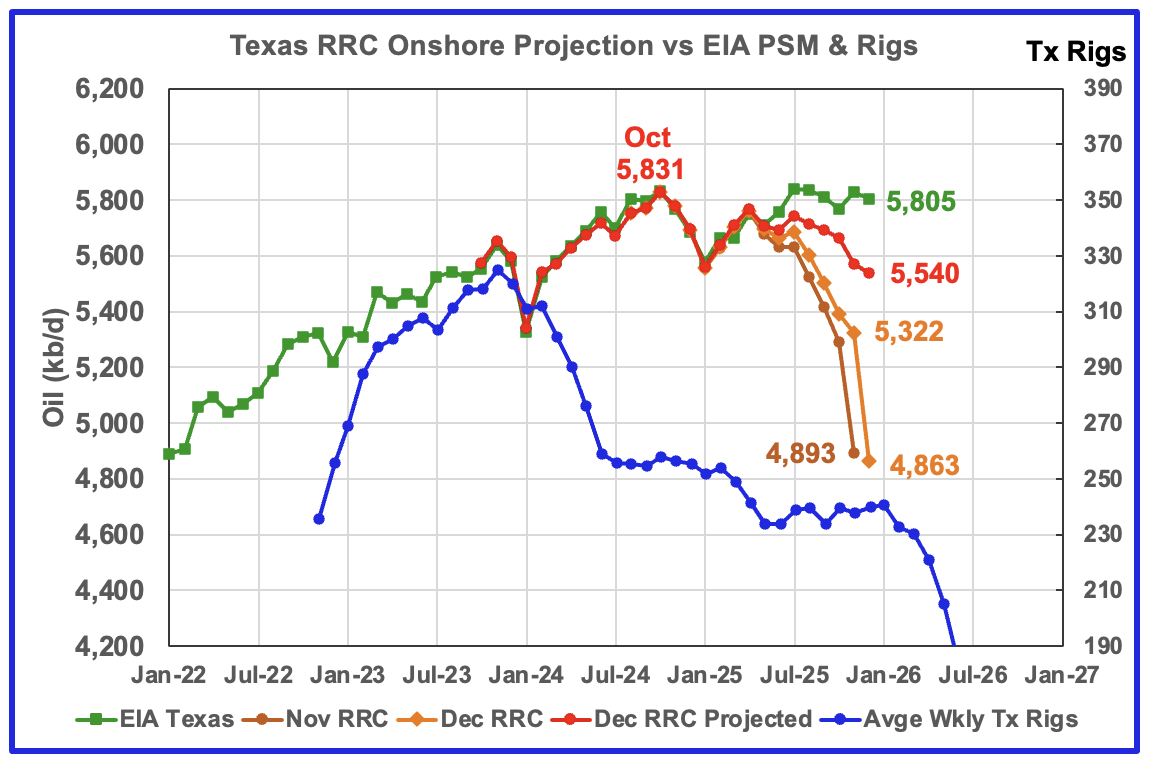
Texas’ December oil production decreased by 25 kb/d to 5,805 kb/d according to the EIA.
The Texas’ RRC initial production for December dropped by 459 kb/d from November to 4,863 kb/d. The projection added 677 kb/d to raise December’s projected production to 5,540 kb/d. It is 265 kb/d lower than the EIA’s estimate. It is lower because of the smaller monthly increments than normal from August to October, compare brown vs orange graphs. However both the EIA and the projection are showing declining production.
The red graph is a production projection using the November and December Texas RRC data.
The blue graph shows the average number of weekly rigs reported for each month shifted forward by 10 months. So the 276 rigs operating in July 2023 have been shifted forward to May 2024. From February 2024 to July 2024, the rig count dropped from 312 in time shifted February 2024 to 256 in July 2024. That drop of 56 rigs had no impact on production up to July 2025. August 2025 appears to be the first month when the impact of the start of a flat rig count is resulting in essentially flat production.
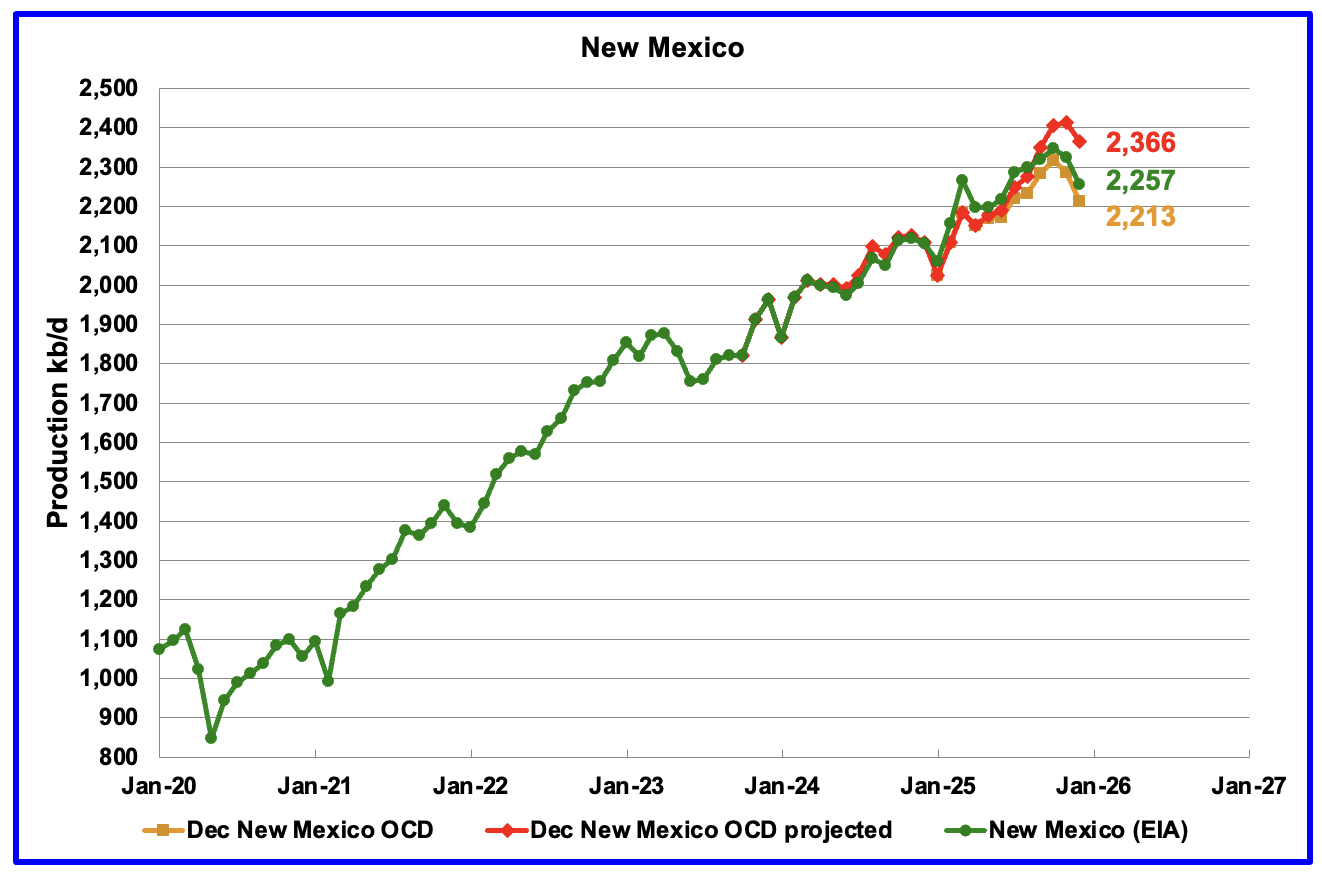
According to the EIA, New Mexico’s December production dropped by 67 kb/d to 2,257 kb/d. YoY production rose by 151 kb/d, the biggest contributor to overall YoY rising US production.
The red graph shows the projected output up to December and is calculated using November and December NM OCD data. December’s projected production decreased by 48 kb/d from November to 2,366 kb/d and is 109 kb/d greater than the EIA’s reported production. While the numbers are different, the trend is the same. The large difference is due to an atypical last minute update to the OCD’s site. I think the projection is too optimistic by 75 kb/d to 100 kb/d.
The largest contributor to the 51 kb/d NM decrease came from Lea County which dropped 53 kb/d. See Permian section further down.
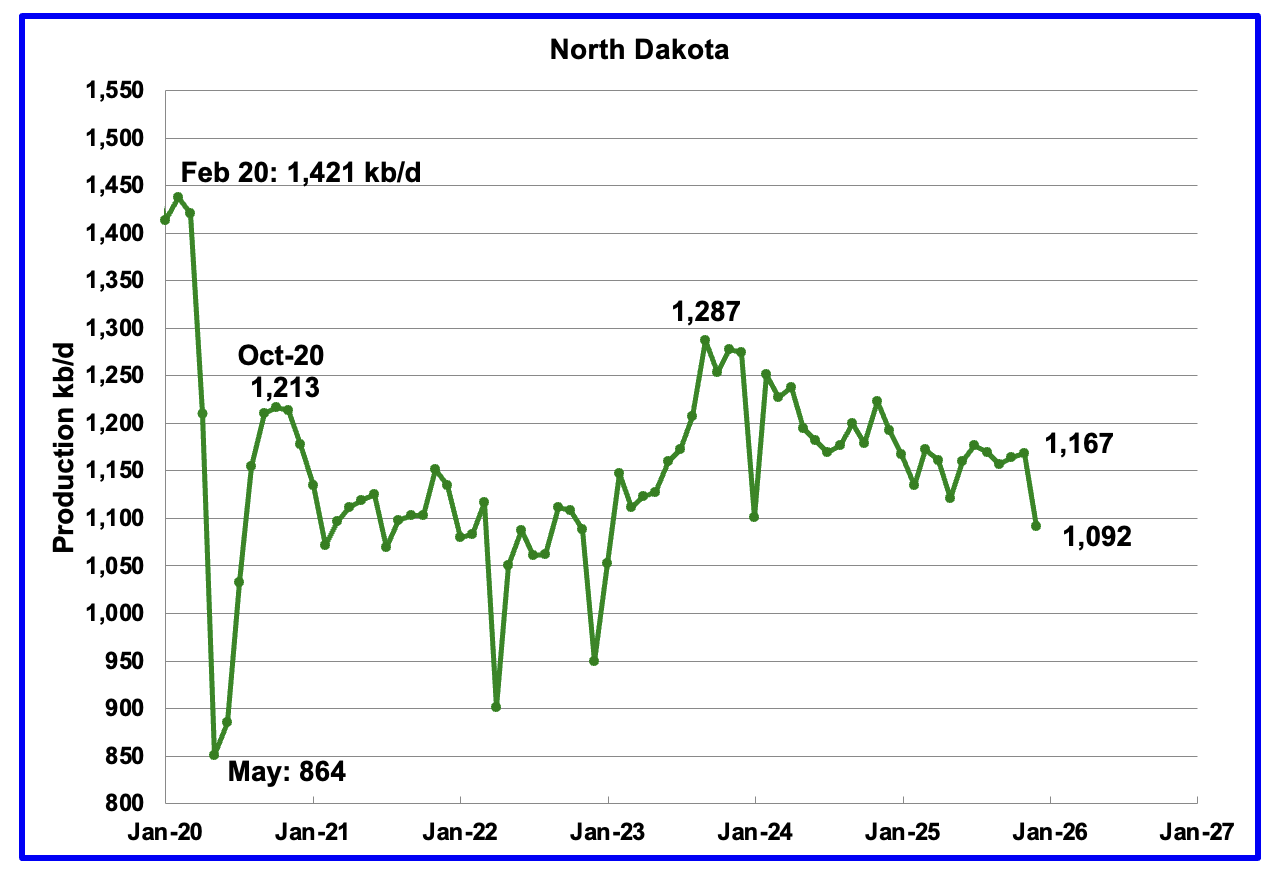
Production in North Dakota dropped by 76 kb/d in December to 1,092 kb/d.
The North Dakota Department of Mineral resources reported December production also decreased by 76 kb/d to 1,122 kb/d, which is 30 kb/d higher than the EIA estimate.
According to this Article, lower prices could mean lower oil production in North Dakota.
“The President claimed record U.S. oil production during his State of the Union address Tuesday night. But, North Dakota’s Bakken region saw a 6.38% production decline from November to December.
Despite Trump’s ‘drill, baby, drill’ mandate, industry leaders expect flat production through 2026 due to low global oil prices.
“The recent discussion I’ve had with operators have all indicated flat production. I’m sorry, not all, most operators have indicated flat production profiles,” says Nathan Anderson, the director of North Dakota Department of Mineral Resources.
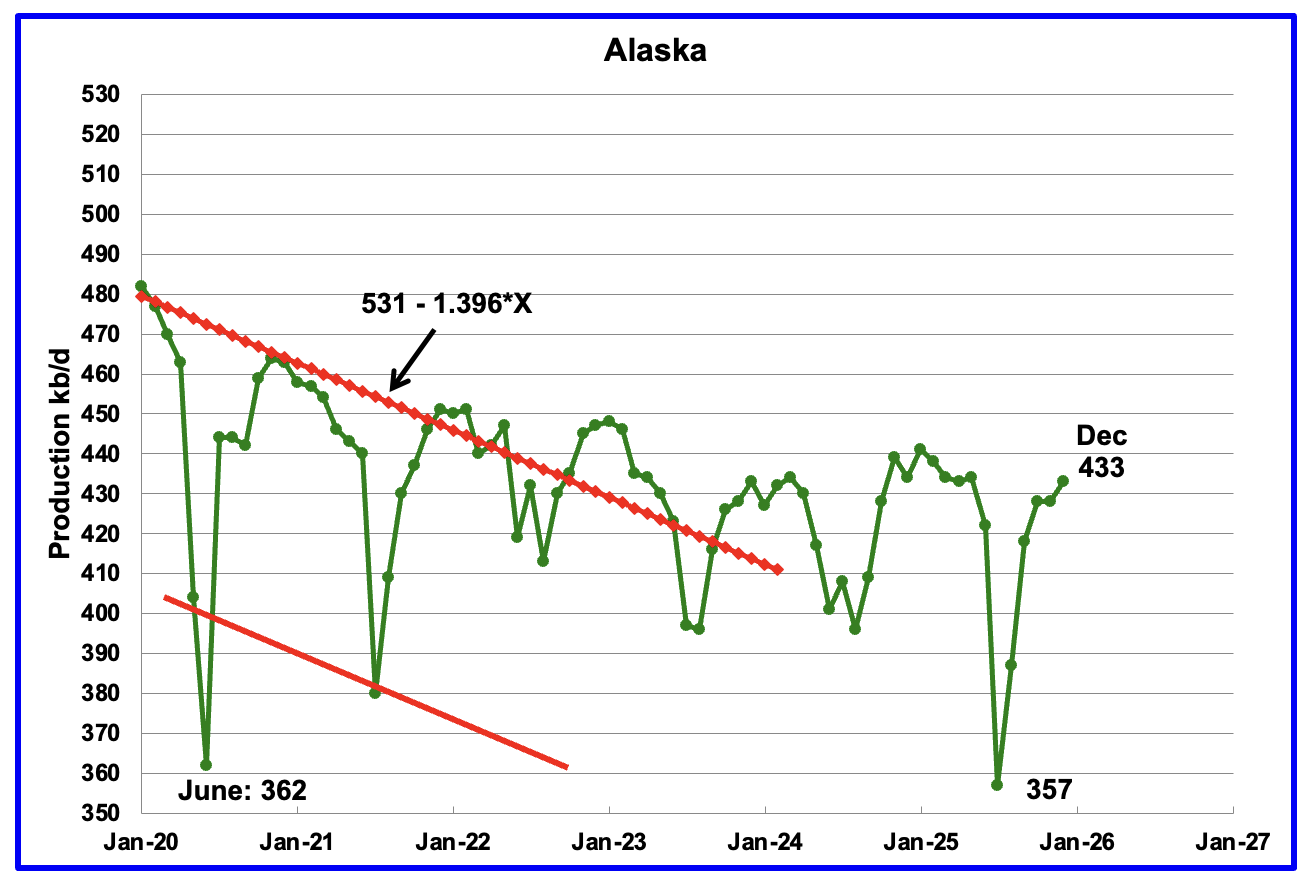
Alaskaʼs December output rose by 5 kb/d to 433 kb/d while YoY production decreased by 1 kb/d. The EIA’s weekly reports indicated that December production would rise and would average close to 435 kb/d.
Alaska has recently brought new fields online to consistently have flat YoY and monthly production gains which have broken away from the earlier dropping production red trend lines. New production is expected to come online from the Picca field in early 2026.
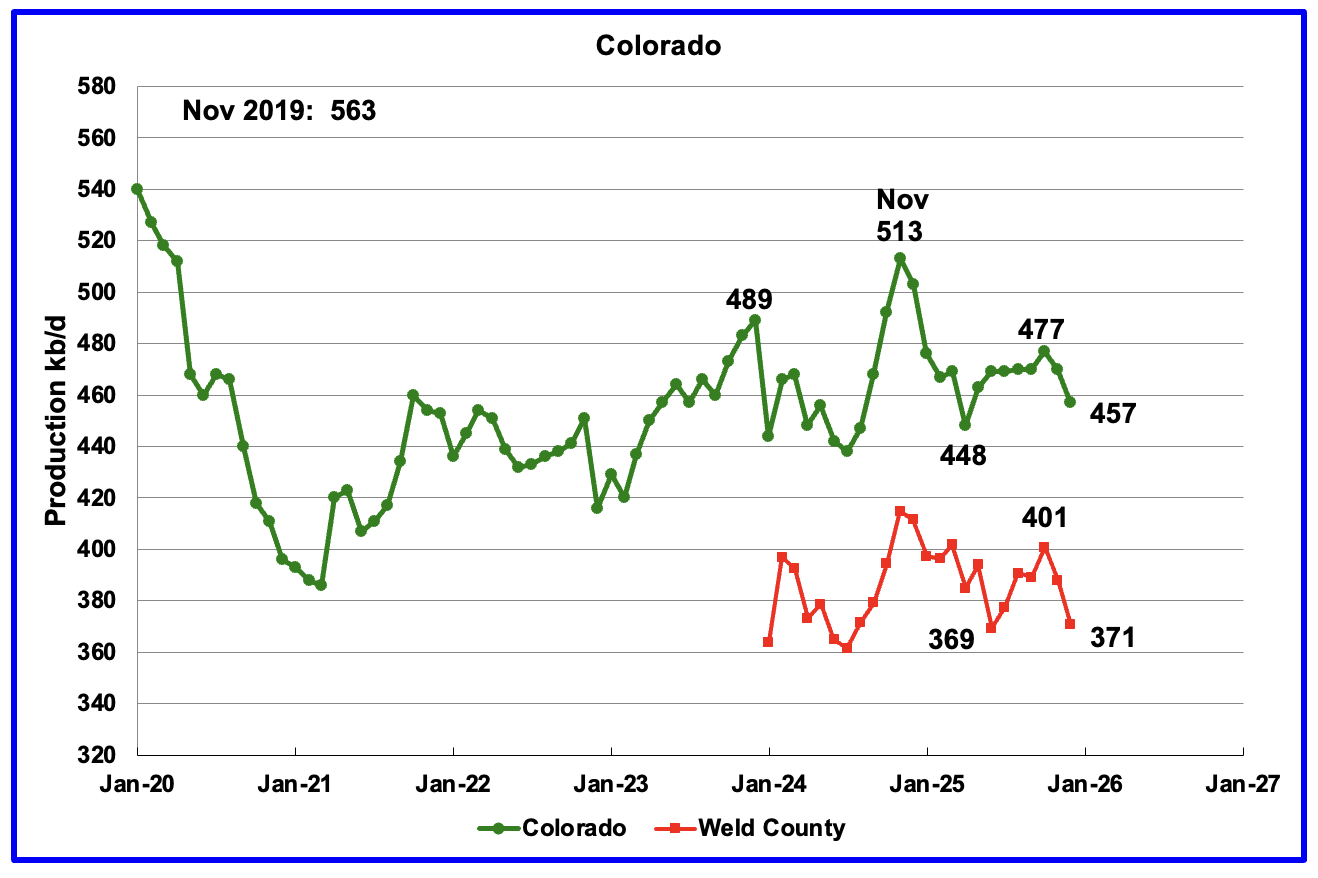
Coloradoʼs December oil production dropped by 13 kb/d to 457 kb/d.
The biggest oil producing county in Colorado is Weld County and its production has been added to the chart. The two graphs have been almost parallel over the last five months. Weld’s production dropped by 17 kb/d in December to 371 kb/d.
Colorado began 2025 with 6 rigs in January and February and peaked at 11 in October. At the end of February 9 oil rigs were operational.
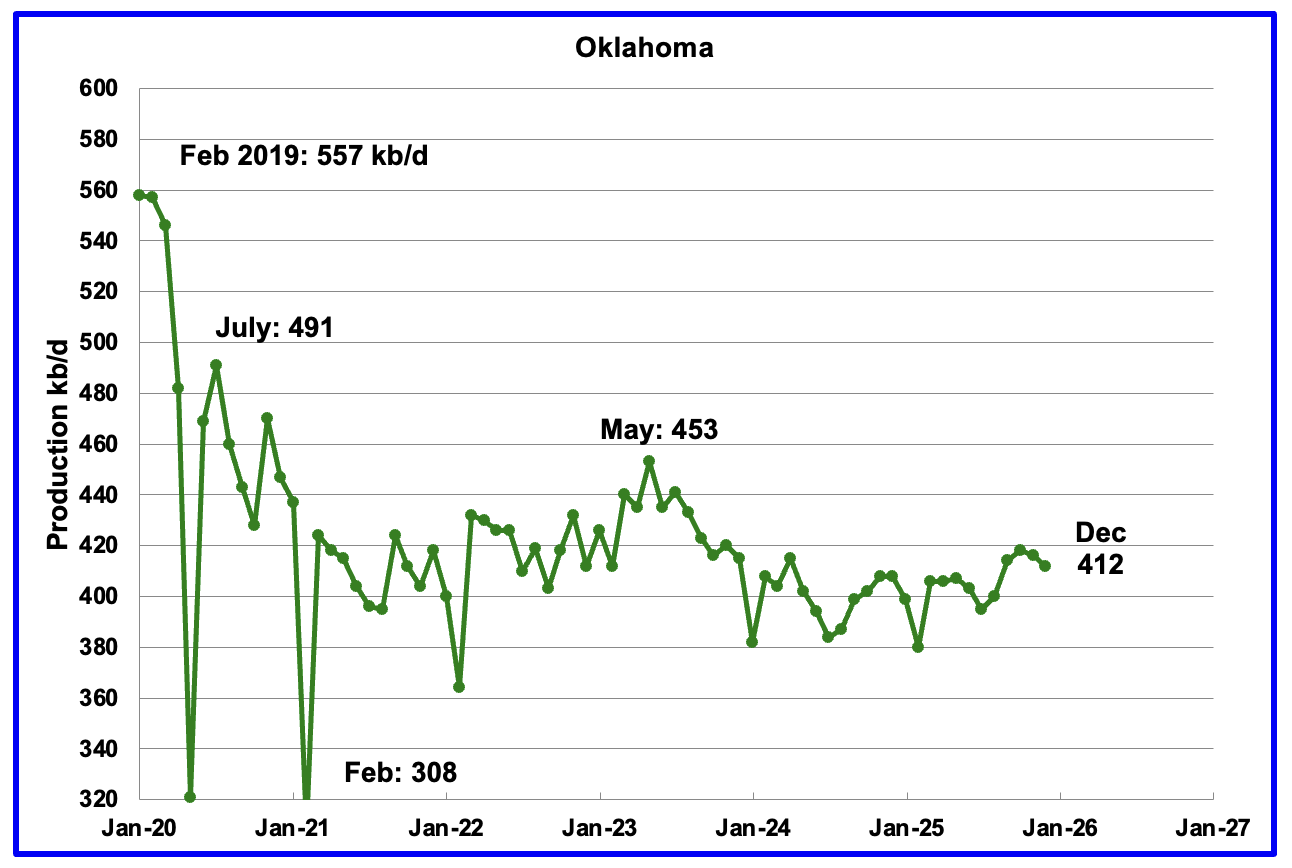
Oklahoma’s output in December dropped to 412 kb/d. Production remains below the post pandemic July 2020 high of 491 kb/d and is down by 41 kb/d since May 2023. Output entered a slow declining phase in June 2023 and now appears to be range bound around 400 kb/d ± 20 kb/d.
Oklahoma had 51 operational rigs in May 2025 which slowly dropped to 40 rigs in January 2026. The rig count has been fairly steady around 40 since July 2025. The steady rig count since July may be showing up in the steady oil production around 400 kb/d.
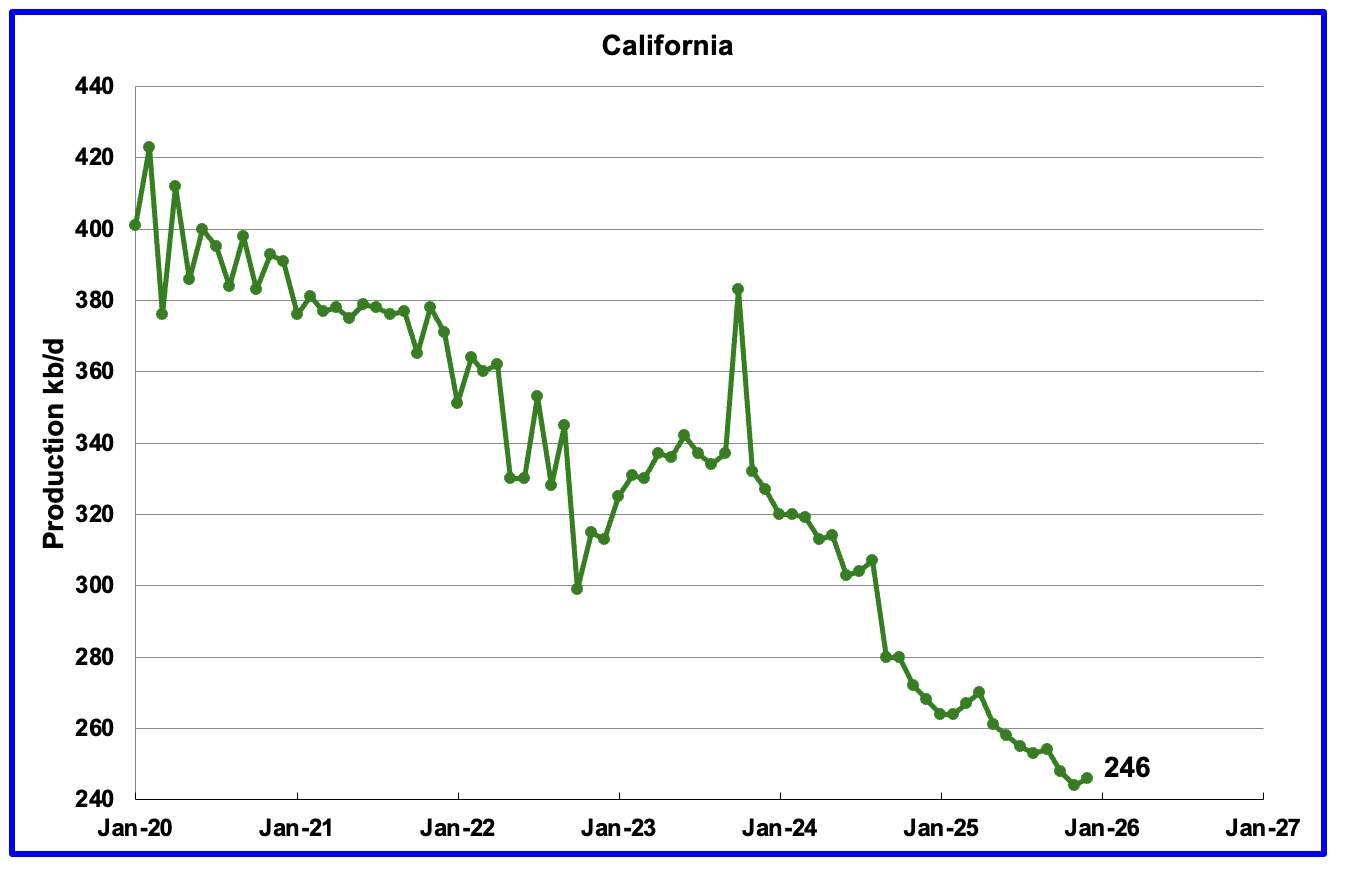
California’s overall declining production trend continues. December’s production rose by 2 kb/d to 246 kb/d. YoY production dropped by 22 kb/d.
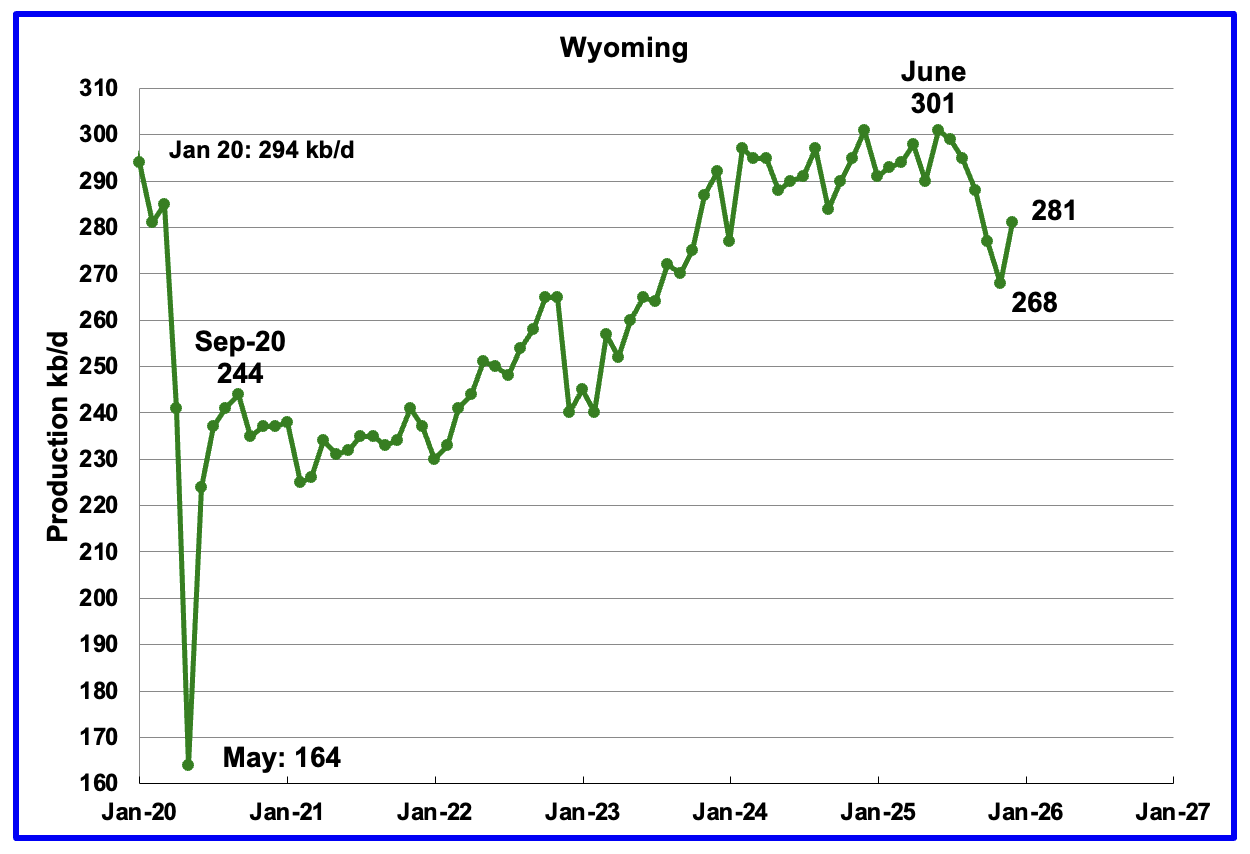
Wyoming’s oil production reached a post pandemic high in December 2024 and again in June 2025 of 301 kb/d. Production has dropped in each of the last 5 months before rebounding in December. December’s production rose by 11 kb/d to 281 kb/d.
Wyoming added 1 rig in February for a total of 14.
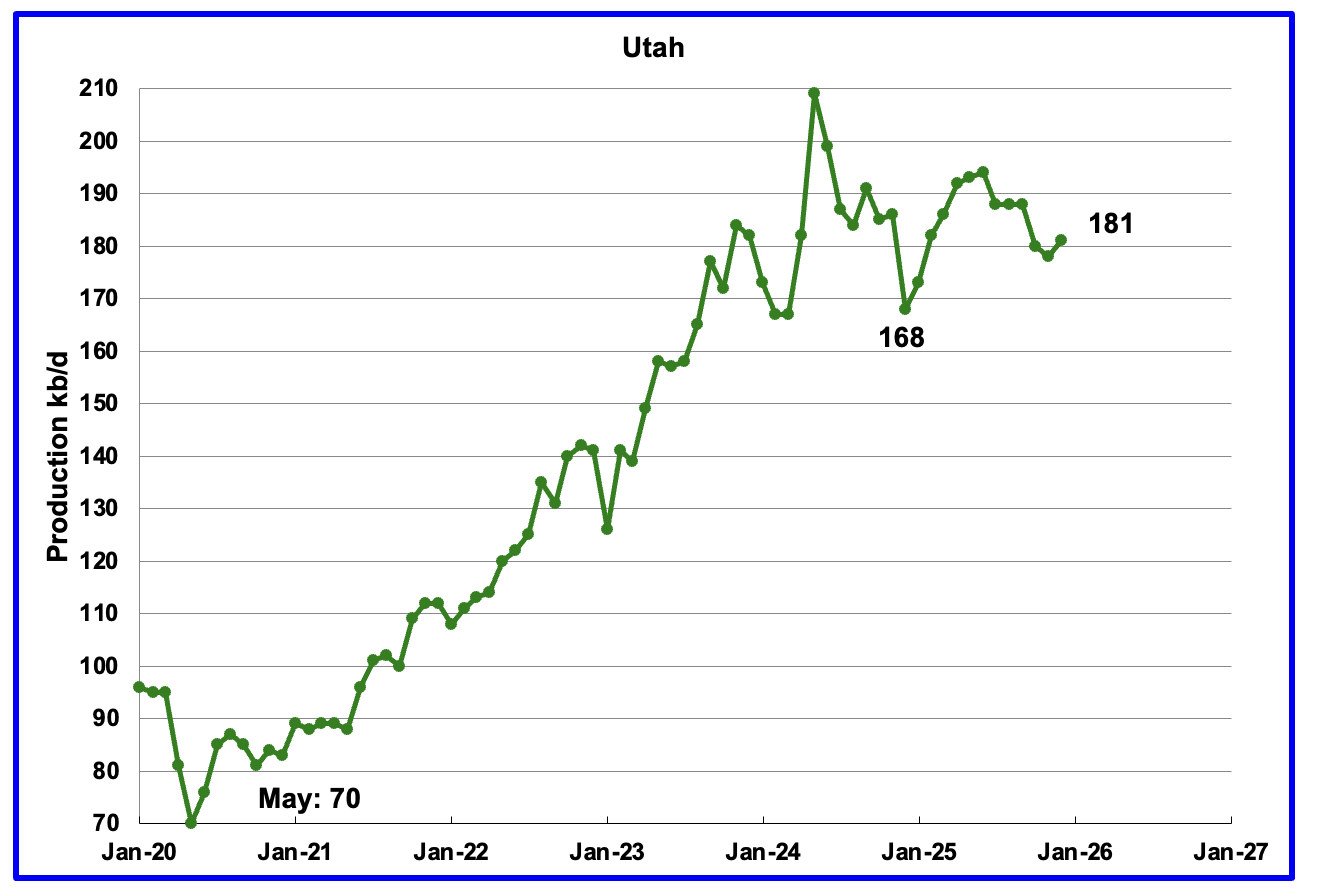
December’s production rose by 3 kb/d to 181 kb/d. Utah had 8 rigs operating from October 2024 through May 2025 but dropped to 6 in early June 2025. At the end of February 2026 11 rigs were operational.
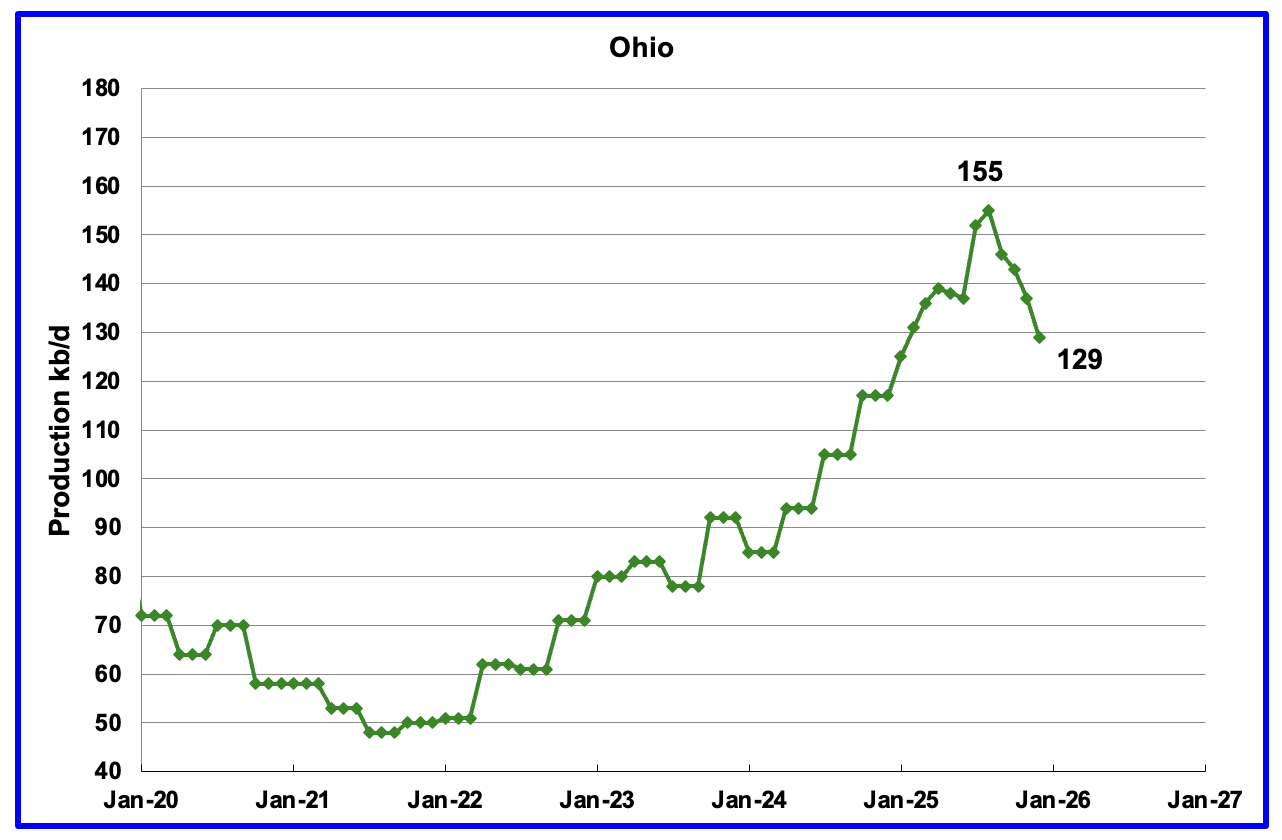
Ohio’s December oil production decreased by 8 kb/d to 129 kb/d and was 26 kb/d lower than the August peak of 155 kb/d. In February Ohio had 11 NG rigs, down 1 from January and 1 oil rig operating.
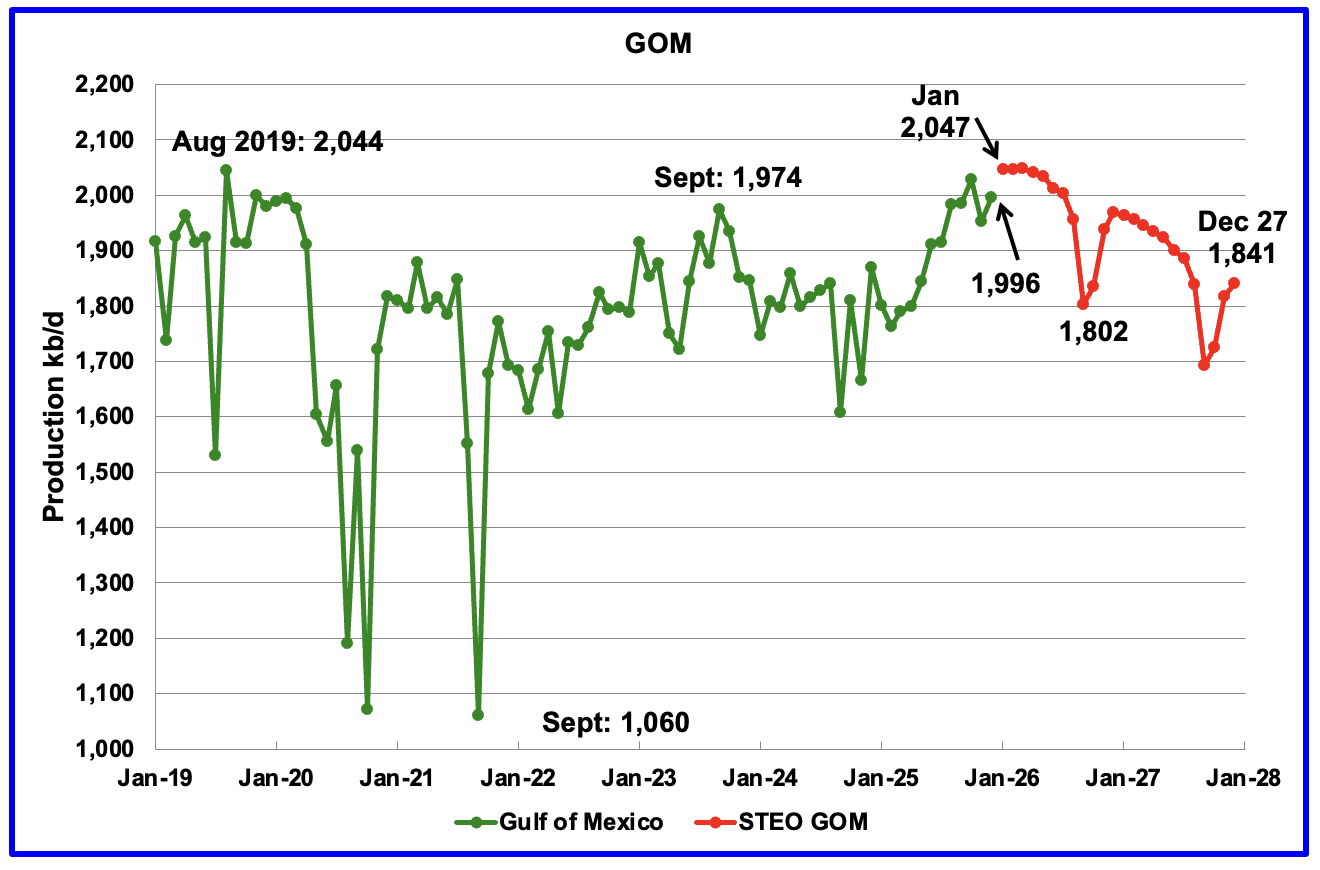
GOM production rose by 43 kb/d in December to 1,996 kb/d.
The January 2026 STEO GOM projection has been added to this chart. It projects production in December 2027 will be 155 kb/d lower than December 2025 at 1,841 kb/d.
While this Article, says three new projects have helped boost US Gulf of Mexico output since mid-2025 and will continue to add to supply, the STEO is indicating that the GOM will peak in early 2026 at close to 2,050.
A Different Perspective on US Oil Production
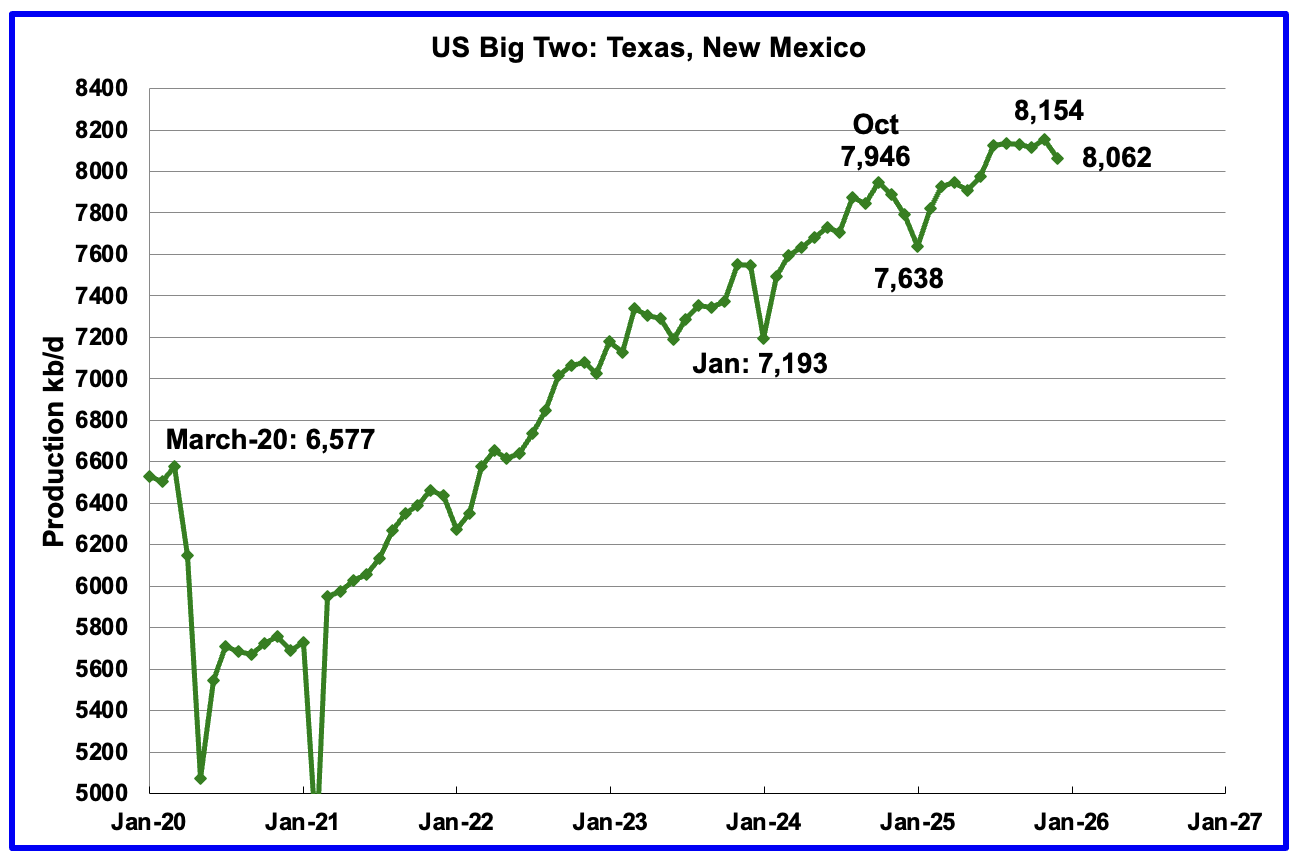
Combined oil output for the Big Two states Texas and New Mexico.
December’s production in the Big Two states decreased by a combined 92 kb/d to 8,062 kb/d. Clearly these two states were the drivers of US oil production growth up to July 2025. The essentially flat production starting in August 2025 was the first sign that production in these two states was close to peaking? The next few months will tell the tale
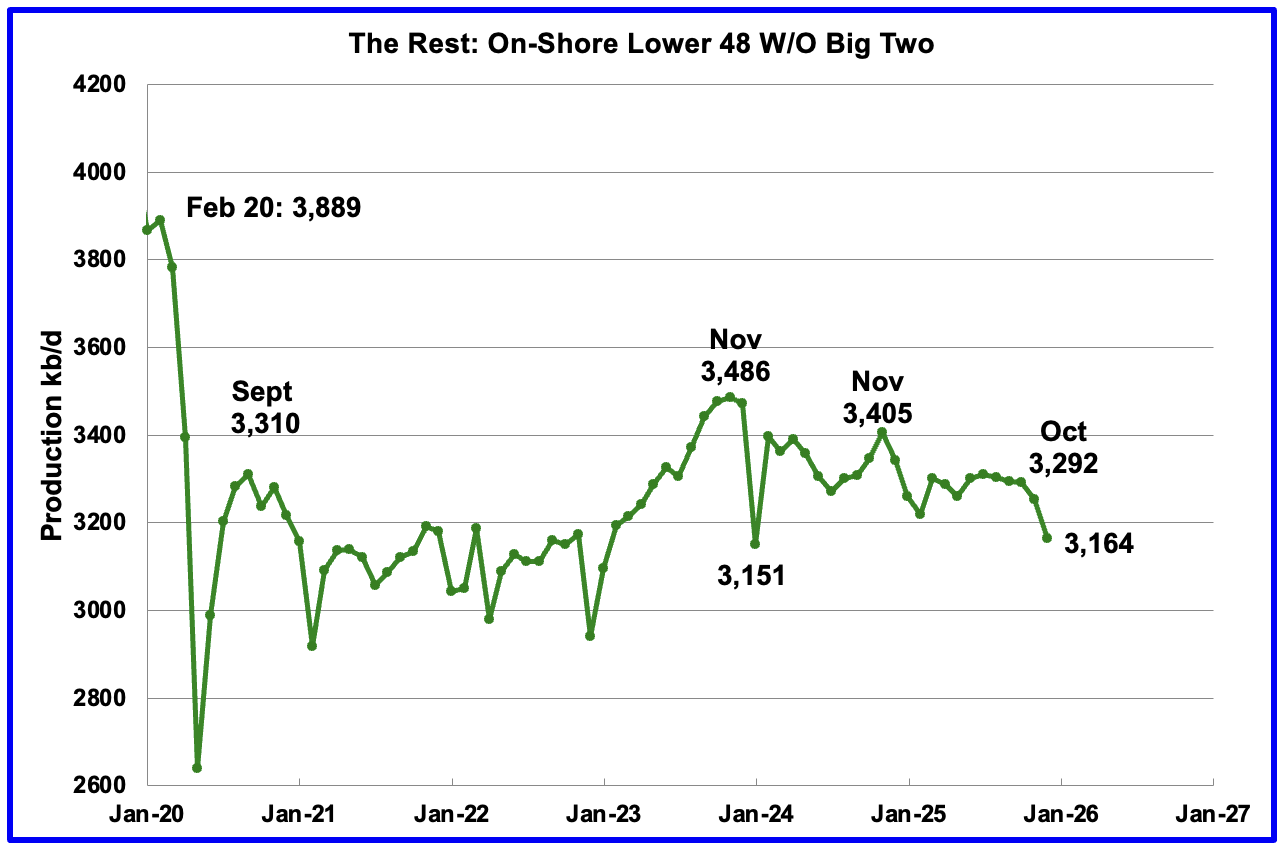
Oil Production by The Rest
December’s oil production by The Rest dropped by 89 kb/d to 3,164 kb/d and is 322 kb/d lower than November 2023.
Permian Basin Report for Main Counties and a District
This special monthly Permian section was added to the US report because of a range of views on whether Permian production will continue to grow or will peak over the next year or two. The issue was brought into focus many months back by two Goehring and Rozencwajg Reports and Report2 which indicated that a few of the biggest Permian oil producing counties were close to peaking or past peak.
A more recent report was issued and can be reviewed Here. In this report they state:
“For years now, we have outlined with what we hoped was clarity, and what we now submit was prescience, the view that U.S. shale oil, that great source of modern supply, could not grow forever. It would mature, crest, and begin its long descent. That moment, by our models and measures, has arrived: shale has plateaued, and 2024 appears to be its high-water mark. And yet, investor sentiment has scarcely been more downbeat.”
This section will focus on the four largest oil producing counties in the Permian, Lea, Eddy, Midland and Martin. It will track the oil and natural gas production and the associated Gas Oil Ratio (GOR) on a monthly basis. The data is taken from the state’s government agencies for Texas and New Mexico. Typically the data for the latest two or three months is not complete and is revised upward as companies submit their updated information. Note the natural gas production shown in the charts that is used to calculate the GOR is the gas coming from both the gas and oil wells.
Of particular interest will be the charts which plot oil production vs GOR for a county to see if a particular characteristic develops that indicates the field is close to entering or in the bubble point phase. While the GOR metric is best suited for characterizing individual wells, counties with closely spaced horizontal wells may display a behaviour similar to individual wells due to pressure cross talking . For further information on the bubble point and GOR, there are a few good thoughts on the intricacies of the GOR in an earlier POB comment and here. Also check this EIA topic on GOR.
New Mexico Permian
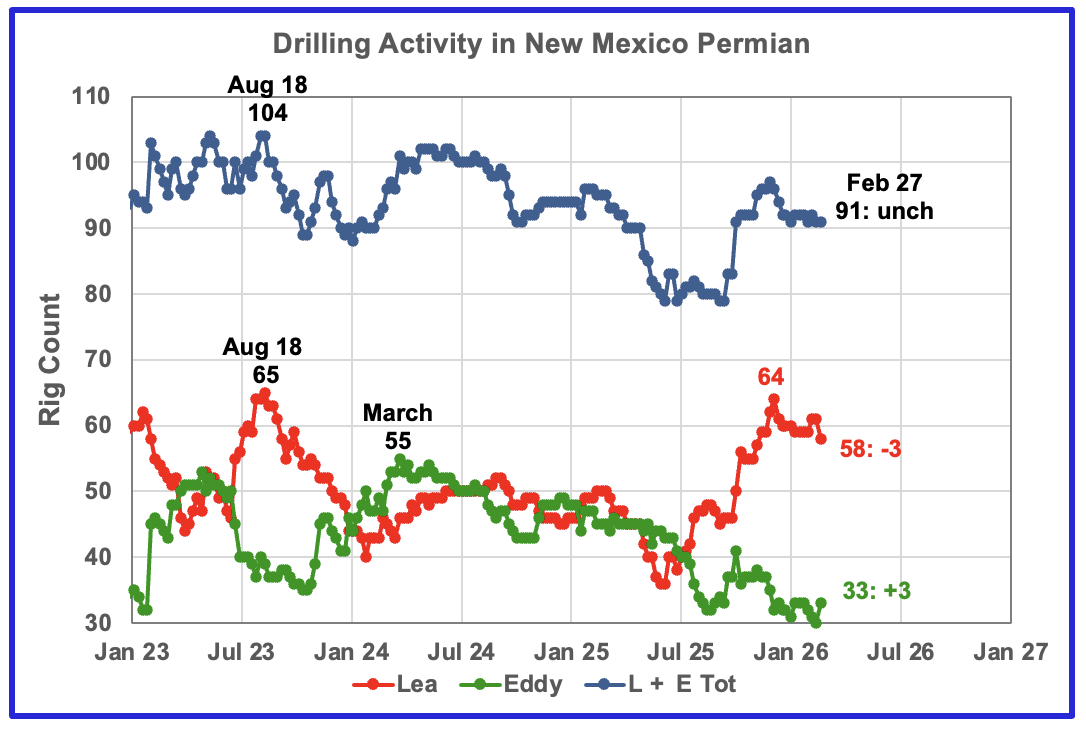
The current rig counts in Lea and Eddy counties are moving in different ways. Lea County has been dropping rigs while Eddy has started to add rigs. Over the past two months Lea County dropped 6 rigs to 58 while Eddy has held essentially steady at 33 but added 3 rigs in late February. Overall NM dropped 5 rigs to 91 from December to February. NM rigs seem to continue to move back and forth between Lea and Eddy Counties.
Oil Production in New Mexico’s Primary Permian Counties
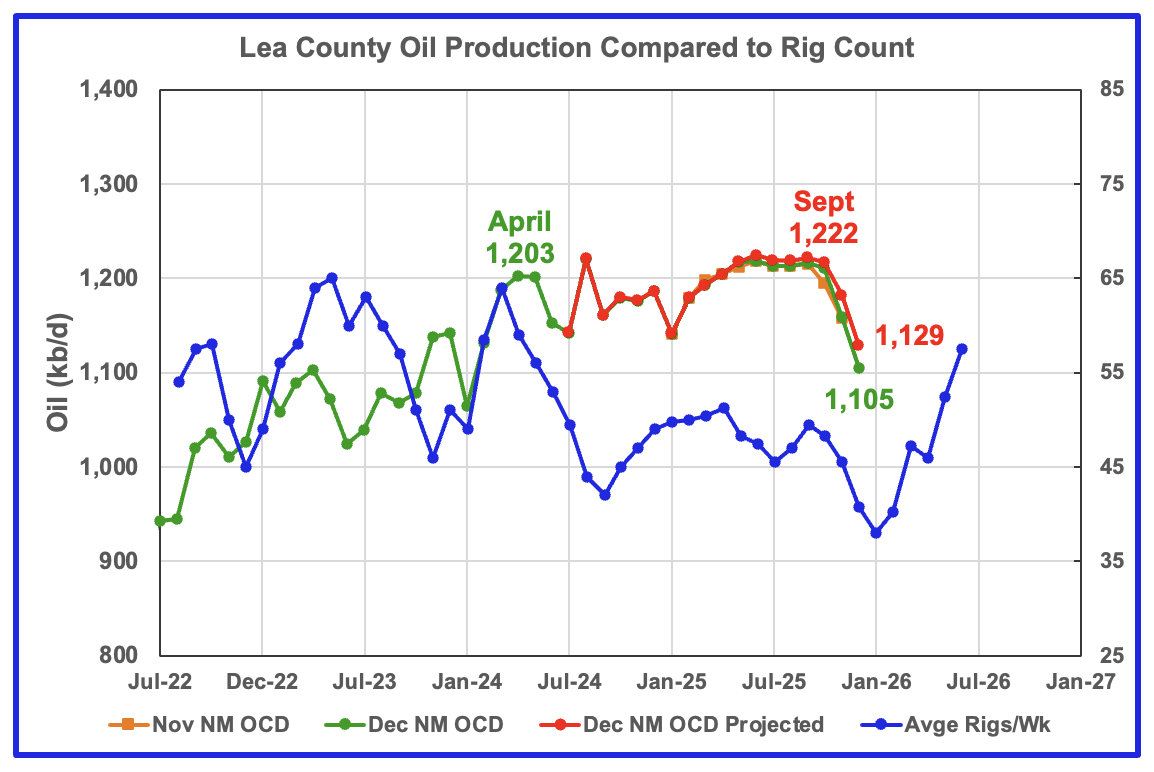
Lea County’s oil production started its plateau phase in April 2024 at 1,203 kb/d and it continued to September 2025. October, November and December have seen production drops in both the projected and NM OCD’s production. December’s projected production is down by 53 kb/d from November’s 1,182 kb/d and is down by 93 kb/d from September‘s 1,222 kb/d.
Preliminary December data from New Mexico’s Oil Conservation Division (OCD) indicates Lea County’s oil production dropped by 54 kb/d to 1,105 kb/d, green graph, and is a second indictor that production may be in decline in Lea County. The November and December production drop could be associated with the dropping rig count that starts in time shifted October 2025. This raises the question of whether the rising rig count starting in time shifted January 2026 could restore production to a new lower plateau phase. At this time it appears that Lea County has hit peak production.
The blue graph shows the average number of weekly rigs operating during a given month as taken from the weekly rig data. The rig graph has been shifted forward by 7 months. So the 64 Rigs/wk operating in August 2023 have been time shifted forward to March 2024 to show the possible correlation and time delay between rig count, completion and oil production.
Note that rig counts are being used to project production as opposed to completions because state completion data is not available. Completion data from the Drilling Productivity report below indicates that the number of completed DUCs and newly drilled wells are almost equal in the Permian basin at this time.
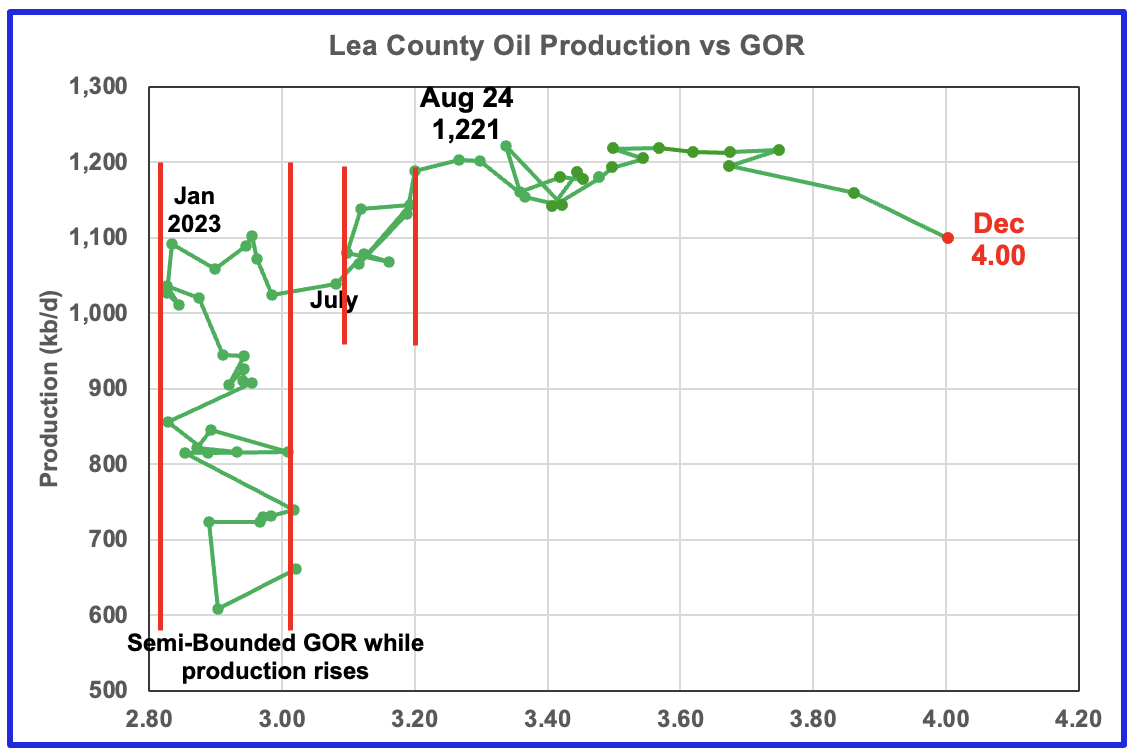
After much zigging and zagging, oil production in Lea county stabilized just below 1,100 kb/d in early 2023. Once production reached a new high in January 2023, production appeared to be on a plateau while the GOR started to increase rapidly to the right and first entered the bubble point phase in July 2023.
Since July 2023 Lea County’s production continued to increase as the GOR remained within a second semi-bounded region. This may indicate that additional production was coming from an oilier part of a layer since the GOR’s behaviour since August 2023 to March 2024 time frame appears once again to be in a second semi bounded GOR phase accompanied with rising production.
The GOR moved out of the second semi-bounded GOR region in April 2024 and production hit a new high of 1,221 kb/d in August 2024. From August 2024 to February 2025 the GOR was range bound between 3.34 and 3.48 but from March 2025 to November 2025 the GOR has risen every month, except for one, to hit new highs. December saw both a production drop to 1,101 kb/d and the GOR increase to a record 4.00.
This zigging and zagging GOR pattern within a semi-bounded GOR while oil production increases to some stable level and then moves out to a higher GOR to the right has shown up in a number of counties. See a few additional cases below. The rising GOR to new highs and dropping oil production in Lea county is an early indicator that production may be entering a declining phase.
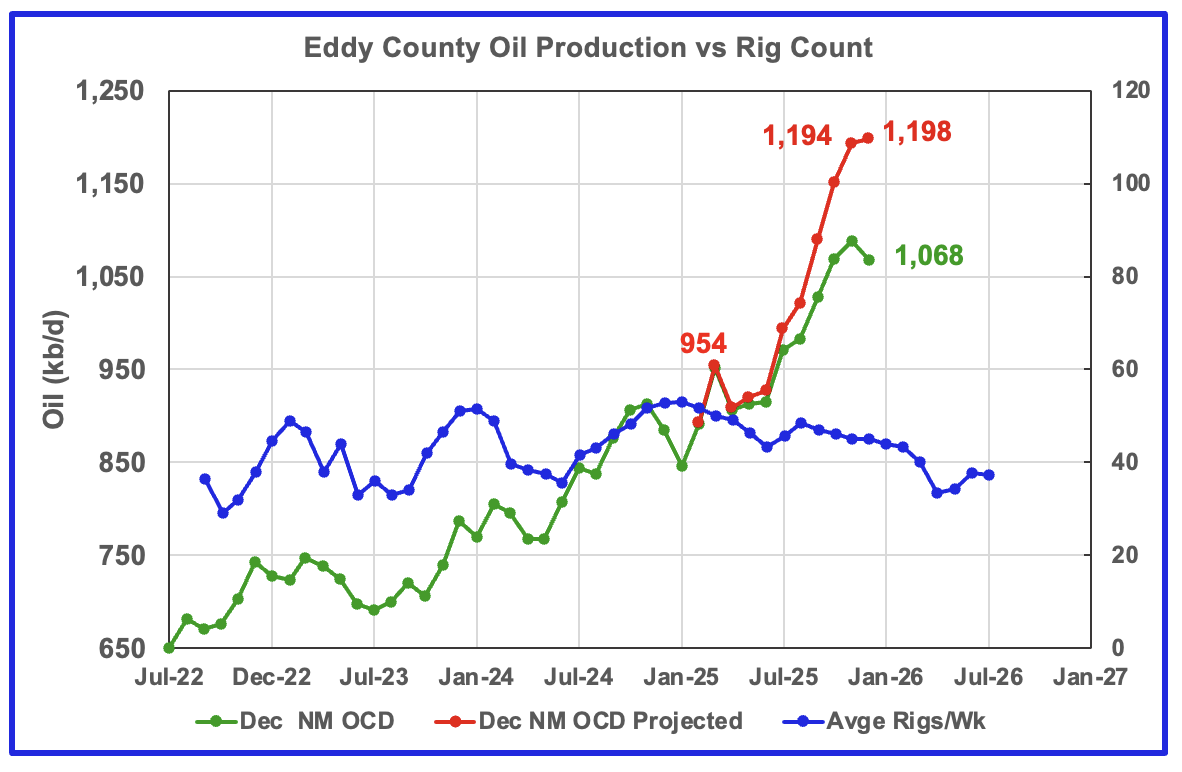
December’s projected oil production increased by 4 kb/d to 1,098 kb/d while preliminary production from the NM OCD decreased by 20 kb/d to 1,068 kb/d. Eddy county’s month over month production updates are typically very few and small and primarily occur in the last two or three months. However this month’s monthly updates/revisions were larger than normal and provide an overly optimistic projection for Eddy oil production. A more realistic projection would be closer to 1,080 kb/d. Next month’s production data should clarify the situation .
Note that from June 2025 to November 2025 projected production in Eddy County increased by 173 kb/d. The December increase of 4 kb/d was relatively small compared to the previous months and may be indicating an upcoming peak.
The rising production for July and August could be linked to the increasing rig count starting in time shifted June 2025. However the rig count for September and October and going forward is dropping while production continues to rise. This implies that Eddy County has been drilling in some very productive areas or been completing extra DUCs or drilling longer laterals beyond three miles.
The blue graph shows the average number of weekly rigs operating during a given month as taken from the above weekly drilling chart. The rig graph has been shifted forward by 8 months to roughly coincide with the increase in the production graph starting in November 2023.
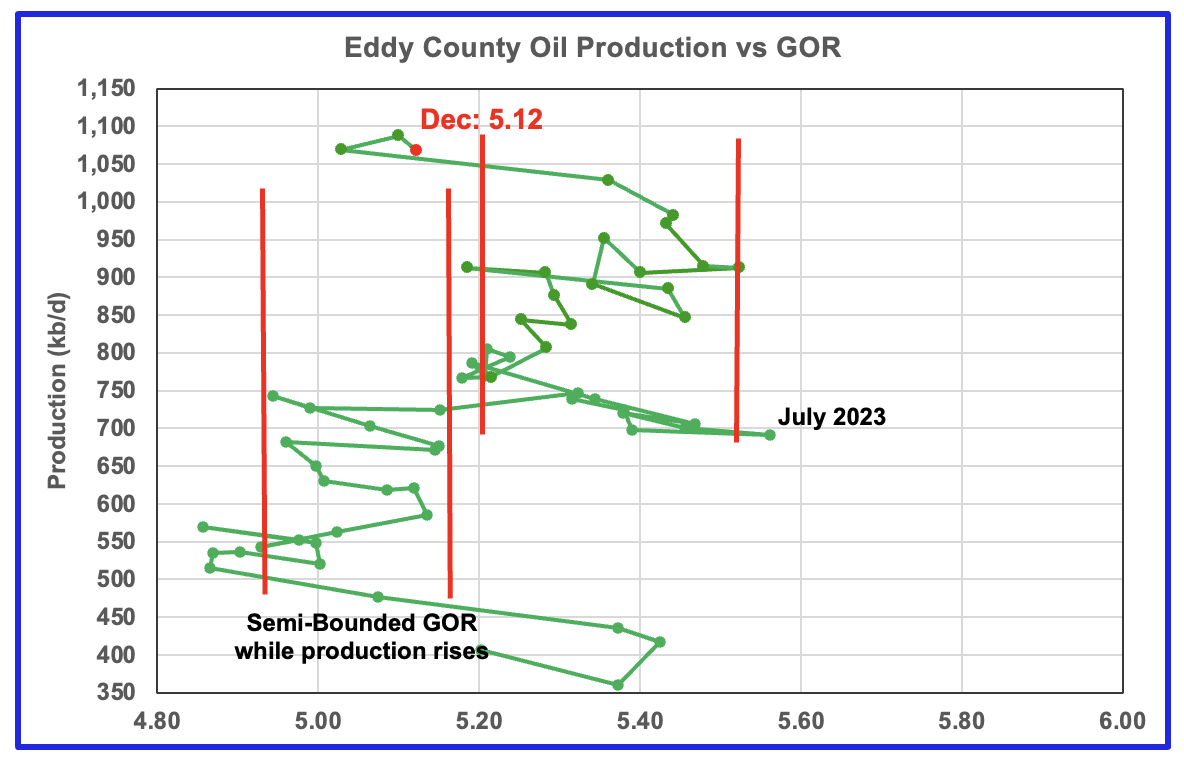
The Eddy county GOR pattern is similar to Lea county except that Eddy broke out from the first semi bounded range earlier and then added a second wider semi-bounded GOR phase. For December New Mexico’s Oil Conservation Division (OCD) reported preliminary oil production decreased by 20 kb/d to 1,068 kb/d while the GOR rose slightly to 5.12 from 5.10 and remained within the first Semi-Bounded GOR range.
Texas Permian
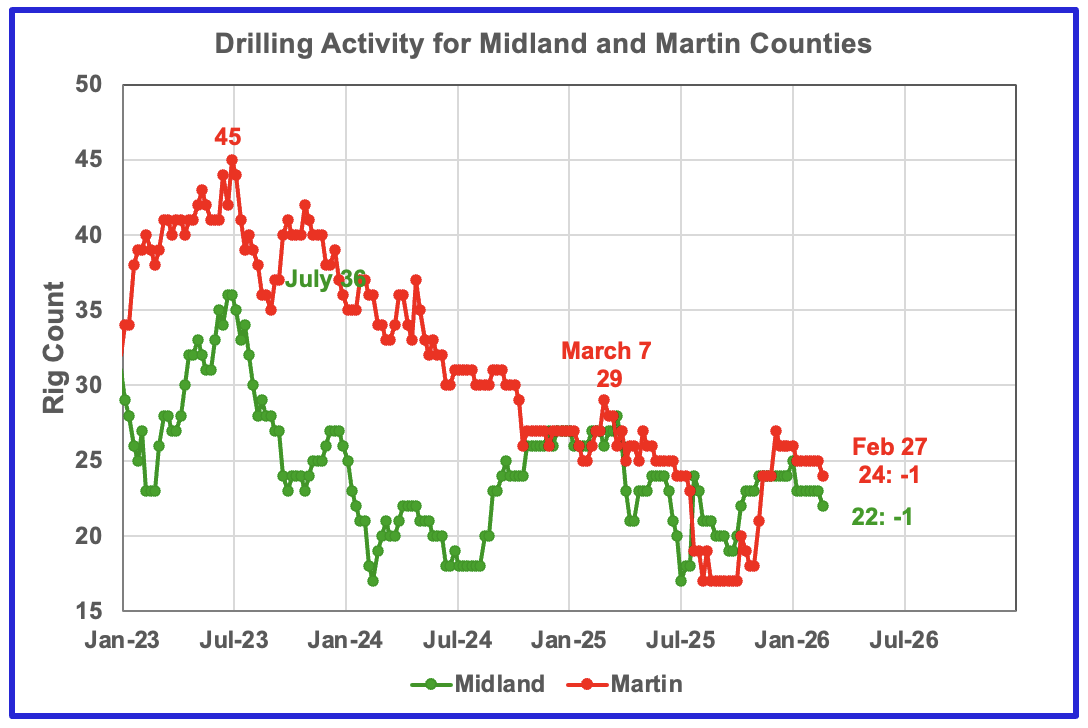
The rig counts in both Midland and Martin counties have decreased over the past few months. Martin dropped 1 rig to 24 in Febuary after adding rigs in October, November and December. Midland dropped 1 rig to 22 in February.
Oil Production in Primary Permian Texas’ Counties
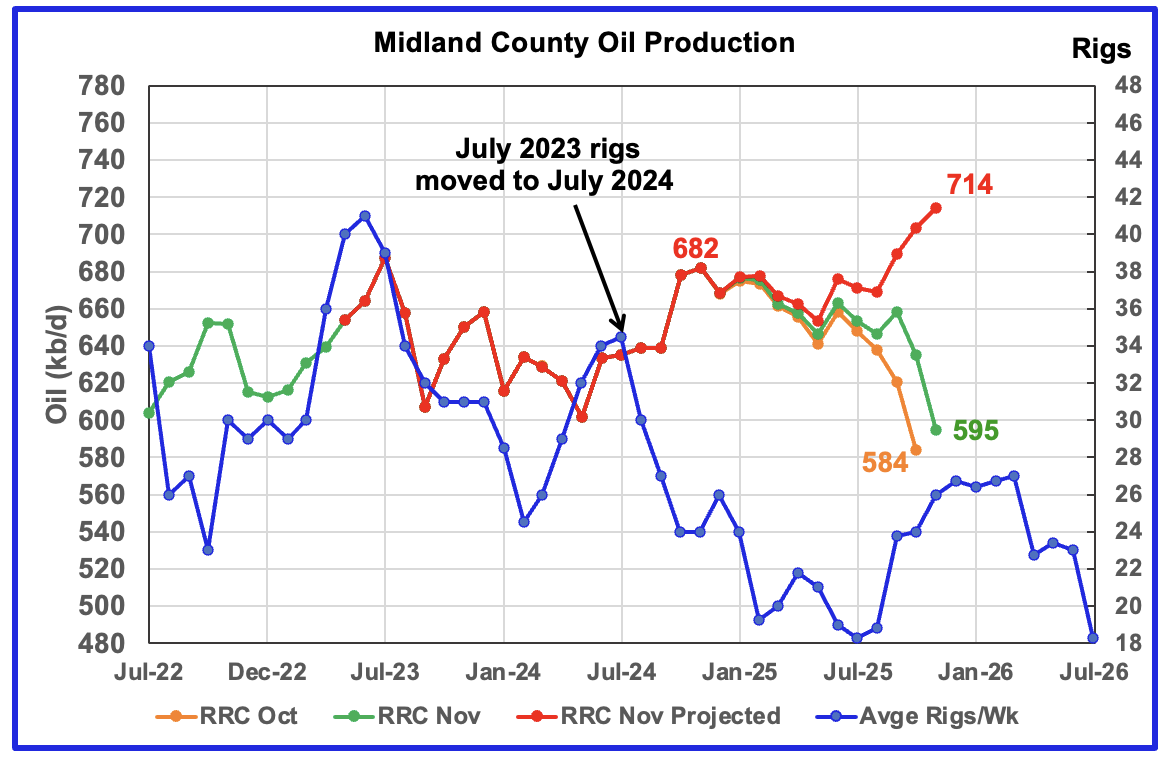
Comparison Chart from last month
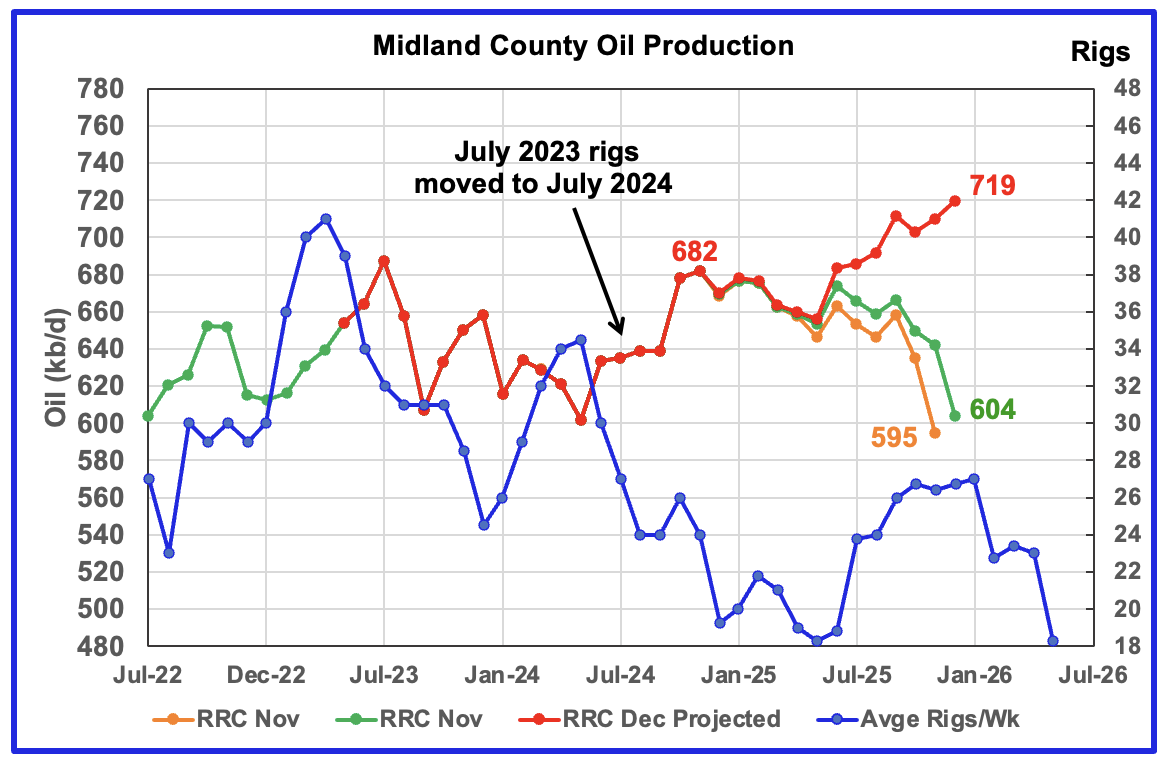
December’s projected production rose by 9 kb/d to 719 b/d. While last month I wrote that November’s projected production looked a bit optimistic, it actually wasn’t. November production was revised down by just 4 kb/d from 714 kb/d to 710 kb/d. See comparison chart above.
The production projection is indicting Midland may be entering a slowly rising production phase. The rise could be associated with the increasing rig count that started in time shifted June 2025. Due to the severe Texas winter storm in late January, Midland county along with many others may have experienced a production drop in January.
Mike Shellman discusses pressure depletion and well productivity in the Midland basin in this Post and foresees dropping production. Provided the correlation between the rising production and rig count is correct, production in Midland county in the heart of the Midland basin, should begin to drop in a month or two. Note that from May 2025 to December 2025, production rose by 9.6% while the rig count rose by 46%. Quite a discrepency.
The orange and green graphs show preliminary oil production for Midland County as reported by the Texas RRC for November and December. The red graph uses November and December data to project production as it would look after being updated over many months.
The blue graph shows the average number of weekly rigs operating during a given month as taken from the weekly drilling chart. The rig graph has been shifted forward by 10 months, revised down from 12, to better align with production. So the average 34.5 Rigs/wk operating in July 2023 have been moved forward to May 2024 to show the possible correlation and time delay between rig count, completions and oil production.
The 10 month rig time shift is larger than the typical six to eight months used in other counties. It is not clear why there should be such a difference.
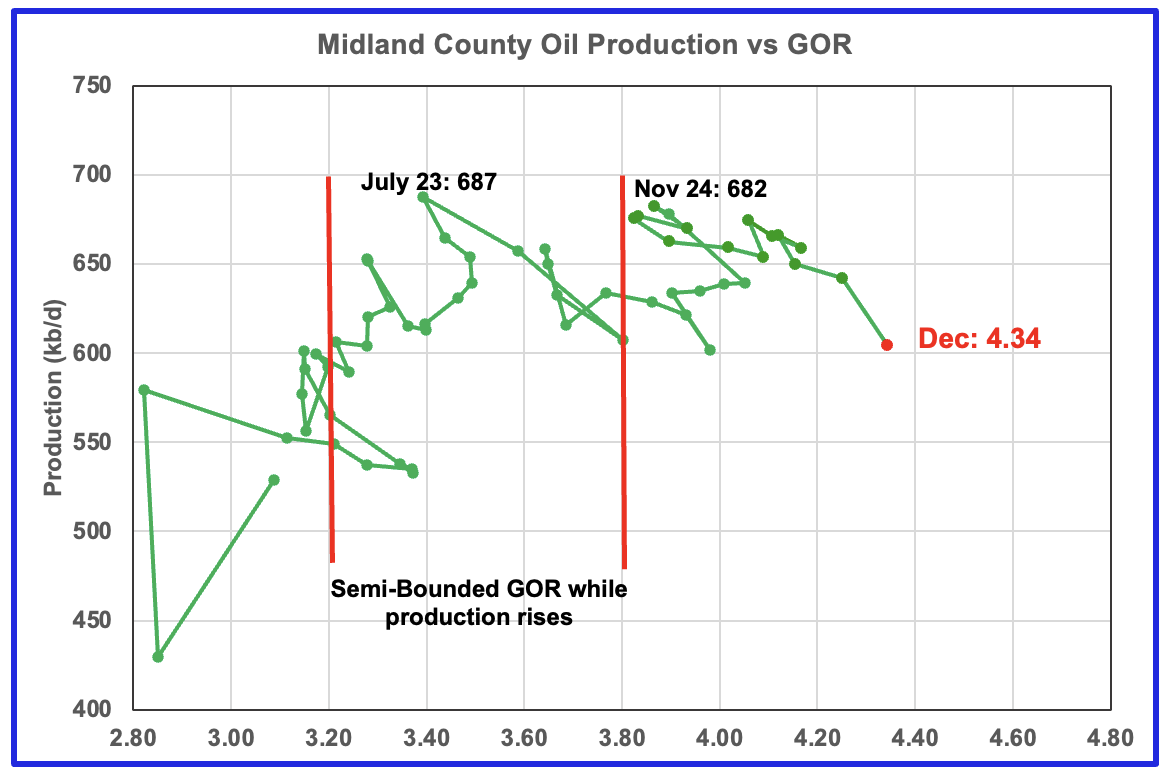
For December the Midland GOR ratio rose to 4.34 from 4.25 in November while the reported preliminary oil production dropped by 38 kb/d to 604 kb/d.
When Midland county GOR initially moved into the bubble point phase, oil production and the GOR stayed within a narrow GOR range of 3.8 to 4.1 outside of the initial Semi-Bounded GOR region from March 2024 to June 2025. However after June, the August to December 2025 GORs broke out to new highs. The December GOR rose to a new high of 4.34. The rising GOR is another indicator that Midland County is approaching peak production.
The oil production and GOR data shown in this chart are based on the RRC’s December preliminary production report.
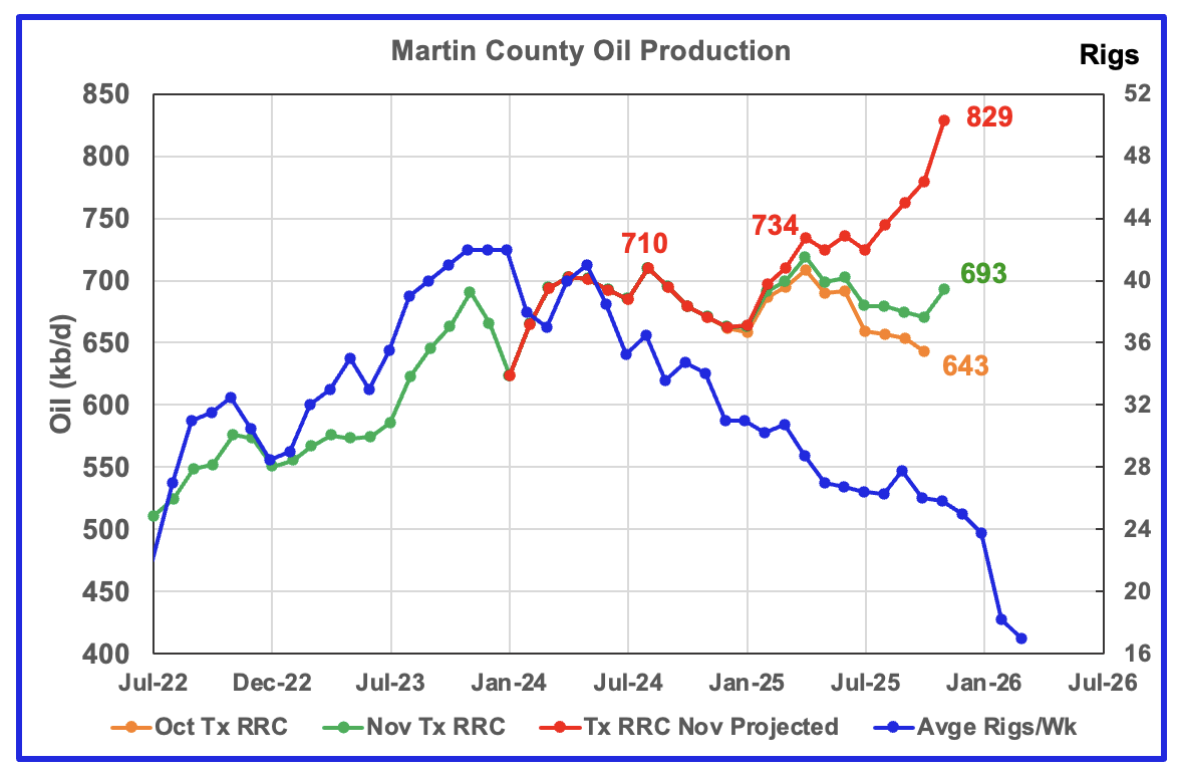
Comparison chart from the previous post.
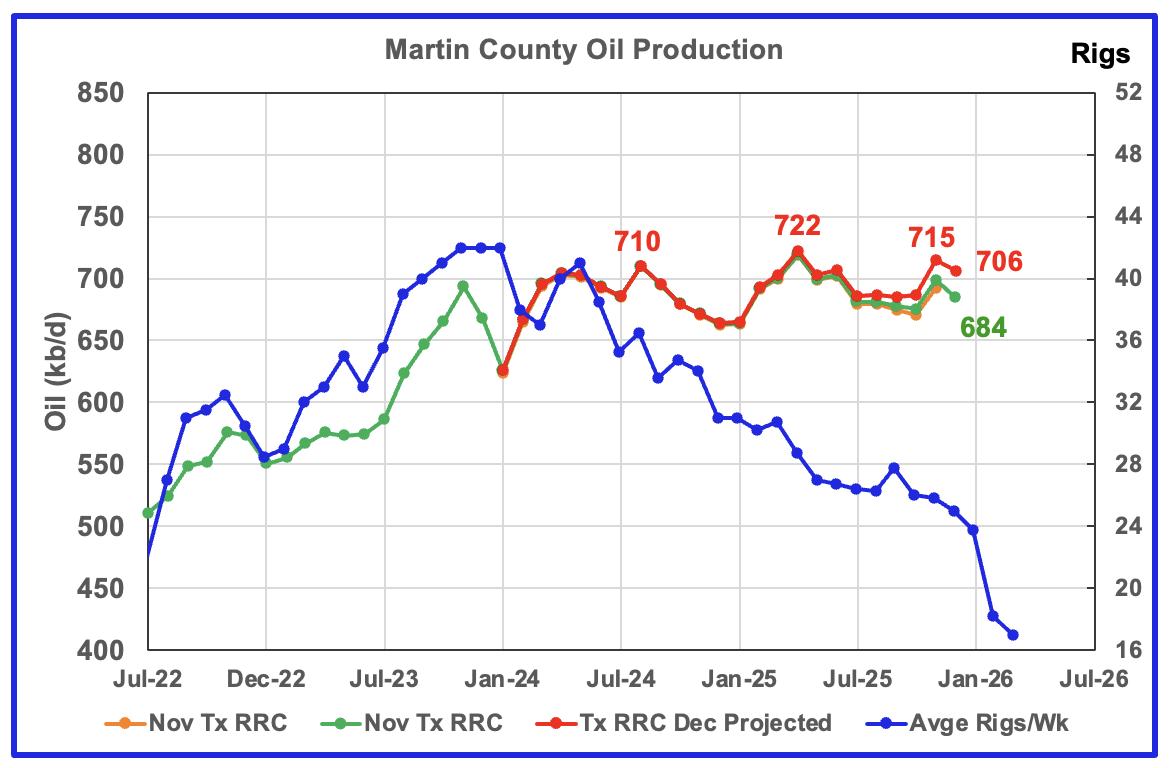
Martin county’s projected December oil production dropped by 9 kb/d to 706 kb/d. Last month I wrote: “I think November’s projected production is a bit optimistic and a more realistic level would be somewhere between 750 kb/d and 775 kb/d.” Turns out that 750 kb/d was too high. See comparison chart above. Martin county appears to be in a plateau phase with production ranging close to 700 kb/d ± 20 kb/d.
The August 2024, April 2025 and November 2025 peaks are all close to 715 kb/d. Considering the falling rig count, it is surprising that Martin has maintained the plateau for over a year and a half. As with Midland, January production should drop due to the late January severe weather. Will the dropping rig count begin to take its toll in 2026?
The red graph is a projection for oil production as it would look after being updated over many months. This projection is based on a methodology that uses preliminary November and December production data.
The orange and green graphs show production for Martin County as reported by the Texas RRC for November and December. The blue rig graph time shifts the rig count forward by 6 months.
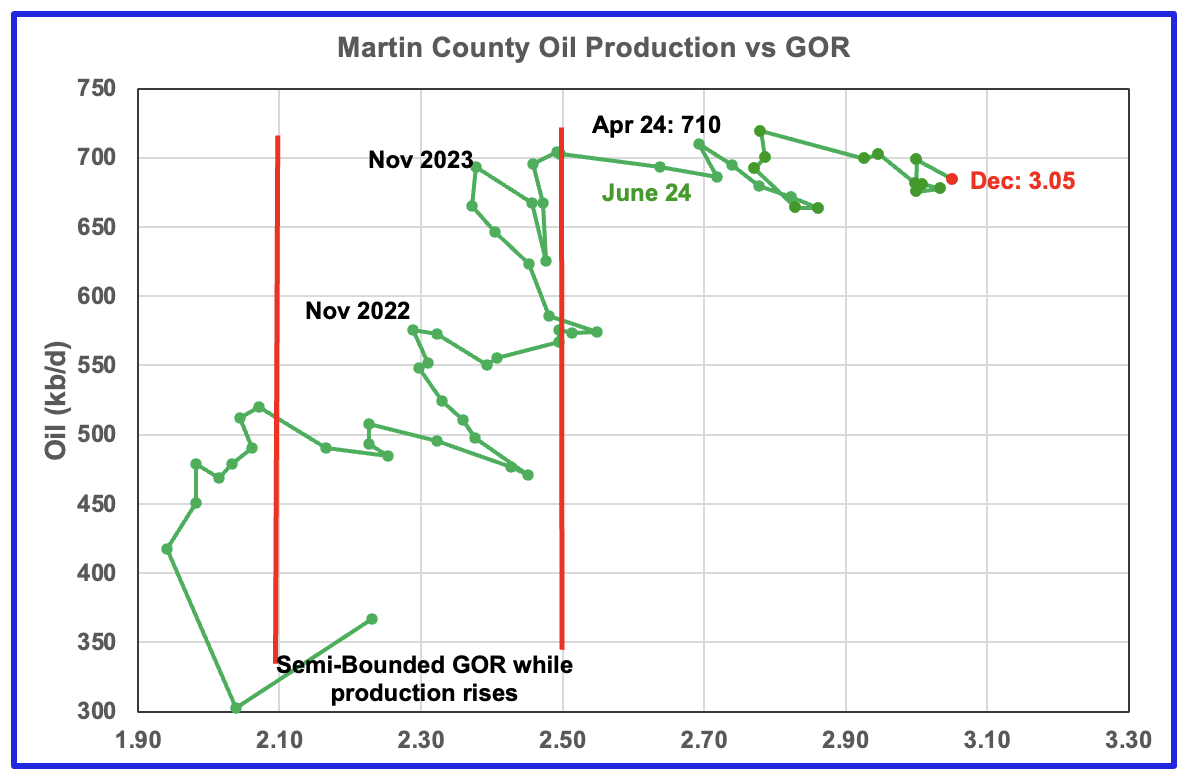
Martin county’s oil production after November 2022 increased and at the same time drifted to slightly higher GORs within the semi bounded range. However the June 2024 GOR saw its first move out of the semi bounded region. The RRC’s preliminary December 2025 production for Martin County shows a 15 kb/d decrease to 684 kb/d accompanied by a negligible increase to the GOR to 3.05.
Martin county has the lowest semi-bounded GOR boundary of the four counties at a GOR of close to 2.50. The December GOR is now clearly out of the semi-bounded region. Martin County has now entered the bubble point phase that should result in a plateau phase that should shortly turn into a slowly dropping oil production phase.
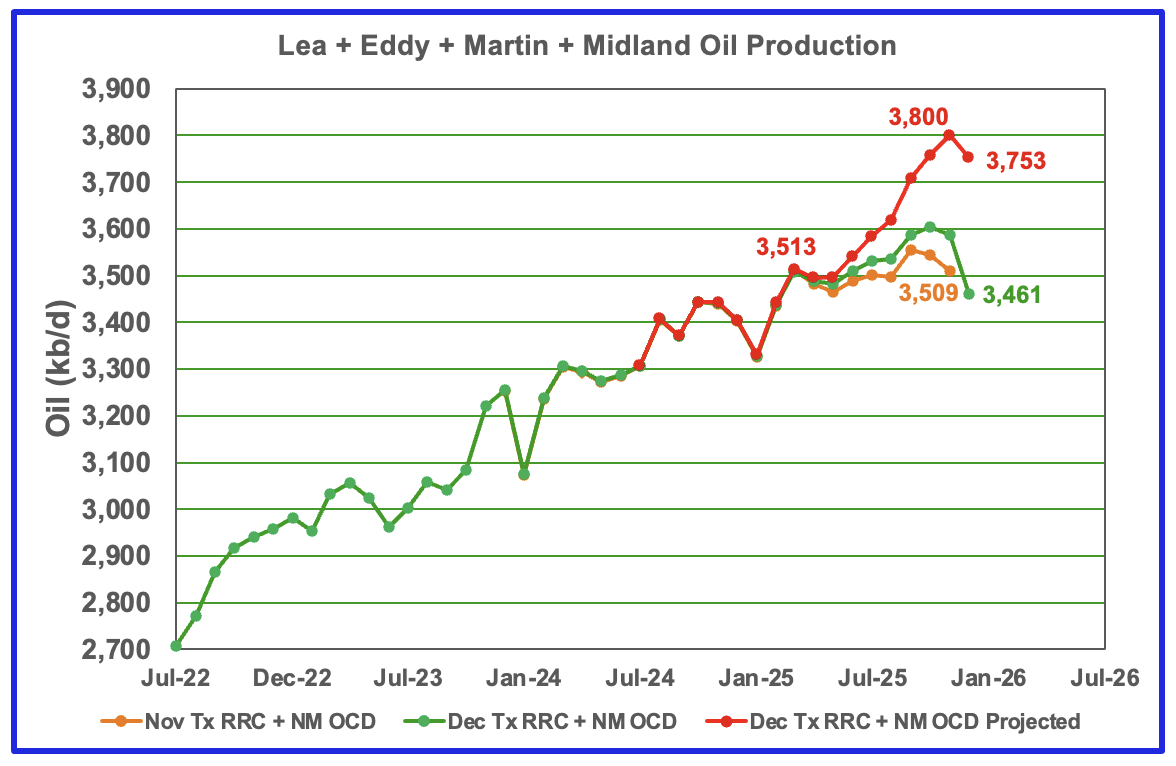
This chart shows the total oil production from the four largest Permian counties. Assuming current Permian production is close to 6,600 kb/d, these four counties account for 55% of the total. December’s projected production decreased by 47 kb/d to 3,753 kb/d and is the first monthly production drop over the last seven months. Of the 47 kb/d drop, the largest drop came from Lea County, 53 kb/d. Due to the unusually late revisions from the NM OCD, I think December projected production is too high by close to 100 kb/d. In other words December projected production should be closer to 3,650 kb/d.
The November and December initial production data are shown in the orange and green graphs respectively. The red graph uses the November and December production data to project a final updated production for December..
Findings
– The preliminary December production data for New Mexico had some late update the make the production projections a bit optimistic. The Texas RRC’s December production data was also OK and provided reasonable projections for December.
– Lea county entered its plateau phase in May 2024. While oil production is not following the rig count graph directly, the dropping rig count has resulted in Lea County production being in a steady flat plateau phase up to September 2025. However October, November and December had production drops which indicate Lea County has entered a declining phase. That declining phase could enter a lower level plateau phase as the time shifted February rig count begins to increase.
– July to November production in Eddy County saw a steady increase to 1,194 kb/d. While December’s projected production increased, it was smaller than previous monthly increases and may be indicating the beginning of a peaking/declining phase.
– Updated December Texas RRC production indicates that Midland County’s projected production continues to rise and may be correlated to the rising time shifted June 2025 rig count. The addition of six new rigs to Midland county in real August 2025 to 24 from 18 was an unexpected surprise and makes one wonder what it implies for Midland county oil production going forward after allowing for a rig count/production delay.
– Martin’s county December projected production indicates that its oil production is in a plateau phase of close to 715 kb/d.
Texas District 8
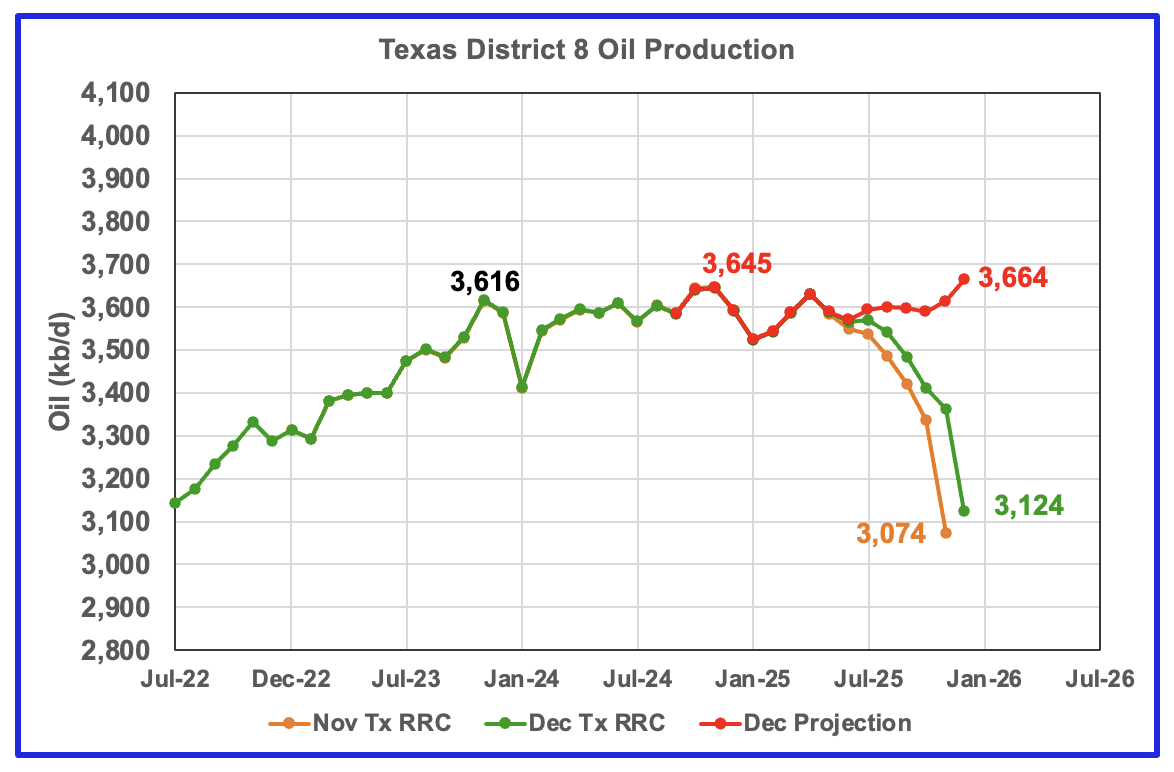
District’s 8 projected production rose by 50 Kb/d in December. Not clear which county/counties contributed to the 50 kb/d increase. The increase could be an over estimate as production over the last five months has been close to 3,600 kb/d which may be more indicative of a plateau phase.
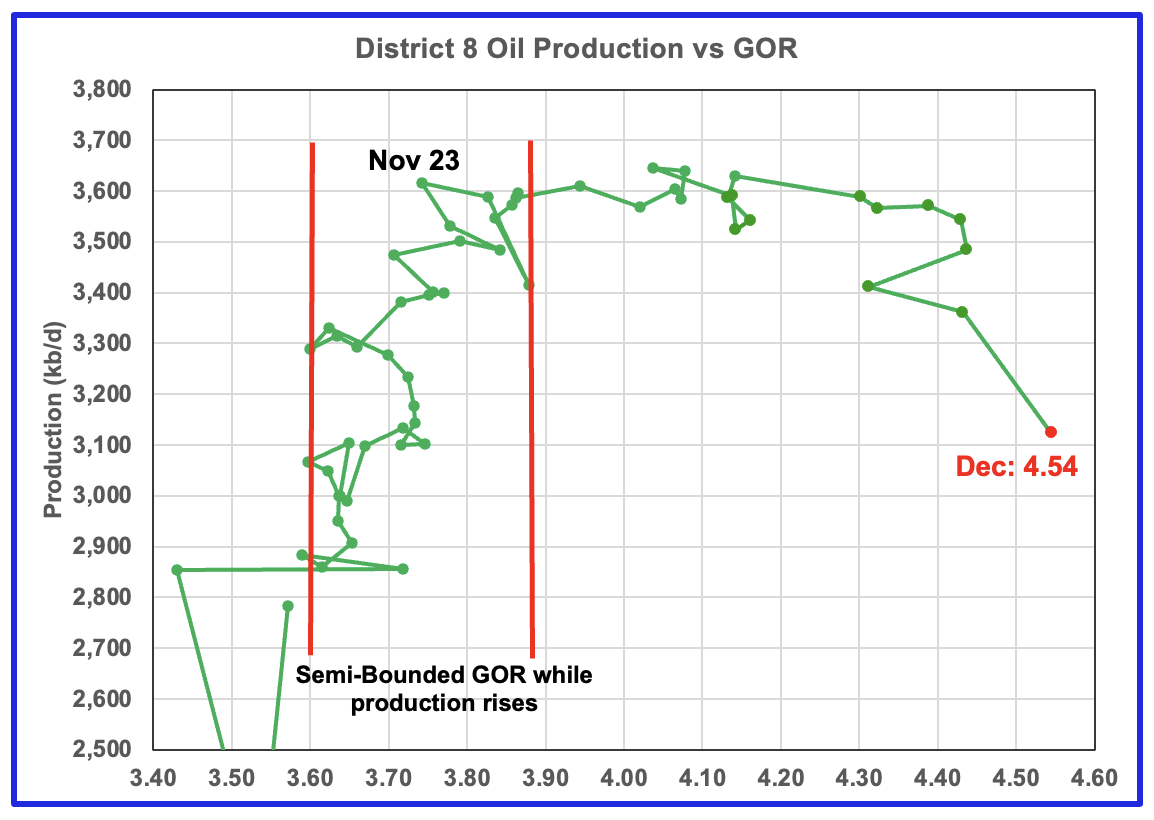
Plotting an oil production vs GOR graph for a district may be a bit of a stretch. Regardless here it is and it seems to indicate many District 8 counties may well be into the bubble point phase. The December GOR increased to 4.54, a new high, as the preliminary RRC production took a large drop of 238 kb/d to 3,124 kb/d.
Oil Production and GOR Charts for Four of the Next Larger Texas Oil Counties
Texas December data appears to be reasonable as are the county projections.
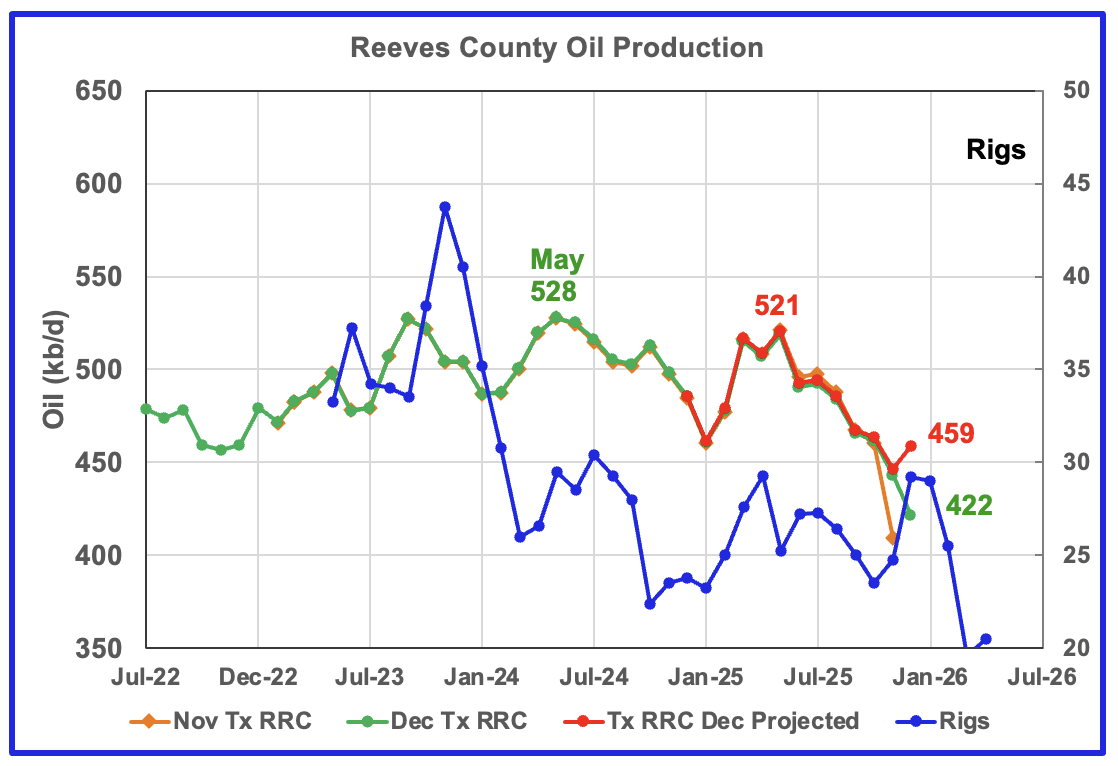
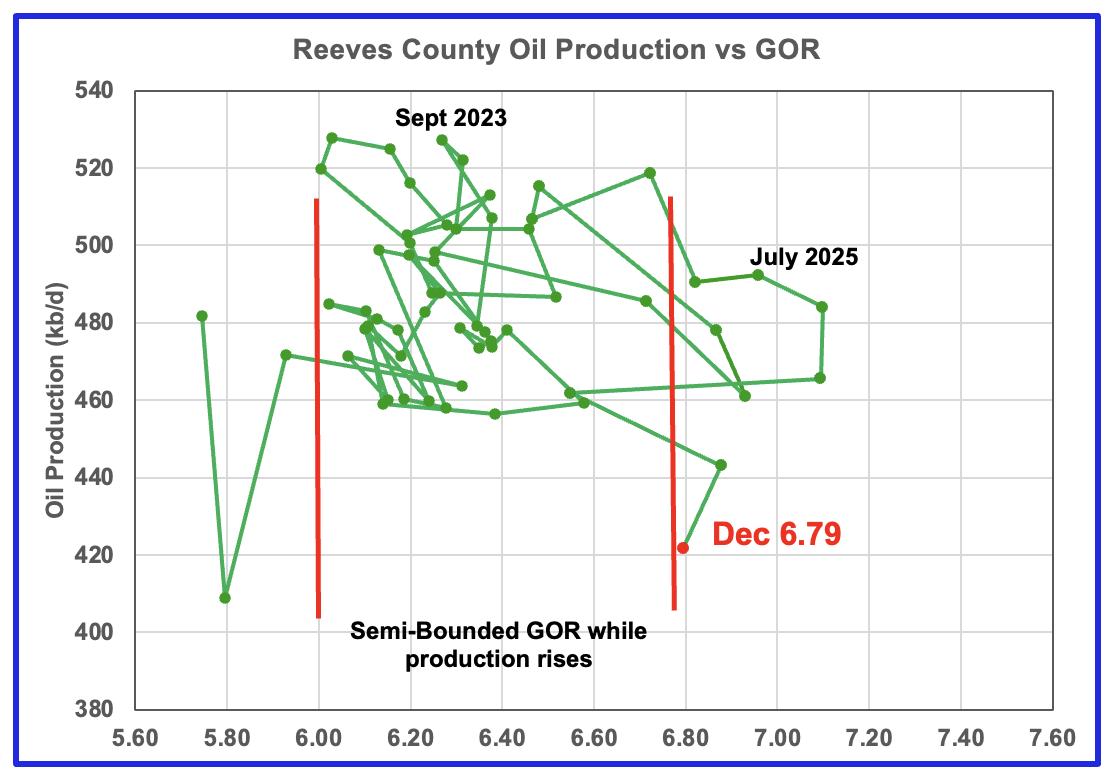
Reeves county GOR is high because it is the number one Texas county ranked by gas production. The current C + C production is almost split between crude and condensate, with condensate about 5% higher than crude.
Reeves County GOR first moved out of the Semi-Bounded region in July and popped back in October. It re-emerged in November and is just barely outside in December.
The rig count is time shifted forward by 7 months.
In real June 2025, 29 rigs were operational in Reeves county. By late February 2026 the rig count had dropped to 10. That is a large drop in 8 months.
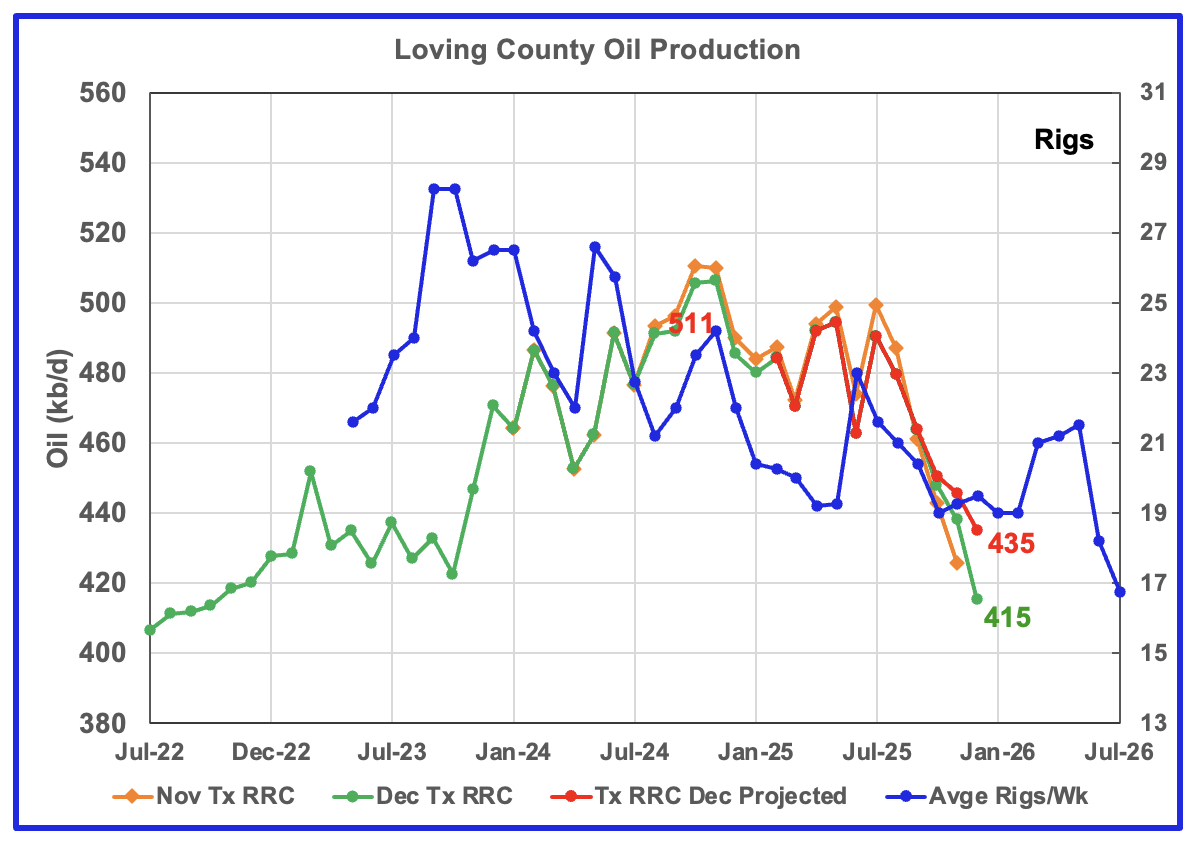
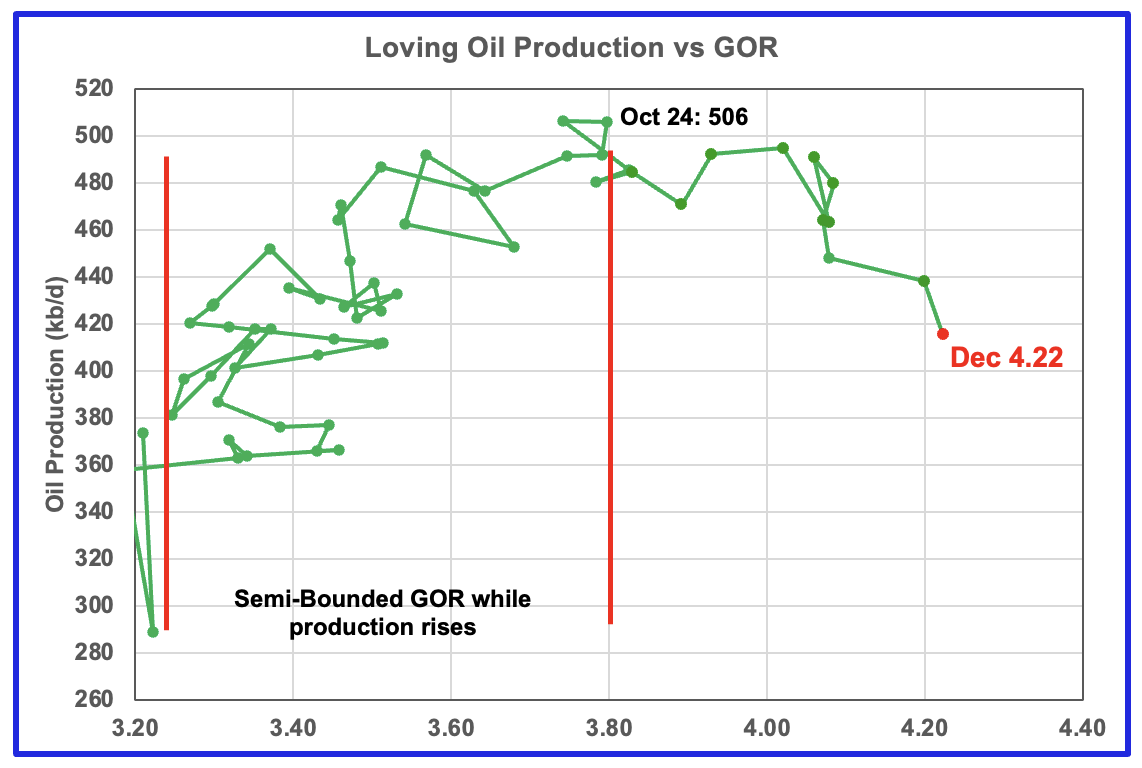
Loving’s projected production dropped by 11 kb/d to 435 kb/d in December. For December, the GOR increased to 4.22, a new high.
Loving’s rig graph is time shifted forward by 8 months.
While Loving had 19 operational rigs in real June, they jumped by 3 to 22 in real September and then dropped to 18 in late February.
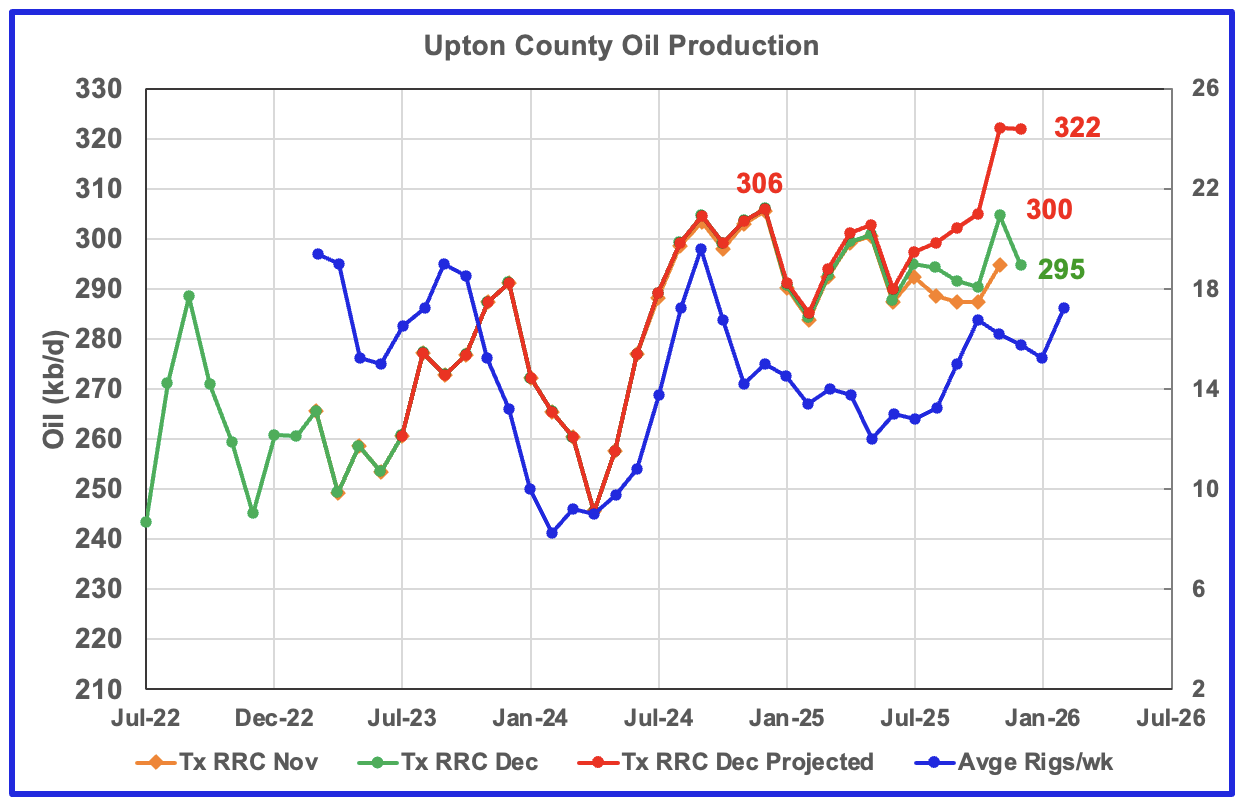
Upton’s projected December production was unchanged at 322 kb/d.
For the next few months Upton County may see a production increase associated with the rising rig count which started in time shifted August 2025. A decline may begin in November/December.
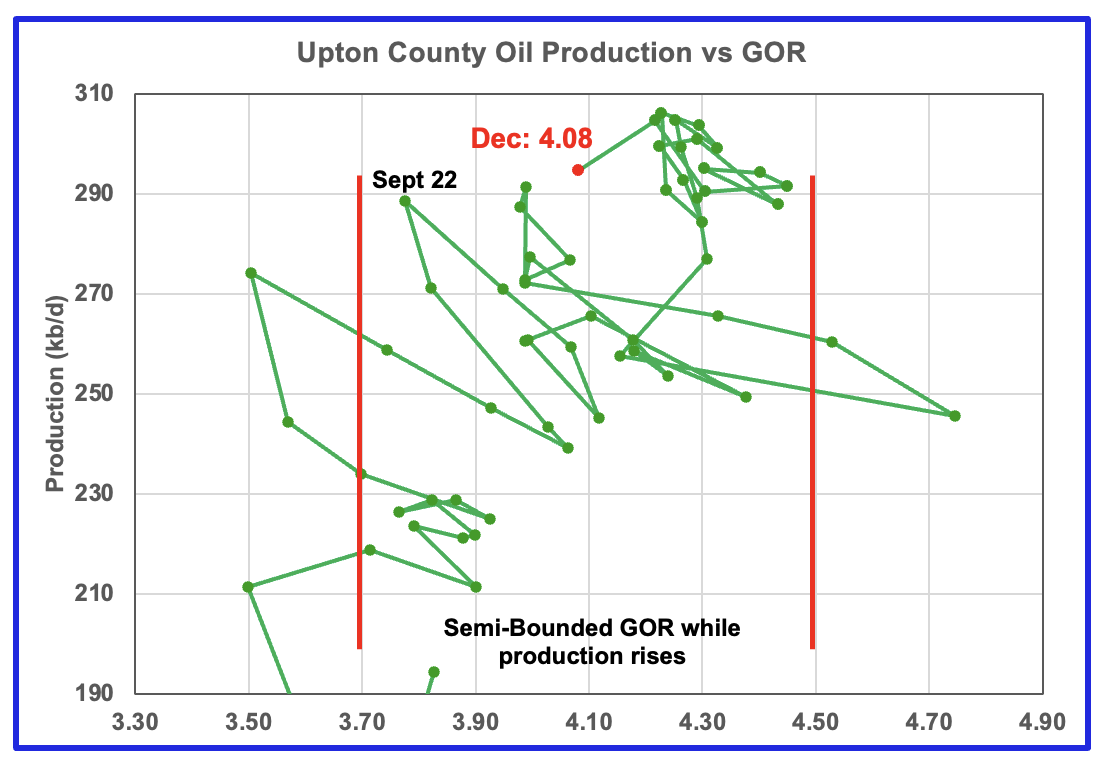
Upton’s GOR continues to stay within the Semi-Bounded region at 4.08.
Upton’s rig chart has been time shifted forward by six months. Upton began 2025 with 13 rigs. In real February 2026, 8 rigs were operating.
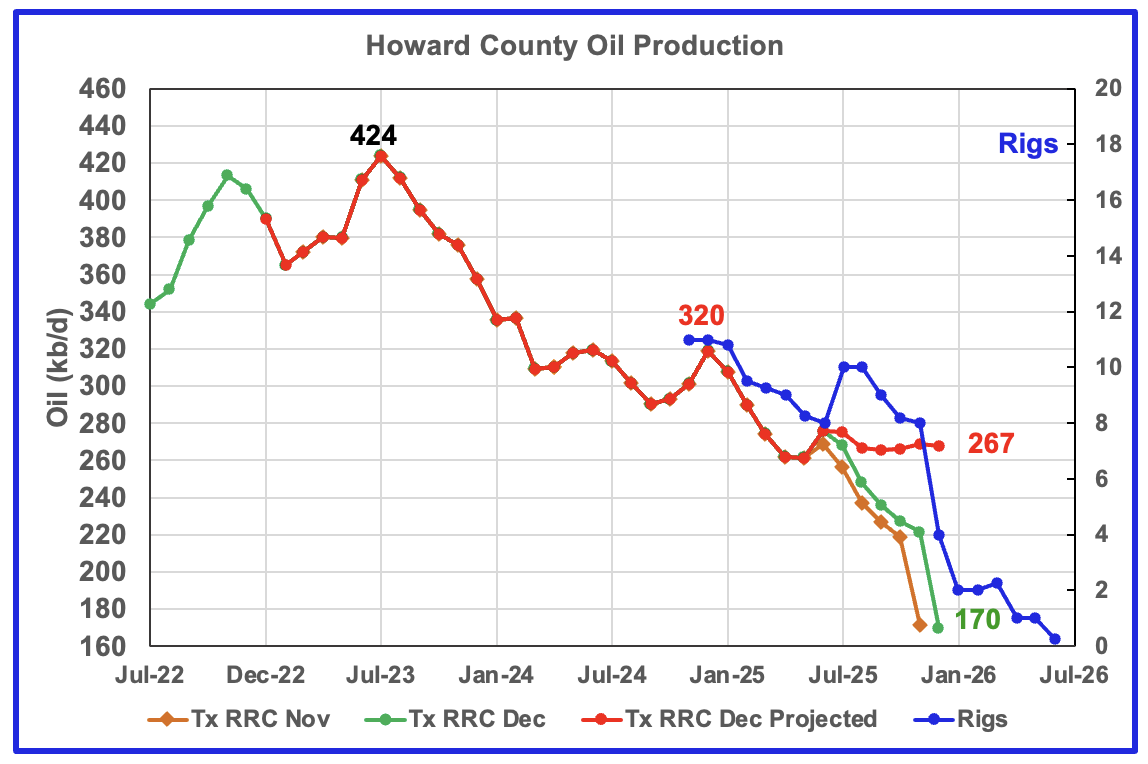
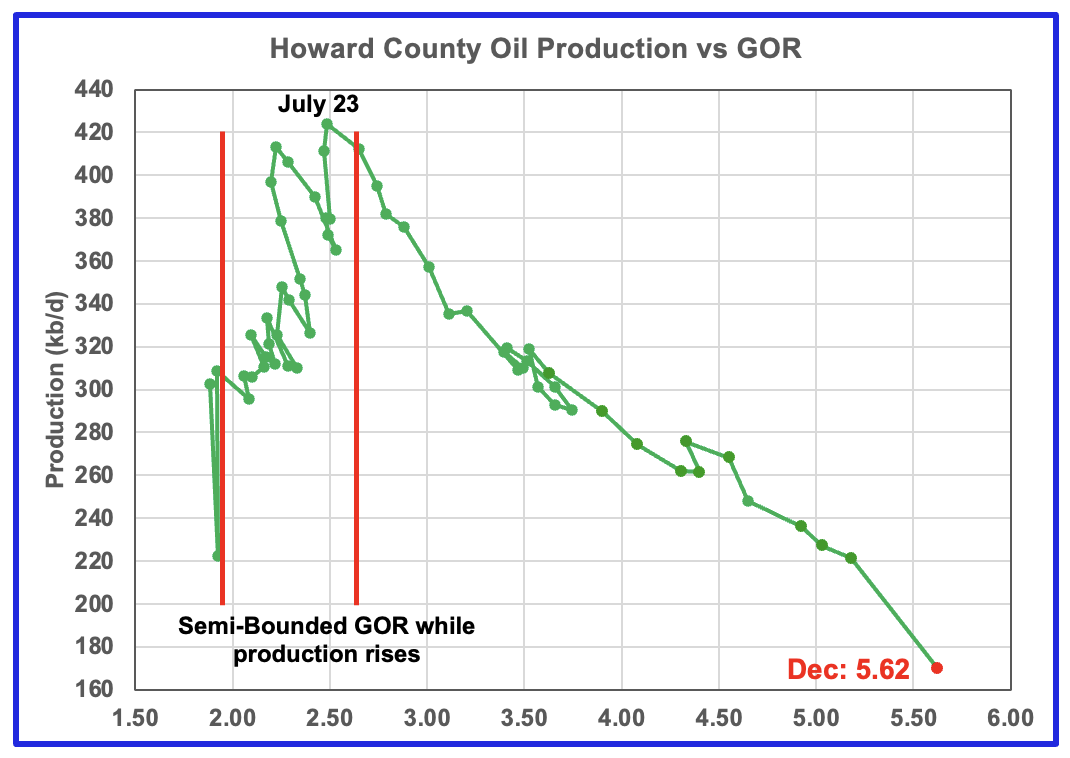
Howard County oil production peaked in July 2023 and has been in a slow decline ever since. However since August 2025 production has stabilized at close to 265 kb/d. The falling production has been falling along with the dropping rig count. Will the dropping rig count starting in time shifted December result in dropping production in January/February?
In December the projected production dropped by 2 kb/d to 267 kb/d.
Note the rig count in time shifted June 2026 is 0.25, i.e. 1 rig for one week in real January 2026. The rig graph is time shifted forward by 5 months.
The GOR continues to increase as the Tx RRC Initial production drops. The GOR ratio reached a new high of 5.62 in December.
Drilling Productivity Report
The Drilling Productivity Report (DPR) uses recent data on the total number of drilling rigs in operation along with estimates of drilling productivity and estimated changes in production from existing oil wells to provide estimated changes in oil production for the principal tight oil regions. The new DPR report in the STEO provides production up to January 2026. The report also projects output to December 2027 for a number of basins. The DUC charts and Drilled Wells charts are also updated to January 2026.
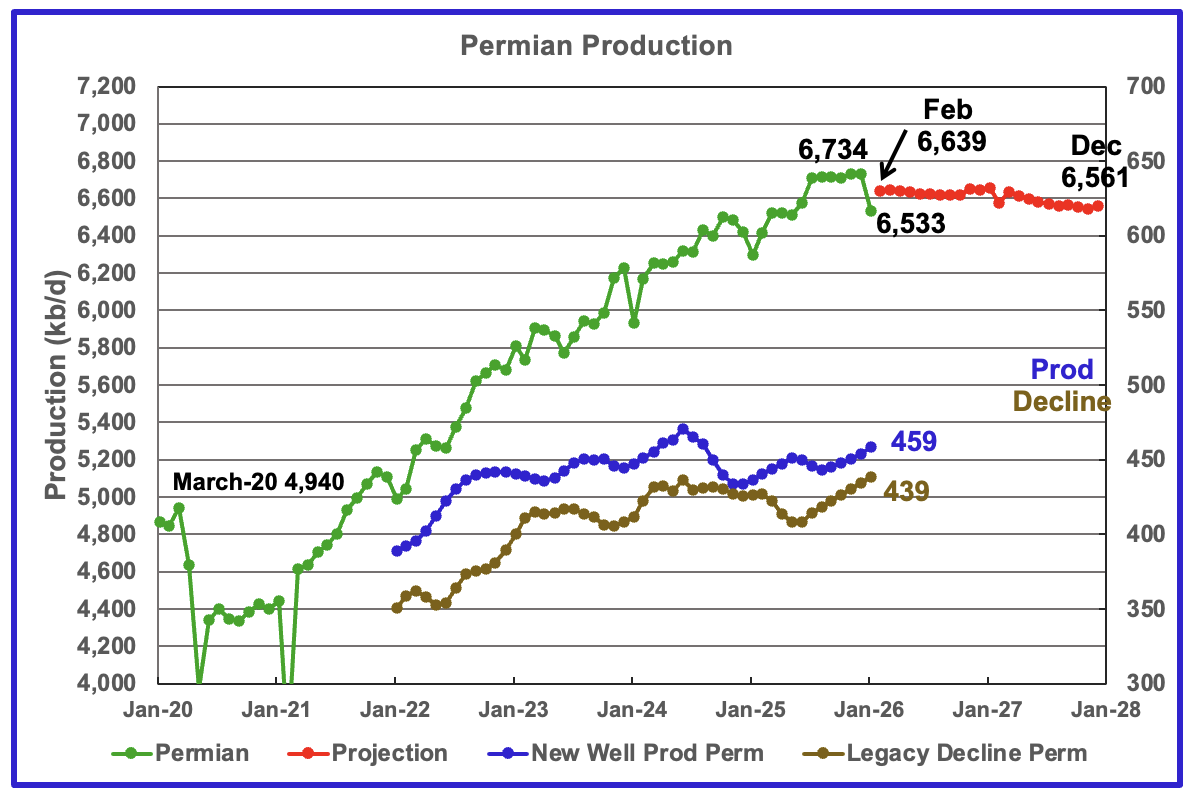
The EIA’s February STEO/DPR report shows Permian January output dropped by 201 kb/d to 6,533 kb/d. The big drop is due to severe winter weather in late January. February production is expected to rise by 106 kb/d to 6,639 kb/d.
What may be more significant in this chart is February’s output level of 6,639 kb/d which is down 95 kb/d from December. This drop I think is related to either a low number or no oil wells being brought online during the winter storm in January. With no wells being brought on line, the steep drop in the new wells brought online in the previous two months rears its ugly head. The lack of daily new wells being brought on line during the storm are required to partially offset that steep decline. Note production never recovers to the December level. It is pretty well a slow downhill story after February 2026.
From February 2026 to December 2027 output is expected to drop by 78 kb/d to 6,561 kb/d.
Production from new wells and legacy decline, right scale, have been added to this chart to show the difference between new production and legacy decline.
These numbers reflect a one year production trend and provide the production contribution from new wells over a rolling 12-month period to determine if the rate of new production is increasing or decreasing compared to previous periods. If the new well production reported were for the latest month, new well production should be lower than decline since January production experienced such a large drop. The averaging process approximately adds a six month delay.
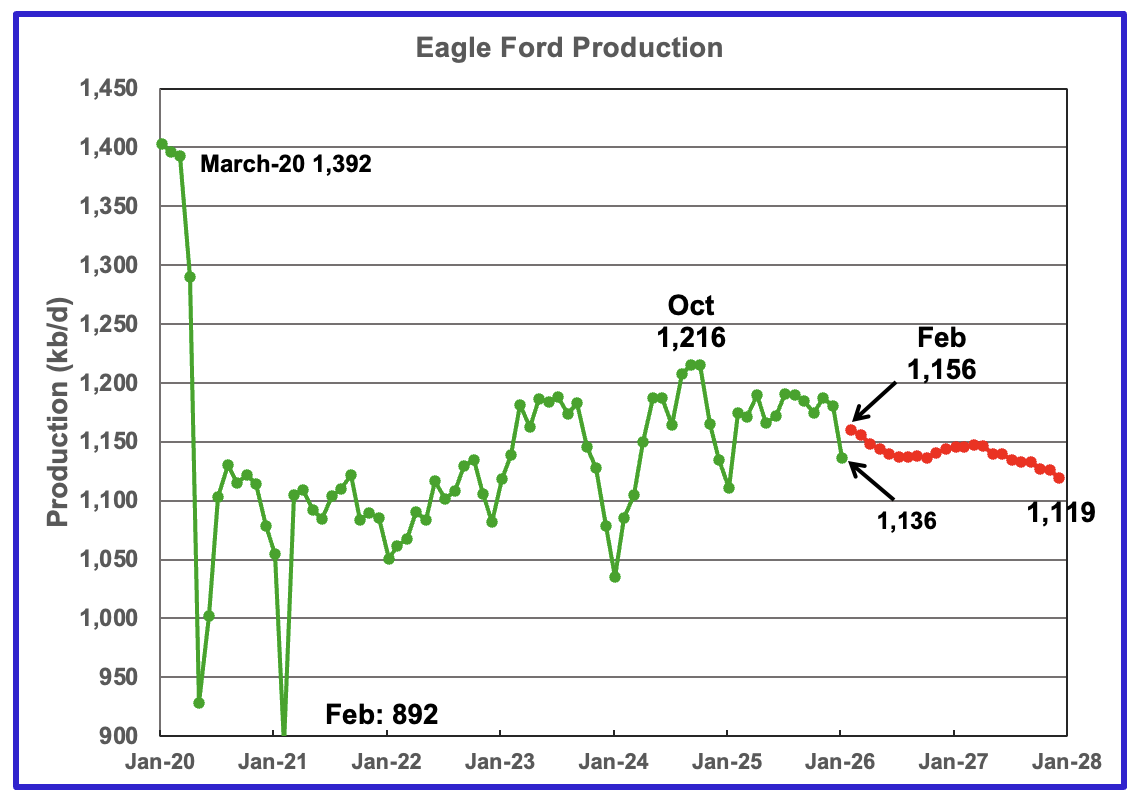
January’s output in the Eagle Ford basin decreased by 44 kb/d to 1,136 kb/d. February’s 2026 production is forecast to rise by 20 kb/d to 1,156 kb/d.
Output in December 2027 expected to be 1,119 kb/d down 37 kb/d from February 2026.
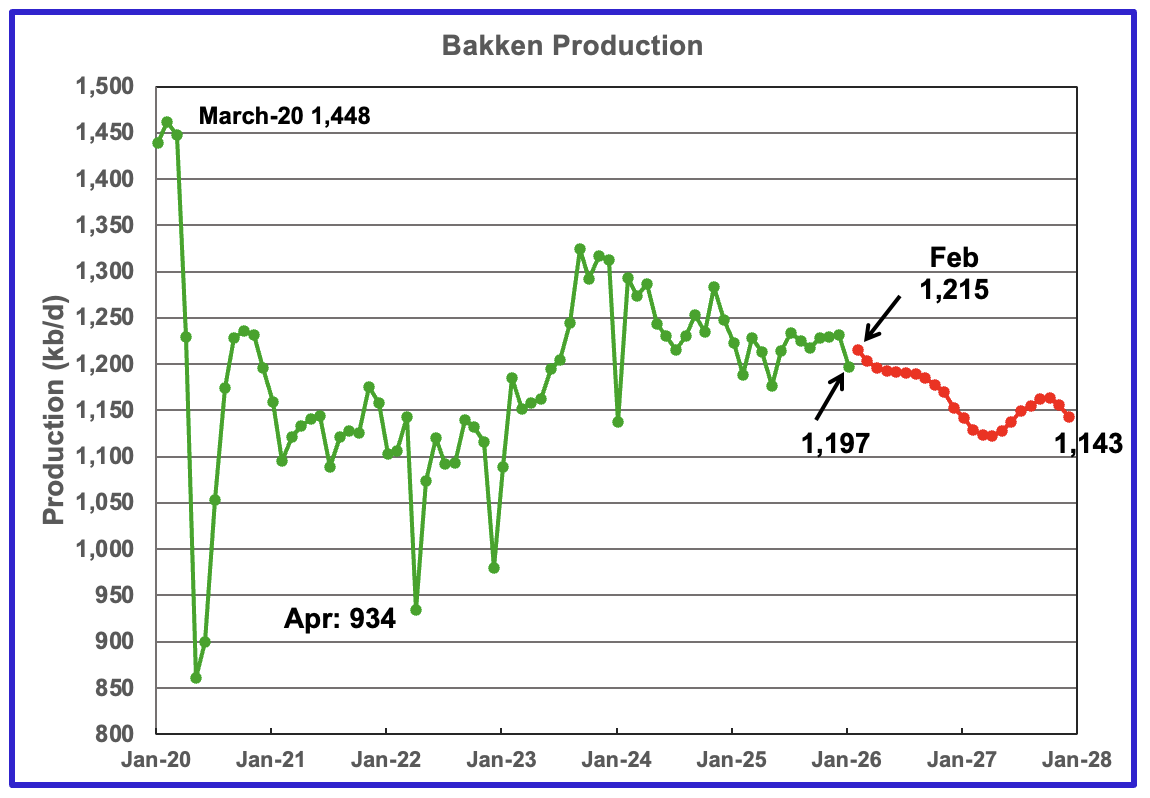
The DPR/STEO reported that Bakken’s January’s output dropped by 34 kb/d to 1,197 kb/d. February 2026 production is expected to increase by 18 kb/d to 1,215 kb/d. The STEO/DPR projection, red markers, shows output dropping to 1,143 kb/d in December 2027.
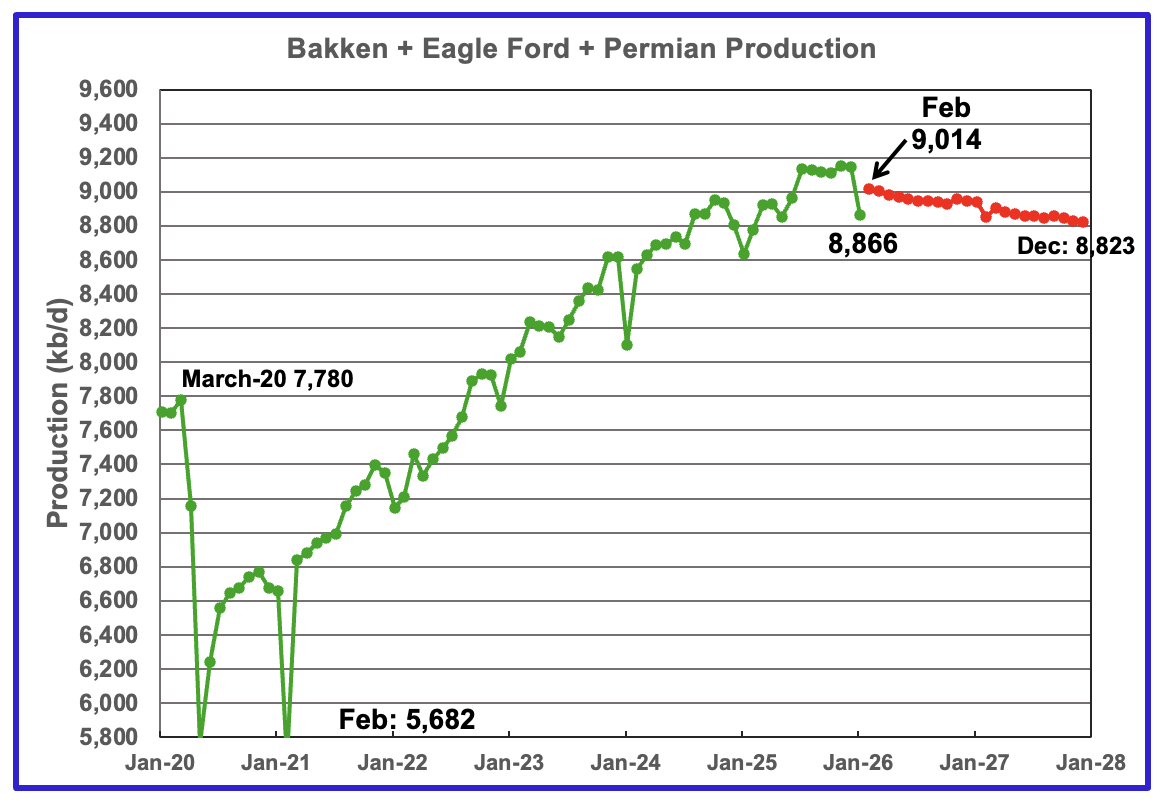
This chart plots the combined production from the three main LTO regions. January output decreased by 279 kb/d to 8,866 kb/d. Production for December 2027 is forecast to be 8,823 kb/d. February recovers to 9,014 kb/d.
DUCs and Drilled Wells
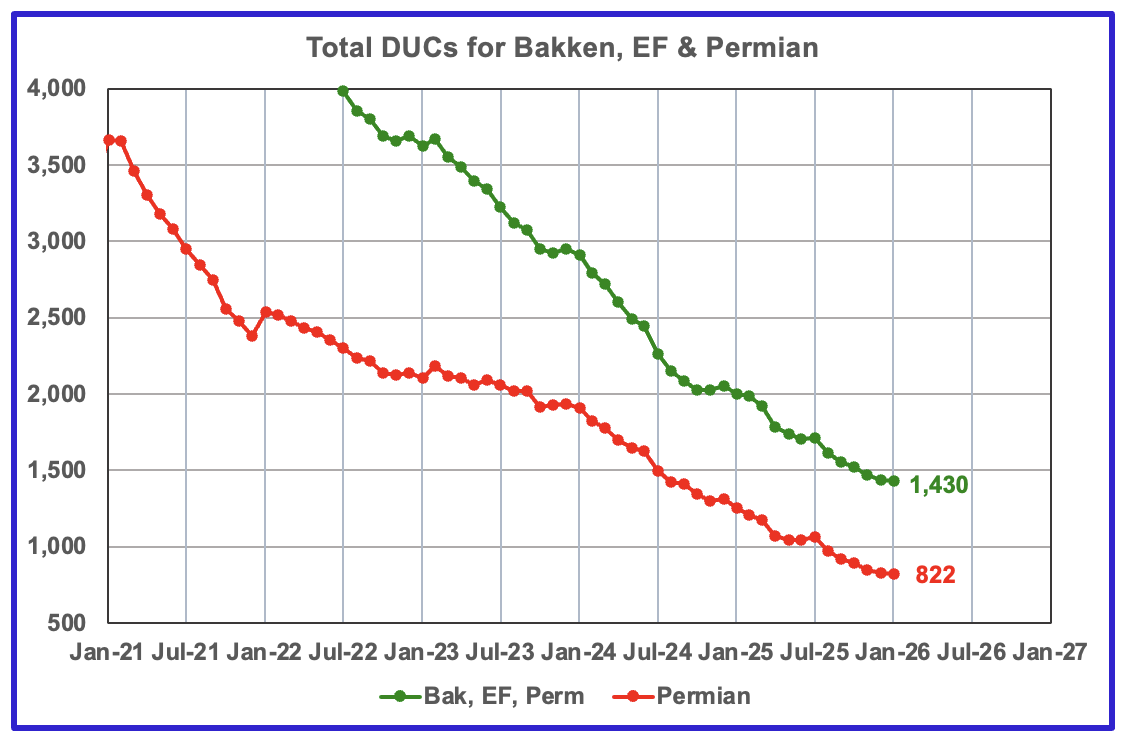
The number of DUCs available for completion in the Permian and the three major DPR regions continues its dropping trend. January’s DUC count for the three basins dropped by 7 to 1,430. In the Permian the DUC count dropped by 5 to 822.
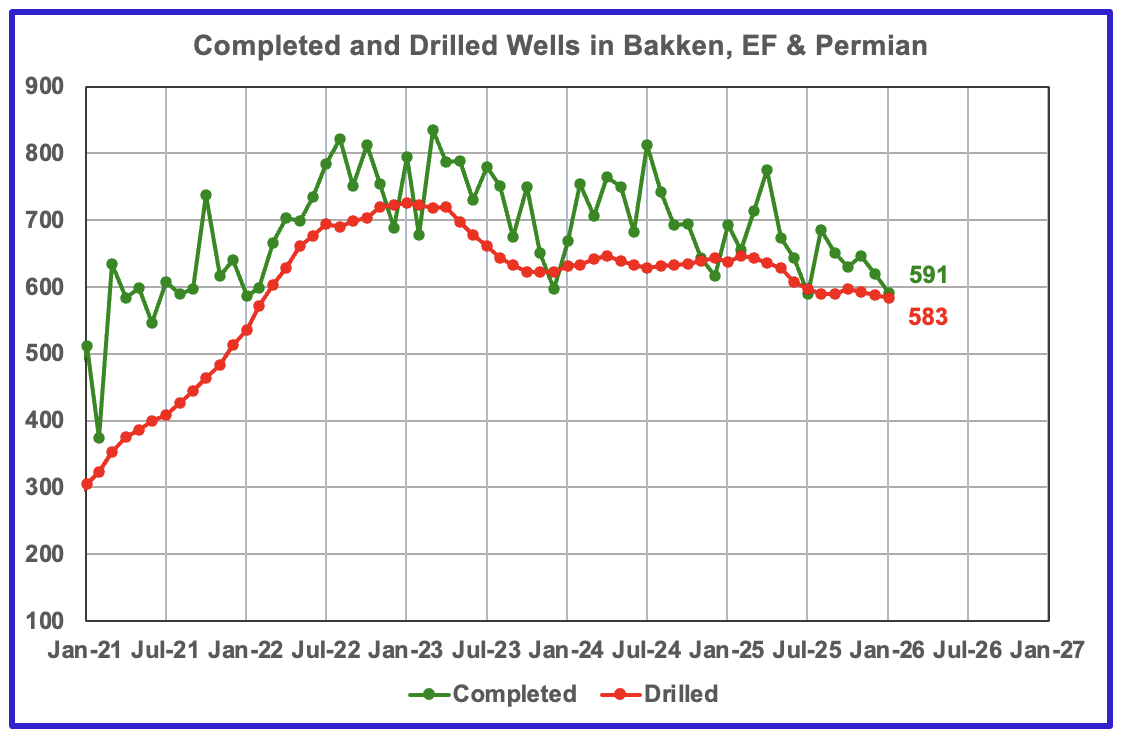
In the three primary regions, a total of 591 wells were completed in January, 29 fewer than in December. There were 583 wells drilled in January 2026. For the past 6 months, an average of 590 wells were drilled each month. For comparison, In January 2023, 726 wells were drilled.
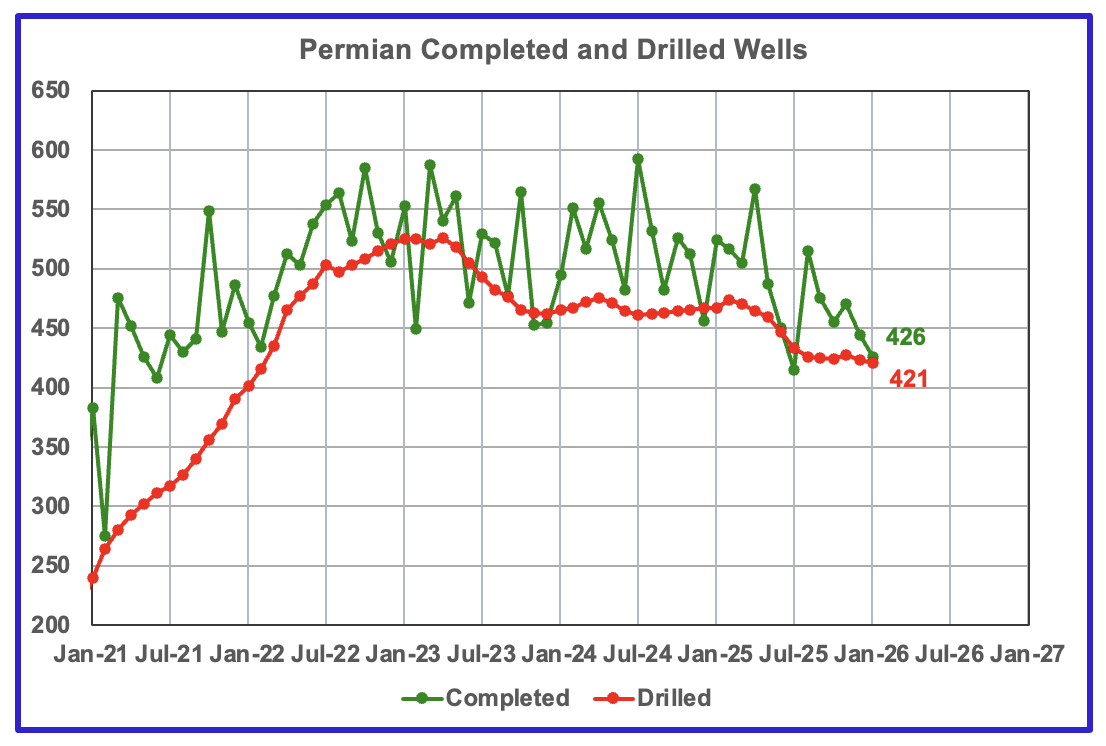
In the Permian, the monthly drilling rates have stabilized around 425 for the last 5 months.
In January 2026, 426 wells were completed and 421 new wells were drilled.
142 responses to “US December Oil Production Drops”
Shallow Sand
In response to your comment in the previous post “Control of the Strait of Hormuz is the whole deal IMO. The USA will have to patrol it for a very long time unless regime change can be accomplished..”
Iran does not even have to fire a missile. Just saying the Straits are closed will keep ships away. Also insurance companies will not insure the ships.
It will be interesting to see how many ships risk going through the straits.
Ovi,
Regarding the status of the Strait of Hormuz, THE youtube site related to this crucial topic is Sal Mercogliano’s “What’s Going On With Shipping?”.
Short, fast paced, info packed presentations by an exceptionally knowledgeable (and entertaining) former mariner.
Excellent post!!!
Thank you Ovi!!!
Dan
Thanks. Much appreciated.
Ovi,
The link for Mike Shellman’s post does not work for me, maybe double check that.
Thanks
Fixed in post.
Just in case/
https://www.oilystuff.com/group/operational-stuff/discussion/841d2787-6d25-4ffe-b39e-f52d7614e6da
Thanks Ovi,
Seems to work correctly now. Another excellent post by Mr Shellman.
Also great work by you.
Thanks.
Great Timing
US at peak oil production and will need to import more oil. Straits of Hormuz shut down for a few months driving oil price up. T encourages more US consumption of oil/gasoline by discouraging purchase of PHEVs.
Will higher WTI encourage more drilling and oil production. Find out in 6 to 8 months and will the new production be big enough to offset ever increasing decline?
Ovi,
If the higher prices are sustained and the completion rate increases we might see tight oil output on a plateau for as long as high oil prices are sustained. This may require $120/bo in 2025$, I doubt that price level will be sustained as it would increase EV and plugin hybrid adoption which may reduce demand for oil.
China is by far the largest customer of oil flowing through the Straits of Hormuz. They are likely to double down on their EV strategy.
I just saw on Bloomberg that US taxpayers are going to pay tanker shipping insurance costs through the Strait of Hormuz, as well as providing escorts via the US Navy.
Isn’t this subsidy directly benefiting China?
SS
Does anything make sense these days.
shallow,
Not only is this a subsidy on U.S. taxpayers that benefits China, but it also puts U.S. Navy ships in jeopardy if Iran decides to use hypersonic missiles, the Fattah-1 or Fattah-2, on U.S. warships escorting tankers.
https://www.youtube.com/watch?v=VTAlZWZi_TQ
If this US-Israel-Iran conflict, which now includes many other Middle East countries with U.S. Military bases, continues for more than 2-3 weeks, this could seriously disrupt the Global Economy.
steve
Steve, Donald is suggesting a few weeks of bombing. I would guess that would keep shipping insurers from insuring during that time.
https://www.juancole.com/2026/03/provoke-economic-downturn.html
In the United States, President Trump has ducked reporters because the rationale for the US/Israeli Iran attacks – Iran’s planning for a preemptive attack against American interests – has proved untrue, as the US intelligence community has acknowledged.
“In the Sunday interview with the British Daily Mail, President Trump disclosed a possible timeline for the war with Iran, suggesting fighting could go on for a month: “It’s always been a four-week process. We figured it will be four weeks or so. It’s always been about a four-week process so – as strong as it is, it’s a big country, it’ll take four weeks – or less.””
LeeG,
The president and others in his administration, notably Rubio, have presented several contradictory rationales, none of which made sense on their own (pre-emptive attacks are illegal under international law, perhaps because such a rationale is so easily dishonest), and make even less sense as part of a chaotic war effort.
No clear or consistent goals, no clear or consistent timeline, no obvious strategy to achieve possible goals (like regime change).
Sigh.
LeeG & Nick G,
Maybe you all have seen this interview of Prof Jiang forecasting “The U.S. Will Lose The Iran War.” Of course, this is his opinion, as everyone who has an a-hole also has an opinion.
But, interestingly, Jiang predicted not only that Trump would win the 2024 Presidential Election, but also that the U.S. would go to war with Iran, and, lastly, that the U.S. would lose the war with Iran… basing his forecasts on his strategy using “GAME THEORY.”
https://www.youtube.com/watch?v=4Ql24Z8SIeE
I think Trump bit off more than he could chew… that’s my KISS-Keep It Simple Stupid opinion.
steve
shallow sand —
I thought the US government’s calculation was “Shutting down oil exports will hurt China and help US oil producers”. Now they seem to be burning money to deal with the unintended consequences of their own actions.
Trump’s Peace Council got $10 bn from the American taxpayer. Maybe they can pitch in.
Thank you POB and Matt Mushalik for the use of your charts. I’ve written a retrospective on the phenomenon of peak oil, which will be published at 3QuarksDaily sometime late next week. But with the way things are going in the world right now that seems like an age away and I’m afraid my little article will seem a fly speck.
LeeG,
I just saw your question on the last post.
I don’t think any regime will change from air strikes. In this particular case, I think defection from the army and IRGC would be the key point. These people have kids which have no future in Iran due to the economic mismanagement and an outdated ideology. So if regime does change it will be from large scale defection.
This scenario would be ideal for the U.S, Israel and the wests since they wouldn’t really have to put any boots on the ground.
No idea how it will play out though.
Hi Iron Mike,
You were concerned about the extreme religious views in Iran. The article below suggests this is a problem on both sides.
https://www.theguardian.com/world/2026/mar/03/us-israel-iran-war-christian-rhetoric?utm_source=firefox-newtab-en-us
Some thoughts, Iron Mike
– Cruelty and economic mismanagement do not doom repressive regimes. They can continue on for decades, even if it it is in practically everyone’s best interests to change.
– Terrorizing the populace with bombing raids is not an effective means of turning the country against its government. It can even have the opposite effect.
– Boots on the ground is a terrible idea. Iran is about four times the area of Iraq and double the population. And America has no plan.
– Without something to rally around, there will be no revolution. People need something to defect to, regardless of how bad. That’s how the current Iranian regime got in. People rallied around the mad mullahs to get rid of the self-styled Shah. They didn’t want the mullahs, they just wanted change, and grasped at straws. What straws do Iranians have now?
DC,
You are opening up a can of worms here and this is not the place for a dialogue on religious theology. So ill keep it short (as possible).
The figure head of Christianity, Jesus, was not a violent figure. If you look at his main teachings it is mostly about loving one another and being kind to one another. Generally a much more wholesome teachings in my opinion. Very similar to Hindu and Buddhist philosophy actually. I wouldn’t be surprised if he travelled to India in his early years.
The figure head of Islam, Muhammad. It is hard to deny he wasn’t violent. The whole religion was spread by the sword. Not to mention the pedophilia aspect of it among a lot of things wrong within the core teaching of the religion.
Now lets get to the followers, human nature is violent and a lot of people have used religion as an excuse to kill what they perceive to be an infidel or a heretic. Christianity being older killed a lot more people than Islam has. Majority of which was done arguably in the dark ages of Europe. But they had their reformation, renaissance followed by the enlightenment period which set the core values of western civilisation. Islam hasn’t had any of that yet.
To the article, yes Christian and in this case Zionist fundamentalists probably look at this event as some end of the world scenario. Funny thing is so the the Islamic regime of Iran (Shia). They think Imam Mahdi will come and save them from the ‘great satan’.
Is one more dangerous than the other. Yes Islam is more dangerous from my perspective, growing up in Iran these people are mentally ill beyond what you can comprehend, go look at the ceremony of Ashura, they take one historical event which may or may not have happen and hinge a whole cult mentality on it by self-flagellation, though admittedly they reformed that in some parts but it still happens. The other side is sick too, but at least it no longer enforces its beliefs onto others. (anymore)
Finally, Islam does not fit WHATSOEVER with western civilisation values. You guys have no clue in the west, but the people who ACTUALLY follow Islam are Islamic State, Taliban, Islamic regime in Iran and what the west calls terrorist organisations. They actually follow what is said by the book.
The rest is what i’d call good muslims. And they are good because they don’t follow everything by the book whether knowingly or unknowingly.
Alim,
You opened a can of worms too so I am going to attempt at addressing some of the points you made. You might not know the intricate domestic issues and looking at it from a wholly outside lens.
– Yes 47 years of gross mismanagement and corruption didn’t doom the Iranian regime. The final straw was economic initially. Which started early January. 1 USD ~ 140,000 IRR. Finally the hyperinflation straw broke the camels back. Even the Baazaris joined the protests which is very rare since they are traditionally very pro-regime.
Now after the protests gained some real momentum and even took over some institutions such as police stations etc, Trump tweeted to the Iranian people take over your institutions help is on the way. The next day almost everyone was on the streets, the regime realised they cannot control this, so they shut the internet off and started killing people. They committed a mass genocide, they killed easily between 30k-60k people within a week. Most of the people under 30.
This was their attitude to the parents who were looking for their kids. You want to see if you kid is dead, you need to pay a fee for the bullets used to kill them + storage fees, then go through a whole factory worth of body bags and check whether they are in one of them. There was still people alive in the body bags for days. They went to hospitals and finished some of the injured off too. I’ve had second hand account of this from relatives and friends there. This is no exaggeration.
Now you tell me whether a regime can survive, doing this to its own people ?
To your second point. In the 12 day war, yes you are correct. After the genocide, the hatred of the people grew exponentially for this regime, a huge majority supported this move by Bibi and Trump with open arms. Especially the younger cohort which are the majority demographically in Iran.
I agree boots on the ground is horrible. I have no idea like everyone else how this thing is going to play out.
Your last point. I think Iranians look at their neighbours in the Gulf and are like why can’t we be like them ? I don’t think they necessarily want democracy, they want economic stability and a higher standard of living. Both of which is possible, Iran is a country full of wealth and resources. It has a strong sense of history and could have a bright future given proper government and leadership. But first you need a government who loves their country, countrymen and women. For 47 years this regime showed nothing but contempt and hatred towards its own people.
Iron Mike —
Trump is hoping for an uprising, but as Hillary Clinton put it, hope is not a strategy. Bush had the same hope in Iraq and Afghanistan.
The Kurds are now invading Iran from Iraq, to extend their autonomy there. Other than that, we’ll have to wait and see. A civil war is probably the “best” result Trump can realistically hope for.
Thank you for your perspectives Iron Mike. Being the only one here from Iran (that I know of) I take your comments most seriously. Although I do realize that with over 90 million people living in Iran that there are also millions of opinions/perspectives. People who are not from Iran should realize that it is a very big country, with population greater than Calif, NY and Texas combined. Just think of all the various opinions residing in those states.
i offer up an opinion that isn’t often expressed- The people of Iran, Palestine and Israel would all be much better off if the Islamic Republic of Iran (IRI) gave up its paramount mission of eradicating/eliminating/ entirely destroying Israel. Over the last 47 years the ‘shadow of annihilation’ over Israel has enabled a much more fundamentalist and nationalist movement within Israel to dominate the local politics and policy. Chances of negotiated two state solution to that extremely unfortunate situation have been severely diminished by the pressure applied from Iran. Now very few Palestinians and Israelis can envision any kind of reasonable coexistence, with ‘one state’ outcomes having gained predominance. People on both sides are desperate for security and sovereignty, but a pathway for both to have some of that is very hard to see.
For the IRI its a religious war against Israel. In the long history of Persia it has been very rare to fight on behalf of Arabs, Turks, or Kurds. Rather they have almost always been in military opposition to these other ethnic groups as territorial or cultural threats. The last war in the 1980’s Iraq attacked Iran, with Iran suffering somewhere between 250 and 750,000 deaths.
Iran, along with Palestinians/Lebanese (courtesy of Hezbollah) and Israel, will continue to suffer until the IRI abandons Islamic version of a crusader religious war on a country 1000 mile away, its look like to me.
Hi Hickory,
I agree with everything you’ve said. From the start they announced their enemy is the U.S and Israel which they declared has to be eradicated from the map.
A regime replacement which drops these ridiculous death cult ideologies would be beneficial both domestically and international.
I was born during the Iran-Iraq war, I still remember it, absolutely horrible. Prior to the revolution the Shah’s policy was one of low population growth if any. He actively encouraged people to have less kids.
Post revolution Khomeini dismantled the Shah’s family planning program, calling it a Western plot. They encouraged large families to build an “army of 20 million,” leading to a massive population boom.
During the war they brainwashed young soldiers and glorified martyrdom, they would organise sprint races for the youngsters and have them run across mine fields many died or were permanently injured as a result.
A horrible evil regime from the start to finish.
In Hoc Anno Domini – Vermont Royster (former WSJ Editor)
When Saul of Tarsus set out on his journey to Damascus the whole of the known world lay in bondage. There was one state, and it was Rome. There was one master for it all, and he was Tiberius Caesar. Everywhere there was civil order, for the arm of the Roman law was long. Everywhere there was stability, in government and in society, for the centurions saw that it was so. But everywhere there was something else, too. There was oppression — for those who were not the friends of Tiberius Caesar. There was the tax gatherer to take the grain from the fields and the flax from the spindle to feed the legions or to fill the hungry treasury from which divine Caesar gave largess to the people. There was the impressor to find recruits for the circuses. There were executioners to quiet those whom the Emperor proscribed. What was a man for but to serve Caesar? There was the persecution of men who dared think differently, who heard strange voices or read strange manuscripts. There was enslavement of men whose tribes came not from Rome, disdain for those who did not have the familiar visage. And most of all, there was everywhere a contempt for human life. What, to the strong, was one man more or less in a crowded world? Then, of a sudden, there was a light in the world, and a man from Galilee saying, Render unto Caesar the things which are Caesar’s and unto God the things that are God’s.
… and unto Trump that are Trump’s
@Matt staben
Do you realize Rome has been at war with Iran (Parthes then Sassanide Empires) for 700 years ? And never conquered it ? (even if the Trajan column is one of the most recognized antique monument in Rome today ..)
As to the current war, a few key things I don’t see discussed a lot, not sure why :
– US interests in changing the regime go far beyond security concerns for the US and Israel (which of course are real, not to mention the expansionist nature of the regime through Hezbollah, Houthis , etc)
– These interests mainly center on Oil (but not only, 80 millions people is a big market), and made even more critical considering US tight oil is peaking or is about peaking. Moreover if the regime isn’t toppled, none of these benefits will be “cashed in” (and Iran could go in the Chinese influence sphere).
– This clearly is hard to sell to Trump electorate and Maga crowd, which I guess is persuaded the US is still full of oil, when they don’t believe in abiotic oil and other non sense. That electorate thinks the US could just rely on its own resource and is doing that war out of good will for the Iranian people, Israel interests only or something.
– As to Trump himself, I really don’t know to what extend he is aware of the oil situation (would be interested to know what people think on this point here), but I guess people like Rex Tillerson gave him a few hints during his first mandate. One thing for sure in his speech (more than 1 hour) after the Maduro story he was very blunt and direct : He spoke about oil, getting back the oil etc around 20 times, and about the drug story with Maduro as a drug kingpin 3 or 4 times. Same during his speech at the UN, Energy was all over the place.
– I don’t see the Iranian people being mentioned much in the context of the ongoing war, although I’m quite confident they will be instrumental in toppling the regime, this is more a liberation war than anything else, and don’t forget the 79 revolution was a kind of strange alliance between “communist” /”lefties” and “Islamists/religious”, the communist/lefties having been wiped out after Khomeiny settled. Iranian didn’t forget about that.
From the Mullah’s own figures, 60% of mosques have closed in Iran for lack of people going to them.
– If a secular democracy (parliementary monarchy or republic) can be a reality in the region, Iran is clearly, and by FAR, the best candidate.
US tight oil centered 12 month average in chart at link below.
Getting close to peak tight oil.
tight oil 2603
Dennis
You usually project out a couple of years. Give it a shot.
Hi Ovi,
The projection would depend on future oil prices. Currently that is difficult to predict. If we use the futures curve for Brent Crude as a guide (price in the range of 67 to 68 per barrel from 2027 to 2033) the following scenario linked below would be my guess. Cumulative tight oil production through Jan 2026 is about 34 Gb, cumulative output reaches 37.5 Gb in Feb 2027 (50% of URR for scenario).
tight scen 2603
Dennis
What is the main factor driving oil production down after the peak. Fewer Tier 1 wells, completions due to WTI price, other
Can you make a simulation with 90-100 $ a barrel? Thanks
Ovi,
Short answer is falling profits.
Falling new well productivity per 1000 feet of lateral length has been occurring in the Permian Basin since 2017. I assume this continues as fewer locations remain in tier 1 and tier 2 areas and a larger proportion of well completions occur in tier 3 and higher (4 and 5) areas of the play. I also assume a similar phenomenon occurs in all other US tight oil plays over time. At about $63/b at well head (due to $5/b transport cost to refineries or export hubs) and under $4/MCF (based on futures curve) and with NGL typically at 30% of crude price, fewer wells are completed due to lack of profitability in this scenario.
GigiB,
The spike in price is due to the war premium, doubtful that prices will remain at $95/bo long term. Current futures curve has Brent back to $69/b in July 2027, see
https://www.cmegroup.com/markets/energy/crude-oil/brent-crude-oil.html
Dec 2033 at about $69/b, if we account for inflation, this would be about $61/b in 2025 US$, accounting for $5/b transport cost, the producer would see $56/b in 2025 US$ at the well head and would not see any profits. For this reason completion rate will fall.
Several outlets reporting Iraq is out of storage and has shut in 1.5 million BOPD.
Further that Kuwait will be out of room by 3-18.
Also reading Trump’s plan for opening the Strait not as simple as it seems.
Shallow,
There is absolutely NO way on God’s green earth that ships will get through Hormuz if the Iranians disallow it.
For about a year and a half, Ansar Allah (aka the Houthis) cut off access through the Suez/Red Sea and their ‘navy’ consisted of no more than a handful of high speed boats.
Not wanting to get political here, but suggestions of effectively forcing Hormuz access are beyond delusional.
(Hydrocarbons aside, something like 60/80 percent of the food consumed in the Gulf area is transported through the Strait.)
I’m not seeing any sign of careful contingency plans here. Any strategist (heck, any chess player) knows that you have to anticipate your opponent’s plans and have answers to them.
I’ve seen comments that Iran will suffer from closing the Strait, or that China will object. Well, I’ve been watching the ship traffic, and it looks like Iranian and Chinese flagged ships are going through just fine. The only other ship is adrift and on fire…
https://www.bloomberg.com/news/articles/2026-03-05/china-tells-top-refiners-to-suspend-diesel-and-gasoline-exports
https://www.independent.co.uk/news/world/europe/ukraine-submarine-russia-black-sea-attack-b2885582.html
Ukraine sunk a docked Russian submarine with an underwater drone.
I’m now reading that Iran has underwater drones.
I can see how you can shoot down an aerial drone.
But an underwater one??????
Can oil and shipping vessels defend against this?
Nick G,
Trump is notoriously impulsive. He has not thought thru any of this thru.
He just wants results that make him look good, make him money and who cares about anyone else.
And when the results are terrible he blames other people.
https://asiatimes.com/2026/03/us-troops-were-told-iran-war-is-for-armageddon-return-of-jesus/
Hegseth is a “Rapture Ready” Christian. He wants the end times to come. (i’m not saying I think will become that bad)
shallow sand —
America (and the rest of NATO) really isn’t prepared for the new droned based warfare that is developing in Ukraine. The key is flooding the skies with cheap potentially harmful objects, like a swarm of bees. Iran has been part of that.
I suspect just threatening to shut down the Straits is deterrent enough for most insurers. Container ship have been avoiding the Black Sea since Putin invaded Crimea, so Russia gets its shipments from the Far East via Petersburg.
Interestingly, Ukraine has started reaching out to the Gulf Arabs offering to sell them protection against Iranian drones in exchange for war funding. America can’t or at least won’t protect its “allies” there.
Ovi,
Copy and Paste Andre’s WTI prediction from last year to this year.
Award me the TITLE BELT.
117 WTI end of year, 100 average
– Trump going after Iran for revenge for assasination
– Declining permian
Missed it by a few months.
https://oilprice.com/Energy/Crude-Oil/Iraqi-Supply-Loss-Could-Expose-the-Real-Limits-of-OPEC-Spare-Capacity.html
Asia is nothing without Middle East oil. Example Australia
2 March 2026
Australia’s diesel import dependency on Strait of Hormuz is around 50%. Update with Dec 2025 data
https://crudeoilpeak.info/australias-diesel-import-dependency-on-strait-of-hormuz-is-around-50
This should make more people start choosing to electrify their transportation and kick the oil habit. China is showing the way, at 50% market share. Norwegians have pretty much stopped buying ICE vehicles. Ethiopia has banned the import of ICE vehicles (not next year,not in 2035, but right now).
Australia’s EV sales grew 38% in 2025, reaching 13% market share. 4 years of growth at that rate gets you to 50% share.
Looks like the refinery in Bahrain just got hit with a missile.
Refined output about 350,000 bbld.
Details sketchy/conflicting but the videos that I have seen show a very large fire.
Things appear to be escalating rapidly.
And yet WTI is only at $79, and Brent at $84. Traders seem to be pricing in the war slower than I would have expected.
Hmmm…
The code name is “Epic Fury”, which is the politically correct way of saying “Temper Tantrum”.
There may be unexpected consequences, as nobody actually thought this through in advance.
Nick G,
… and a day later, WTI is $91.
I’m no fan of conspiracy theories, but I can’t help thinking that the guy who comes up with the stupid “operation” names was having a little fun at Trump’s expense. “Epic Fury” is awful close to “epic failure”, and the initials EF also stand for “Epstein Files”. These jokes just write themselves.
Interesting perspective to consider. The China angle to the Iran conflict
https://substack.com/home/post/p-189459055
meanwhile-
BYD’s New Flagship EV SUV Blows The Competition Out Of The Water-
The BYD Great Tang gets a 1,000-volt architecture, 1,500-kilowatt charging, and nearly 600 miles of range.
https://insideevs.com/news/789214/byd-great-tang-ev-suv-ultra-fast-charging-range/
Or perhaps you’d prefer a Buick-
A plug-in hybrid Buick minivan is now the world’s longest-range multi-purpose vehicle. [available in China]
https://insideevs.com/news/789066/buick-gl8-ls-phev-range-record-china/
Worthwhile article but the last sentence is a head scratcher.
“ Trump’s strikes are the first move by an American president who appears to understand that the road to the Pacific runs through Tehran.”
1. implying that Donald is implementing a long range strategy isn’t supported by his words or actions as much as he is a useful tool for powerful interests.
2. Demonizing Iran and China isn’t a realistic path to promoting the general welfare in the US.
LeeG- I agree with your point/s.
Bessent is going to use US taxpayer dollars to intervene in the crude oil futures market.
You just cannot underestimate the lengths the administration will go with our money. Costing us almost $1 billion per day on this war, and that doesn’t count the F-15’s Kuwait shot down, nor the billion dollar radar destroyed by an Iranian drone.
Brent May futures contract now at about $89/bo.
Looks Like $100 Oil Comes In A Few Days At This Rate
According to a JP Morgan analyst, after the next three days, we will enter into a Commodity Crisis, led by Oil. Even the coal price is up 17% over the past 4-5 days.
Furthermore, the damage done to the U.S. Military Bases in the Middle East is far more extensive than we hear from the MSM, an estimated $2 billion in damages in just the first two days of the war.
I’ve seen estimates on the Boob Tube that the U.S. Military is spending ~$1 billion a Day in this War, which already has cost $4 billion.
How many more days before this situation in the Middle East really gets out of control??
steve
Interesting graphs on US gasoline consumption
https://wolfstreet.com/2026/03/04/u-s-gasoline-demand-fell-further-amid-long-term-structural-shift-plunging-per-capita-consumption/
Yes, we’ve seen peak ICE vehicle in the US and in the world.
” In 2020, the US became a net exporter of crude oil and petroleum products, exporting more than importing. “
Always find this interesting considering extraction is 13 million barrels while consumption is 20 million.
Paul,
We tend to focus on crude and condensate on POB, to have consistency in analysis. Most people include any liquids you can burn (or convert into something else useful…). That gets you to: Total Petroleum Production: Approx. 21.69 million b/d (2023 data).
That total includes:
C & C: Record-high production reaching 13.4–13.6 million b/d in 2024–2025.
Natural Gas Plant Liquids (NGPLs): 6.43 million b/d.
Biofuels & Others: 1.3 million b/d.
Refinery Processing Gain: ~1 million b/d
Roughly half of NGLs are exported. That more than accounts for positive net exports.
Paul,
Consumption of C+C is about 16 Mb/d (input of crude oil to refineries), so for C+C, US net imports of C+C are about 2 to 3 Mb/d. The claim by some that the US is a net exporter of oil is false, the US is a net exporter of NGL.
Agree. Just find it interesting in that the caveats are never mentioned, and how the public is always lead to believe that the USA is in any way self-sufficient. And it will only get worse.
Paul, DC,
Crude is cheaper than refined products. The US has a fairly significant positive balance of trade in liquid fuels. That means that when the price of oil jumps, the US benefits.
That’s an important factor in this situation.
Paul,
I was watching Morning Joe and even their stats guy didn’t understand this, he was claiming the US is a net exporter because he doesn’t realize that C+C is the crucial liquid that is actually “oil”. When you look at net imports of US C+C you find the US imports less than in 2005 to 2008 when it was about 10 Mb/d, but we still import more C+C than we export and many are not aware of this. See chart at second link below from first link below
https://www.eia.gov/dnav/pet/hist/LeafHandler.ashx?n=PET&s=MCRNTUS2&f=M
chart(117)
Nick G,
Keep in mind that a large proportion of those “liquid fuels exports” are propane, ethane, and butane, essentially bottled gas. The prices of these gas products are not really linked to crude prices, it is a separate market.
We do have some net exports of gasoline, diesel, and jet fuel, on the order of 1.8 Mb/d in 2025 out of roughly 4.98 Mb/d for all products. But when we look at crude plus products the net exports falls to 2.8 Mb/d because we had net imports of about 2.2 Mb/d of C+C in 2025. About 2.9 Mb/d of the net exports were hydrocarbon Gas liquids (essentially the product form of NGL).
Yes there is a markup for refining crude into gasoline, diesel and jet fuel so the exports of the crude oil products will bring some profits to the refiners on their imported oil.
Also keep in mind that higher crude prices tend to increase the prices of refined products in the US and this tends to be inflationary in the domestic market.
Dennis,
I agree with your points but…we still have a noticeable dollar surplus in petroleum products. We’re the mirror image of Mexico, which is also a net exporter of petroleum products, but exports crude and imports refined products which means they have a dollar trade deficit.
And, yes, higher crude prices increase refined products prices in the US, but it doesn’t bleed into non-energy inflation much. It does increase the CPI (about 9% of the CPI is energy), but the Fed ignores that these days in favor of core CPI and PCE, unlike in the 1970s.
Sadly, oil companies don’t care about inflation, and Texans don’t worry about the effect of high prices on oil importing US states. The oil industry has bought this presidency – we know because it was for sale, and the purchase was right out in the open.
At the end of the day, this is not the 1970’s, in many ways. Fortunately, one important difference is that there are very clear and superior substitutes for oil and FF, and this war will accelerate the transition to them. That’s a fairly big silver lining.
Nick,
Oil prices do bleed into other sectors as oil products are used to transport goods and people driving up both prices and wages which leads to inflation. Also in the news cycle it is the headline inflation that tends to be reported and that includes energy prices. To politicians the price at the gas pump is quite important as the majority of consumers continue to use ice powered transport.
I agree there is a dollar surplus in petroleum products as one would expect because there is a cost to refine crude into products, in volume terms the net exports in products from crude is similar to the net imports of crude, and products have a higher value.
If one is focused on trade deficits like Trump, this is important. Most economists would say this is of third order importance.
Yes, the amount of money that flows in or out of the US is now a 3rd order effect. 50 years ago it was a 1st order effect.
OTOH, you’re focusing on the real problem: US consumers. Very large amounts of money are flowing out of the pockets of consumers, into the pockets of producers. Sadly, the US car industry has managed to con consumers into buying low-mileage high-profit status symbols.
US oil producers are rushing to lock in higher prices by hedging. Is this raising production?
I’m surprised that prices aren’t rising faster. Is this surge in hedging helping to hold down the rate of increase in prices, at least temporarily?
https://www.reuters.com/business/energy/investors-us-crude-producers-scramble-lock-oil-price-spike-2026-03-03/
Rig Report for the Week Ending March 6
The rig count drop that started in early April 2025 when 450 rigs were operating rose for the third consecutive week this week. Drilling continues at a steady rate of 365 ± 5 rigs per week since August 2025. However this week the rig count spiked up and WTI closed above $90/b.
– US Hz oil rigs rose by 5 to 371, down 79 since April 2025 when it was 450. It was also up 9 rig from the low of 362 first reached in the week ending August 1. The rig count is down 17.5% since April 2025.
– New Mexico Permian was unchanged at 91. Eddy and Lea held steady at 33 and 58 respectively.
– Texas added 5 to 170. Midland and Martin both dropped 1 to 21 and 23 respectively. Andrews, Dimmit and Upton added 2 each while Ector added 3. A couple of counties dropped 1 each.
– Eagle Ford added 3 to 31.
– NG Hz rigs dropped by 3 to 112.
A rig
Frac Spread Report for the Week Ending March 6
The frac spread count rose by 3 to 170. From one year ago, it is down by 40 spreads and is down by 45 since March 28.
A frac
WTI since January 2023
Companies that were producing 1 Mb/d on December 16, 2025 are making an extra $35 M/d or an extra $1 B/mth.
However some OPEC countries now have to limit production because of the closing of the Straits of Hormuz.
Iran war forces OPEC nation to limit oil production
https://www.independent.co.uk/news/world/middle-east/kuwait-oil-iran-war-trump-b2933548.html
A WTI
Ovi,
Producers may not increase drilling or completion until they see oil prices maintained at some level for a few months. The futures market suggests most who trade the futures contract believe this price increase will be temporary. Producers are likely to just collect the profits for now and wait to see what happens in the future.
Dennis
I was surprised to see the jump of five rigs last week. Let’s see if it jumps again next week. That will give some idea of whether a $25/b increase in WTI brings on more rigs.
exploration drilling exploded 2 months ago, obviously they had inside note from Trump
Ovi,
We will need to wait and see if the increase in rigs continues. Many producers may not be willing to bring more rigs online if they believe the current price increase will be short lived.
At $95/b for crude and NGL at 30% of crude price and natural gas at $4/MCF, the average Permian well for a high price scenario ($95/b) in 2035 falls to 355 kb of crude over the life of a new well. Such a well at these prices has an average annual return of 2% per year over a 15 year well life, this barely keeps up with inflation and for my scenario, the completion rate starts to decrease in late 2035. Permian high price model below.
permian high price 2603
355kbo EUR + gas and NGL EUR at $95 WTI is total $35million+?
How could the return still so miserable?
The majority of the EUR is front loaded in first 5~6 years, so the return should be even better.
Sheng Wu,
Over the first 5 to 6 years the capital cost is being paid off. I take net revenue over the life of the well and divide by capital cost. The total return is averaged over the 15 year life of the well. The average return over 15 years is about 2% per year.
Sheng Wu,
There are royalty payments, severance taxes, operating costs, overhead, transportation costs and downhole maintenance over the life of the well and then plugging costs at end of life. Gross revenue is not very important, it is the discounted net revenue over the life of the well that matters.
Also not likely that oil price remains at $95/b for 15 years, so the $95/b price assumption for 15 years is very optimistic.
Permian low price scenario for comparison, URR is about 11 Gb (20%) less than high price scenario. Low price=$65/b, high price=$95/b. both in 2025$.
Note that this low price scenario is probably on the optimistic side. At low prices the completion rate may decrease far more rapidly than I propose in this scenario.
permian low price2603
Looks like the Tondgouyan refinery just outside Tehran has been attacked.
Reciprocal – as in targeting regional energy infrastructure – seems to be both a logical and imminent response.
Coupled with reports of the bombing of a somewhat small water desalination plant (in southern Iran, IIRC), the rapidly unfolding events are spiraling downwards into the realm of global chaos unimaginable just a short time ago.
Buckle. The. Fuck. Up.
Iran is shelling back with cluster bomb
Alternative low price Permian scenario with lower completion rate. URR=37 Gb see link below. This scenario seems more realistic for oil prices at $65/b in 2025$ (pre-war oil price).
permian low priceb 2603
Kuwait declares force majeure, cuts crude oil output due to Middle East conflict
March 7 (Reuters) – Kuwait Petroleum Corporation began cutting oil output on Saturday and declared force majeure, adding to earlier oil and gas reductions from Iraq and Qatar as the U.S.-Iran war blocked shipments from the Middle East for the eighth consecutive day.
————————
Looks like $100 Oil is likely a done deal Sunday-Monday.
How do we get to $150-$200 Oil? Send in the U.S. Marines.
steve
https://mishtalk.com/economics/kuwait-petroleum-declares-force-majeure-on-sales-of-oil-and-refinery-products/
Mish is doing some good reporting on this as well.
Underwater sea drones. Can’t be stopped by commercial vessels.
And they are relativeily cheap…there in lies the very scary problem….
(unlike a submarine)
Maybe the US Navy can send an electromagnetic weapon down there….but unintended consequences?
Off ramps?
Most oil importing countries are going to get extremely hot and bothered by a shutdown of the Strait of Hormuz and damaged oil export facilities in the Gulf, within a few weeks.
The international pressure on Iran to allow shipping, and on the US/Israel to halt attempts at wholesale regime change is going to ramp up big time, soon. But neither of these three entities will have what they vehemently desire.
It is highly doubtful that a bombing campaign will get the IRI and its fervent supporters to fade into the woodwork and allow other factions to slide into control. They will ride things out for a very long time, short of a massive invasion or wholesale civil war involving millions. That latter scenario will be a very long bloodbath, and both scenarios do not allow a quick return to safe shipping.
Can anyone be confident that the IRI and its supporters (5-30 million) will give up on the United Islamic Republic project, and the goal of eradicating Israel from all maps. I can’t see it.
And I don’t see the people of Israel learning to live with the perpetual threat of annihilation without putting up a massive fight for survival to the very end.
So, does anyone really see a way that oil, nat gas and commodities will flow from the Persian/Arabian Gulf anytime soon?
______________________________________________
“The Gulf of Arabia (Persian Gulf) is a critical source for global commodities, with over 5 million metric tons of primary aluminum (roughly 8-10% of global supply) and roughly 33% of the world’s fertilizer supply transiting the Strait of Hormuz. Major exporters include Saudi Arabia, UAE, Qatar, and Iran, with significant, amounts of nitrogen fertilizers and aluminum shipped to Asia, Europe, and the US.”
Side effect- there will be big pressure to for Ukraine to capitulate to Russian territorial annexation, so that Russian export commodities can be rapidly de-sanctioned.
Hickory,
“… within a few weeks”.
Already, ~8,000 miles from Hormuz, the large diesel distributor in Brisbane has halted sales to customers who do not have contracts.
This imperils food production from this high yielding, very fertile region.
Reports coming out that Oz may be completely out of diesel, avgas and petrol this time next month.
Global ramifications of current events are as imminent as they are profoundly disrupting.
This author hits a lot of nails directly on the head, worth considering all the points made-
https://substack.com/home/post/p-190073150?source=queue
‘Faced with the reality of foreign bombs, the Iranian populace prioritizes national survival over political reform.’
https://x.com/femmeazadi/status/2032571136311951517
The Longer The US-Israel-Iran War Lasts, The Worse It Will Be For The Global Economy
The reason I say that is because the U.S. is sitting on the Edge of a Massive AI-Bubble Recession, which looks like it has already started with the 92,000 job losses as just one indicator.
According to Bloomberg:
Oracle and OpenAI End Plans to Expand Flagship Data Center
Oracle Corp. and OpenAI have scrapped plans to expand a flagship artificial intelligence data center in Texas after negotiations dragged over financing and OpenAI’s changing needs.
——————
Supposedly, Meta wants to step in and snatch up excess AI Capacity. This will be a Big Mistake for Meta, but there isn’t much wisdom today in High-Tech.
Watch as more Large AI Data Center Projects get cancelled as completed projects go bankrupt in the years ahead. Unfortunately, the market, except for a few wise individuals, doesn’t realize AI ain’t AI; it’s lame LLMs that don’t really live up to the promises made.
Even if LLMs did efficiencies, like Coding, the cost of LLMs isn’t profitable. Thus, the market will figure this out shortly.
Now… with this AI-High-Tech HPC-Bitcoin Bubble being a large percentage of U.S. GDP, the coming Gutting of the Global Economy from the massive disruption of the US-Israel-Iran War, then the Recession and Stock Market Selloff will be much worse… thanks to the current Trump Administration.
Oh, I forgot… Cuba is Next. LOL, what an insane asylum running the show.
Grab Your Popcorn…
steve
Oil futures up 20% and hauling ass.
lol, everything is so stupid.
Kleiber,
Yeah, oil markets have been open barely a half hour as I type this (they open 1800/6 PM now eastern daylight time) and Brent spot price shot up from ~$92 to over $107 from Friday’s close.
Quick edit …
As I was typing the above sentence, I went back to the open ‘Oil Price dotcom’ tab and hit refresh.
Sunuvagun … price for both Brent and WTI are now well above $108 with WTI actually higher.
… Yeah, gotta stop now as prices are over $109 as I keep typing.
For any and every one who might be reading, to say we are in absolutely uncharted territory would be to state the obvious.
Sincere good luck wishes to all.
WTI $118
Only matters where it closes tomorrow afternoon though. Might close higher, might close lower.
WTI was above Brent. At least for a few minutes. Nothing inflationary about this. This is the setup for a hard recession.
There will be a mad rush for dollars soon if this keeps going. Forced selling of other stuff to get dollars that is.
That forced selling may or might not include government bonds, gold, Swiss francs are down rather sharply. Because there are plenty of dollars piled up in the Swiss banking system. The Franc usually acts as a safe haven. Not so safe when liquidity disappears and you have to get dollars wherever possible.
• South Korean President Lee Jae Myung is arguing that his country “should not merely endure the recent global oil price surge and fossil fuel supply chain crisis—triggered by the Iran situation—but instead use this as a pivotal moment to completely overhaul its national energy structure,” the Chosun Daily reports.
“I think this would be a good opportunity to swiftly and extensively transition to renewable energy,” he said.
• UK Business Secretary Peter Kyle announced that the country would accelerate its net-zero strategy, emphasizing “that accelerating the deployment of renewable energy technologies, such as offshore wind and solar power, will help reduce Britain’s reliance on oil and gas imports from politically unstable regions,” London Loves Business writes.
“Doubling down on renewables is, yes, right for climate change, it’s, yes, right for jobs,” Kyle said. “It is also essential because we keep on seeing these lived examples of how instability, through regional instability, is creeping into our energy prices, for which the British government has no agency.”
• Energy Transition Africa says the first attacks on Iran changed the continent’s transition debate overnight. “The first alert didn’t come from a climate report, but from the market,” the organization recounts, with crude oil prices surging on even the possibility that Middle East shipments would be disrupted.
The week’s events have African governments and investors “once again prioritizing a question that climate narratives sometimes treat as secondary,” the independent media platfom adds: “Can an energy system keep functioning under geopolitical stress? The shift is subtle but decisive: transition is increasingly framed as security-aware electrification, not only climate-aligned decarbonization.”
G7 coordinated SPR release has gotten WTI futures to drop about $20.
Will drop US SPR to about 300 million, maybe less.
Trump only added 20 million back during his Presidency. Biden had added back 48 million after dropping it to a low of 347 million.
The SPR provides about a 450 day cushion (assuming 20% loss of crude barrels flowing through Hormuz and assuming 90 day supply of 100% of crude demand). So maybe we are ok for 15 months, not clear the objectives in Iran are achieved in that time frame.
The Biden drawdown was determined by laws passed by Congress and signed into law by Trump and Obama in his first administration (though Biden accelerated the timing).
Iran very likely won’t open the strait again until the US has removed all bases (what’s left) and Israel disarms. Otherwise, open season on any ship going through.
France has announced two frigates to go open the thing. Uh, good luck.
A big factor in how this all progresses (Hormuz) is just how many missiles and drones that Iran still has left, and how quick their manufacturing pace is for stockpile replenishment.
Also- mine-laying ships, subs and waterborne drones.
I have seen various reports over the past week about these capabilities being heavily targeted by the US and Israel.
And the discussion already is that the USA is “running out of ammo” — this is just so bizarre considering how much is spent on defense. Realize that without ammo, there really is no military, you can have the fastest jets but that won’t matter without ammo.
Venezuela oil ramp up could be super fast, just 10 shipments of 1million barrel of condensate in a month, and could bring out 1million barrels of heavy crude each day.
https://www.reuters.com/business/energy/venezuelan-oil-output-could-return-pre-blockade-level-by-mid-2026-eia-says-2026-02-10/
Paul,
Apparently the US military, left fairly incompetent by the political purges by the current president, didn’t notice that Iran had a very large supply of effective drones. They should have known, as it became quite clear in Ukraine. So, these cheap drones are being stopped by very expensive precision ordnance, which is somewhat limited in supply.
It’s an asymmetrical war of attrition which the US was not prepared for, in part because this is a capricious, unplanned military adventure which is very likely intended as political theatre for the US mid-terms.
The Iranians know this, and they’re determined to embarrass the US (and, of course, survive). Of course, the US already looks ridiculous to the rest of the world – the president has literally provided 10 different explanations for this war – so I guess you’d have to say the Iranians are determined to further embarrass the US.
https://oilprice.com/Energy/Crude-Oil/Why-100-Oil-Isnt-Going-to-Spark-a-New-Shale-Boom.html
Brent crude price
brent_crude-2026-03-09
The wild swings in oil prices are typical of Trump’s behavior. In his first term he damaged the car industry severely with erratic trade policies. Specifically he nearly shut down the chips-for-cars industry. It took years to recover, and now he’s back.
This is crashing the economy because if nobody knows what prices are. Even the price of basic materials like steel and lumber are in legal limbo.
The errors are now baked into the system. Imagine you bought imported raw materials for your production from an importer. The importer passed the tariffs on to you, but they are now expecting a refund from the Trump administration. Do you demand a refund from the importer or eat the loss while your competitor buy at the new price? how long will all this take?
Trump illegally grabbed $175 bn and is stonewalling on paying it back. This is typical Trump behavior — delay in court until the problem goes away. He has also introduce new tariffs, which will be challenged in court as well. In the meantime, nobody in America knows the price of any imported goods. Wild swings in oil prices are just compounding the problem.
Yeah, he’s doing enormous damage to the US car industry by pushing them to make low-mileage vehicles. Low mileage vehicles are high profit – it’s very hard for car company execs to say no to investors who want short term profits to fund stock buybacks. They need a government referee that maintains efficiency CAFE rules that push the industry to compete with China. By the time he leaves office China will have taken the export market in the rest of the world, and will be moving in on the US, leaving US car companies as niche manufacturers of ICE vehicles that the rest of the world doesn’t want.
Not just US auto industry, Japan also increased price for basic gas saving cars like Corolla by 50% in the past 6 years in Japan (converted to same USD), while dropping price in China by 35% (converted to same USD), now the difference is almost 50percent (22K USD in Japan and 13K USD in China).
Most of the auto parts are much cheaper in China than the rest of the world, and recently China imposed restriction to Japan industrial products include lots of basic steel parts, like springs, bearings and axle joints, can not believe it!!!!
Guess that the only countries in the west that could produce such basic heavy industry parts at lower cost and large quantity are limited to Korea and Ukraine now.
I’ve been saying for some time that the future of the car industry is Chinese and electric.
All traditional car makers are trapped by the “innovator’s dilemma” — the can only move forward by undermining their current business model.
Alim, my $.02 is that the future of the car industry in the US is fewer cars.
We’re gonna win so much, you may even get tired of winning. And you’ll say, ‘Please, please. It’s too much winning. We can’t take it anymore, Mr. President, it’s too much.
UK want to send 2 AC, and Trump said “no longer needed”
Recent STEO forecast for Brent crude price at chart linked below.
chart(118)
Energy Secretary Wright’s tweet (which was false) really moved the oil market. Same with President Trump’s interview with CBS News.
As I thought it would be, the Strait of Hormuz is the whole deal.
shallow sand,
You are wise, think we may see oil prices continue to rise.
https://oilprice.com/Latest-Energy-News/World-News/Cargo-Ship-Hit-by-Projectile-in-Strait-of-Hormuz-as-Tanker-Crisis-Continues.html
OPEC Big 4 have reduced output by about 5 Mb/d. It will be difficult to replace this oil, though releases from SPR could help. US imported about 6 Mb/d of crude oil in 2025 with about 4.3 Mb/d coming from Canada and Mexico (3.9 Mb/d from Canada). So only 1.7 Mb/d of crude imports from outside North America. The US has about 413 million barrels in SPR so enough for 243 days (8 months) at 2025 average crude consumption assuming crude oil imports from Canada and Mexico remain at 4.3 Mb/d.
Note that Trump has been pissing off our neighbors so it is possible that crude imports from Canada and Mexico may fall in 2026 and beyond.
Also note that if there were no crude oil imports to the US and consumption of crude remains at the 2025 level, the SPR would be depleted in 69 days. Note that the crude oil exports by the US are tight oil which US refinery capacity is unable to handle. Most refinery capacity in the US is designed for heavier grades of crude that must be imported. Hopefully not much of the SPR is tight oil as that would not be useful at present because tight oil output is more than current refinery capacity that can utilize this lighter crude.
https://oilprice.com/Energy/Crude-Oil/What-Can-Saudi-Arabia-Do-to-Stop-Oil-Prices-From-Spiking-Further.html
Short answer is not much. Spare capacity and reserves are far lower than claimed by KSA.
With Hormuz effectively shut, Saudi max export capacity declines roughly 2-3 Mbpd (as does export capability from Kuwait, Iraq, Qatar and much of the UAE).
4-5Mpbd export capacity by Saudi east to west pipeline exists however it may already have been at capacity…on this I have no idea.
So, any spare capacity is a mute point if it can’t be exported.
note- ‘If the Strait of Hormuz closes, the UAE can export approximately
1.5 million barrels of crude oil per day using the Habshan-Fujairah pipeline.’ That export terminal is on the Gulf of Oman about 90 miles south of the narrowest portion of the Strait of Hormuz, but still only 70 miles across from Iran.
Hickory,
Excellent point.
Saudi exports before current crisis were about 6.5 Mb/d and the east-west pipeline will struggle to reach that capacity, nameplate is 5 Mb/d. So it is likely that Saudi exports will decrease by 1.5 Mb/d, UAE can also bypass Hormuz with about 1.5 Mb/d of capacity, so about 8.5 Mb/d of capacity (at 2025 export level of 15 Mb/d of crude flow through Hormuz) is at risk. Approximately 10% of World C+C output. The 400 million barrel release by the IEA recently announced, at 8.5 Mb/d would last about 47 days.
Iran may attack these pipelines in KSA and UAE or the loading terminals, we will see.
Some info in piece linked below
https://houseofsaud.com/aramco-east-west-pipeline-red-sea-yanbu-hormuz-bypass/
Also keep in mind that the countries (IEA) planning to release oil from storage do not necessarily have a big enough spigot capacity to match what supply usually comes through from Gulf. I don’t how much supply they can get to flow to market per day.
Hickory another good point. Thanks.
US SPR currently at 413 Mb has maximum flow of 4.4 Mb/d, all IEA members have SPR of about 1200 Mb, assuming it is a similar rate for all members this suggests about 13 Mb/d maximum flow rate, enough to offset the roughly 8 to 9 Mb/d of Gulf Nation output that must pass through the Strait of Hormuz. The 1200 Mb SPR for all IEA members could offset the crisis for 5 months, but note that China and India are not be part of the IEA and no doubt they also have their own SPR, but they may be getting much of their imports from Russia that are not affected by the current crisis.
https://oilprice.com/Latest-Energy-News/World-News/G7-Backs-Oil-Reserves-Release-to-Curb-Middle-East-Supply-Crunch.html
Using numbers in piece linked above we have about 1800 million barrels in IEA SPR and 20% of World crude output behind Strait of Hormuz so about 16.8 Mb/d (assuming World output of 84 Mb/d). So a release from SPR would cover this loss for about 107 days (less than 4 months) assuming no change in output from other nations not affected by Hormuz. Releasing crude from SPR is a very temporary ( 4 month) solution.
Seems Trump did not really think this through.
Have to think at some point in the near future an international armada will be able to start getting some tankers through.
Still a lot of unknowns here.
Wonder if this is why Gulf OPEC ramped up production ahead of this to cause a surplus?
Also have to wonder about Iranian exports. They have been significant.
Shallow sand,
Iranian oil will get through unless US Navy blocks or seizes the oil, if that happens then Iran will also stop shipping oil. The 20% estimate is total crude flows through Hormuz and probably includes Iranian crude, possible that the 20% refers to crude plus product flow, this is not very clear. An article from EIA in 2023 linked below suggests around 16.4 Mb/d of C+C in 2018 flowed through Hormuz which was about 20% of World output in 2018.
https://www.eia.gov/todayinenergy/detail.php?id=61002
Maybe naval escorts and mine sweepers will get the job done, but still seems the risk may be more than many shipping firms may be unwilling to take unless the transport charges double.
IEA at link below has about 15 Mb/d of C+C transiting via Hormuz, about 18% of the most recent 12 month World C+C output (84 Mb/d).
https://www.iea.org/about/oil-security-and-emergency-response/strait-of-hormuz
Shallow- underwater mines could make the armada attempt a very risky/ineffective endeavor.
May not be nearly as practical/viable as many of us might assume. Estimates are that Iran has over 5000 mines.
I have heard that the US mine sweeping capacity is weak in the region-
https://www.navalnews.com/naval-news/2025/09/combat-ineffective-littoral-combat-ships-are-replacing-mcm-ships-in-bahrain/
https://www.flyingpenguin.com/trump-gutted-the-minesweepers-then-trump-started-the-mine-war/
This is a flow versus stock issue. If the flow of 2 Mbd is reached, then the deficit is still around 4 Mbd.
With chatGPT
1991
Gulf War
~2 million b/d for ~30 days
2005
Hurricane Katrina
~2 million b/d short-term
2011
Libya civil war disruption
~2 million b/d equivalent
There is no viable way to form an armada to escort tankers. It’s a suicide run, even if the US didn’t retire (two months ago!) their last four minesweepers in the ME. Even during the tanker wars, which were nothing like this, an LHD of the USMC almost got sunk.
Professor Korpela,
The US only imports about 2 Mb/d of C+C from nations outside of North America, so the 2 Mb/d release from SPR will cover any deficit from outside of North America for about 6 months. This assumes no change in US C+C imports from Canada and Mexico from the 2025 average level.
Well DC, it´s all well and dandy for the US then, it´s a good thing having the SPR filled up to the brim but there is a world outside that might have opinions on things at the moment…
Several countries have forbidden exports of finished products lately I´ve read btw, might be an issue forwards one would think?
If this conflict results in a big oil spill in the Gulf then desalinization plants could be fouled.
“Gulf countries, including Kuwait, Oman, Qatar, and Saudi Arabia, rely on desalination for a significant portion of their water, ranging from 50% to over 99% of their potable water needs, according to
Alhurra. In Kuwait and Oman, nearly 90% of drinking water is desalinated, while it accounts for 70% in Saudi Arabia.”
GCC countries also discharge vast quantities of raw sewage into the gulf. This is mostly water that has been previously desalinated.
I burn my candle at both ends,
It will not last the night.
But ah my foes and oh my friends,
It gives a lovely light.
— Edna St. Vincent Millay
Reading reports that two tankers are on fire in the Gulf.
Also listened to a retired Navy higher up explain why we won’t be able to open the Strait without a major land invasion.
Which is never happening. Sounds like the idiots who wandered into this could have thought about this problem in the first minute of planning and realised why fifty years of US presidents didn’t attack Iran for this very reason.
Talk about a self own.
https://oilprice.com/Energy/Crude-Oil/Shale-Producers-Stay-on-the-Sidelines-as-Oil-Crisis-Deepens.html
and
https://oilprice.com/Energy/Energy-General/The-Strait-Is-Closed-the-Story-Keeps-Changing-and-Youre-Paying-for-It-All.html
and Brent futures currently trading at about $99/bo
https://x.com/IranObserver0/status/2031868153945317512?ref_src=twsrc%5Etfw%7Ctwcamp%5Etweetembed%7Ctwterm%5E2031868153945317512%7Ctwgr%5Ebb09e1b8c46af974d424bfa7e49e0d53bec2524b%7Ctwcon%5Es1_&ref_url=https%3A%2F%2Fmishtalk.com%2Feconomics%2Fthree-oil-tankers-on-fire-following-trumps-advice-crude-jumps-again%2F
US owned oil tanker sunk by underwater sea drone
Lets be honest and start taking Big Andre’s predictions more seriously.
ANDRE IS BIG
Set on fire by sea drone, not sunk.
Sorry guys Andre isn’t PERFECT with his predictions
An update to World Oil Production has been posted
https://peakoilbarrel.com/november-world-oil-production-slides/
[…] Imagen extraída de la web Peak Oil Barrel. […]
[…] Imagen extraída de la web Peak Oil Barrel. […]
[…] Imagen extraída de la web Peak Oil Barrel. […]