A post by Ovi at peakoilbarrel
All of the oil (C + C) production data for the US state charts comes from the EIAʼs Petroleum Supply monthly PSM. After the production charts, an analysis of three EIA monthly reports projecting future production is provided. The charts below are updated to July 2020 for the 10 largest US oil producing states.
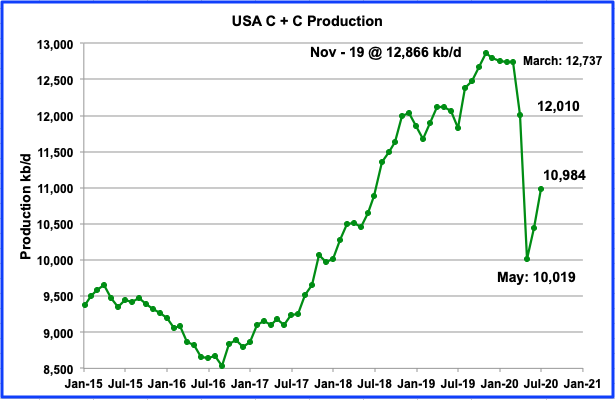
July’s US production continued to rebound from May’s low by adding 538 kb/d to June’s output. Since May, the US has added 965 kb/d, almost 1.0 Mb/d. May’s output was revised up by 3 kb/d from the EIA’s June report.

The US rig count stabilized in September at the 180 level and ended up by increasing to 183 rigs in the week of September 25.
RANKING PRODUCTION FROM US OIL STATES
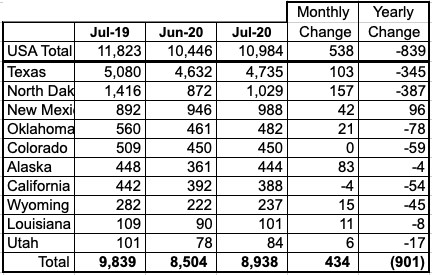
Listed above are the 10 states with production previously greater than 100 kb/d. Over the last few months, both Utah and Louisiana fell below 100 kb/d but Louisiana has now recovered to over 101 kb/d. These 10 accounted for 8,938 kb/d (81.3%) of US production out of a total production of 10,984 kb/d in July 2020. Note that California is the only state where production decreased in July. On a YOY basis, US July production was down by 839 kb/d.
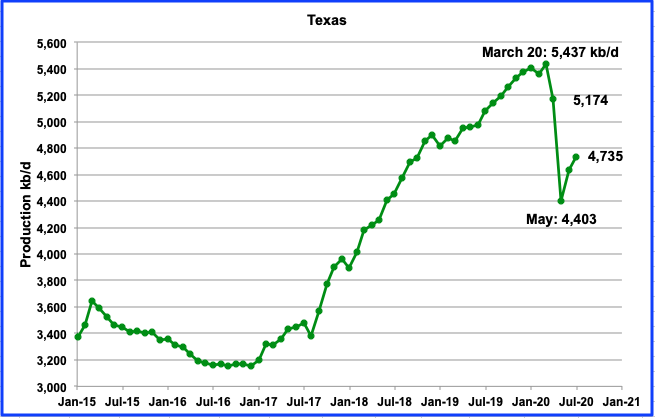
Texas production increased by 103 kb/d to 4,735 kb/d in July. The July output increase was less than half of the 229 kb/d June increase.
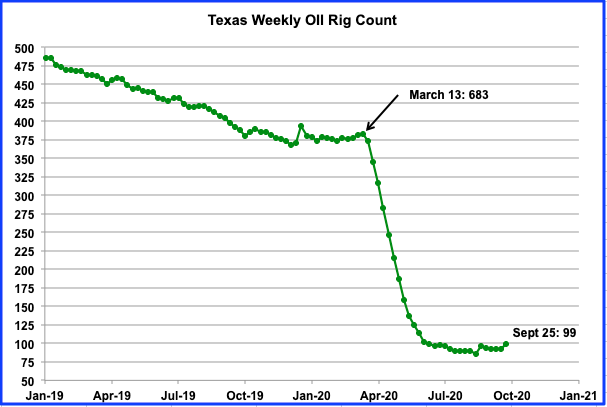
While rigs in operation dropped from March to August 14, production began to rebound in June from the May low. In the week of August 14, the Texas rig count bottomed at 86. During the week of September 25, 99 rigs were operational.
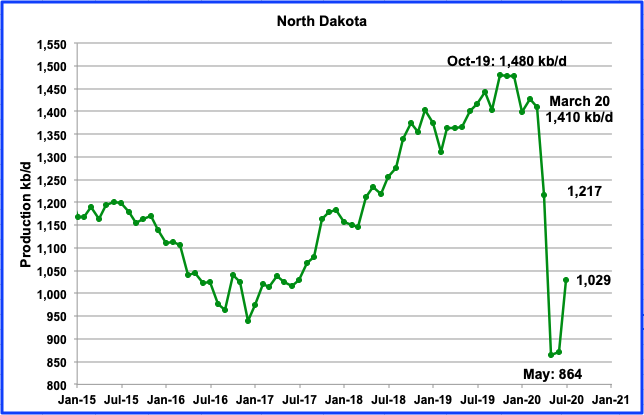
North Dakotaʼs oil production started to drop in November 2019 after peaking at 1,480 kb/d in October 2019. After June’s output increased by only 8 kb/d, July added 165 kb/d. July’s output restored North Dakota to being the second largest oil producing state.
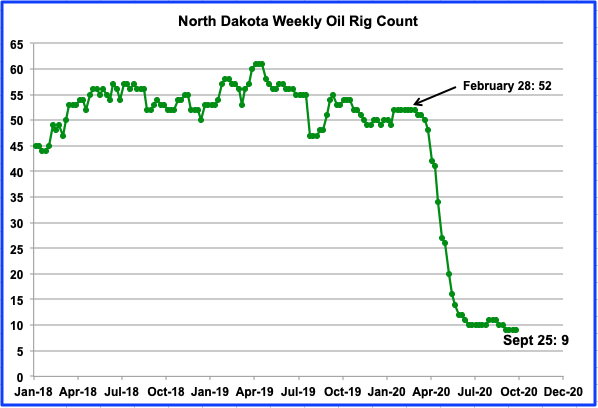
The North Dakota rig count has held steady at 9 for September.
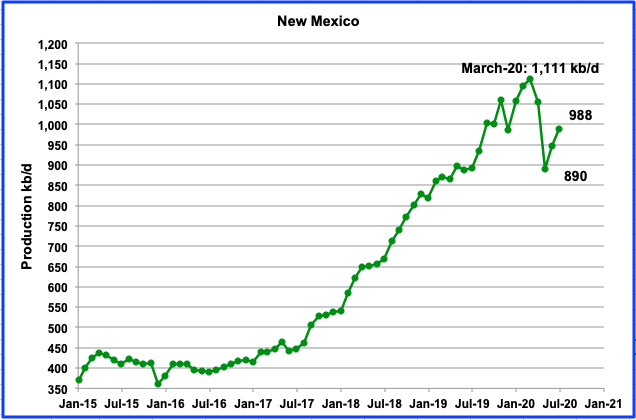
Julyʼs New Mexico production increased by 42 kb/d to 988 kb/d. New Mexico has returned to being the third highest US oil producing state in July. Last month it surpassed North Dakota.
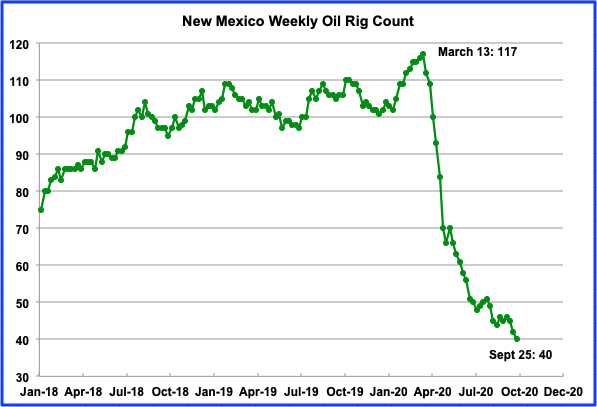
Drilling rigs in the week of September 25 continued to drop from 42 to 40. Even though the rig count kept dropping up to the week of September 25, New Mexico’s production bottomed in May and then increases were recorded in both June and July, as shown in the previous chart.
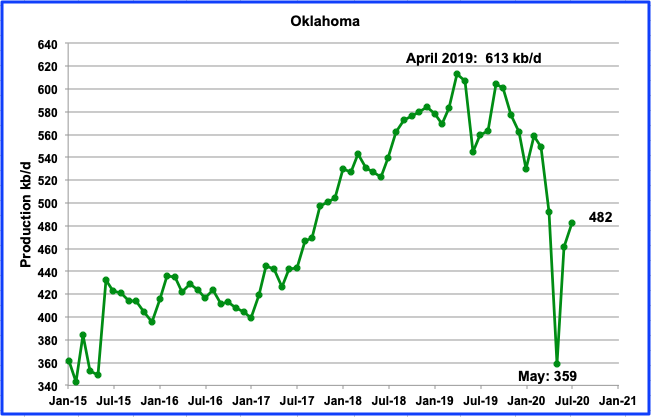
From a low of 359 kb/d in May, Oklahoma’s production rebounded in July to 482 kb/d. The July increment was 21 kb/d. Oklahoma had 11 oil rigs in operation during September. In January 2020, 50 oil rigs were in operation. Whether production can recover to the 600 kb/d level may be impeded by the complex geology according to this one year old source.
“Geology has stymied hopes for a “Permian Jr”: Exploration wells pointed toward uniform rocks that produced high levels of oil, but producers instead encountered more complexity underground, and production weighted toward gas – at a time of a global glut and stubbornly low prices for the commodity.”
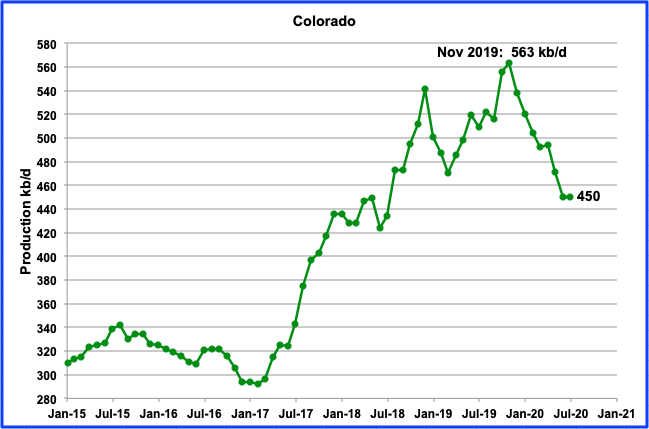
Colorado’s July output was flat at 450 kb/d. Coloradoʼs oil rig count has held steady at 4 for the last 14 weeks. It is not clear whether the price of oil has lead to the constant number of rigs or whether it is related to the stricter drilling rules in force or possibly a combination of both.
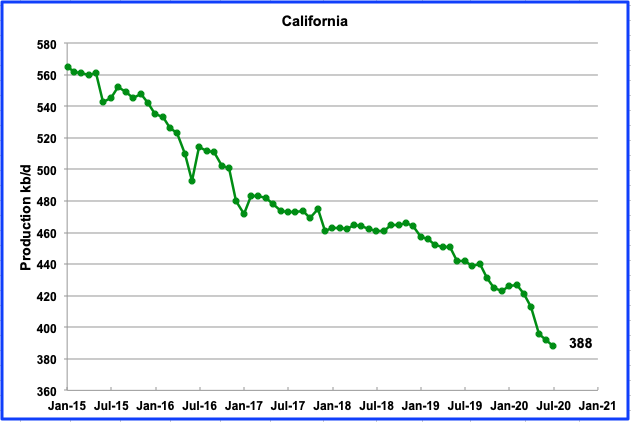
Californiaʼs slow output decline has accelerated in the last few months and dropped below 400 kb/d. July production was down by 4 kb/d to 388 kb/d and continues its slow and steady decline. During the last 18 weeks, California only had 3 rigs in operation.
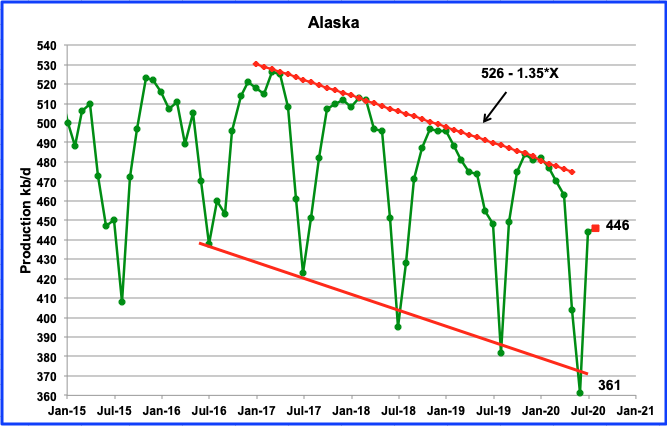
Alaska reversed its annual summer production decline in July. In July output increased by 83 kb/d to 444 kb/d. August production is expected to be essentially flat 446 kb/d (Red square). The new low of 361 kb/d was 21 kb/d lower than the previous August 2019 low of 382 kb/d.
A summer lows trend line, parallel to the annual winter peaks has been added to the Alaska chart. It indicates that the summer lows are falling at a higher rate than the decline in the winter peaks. This raises the question of whether the winter peaks will begin to fall away from the current winter trend line. However according to this source, the Alaska North Slope region produced more oil in July than it had since 2013.
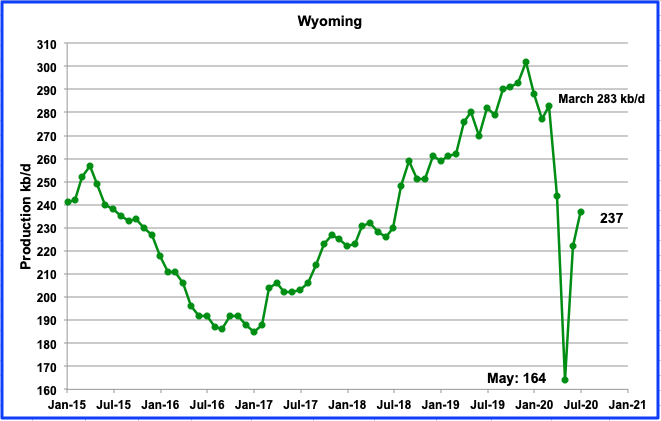
Wyomingʼs production in July increased by 15 kb/d to 237 kb/d. During the month of September, Wyoming had 1 oil rig in operation, down from a high of 20 in January 2020.
According to this Wyoming source, US producers cannot make a profit with oil below $40. “The U.S. was the world’s largest oil producer before COVID-19, but American producers struggle to make profits when the price per barrel is below $40. Diminishing income forced many producers in Wyoming and throughout the U.S. to cap wells.
“Capping wells is drastic, because it can damage (oil) reservoirs,” Godby said. When producers re-start capped wells, the damage done to reservoirs can reduce the wells’ output. “It’s not great,” Godby said. “But, it’s all you can do to stop the bleeding.” Prior to 2020, Wyoming’s oil production never fell by more than 10% in a single year.
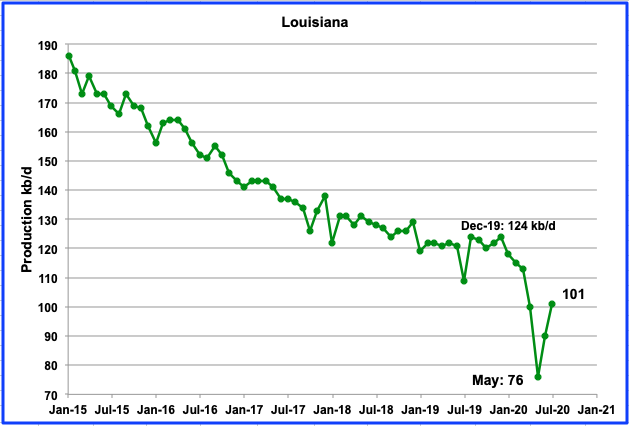
Louisianaʼs recent output has reversed the steady decline that started in January 2020. In July, production rebounded by 11 kb/d to 101 kb/d. In January 2020, on average, 22 oil rigs were operating. Over the last four weeks, Louisiana’s rig count increased to an average 13 from a low of 9 in August.
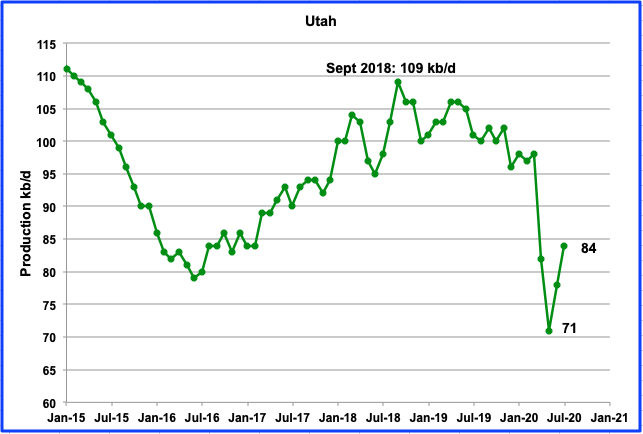
Utah’s production bottomed in May 2020 at 71 kb/d and rebounded to 84 kb/d in July. There were no oil rigs operating in Utah during September. Has the increase in output come from reopening shut in wells?
The Utah drilling industry was hard hit by CV-19 and according to this source, “As of May 1, all drilling rigs had left Utah and many current wells are being shut in, according to the Utah Geological Survey.”
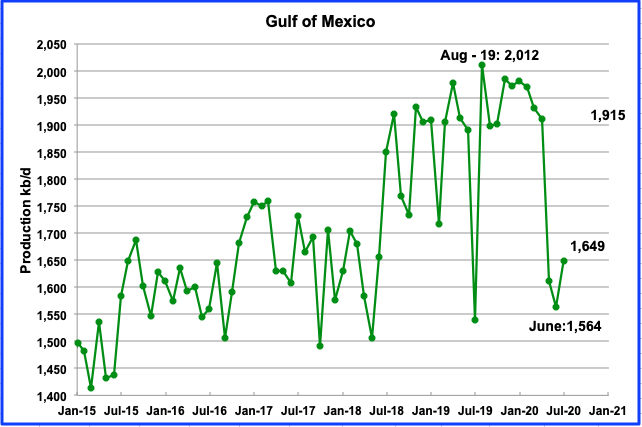
The GOMʼs production bottomed in June at 1,564 kb/d. In July, output increased by 85 kb/d to 1,649 kb/d. If the GOM were a state, its production would rank second behind Texas.
UPDATING EIA’S THREE OIL GROWTH PROJECTIONS
1) DRILLING PRODUCTIVITY REPORT
The Drilling Productivity Report (DPR) uses recent data on the total number of drilling rigs in operation along with estimates of drilling productivity and estimated changes in production from existing oil wells to provide estimated changes in oil production for the five principal tight oil regions. The charts are updated to October 2020.
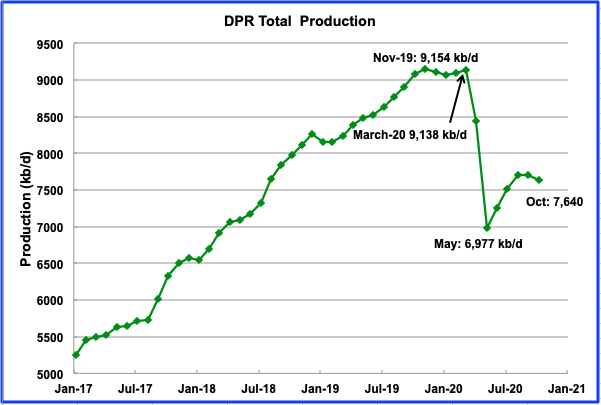
Above is the total oil production from the 7 basins that the DPR tracks. Note that the DPR production includes both LTO oil and oil from conventional wells/fields.
According to the September DPR report, LTO oil and conventional oil output bottomed in May 2020 at 6,977 kb/d. The projected output for October 2020 is 7,640 kb/d, down 33 kb/d from September. October’s output is 1,514 kb/d below the November 2019 peak of 9,154 kb/d
The contribution from three of the LTO basins is shown in the charts below.
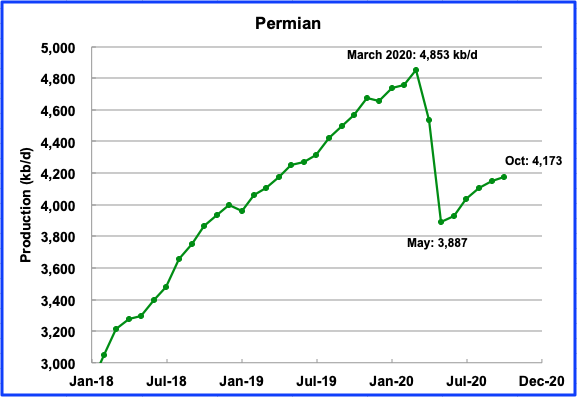
Permian output in October is projected to be 4,173 kb/d, up by 23 kb/d over September and up 286 kb/d from May. October’s output is 680 kb/d below the March 2020 peak of 4,853 kb/d
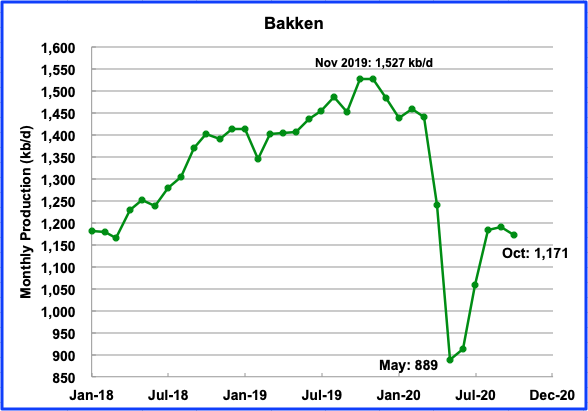
After the Bakken’s two big output drops in April and May, output began to bounce back. In October output is projected to be 1,171 kb/d an increase of 282 kb/d over May.
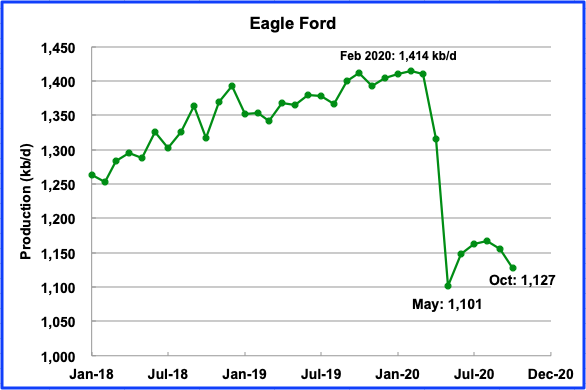
After bottoming in May, Eagle Ford’s output is expected to increase up to August and then begin to fall. In October, EF output is projected to drop by 28 kb/d to 1,127 kb/d.
2) LIGHT TIGHT OIL (LTO) REPORT
The LTO database provides information on LTO production from seven tight oilbasins and a few smaller ones. The September report updates the charts to August 2020.
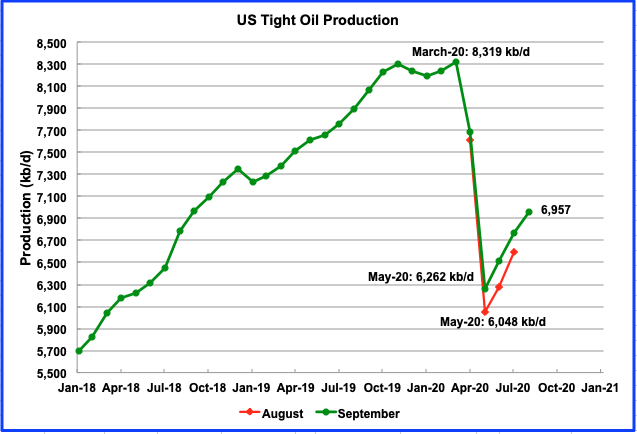
August’s total LTO output is expected to increase to 6,957 kb/d from a low of 6,262 kb/d in May. Note that the September report has increased the May to July estimates by approximately 200 kb/d.
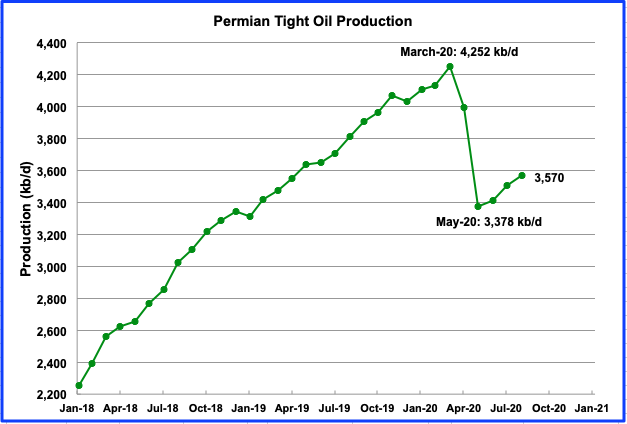
Permian output in August is projected to be 3,570 kb/d, an increase of 192 kb/d from the May low of 3,278 kb/d. The September report shows a smaller increase from May to August than the August report because May output was increased by 170 kb/d.
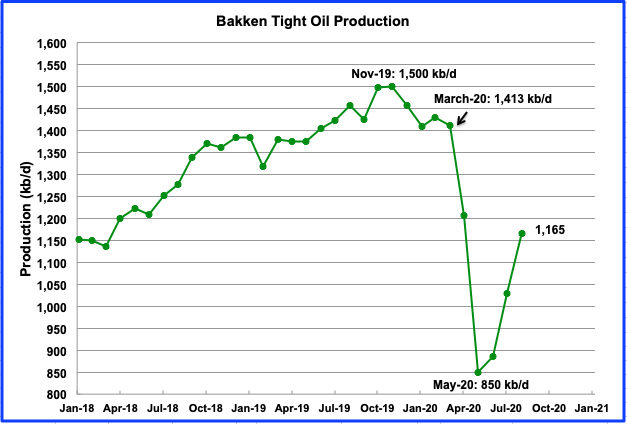
The Bakken is expected to add 315 kb/d to the May low of 850 kb/d by August.
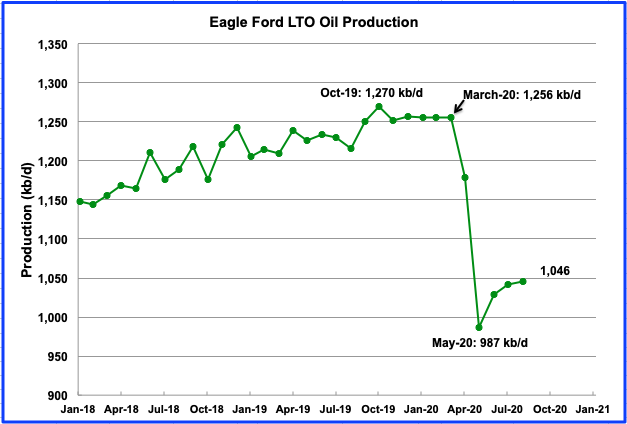
The Eagle Ford basin is expected to produce 1,046 kb/d in August. The increase from May is only 59 kb/d and EF is showing signs of rolling over.
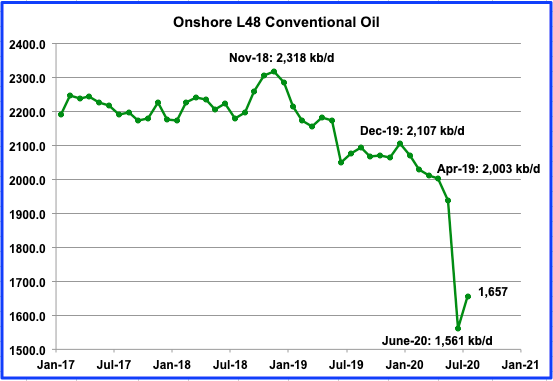
Conventional oil declined in the Onshore L48 by 442 kb/d from April to June. July is expected to restore 96 kb/d of conventional oil.
Note that conventional oil in the L48 also peaked in November 2018, the current world peak oil date.
In the previous section, the DPR is projecting that production will begin to roll over in September and October. LTO output should follow when the data is released in a few months. Could the rollover be associated with WTI staying persistently close t0 $40 late in September rather than increasing to the $50 range as most driller might have expected?
3) SHORT TERM ENERGY OUTLOOK (STEO)
The STEO provides projections for the next 13–24 months for US C + C and NGPLs production. The September 2020 report presents EIA’s oil output projections out to December 2021
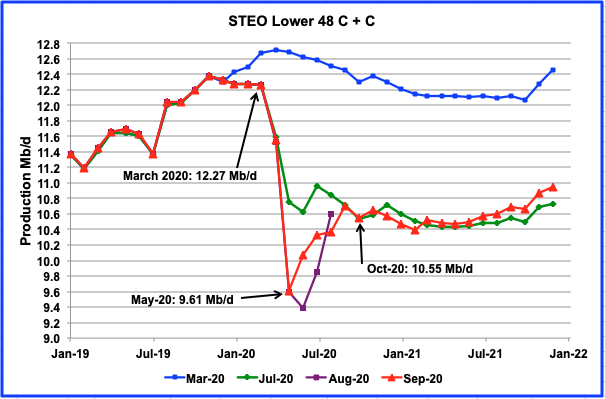
The September STEO report output projection is very similar to the previous July and August graph beyond October 2020. (Purple graph stopped in August for this reason) The main difference is that the September report/graph shows that production after May bounced back faster than expected between May and August 2020. This could be associated with many conventional wells being reopened as the price of oil recovered. Once they were returned to production status, new drilling was just sufficient to offset decline as capex spending was minimized to keep production flat.
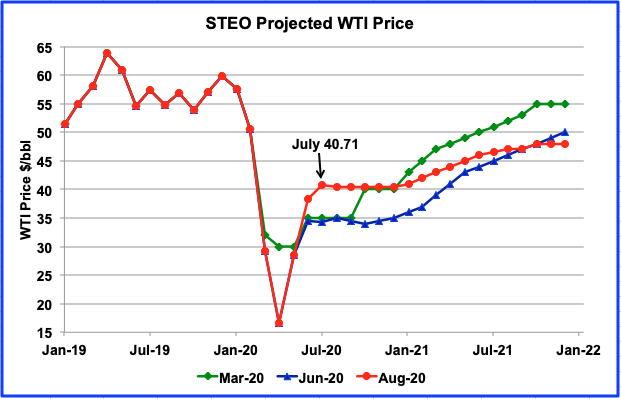
The September STEO is projecting an average WTI price from July to December of $40.50 which is higher than the settled price of $38.72 on October 1, 2020.
World Oil Production
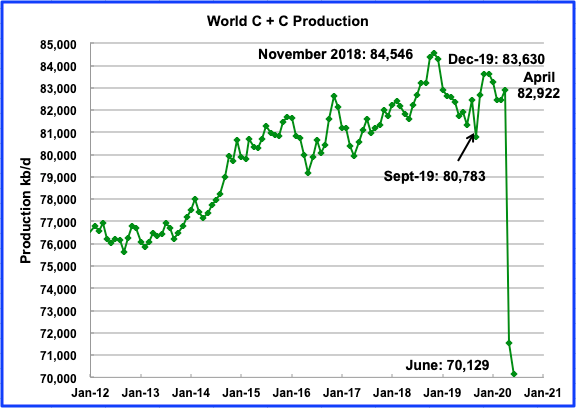
World oil production decreased in June by 1,401 kb/d to 70,129 kb/d. OPECʼs production decreased by 1,965 to 24.186 kb/d in June
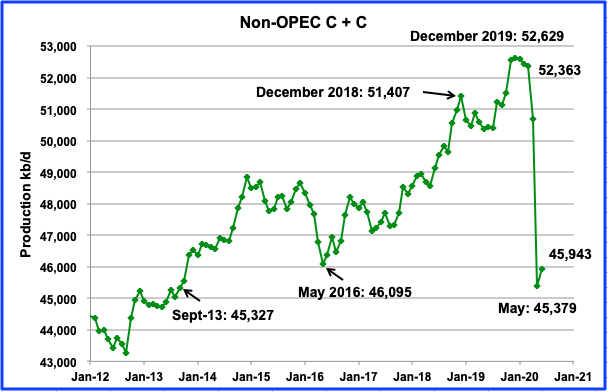
Non OPEC oil production increased in June by 564 kb/d to 45,943 kb/d. Of the 564 kb/d increase, the US contributed 434 kb/d. OPEC’s output drop of 1,965 kb/d was offset by Non-OPEC increase of 564 kb/d for a net world decrease of 1,401 kb/d noted above.
82 responses to “US July Oil Production Continues to Rise”
GOM production will be down in August and September because of numerous storms. (Tropical storm Cristobal was one of the contributors to June’s production being down). Not sure when, or if, we will see GOM production levels back up in the 1.9-2.0 mmbopd range. We’re going to start seeing the impact of the decisions many made back in March and April to defer some development well drilling. Some of those wells would have started coming on line pretty soon now.
Ovi.
I suspect most of the increase in US is re-activation of shut in wells.
States with almost zero rigs and completion crews in the field increased, and I suspect this applies to Texas and New Mexico as well.
Yes, Shallow Sand. Also, the STEO projection shows this. Production won’t go further up from actual levels till spring 22. Counting with a lag of twelve months between drilling and the beginning of production, drilling should increase soon, or that projection will be too optimistic.
It will even go down again once all shut in wells are producing again.
This little drilling and fracking won’t be enough to replace the huge decline. Especially in fields like North Dakota where drilling almost stopped.
Only thing helping here would be a sharp rise in oil prices. Especially when the companies that hedged are running out of hedges.
Westtexasfanclub,
For onshore production the lag between a change in rigs and a change in output is much less than 12 months probably more like 4 months, perhaps 6 months. Offshore likely closer to 12 months, perhaps longer.
As shallow sand points out, much of recent change in output is due to shutting in wells and later reactivation.
Thanks Shallow-sand
I tend to agree with you that most of the increase in US output is due to bringing shut in wells back online. With the initial surge completed, the DPR showing output starting to roll over in September is an indication that drilling is not sufficient to offset decline.
Ovi,
If the DPR model is accurate that will be the case. Often when there are changes in trend th DPR model is far from the mark. Frac spread count has been increasing, which suggests completions may also be increasing. Also note that total frac horsepower in action is a better metric, not all frac spreads are equal. Those still operating are likely the newest highest horsepower units which likely can crank out more well completions per month.
Ovi,
Oct 2 frac spread count increased by 10 from 101 on Sept 25 to 111 on Oct 2.
See primary vision network Oct 2 frac spread count video.
In August the frac spread count had a 4 week average of about 80. Now the Sept 4 week average is up to 93. We can only estimate the oil to gas focused spreads. We don’t get a detailed breakout without paying for proprietary info.
Frac spread count and centered 4 week average
Using ratio of horizontal oil rigs(HOR) to total horizontal rigs (HR) in the US based on Baker Hughes data, the chart below uses this ratio to estimate the oil focused frac spreads in the US (frac spread times HOR divided by HR).
Breaking news
The President and wife have tested positive for CV.
We wish them well.
These are by far the weirdest elections I’ve ever seen.
Noticed EIA is quoting July 3.6 mbpd diesel product supplied vs 4.0 Feb. The 3.6 number is increasing from April/May/June of about 3.5. This is 12% diesel decline from virus.
Concerning refining — if all you want is diesel, there are problems. You have other products accumulating in storage. If all you want is gasoline, ditto. You have to burn it all.
Watcher,
The refining process can be adjusted to reduce jet fuel and produce more diesel per barrel. Jet fuel and diesel are fairly similar, ratio of gasoline to diesel/jet fuel is relatively fixed (only very small adjustment is possible without major refinery refit.)
Dennis/Watcher
Yes, companies can adjust the gasoline/diesel split at a refinery. Unfortunately I don’t think it is adjustable to the point of meeting the US’ needs.
My understanding is that the US produces excess diesel due to its high gasoline needs. In Europe the opposite is true. So what is happening on the Europe/US market is that the US ships the excess diesel to Europe and brings back gasoline from Europe.
Attached is Table that I bashed together from the EIA weekly report.
https://www.eia.gov/petroleum/supply/weekly/
Data Overview (Combined Table 1 and Table 9) PDF
Note the level of exports of Distillate and Residual Fuel oil two years ago
Conventional C+C output from US lower 48 onshore. Took PSM US estimate then subtracted output from Alaska and Federal offshore output from Gulf of Mexico and Pacific, finally subtracted the official EIA tight oil output estimate. In July conventional US L48 onshore output returned to about Dec 2019 output level.
Longer history of US lower 48 onshore (excluding Federal GOM and Pacific) C plus C conventional production Jan 2000 to July 2020. The peak was not November 2018.
Dennis
Got it. My remark was to note that even that local US peak of roughly 100 kb/d helped to cement and add to the other countries that made November 2018 the peak.
Ovi,
In my view Nov 2018 was simply due to OPEC nations and Russia boosting output before the Dec 2018 OPEC plus meeting to decide on quotas. Those with the highest output get the biggest quotas, just a game they play. In any case thae centered 12 month peak also falls close to Nov 2018. We may or may not surpass this and if so only by 1000 to 2000 kbopd, probably between 2025 and 2035 for a new peak 12 month centered average for World c plus c output.
Increase production to lower prices . Excellent strategy .
https://www.thisismoney.co.uk/money/markets/article-8796015/BP-Shell-shares-hit-lowest-level-25-years.html
WTI is back at $ 38 . What will it be when the stimulus runs out ? In the meanwhile :
https://uk.reuters.com/article/uk-occidental-divestment-idUKKBN26M6EL
We discussed this in the last post also . Refineries in US and Europe are facing an abyss .
https://www.bloomberg.com/news/articles/2020-09-30/europe-s-oil-refineries-struggling-to-cope-with-diesel-glut?sref=866aH6XX
There has been excess refinery capacity in the World for many years, obviously during a depression it will be worse. The least profitable refineries may shut down, this is the way market economies work.
As to government stimulus in the US, either a compromise will be reached or it will not, after the election, things might move, or it may need to wait until Jan 20, 2021.
Clearly oil prices have reacted to the news about Trump, market probably over reacting which is common.
https://uk.reuters.com/article/uk-lonestar-bankruptcy/shale-bankruptcies-pile-on-lonestar-latest-to-succumb-to-weak-demand-idUKKBN26M63I?il=0
Another one bites the dust .
That is one way that oil supply is reduced. Unprofitable companies go bankrupt.
The point is gasoline and diesel. You can’t just have one. You have to burn them both. You will overwhelm storage.
Polls all have a turnout model. No one knows what is the correct turnout model. The only thing you can learn from polls is change. If a turnout model is held constant, any change that takes place in the measurement is likely meaningful. Once this truth becomes well-known, pollsters quietly change turnout models depending on who paid them and what will generate another contract. It is an amazing business. It’s not much different from hedge funds. They could take the money for their contract, make no phone calls at all, just report what everyone else is reporting, and pitch another contract. They have self celebrated standards, which seem to be regulated by nobody. Their new buzz phrase is “opinion journalist”. That sounds even more like there’s no regulation.
The reason for the focus on diesel above was a comment from SS that on a recent trip he saw highways not particularly full of cars but completely full of trucks. Not surprising, and it will have to change. Gasoline would overwhelm storage. Imagine the refinery that flares gasoline. That would be cool. We would have state governments announcing that by 2035 all cars must be ICE.
Watcher ” Imagine the refinery that flares gasoline. That would be cool. We would have state governments announcing that by 2035 all cars must be ICE.”
That would really be cool .
Profits for the executives ,loses for the taxpayer .
https://oilprice.com/Latest-Energy-News/World-News/Texas-Taxpayers-Face-117-Billion-Bill-For-Orphaned-Oil-Wells.html
and another
https://oilprice.com/Energy/Energy-General/Oil-Companies-Cut-More-Jobs-As-Demand-Recovery-Remains-Uncertain.html
Exploration is not worth the effort
https://uk.finance.yahoo.com/news/coronavirus-norway-equinor-oil-gas-industry-job-cuts-exploration-112712504.html
Hole.
Equinor plans just 30-40 wells globally in 2020? I thought it was big shale player in the Bakken and EFS? Must not be drilling at all in US shale. I do note it has not had a rig in North Dakota on its acreage for months.
I wonder what the current value of shale acreage and shale leases are in the oil shale regions of the US?
Better yet, what is one of those new rigs that drills shale wells worth now, given that 80% are stacked? Think 10% of what they were worth in 2013?
Nabors Industries is the number 1 shale driller in North American. Did a 1 for 50 reverse stock split a few months ago. I doubt the company could liquidate right now and even come close to paying off half the debt. It might not be able to liquidate at all, given it might not be able to get a bid for much of its equipment.
Equinor has not completed a well in the Bakken since 11/2019 based on my review of shaleprofile.com data.
I did some back of napkin calculations for Equinor for June, 2020. It probably has somewhere between $6-10 billion invested in those wells plus all of the other capital costs required to drill, complete and operate them. In June, 2020 my guess is Equinor netted less than $20 million on those wells. Probably an annualized return of 2-3% at this point.
I would sure love to see payout statements for each of those wells, as I would for any other shale oil wells. After all these years, the companies still do not want to release any of that data. Shale oil well payout statements are among the tightest held secrets in the USA, harder to get ahold of than Donald Trump’s income tax returns.
I should note my 2-3% figure is cash flow on sunk cost.
DD & A included would make it very negative.
By “those wells” I mean the 733 wells they still own in the Bakken as of June, 2020.
Those wells produced about 44,000 gross BOPD in June, 2020. In round numbers about 35,000 net BOPD. I doubt they could get $1 billion for their wells plus acreage at the present time.
Shallow,
According to Equinor’s Q2 2020 Report, they reported a net income profit of $863 million in Norway and a $1.35 billion net income loss in the USA during 1H 2020. So, those 733 wells are likely doing much worse than anticipated.
steve
Shallow and Steve ,thanks for your inputs . What were these guys thinking ? Smartest men in the room or bozos ? Makes me wonder .
hole in head,
While it’s difficult to understand why anyone would have invested in the GREAT SHALE OIL BLACK HOLE, we are starting to see the same insanity by the Middle East producers. Check this out:
UAE Bets Big On Space Tech To Diversify From Oil
https://oilprice.com/Latest-Energy-News/World-News/UAE-Bets-Big-On-Space-Tech-To-Diversify-From-Oil.html
If the UAE thinks they are going to D-I-V-E-S-I-F-Y away from oil into DEEP SPACE TECH, then there is no limit to the amount of insanity in the oil biz.
Good Grief.
steve
Steve, I read that earlier. UAE total population 9.5 million , actual UAE nationals 1 million. 8.5 million ex pats from India, Pakistan etc . 8 ex pats per UAE national to wipe their arse ,and they plan to do space tech . There is dumb , dumber and dumbest.
Shale looked pretty good at $90+ oil.
Shale generally hasn’t been worth it since late 2014.
Shale is so dangerous that it could take down ExxonMobil, a company that not too many years ago had a AAA bond rating.
Wow .
Shallow sand,
If oil prices remain under $60/bo in 2019$ (WTI price) tight oil will never be a good investment. If oil prices gradually rise to $70/bo for WTI (assuming a $5/bo Brent/WTI spread) by 2030, and then remain at that level or higher until 2040, followed by a decline in oil prices of about $2/bo per year to $25/bo, then Permian basin wells pay out with a 10% IRR, taken as a a single project.
Chart below has Permian output for a scenario with oil prices as assumed above, URR=50 Gb, cumulative net revenue from 2010 to 2045 shown on right axis in billions of 2019 US$, average well cost assumed $9 million in 2019 US$ over entire 2010 to 2045 period, EUR of average well assumed to decrease from 430 kb in Dec 2019 to 276 kbo in Feb 2040 for this scenario. It is likely well costs were lower than $9 million from 2010 to 2015, so the net revenue estimate may be conservative over that period.
Art Berman article from 2015:
“Pioneer states that its average Spraberry well is “continuing to deliver an average EUR of 1 MMBOE from all Wolfcamp B and Wolfcamp A interval wells drilled in the northern Spraberry/Wolfcamp since 2013.” Pioneer has drilled many impressive “monster” wells mostly in 2015 one of which will probably reach an EUR 1.25 million barrels of oil (Figure 3). But for 2015, the 123 wells that I evaluated have a per-well average P50 EUR of 164,000 BOE (also Figure 3) and that is nowhere close to being commercial.
PXD UNIV 17H & PXD 2015 DCA 15 DEC 2015Figure 3. Decline-curve analysis of Pioneer University 178B-17H well (1.2 mmbo & 2.4 bcfg EUR) and Pioneer 2015 production group average (146 kbo & 221 mmcfg EUR). Source: Drilling Info & Labyrinth Consulting Services, Inc.
This leaves me scratching my head and wondering exactly which average Pioneer Spraberry wells are delivering an average EUR of 1 MMBOE? I can only conclude that this represents some cherry-picked subset of Pioneer’s wells and is, therefore, a misleading statement at best.
A Spraberry-Wolfcamp well with 1 million BOE EUR would break even at an oil price of $15 per barrel. Yet Pioneer showed $0.98 billion in negative cash flow through the 3rd quarter of 2015. If they truly had wells this good, why wouldn’t they drill all of their 2015 wells in the Spraberry and show a profit?”
Greenbub.
Go look at PXD’s wells on shaleprofile.
They are good, but average for 2015 is cumulative of around 240K BO. 2017 and 2018 are better, they will pass 300K BO before the 2015 wells passed 240K BO.
Looks like 2017 and 2018 are the best, and 2019 aren’t quite as good, but close.
None of these wells on average 2015-18 are going to produce over 50K BO annually in 2021 or beyond, and when they are 10 years old will be producing between 4,000 and 10,000 BO per year.
hi shallow sand,
If we look at advanced insights chart for Permian wells operated by Pioneer at http://www.shaleprofile.com and assume the cutoff for abandonment is about 15 bo/d, the charts suggests EUR of roughly 250 kbo in 2014, 320 kbo in 2015, 430 kbo in 2016, and about 525 kbo for 2017, 2018, and 2019. This does not include natural gas.
Note that for all Permian producers the average well has EUR of roughly 190 kbo in 2014, 275 kbo in 2015, 375 kbo in 2016 and 2017, 410 kbo in 2018 and 2019. Again I have ignored natural gas.
Chart below is for Pioneer Natural Resources wells only in Permian basin.
Dennis , I respect your work but I would rather listen to SS and Mike S . I think the end of shale oil is going to faster than expected . I do not have enough info since one of my several sources , Steve put his site on Patreon ,but he is following the crash of shale on real time basis . Maybe he can chime in with his POV with respects?. I have already said WTI headed to $ 25 by 2025 . Maybe I am optimistic ?
hole in head,
If oil prices go from 40 to 25 as you expect, tight oil output will be negligible. Much depends on the future price of oil which is unknown.
Scenario below assumes WTI rises to no more than $45/bo (still much more optimistic than your scenario where prices fall from $40/bo to $25/bo by 2025 or 2030 at the latest), Permian URR is about 15 Gb for this scenario (about 6.8 Gb of tight oil has been produced from the Permian basin from Jan 2000 to July 2020). Mike and Shallow sand are smart enough to not predict future oil prices as they know any such prediction will be wrong. I agree.
Chart is mislabeled, it should be cumulative net revenue in billions of 2019 US$ on right axis.
For oil price scenario favored by hole in head, (WTI falls from $40 to $25/bo in 2019$ over 2020 to 2028 period, then remains at $25/bo until 2080) I get a Permian scenario with a URR of 10 Gb where it is assumed no wells are completed in the Permian basin after August 2020. The debt accumulated by Permian basin oil companies as a whole is never paid back, it gets paid down to 22 billion by 2027, but at that point net revenue can no longer pay back principal and interest and much of the remaining debt will be defaulted on as companies go bankrupt.
Note also that the Permian basin is the most profitable of US tight oil basins at present, so for other US tight oil basins the decline would likely be as steep or steeper than the Permian basin. By 2031 we would likely see close to zero US tight oil output, if the underlying oil price scenario were correct (I do not believe that future oil prices will follow this scenario).
Trump out of the hospital, says, ” I feel better than i have in 20 years” I know you must have heard of many covid patients who say the same thing. Talk about fake news, the guy is a master. Fake news, fake president, fake illness!
Ever see the movie “Wag the Dog” ? …thats this week in spades!
Dennis, thanks for making the forecasts based on my low price scenario . Appreciated .
hole in head,
You’re welcome.
My thinking is that if US output falls by 8 Mb/d from March 2020 to Dec 2031, World C plus C is likely to be in short supply, but that presumes that World real GDP returns to the 2019 level at some point, we disagree on future World real GDP. You believe (as far as I can tell) that World real GDP will permanently remain below the level reached for 2019 (annual output), I think the odds are about 100 to 1 that World real GDP (annual basis) will rise to more than the 2019 level some year between 2022 and 2028. We will have to wait to see if I am correct.
https://uk.reuters.com/article/uk-norway-oil/six-norway-oil-and-gas-fields-shut-as-strike-escalates-idUKKBN26Q0NY
$100000 per year jobs at a time when there is a tsunami of unemployment .
Denmark issued official permission to Nordstream 2 for traverse of Danish territory. Looks a lot like the last obstacle.
https://www.thejakartapost.com/news/2020/10/06/exxonmobil-to-cut-european-workforce-11-with-1600-layoffs.html
Seems Shallow is pointing in the right direction .
Saudi’s are working their budget based on $50 till 2023 .
https://www.bnnbloomberg.ca/saudi-arabia-pegs-budget-to-oil-staying-around-50-until-2023-1.1503449
Low and lower prices are the future .
hole in head,
Futures market sees $45/bo for WTI for Dec 2023, if we assume the $5/bo Brent/WTI price spread remains in place, this implies Brent at around $50/bo in Dec 2023.
The future market is often wrong of course.
I do not have to introduce Rune ,he is legend in the oil industry . Read and understand the whole picture .
https://runelikvern.com/2020/10/05/the-prices-of-usd-oil-and-u-s-fiscal-and-monetary-policies/
Thanks Rune .
2014 on the DXY was when the ECB took interest rates negative. That was a good read that Rune put together. A lot of stuff in it is what i’ve been talking about. Currently the dollar weakness being seen is almost 100% dollars chasing stimulus money wherever that might be. There is a big difference between now and 1985. Other countries only have so much room to allow their currencies to appreciate. I don’t see another 1985 like USD devalue in the cards.
Low interest rates are deflationary when they are long term. You now have all these loans with low interest rates. When it comes to the amortization of all these low interest loans. The small interest expense is front loaded just like a high interest rate loan. But the principal portion of the loan is huge in these low interest rate loans. As you can borrow a lot more when interest expenses are low. Money is destroyed when principles are paid down. So money disappears at a much faster rate than in a high interest rate world every month when payments are made. The short term gain from people taking out new loans at low interest rates when rates go down is out weighted big time by the long term effect of money being destroyed at a much faster rate as loans are repaid.
When oil does get scarce. The dollar and oil will rise together. And i would argue that oil isn’t scarce until you see the dollar and oil rising at the same time.
I read Rune’s work and must say it is a case of liking the messenger but not liking the message, from my standpoint in owning stripper well working interests.
It seems like there is a never ending fight against deflation going on?
There is a myth that the stock market and other asset prices are correlated with the expansion of the FED’s balance sheet. There is absolutely zero truth behind that myth. The FED doesn’t inject money into the economy via QE. It’s the exact opposite. They remove money from the economy by removing financial assets from the economy. When they “buy” assets mainly US treasuries and MBS. They don’t pay in cash. The just create an accounting entry in the name of the primary dealer they got it from. No money ever leaves the FED. But what QE does is lower interest rates as the FED is “buying” more of the supply of say the 10year treasury than the US treasury is issuing. Lower interest rate have allowed corporate America to load up on cheap loans they have used to buy their own stock back to push valuation absurdly past economic fundamentals. Lower interest rate have provided a boom in many different areas.
Interest rate can never rise again. Not now, not in 100 years from now. Never!
Government spending financed by central banks is a wash because the same amount of money leaves the economy via QE as is being spent into the economy. Governments have no effective way to stimulate the economy.
And than the American voter removed Trump from office and the nonsense stopped happily ever after
Just say “no” to stupidity next time
The nonsense doesn’t stop no matter who you vote for. It’s just a matter of what brand it continues under.
When you realize there is no way out. Debts can’t be inflated away and we also can’t grow our way out there is only one logical end. Defaults. More money will simply disappear over next 10-15 years than most people can wrap their head around.
But at the end of the day you have to have oil. You don’t have to have solar or wind. You have to have oil. And oil and the dollar is where money will flow to once oil scarcity sets in. What is the exact timeline on that? Over next 10-15 years.
Fear springs from ignorance
Your Tverberg style of “Education is a system of imposed ignorance”
Money is a liquid medium of exchange used to facilitate trade between parties.
“But at the end of the day you have to have oil. You don’t have to have solar or wind. You have to have oil. And oil and the dollar is where money will flow to once oil scarcity sets in. What is the exact timeline on that? Over next 10-15 years.”
I have a alternative take on that timeline. The period during which oil scarcity, and the resultant money flows you suggest, are a likely scenario is a 10-15 years window.
But beyond that timeframe, electric transport for people and cargo will be so widespread that oil will not be as critical as it certainly is today. A 30-50% decline in global supply of liquid fuels by 2035 can be digested by worlds economy. That assumes the supply declines happen gradually. An abrupt decline is never easily digested.
If you think this assertion is absurd, I don’t mind at all. Check back in 2030 and see how much the landscape of transportation has changed- dramatically.
Also keep in mind that any significant escalation of oil price will serve as an accelerant to electric vehicle adoption.
The market (5yr performance of stocks/ETF’s) looks to be in full agreement with the trend I describe.
XLE (big oil and gas industry)- down 57%
TAN (solar energy industry)- up 134%
SMOG (low carbon energy including electric vehicles)- up 118%
“A 30-50% decline in global supply of liquid fuels by 2035 can be digested by worlds economy”
I agree
“A substitute, or substitutable good, in economics and consumer theory refers to a product or service that consumers see as essentially the same or similar-enough to another product. Put simply, a substitute is a good that can be used in place of another.”
https://www.investopedia.com/terms/s/substitute.asp#:~:text=A%20substitute%2C%20or%20substitutable%20good%2C%20in%20economics%20and,that%20can%20be%20used%20in%20place%20of%20another.
Europe is rapidly electrifying their autos at an accelerating rate. They appear to have hit the rapid ascent portion of the S curve:
https://cleantechnica.com/2020/10/06/fossils-panic-september-in-germany-hits-record-15-6-ev-market-share/
https://cleantechnica.com/2020/10/07/uk-september-ev-market-share-hits-10-5-up-3x-year-on-year/
https://insideevs.com/news/433473/plugin-car-sales-france-record-june-2020/
The nonsense doesn’t stop no matter who you vote for. It’s just a matter of what brand it continues under.
Bullshit! It matters a lot:
The Federal budget deficit has increased over 68% in Trump’s three years in office and is expected to exceed $1 trillion in 2020 and beyond. This is in direct contrast to his statements that it would be easy to eliminate not just the deficit but also the Federal debt.
Trump’s massive tax cut for the rich while giving the shaft to the middle class has ballooned the deficit. That would not have happened under Clinton. Trump ignoring the virus and doing nothing has likely doubled the death rate. A person who thinks it doesn’t matter who you vote far has their head so far up their ass that they cannot see reality.
“Bullshit! It matters a lot”
Agree, for those who can’t see the difference. I believe they have drank the Republican Kool-Aid.
It’s also a line that is being pushed hard by enemies of democracy worldwide. It is a well documented fact that the Republican party has been heavily infiltrated by these forces. For example, the NRA is a Russian quango. They claim that being armed and ready to attack the government or your fellow citizens, not voting, is the definition of democracy.
Hillary won the popular vote by 3 million votes.
The Dims in the Senate received 18 million more votes than the Repugs.
Anyone see a problem?
Governments have no effective way to stimulate the economy.
Of course they do. They can simply spend money directly, rather than handing it over to the .1% as tax cuts. Governments can hire people, build stuff, whatever. To the extent that a decentralized market economy has failed to spend money on real goods and services, the government can do it to whatever extent is needed. They can do it as long as needed.
WWII is the classic example of this.
shallow sand,
If Rune’s estimate of $70/bo being affordable is correct, I imagine at that oil price you would be doing pretty well.
Yes, but that’s his upper limit and I take it that prices will be generally much lower.
Hi Shallow sand,
My guess is that his guess is incorrect, I think if oil supply is short we could see $90/bo, his argument is based on affordability, my guess is that $90/bo in 2019 $ will be affordable enough for demand to be as large as supply at that oil price, though I doubt we get to that point until 2028 or so.
Also keep in mind that total credit to the non-financial sector is about 227% of GDP of the 43 nations that report data to BIS(most recent quarter reported, generally we would expect as GDP grows by a dollar, total credit expands by more than this amount.
Since 2001 this ratio has increased from 172% to 227% over 18 years, an average annual increase of 1.55% (=227/172 raised to the 1/18 power and subtract 1 then multiply by 100.)
This is mostly explained by better access to credit by emerging economies, this is expected as economies become more developed.
Exchange rates are important, but I don’t think we can predict the future level of DXY any better than we can the future price of oil.
In some nations (China for example) the currency tends to be pegged closely to the dollar, India is not part of DXY. Which is mostly based on Euro, British pound, Japanese Yen, and Canadian dollar (as a group they constitutes about 92% of the value of the index, based on information at Wikipedia).
Dennis, Rune has pointed in the direction of affordability like I have been talking about . Yes ,we have different price levels for affordability . This unlike your line of thought that price level will be determined by supply and demand factor .
Hole in head,
Demand includes the concept of affordability, when oil price increases demand is lower than before, especially over the long term as consumers change behavior. So I also include affordability, but believe the price level where demand falls below supply is different than you. You suggest $40/bo or less long term, I think medium term(10 years) the affordibility threshhold is $90/bo or higher.
Dennis Coyne,
Can you point to where I presented an estimate of the affordability limit for crude oil in my referenced article?
(Yes, I earlier vowed to never post again on POB)
This chart shows how price and demand quantity for oil have changed in recent decades. It is adjusted for inflation.
https://ourworldindata.org/grapher/world-crude-oil-price-vs-oil-consumption
This is what I read from it:
Current oil prices are twice as high as they were in the sixties in real terms.
Post 1978, a price spike was associated with significant decline in volume consumed — consumption in1983 was about 15% below 1978. This was much less pronounced in 1973 and post 2000.
This suggests to me that markets are not particularly sensitive to oil prices. Put another way, it suggests that consumers consider oil cheap compared to its usefulness. $120+ didn’t even slow consumption down.
The world GDP has roughly quadrupled since 1970, but oil consumption volume has only doubled.
This suggests decoupling of oil consumption from economic growth. It shows that attempts to connect GDP to energy derived from oil are misguided. Prices have roughly doubled since 1970 though, keeping the industry about as relevant economically as it was then, at least in terms of sales. But I guess costs are significantly higher, so total profits should be lower.
Rune,
Following is a quote:
From monitoring the oil market for more than a decade, I have increasingly become convinced that from now on, consumer affordability will grow in importance as the factor that establishes an upper sustainable ceiling for the oil price.
Above some threshold for the oil price, consumers will reduce their consumption, thus adjusting their demand to what they can afford.
The upper sustainable, affordable ceiling for the oil price (Brent spot) has, in recent years, appeared to be about USD 70/Bo. Refer also figure 17.
From your post at link below
https://runelikvern.com/2020/10/05/the-prices-of-usd-oil-and-u-s-fiscal-and-monetary-policies/
Perhaps estimate is the wrong word, you say the upper sustainable, affordable ceiling for Brent Spot price appears to be $70/bo.
For the period from Jan 2011 to Dec 2014 the average daily Brent spot price was about $107/bo.
During periods of oversupply as has mostly been the case from 2015 to 2020, we get lower oil prices ( the average daily Brent spot price over the Jan 2015 to Oct 5, 2020 was about $55/bo).
Not sure where you get the $70/b Brent price. I believe if oil supply is consistently lower than demand at $70/bo (and think this is highly likely by 2028), then oil prices will rise, though I am doubtful that the Brent spot price will be sustained at more than $90/bo (in 2020 US$.) Obviously this is a guess, as I suspect your $70/bo Brent spot price, might also be a guess (or “estimate”).
(Estimates to me is something like exercises performed to derive at a number like Estimated Ultimate Recovery (EUR).
It may be semantics, but in the second half of 2019, there were protests in part of India about prices for fuel while Brent was below $70/bo. Ref also to the TIME article linked.
That should be important and say something about the affordability threshold for oil in one of the world’s biggest consumers.
In other words, I based my statement based on observations from the real world.
No one disputes the fact that the nominal oil price in 2010 – 2014 was above $100/Bo.
Few points to the fact this was while the USD was weak and the world piled up on debt.
The statistical analysis shows that the USD strengthening was a more dominant factor in the oil price collapse of 2014 than the oversupply.
Likewise, a strong USD (and likely stronger USD in the near term) keeps the nominal oil price lower.
My $70/bo is not a guess but from observations of responses in the real world.
Rune,
It may be that there are some people that cannot afford a Brent oil price of $70/bo (USD), this will depend in part on the specific exchange rate between their local currency and USD as well as their income level. As to the cause of the price crash, note that correlation does not imply causation, it seems likely that both the stronger US dollar and the large increase in OECD commercial oil stocks from year end 2013 to year end 2015 (a 17% increase over that two year period), led to lower oil prices.
We will know what oil prices are affordable, only when oil supply becomes constrained relative to demand at the current price of oil, that is the true real world test in my opinion.
As to World piling on debt, credit to non financial sector to GDP (PPP) increased from 197.6 for 2010Q4 to 211.1 for 2014Q4 for all reporting countries to the BIS, an increase of 6.8% over 4 years or 1.65% per year on average, a pretty small “pile” of extra debt. This rate was lower than the previous 4 years where the average annual rate of increase of debt to GDP (2006Q4 to 2010Q4) was 2.6%. As to stronger or weaker dollar, DXY does not tell us much about exchange rates for India and China where oil consumption is growing more strongly (over the 2011 to 2014 period).
For China the Yuan was getting weaker from 2011 to Jan 2014 and then strengthened over the 2014 to 2017 period.
https://fred.stlouisfed.org/series/EXCHUS
For the Indian Ruppe, it was also getting stronger relative to the dollar from 2011 to 2017.
https://fred.stlouisfed.org/series/DEXINUS
DXY may not be the best measure to use for the strength of the US Dollar and its affect on demand for oil.
Dennis,
This idea of “affordability” is unrealistic. It comes, I think, from a oil industry-based point of view. From a wider point of view, demand curves include the availability of substitutes and perceived value.
In other words, fuel above a certain price doesn’t justify itself. Just as people switch from beef to pork when beef rises above a certain point, people choose a wide range of alternatives to BAU fuel consumption: shopping online, mass transit, carpooling, more efficient ICEs, hybrids, EVs, etc., etc., etc. The same is even more true of industrial/commercial oil product consumption: corporations have fleet managers, supply chain/purchasing managers, etc. who pounce on ways to reduce or eliminate fuel consumption.
If affordability was the most important element of consumer choice, everyone would choose a $12k new car or a $6k used car, and the average car on the road would be 15 years old, like that of Old Farmer Mac. Instead the average new vehicle goes for $36k, and the average age of cars is about 6 years.
Deflation factors into Nouriel Roubini’s dramatic ten deadly drivers of a greater recession for this decade. I note that he does not factor in the World Oil Shock scenarios as does Peak Oil Barrel; you could say that he’s not in the “thermodynamic economics” camp. But the way he lays this out is of interest to this discussion.
https://www.theguardian.com/business/2020/apr/29/ten-reasons-why-greater-depression-for-the-2020s-is-inevitable-covid
Hurricane Delta is now a fast moving CAT4. I assume most GOM production prepping for evacuation, not much time left. This might get messy.
Pray for those in DELTA’s path.
The petrostate of Venezuela has fully collapsed. This is likely the fate of all petrostates by the end of this century, including not just most of the Middle East but much of Texas and Louisiana: destitute polluted hellholes.
https://www.nytimes.com/2020/10/07/world/americas/venezuela-oil-economy-maduro.html?action=click&module=Well&pgtype=Homepage§ion=World%20News