By Ovi
All of the Crude plus Condensate (C + C) production data for the US state charts comes from the EIAʼs Petroleum Supply monthly PSM which provides updated information up to December 2023.
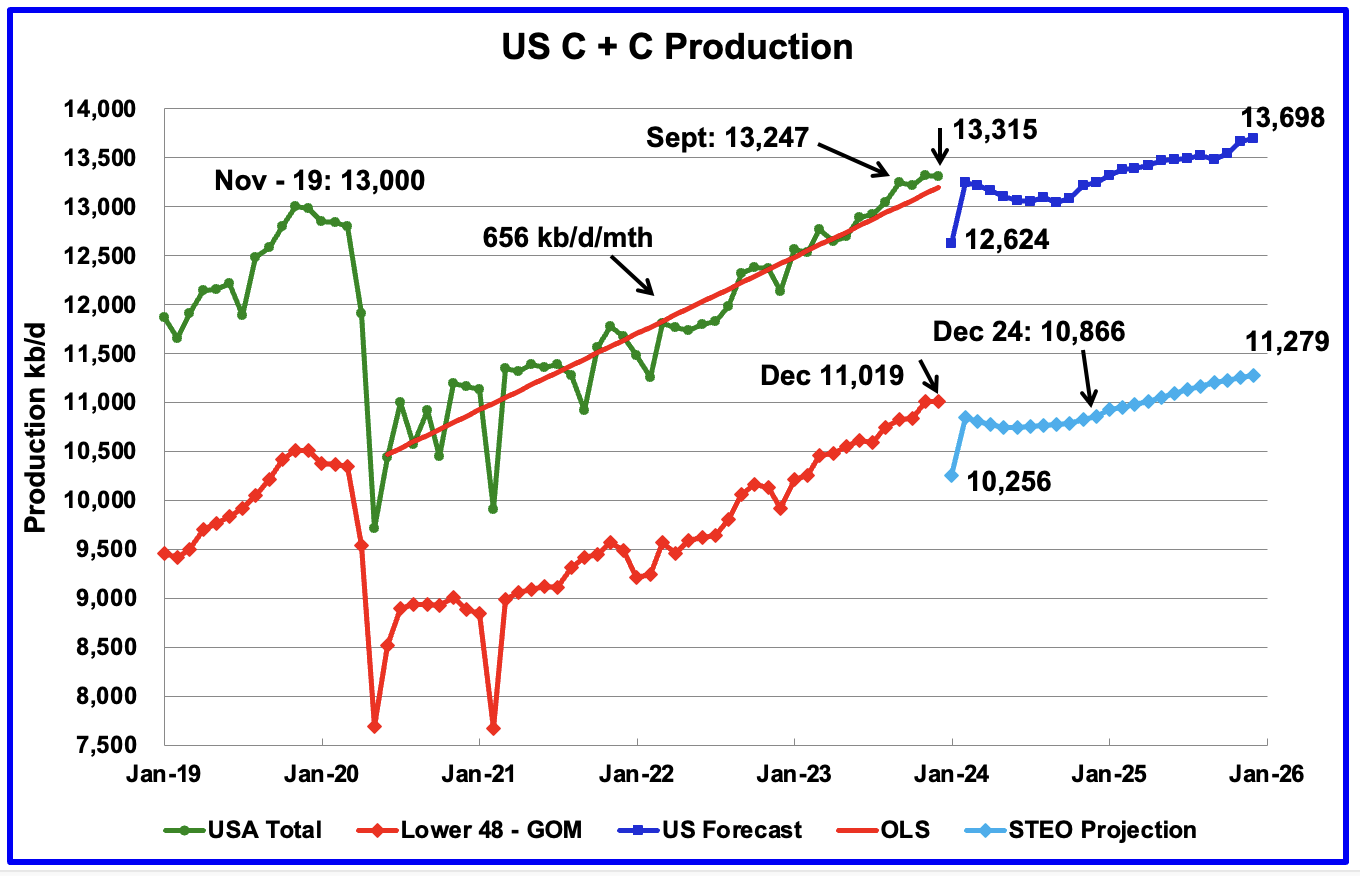
U.S. December oil production decreased by 4 kb/d to 13,315 kb/d. The small decrease was a mix of increases and decreases that netted out to a negligible decrease. The largest decrease came from Texas, 20 kb/d, offset by a New Mexico increase of 23 kb/d.
The dark blue graph, taken from the February 2023 STEO, is the forecast for U.S. oil production from January 2024 to December 2025. Output for December 2025 is expected to reach 13,698 kb/d. The projected January drop was due to severe storms in the central US.
The red OLS line from June 2020 to December 2023 indicates a monthly production growth rate of 65 kb/d/mth or 780 kb/d/yr. Clearly the growth rate going forward into 2024, shown by the dark blue graph, is flat and significantly lower than seen in the previous June 2020 to November 2023 time period. In January 2025 production is expected to be 13,318 kb/d, 3 kb/d higher than in December 2023.
Both the overall US and the Onshore L48 oil production were essentially flat, with overall US production dropping by 4 kb/d while the Onshore L48 was up by 1 kb/d.
The light blue graph is the STEO’s projection for output to December 2025 for the Onshore L48. From December 2023 to December 2025, production is expected to increase by 260 kb/d to 11,279 kb/d. Production for most of 2024 in the Onshore L48 is expected to be lower than December 2023. In December 2024, oil production is expected to be 153 kb/d lower than December 2023.
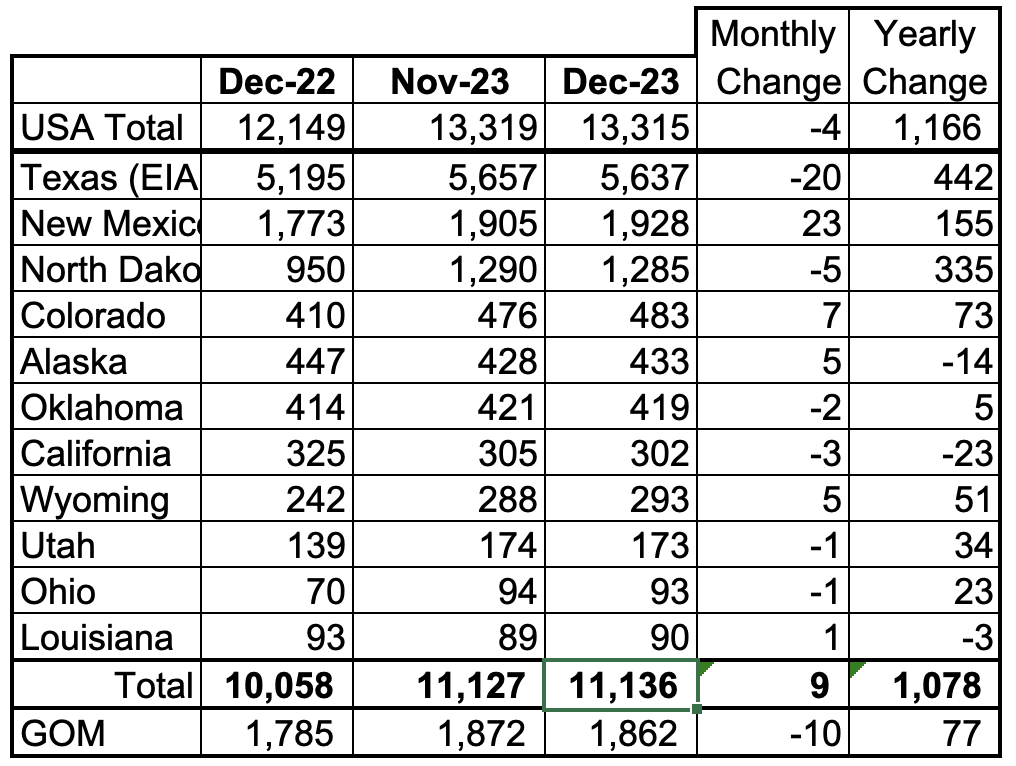
Listed above are the 11 US states with the largest oil production along with the Gulf of Mexico. Ohio has been added to this table since it exceeded Louisiana’s production. These 11 states accounted for 83.6% of all U.S. oil production out of a total production of 13,315 kb/d in December 2023.
On a YoY basis, US production increased by 1,166 kb/d with the majority, 932 kb/d coming from Texas, New Mexico and North Dakota. GOM production dropped by 10 kb/d MoM while YOY it is up 77 kb/d.
Note that on a YOY basis, four of the smaller producing states have increased production, Colorado, Wyoming, Utah and Ohio.
State Oil Production Charts
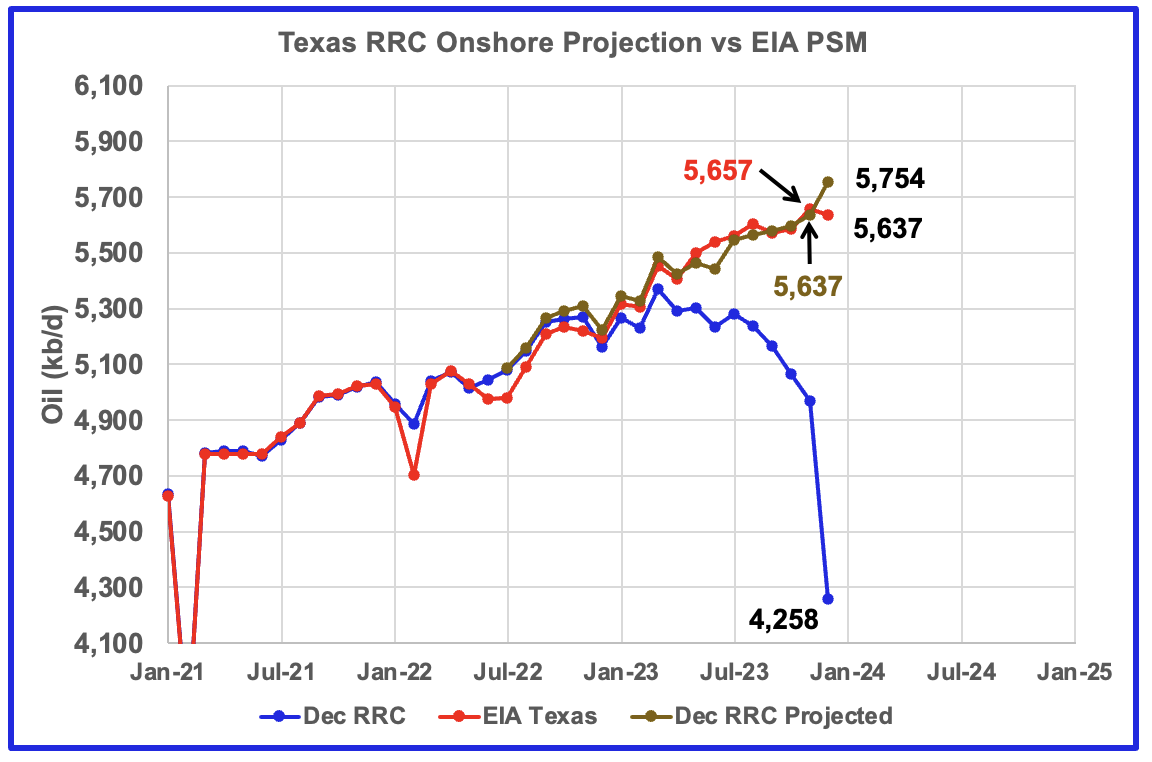
Texas production decreased by 20 kb/d in December to 5,637 kb/d.
Also shown is the monthly data from the Texas RRC, the EIA and a December RRC projection. The projection is very close up to November 2023. The error for December 2023 is due to under reporting of November production in the RRC November report. Note the error for November 2023 is 20 kb/d too low.
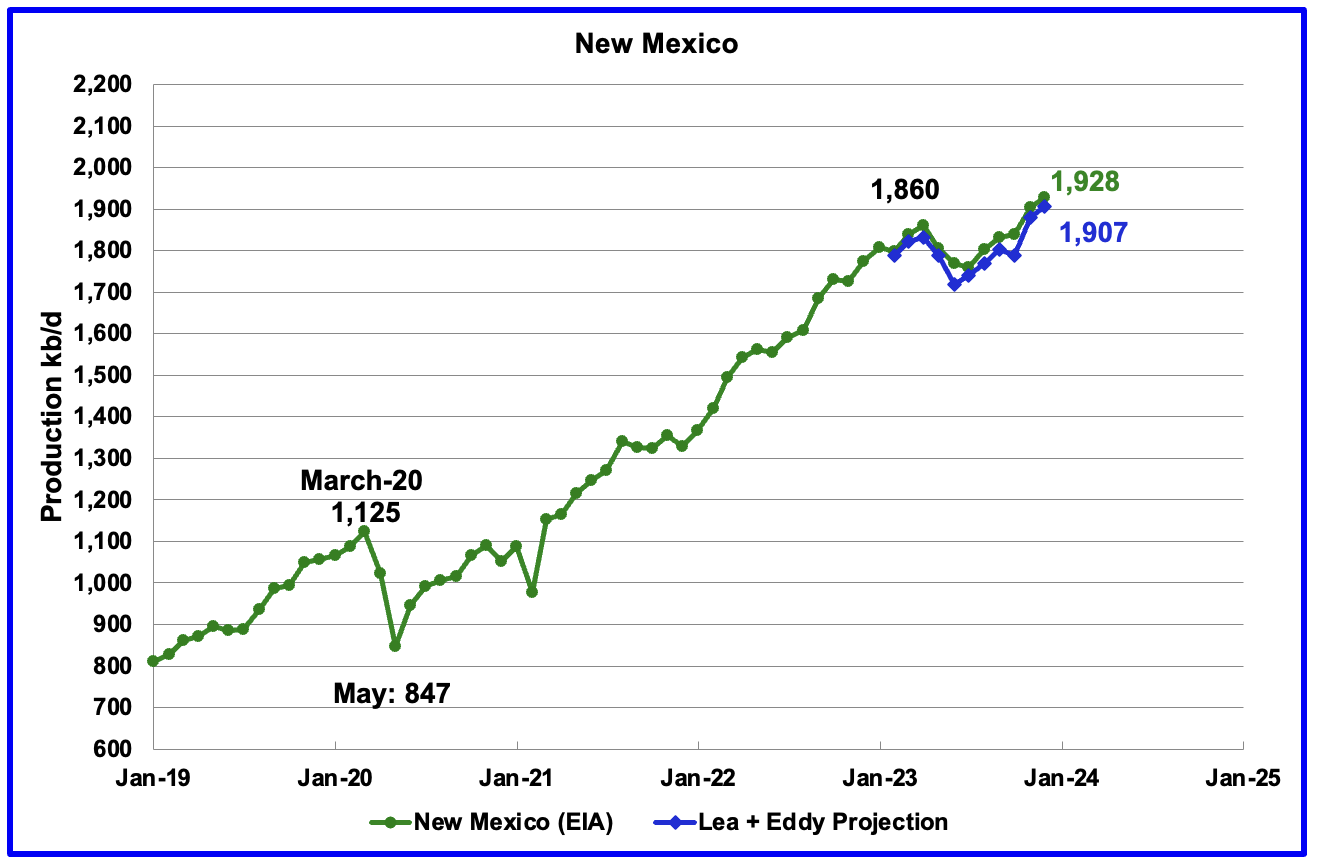
New Mexico’s December production rose by 23 kb/d to 1,928 kb/d.
The blue graph is a production projection for Lea plus Eddy counties. The projection used the difference between December and November production data provided by the New Mexico Oil Conservation Division.
The combined output from Lea and Eddy counties in December increased by 27 kb/d. It is interesting to note the Lea + Eddy production trend is similar to the EIA’s except for October.
More production information from these two counties is reviewed in the special Permian section further down.
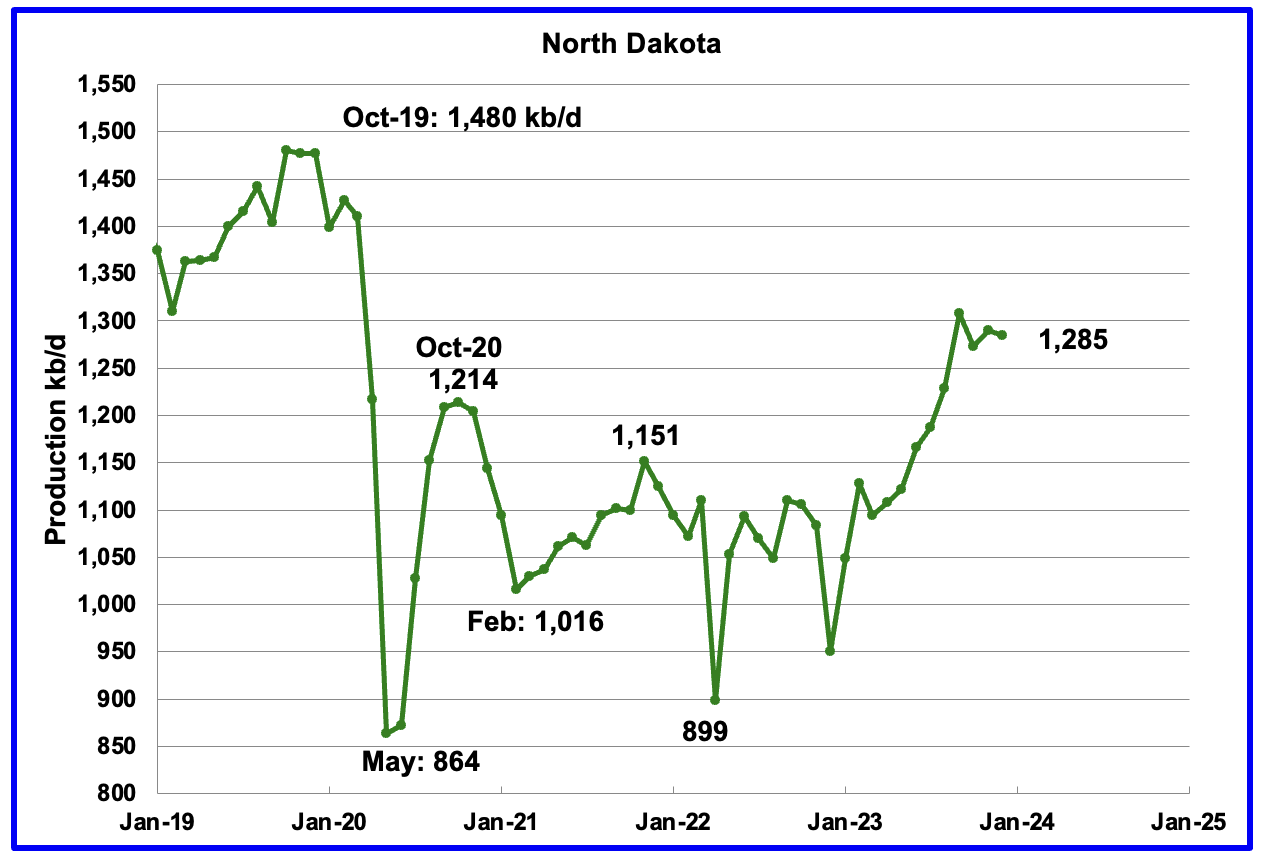
December’s output decreased by 5 kb/d to 1,285 kb/d. YoY production increased by 335 kb/d.
According to this article: “Helms attributed the growth to completion of wells that had been drilled but not yet completed. Completion is the process of preparing a well for production.
“All the drilling in the Tier 2 geology has turned out to be every bit as productive as the core, the Tier 1 geology,” Helms said, referring to the main and secondary oil-producing areas in the Bakken.
The state’s drilling rig count as of Thursday was 37, about flat compared to recent months.
There were 18,753 producing wells in North Dakota in December, another record.
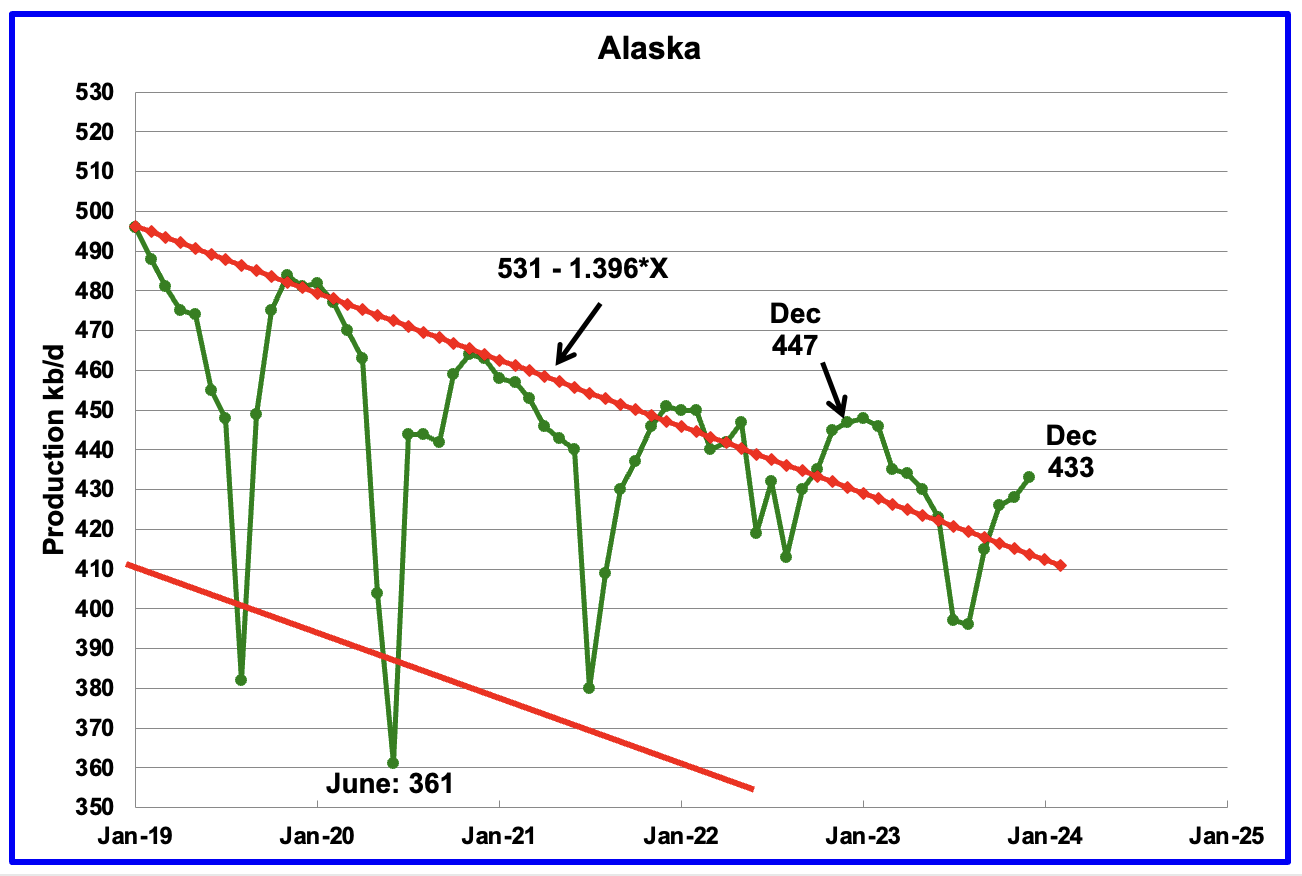
Alaskaʼs December output increased by 5 kb/d to 433 kb/d. Production YoY is down by 14 kb/d. The EIA’s weekly petroleum report continues to show January/February Alaska production is in the 430 ±5 kb/d range.
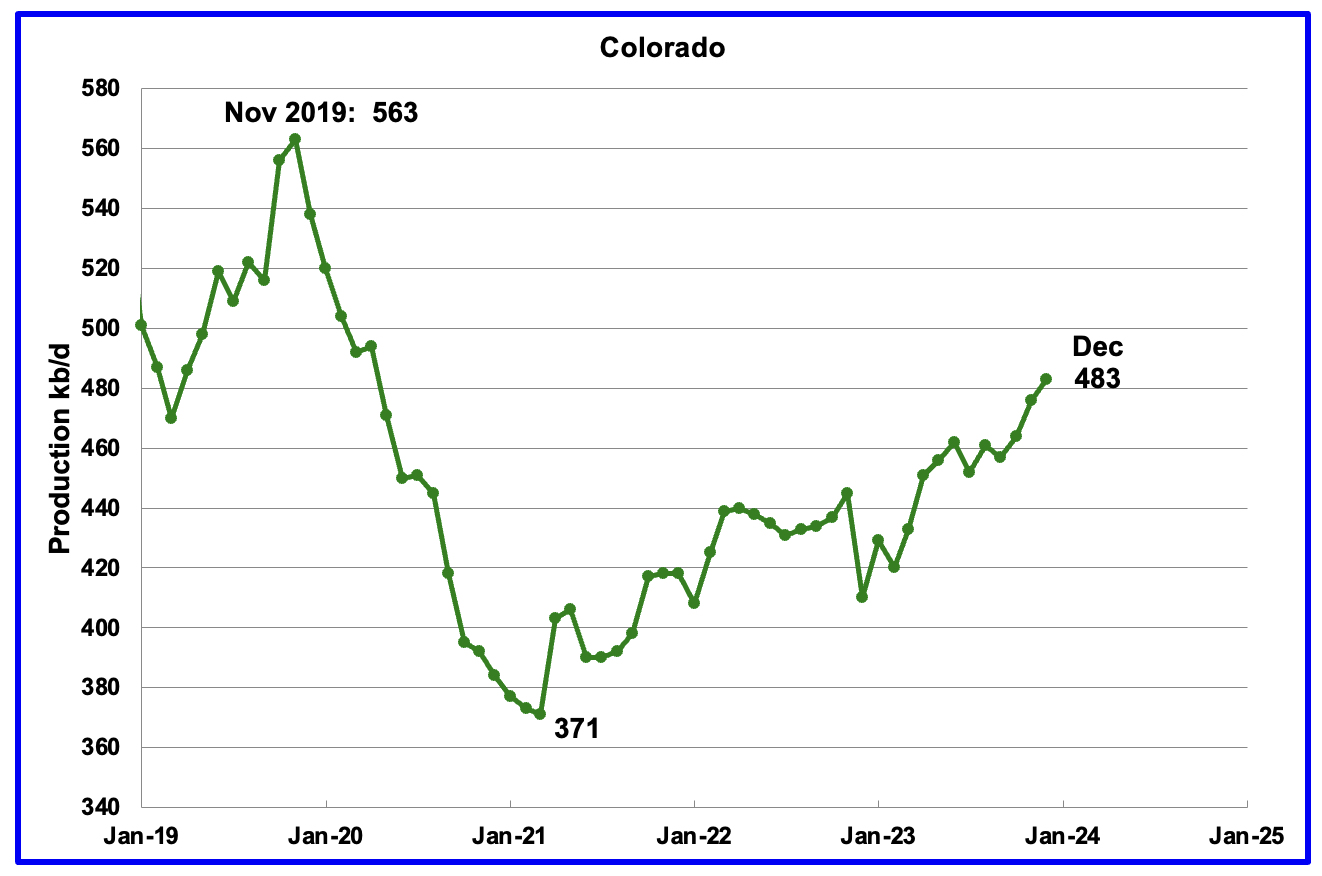
Coloradoʼs December production increased by 7 kb/d to 483 kb/d. Colorado has moved ahead of Alaska to become the 4th largest oil producing state.
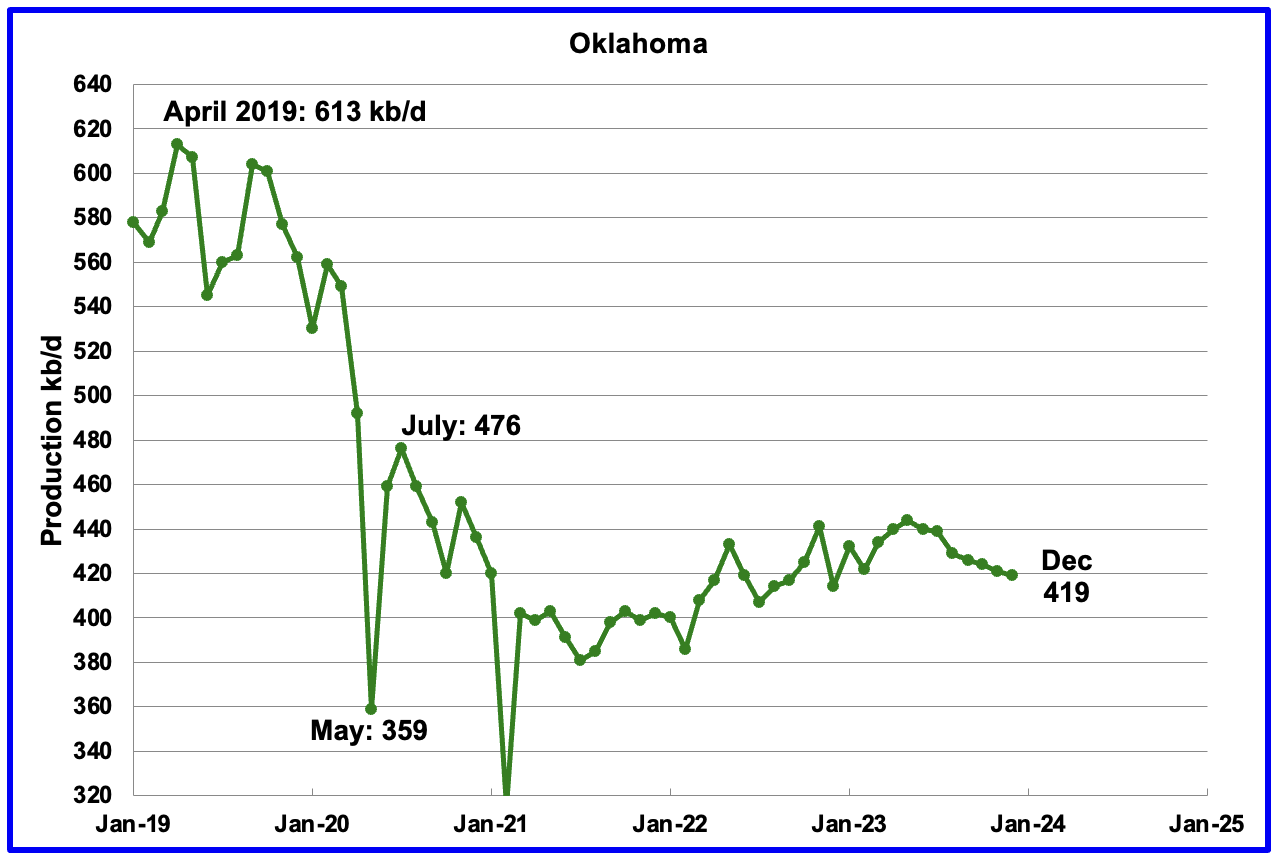
Oklahoma’s output in December decreased by 2 kb/d to 419 kb/d. Production remains 57 kb/d below the post pandemic July 2020 high of 476 kb/d. Output may have entered a slow declining phase.
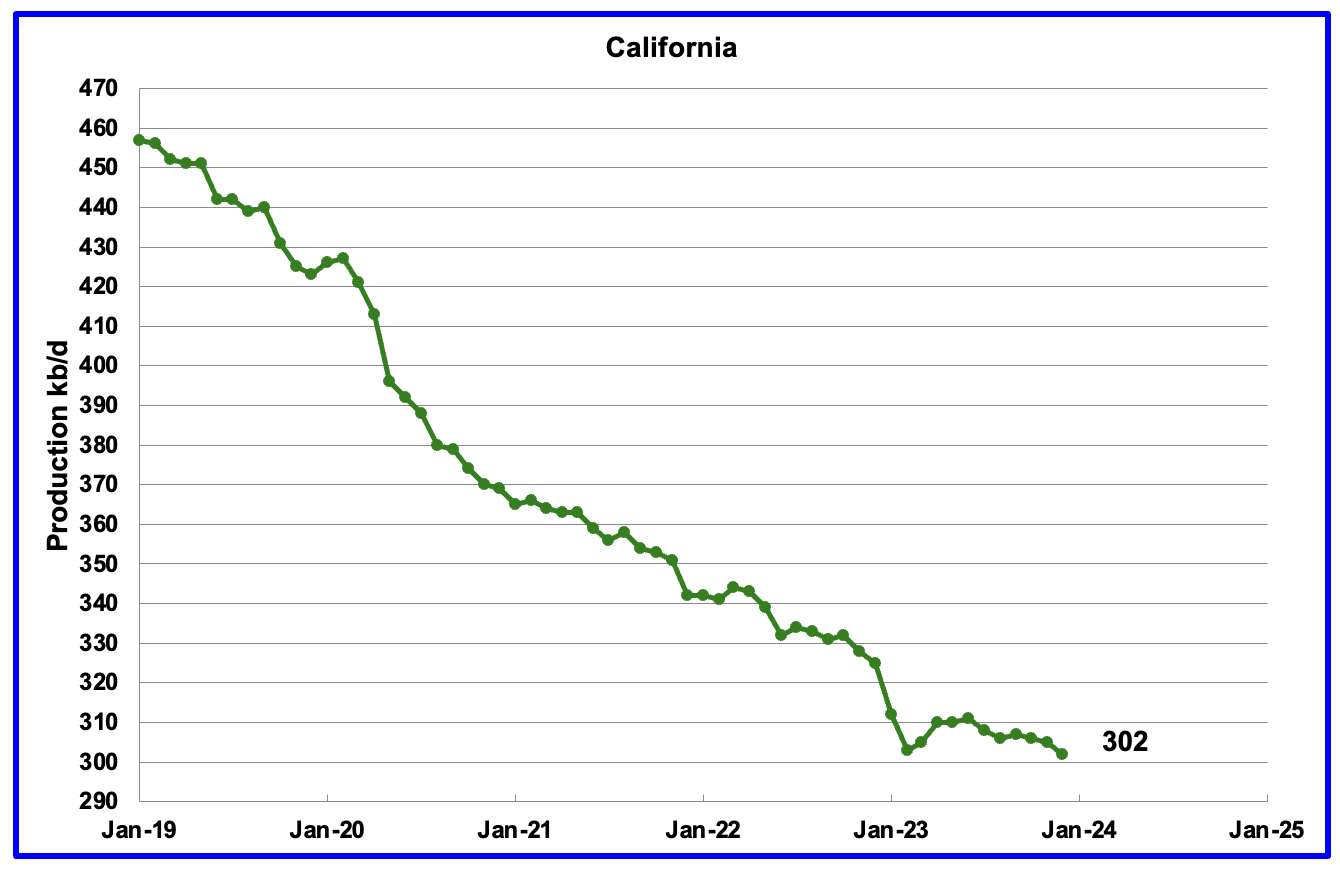
Californiaʼs December production continued its slow decline by dropping 3 kb/d to 302 kb/d.
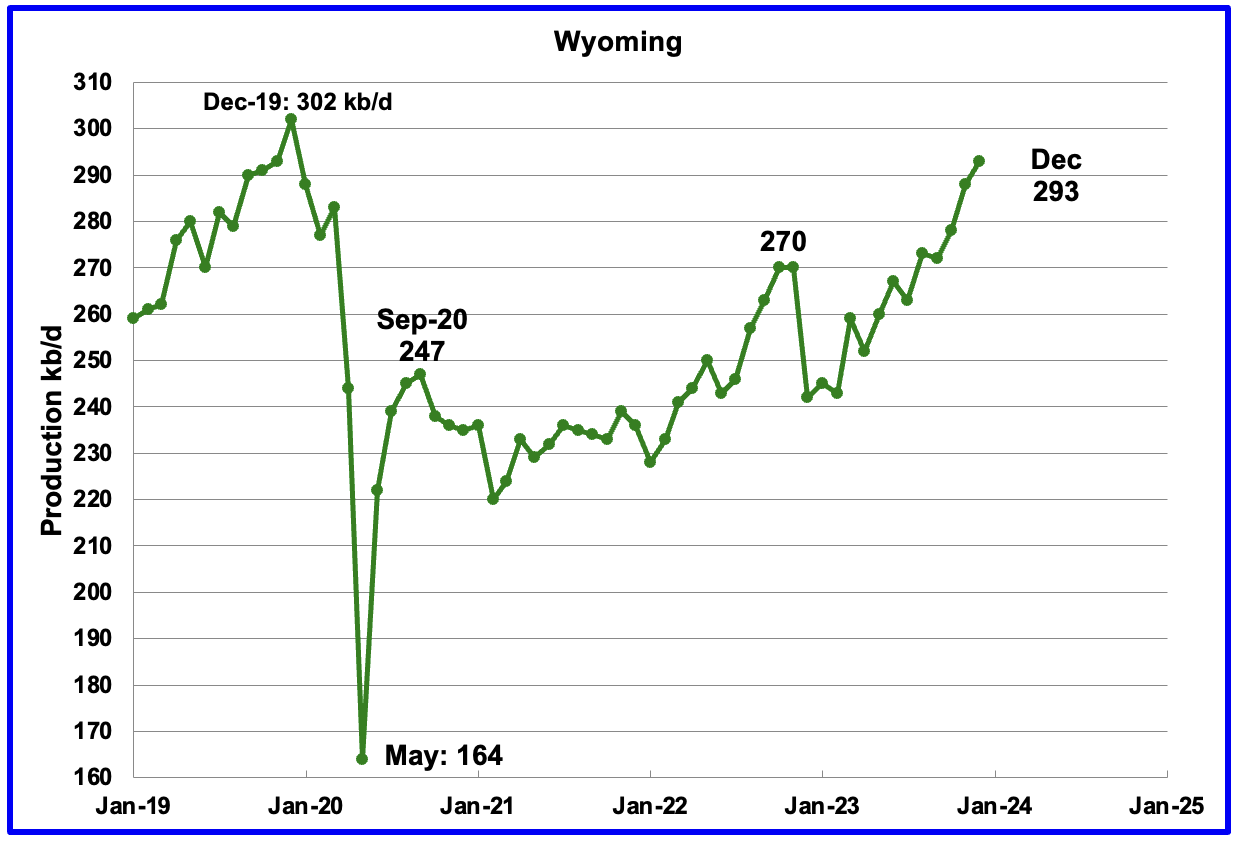
Wyoming’s oil production has been rebounding since March 2023. December’s oil production rose to 293 kb/d, a post pandemic record high. YoY its oil production increased by 51 kb/d.
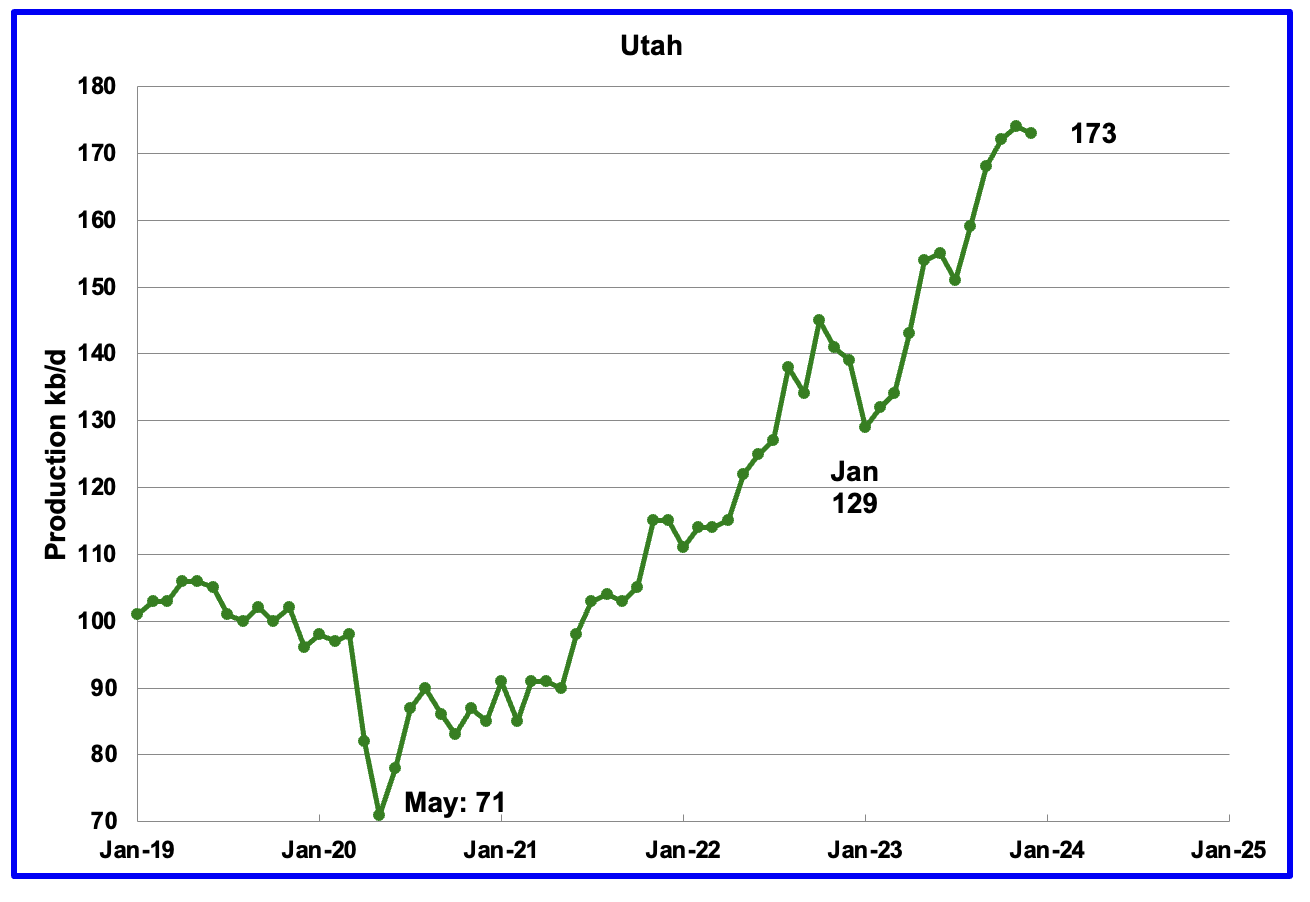
December’s production decreased by 1 kb/d to 173 kb/d. For the first 4 months of 2023, Utah had 7 rigs operating. Since May the number of operational rigs has bounced between 8 and 9, which may account for the increased production.
The increased production since February has come from the Uinta basin.
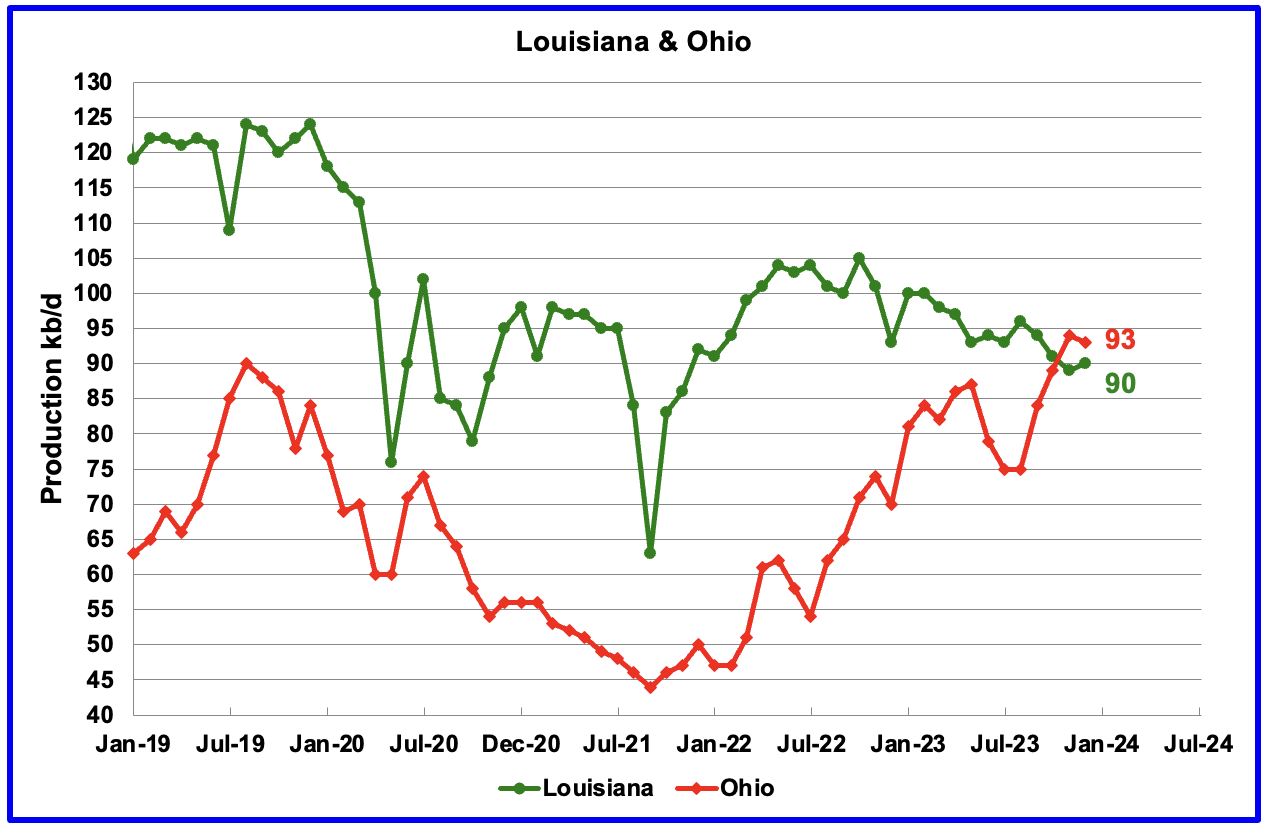
Ohio has been added to the Louisiana chart because Ohio’s production has been slowly increasing since October 2021 and passed Louisiana in November 2023.
Louisiana’s output entered a slow decline phase in October 2022. December’s production increased by 1 kb/d to 90 kb/d. Ohio’s oil production dropped by 1 kb/d to 93 kb/d after reaching a post pandemic high of 94 kb/d. Interestingly, the weekly rig count report does not show any rigs operating in Ohio.
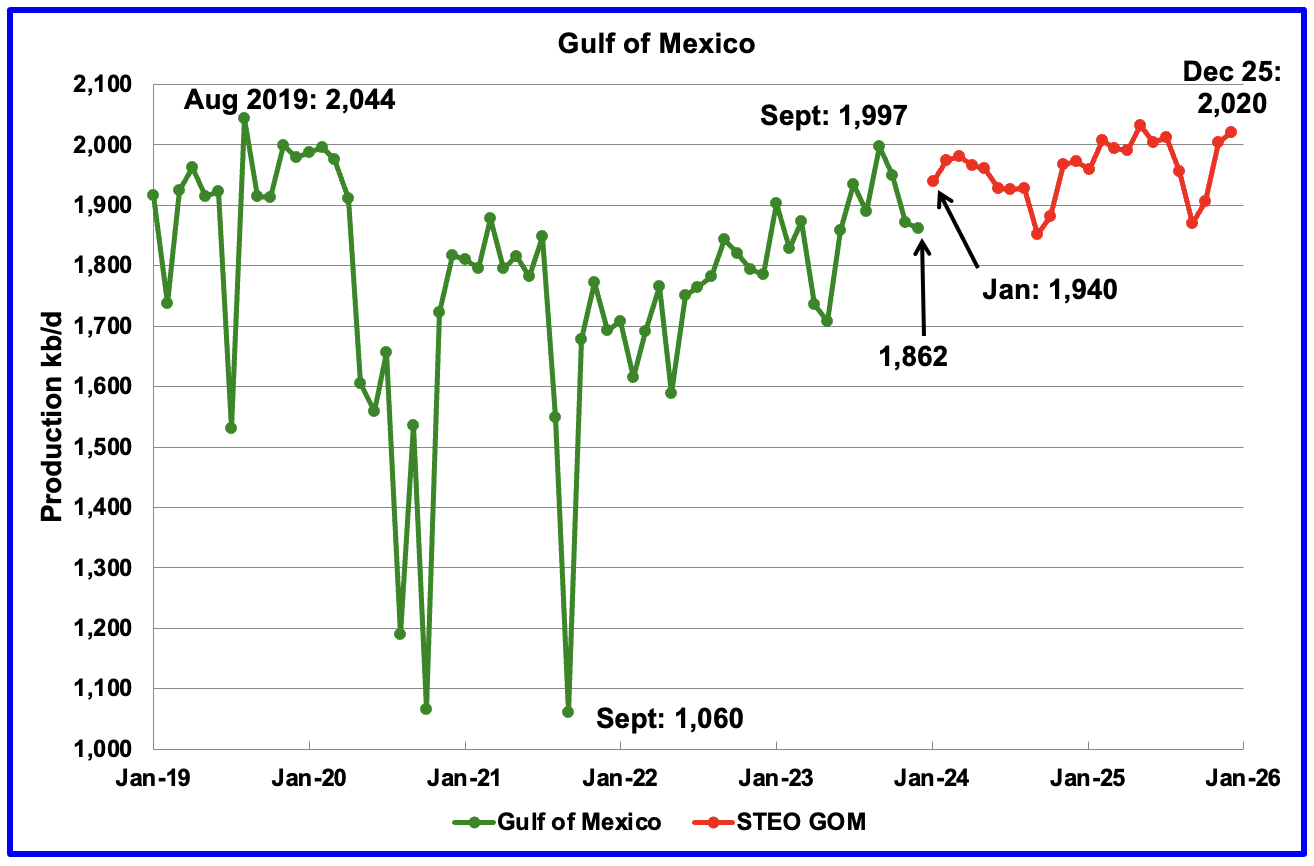
GOM production decreased by 10 kb/d in December to 1,862 kb/d but is expected to rebound in January by 78 kb/d to 1,940 kb/d.
The February 2024 STEO projection for the GOM output has been added to this chart. It projects production from January 2024 to December 2025 will increase by 80 kb/d to 2,020 kb/d.
It is not known if the GOM decline shown after April 2024 is related to a combination of extensive maintenance and a general decline of wells.
A Different Perspective on US Oil Production
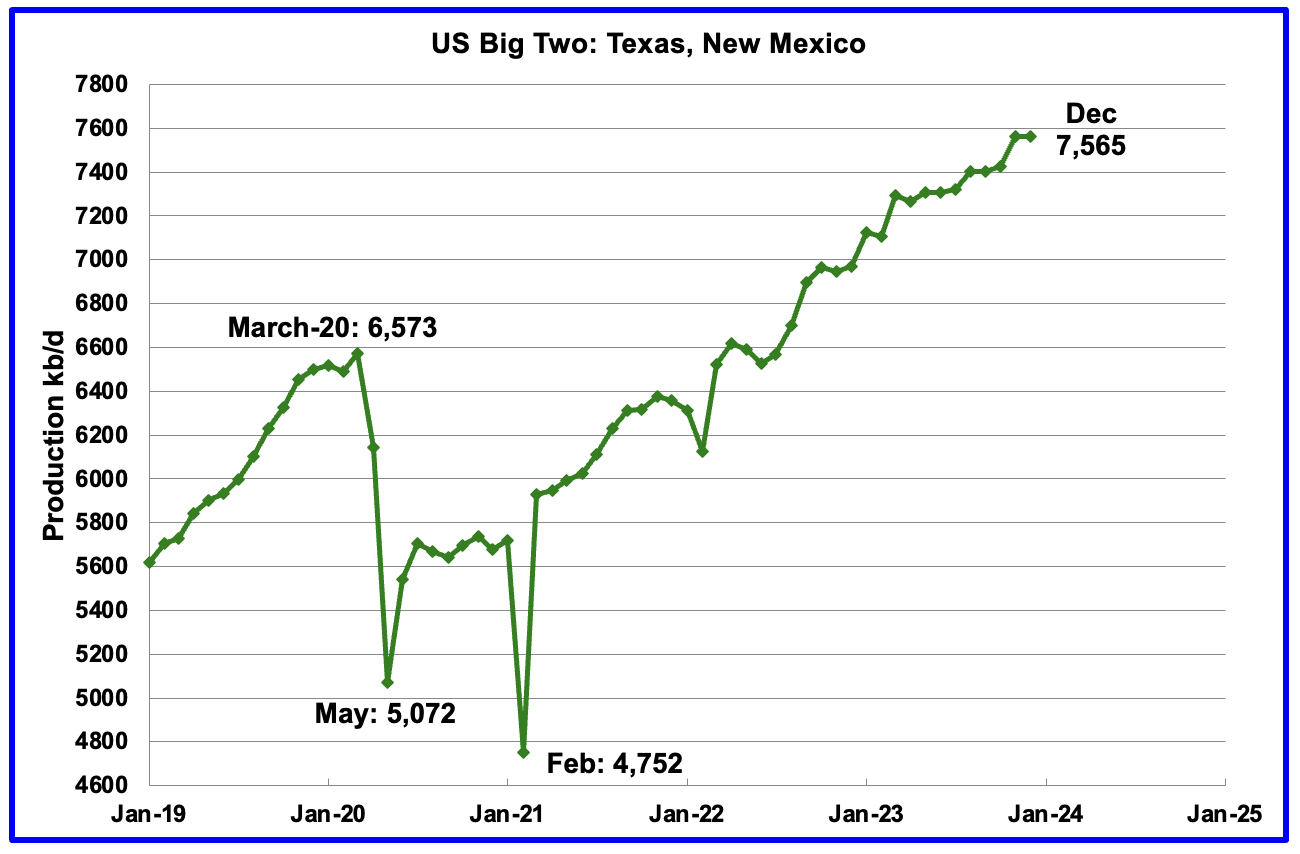
The Big Two states’ combined oil output for Texas and New Mexico.
December’s production in the Big Two states increased by a combined 3 kb/d to 7,565 kb/d with Texas dropping 20 kb/d while New Mexico added 23 kb/d.
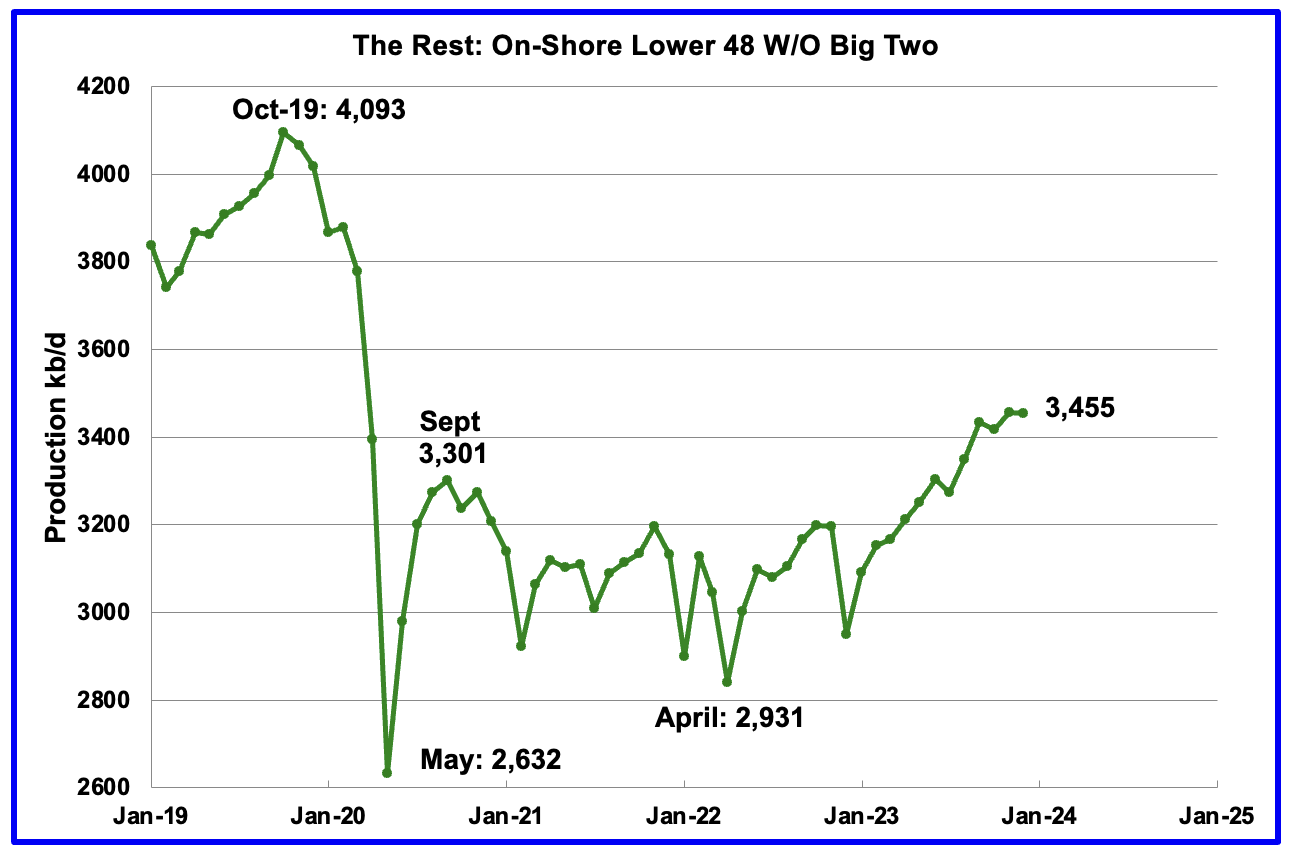
Oil production by The Rest
December’s production in The Rest decreased by 2 kb/d to 3,455 kb/d.
The main takeaway from The Rest chart is that current production is 638 kb/d below the high of October 2019 and is a significant loss that is slowly being recovered.
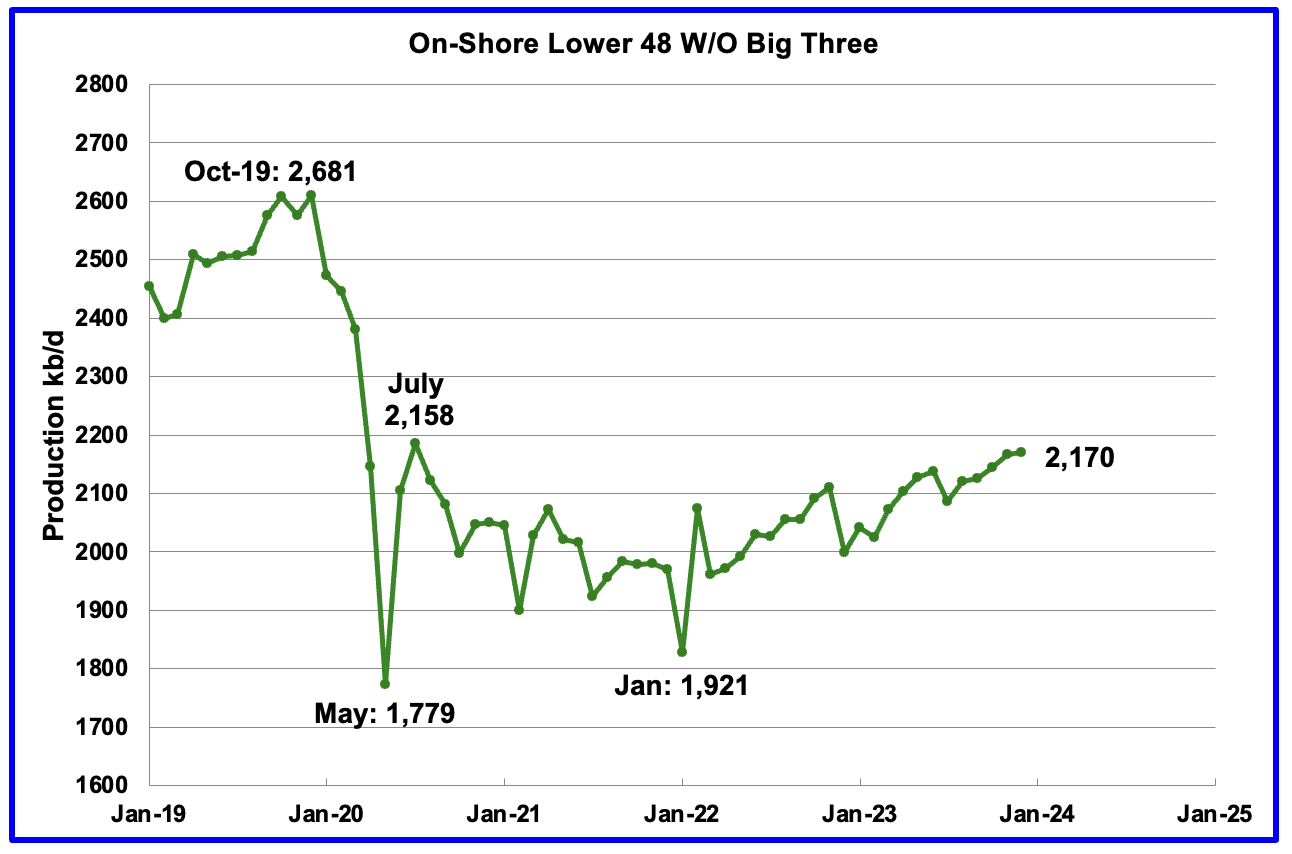
The On-Shore lower 48 W/O the big three, Texas, New Mexico and North Dakota, shows a slow rising production trend from the low of January 2022. December’s production increased by 3 kb/d to 2,170 kb/d.
Rig and Frac Spread Report for Week ending March 8
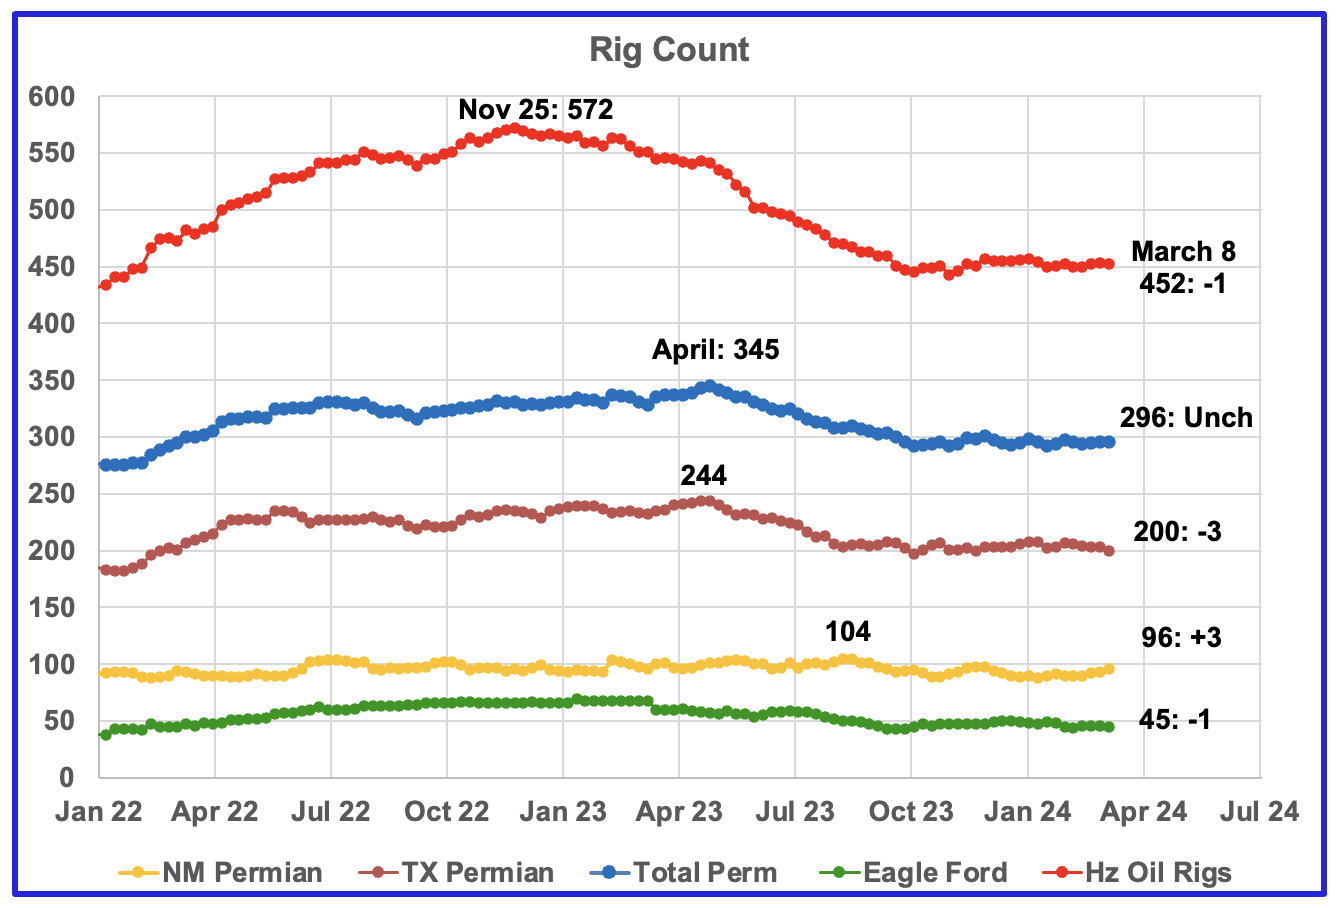
- US Hz oil rigs decreased by 1 to 452. The rig count continues to hover close to 450 since the beginning of October
- Permian rigs were unchanged at 296 and also have been flat around 295 since October 2023.
- Texas Permian was down 3 to 200 while NM was up 3 to 96. In New Mexico, Lea county was down 1 to 45 while Eddy added 4 to 51. Something is happening in Eddy county.
- Eagle Ford dropped 1 to 45
- NG Hz rigs were down 3 to 104, (not shown)
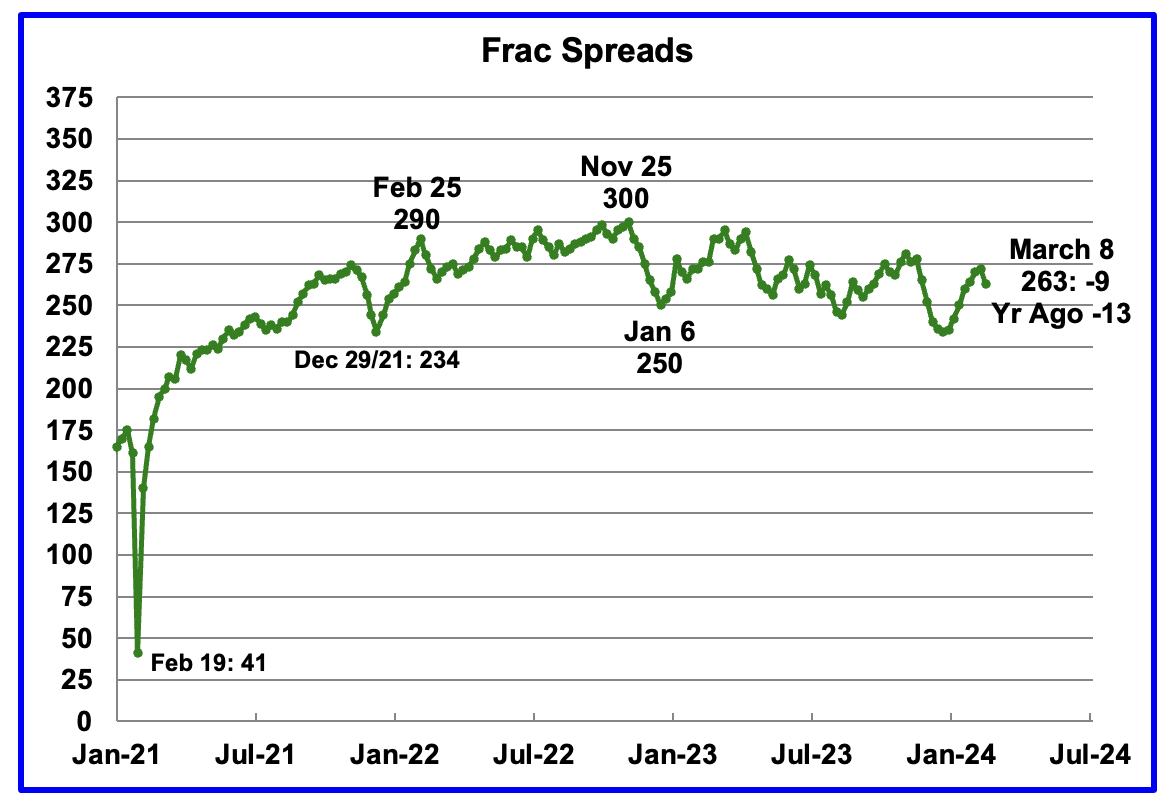
The frac spread count was down 9 to 263 and down 13 from one year ago. How high will the Frac count go in 2024? The chart is starting to show signs the frac spread count will bounce between 250 and 275 going forward.
Permian Basin Report by Main Counties and Districts
This special monthly Permian section was recently added to the US report because of a range of views on whether Permian production will continue to grow or will peak over the next year or two. The issue was brought into focus recently by the Goehring and Rozencwajg Report which indicated that a few of the biggest Permian oil producing counties were close to peaking or past peak. Also comments by posters on this site have similar beliefs from hands on experience.
This section will focus on the four largest oil producing counties in the Permian, Lea, Eddy, Midland and Martin. It will track the oil and natural gas production and the associated Gas Oil Ratio (GOR) on a monthly basis. The data is taken from the state’s government agencies for Texas and New Mexico. Typically the data for the latest two or three months is not complete and is revised upward as companies submit their updated information. Note the natural gas production shown in the charts that is used to calculate the GOR is the gas coming from both the gas and oil wells.
Of particular interest will be the charts which plot oil production vs GOR for a county to see if a particular characteristic develops that indicates the field is close to entering the bubble point phase. While the GOR metric is best suited for characterizing individual wells, counties with closely spaced horizontal wells may display a behaviour similar to individual wells due to pressure cross talking . For further information on the bubble point and GOR, there are a few good thoughts on the intricacies of the GOR in an earlier POB comment. Also check this EIA topic on GOR.
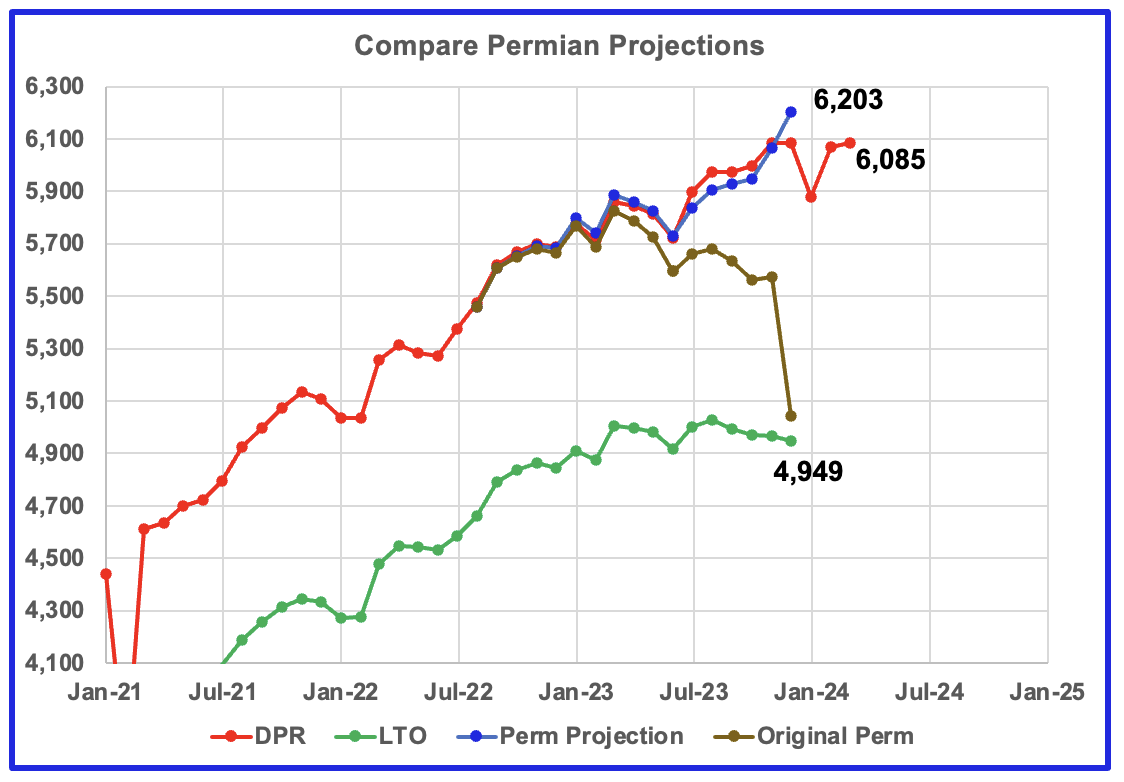
This chart shows three oil production graphs for the Permian basin updated to December and to March for the DPR. The gap between the DPR and LTO projections is there because the DPR projection includes both LTO oil along with oil from conventional wells in the basins that it covers.
The red and green graphs show oil production as published by the EIA’s DPR and the LTO offices. Comparing the two, it appears that the LTO office believes Permian LTO production is currently in a plateau/declining phase while the DPR office continues to show the beginnings of a plateau phase. The blue marker is a projection for Permian oil production. The brown chart is the sum of Permian production data as taken from the Texas RRC and the New Mexico Oil Conservation Division. The big January drop is due to severe weather in the central US.
The blue Permian projection graph only uses two months of production data, November and December, from the New Mexico OCD and the Texas RRC to make its December projection. The blue graph follows the DPR very closely up to November 2023. The large difference for December may be due to the significant under reporting of Texas Permian production in November in the previous US post. This under reporting results in larger December monthly increments which may account for the 119 kb/d December gap between the DPR and the Permian projection. January production data should resolve this discrepancy.
New Mexico Permian
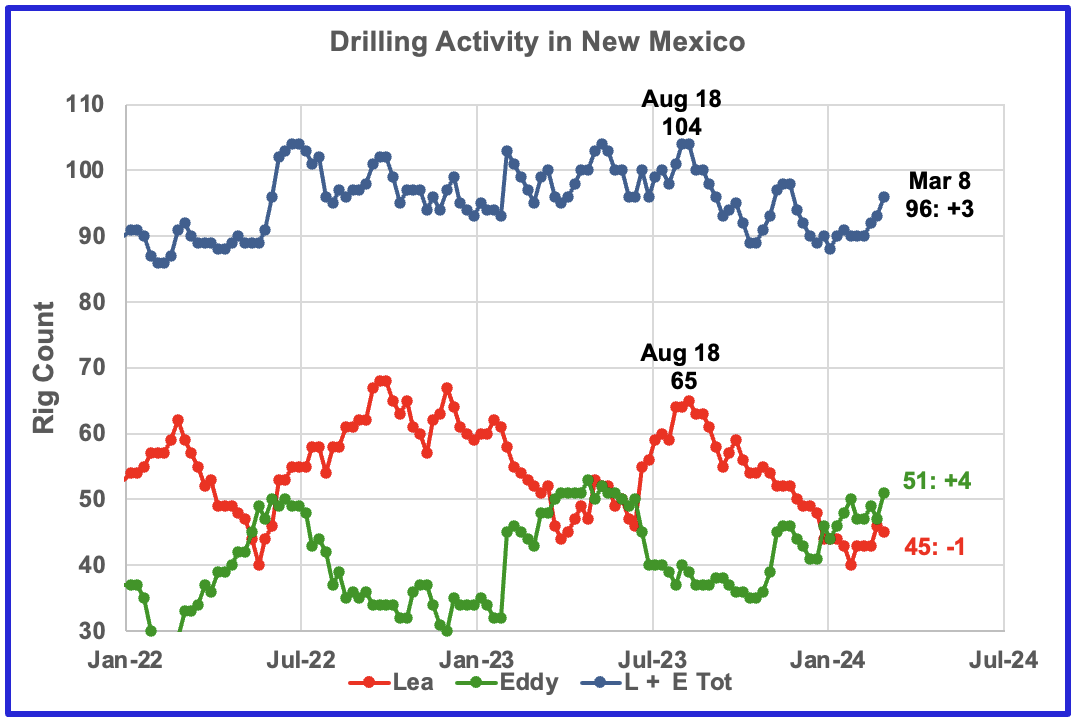
From August 2023 to January 2024, drilling activity in Lea county fell each month. In February, the rig count was steady at 43. For the week ending March 8, the rig count in Lea county dropped 1 to 45 while Eddy added 4 to 51. Something is happening in Eddy county which will take at least six months to show up.
Since the middle of August, the Lea county rig count has dropped from 65 rigs to 45 rigs in March 2024. At the same time November production in Lea county increased by 59 kb/d while December dropped by 15 kb/d, see next chart.
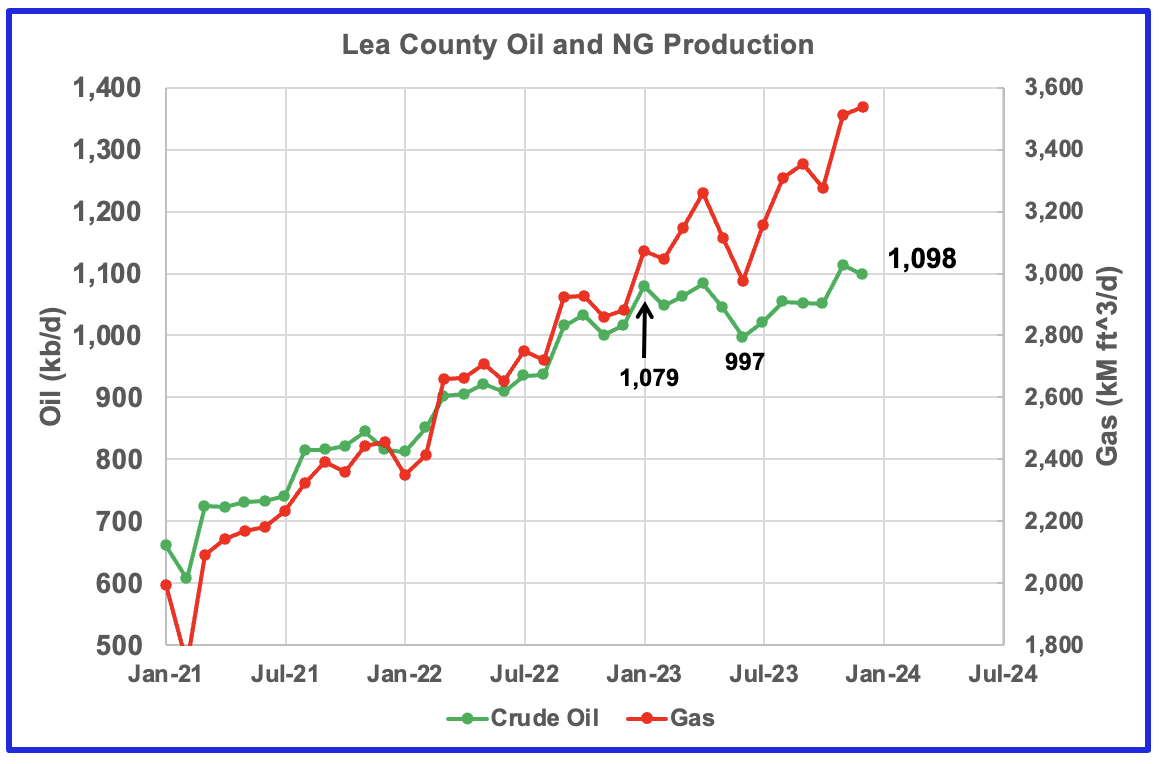
December oil production decreased by 15 kb/d from its record 1,113 kb/d to 1,098 kb/d. The recent rig count drop of 20 rigs since August 18, 2023 could be beginning to show up in a production drop. Assuming the average spud to production time is 6 to 12 months, the November production increase must be associated with a number of June 2023 drilled wells coming online in November. The December drop may be foretelling that Lea county is close to peak production and may be reflecting the dropping rig count that started in August 2023. Note there has been very little production increase since January 2023, 1,079 kb/d to 1,098 kb/d, up by 19 kb/d.
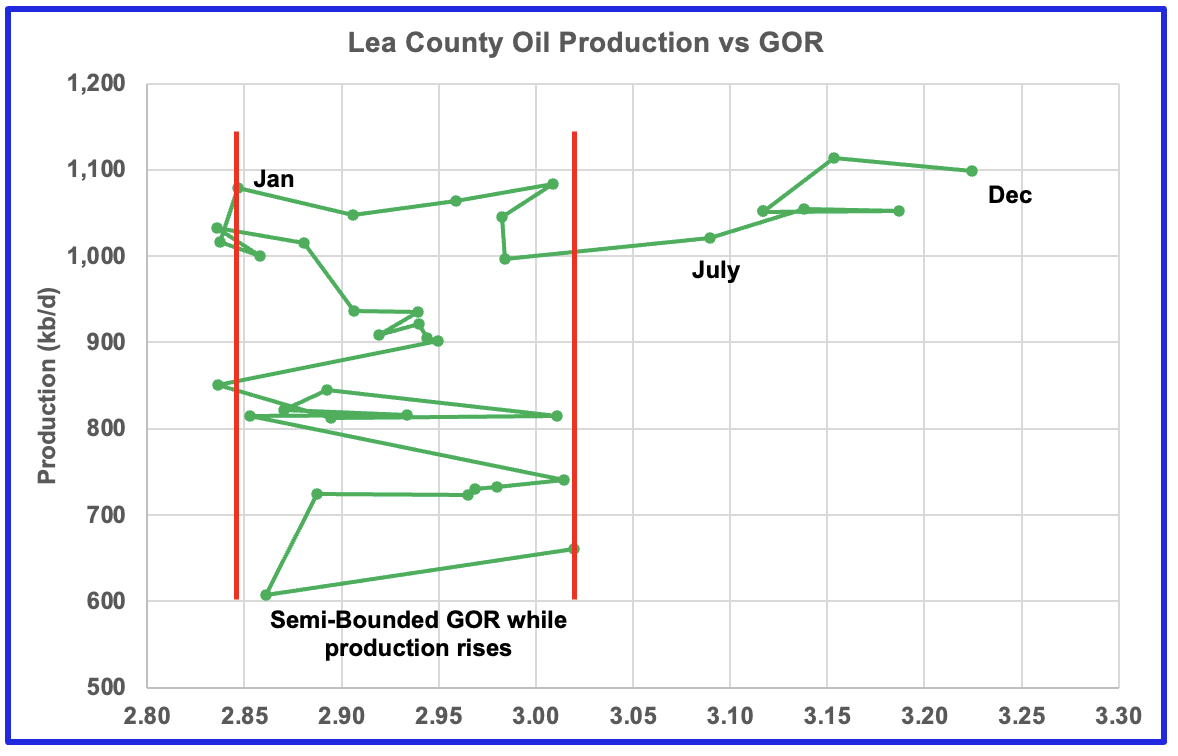
After much zigging and zagging, oil production in Lea county stabilized above 1,000 kb/d. Once production reached its new high in January 2023, production essentially plateaued but the GOR started to increase and entered the bubble point phase in July 2023.
November oil production in Lea county hit a new high of 1,113 kb/d. However, December production dropped by 15 kb/d while the GOR made a new high of 3.22. From January 2023 to December 2023, the GOR increased rapidly from 2.85 to 3.22. In comparison, note that from January 2021 to June 2023, the GOR remained within the semi bounded range of 2.85 to 3.02.
The November production increase must be related to the significant increase in drilling that started in mid June 2023. The December drop may be hinting at further production declines in the coming months as the drop in drilling activity after August 2023 starts to kick in.
This zigging and zagging GOR pattern within a semi-bounded GOR while oil production increases to some stable level and then moves out to a higher GOR to the right has shown up in a number of counties. See an additional two cases below. This is the sixth month in which Lea county has registered a GOR outside the semi-bounded GOR range.
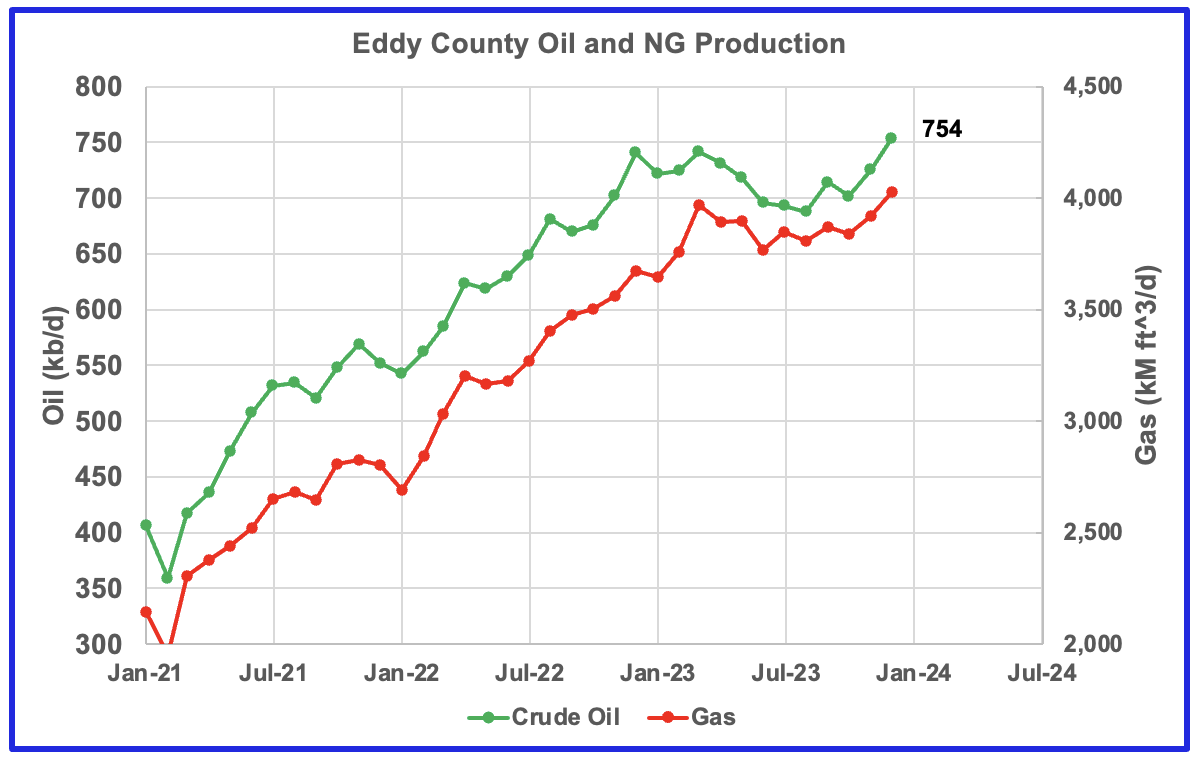
Eddy county oil production had been showing signs that it was in a plateau phase up to November 2023. However, December production hit a new high 754 kb/d and has been increasing since October. The increase could be associated with the large increase in the rig count in February 2023.
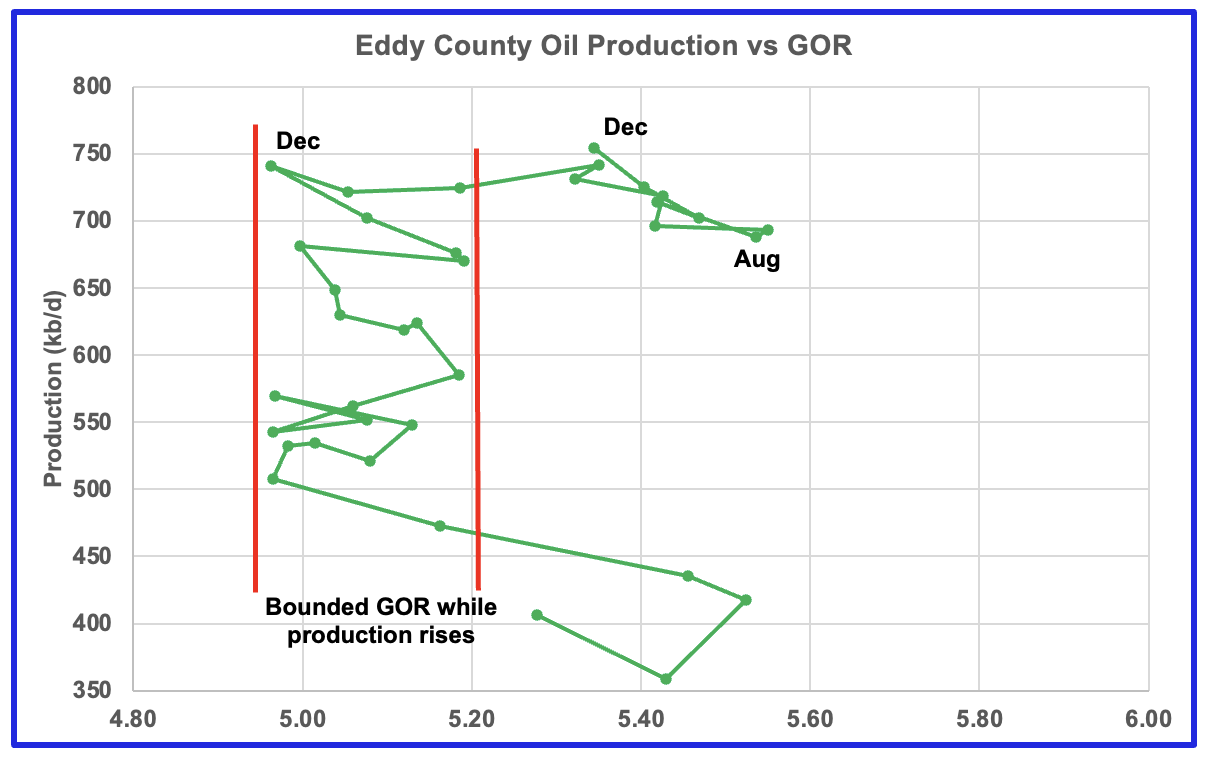
The Eddy county GOR pattern is similar to Lea county except that Eddy broke out from the semi bounded range earlier and for a longer period while oil production has been bouncing around the 700 kb/d to 750 kb/d level. However August saw a reversal in the GOR trend by decreasing which then was followed by a November oil production increase which reached a new high in December, an atypical pattern. Could this indicate that drilling in Eddy county has punched into a new bench?
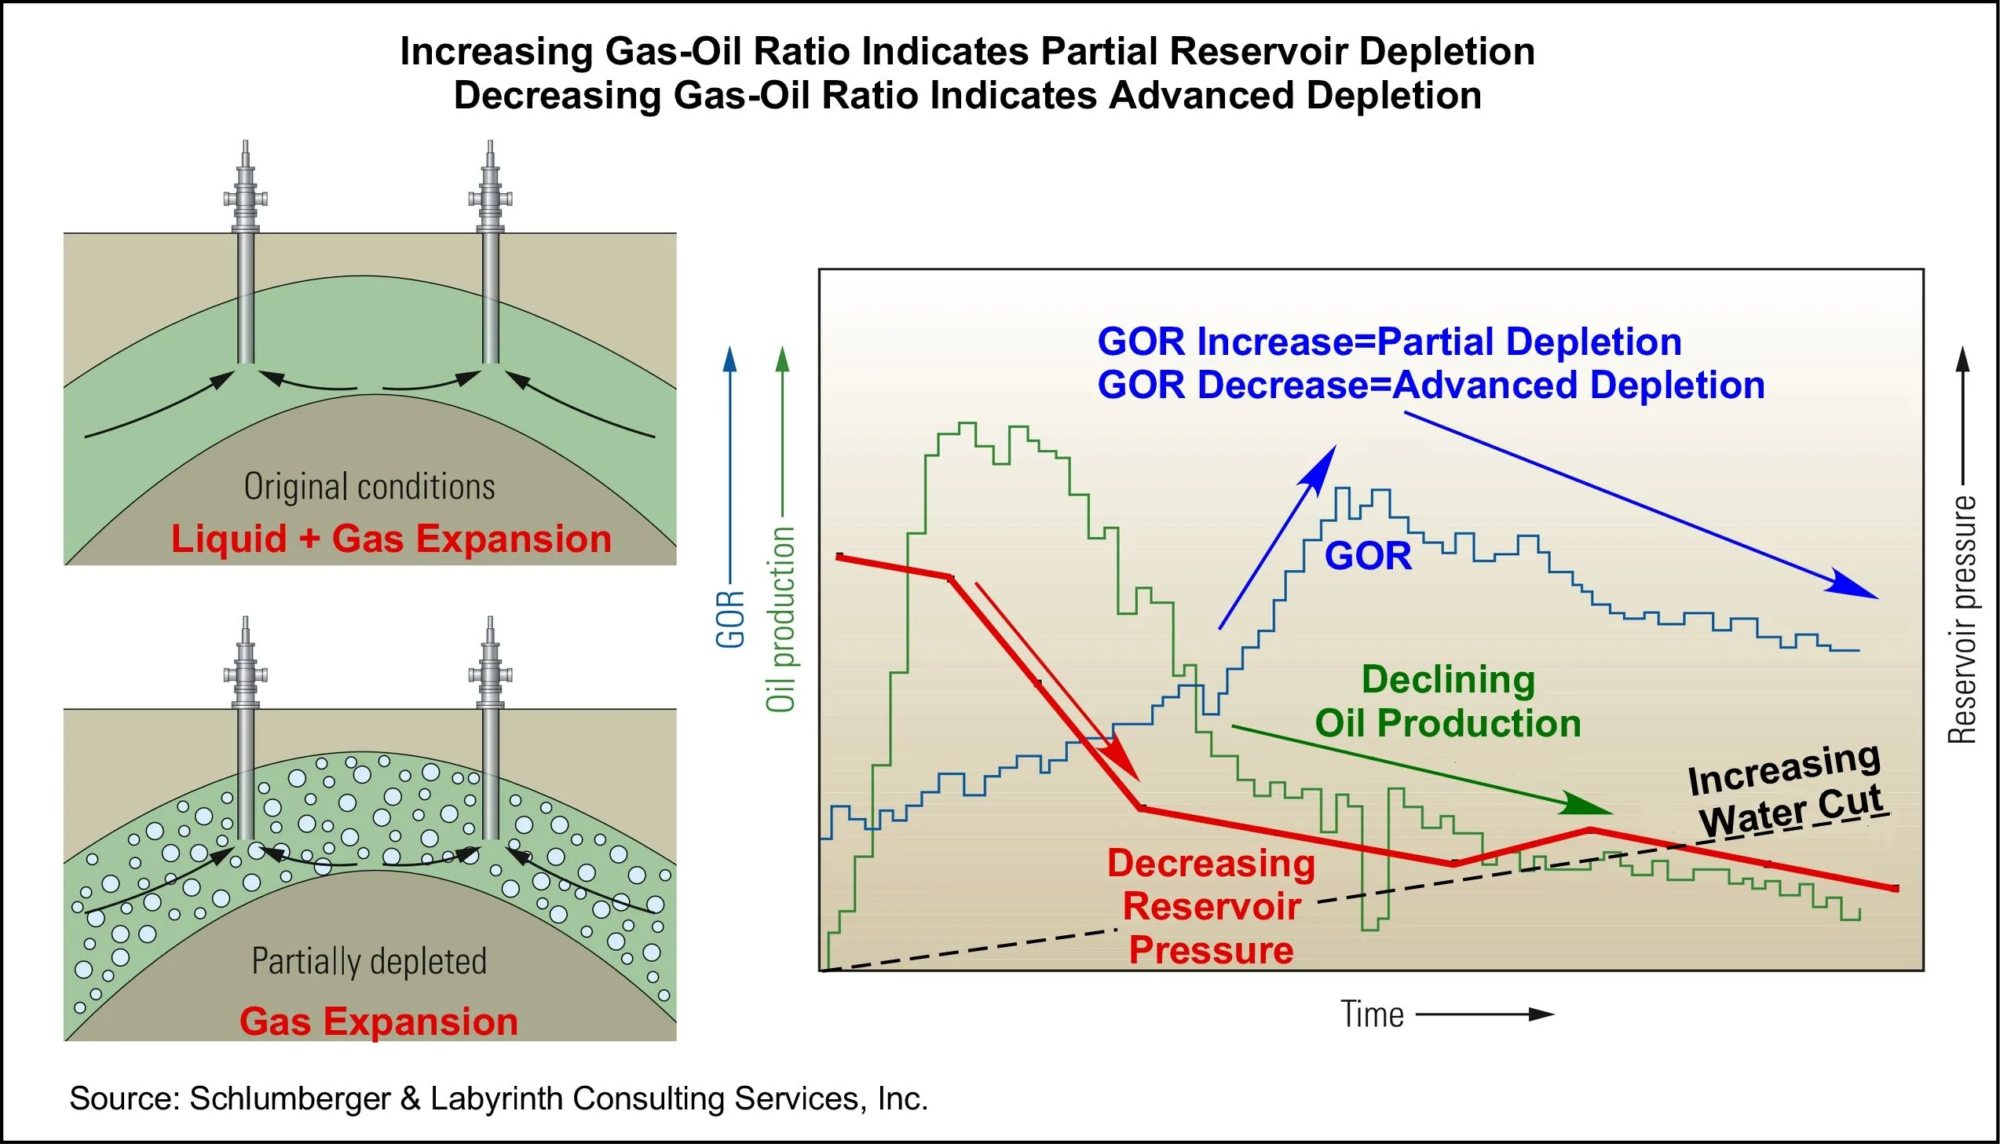
This graphic was taken from https://www.oilystuff.com/forumstuff a few weeks ago. It shows oil production rising rapidly at the front end while reservoir pressure slowly drops. The GOR continues to rise after peak production and then displays a change in slope as it heads for peak GOR. Not clear if that is an indication of the reservoir moving deeper into the bubble point phase. It is interesting how the graphic categorizes the state of a reservoir, depending on whether the GOR is increasing or decreasing.
GOR Decrease = Advanced Depletion.
Unfortunately this graphic does not explain the current behaviour of oil production in Eddy county. The GOR is dropping and oil production is increasing. Possible explanations are that the latest wells are producing oil at a higher than previous average or the wells are being drilled into a new bench.
Texas Permian
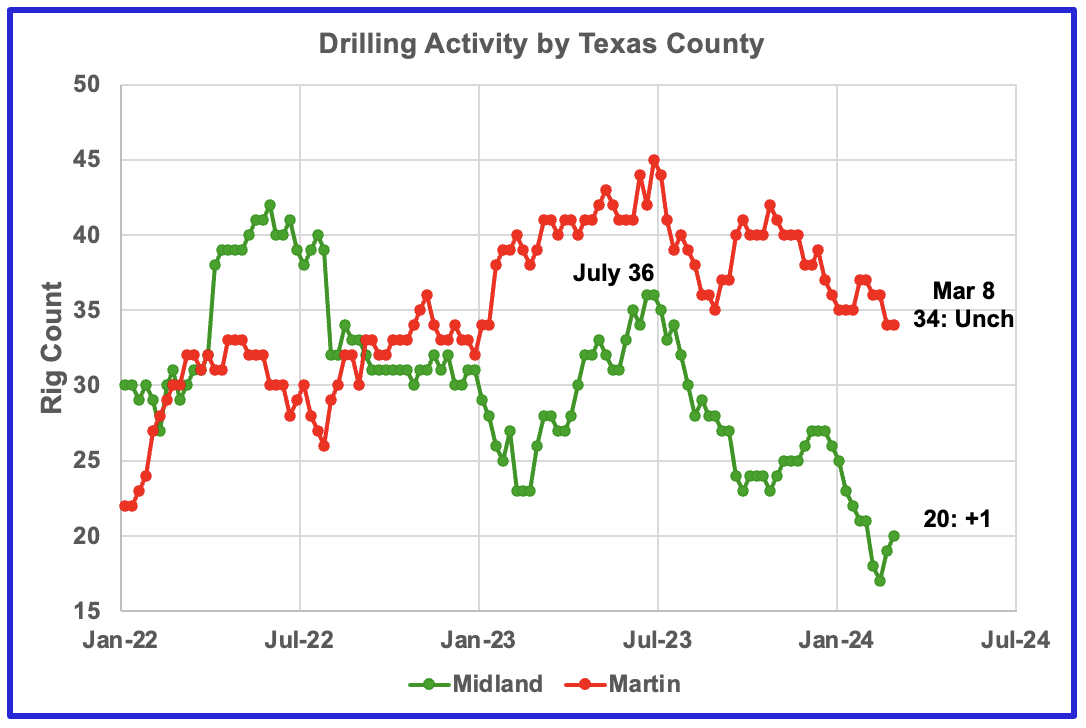
The rig count in Midland county started to increase in late February. Martin county rigs continue to drop from the high of July 2023.
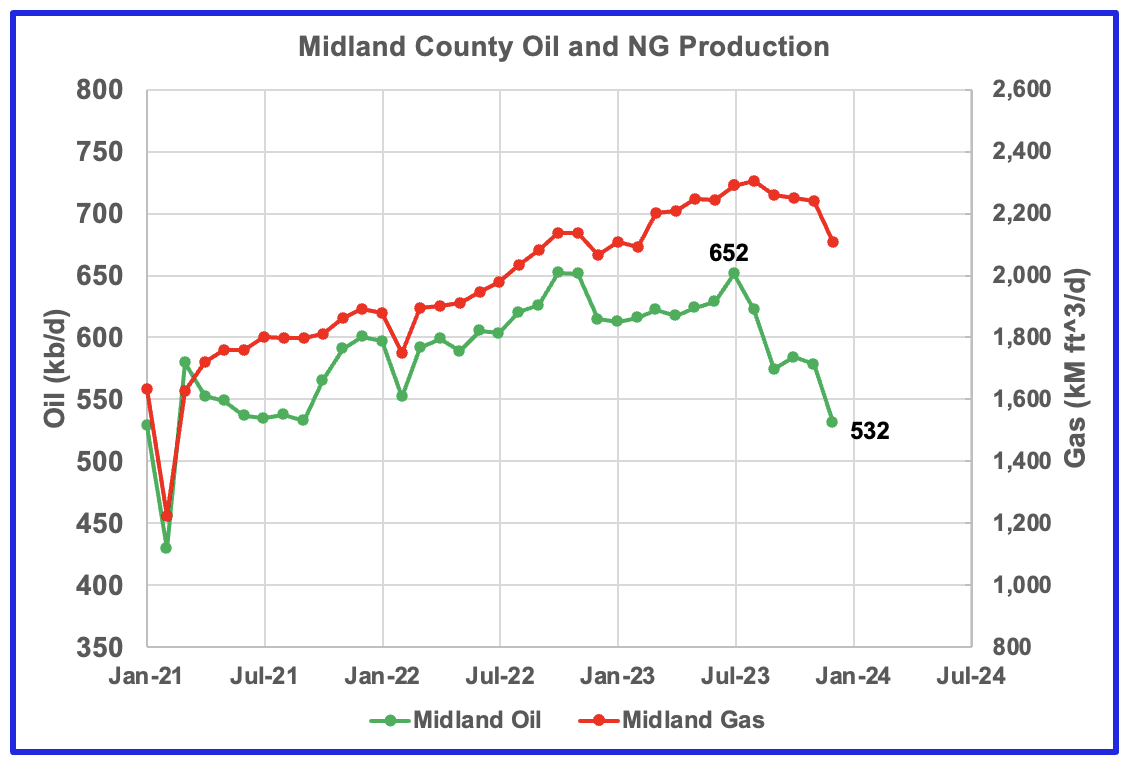
Both natural gas and oil production are dropping in Midland county. December Oil production has dropped by 120 kb/d to 532 kb/d since July 2023.
Comparing the drop in production with the rig count, one could speculate that the drilling peak in June 2022 could account for the July 2023 oil production peak. Note the sharp drop in the rig count at the end of July 2022 which could explain the rapid drop in Midland production that started in July 2023.
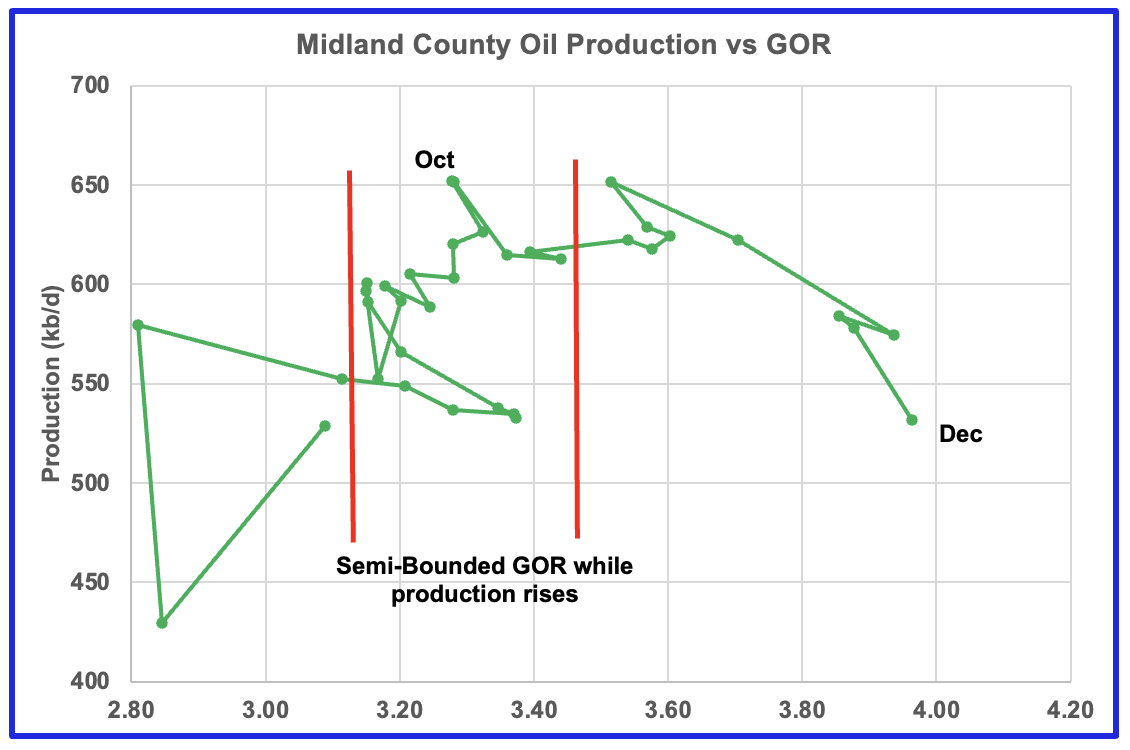
It appears that Midland county is deep into the bubble point phase. Oil production is dropping and the GOR is increasing.
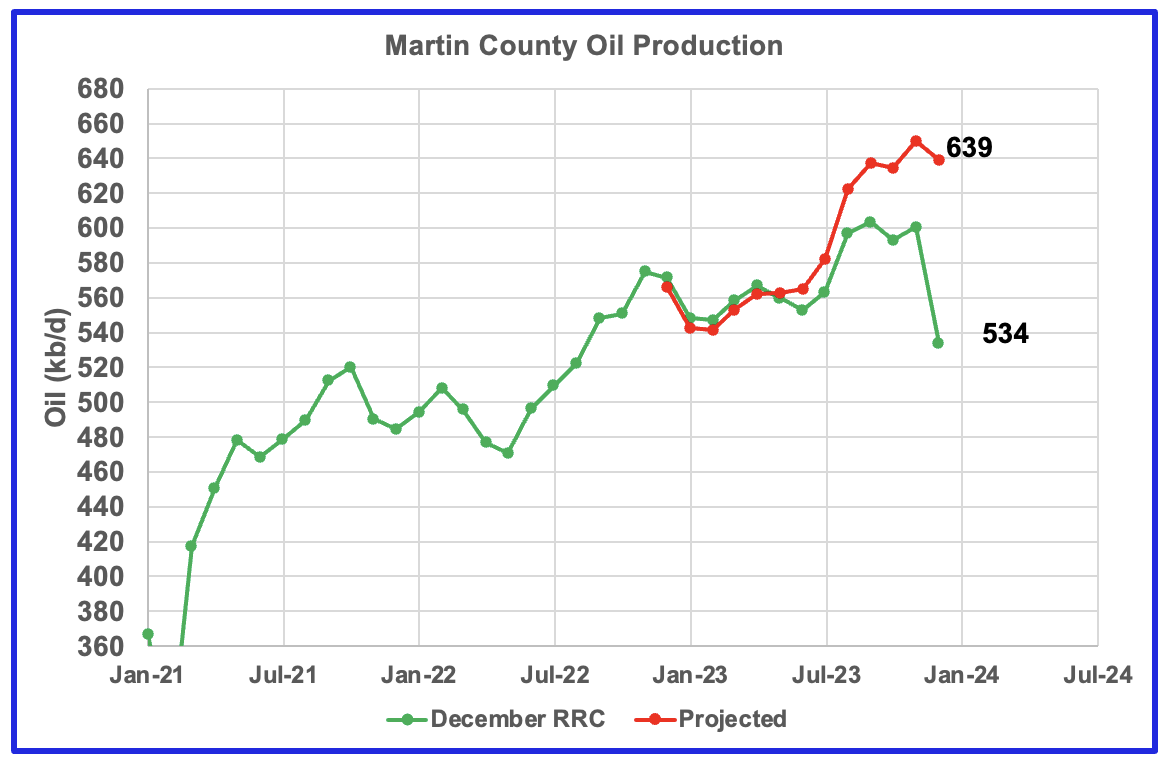
This chart shows the Texas RRC oil production for Martin County up to December 2023. It is indicating initial signs of plateauing. The projection is also hinting at the beginning of a plateau phase.
The red graph is a production forecast which the Texas RRC could be reporting for Martin county about one year from now as drillers report additional updated production information. This projection is based on a methodology that used November and December production data and will be re-estimated next month.
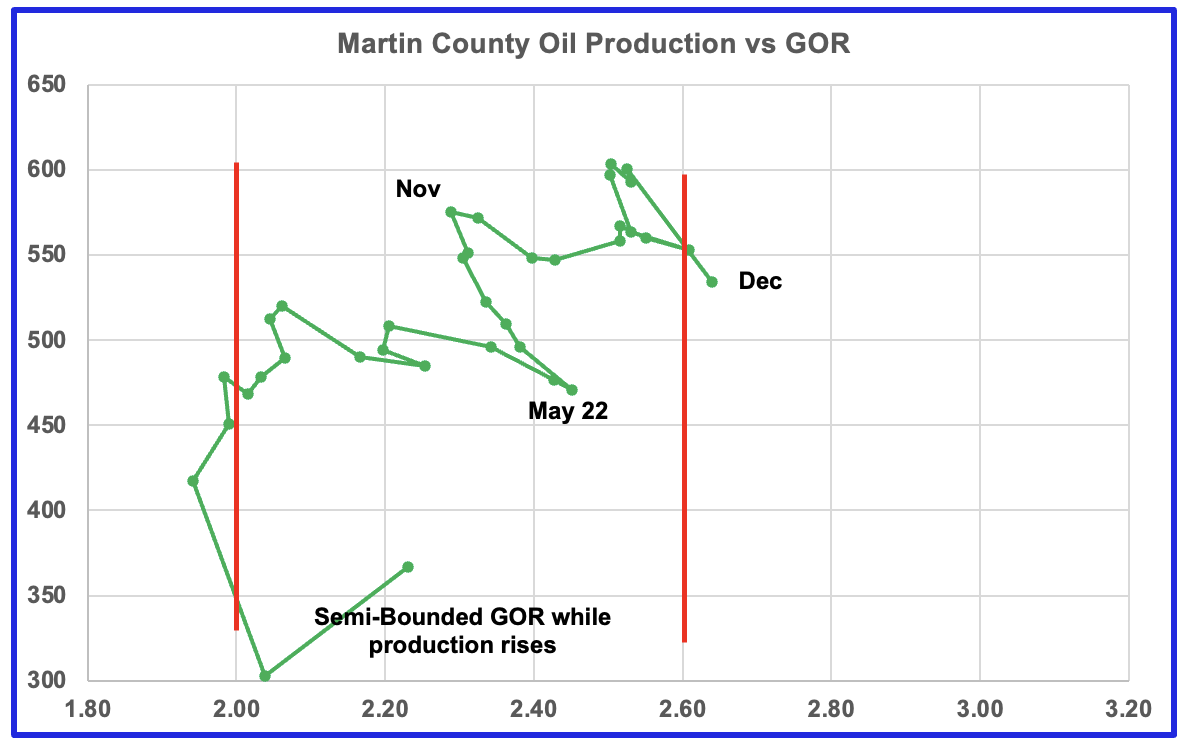
Martin county’s oil production and GOR up to November stayed within the semi bounded range and near peak oil production. However December saw the GOR just barely move out of the semi-bounded range for the first time along with a drop in production. Martin county has the lowest GOR of the four counties at a GOR of 2.64. Martin may be on the verge of entering the bubble point phase that results in a dropping oil production trend.
Exactly where to put the right hand red GOR boundary for Martin county is not exactly obvious. It is possible that the right boundary should be closer to a GOR of 2.5. The GOR started to reverse direction in June 2022 and oil output rose to a new high. In December 2022 the GOR began to increase and production hit a new high of 603 kb/d and a GOR of 2.5 in September 2023. The GOR has been increasing since then and production has dropped. This makes it more likely that Martin county entered the bubble point phase in December 2023. A few more months of data will clarify the situation.
Findings for the Four Counties
- Lea: It is in the plateau phase and possibly close to peak oil production. GOR still increasing.
- Eddy: Oil production increasing even though the GOR is in bubble point phase and decreasing. The rig count is also increasing.
- Midland: Oil production falling while GOR continues to increase.
- Martin: Oil production could be entering the plateau and bubble point phase. The GOR has continued to increase since November 2022 while production has remained in the 525 kb/d to 600 kb/d range and coincidentally may have entered the bubble point phase.
Texas District 8
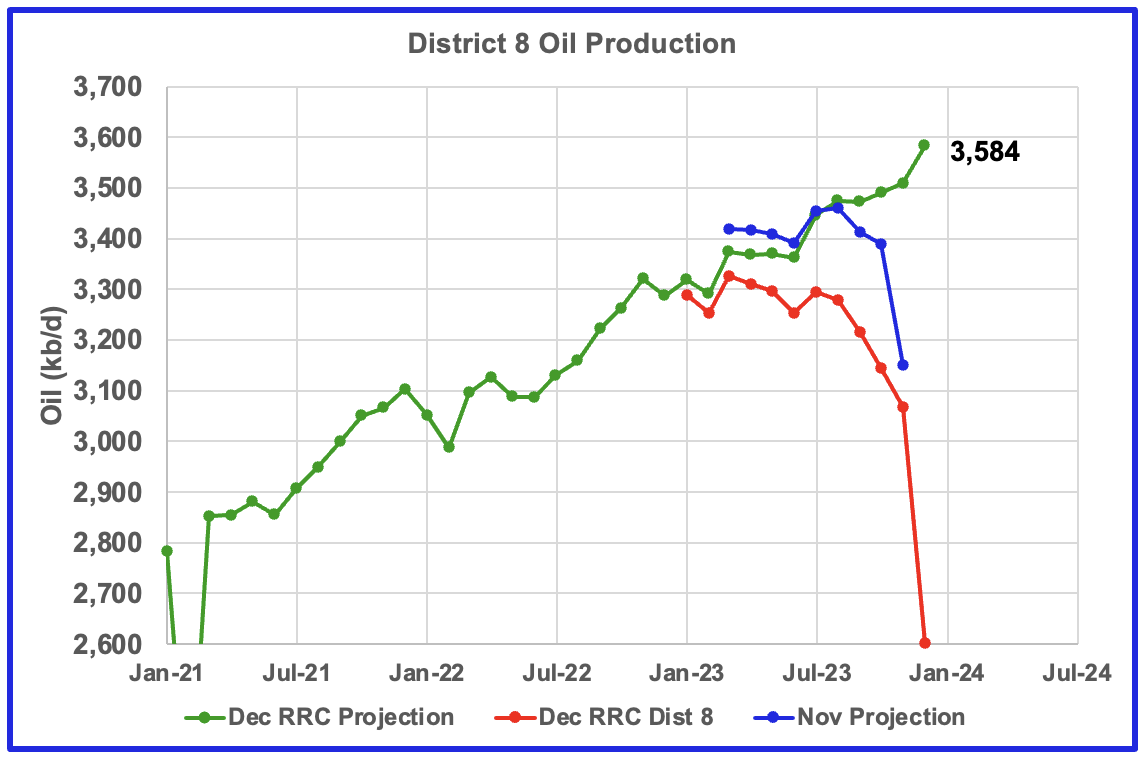
Texas District 8 contains both the Midland and Martin counties. Combined these two counties produce close to 1,200 kb/d of oil. While these two counties are the two largest oil producers, there are many others with smaller production that results in total production of close to 3,500 kb/d. Essentially the Midland and Martin counties produce 1/3 of the District 8 oil.
This chart shows two projections for District 8 oil production. The blue graph, derived from November and October production data indicates that District 8 production could be on a plateau and possibly starting to decline. The green graph, derived from December and November production data indicates that oil production could still be rising. The difference, I think, is due to the under reporting of the November Texas RRC data. This leads to under projecting production in the blue graph and over projecting production in the green graph.
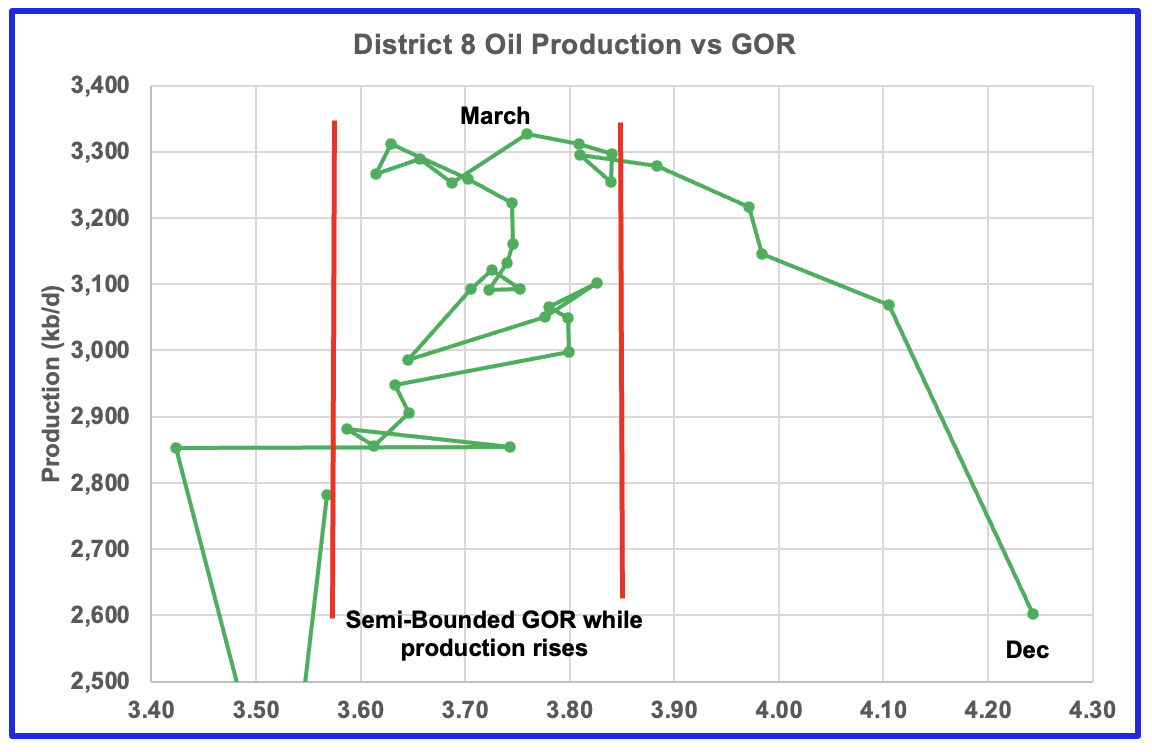
Plotting an oil production vs GOR graph for a district may be a bit of a stretch. Regardless here it is and it seems to indicate many counties may be well into the bubble point phase.
Eagle Ford Basin Largest County
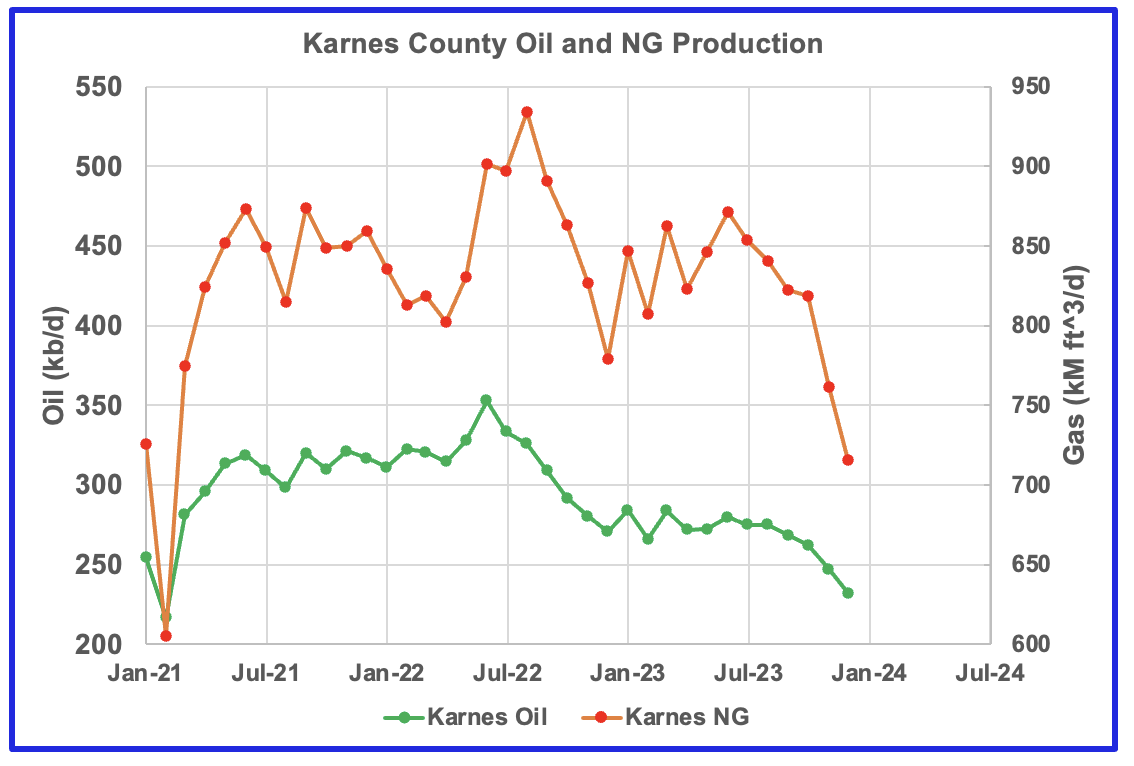
Karnes county is the biggest oil producing county in the Eagle Ford basin and is ranked as the seventh largest oil producing county in Texas. Both oil and gas production are falling in Karnes county and both are down close to 30% from the peak. Karnes county is in decline and past its peak.
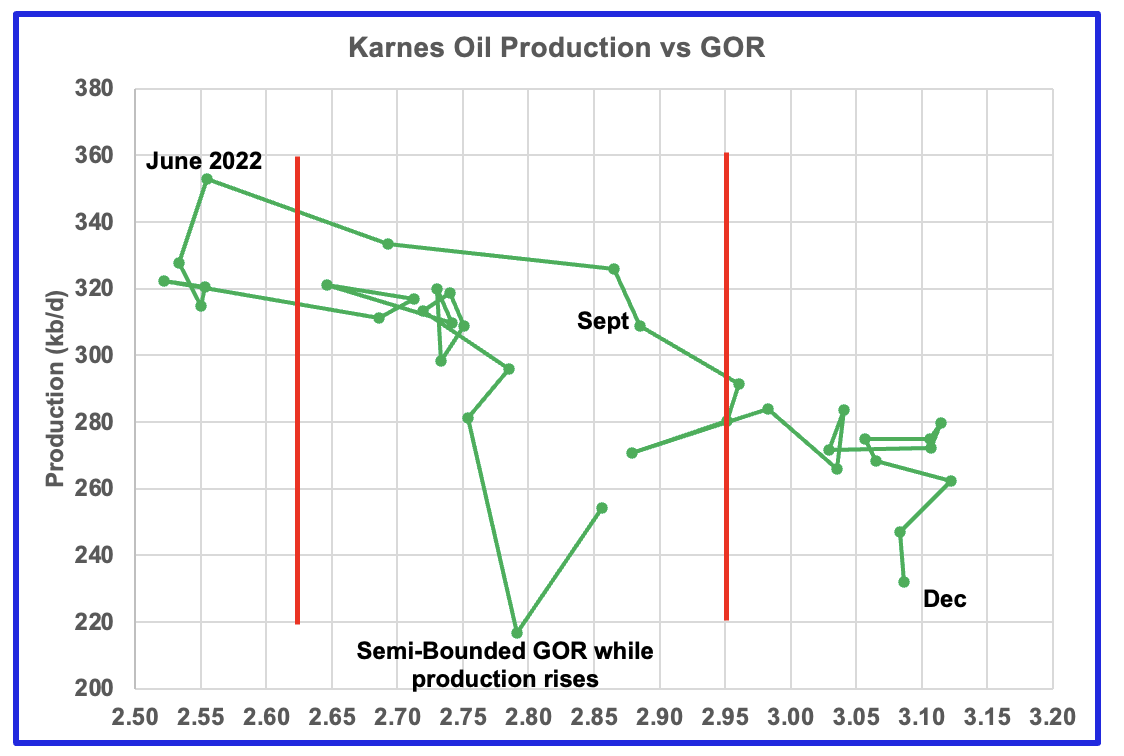
This is the GOR vs oil production chart for Karnes county. The GOR has now moved out of its typical semi bounded range while oil production drops. The rapid move to larger GORs started in June 2022. Karnes county ranks thirteenth in Texas natural gas production.
Drilling Productivity Report
The Drilling Productivity Report (DPR) uses recent data on the total number of drilling rigs in operation along with estimates of drilling productivity and estimated changes in production from existing oil wells to provide estimated changes in oil production for the principal tight oil regions. The February DPR report forecasts production to March 2024 and the following charts are updated to March 2024. The DUC charts and Drilled Wells charts are updated to January 2024.
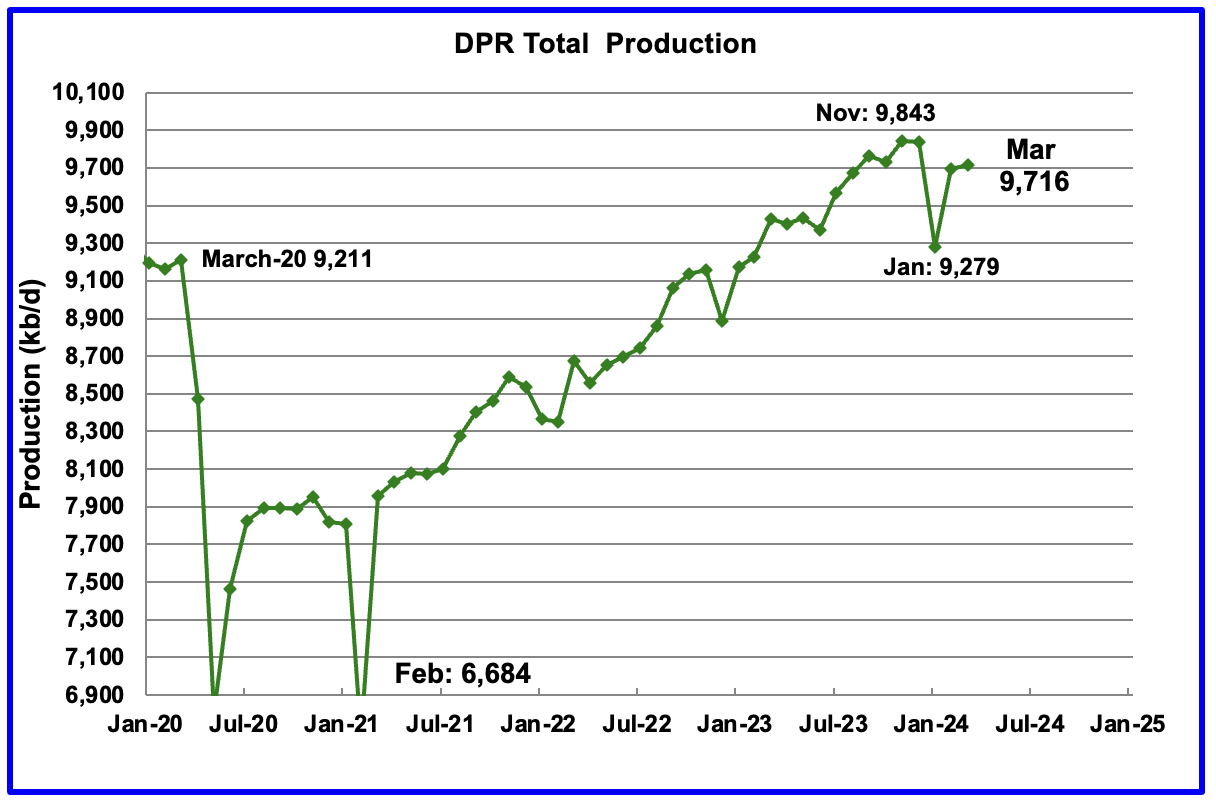
Above is the total oil production projected to March 2024 for the 7 DPR basins that the EIA tracks. Note that DPR production includes both LTO oil and oil from conventional wells.
The DPR is projecting that oil output for March 2024 will increase by 20 kb/d to 9,716 kb/d.
The March report has also made a substantial upward revision to its previous production forecast. For November, DPR production was revised up by 160 kb/d to 9,843 kb/d. For February, production was revised up by 16 kb/d to 9,696 kb/d. The large January drop is related to severe winter weather across the central US.
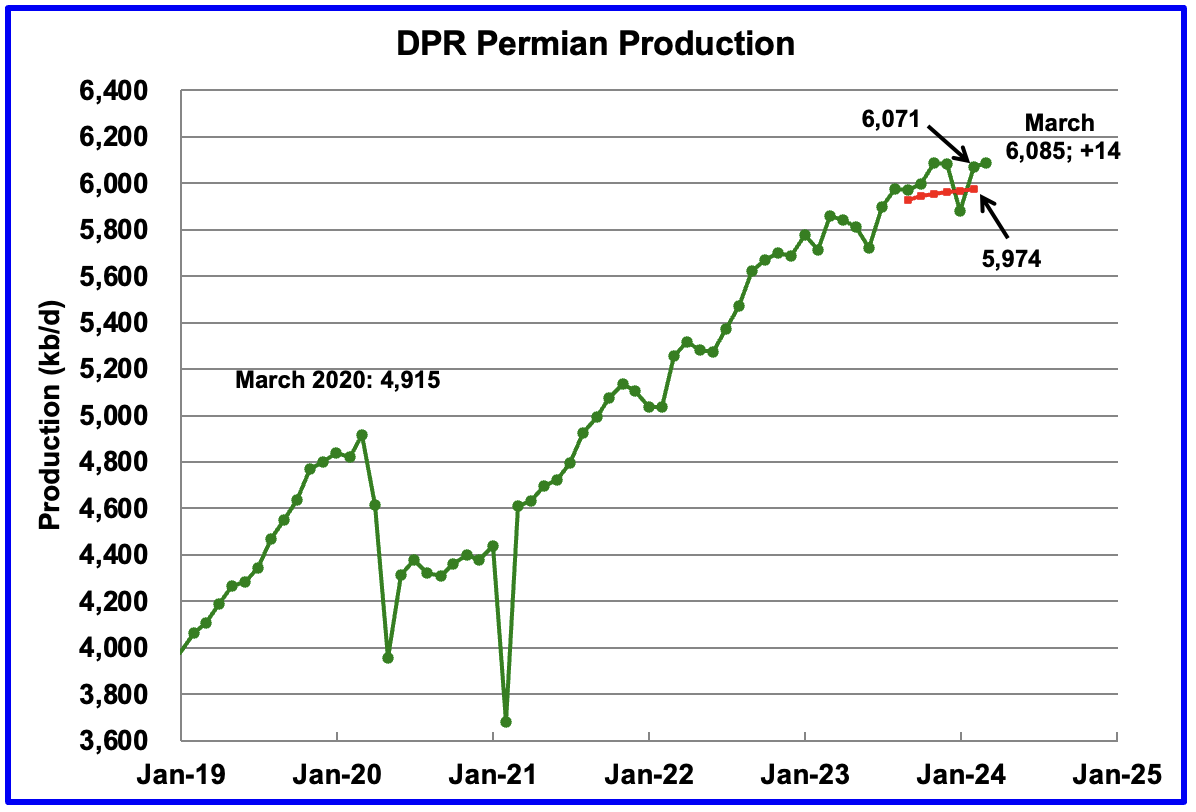
According to the EIA’s February DPR report, Permian output will continue its slow rise in March. It is expected to increase by 14 kb/d to 6,085 kb/d. While the last four months of Permian production show a slowing trend in monthly production growth, the DPR’s revisions continue to increase production from previous months.
The red markers show the DPR’s previous January forecast. For February, Permian production was revised up by 97 kb/d from 5,974 kb/d to 6,071 kb/d.
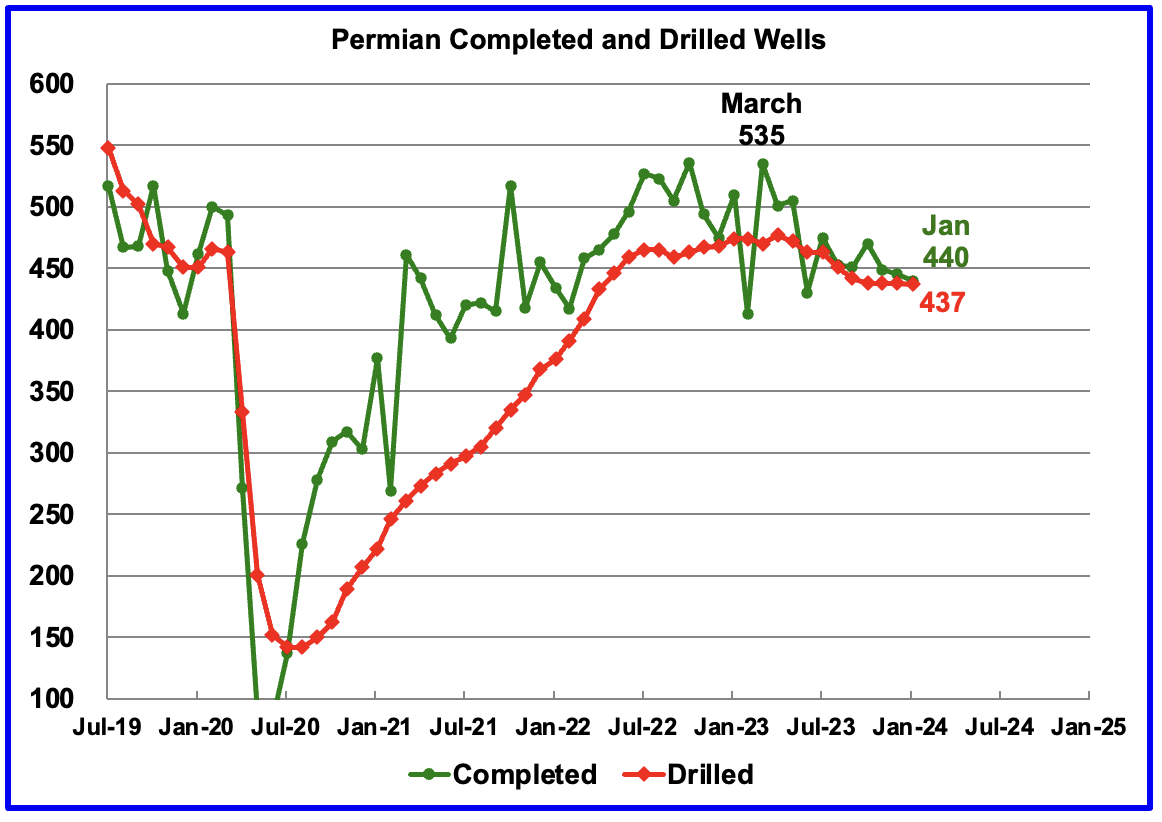
During January, 437 wells were drilled and 440 were completed in the Permian. (Note that January is the latest month for DUC information). The completed wells added 414 kb/d to January’s output for an average of 941 b/d/well. The overall decline was 618 kb/d which resulted in a net decrease in January’s Permian output of 204 kb/d, largely due to severe January weather. In this past weather impacted January, an additional 217 completions would have been required to offset the decline.
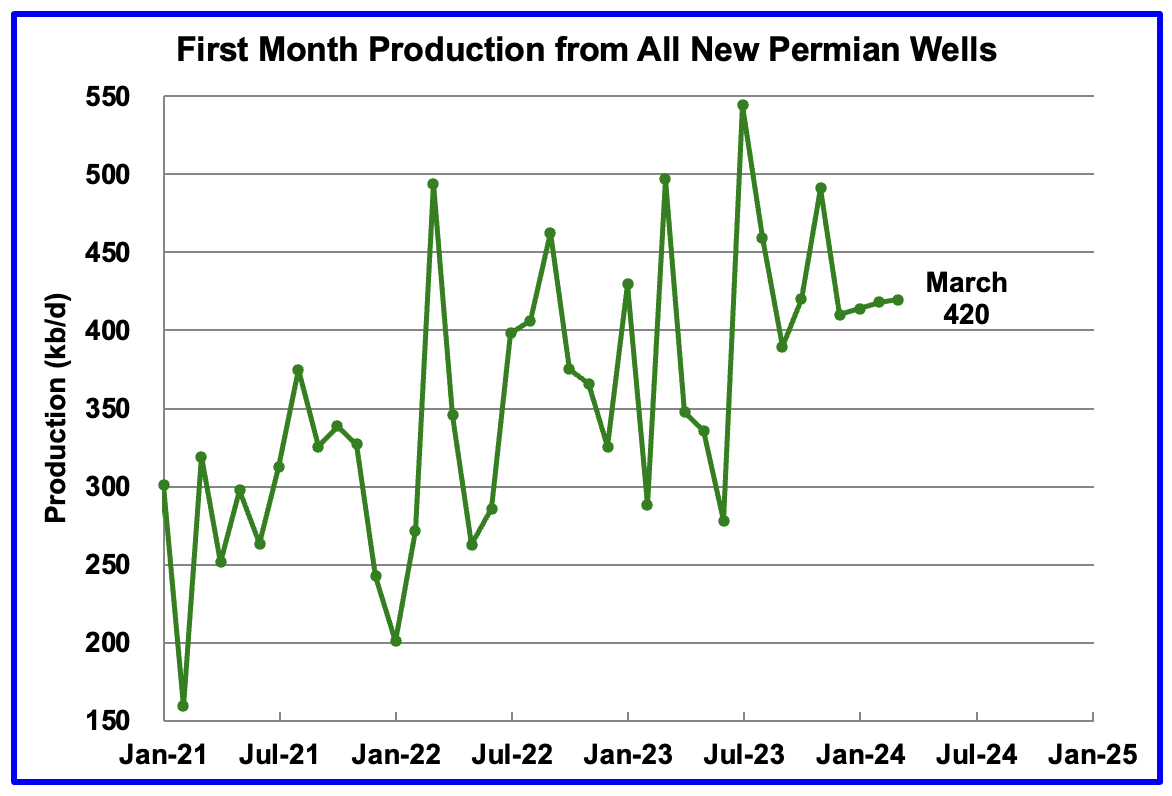
This chart shows the average first month total production from Permian wells tracked on a monthly basis. The total monthly production from the newest Permian wells in March is expected to be 420 kb/d, 2 kb/d higher than February.
Recall that this March production of 419.6 kb/d is offset by a decline of 405.4 kb/d for a net overall output increase in the Permian basin of 14 kb/d.
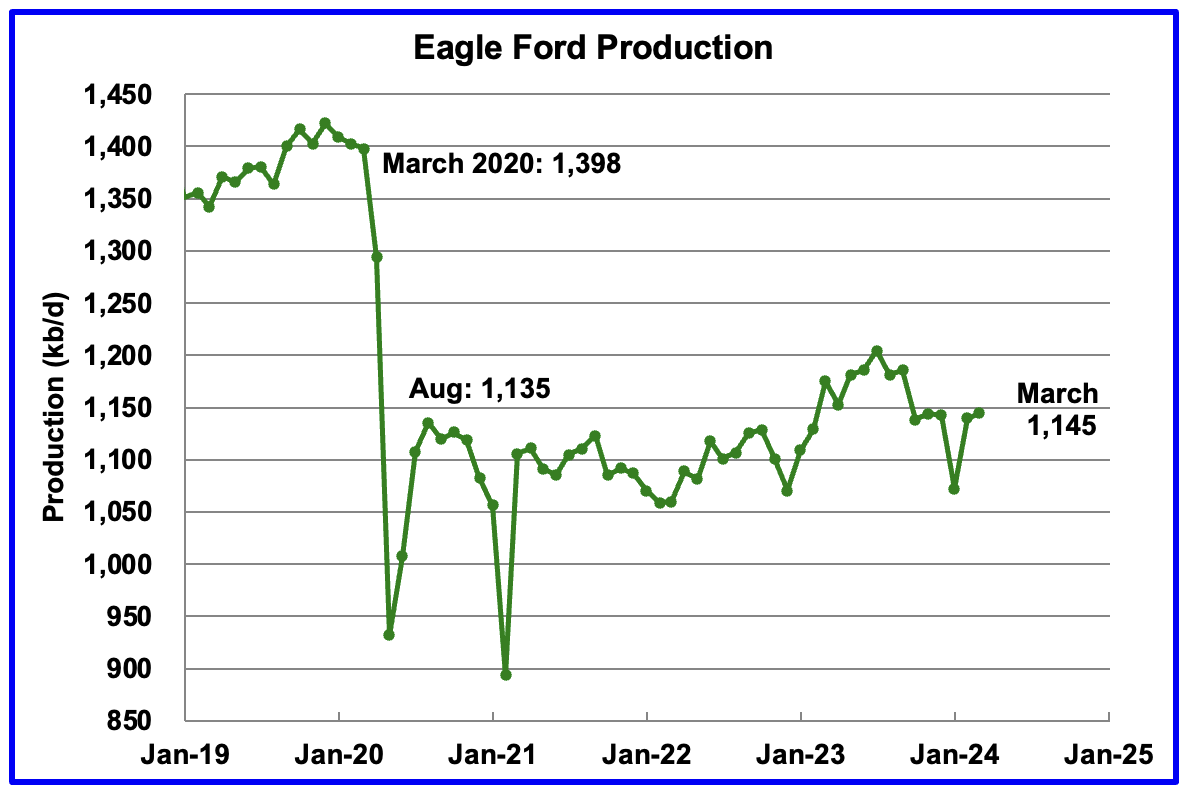
Output in the Eagle Ford basin has been on a plateau since November. The DPR’s February’s forecast projects March output will increase by 5 kb/d to 1,145 kb/d.
At the beginning of the year 2023, 68 rigs were operating in the Eagle Ford basin. The rig count began to drop in mid March 2023 to 60 and slowly dropped further to 47 in November 2023. Since late October 2023 the Eagle Ford rig count has been close to 48 ± 2 rigs. Recently the rig count dropped to 46.
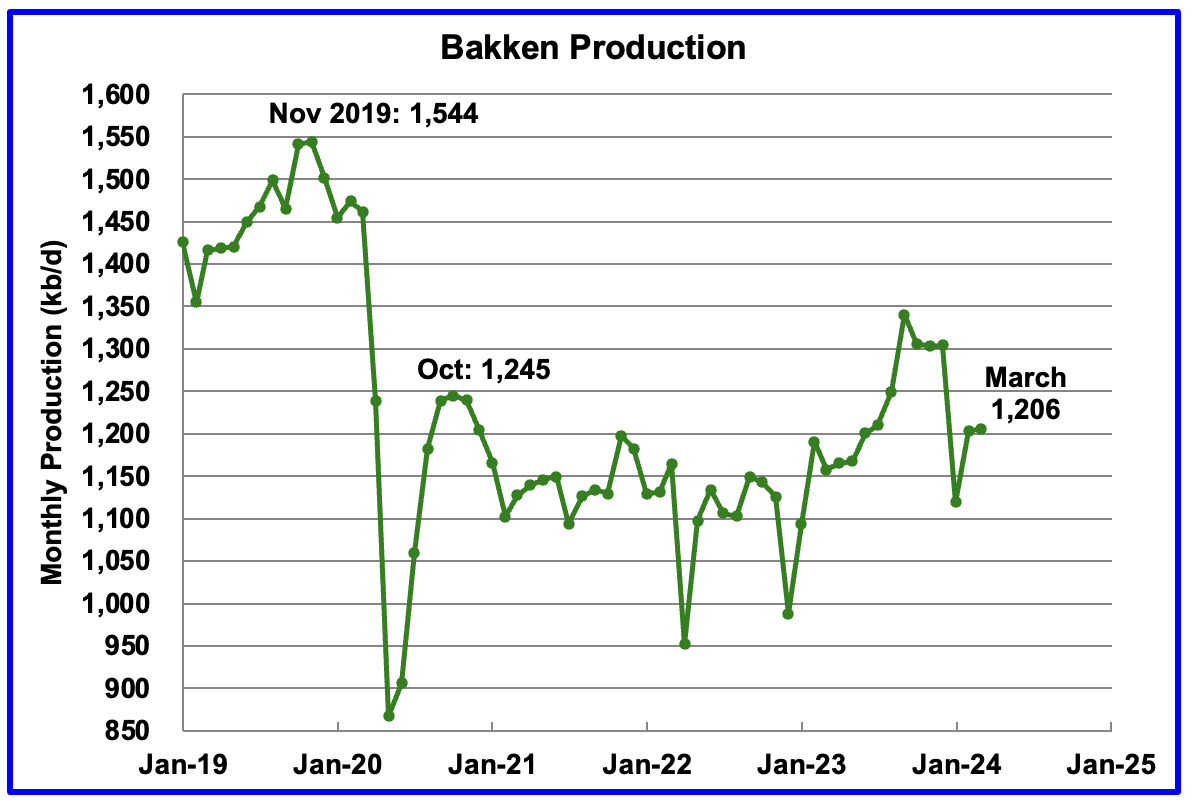
The DPR forecasts Bakken output in March will be 1,206 kb/d, 3 kb/d higher than February. March 2024 production is now projected to be 39 kb/d lower than the post pandemic peak of 1,245 kb/d in October 2020.
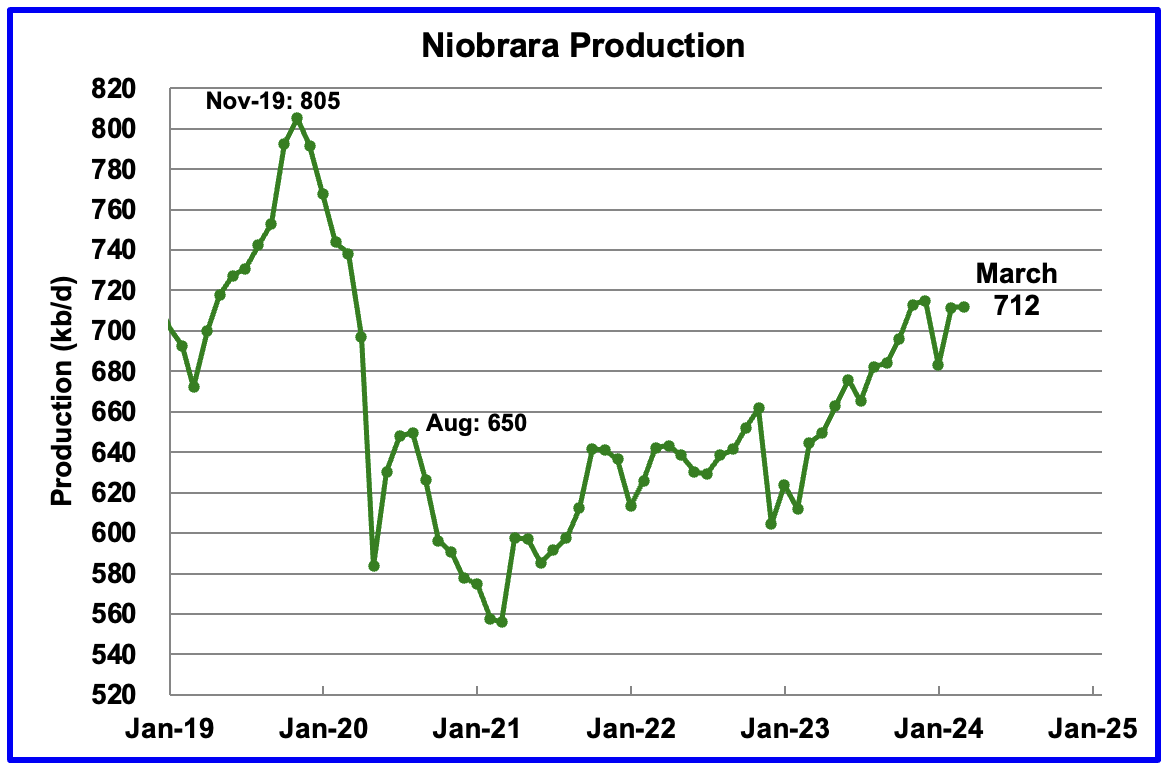
Output growth in the Niobrara continues to slow and may be on a plateau. February’s output increased by 1 kb/d to 712 kb/d.
Production increased starting in January 2023 due to the addition of rigs into the basin but stabilized at 16 ± 1 rigs in March and April. However while from August to December the rig count has held steady at 14, January and February have seen the rig count drop by 2 to 12. The drop in production growth has been slowed by the increased use of DUCs, 24 in January. See next section.
DUCs and Drilled Wells
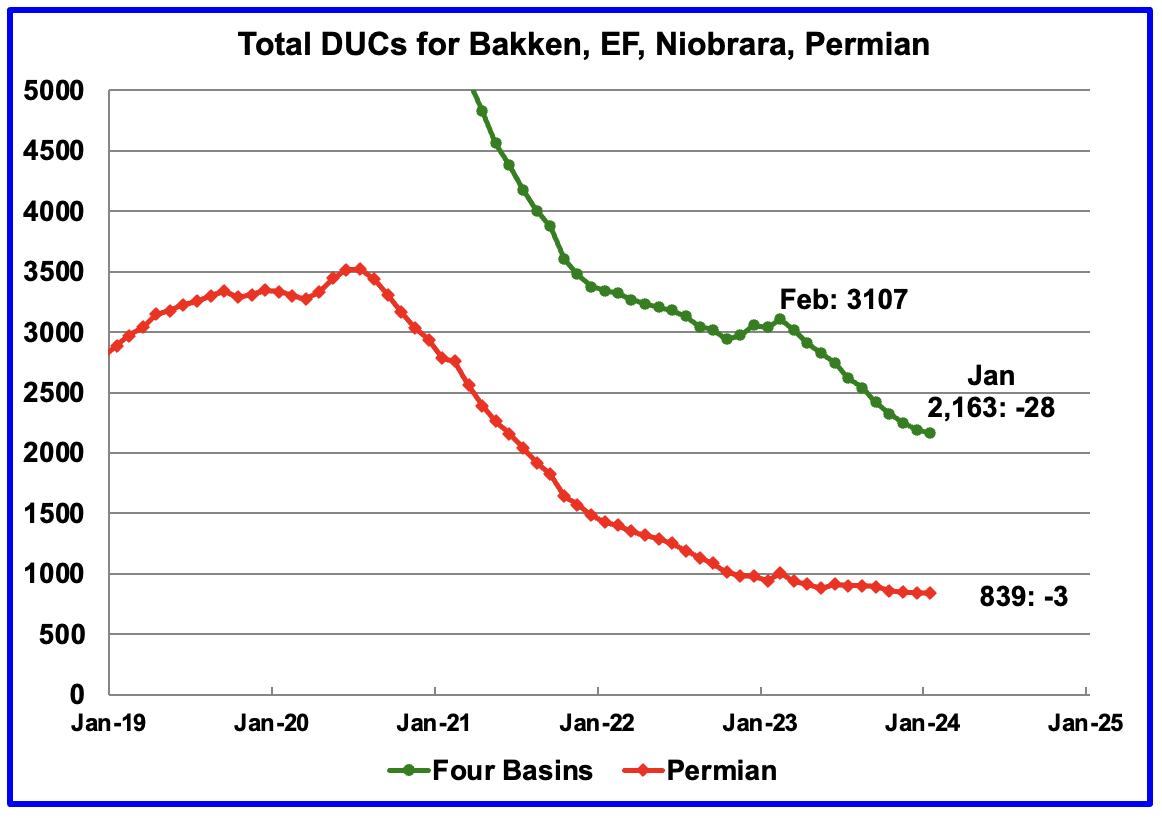
The number of DUCs available for completion in the Permian and the four major DPR oil basins has fallen every month since July 2020. January DUCs decreased by 28 to 2,163. The average DUC decline rate since March has been 89 DUCs/mth but appears to have slowed over the last few months. Of the 28 DUC decrease in January, 24 came from the Niobrara.
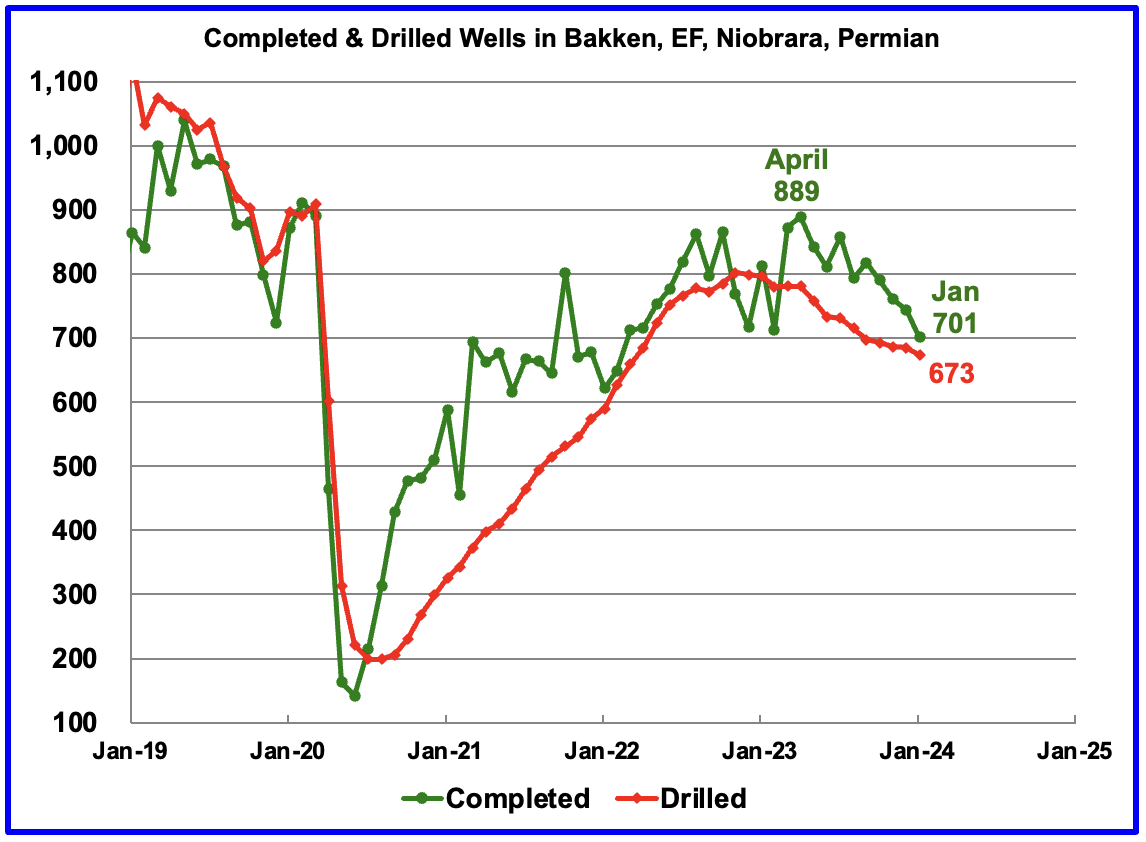
In these 4 basins, 701 wells were completed while 673 were drilled. Both drilled wells and completions are down from higher levels in early 2023. The gap between drilled and completed wells continues to decrease from previous months.

In the Permian, the monthly completion and drilling rates have been slowing since the March 2023 high of 535 rigs.
In January 2024, 440 wells were completed while 437 new wells were drilled. The gap between completed and drilled wells in the Permian is now very small compared to late 2022 and early 2023. Regardless, it is those extra completions that increase Permian production.
A discussion last month in the comments section overwhelmingly decided that a more realistic DUC count for the Permian would be closer to under 100.
138 responses to “US December Oil Production Flat”
Ovi – The graphic you show for GOR evolution in a reservoir is for a conventional oil field undergoing solution gas drive (i.e. pressure depletion with no injected volume balance). I have not worked on fracked wells so this is conjecture but I cannot see how that is applicable to a tight oil development.
In a permeable conventional reservoir, or at least each fault block, to a close approximation, all the oil can be assumed to be at the same pressure at each time increment (ignoring flow effects close to the well bore). So it is OK to speak of a common reservoir pressure and GOR. In a fracked LTO field it is the complete opposite. For idealised fracking each well is isolated from its neighbours and has its own pressure and GOR profiles through its life. Even if there is some interconnection the pressure differences will be large. Talking of a “reservoir pressure” means nothing, the pressures will vary all over at different locations and different depths. The field GOR is just an average of an unknown spread of gas and oil flows coming from wells at different stages of development.
Things are further complicated because there is a significant pressure drop down a fracked well and through the fractures. So at some point in production the front half of a well might be below bubble point while the oil at the end of the fractures is still saturated. As the pressure drops the gas moves more freely than the oil and the GOR will actually be different along the well bore as well as changing with time. Once most of the gas has gone and the well switches to some kind of artificial lift then I’d guess the GOR would stay relatively constant and low. But the production from all such wells would be mixed in with that from newer wells with higher GOR (that may be rising or falling depending on the exact point of operation). A given field GOR could be made up of an infinite number of combinations of wells with different individual GORs. Without a detailed history of how the field was developed I don’t know what it would tell you in any more than general arm wavy terms.
Thanks George.
Interesting comment.
Definitely, just by simple arithmetics, the age composition of a set of wells would affect the GOR of the whole set, even if there was no pressure communication.
My understanding, however, was that in a densely drilled area there WILL be pressure communication. I.e. as a new well is drilled some gas would be pushed out and bubble out in older wells, so that the new well would lose some pressure. Maybe that understanding is wrong…
There may be some communication but only a small flow and the pressures in the connected wells could be widely different (they would have to be to induce any flow through the interconnected, but still relatively tight, fractures).
there has to be flow, yes, flow of Gas towards the low pressure parent.
since shale oil is gas-driven that would affect the recovery in the child.
It’s not exactly “I drink your milk-shake”, more like “I’m making your soda-pop go flat”
George
The physics of a two phase solution/mixture is no different whether it is a big blob of oil or a small one. The issue in an LTO well/field is the time it takes for the pressure change to travel through the field and the well. You sort of hint at this in your explanation above. The other complication is the continual addition of wells and the level to which they communicate. There have been many posts of how there is an overall drop in pressure in LTO fields, indicating some level of communication.
The posted chart is reasonably consistent with the GOR chart for Eddy County. The issue as noted: “Unfortunately this graphic does not explain the current behaviour of oil production in Eddy county. The GOR is dropping and oil production is increasing. Possible explanations are that the latest wells are producing oil at a higher than previous average or the wells are being drilled into a new bench.”
Note in the latest rig report for Eddy county, four more rigs were added. Possibly someone close to Eddy county can explain this sudden increase in drilling activity.
Also note the amount of time Eddy county spent in the over bubble point pressure phase, May 2021 to March 2023. That is the time spent in the Semi-bounded GOR region. The wondering back and forth is probably due to the addition of new wells with different GOR ratios and more wells communicating.
I agree that what is happening deep down in these oil fields is complicated. My task is to try to simplify it for our readers. Overall I think the oil production vs GOR charts are going to provide us with an early clue if the Permian is about to peak. All of this new drilling in Eddy county may just delay things for a while.
Tight oil volumetrically calculated to be “in place’ along a lateral is drained by the extent of its frac radius, or that portion of the rock that is believed to be treated, hydraulically, typically called stimulated resevoir volume (SRV). Those SRV’s are cylindrical-like “containers” that are subject to the same depletion mechanism as a conventional, solution gas “reservoirs.” The SRV is the reservoir and the SRV has boundaries. At least in the beginning. Gas breaks out, GOR goes up, liquids get left behind, oil goes down and in Stage 4 of that depletion mechanism, GOR goes down.
Core areas that are heavily saturated with wells, with BHL’s 330 feet apart, of course communicate with each other. Parent-child domestic problems are very real, or that dumb “halo” affect thing in the Bakken that gives people hissy fits, or the fact that offset wells on AL are almost always shut in, packers/plugs set before a new well is frace’d thousands of feet away.
The way to think of a horizontal lateral is a long lease road with say, 60 stripper wells (perforation clusters) directly adjoinng the lease road, all being produced into the same flow line. Different perforation clusters have different pressure deltas, contain different fluids, have different GOR’s. So what? The performance of the least road and its wells are gauged at the end of the flowline, at the tank battery.
GOR is typically an individual well performance metric but in todays over-drilled tight oil sweet spots (cores where 93% of all Permian tight oil production comes from, for instance) GOR of a core area is important. Most cores got that way by hammering on the same benches, by the way…in Eddy County, for instance, the Bone Springs 2 and Wolfcamp A and B make up over 63% of production. When those core areas comprise the productive limits of a county, the GOR of that county is relevant. Take S.W. Lea County as an example. Or the western portion of Culberson County, or Eddy County, were because of GOR wells are classified by regulatory agencies as gas wells. Who could not look at how Pioneer’s well performance in Saud America has detoriated over time, as its gas volumes have gone thru the roof, and not believe ‘GOR for Midland County’ is not relevant.
Ovi is on the right path. Many people like to pooh-pooh GOR and stuff like bubble point because it implies problems in their abundance agenda. If GOR, pressure depletion, etc. are irrelevant, whats the cause for declining initial IP’s, steeper decline rates, and lower EUR’s?
We can safely say that Mr Kaplan does not have an abundance agenda. Besides that, very interesting post and comments, thanks everyone. Tight oil production has a Wile E. Coyote feel at the moment with lower rig, frac and DUC counts but still elevated production. We are all feeling around in the dark (literally) and Ovi’s analysis is an excellent contribution.
“If GOR, pressure depletion, etc. are irrelevant, whats the cause for declining initial IP’s, steeper decline rates, and lower EUR’s?” If that is a question for me then I did not say such a thing only that GORs and pressures (which are as important as anything except maybe water cut in conventional wells) can only be looked at on a well by well basis (or SRV basis if you like) and averaged GORs over a large area with different ages of wells don’t necessarily say much about what is really going on.
My main point was that the profile for GOR in a conventional field isn’t necessarily followed by a set of wells in a tight oil area. As one example the period before the bubble point can be quite long in a conventional reservoir because there is a large volume being depleted relatively slowly so the oil can expand a bit and maybe the rock compacts a bit to help. In a fracked well the pressure drops rapidly and I’d guess the bubble point is reached almost immediately, at least at the front part of the well bore and fractures where the pressure initially drops and flow first occurs.
George
I think the issue is whether that rapid initial pressure drop is to below the critical bubble point pressure. As I noted in my initial answer above, “Also note the amount of time Eddy county spent in the over bubble point pressure phase, May 2021 to March 2023. That is the time spent in the Semi-bounded GOR region.”, Eddy county spent almost two years in the over pressure region. That suggests to me that while the pressure drop is rapid, it does not fall below the critical bubble point pressure. It also indicates how high the over pressure must be.
Looking at the attached Permian Novi plot, I might guess that the bubble point is being reached somewhere after 12 to 18 months. The initial sharp drop in output is due to the small LTO oil volume associated with each well, (relative to a bigger more contiguous reservoir), being released.
WRT to the following comment “I’d guess the bubble point is reached almost immediately, at least at the front part of the well bore and fractures where the pressure initially drops and flow first occurs.”
That front pressure would depend on how much the well is choked. Is a larger choke used as the flow rate drops?
I’ve never heard of a semi bounded GOR or a critical bubble point (is that a cricondenbar?). An entire county cannot be at one pressure or even in a narrow pressure range, each well has its own pressure. In 12 to 18 months about half the oil would be produced, are you saying that the oil remaining halves its density to fill the void left while staying a liquid, because it doesn’t, there is no such substance. The void is filled with evolved gas because the bubble point is passed almost straight away. The amount of overpressure doesn’t so much determine the time to bubble point as the expansion (bulk modulus) of the liquid, the small LTO volume compared to the rate of pressure drop is why bubble point would be reached quickly. I don’t know any way to look at a production plot and make inferences about well pressure from it.I doubt if the wells are choked once flow is established abd I’d imagine, given their rapid depletion, they have to be put on artificial lift pretty early on.
Sorry to butt-in, the way I understand Ovi’s argument is that pressure of the bulk, undrilled areas is dropping-off, so that new wells bubble-up sooner than before.
You’re obviously right that the fraced cylinder of a lateral drops its pressure way bellow the bulk reservoir very quickly, and that there is a pressure gradient along the well. I don’t think that’s the point Ovi’s making, I think he’s talking about lowering the bulk reservoir pressure, so that once you drill a well, gas starts bubbling much sooner.
He was replying to my comment which was about initial flow in a new well, not bulk reservoir pressure. If the overall reservoir pressure is falling even in areas where there are no fractures then surely by definition it is not a tight oil reservoir. I can see wells having some effect on neighbouring fracked areas (that are therefore already producing and therefore already below the bubble point) but not virgin rock.
George
I am not a petroleum engineer. I just plot data and try to give meaning as best I can. I plotted a number of crude vs GOR charts and noticed a similar trend in a number of them. In that region where the crude production was rising and GOR was semi constrained, I decided to call it a “semi bounded GOR while production rises. I assume during that period the local area is over pressurized, l.e. pressure is above the bubble point. At some point the GOR breaks out of that region. That appears to be a significant change which I interpret as an Indication that the region has entered the bubble point. You may have a different opinion or a better way of plotting the data to indicate the bubble point has been entered.
I never said a region would all be at one pressure. If all of the wells were stopped producing, they would eventually come to an equilibrium pressure.
Not sure how you got the impression “In 12 to 18 months about half the oil would be produced, are you saying that the oil remaining halves its density to fill the void left while staying a liquid, because it doesn’t, there is no such substance.”
George,
You emphasis on semi bounded GOR or Bubble Point pressure in tight oil laterals reminds me of the similar phenomena that over drilling caused fast rise of GOR, and water content as a result of parent well depletion.
Looking back 10 years from now, the wells in Bakken certainly has a much slower rise of GOR after IP, and now it is way much faster. It seems that larger frac job just put all and larger volume in the lateral in a one fraced reservoir with much higher permeability, and therefore the same pressure system. This will cause oil and gas seperation as soon as the whole stimulated volume presure is lowered to the bubble point pressure; whereas before smaller fracing job will save the process and promote more gradual release of rock volume jointing the production. It seems that these 2 kinds of accelerations of production, i.e. overdrilling infills and larger frac job, are doing the same thing, i.e. accelerate “drainging US first”, and maybe result in the same—- spend twice more and getting half less.
Sheng Wu
If the GOR is higher than expected then I’d agree that more oil is being left behind than was expected, but I don’t know if that is happening (to be clear I don’t know that it isn’t happening either). I’d expect a rising GOR as a field is developed because as the well is produced (approximately isothermally) the bubble point is quickly crossed and then the GOR increases as the pressure declines (i.e. the two phase region is more deeply penetrated), reaches a maximum, and then declines. But most of the production will be in the rising GOR region. I had thought that eventually artificial lift is added to get out the last, dead oil but from googling it doesn’t seem so as adding pump jacks or ESPs to these long horizontal wells is difficult. So it may be the declining GOR period doesn’t add much more oil and doesn’t lower the overall lifetime GOR of the well. Therefore wells and collections of wells only really see rising GOR. I can see interference from neighbouring wells and more rapid production is likely to mean more oil is left behind but I don’t think there is enough data available publicly to say this is happening or not (though the desire for early return on investment would suggest it’s quite likely). Of course with so many wells at different stages of production, different fluid properties, forced shutdowns, changing conditions along the well and through the fractures it’s a lot more complicated.
p.s. to be clear I wasn’t emphasising “semi bound GOR” I just don’t know what it means or how it influences the behaviour of a well or basin, and nor do I see what it has to do with the rest of your comment (can you explain?). Similarly “critical bubble point”, can you explain what the critical bit means?
George
I just used the word “critical” in front of bubble point because the bubble point is a special point in the phase diagram. Something different starts to happen there as the pressure drops below that point.
The PVT separation actually happens more after pressure decline below Bubble Point, the volatile oil will experience dramatic separation, like death, while black oil will experience much smaller separations.
my video starting at 588 seconds tries to show this difference, but I did not emphasize that separation will definitely happen almost at IP for volatile oil considering the well head pressure is much lower.
https://youtu.be/2wwoUOT4rGE?si=rM1BKDTpbQxRaaRk&t=588
My only experience with black oil is as a way of characterising a single phase oil when not much is known about it (e.g. to give it a density and specific heat capacity) but it wouldn’t be used in PVT calculations because there were no known multiphase properties (it is effectively considered as a single psuedocomponent). Therefore I don’t understand what the discussion around putative black oil reserves in the shale areas is showing. LTO implies to me that everything is fairly volatile oil and the basins’ behaviours are described by that not a made up black oil.
The EIA publishes annual reserve data based on a well responded questionnaire to E&Ps and reported by production area (2022 data is three months late so far). Importantly the data is split to show cruse and associated gas so real GORs for oil wells is shown. The chart below is for ND and would be mostly just LTO since 2012. The lines are for measured crude and gas production, remaining reserves (reported by the E&Ps, and inferred original reserves (remaining plus cumulative production). The continuing rising number, to me, says that each well is entering the two phase region but may not be passing the maximum GOR and entering the dead oil phase. That the lines are almost identical would suggest there is no interference between wells having much effect.
No sir, that question was not directed at you nor did I imply you were touting shale oil abundance. I was defending the graphic that Ovi used to describe gas depletion in tight oil wells; I think it applicable. I also believe GOR trends in overdrilled cores, even parts of entire counties within the productive limits of a resource play, can be used to predict liquids decline. Exxon’s Bone Springs and Wolfcamp A & B bench wells in its densely populated Poker Lake block now have GOR’s of 15+. Many of them.
George,
you are right that there has been this hope before LTO that conventional GOR-PVT phase diagram does not apply.
Like you outlined, there are at least 4 differences for LTO to behave differently to conventional in GOR-PVT behavior.
1. Basin or reservoir wide, i.e. surface horizontal dimension from several miles to 10s miles, i.e. field to field communications — since LTO is a tight resources, the inherent little communication means basin wide pressure drop due to several lateral in one field is almost zero, thus limit pressure drop to new field
2. Within each field, there are different benches at different depths or burial formations, if the untapped bench is well separated from the developed benches, probably the untapped benches will maintain its original pressure.
3. Within each field’s same bench, the communication certainly is much higher than the above two cases, and the closer the new lateral gets to the parent laterals, the more pressure drop is expected.
4. Within each lateral, the communication between rocks first exposed to frac and roacks joining the fracture or production later could be minimized due to tight rock nature — shale operators would wish that this will benefit LTO. Maybe initial fracing with limited volume of fluid and proppant, i.e. prior 2014, this tight rock nature indeed benefit the slower decline, but also limited initial IP. After 2014, larger fracing job certainly improved the IP significantly, but also exacerbated the decline and rising GOR in almost all fields. A crude look without AI analysis could observe such changes.
In the case of Eddy county, the recent drop of GOR and rising oil production is probably a result of new field and new benches. The part of Eddy close to the state line and Lea Co have very low GOR benches, e.g. the Bone Springs and upper wolfcamps have quite low GOR and very good pressure. The Bones could have lowest GOR than deepest basin LEA wolfcamp, where the shallower Bones have initial GOR at ~>2MCF while deeper Wolfcamp below has initial GOR at 1MCF. Yes, obviously inverted in Lea but in Eddy it is normal or same again. Devon reported several monster Bone wells in Eddy with initial IP over 10K BOEPD and GOR at ~2MCF/bbl which is further north of the Stateline, and further closer to the stateline, the Bones just gets better, i.e. with same or lower GOR at below 2MCF/bbl, and along with the Wolfcamp, some of the fields have been lightly drilled, e.g. COP, did not intensively develop their part or Concho, especially the deeper Wolfcamp benches there, even before and after they bought the acreage from Shell in less productive TX Loving.
you could see the map here,
https://esg-dynamics.com/environmental-conocophillips-acquisition-shell-permian/
and see COP production history in NOVI
Sheng Wu
Clearly with all of the discussion and your additional info, this is a very complex issue.
Thanks for your info on Eddy county: “In the case of Eddy county, the recent drop of GOR and rising oil production is probably a result of new field and new benches.”
You mean like this?
There are no new benches, or new field discoveries (?!!) in Eddy County. Rule 1 in tight oil study, ignore all PP decks in IP’s, particularly from Conoco.
If GOR is going down and oil is going up in Eddy County it is more a function of gas production going down because of natural gas prices, nobody drilling new wells in a a well delineated, down structure gas leg in the Bone Springs to Wolfcamp correlative interval and more Yeso/Glorietta wells geting drilled along the NW shelf margin.
Mike
My Eddy question is why is production hitting new highs. It could be related to the bump in drilling last May, shown in the NM rig chart above the Eddy section. Those wells could be coming on line now.
Then there is the additional question of all the new drilling in Eddy.
yes, Mike,
The “new benches, new fields” could be the following,
1. relatively less drilled benches or fields in the mainstream Bones and Wolfcamps
2. the new laterals could also come from the old conventional fields with conventional migrated oil, i.e. NW shelf, Yeso and Glorietta, these zones are actually also Permian time rocks, similar to Bones just with a different name, many attempts even before shale drilling wave to recover more such conventional oil, so called residual oil zones.
Geopolitical risk has entered the chat.
https://apnews.com/article/new-mexico-halts-some-oillease-sales-5ad94d5d7f43fb593417da2ebf0080a0
Just going to throw this out there.
There are numerous benches in the Permian.
Going from 2800 to 3200 GOR is A) not that significant, and B) possibly a result of drilling wells 1 bench deeper with a slight GOR change, as opposed to any proof of depletion.
If we get to 6 or 8000 GOR I’ll get interested. When you slam through the bubble point it’s not a 10% change. GORs blow out to tens of thousands.
Not what we’re seeing here yet
Everything happens much slower, because of the low porosity.
In a conventional field you’d probably see a more rapid gas boil-off with these higher GORs that you mentioned, and then the GOR inflection downwards, as shown in Ovi’s figure. I don’t think people yet see the downslopping in shale. The GORs just keep rising, and this gas has to come from somewhere, i.e from downfield.
George,
you mentioned the 5th GOR-PVT change, i.e. pressure drop during production in the well bore, from bottom to the wellhead.
This part is certainly the same as conventional, and certainly the LTO are more exposed to the PVT bubble point more than real black oil, especially when GOR is well over 1MCF/bbl, the lifting process is quite different to fluid with GOR under 1MCF/bbl, and usually more expensive.
A rough correlation between bubble point and GOR in Delaware with depth from 8,500′ to 11,000′ is like this:
initial GOR(sCF/bb), BP Pressure (psi)
500, 1200~1600
1000, 2000~3000
1500, 3000~4000
2000, 4000~4500
2500, 4500~5000
3000, 5000~5500
3500, 5500~6500
if the bottom hole or wellhead pressure drops below the bubble point for a certain initial GOR fluid, then the bubble point PVT phase separation will also happen in the lateral all the way to the wellhead. The wellhead pressure is very difficult to maintain at over 2,000psi after first 3~6 months of production.
Note the reservoir pressure is about >5,000psi for shallow 8,500′ to over 8,000psi at 11,000 ft with pressure gradient from 0.6~0.8psi/ft.
I was thinking more about the difference in pressure conditions seen by the fractures nearest the well bore at the front of the well (lowest) compared with those at the end of the fracture at the backend (highest). There would be a much bigger pressure difference between these than ever seen in a conventional reservoir block. Once in the well bore there’s not much difference between conventional and tight oil wells and the GOR there is fixed until the wellhead anyway.
At the recent ASPO France meeting 2023 discoveries were discussed. A relatively low year with about 10 billion BOE discovered. Of that about 30% was oil and the rest gas.
With regard to Eddy county’s falling GOR and rising oil production, there are some new wells that have lower than usual gas cuts and quite a bit higher than expected oil flush. In other words, it would appear that a well-circumscribed little “sweet spot” was found. This sort of Milagro (Spanish for miracle) exemplifies the hazard of trying to determine the “bubble point” of entire counties using pooled gas and oil production. Many wells in Eddy county are in terminal decline.
Gerry
In six to eight months we will see what this Milagro produces.
Ovi: “In six to eight months we will see what this Milagro produces.”
Precisely! It could be a big deal. That county has been left for dead before.
After all, New Mexico is the Land of Enchantment.
If nothing else, your hard work and great graphs produced an abundance of thought. I especially enjoyed the notion that there are as many bubble points as there are hydraulic fractures, with dissipation of pressure in the proximal portion of the fissures happening first. Most of you probably already knew this and had thought it through, but not me.
And I am again struck that while each well is a “contained” impermeable reservoir within itself, if you space too densely you wind up with competition, and cannibalism of adjacent wells. So at some point there develops a communication between well bore fractures. One has to believe this is due to the propagation of planar fissures, perhaps hitting an incongruity in the shale matrix.
I congratulate you on coming up with a most thought-provoking series of graphs.
Gerry
Thanks. I am glad that there was a vigorous, well informed and most importantly gentlemanly discussion regarding GOR.
Gerry,
I’d like to join you in congratulating Ovi for the great content, as always.
With regard to planar communication between wells: keep in mind that even “virgin” rock has some lateral permeability. Shale permeability is anisotropic: there is almost no vertical permeability, that’s why the hydrocarbon can stay in place even though it’s not capped. However, it can move between the sedimentary laminates in the lateral direction.
Kdimitrov
Thanks. Much appreciated.
But I think the flowrates in tight oil reservoirs will be many orders of magnitude slower than in conventional, so it would take years or maybe centuries to equilibrate pressures rather than hours or days (hence the need for hydraulic fracturing).
It obviously is slower, but how many orders of magnitude?
Here are questions that I have in my head.
1. Why is gas decline in the legacy base slower than oil? Why do some shale gas wells produce non-insignificant amounts years and years after completion, when the fraced volume is undoubtedly depleted? Isn’t that a sign of pretty significant gas transport from non-fraced rock?
2. If there is a pressure differential between two points on the same shale plane, and gas first moves-in to fill the low-pressure voided space, what happens to the lagging moving front? Wouldn’t the light ends separate in the formation, even without phase separation, still in the supercritical single phase? In the lab we call this process chromatography, not sure what geoscientists call it.
3. Since the light ends (methane, ethane, propane) are much more compressible than the liquids, if they are more mobile and move out of the formation, wouldn’t that cause a pretty steep decompression, rather quickly? We know, just by summing-up cume production, that gas fraction extracted has been growing for each of the basins. All this gas getting extracted has got to deplete some of the driving force for recovery. Shale extraction is gas driven.
4. If a formation is getting gas/pressure depleted, wouldnt you expect that any new wells will have a LOWER gas cut? Which is what these new NM wells are getting.
So if this train of speculation above is accurate, the Bubble Death Point would look like: (i) higher GORs basin-wide, since legacy wells are gassing-out more profusely as the pressure in their vicinity is low and gas is boiling, and (ii) lower GORs for new wells, where there is still enough pressure initially to push the liquids but decay is more rapid due to gas depletion, loss of driving force and pressure.
KD, those are provocative questions.
Is shale always 100% solution gas drive?
Some of the aged wells that refuse to reach terminal decline produce a lot of water.
Are some of these wells partially water drive wells?
The southern tongue of the Ogallala Reservoir reaches the Delaware.
Gerry,
that’s another interesting question. My understanding is that the water is only the recovered frac water, coming from the fissures, however, I may be wrong. Water is quite viscous and would not flow very well in the shale, I would think. In fact if the clay content is high it would only make things worse, as it will swell the clays.
However, water viscosity drops significantly with temperature, and the Delaware is a deep and hot formation, so it is possible that water plays a driving role.
Kdimitrov,
I try to give my understandings to your Qs above,
1. Decline — this really depends on geology first, and is not a clear cut between shale oil decline fast and gas slow (Haynesville still decline as fast as shale oil). The Marcellus shale gas has been known to be slowest decline even before modern fracing, and that’s how the shale frenzy got high when the industry use the slow decline and initial high IP after modern fracing.
But,when counting all shale basins, it is true that shale/tight oil decline all much faster. It is most likely controlled by PVT bubble point.
2. The petroluem engineers only use darcy flow, i.e. all components flow together, as viable production, all other flow, i.e. fractionation of components, might happen in the very beginning, but are not considered as lasting. Many with scientific background confused by this— they believe as the oil and gas migrate from source to reservoir, the lighter components will be separated from the rest, like the chromatography. But, if you have a large almost infinite continuous flow, any fractionation in the path will soon be saturated. Imagin you inject a 1,000cc in your chromatograph instead of 100micro cc, you will not see separated peak, the majority will all come out together in one big lump.
3. shale oil is dissolved gas expansion drive — it is different from simple one gas pocket expand and drive out oil. Imagine the reservoir rock after fracing, all connected as a conventional one, and as a cylinder. Initially, they are one phase, gas dissolved in oil, and as pressure lowered, the density actually gets lower, and the one phase will expand and drive out more oil — this is dissolved gas expansion. But below bubble point, the oil will be separated from gas, and sure the gas will expand more, but they just flow at a much higher speed than oil, this cause the oil to be left behind. This is the bubble point death. Now, low GOR black oil, i.e. GOR really low below 100scf/bbl and API below 25deg, the gas separated from oil will not like form large bubbles and then flow out first, instead, they could magically mix with oil and create a new phase called “foamy” oil, this phase could expand continuously bring out oil and gas at a much faster rate than before bubble point. This is the magic that some black oil reservoirs could have exceptional production and the viscosity is magically lowered by orders of magnitude.
I made a youtube video about this:
https://youtu.be/2wwoUOT4rGE?si=p_1lDWoifjYwgGXw
While I find most/all of this US tight oil data /analysis really interesting, what’s truly fascinating to me is that we are laser focused on tight oil, something that is currently <1% of all oil that was every produced. Seems to me tight oil is a fad whose time is nearly up.
To me, it’s crystal clear that major changes are coming to US oil production, I applaud Dennis for making tweaks to his models to reflect the likelihood of no/limited additional US production growth, a series of cliffs are likely to come exactly when and how/why is anyone’s guess…
Kengeo, I have never liked the shale oil business, but if you liked oil and gas and wanted to participate, you were forced into this arena. And like it or not, shale changed the world: geopolitically, economically, culturally, and may have contributed a sizable amount to global climate change via unfettered methane venting/flaring.
That said, the thing is America’s last hurrah. Conventional production has dwindled. The GOM is still fairly decent and Exxon pretty well controls Guyana–so that’s American. The shale industry has grown to mammoth size. New Mexico is getting 2-4B a year from their leases. The shale–along with drug cartels and the movie studios–has literally taken NM from the poorest state in the Union up a few notches, and that money goes to schools and services.
Shale isn’t done by any stretch of the imagination. We have run through the basins roughshod, but now has come a time to put various maneuvers to the test. The old tried and proven way to wake up dead wells is by stimulation. CO2 is readily available. When the pressure drops, long-chain hydrocarbons get stuck in microscopic hairlike fissures. CO2 acts as a solvent, and also increases pressure. The carbon capture stuff to “decarbonize” is real, but a potential collateral gain is the stimulation of old wells. Some will likely respond very well; others won’t. Remember, roughly 85-90% of the in-place hydrocarbons in virgin rock is still there.
This note won’t set well with some people. I’m not even sure how much I like it. But before the need for fossil fuels is over, every decent piece of shale will be pierced, and every technique will be used. My suspicion is that shale hydrocarbons are going to be around for a very long time. They’ve peaked, or close to it, but they can plateau or lose only a small market share for years. I’m no apologist for the shale industry, but the hula hoop was a fad; shale fracking is now over two decades along and still going strong.
KENGEO —
I agree, the tight oil business seems especially ephemeral. Just a few years ago the only thing anyone talked about on the blog was the Bakken. You could have been forgiven for thinking it was the most of the world’s energy production. Now it still shows up in the charts, but is rarely mentioned in the comments, usually in connection with discussions of depletion.
Kengeo,
The reason for the focus on tight oil was that it was a surprise, in 2007 when I started paying attention to peak oil, I did not expect anextra 8 million barrels per day from the US above the roughly 5 million barrels per day that the US was producing at the time. In fact I had never heard of light tight oil at that point. We are probably pretty close to peak tight oil, perhaps slow growth until 2026 (1 to 3 % per year), perhaps flat output for two years, slow decline for two years, the reverse of 2024 and 2025, followed by more rapid decline starting around early 2030. In the grand scheme the 70 to 80 Gb of tight oil produced is a drop in the bucket compared to the World URR for C plus C of roughly 3000 Gb, about 2.5% of the total crude plus condensate that will eventually be produced.
Kengeo,
Keep in mind that small changes in output can have a big effect. The Saudis cut 1000 kb/d and everyone gets excited, that is about 1.25% of World output. US tight oil output is about 8000 kb/d, roughly 10% of World C plus C output, a fairly significant chunk which didn’t exist in 2007 (or was nearly non-existent at about 400 kb/d, the EIA didn’t even track it back in 2007 so only oil industry insiders may have been aware of it.) When people started talking about it in September 2012, sparked in part by some excellent analysis at the link below, many suspected that tight oil would not be able to mitigate conventional oil decline, the expectation of some was a plateau in futur output at around the 2012 level of output (in 2012 World average C plus C output was about 76.7 Mb/d, about 6.2 Mb/d below the 2018 peak at about 82.98 Mb/d. Note that tight oil output annual average in 2018 was about 6.35 Mb/d, nearly equal to the increase in World C plus C output from 2012 to 2018, though US tight oil output only increased by about 4.33 Mb/d over those 6 years. There was also an increase in oil sands output of roughly 1.34 Mb/d from 2012 to 2018, so unconventional output (tight and extra heavy oil) increased by 5.67 Mb/d accounting for about 91% of the increase in World C plus C from 2012 to 2018. Such a large increase in unconventional output was not expected by many at the Oil Drum in September 2012.
http://theoildrum.com/node/9506
So, Dennis,
nice recap of history, first.
When did conventional actually peak worldwide?
Kdimitrov,
Conventional C plus C output (which I define as World C plus C output minus tight oil minus extra heavy oil from Canadian Oil sands and Orinoco Belt output) peaked in 2016 at about 73.6 Mb/d.
Note that often it is claimed that 2005 was the peak for conventional output, but that likely uses a different definition of “conventional” oil (perhaps excluding Artic Oil and /or ultra deep water offshore oil). Using my definition of “conventional oil” which is similar to the USGS definition of non-continuous oil, the 2005 output of conventional oil was 72.3 Mb/d, about 1.3 Mb/d less than in 2016. Note that I define “oil” as C plus C and do not include NGL, biofuels, refinery gain, and other liquids.
thanks, Dennis.
yeah, the definitions of “conventional” and “non-conventional” are not exact science.
Arctic oil and Sub-salt oil are conventional in geological sense: oil migrated to porous sedimentary rock and capped with impermeable rock. Economically, however, they are non-conventional because they are hard to access.
One thing that shale has going for it is that it is accessible. Sure, the reservoir is a bi**h to extract, but is easy to access and to build infrastructure around it.
Really great review of tight/shale oil and comparison to the global total oil, Dennis!
If you do similar review and comparison of shale gas to the global total gas, you will see now shale gas account for ~25%, and probably will be larger in the near future. If coalbed methane fracing make similar or bigger success to shale gas, the world will be dominated by fraced gas, and gas peak probably will be delayed to 2060? On the consumption side, starships will add 30TCF each year.
The “success” or good start of US shale oil is not a complete success compared to the coventional oil, and without solving the fast decline and spread to other countries, it is not going to be as significant as shale gas or just similar to renewable energy to fossil fuels for now.
Sheng Wu,
Thanks.
Not clear fracking of coal resources would work that well, the amount of gas from coal is not likely to change significantly (in terms of MCF of NG per million btu of coal mined) imho. On shale gas, it is not clear this will be viable worldwide as the financial incentives that exist in the US with provately held resources is very different in other nations where resources below the surface are typically claimed by the State. US Shale gas is likely to peak around 2030 to 2035, for the rest of the World less clear.
For 2022 I get about 20% of World Dry Natural Gas production is shale gas using EIA data. So yes the resource is a larger fraction of World output (roughly 2 times larger). Whether shale gas will be able to compete with Russian and Middle East conventional resources remains a question. As Permian tight oil becomes less viable economically the shale gas from the Permian basin is likely to decrease as the wells will not be profitable to drill. As reneweable power continues to ramp up in the US and more households switch to heat pumps, demand for natural gas may eventually fall and US LNG may not be able to compete on World markets as shale gas will be prohibitively expensive.
In short the economics is highly likely to make shale gas a poor investment within 5 to 10 years in the US and consequently we may see a sharp drop in new completions and overall shale gas output by 2035.
If we use the EIA’s IEO 2023 for the estimate of World natural gas consumption in 2023 and compare the the EIA estimate for shale gas output in 2023 we find the proportion decreased to 19.5% of World natural gas consumption was from shale gas.
https://www.eia.gov/todayinenergy/detail.php?id=61263#:~:text=The annual growth rate in,from S&P Global Commodity Insights.
The EIA November news gives a new 2023 high at 105BCFPD, and most increase from shale basins. So, I would expct shale share in the US is more than 80% in 2023 at over 850 BCM, and China and Argentina each produced 25 and 26 BCM, and Canada close to 20BCM, total over 930M, and global total gas production is 4,000BCM, this makes shale gas account for 23%.
I was only including shale gas from US, not sure where to find Worldwide shale gas statistics.
My expectation is that US shale gas growth will not be very large in the future, perhaps 2% per year until 2028 followed by plateau for 3 or 4 years followed by declining output particularly in the Permian. Also if US gas prices remain depressed there will be little incentive for continued drilling.
Here is the demand for natural gas in the US expected by the EIA’s AEO 2023 Reference case. If US LNG cannot compete on World markets we may see NG output decrease due to lack of demand.
Just a silly questions
When most frack fissures are in the neighborhood of the drilled well – has someone already tried to frack with explosives?
Stuffing the first drilled well, ignite and then drill a secondary production well. Too much damage to infrastructure, or just not working at all because the radius of cracked rock is too small?
Surprised nobody cares about the halt of oil leases in new Mexico and the proposed royalty increase to 25%
It appears to be state leases only, and also appears to be withholding up to 6 per month.
The State of NM wants to be able to charge a 25% RI, in line with TX University lands.
Are there that many places that are productive not already leased? I would be surprised; but admit I’m not in the know.
Shallow Sand- I applaud your practice of attempting to look beyond the headline soundbites on various issues. We need that desperately in our nation. Most issues are not black and white, rather they are a hundred shades of grey that require a closer look to understand the landscape. Thank you.
You are welcome. I try.
We have a very uninformed populace here in the USA when it comes to oil.
Many people think the USA is actually producing less oil now than during the previous administration.
OTOH the current administration during the 2020 primary said that fracking should be banned.
Of course, fracking was around long before the shale boom.
It is too bad this country doesn’t have more sensible policies when it comes to oil production.
Saudi Aramco slashes four-year capex target by $40 billion after shelving capacity expansion projects
Company’s move to halt work on multiple oilfield expansion projects including Safaniyah and Manifa has likely contributed to lower capex targets until 2028.
Saudi Aramco has cut its four-year capital expenditure target by $40 billion, following a recent move by the Saudi government to pause expansion of the country’s oil production capacity.
Aramco on Sunday announced its annual results and revealed that its envisaged capital investments would take a significant hit in the next few years on account of the cancelled oilfield expansion plans.
“The directive to maintain maximum sustainable capacity at 12 million barrels per day, mainly from deferral of projects not yet commissioned and reductions in infill drilling, is expected to reduce capital investment by approximately $40 billion between 2024 and 2028,” it stated.
Why is Saudi Arabia cutting back so sharply on capex? This article has more to it, but it requires a subscription.
Saudi Aramco simply calculated that they wouldn’t be able to recover the $40 billion from additional production. Why else would they cut the capex?
It will help raise prices, with less spare capacity overhanging the market. Win win! Save money and earn more!
More importantly, its a sorted, calculated effort to keep worldwide oil prices in a range that will allow the US to deplete itself of affordable tight oil resources as fast as possible, for 5 MM BOPD of exports to foreign countries.
Its smart. Its a win-win for everybody except the US, which is too stupid to know any better. Over scotch and cigars, they laugh in Riyadh every night at how dumb we are are here in the US. Texas, for instance, is livid today, filed a lawsuit today against the EPA over methane emissions and the fear that any regulations on methane will harm the HZ tight oil sector and reduce its ability to export the last of America’s oil resources away.
Drill baby, drill.
Please don’t worry Mike, I’m told that self driving teslas will completely replace all oil consuming activities, so it’s better we sell it all now for a profit than at a loss when a barrel is only worth $5.
Why keep any money (oil) in the bank anyways, we’ll all be on food stamps soon enough….just no food though…The Middle East has been waging a war against shale for longer than many may realize, dating back to at least 2015-2016 timeframe…seems they may win eventually.
Kengeo,
That will take another 10 years perhaps more.
In 2023 the best selling vehicle in the World was the Tesla Model Y.
https://www.motor1.com/news/706258/tesla-model-y-worlds-top-selling-vehicle-2023/
KENGEO —
Most of the growth in oil consumption in the last decade or so came from China. Combustion engine production has collapsed there as EVs replace them. China produces about a third of the world’s light vehicles.
https://www.just-auto.com/analyst-comment/the-polarisation-of-chinas-automobile-production-capacity/?cf-view
Also most savings on oil consumption come from two and three wheelers.
https://jalopnik.com/sure-evs-are-nice-but-e-bikes-are-slashing-oil-demand-1851031458
Meanwhile, regardless of the fact that Musk oversold autonomous vehicles, the tech continues to advance.
So I wouldn’t be too bullish on oil demand in the next decade.
They intend to invest considerably more in natural gas (for LNG) and perhaps renewables:
https://www.spglobal.com/commodityinsights/en/market-insights/latest-news/oil/031024-saudi-aramco-raises-2030-gas-target-as-capex-growth-to-slow-on-oil
In recent months they have expressed concern about lack of upstream investment by the oil majors leading to possible oil shortages in the near future (2025) !
“India Cannot Get Enough of Coal. India’s coal-fired electricity soared to an all-time high of 115 TWh in January, up 10% year-on-year, leading to a concurrent increase in coal-powered emissions to 104.5 million metric tonnes of CO2 as renewable output dropped lower.” — From Oilprice.com
For smaller population zones of the world–the U.S., UK, Finland, Norway–to push renewables while large population zones like India (and China) are using more and more coal is unsustainable (for the planet). The massive data centers to support the Cloud are going to require gargantuan amounts of electricity–25% of ALL electricity by the end of this decade. So far these data centers have been owned by Amazon, Microsoft, Google.
The major owners of data centers are on the one hand pushing for renewable energy, but on the other are building electricity hogs that will inevitably cause electricity shortages if nothing new is done. They’re pushing hard for small modular nuclear reactors to power those plants, but that’s a ways in the future.
I believe that the KSA appreciates the fact that there will likely be enough oil to support petrochemical, but that the world will inevitably condemn this rising coal usage, which has a GHG emission number more than twice that of LNG. Coming is a huge bull market for electricity. Ten percent of the world population has no ready access to a switch to flip, so almost a billion people want and need electricity. To break out of poverty they need to catch up to the modern world, which depends more and more on data storage. Everyone under the sun is investing in AI–including the Saudis–yet it will, as it matures, hog more and more electricity.
So far, no one but no one has applied pressure on China and India to switch from coal to LNG. For business and diplomatic reasons, other countries have allowed them to go their way, while patting them on the backs at every opportunity. This too is unsustainable. The bridge fuel is LNG, and the Saudis know it. Oil is not the fossil fuel for generation of electricity, but NG is. And man, with AI and data storage, the world is going to need some multiple of our current electricity. No matter what we may think of the emissions, LNG is the cleanest bridge fuel we have available.
“Coal has a GHG emission number more than twice that of LNG”.
It’s time to put that fake talking point to rest. It’s a disservice to humanity. With the paper this week (https://www.nature.com/articles/s41586-024-07117-5) reporting that methane leaks were likely 3x that of stated/reported amounts, and earlier reporting that:
“Natural gas, long seen as a cleaner alternative to coal and an important tool in the fight to slow global warming, can be just as harmful to the climate, a new study has concluded, unless companies can all but eliminate the leaks that plague its use.
It takes as little as 0.2 percent of gas to leak to make natural gas as big a driver of climate change as coal, the study found. That’s a tiny margin of error for a gas that is notorious for leaking from drill sites, processing plants and the pipes that transport it into power stations or homes and kitchens.” https://iopscience.iop.org/article/10.1088/1748-9326/ace3db
If 0.2% leaks, the warming effect can equal coal. They just found 9% leaking in the study above.
It’s time to stop lying about how clean methane is vs coal. Whether it makes a difference as to how fast we’ll render the planet uninhabitable, I have doubts, but at least we can go down without lying about it.
See it in real time: https://viirs.skytruth.org/apps/heatmap/flaringmap.html#lat=32.80848&lon=-103.37361&zoom=5&offset=15
Got2surf,
If the methane is properly flared it becomes CO2, only methane that is directly vented has the higher GWP, there are leaks, but note that not all methane comes from natural gas there are plenty of natural sources as well and on a warming planet the natural sources increase.
Both coal and natural gas use should be reduced as much as possible, note also that coal production also results in methane releases.
Dennis,
This is actually related to the coal bed methane (CBM) fracing.
The current mainstream about CBM is that the storage is by the means of adsorption, i.e. at lower pressure, there is already lots of gas stored than PVT free gas formula, e.g. even if coal rock has porosity only 2% v/v, at 1atm, there is already 10cc of gas in 1cc of coal samples, and this figure quickly flattens as pressure goes up, and at 10Bar, there is about 50cc of gas in 1cc of coal, and at 50Bar, only less than 100cc of gas in 1cc of coal. So, you see that coal is carrying huge amount of methane around after exhumed from ground to rail cars, and slowly emit methane all the way to the coal firing plant, where it is pulverized and lots of methane released, some burnt and a lot more emitted.
Many climate and coal scientists don’t know this or pretend to be blind to this process — I actually used water and frac coal sample couple years after exhumed and measured it.
So, if you do the math, each cc of coal actually easily holds more methane than the best shale in the same volume cc, i.e. 15~50cc/cc for coal and 10~35cc/cc for shale, and lots of coals are buried at less than 1km depth, much shallower than shale.
That’s why CBM with Frac revolution will easily release huge amount of gas. Last year China almost added 5 BCM of CBM production, and this year 10~25BCM will be added.
SHENG WU: “So, if you do the math, each cc of coal actually easily holds more methane than the best shale in the same volume cc, i.e. 15~50cc/cc for coal and 10~35cc/cc for shale, and lots of coals are buried at less than 1km depth, much shallower than shale.”
And at those levels, certain to contaminate ground water. CBM is not a viable competitive source for NG. The world has screwed up its water supply badly enough already.
https://www.msn.com/en-us/money/markets/china-s-cnooc-claims-world-s-largest-offshore-oil-discovery-in-special-rock-formation/ar-BB1iUzoM
Has this been posted before. A very large oil field discovery in Bonhai Bay in China.
seems there are lots of old stranded resources left untouched in EU, they just need to open old well and then find enough to forget Russian oil and gas
https://oilprice.com/Energy/Energy-General/Forgotten-Gas-Reserves-Could-Be-A-Gamechanger-For-European-Energy.html
I don’t fully follow reserves versus resources but addition of 180mmbbl (30 million cubic meters) only counts as a medium sized discovery (it wouldn’t be enough for a stand alone development but it sounds like there is infrastructure already in place there).
right, it is rather small and
this Bohai Bay is like Gulf of Mexico in China, but so far drilled only 1/19th of the number of wells and 1/12th surface structures, and producing at 690 K BOPD, and another 0.65BCFPD of gas; compared to GOM at 1.9 M BOPD and almost 5BCFPD gas.
This discovery is one of the many so called Basement reservoirs — oil trapped in Aeone time Billions Years old rocks, and this one claims to be the oldest at 2.7 billion years. The source rocks are only from Eocene time which is within last 60 million years,oil generated went into the basement which uplift to be so called “buried hills”.
One of the largest basement reservoir was discovered in 1978, at the peak of the oil crisis, close to Beijing in rocks more than 1.2billion years old, and each well produced over 50K BOPD, with GOR only at 40scf/bbl. With 14 wells drilled within 9 months, the field achieved almost half a million BOPD in a year. This made China a major oil exporting country with annual export more than half a million BOPD, and Bush Senior, who was pre-ambassador in Beijing, immediately notified Washington to start importing oil from China. It also made China government believe they could replicate half a dozen such discoveries and made Bohai Bay the Gulf of Mexico or Persian Gulf.
The Ukraine is now zeroing in on Russian oil infrastructure – another refinery and oil tanks this week.
And Russia has already reduced production from the attacks.
We’ll see an additional oil production reduction here when this continues.
And the Brent oil price is at a chart breakout formation at the moment. I think we’ll see somewhat higher prices the next days.
Right now treasury yields and the dollar seem to be positively correlated with oil prices.
Higher oil prices means no rate cuts. No rate cuts at least until something blows up and forces rate cuts.
Nightmare scenario outside the US with both a strong dollar and higher oil prices.
https://mishtalk.com/economics/producer-price-index-ppi-much-hotter-than-expected-in-february/
PPI comes in HOT.
Andre the Giant,
The Fed focuses on PCE inflation which for the past 6 months has been running at an annual rate of 2.5% and if leave out housing, food , and energy(housing has a poor estimate that lags the real rate and food and energy tend to be volatile) the rate is under 2% for the past 6 months. The Fed will base its decisions mainly on PCE.
See link below for data
https://www.bea.gov/data/personal-consumption-expenditures-price-index
Also to see what actual housing rental costs are see
https://www.apartmentlist.com/research/national-rent-data
The PCE Index has housing up 6.8% since a year ago, this is not a good estimate as it is supposed to mirror what you would have to pay to rent your own home, this should reflect market rates. Another market rate estimate is at link below
https://www.zillow.com/rental-manager/market-trends/united-states/
The rent estimates are down over a 12 month period and roughly flat over the past 6 months. This is the reason the housing estimate is excluded, the housing price estimate by the BEA is garbage.
Wolf Richter’s thoughts today on inflation and rate cuts, which have been spot on over the last two years
https://wolfstreet.com/2024/03/15/short-term-treasury-market-walks-away-from-rate-cut-mania-inflation-has-the-upper-hand/
HHH,
Lots of spare capacity in OPEC to take care of any fall in Russian refinery output, there is likely excess refinery capacity worldwide so this is a problem for Russia only. Little effect on World prices is likely.
So if Russian exports were to go to zero, refined products and crude exports go to zero are you telling me that’s not a problem? OPEC can handle it?
Right now it’s just the refineries being targeted. It will expand to the rest of the oil and gas infrastructure in time.
So China and India and everyone else will be made whole by OPEC?
At what price?
I still think oil will revisit $25 in time due to monetary crisis. But let’s say Brent goes to $150 or even $175. (Which would cause a monetary crisis)
Couple that with the purchasing power of local currencies which include all the major currencies losing 25-40% or more of their value to the dollar.
How is this not a problem?
Just going to tell you that dollars will come flooding into the US like crazy in this scenario. You’ll see prices go crazy here. But outside the US the $100 trillion in USD denominated debt that exists on bank balance sheets will have far fewer dollars available to service the debt.
Which is why we will see currency crises outside US.
now, Starship will bring us into LNG time, we need more gas than ever now, see natural gas price up and up!
Sheng Wu,
The warp engines are powered by dilithium crystals, no NG needed. 🙂
“In some parts of New Mexico, more than 9 percent of the natural gas produced was escaping into the atmosphere…”
We are in such a rush to reach our limits,
we leave a great trail of waste and destruction in our wake.
Do we really think that we can just outrun the grim reaper?
… and this means that natural gas is as polluting as coal, or worse, in regards to the atmosphere. Lots of talk here and elsewhere about how clean gas is, and how dirty coal is. Well, it’s all bullshit if you believe the science.
Got2surf,
The US EPA is trying to work on this, but states will fight it in court so it will take time, unfortunately there are many who doubt the science. You know, cigarettes are actually good for you. 🙂
https://www.reuters.com/world/europe/ukraine-launches-drones-oryol-fuel-facility-other-regions-russia-says-2024-03-12/
Ukraine knocks out major Russian oil refinery.
https://www.youtube.com/watch?v=86YrV2D-nB4&feature=youtu.be
3 minute geopolitical analysis – struck 1000 miles within Russia’s borders.
Perhaps a secret service command troup launching some medium range drones somewhere. Smuggling them in should be possible.
For these premium targets is this effort not that high.
I can’t believe Russia is sitting there allowing this to happen.
The USA would blow Mexico off the map (except their Oil) if they started attacking refineries within the borders.
Andre the Giant,
If one country attacks another, they should expect such a response. Russia is already attempting to blow Ukraine off the map. If you are talking about a nuclear response, the fallout would affect US citizens, as would a nuclear attack by Russia on Ukraine. Possibly the only reason it has not occurred.
Tactical nukes.
https://en.wikipedia.org/wiki/Tactical_nuclear_weapon
A tactical nuclear weapon (TNW) or non-strategic nuclear weapon (NSNW)[1] is a nuclear weapon that is designed to be used on a battlefield in military situations, mostly with friendly forces in proximity and perhaps even on contested friendly territory. Generally smaller in explosive power, they are defined in contrast to strategic nuclear weapons
Would send a hell of a message!
Andre the Giant,
The problem is would a nation really want to test these “tactical nukes” very close to their own borders, it is doubtful that these would be used by the US for an attack on its refineries by Mexico, as is the idea that Mexico would undertake such an attack or that the US would invade Mexico as Russia has done in Ukraine. The idea is too silly to discuss seriously, that’s it I am out.
I didn’t say Mexico attacking US refineries is plausible.
I see attacking a countries refineries as a serious threat to national security.
Especially when it doesn’t look like Russia can stop it.
https://www.yahoo.com/news/ukraine-hits-least-3-russian-022544306.html
Sorry, the Ukraine hit 3 oil refineries accounting for 10 percent of Russia’s production.
Unquestionably a threat to national security to the point where Russia needs to figure out how to stop it.
A Ukrainian official told The Financial Times that the strategy is “to deprive the enemy of resources and reduce the flow of oil money and fuel.”
To stop Ukrainian attacks on its oil refineries, Russia could consider withdrawing from Ukraine.
Yes, that might be another way to do it. That would be great with me!
I looked at the war youtubers tonight – it was a new long range drone derived from the Iranian scooter motor type. Very small and cheap, but you need only 10 Kg explosives when you hit the right spot at a refinery. That are no bunkers.
They used the chaos from the separatist invasion into Russia to launch the drone attack – the Russians flighted this off with attack helis and bombers, and they launched there drones between them. Result: A few downed helicopters and planes (air defense was shooting at every spot on the radar screen), and several drones went through.
The most important result of attacks like this is to bring Russia in deploying more troops for air defense into their backyard, weakening the invasion force.
If this continues, we’ll see another one mbpd oil production missing from Russia soon.
And atomic bombs for this? That are similar drones the Russians are shooting every day to the Ukraine by the dozen.
North Dakota oil production was down 172,456 barrels per day in January due to the blizzard.
All North Dakota C+C production
The GoM had a high overall availability in 2023 with almost no hurricane downtime (which typically can remove 2 to 3% of production but has been higher recently), relatively few major scheduled turnarounds and only one significant outage (because of the Main Pass pipe leak – undergoing repairs as of lat February). As a result it did a bit better than the EIA low case prediction (from its 2022 analysis). With a typical hurricane season it would have been about half way between last year and the low case (i.e. still showing some growth). However the decline of about 180kbpd between January and May before Vito and Mad Dog II fully got going may indicate some issues ahead with maintaining production. By BP investors page Mad Dog II (Argos) has a nameplate capacity of 120kboed, not 140 that was reported in some places. That would translate to about 95kbpd oil as an annual average. Mad Dog I was producing abut 40 to 45kbpd and falling before Argos start up so it looks like ramp up has been completed there.
Last year added about 160kbpd on annual average from new fields, and there is only 120 new field nameplate identified as coming on line this year (so maybe 114 annual average but likely under 90 depending on start dates) so an annual drop is likely, whereas the EIA low case has a slight gain. The exact drop will depend on hurricane losses; with La Nina conditions expected and the GoM like a bain-marie the season may be active and intense. Storms getting into the producing areas will cause extensive shut-ins and the most violent (e.g. the proposed category 6) might be outside the design envelope of some platforms and on shore refineries and gas plants, which may therefore see some damage.
2025 has four new greenfield projects for about 210 kbpd nameplate (so maybe 100 to 150 average), and with any short term additions may stay around level overall. Sparta, a Vito copy, went through FID last December so may startup in late 2027. There is nothing else significant through FID at the moment and only a handful of medium sized discoveries available for tie-backs (e.g. Blacktip) or for brownfield development (e’g. Argos Southwest, 20kboed in 2026). There may be some more discoveries but there have been only four (smallish) new fields since 2020 and there aren’t that many exploration wells being drilled. So longer term I think production is likely to be around or fall below the low case, and the EIA reference case and BOEM case (green bars) are not possible. The various high EIA cases are so far out that there surely must have been some political influence in their development.
Mr Kaplan,
Great analysis as usual, thanks. South LA Geo’s comments on this would be interesting as he is the only one with knowledge that is close to that of Mr Kaplan.
Here is the analysis from the EIA AEO 2023 published in March 2023 for Gulf of Mexico reference, low, and high oil supply cases up to 2030.
https://www.eia.gov/outlooks/aeo/
My low-mid-high range profiles are below. I think the queue of recent projects that have come online (Mad Dog 2, Vito, King’s Quay), those set to come online this year (Whale and Anchor), those set to come online next year (Shenandoah, Ballymore and Salamanca) plus the remaining projects (Sparta, Winterfell, probably Kaskida) will, in a mid-case scenario, keep production over 1.5 mmbopd through 2035 or so.
Projections that show production consistently exceeding 2 mmbopd, in my view, are not supported by exploration results. Interesting – when you read recent industry publications about the flourishing offshore industry, they no longer mention the Gulf of Mexico. I saw something recently about the 8 or so GOM discoveries in 2023 : of those that are likely to be developed – they were all tiebacks.
Thanks Bob,
Seems you and Mr Kaplan are on the same page, I assume the mid-case would be your best guess (roughly 50/50 chance output would be either above or below that mid-case)? By eyeball it looks like the midcase is in the 1.8 to 1.9 Mb/d range from 2023 to 2030, seems to be roughly what George is projecting (flattish output for a few years, I think is what he is saying so maybe 1.8ish for his scenario)
Hi all,
a couple of weeks ago Konstantin Samoilov posted this video claiming liquid assets held by Russia’s National Wealth Fund are only 20% of the stated total:
https://www.youtube.com/watch?v=8ls0qxR28YQ&list=WL&index=91&t=63s&pp=gAQBiAQB
While nothing similar has made it to the “western” press, there was this piece in BNN last January also pointing to a considerable gap between stated volumes and actual liquid assets:
https://www.bnnbloomberg.ca/war-in-ukraine-drains-nearly-half-of-accessible-russian-reserves-1.2023038
However, about that time various media were reporting on-going efforts by the Kremlin to obtain sizeable loans from China:
https://www.msn.com/en-us/money/companies/russia-struggling-to-secure-loans-from-china-putin-ally-admits/ar-BB1iUCRW
I suspect the Kremlin has a major budgetary crisis in its hands. The few figures they posted from last year, on execution, debt and reserves do not “add up” so well. E.g. if the wealth fund is so large why has the federal state indebted itself so fast? Especially when interest rates are at 16%.
If the situation is this strained, some ruptus is at hand, possibly still this year, in the form of a currency crisis, a default or something similar.
If we consider New Mexico C plus C output, nearly all of New Mexico’s output of oil and natural gas is from tight oil wells (about 98% from 4 Permian region counties of New Mexico with about 99.5% of tight oil from Lea and Eddy counties). Using EIA oil and natural gas and C plus C data we get the following for New Mexico from Jan 2019 to December 2023. Note also that longer term from 2006 to 2018 the GOR for New Mexico was above 5.6 MCF/bo.
This graph posted by Mr. Coyne is a sort of drive-by effort at showing that oil wells in New Mexico are NOT showing rising gas to oil ratios (GOR’s) and therefore concerns over GOR as an indication of depletion in HZ tight well development is irrelevant.
New Mexico is chock full of wells, old wells, coal bed methane wells, etc. etc. that don’t have anything to do with Wolfcamp and Bone Springs wells declining, significantly, in Lea and Eddy Counties. HZ wells in those two (partial) counties is up 5 fold in the past 6 years.
This chart is, in reality, a twisting of facts, a distortion of the truth. I truly hope people will see how irrelvant it is. Its sort of a middle finger to Ovi, and others, like me, who believe something is causing liquids well productivty in New Mexico to go down and it is pressure depletion in gas-depletion driven tight oil containers.
Looking at the biggest operators, with the biggest blocks of acreage, and the most rigs running in those blocks in that portion of the State of New Mexico lying within the Permian Basin HZ play, is very relevant. GOR especically. The entire State, not so much, but he knows that. Statewide GOR is smoke and mirrors.
Mike,
Lea and Eddy Counties produce 98% of oil in New Mexico, so it is essentially a plot of GOR for Eddy and Lea vs oil for those 2 counties. Not all that different from looking at these counties individually.
Dennis,
Mike is right, NM got about 2BCFPD of San Juan coal bed methane production to start, along with many conventional wells in Eddy and Lea.
I looked at NOVI plots of Eddy and LEA only and found that the GORs from 2013 are from 3.1~3.3 till 2019, and inching up obviously each year 3.5, 3.6, 4, 3.8, and last April reaching ~4MCF/bbl.
These are EF and Permian GORs based on EIA reported crude and associated gas only. Permian and early EF data may be influenced by a high proportion of conventional production.
Sheng Wu,
Chart using Novi labs data Jan 2015 to April 2023 for Lea and Eddy Counties.
Debating gas to oil ratios as to how that metric might be a precurrsor to tight oil depletion is senseless unless it is limited to isolated parts of counties that represent the productive limits of unconventional plays. Like SW Lea and SE Eddy, for instance. Further, pick a big operator in each of those areas in Lea and Eddy, like EOG and Exxon and you’ll now see areas of densely drilled, pressure depleted areas where GOR is upwards of 12, and growing.
If these overdrilled, core areas were not important, then why aren’t those tight oil girls drilling away out in West Culberson County, or Irion County in the Midland? They are still highgrading core areas (thats why Exxon bought Saudi America) and it matters. Big time !
The Delaware Basin in the Permian and Gulf Coast and Maverick Basins of S. Texas are 100 years old; GOR from conventional production, before 2010, is totally irrelevant.
I don’t understand the propensity against the reality of resource depletion other than big egos and a need to be right. If GOR is not an issue in dense, shaley carbonate formations when they deplete, what is? What is causing signicant declines in liquids productivity (in many areas waaaayyy more than 3.5% annually)?
What should we be looking at? Nobody looks at well economics and profit. Nobody knows there the money will come to keep drilling this marginal crap other than to say well, “they are still drilling.”
Or WOR. My God the WOR in these two New Mexico counties is thru the roof. OWR in the Delaware is <20% in most of the cores.
Focusing on some imaginary URR BS that big government dreamed up, per square mile, per bench, and working down…is dumb.
Mike,
Finding information on sub areas of counties is very difficult. From a statistical perspective there is not much correlation between GOR and output for Eddy and Lea counties, with R squared about 16.3% using Jan 2021 to Dec 2023 data from New Mexico OCD for Lea and Eddy Counties. Also the relationship over that period is for rising GOR to be associated with rising production.
If I pull Lea and Eddy output for EOG and Exxon for April 2023 from the latest Novi blog post (Nov 2023) the GOR for those two producers in those two counties is about 4 MCF/bo (for all operators it is about 3.9 MCF/bo, not a big difference.)
I agree the economics suggests the completion rate is likely to decrease in the future, but would suggest that GOR is not a metric at the county level that gives us reliable guidance.
Wells spudded or completion rates or even number of operating horizontal rigs are more useful metrics in my view.
All of my charts have looked at Jan 2015 to either April 2023 (for Novi data) or Dec 2023 for NM OCD data. I do agree earlier data than 2015 is not relevant and using the entire state of New Mexico was a mistake because there is significant natural gas output from counties besides Eddy and Lea so GOR statewide tells us very little.
Mike,
You are correct, there are significant amounts of natural gas for other parts of New Mexico besides Lea and Eddy counties.
The chart below uses New Mexico State Data from Jan 2015 to December 2023 for Lea and Eddy counties combined. Note I offer no interpretation of this chart, though I am sure you will provide my thoughts on this.
Longer term New Mexico C plus C vs GOR, Jan 2015 to December 2023 using EIA C plus C and Natural Gas data.
Dennis – Curious of your settings for the incredibly squiggly line…looks like a signature or something…
Kengeo,
I set the line width at 0.01 inch with a continuous line style in LibreOffice Calc. The GOR jumps around quite a bit causing lots of squiggles.
Got it, thanks!
“The world is at risk of energy shortages unless more money is invested in drilling for oil and gas, Shell has warned”
Anyone have information on the trend in global cost per barrel for new oil E & P over time?
I wonder what is the average vintage of discovery and initial production date for the oil being currently being consumed globally.
While current oil production based on past E & P capital expenditures results in a global price for product
that is affordable at this time, what would be the price for product if it was based solely on new E and P expenditures? Will that oil come in at a cost of $150/b, and if so which industries/regions are still viable at that price level?
The answer to these kinds of questions bares heavily on how much capital can and should be allocated to the search for new pockets of production. What is the return on investment, what is the cost of capital debt, who bears the risk?
What are the alternatives?
Hickory,
Currently there is an excess of crude oil on world markets with OPEC having roughly 2000 kb/d of spare capacity, so in the near term $150/bo is not really in the cards, perhaps $100/bo which the World is likely able to handle with little trouble, but I think we will remain in the $80 to $90 per barrel range (2023$) until 2026.
I was referring to cost/pricing levels of newly discovered and produced oil….what Shell CEO was calling for.
Not the cost of current project output.
Dennis –
I disagree, I’d say there was an excess between 1899 – 1999, nothing since. The oil age kicked off 150 years ago when there were 1.5 B people on the planet. Now there are at least 6 times as many all thanks to 1,500 Gb of oil produced to date.
A big spike has to be coming, maybe $300 per barrel for a very short and damaging spike, higher for longer might mean $130-$199 per barrel.
While it would be terrible, runaway inflation is certainly a possibility…
Unless we are unique, there must be limits to growth and we reached those 15-20 years ago…
Kengeo,
If there was a shortage at present oil prices would be higher. I my be convinced that you are correct when oil prices in 2023 US$ reach about $150/bo (roughly the average annual Brent Oil Price in 2011 in 2023 $). Demand is not growing as fast as it did in the past and by 2030 demand for oil may fall to less than supply which will drive oil prices lower.
IMHO we will never see Brent Oil over $175/bo in 2023 US$ for an extended period (12 months or more).
I brought up this topic to raise the general question of-
‘Where should the next $1T of energy cap ex be deployed…what gives the best bang for the buck?’
I think that everyone who has given it a thought realizes that the next trillion spent on new oil development will yield much less product than the last trillion did.
Speaking of funding, my guess is that interest rates for debt financing stays elevated indefinably except for brief attempts to stimulate the economy. The great dis-inflationary tailwind gain of globalization of labor and supply chains has largely run its course and in fact appears to be sliding into reversal. Add to that headwinds from peak oil, demographic shifts that will make societal debts and entitlements harder to service, and climate disruption costs to economy.
As I see it this all adds up to much more expensive new energy development costs than we have become accustomed to in the past many decades, with only a only few exceptions that vary widely by region. For example nat gas development is cheap in a few locations, and photovoltaic electricity is cheap where it is sunny.
If you think I’ve got it wrong on the long term interest rate trend please do set me right.
HIckory,
The wealthy have little reason to spend all of their money on consumption. So, they’ll always save too much. If too much of the economy’s income were to go to the wealthy, then consumption would be too low, which would depress the economy.
The share of the nations income that goes to the wealthy is currently at an historic high, and still growing.
So…it is very likely that there will be too much capital looking for returns, and so returns (i.e., interest rates) will tend to be at historic lows, despite the current aberration due to covid disruptions.
Regarding NG v Coal above, where I am accused by someone (who uses the idiotic handle of surf something) of lying, I suppose I thought we were talking about use at the utility plant for production of electricity, not leaks. With leaking methane, it’s hard to determine the bigger Satan. There are methane mounds all over the GOM and also the Siberian Traps are coming out of the permafrost and literally exploding with methane. As far as manmade leaks, there are thousands of orphan wells leaking methane, and coal bed methane is also leaking. The orphan wells can and will be plugged, but it’s hard to plug a coal bed methane leak. The TRRC has allowed unfettered methane venting, which was so dumb and greedy that it makes me want to puke. So yeah, it’s a nasty world out there, ain’t it?
From the standpoint of NG, and associated oil production, you may get your wish soon. NG at the Permian WaHa Hub is upside down right now. In other words, you have to pay to get it taken off your hands. This does not augur well for the recent Exxon purchase, in which they gave a whopping $3.5M per drilling site premium. Those wells cost upwards of $15M now, and have a significant gas cut. Right now, in current time, many of them would merely break even. As I’ve said many times, in any solution gas drive shale oil basin, the Achilles heel is the immense volume of NG that comes up with the oil. The (probably transient) fall of GOR in the two southeast counties of NM won’t make a tinker’s dam against the increasing gas cut in so many thousands of oil wells across the entire basin.
But, here I would offer a slight warning–at the risk of being called a liar again, which is a coward’s thing to do, when you hide behind an alias and I use my name–it has been said recently (WSJ) that roughly half of all food production is due to ammonium nitrate, which is 100% manufactured using the Haber-Bosch process, and that uses NG as feedstock. You can actually perform that same equation using methane from coal, so let’s just burn the living shit out of the coal so we can feed the masses, sounds like a great idea, Surfer Boy.
https://www.youtube.com/watch?v=lsShcL5oII0
Germany seizes oil and gas assets from Russia.
Impressive and thorough analysis of what is going on.
Joe Blogs – knocks it out of the park.
Norwegian NPD issue timely estimates field reserves and discovery resources. It doesn’t use proven/probable categories but given that there is generally upward revision I think the estimates are probably mostly proven. The dark green/red are reserves, light green/red are resources (either already approved for development but not yet through FID or expected to be developed). Total oil and (below) gas reserves and resources have been declining for the past few years (as might be expected in a very mature basin (the Johan Sverdrup development and some Artic fields make it appear closer to peak than it really is, most of the larger oil fields are well into late life). For 2023 the large drop in resources is particularly noticeable showing a possible slowing in discoveries.
The continuous and steady decline in gas reserves and resources is especially clear.
R/P for oil has been continuously declining, meaning production is being maintained at the expense of increasing reserve depletion. The level of revision addition has also been falling, another sign of a mature field as the probable and possible reserves are exhausted. Gas production is at an earlier stage than for oil and is similarly dominated by one field (Troll versus Johan Sverdrup for oil) but is likel to be showing similar declining revisions soon).
Thanks for the great info.
Thanks!
A slowing rate of discovery, but a lot of activity to avoid any kind of steep decline anytime soon overall is my impression too. I suspect we are approaching hard limits when it comes to discoveries, thinking about the vast amount of advanced technology used in the seismic/discovery phase so far. Some of the companies probably have a few “sleeves in arm” still, but not at the same rate as before. There is some slack out to the 2030s and 2040s due to all the activity; the devil is in the details (which is too difficult for me at least to get an accurate picture of).
New Posts are up
https://peakoilbarrel.com/opec-update-march-2024/
and
https://peakoilbarrel.com/open-thread-non-petroleum-march-18-2024/