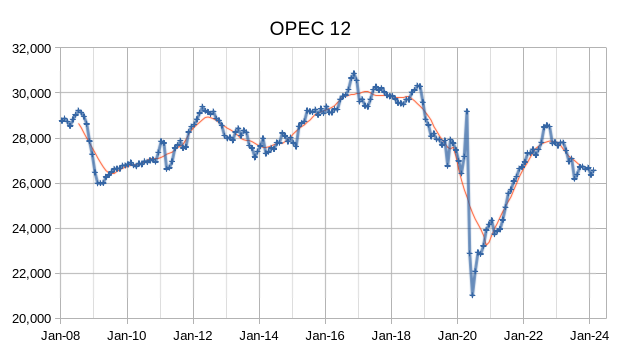
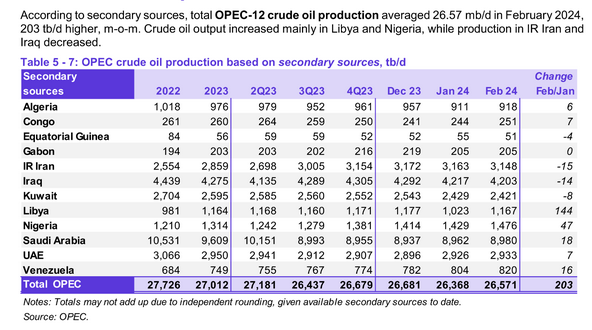
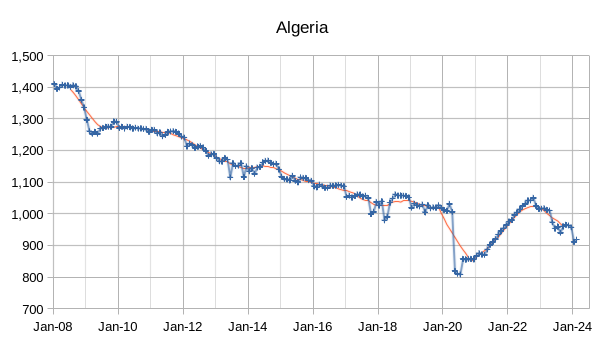
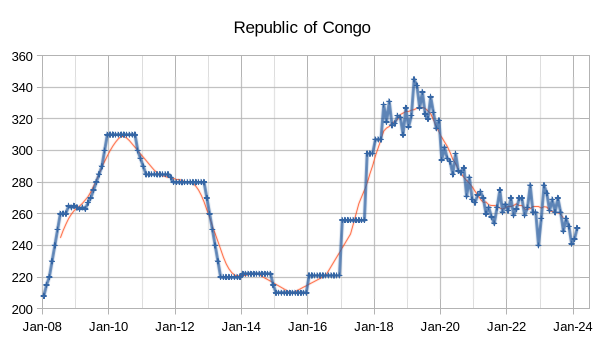
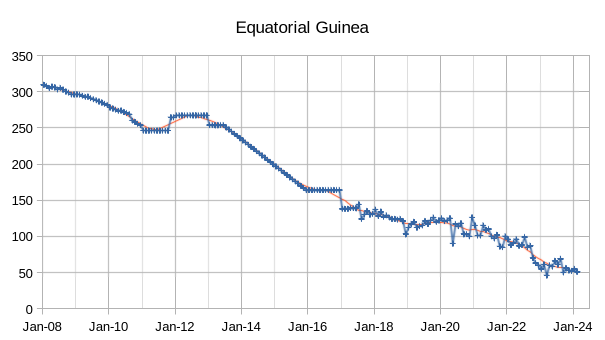
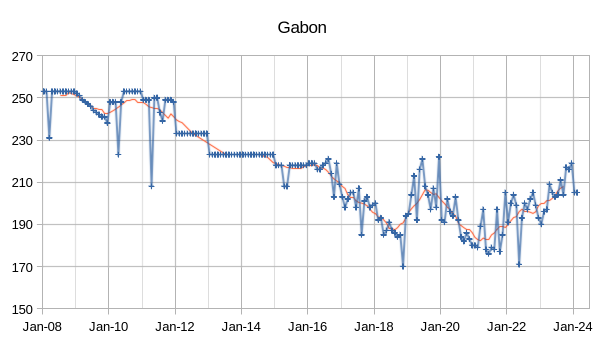
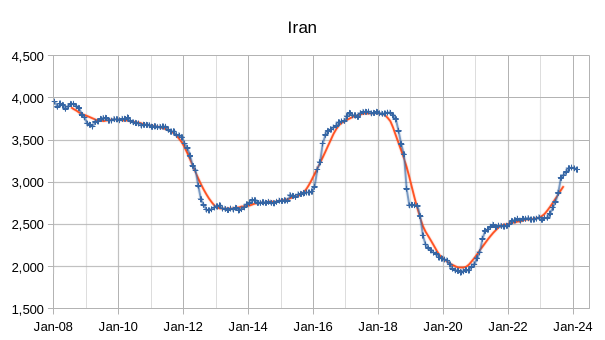
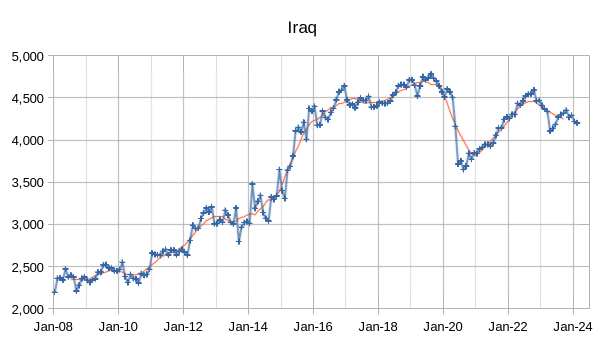
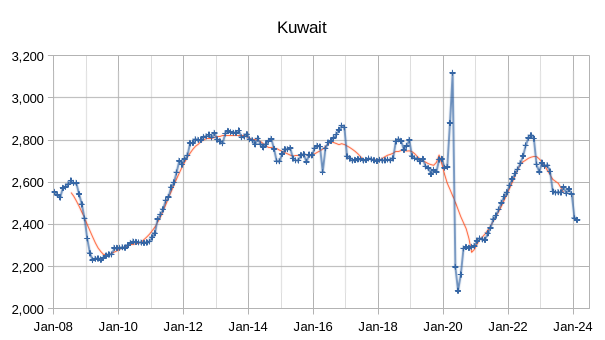
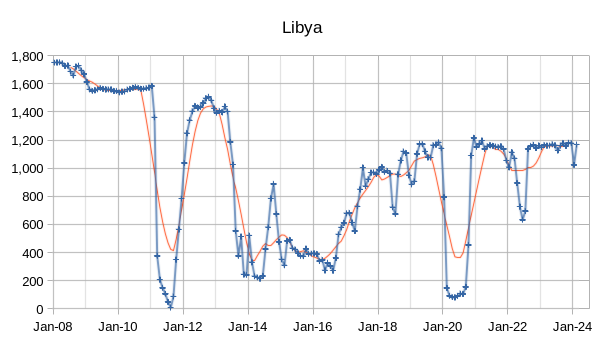
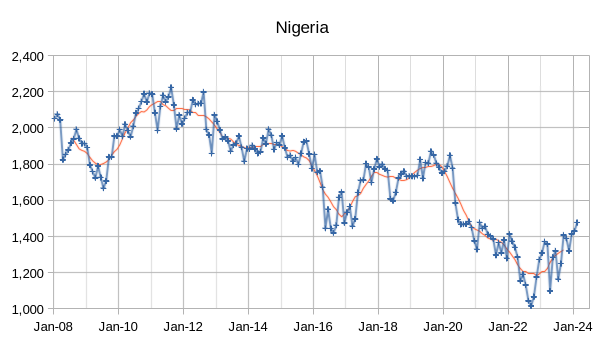
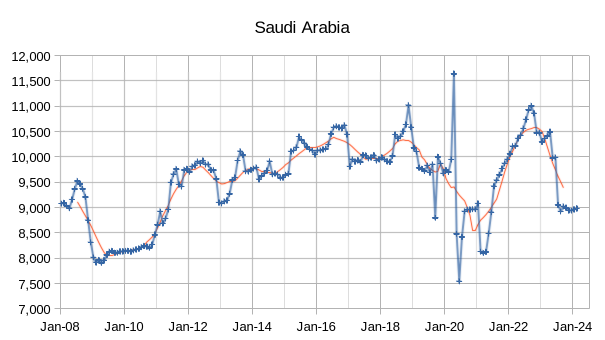
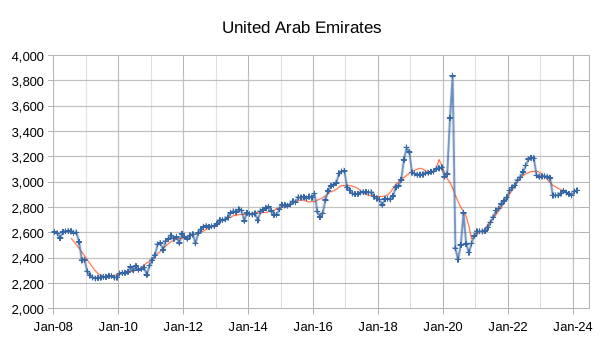
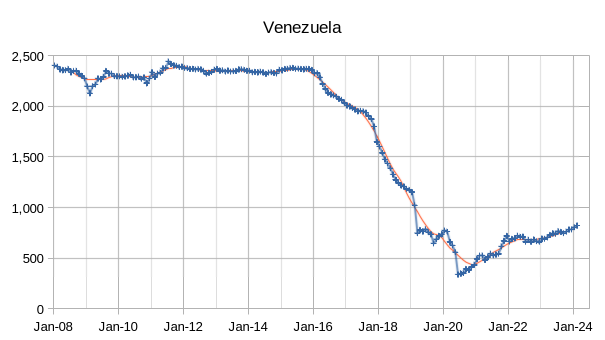
The OPEC Monthly Oil Market Report (MOMR) for March 2024 was published recently. The last month reported in most of the OPEC charts that follow is February 2024 and output reported for OPEC nations is crude oil output in thousands of barrels per day (kb/d). In the OPEC charts that follow the blue line with markers is monthly output and the thin red line is the centered twelve month average (CTMA) output.
There was no update on World Liquids in the March MOMR which is different from every other MOMR I have read.
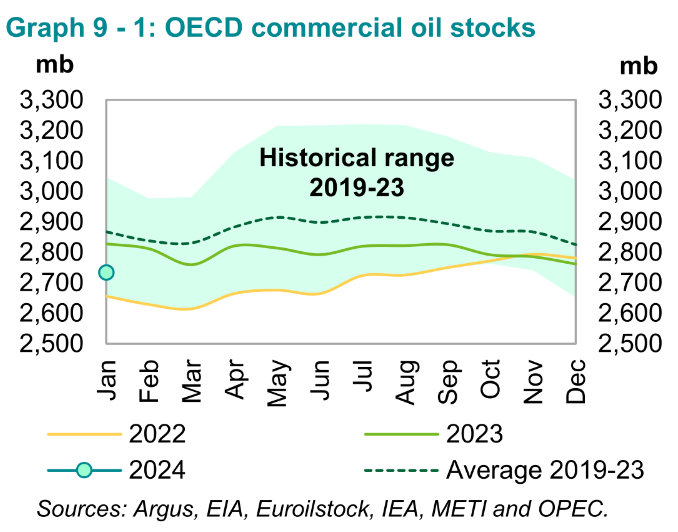
Preliminary January 2024 data shows total OECD commercial oil stocks down by 26.8 Mb, m-o-m. At
2,735 Mb, they were 94 Mb lower than the same time one year ago, 132 Mb lower than the latest
five-year average and 192 Mb below the 2015–2019 average. In short, OECD commercial stocks are low.
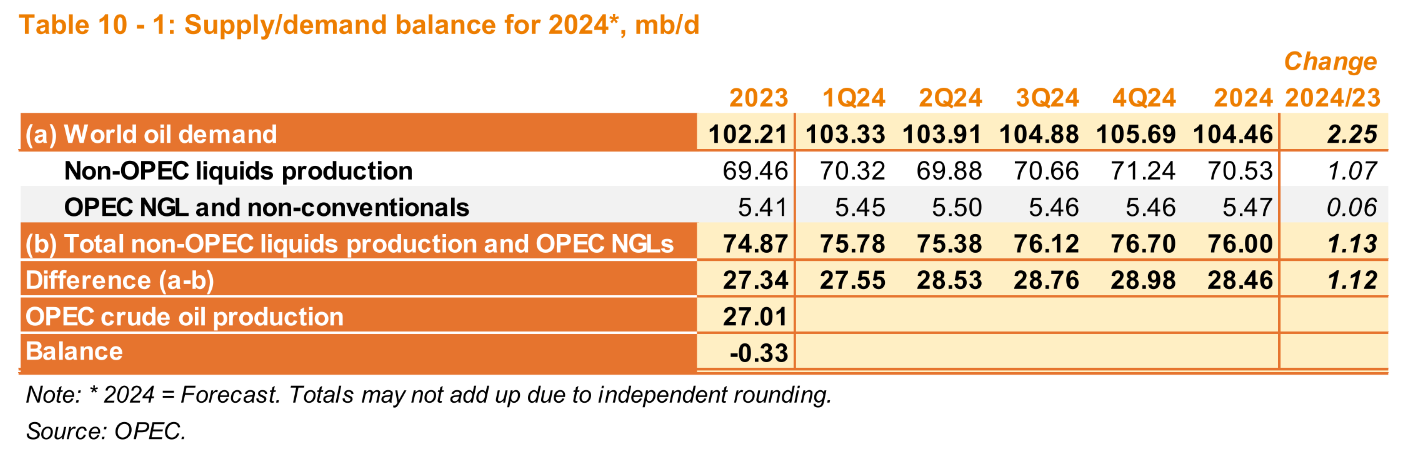
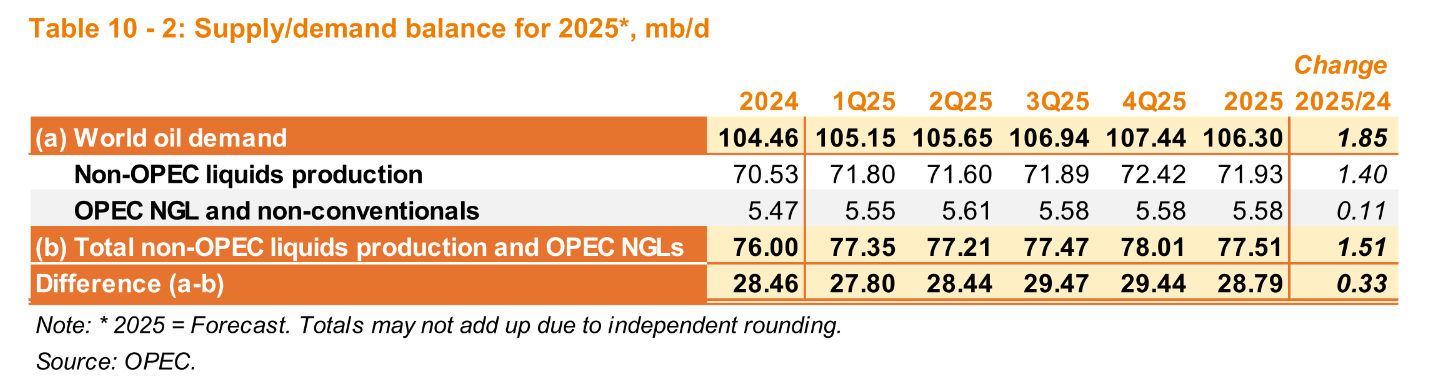
OPEC expects robust growth in World Demand for Liquid fuel in 2024 (2.25 Mb/d) and 2025 (1.85 Mb/d), the growth in liquids demand expected by the EIA is about 1.4 Mb/d in 2024 and is similar to the IEA’s estimate in their March Oil Market report of 1.3 Mb/d. In addition the EIA has a 1.24 Mb/d lower estimate for World liquids demand in 2023 than OPEC.
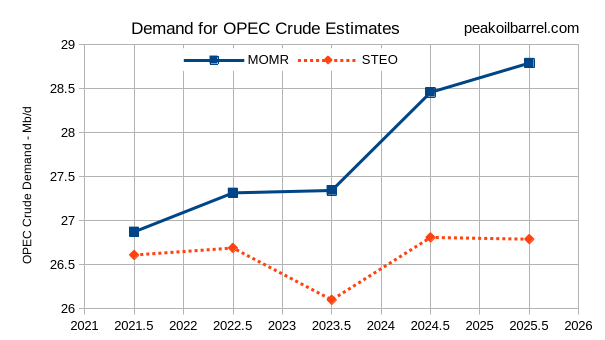
The chart above shows the different estimates of the “call” on OPEC for crude in the March STEO and MOMR reports. These estimates may represent wishful thinking on the part of both agencies and reality may fall somewhere between these two estimates. My guess is that demand for OPEC crude may be closer to the EIA’s STEO, but I am often wrong in my predictions of the future.
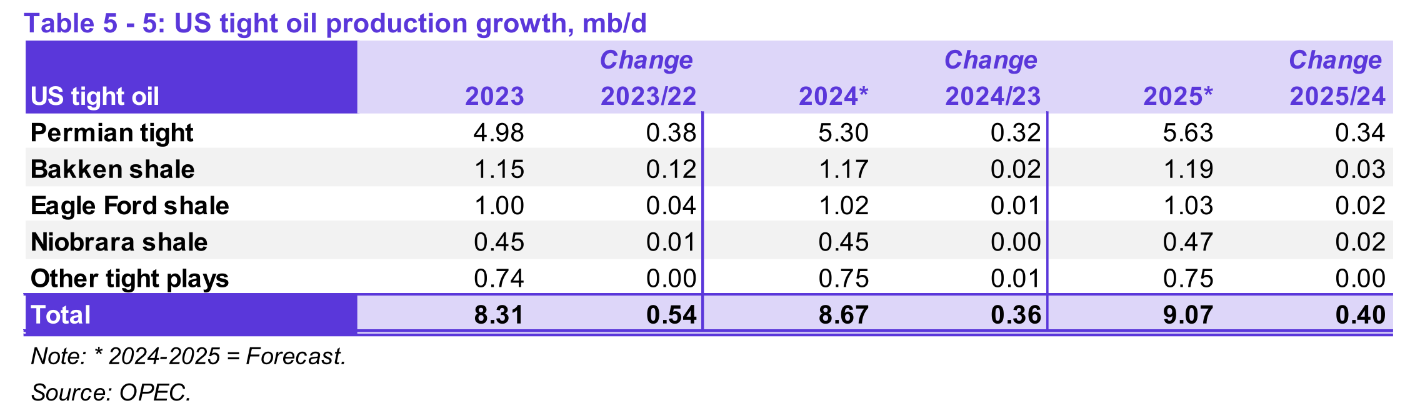
The OPEC estimate for future US tight oil growth in output is unchanged from last month, about 4% growth in 2024 and 5% growth in 2025.
137 responses to “OPEC Update, March 2024”
Thanks for the work Dennis.
Thanks Dennis, WTI price has been moving steadily upward since it’s low point of ~$68 in December 2023.
Current trend is 6% monthly growth (~$5 per month increase). Assuming this trend continues thru June/July timeframe (not a great assumption, could be large market moves either direction), WTI would stand somewhere around $103. In context, since ~2004, there are very few years where WTI was less than $100 during the summer driving season.
There is potential for increase to be higher, in the $15-20 per month increase range, this would bring WTI to almost $150 by that time…I’d guess the new normal price range between now and 2030 will be $90 – $150 with spikes above. The relative price stability seen between 2015 – 2021 was on account of shale oil coming to market. This will have inflationary impacts that will likely drive inflation above 10% annually.
Kengo
It is not possible to have a 150 dollar oil price over a sustained time period, without a collapse in the financial system in my opinion. A “wash out” is going to come, just no way to predict when. Maybe a “wash out” not necessarily means a reboot of the financial system, more a recalibration. I am leaning more towards that – just free speculation on my behalf here. Dennis C. may have a better answer.
I think the most likely way forward for the official data and official view on global oil production and Peak Oil, is a kind of “stealth Peak Oil” (see what Kurt Cobb wrote about this concept in 2020, here: https://www.resilience.org/stories/2020-05-24/a-stealth-peak-in-world-oil-production/), where we think we have a lot of oil (because we have begun to count all kinds of strange stuff), but it is more and more expensive, and since the decline of EROEI (Energy Returned on Energy Invested) is very difficult to measure (everything here is almost a guess work), we will not discover, at least not publicly, when we are really peaking and the decline begins, we will just watch the global economy decline more and more, just as it has since 2005, when conventional crude oil (minus condensate) peaked. Like watching a very slow train wreck, a wreck that goes so slowly, that we never ever really understand the reasons for it, how the puzzle pieces fit together, the whole picture, it will be buried below a mountain of small details, just as it almost always is at http://www.oilprice.com, where almost only Gail Tverberg sees the big picture, it sometimes seems to me.
I agree, I think 1P – 2P – 2PC – 2PCX is a house of cards and anyone focusing on 2P+ is kidding themselves, Mr Kaplan produced some really good visual aids in the last post comments.
I’ve followed Gail’s work for a very long time, great analysis and insightful description of the complex interconnected economy. I seem to think that peak oil and ww3 are closely connected.
Kengeo:
Definitely. Somebody said that all wars are in the end resource wars. I just watched this long Youtube video chat on the issue, organized by Ukrainian-Canadian peakoiler and collapsologist Andrii Zvorygin: https://www.youtube.com/watch?v=fKu802QsmCI. I highly recommend it. They have a long series of Peak Oil chat videos. I have pretty much watched them all. John Peach, one in the chat group, has done a good work with calculating the remaining oil reserves.
Kolbeinth,
The average real spot price for Brent crude in 2024$ from Jan 2011 to July 2014 was about $149/bo, the World economy (real GDP at market exchange rates) grew at an average annual rate of roughly 3% per year over that period.
It is not clear that $150/bo in real dollars would cause as much distress as some seem to believe. In addition demand for oil has been growing more slowly of late and there is much excess capacity for oil production in the World at present (about 2000 kb/d).
Finally, someone who can see the relationship between oil and money…!
I’m not sure about the statement that there are few years where WTI was below $100 during the summer since 2004.
WTI has been in the area of $100 in 2008, 2011-14 and 2022, as I recall, without looking it up.
It first hit $100 in 2008. GFC dropped it and didn’t recover till 2011. Shale/OPEC issues dropped it in 2014. It didn’t hit $100 again until the Russian invasion of Ukraine in 2022.
Again, this is from memory. Not hard to find the data.
Kengeo,
A couple of problems with that scenario.
1. Higher prices will make more tight oil wells profitable and may lead to higher completion rates and higher tight oil output.
2. OPEC has about 2000 kb/d of spare capacity that can be brought online at the moment of their choosing, I will speculate that this would occur at around $95/bo in 2024$ for Brent.
The US could choose to increase the level of sanctions enforcement on Iran unless Iran reigns in the Houthis, that might reduce the problems that currently exist in the Red Sea, which is a large part of increasing oil prices.
Weekly Brent Sport prices from EIA below for past 104 weeks. The general trend over the past two years has been lower oil prices. And a very small increase over the past 52 weeks about $5/ year in nominal terms.
Dennis
Nice job
A technical analyst would look at that chart and say the oil price has put in a double bottom. Combine that with actual OPEC cutbacks and it is unlikely that that downtrend is going to resume anytime soon.
The bigger question is how far will OPEC let prices rise before they add 500 kb/d to the supply side.
Ovi,
I agree the down trend is unlikely to continue, but I think the recent three month increase is unlikely to continue, I think the price trend will be relatively flat in the 80 to 90 dollar range in 2023$ for Brent crude. Of course I never get prices right so in fact the range that I guess may be the least likely price.
Ovi,
For those new here (does not apply to many) I have long predicted higher oil prices of $100/bo or more (starting about 2014 when they began to fall) and have been wrong on this for about 10 years or so. Now that I have changed my thinking to a relatively moderate $75 to $95 per barrel window for Brent over the next 10 years or so, oil prices are bound to increase more than I predict or perhaps they will crash to $25/bo as some have consistently maintained. In any case the chances are nil that my guess will be correct.
Here is monthly data for Real Brent Spot Price in 2024 US$ per barrel from Jan 1988 to Feb 2023. In real terms the price of Brent in 2024$ was between $140 and $160 per barrel from 2011 to 2014.
If we look at the past 13 months of data (Feb 2023 to Feb 2024) the annual rate of increase in real Brent Oil Price has been about $1.18/year in 2024$. So at that rate we reach $100/b in about 13.5 years (around 2038).
i wonder if the real brent price could be factored by something like the Fed’s nominal broad US dollar index to adjust for US dollar strength to give a more “global” picture of price changes?
Phil,
The best I can do is real prices annually based on World Bank average consumer inflation for World and nominal Brent prices. Data from links below.
https://fred.stlouisfed.org/series/FPCPITOTLZGWLD
https://www.eia.gov/dnav/pet/hist/LeafHandler.ashx?n=PET&s=RBRTE&f=A
Just curious – Is there any way to know how much of the oil that actually is transacted is done at/near Brent prices? There are a number of places with oil which is somewhat stranded – think of some of the Canadian grades – that trade at quite a discount. Add to that oil from Russia which likely is trading at a discount. So Brent may be overstating the actual price paid for oil. So then the question becomes how stable that ( potential) discount of actual volume weighted transaction prices are vs Brent. If that ( assumed) discount is stable it probably doesn’t mess too much with the various analysis but it that relationship is not stable the conclusions, for for example, the relationship between oil prices and GDP – become more suspect.
Rgds
Vince
Vince,
Too much data to track to accomplish that, there are a lot of different grades of crude all of which trade at different prices, Brent is generally chosen as the best representation of the average World price for crude, how well it represents the actual price is not known by me.
You can research it and get back to us.
Found this while trying to find an answer, though it does not answer the question, it is interesting.
https://www.oilsandsmagazine.com/market-insights/oil-prices-explained-how-to-value-a-barrel-of-crude
Dennis – I have poked around but the most I can find is posted prices for various grades but no volume to go along with that so there is ( for me at least) no way to come to a weighted average price of actual delivered oil. I just thought that you may have had some secret source for stuff like that.
Weekendpeak,
Sorry, no I don’t have that info, someone may, but it would cost more than I am willing to pay I think.
Thanks for the graph and the data links. The context for me in Australia, from 2011-2014 the aussie dollar traded at parity to the USD, compared to a more “normal” range of 1 AUD = 0.70 USD. The relative weakness of the USD took the sting out of the high USD price for oil for Aussies.
Using your link for Brent Price and the Real Broad Dollar Index at fred.stlouisfed.org/series/RTWEXBGS I made the graph below, showing oil was “cheaper” for the other parts of the world than the raw USD price during that period, and now is “more expensive”.
Hi Phil,
I would suggest using the following index
https://fred.stlouisfed.org/series/RTWEXBGS
Using this on annual data, I get the following for World Real Brent Price from 2006 to 2023 in 2023 $ (using the real broad dollar index).
Comparison using CPI index set to 2022$ with World Bank estimate for World average inflation (also 2022$), CPI uses monthly data, World Bank uses annual data (as we only have an estimate for annual inflation rate). From 2008 to 2022 the estimates are pretty similar.
The previous supercycle of the 70s/80s is not shown…
The supercycle oil price theory goes like this:
Prices are high when there is not enough non-OPEC supply and OPEC can set the price. That was the story of the 70s. That cycle popped with North Sea shelf and Prudhoe Bay, which ushered a long era of abundance (~ 20 years) despite:
(i) Iran-Iraq War in the 80s, (ii) drastic cuts by the Saudis, close to 7 MMbpd, (iii) post-Soviet collapse in the Russian oil sector.
From the low point in 1999 the gradual depletion and supply tightening started the next cycle. Prices went up relentlessly, and stimulated the shale oil/oil sands investments. That cycle popped in 2014, and the abundance narrative set-in driving low prices. That was a much shorter “abundance period”, however, and In 2018-19 the narrative started to change again with “end-of-shale” talk and EM/China never-ending demand growth talk. That upswing was busted quickly and violently with the COVID-19 pandemic, so you can either call it a short cycle or an interrupted cycle.
Right now we are probably in the early stages of a new supercycle : either a brand new one, or a resumption of the interrupted 2018-19 cycle, depending on how you define the boundaries.
Kdmitrov,
In October 2018 Brent prices fell due to oversupply and led to OPEC cuts in output in 2019, but prices continued sideways until the an OPEC plus disagreement (late 2019/early 2020) and then the pandemic brought them down.
Since the recovery in prices by June 2021 the only serious increase in prices was due to the disruption in output due to the war in Ukraine.
Perhaps we will eventually see another supercycle in oil prices, but my guess would be 2027 to 2030, if demand outpaces supply. This might not happen, it is possible that we never see sustained (3 months or more) Brent oil prices in 2023$ above $100/bo in the future.
Dennis,
what matters to price is non-OPEC supply. In the 80s and 90s it was abundant and price was low. In 2014-2018 it was also abundant due to shale. If non-OPEC is gasping, OPEC will control the price of oil, and I suspect it will be in excess of $100.
Kdimitrov,
Perhaps that happens, but non-OPEC resources may be developed at over $100/b and increase non-OPEC supply and in addition as electric transport ramps up it may reduce Worldwide demand for oil relative to a slower ramp up. Soon EVs will reach price parity with ICEVs (or become cheaper from a TCO perspective) and charging infrastructure will become more widespread (this is simply a matter of installing chargers, not technically difficult). Many discount this possibility despite annual sales growth in plugin vehicles north of 40% per year for the past decade. This rate will of course become slower over time, but the transition to electric transport is likely to impact demand significantly by 2028 to 2032 IMHO.
Dennis,
logical points, but generic.
In prior cycles the non-OPEC supply DID come, but it took close to a decade. North Sea/Prudhoe Bay in the 1970s, Shale in this century. Where will the next wave of non-OPEC supply come from? Maybe deep off-shore? It takes a long time for these new waves to come along…
As for EVs, the impact on gasoline so far hasn’t been as large as some prior disrubtors, such as the ethanol mandate or the OBama-era CAFE standards… Maybe it will grow to be a game-changer, but still too early to tell.
Kdimitrov,
There are a lot of governments pushing hard on the transition to electric transport (EU, US, and China at least, perhaps most of the OECD) these are likely to have at least the impact of Obama CAFE and Ethanol Mandates in the US. I imagine there are many deepwater projects that are waiting for higher oil prices to get the FID and tight oil might either increase or at least maintain plateau with higher oil prices and the lead time here is quite low (6 months or maybe 18 months if more rigs or frac spreads are needed). Things can change with high oil prices and yes sometimes there can be a significant lag for complex projects like ultra deep offshore or Arctic Oil.
Looking back at older OPEC MOMR reports we still have not returned to 2018 levels of crude input to refineries through 2023 (annual average). OPEC does not make a forecast for World refinery throughput for 2024 or 2025. It will be interesting to watch.
Oh on the tight oil, if we consider 2008 the peak of the initial 21st century supercycle (which ended in 2014, we could also use 2011) by 2012 tight oil was beginning to take off, so not really a decade in my mind, maybe 5 years tops if we consider 2009 the start, by 2014 OPEC is ramping output to take back market share from tight oil. I agree in the 70s it was roughly a decade to respond to the Arab Oil Embargo and the higher oil prices that resulted.
Kengeo,
Price goes up and down, a short 10 week trend is not likely to continue for long, prices usually come down in the April May period and then increase July to Sept and then decrease again in the fall, there tends to be a seasonal cycle so 12 month trends (or 52 week trends) give a better indication of where prices might go. Lots of things can change this such as the end of the Israel Hamas conflict, changes in OPEC policy and an infinite number of possible events that I don’t have space to list.
Trends often change.
Kengeo,
Lets look at a model based on Dec 2021 to June 2022 monthly Brent Spot prices, the model assumes the trend (based on OLS) continues after June 2022. That model is compared with actual monthly Brent Prices in chart below. The trend changed. I see a relatively flat trend based on Dec 2022 to Feb 2024 monthly Brent data, but that trend is also unlikely to be correct (annual rate of increase is $1.7 per year for OLS trend).
“Saudi Aramco CEO says energy transition is failing, world should abandon ‘fantasy’ of phasing out oil”
A person in his position would love the scenario where the world is short on oil with no backup plan in place to blunt the shortage as oil supply declines.
Yeh, lets just pretend oil supply goes on indefinitely.
Most here would say the transition was destined for failure. We can’t reasonably expect that wind, solar, hydro, and nuclear would supply 10B people with all their energy needs, specially fossil fuels can’t supply 5B people with enough energy to make it out of poverty…Gail Tverberg often points out that the more advanced countries have the most to lose, I might agree but think that those countries wod be able to hold onto basic needs for longer and therefore have a higher chance of emerging from the ruins…Haiti/Ukraine/Gaza might be examples of this…
A transition to renewables is guaranteed to succeed, it just won’t be the sort we’d like. With all the surface metals gone the best possible would be some sort of neolithic village, but with climate change accelerating agriculture is unlikely to be stable enough for settled communities, so some sort hunter gatherer society with tools constructed from scavenging of past cities is most likely after 2100.
To those three countries you can add Yemen, Lebanon, Sudan, Afghanistan with Pakistan, Nigeria, Egypt, Venezuela, Ecuador, various East African nations maybe just a bit better for now.
Nothing of the metals is gone beside a few tons on the way to Mars, Jupiter or deep space. You just have to look at other places for them.
Even the geostationary satellites will come down some day.
And resource scarcity and price makes it own agenda – batteries for example are already possible with salt, aluminum , iron and some hydrocarbons. And zero rare earth. Nothing fancy.
Thanks Dennis, good work. Interesting that OPEC sees the global economy humming this year and next.
No decrease in global liquid fuels demand at all.
Iron Mike,
Yes their view is optimistic from their perspective (where they hope for higher oi prices0 and the US EIA has an optimistic view from their perspective (where the hope is that demand is subdued and oil prices remain low). Probably an average of the two estimates will be closer to reality, though I think a bit under this average will be correct (but I may also be too optimistic).
gas is in more serious trouble, the increase of gas consumption has been lagging behind liquid.
We need starships to reach moon this time in 2025.
Iron Mike,
In 2025 the EIA expects annual consumption of liquids by the World to be 103.8 Mb/d an increase of 2.8 Mb/d from the annual level in 2023, estimated at 101 Mb/d by the EIA. OPEC has a much higher estimate for both 2023 annual liquids consumption (102.2 Mb/d) and for consumption in 2025 (106.3 Mb/d) about 2.5 Mb/d higher consumption in 2025 forecast by OPEC than the EIA’s most recent STEO. Much of this increase may be NGLs such as ethane, propane and butane (which in my view are less important than crude plus condensate). Demand for crude plus condensate may be growing more slowly as reflected by the price of crude oil in the face of OPEC cuts and ships being attacked in the Red Sea. Difficult to predict what happens if oil prices continue to rise while the price of batteries continues to fall.
The Tesla Model 3 can be leased for $329/ month (36 months/3000 down) vs $452 per month for equivalent Camry Hybrid LE in the US (Maine). Eventually the word will get out that charging an EV is not very difficult and maintenance is pretty cheap. Also the Tesla Supercharging network being opened to Ford, Rivian, and other companies in the near future will give other EV owners a taste of a decent charging network and reduce range anxiety. These factors could affect future oil demand as could the aggressive expansion by BYD in the OECD with a large offering of PHEVs which some people favor over BEVs.
Dennis,
It is hard to say whether EVs have had any impact on oil consumption YET. I am sure within the next few years it might be slightly more clear. If oil prices drop as a result then ICEs might also gain demand, they are still more convenient.
Oil demand for now seems to rely on more how the global economy is doing. OPEC seems to speculate that demand for liquid fuels will not drop within the next couple of years. EIA seems to think otherwise, who the hell knows. For me it depends on credit availability and easy money. Central banks will do whatever in their power to keep the money flowing. So maybe OPEC is right.
Iron Mike,
Nodody knows we can only guess, if oil prices rise EVs may sell better and if oil prices fall they won’t sell as well all else being equal. I expect we will also see the price of EVs fall as batteries become cheaper, my expectation for the next 5 to 10 years is for oil prices to remain in the $70 to $90 per barrel range in 2023 US$. I agree we probably won’t see EVs and plugin hybrids have a big impact for 5 to 10 years.
At the end of 2023 it is estimated that about 40 million EVs were registered. Let’s assume each is driven 12000 miles per year replacing a vehicle that had average fuel economy of 30 miles per US gallon, that is about 9.5 barrels of gasoline per year per vehicle or 380 million barrels of gasoline per year or 1.04 Mb/d not a huge impact, but it is early days. In the next 4 years EV registrations might increase to 150 million so about 4 Mb/d of gasoline demand replaced, this ignores the growth of 2 and 3 wheeled EVs, as well as EV buses, and trucks. Future rates of growth are unknown (I have assumed sales growth of 35, 30, 25, and 20% over the next 4 years, growth rate of sales has been about 40% per year on average over past decade). Note that the EIA assumes World real GDP grows at 2.8% in 2024 and 3.1% in 2025. The OPEC MOMR has World real GDP growth at 2.8% in 2024 and 2.9% in 2025. The difference in the liquids demand is a difference in how much oil is needed for that level of growth, the EIA and OPEC have very different perspectives on this.
Iron Mike,
I though a bit more on this EV impact question. Let’s imagine the average new EV or PHEV drives 15 thousand miles per year and replaces a vehicle that on average had fuel efficiency of 25 miles per US gallon, the fuel savings would be about 14.3 barrels per year. About 14 million plugin vehicles were sold in 2023 so World savings for these assumptions would be about 548 kb/d for reduced fuel demand Worldwide compared to the alternative scenario where no new plugin vehicles were sold. For many years (1983 to 2019) the long term trend of increased World C plus C consumption was about 800 kb/d per year, so the increased plugin vehicle sales may have already had some impact in reducing demand (about a 60% reduction assuming the reduced fuel use is all gasoline and taking the energy content of a barrel of gasoline as about 89% of a barrel of crude). In a couple more years we may see demand start to fall as EV sales increase.
Norway C&C production through December 2023.
Norwegian wet gas production through December 2023.
This shows more recent C&C production. The rapid rise in Johan Sverdrup water cut is the most notable feature.
This shows UK oil production (red diamonds) compared with mostly P10, i.e. high case, estimates taken from environmental assessment submissions before new developments were approved. The black diamonds are from the UK North Sea agency projection.
This picture, which is a sample of the worlds overall prospects, shows exactly why people will fight hard to accomplish some degree of transition away from oil. Look to Chinas efforts in this area to get a glimpse of what importing countries (just about all countries) need to work full speed on.
The speed of contraction in economy, population, stability all depend on the degree of success/failure achieved.
With all respect, Hickory, China’s effort was to genetically engineer a deadly virus, and then, during the pandemic, install about 700 new teapot brown coal utility plants, all the while manufacturing 75% of the world’s pharmaceutical precursors (from petrochemicals) and parceling them out, and assembling iPhones using Uighur slave labor.
I might pause before using China as the world prototype for preservation of the planet.
Source for your information?
Oh please . . .
So you’re just making shit up then
Gerry…you discredit yourself.
The China comment was simply about their efforts to diversify away from oil. They are a big importer, with a big incentive. Just like most all countries of the world will be before too long
[…] original post […]
[…] Original Post […]
[…] Original Post […]
What?
You’d seriously like a bunch of references about the virus? Or the coal utility plants? Or the Uyghurs?
These topics have been in newspapers (WSJ, NYT) for months, if not years.
Surely you read? Or do you just like to impress people with your sterling lexicon?
Gerry – You can’t be surprised…many prefer to stick their heads in the sand…
China’s population has grown by 10M people per year for over 40 years, India by 16M during that time.
US growth has been much lower in comparison, 2.5M per year or so. All in all that’s 33% of global population.
Gerry, of course you are wrong about China adding 700 new power plants between 2020 and 2024, they added more, in fact added 1,079,982Mw of coal power plants in those years. That amount is capable of providing over 8,000Twh of electricity compared to the total solar capacity of 510,000Mw capacity, capable of producing at say 5hrs/d of a total output of 930Twh, or just 10% of the new additions of coal in that period!!
References??
https://docs.google.com/spreadsheets/d/1j35F0WrRJ9dbIJhtRkm8fvPw0Vsf-JV6G95u7gT-DDw/edit?pli=1#gid=647531100
https://globalenergymonitor.org/projects/global-coal-plant-tracker/?gad_source=1&gclid=CjwKCAjwkuqvBhAQEiwA65XxQHOjoCIoymoXkW9-A1K1dBOvWskSqlTiMYeSXtuawOzRCSNW1hXg0RoC314QAvD_BwE
https://balkangreenenergynews.com/renewables-2023-report-solar-china-drive-record-renewable-capacity-additions/
Does anyone really think China could have added all the extra solar production (of the panels!!) if they didn’t increase their coal fired electricity output?? If you want want more solar, it means MORE coal use, to mine, process the minerals and make the panels in the new factories needed to build it all (including the mining equipment).
If China stops using coal tomorrow, the production of solar panels stops tomorrow, how is this hard for people here to understand??
Must be really hard Hideaway
You keep explaining it and still nobody gets it.
🤦♂️
No coal=No solar No=Zero
Zero emissions = Zero economy
Fortunately for coal and gas the surge in EVs has kept demand high enough to maintain production.
Hi JT, also note no-one bothered to refute it either. Everyone that promotes green growth wants to ignore the fact that it is all built with fossil fuels. No fossil fuels and no solar nor any other type of modern renewable as you know.
I asked the question before about the new Adaro aluminium smelters being proposed and built in Indonesia about whether they should use the coal to power the smelters, or destroy tens of thousands of hectares of rainforest to build huge solar farms. They could also destroy the ecosystems of a couple of rivers to build pumped hydro for when the sun isn’t shining.
Which is preferred is the question? and so far silence.. My choice is neither which means less aluminium for solar panel frames….
“No fossil fuels”
I keep pointing out that we have a mixed energy source system in just about all parts of the world, and will continue to indefinitely.
This is not an all-or-none question, and there is no all-or-none answer.
Hickory, I know what we have at present, but the ‘plan’ by those trying to be in charge is for ‘net zero’ by 2050, meaning nearly no fossil fuel use. Plus the minor inconvenience of resource depletion of oil in particular that effects all coal and gas sources of energy as they rely totally on oil, just like renewables.
My immediate question is about the Adaro aluminium smelters. Should they destroy tens of thousands of tropical rainforest and river systems to build a large solar farm and pumped hydro backup, or should they mine and burn the coal to produce this aluminium?? We will need more aluminium for the ‘solar’ buildout.
Don’t you see that increasing renewables to transition away for fossil fuels for whatever reason is highly destructive on the natural environment, with the Adaro aluminium smelters being the classic examples?
Renewables are just business as usual, building more ‘human’ environment to the detriment of the natural world. It’s more goods and services to keep the economy growing, no matter what the cost.
It all ends when the oil supply decreases at an accelerating rate year after year. We wont have the fuel for all the needed mining equipment, trucks, ships and tractors at a reducing rate creating problems for all other industries, governments and populations, as living standards crash, food becomes harder to obtain and populations rebel against deteriorating conditions looking for ‘someone’ to blame. Resource wars are guaranteed as that is human history, which will accelerate the decline of everything.
Meanwhile on top of all that we have rapidly changing climate and deteriorating natural world exacerbating all the energy problems. Business as usual, guarantees we get to the above reckoning, at some point in the future, with more ‘growth’ meaning we fall from a higher level and the natural world is worse off.
All the renewables hype is just that , hype. There is no evidence that any of it is close to sustainable as it’s all built with fossil fuels, with no attempt to build it from renewables, because the numbers do not add up!!
If the numbers went close to adding up, as in renewables really were cheaper sources of useful energy, then the market would quickly adopt it with zero incentives necessary, as it would be cheaper and more profitable for the capitalists of the world.
So I ask you again about the Adaro aluminium smelters, is it more coal burning, or rainforest destruction for solar and pumped hydro, as they are the 2 choices for building more solar panels out of the increased aluminium needed?
I don’t know the details of that project or the aluminum market.
Perhaps its time to slow down, and prepare ourselves for a smaller world.
One way or another, we will get there.
-btw, less than 25% of aluminum production in the world goes to the machinery/equipment/electricity sectors. There is plenty already available for important uses.
The Uyghur thing is a well known smear against the CPC.
https://redsails.org/the-xinjiang-atrocity-propaganda-blitz/
It also rings somewhat hollow when the West is literally propping up a genocide in Gaza right now that’s televised for all to see.
This is not to say China is “sustainable”, since that quote simply isn’t going to happen without mass reduction in resource use and/or population (latter is happening one way or another).
[…] Original Post […]
Dennis –
Is this a reasonable enough reference for you?
https://oversight.house.gov/release/covid-origins-hearing-wrap-up-facts-science-evidence-point-to-a-wuhan-lab-leak/
“ Scientists, including Dr. Fauci, then drafted a paper arguing COVID-19’s proximal origins to animals at a wet market.”
“ Rep. Lesko: “Do you believe we can have certainty that the virus did not come from the Wuhan lab and that U.S. funding was not used for coronavirus research?”
Dr. Redfield: “Absolutely we cannot do that. It’s now declassified now, but in September 2019, three things happened in that lab. One, they deleted the sequences. That is highly irregular—researchers don’t usually like to do that. Second, they commanded the command and control of the lab from civilian control to military control. Highly unusual. And the third thing they did, which I think is really telling, is they let a contractor re-do the ventilation system in that laboratory. There is strong evidence there was a significant event in that laboratory in September 2019.”
Kengeo,
No not a good reference at all.
Did you notice that every committee member that was quoted in that piece was a Republican?
That doesn’t make you a bit suspicious that a full picture of the hearing is not being presented?
Note that just because it cannot be unequivocally proven that the virus did not come from the Lab in Wuhan is far from proving unequivocally that it did in fact come from that lab.
When one asks a conspiracy theorist if their theory is a conspiracy theory, their answer will always be no, this is the truth.
A better reference
https://en.wikipedia.org/wiki/COVID-19_lab_leak_theory
Factsheet:https://2017-2021.state.gov/fact-sheet-activity-at-the-wuhan-institute-of-virology/
I disagree and think it’s foolish to write Wuhan COVID Lab origin off as a conspiracy theory, but clearly this is a controversial and geopolitically charged issue and possibly along partisan lines (although I’m not really convinced of that though).
While it may not be possible to prove one way or another, if you evaluate all of the facts independently it points to lab related release (intentionally or accidentally). I would say the Chinese conspiracy theory is less believable and also interesting they tried to shift the discussion from the Wuhan lab:
“The US doesn’t care about facts or truth at all, neither is it interested in a serious scientific study on the origins. Its only aim is to use the pandemic for stigmatization and political manipulation to shift the blame,” said Chinese Foreign Ministry spokesperson Zhao Lijian.
Zhao then referenced Fort Detrick, a US Army biomedical research laboratory in Maryland that has been linked – without evidence – to the emergence of the virus by Chinese officials and state media outlets.
“What secrets are hidden in the suspicion-shrouded Fort Detrick and the over 200 US bio-labs all over the world?” Zhao said, adding that the US “owes an explanation to the world.”
WHO essentially hammering the Fauci party line of “it just appeared out of nowhere”:
“In March, the WHO released a report of its investigation in China, concluding it was “extremely unlikely” that the coronavirus leaked from a lab. The report has drawn criticism from governments around the world over questions of transparency.”
Try this wikipage too: https://en.wikipedia.org/wiki/Wuhan_Institute_of_Virology
Points:
“In 2005, a group including researchers from the Wuhan Institute of Virology published research into the origin of the SARS coronavirus, finding that China’s horseshoe bats are natural reservoirs of SARS-like coronaviruses.[19] Continuing this work over a period of years, researchers from the institute sampled thousands of horseshoe bats in locations across China, isolating over 300 bat coronavirus sequences”
“In 2015, an international team including two scientists from the institute published successful research on whether a bat coronavirus could be made to infect a human cell line (HeLa). The team engineered a hybrid virus, combining a bat coronavirus with a SARS virus that had been adapted to grow in mice and mimic human disease. The hybrid virus was able to infect human cells.”
In December 2019, cases of pneumonia associated with an unknown coronavirus were reported to health authorities in Wuhan. The institute checked its coronavirus collection and found the new virus had 96% genetic similarity to RaTG13, a virus its researchers had discovered in horseshoe bats in southwest China.
My unprofessional assessment is only an idiot would say with any certainty that COVID did not originate from the Wuhan lab (when exactly is anyone’s guess)…
Kengeo,
Did you read the Wikipedia piece? From the wikipedia page you cite.
The scientific opinion that an accidental leak is possible, but unlikely, has remained steady.
Most of the information you posted from the other wikipedia page is in the page I cited originally.
When I evaluate the facts I think the experts have it right, most of them agree with Fauci and Collins on the likely origin of covid-19.
That fact sheet was released by the Trump White House, which makes me tend to discount it.
“My unprofessional assessment is only an idiot would say with any certainty that COVID did not originate from the Wuhan lab (when exactly is anyone’s guess)…”
https://www.bbc.com/news/world-us-canada-64806903
The FBI didn’t rule out the covid leak theory.
“FBI Director Christopher Wray has said that the bureau believes Covid-19 most likely originated in a Chinese government-controlled lab”
They have a BIO terrorsim division and muck around with DNA all the time. I guess all the professionals in there are lying with no whistle blowers.
And what the hell do you do in a virology lab but tinker with viruses?
We will probably never know, that is my thinking.
How did Charlie Munger put it?
“Show me the incentives, and I’ll show you the outcome.”
It’s in every virologist’s interest that the virus didn’t come from a virology lab, so of course the “It came from the wet market” became their greatest ‘friend’, despite a lack of evidence for that either.
Public reaction to a leak in a virology lab, with lots of the work there being funded by western countries, would see an outrage, to the point of wanting not only that lab, but every other lab that does similar work with viruses shut down and defunded. No virologist would want that, anywhere in the world, so of course the ‘leak’ didn’t come from the lab and no virus ever will (officially). Where’s the sarc emoji when needed….
There has been zero evidence from the international genetic labs that show any trace of genetic manipulation of the covid19 virus.
Zero.
Whether the virus
1-simply spread from the food market or
2-spread from the virus research lab by intent or by accident
is a whole different and unsolved question.
The genetic manipulation story is simply discredited conspiracy for the weak minded.
If Gerry harbored such unfounded ideas during his career as a cardiologist, and acted upon them, he would have lost his hospital privileges, lost his board certification, and lost his medical license.
Someone with a science background should know better.
Maybe find better sources of news.
Reality isn’t a trump rally where lies are uniformly celebrated.
All of those related comments are a complete distraction from my original statement, which was about the response to oil supply depletion.
Hickory,
I think in the past you have said this is either your area of expertise or closely related (immunology or virology, or something closely related). Am I remembering correctly?
Kengo perhaps needs to stop shitting in all over the oil comments and take it to the other side of the street; the non oil comments thread. Hick can’t even bring up China oil without the Covidiots trynna derail an intelligent conversation with regurgitated conspiracies from 3 years ago. Pathetic. Don’t feed feed the trolls.
Survivalist,
Sorry. I will stop.
Cheers Dennis, thanks a lot for writing the piece. I suppose YOU can talk about whatever the hell you like. I feel that all others should try and keep it as close as possible to a conversation about the world of energy, and the people that produce it and consume it.
All the best
Survivalist,
I should follow the rules like most everyone else, I will try to do better.
“He’s just Ken”
I do have a strong University background in science, including undergraduate and graduate degrees,
and understand enough to digest most of what I read about these subjects.
Perhaps more importantly, I seek reality with earnest whether or not the answers jive with my preconceptions or desired outcome.
So Dr. Hickory, I’m sure you recognize that it was a bit unusual for the novel virus to possess repetitive CGG codons at the furin cleavage site, which enabled it to uniquely attack the angiotensin converting enzyme 2 receptor in hypertensive victims. And that there was no evolutionary intermediary leading up to this unusual occurrence. That would be a first.
The two leading viral geneticists in the world–David Baltimore (old) who won a Nobel Prize for reverse transcriptase and Kristian Andersen (young) at Scripps–both noticed it the minute the sequence was published (just about everyone did who follows this sort of thing). Dr. Baltimore pointed to the unusual sequence at the furin cleavage site and said, “There’s the smoking gun,” and Dr. Andersen felt so moved that he immediately sent an email to Dr. Fauci that this showed a rather strong possibility of being manipulated in some lab.
It is of great amusement that both men–stalwarts in their field–decided at a singular moment that they had made a dreadful mistake. But a guy with the incredible insight that the Chinese burned more and more coal in an effort to transition away from oil and gas would probably have a significant intellectual edge on everyone else who looked at this. Congratulations on your fine deductive reasoning!
And this is pertaining very strongly to the oil and gas market, as well as one of the most amazing implications of peak oil, so don’t lecture me about moving it to the other place. Thank you for allowing me to express myself here. I will be going for good this time. There are an awful lot of good thinkers here, and a lot of people who just want to preen and posture. It’s not for me.
Gerry,
I know quite a few doctors, they are very smart people. The very smart doctors know their limitations.
Yes, they do, and I know mine.
But it just so happens that I did single strand RNA viral research for close to three years before going to medical school. The coronavirus is a single stranded RNA virus. While that I was a long time ago, I stayed up a bit.
The furin cleavage site on this novel virus was a dandy, I’m here to tell you. And you, my friend, seem to have a pithy comment to make to anyone who doesn’t fit your contour of the imagined world. Still, thanks again, and good luck.
Thanks Gerry,
You certainly know more than me, I imagine there are others who know more, it is certainly not me. Many epidemiologists and virologists seem to have a different take than you. Your seeming certainty that the lab leak hypothesis is correct seems unfounded based on what I have read. Good luck to you as well.
Gerry, I would like say that I am sorry to see you leave AOB but I have not looked at this stupid, far left, anti-fossil fuel dung heap in two weeks and I won’t miss you much because two weeks has not been near long enough.
Imagine a public forum titled “peak oil,” that is so chock full of declared, intellectually superior “scientists,” economists, psychist’s and self-absorbed experts, NONE of which have the courage to stand by their opinions using their own name, ostricize somebody’s opinions because he or she is a… Republican. You steered too far to starboard, mate; now you are being systematically run off like so many others. This is the curent state of American, man.
All this over China? And who brung us COVID? Fuck me.
Its a one man show around here and Coyne IS the show. The content of this forum is completely under his control. Now its up to Shallow Sand, from Illinois (the most populated outpost on the planet for liberalism), the only oily guy left to try to teach these EV wackos about oil depletion.
Move on, Gerry and be happy. A few more months and bugs will be hatching on clear rivers. There’s in nothing more to be seen here.
Gerry +1
This is supposed to be an oil and gas thread, but I feel obliged to state that the so called “twitter files” (see https://www.racket.news/p/capsule-summaries-of-all-twitter and https://wikispooks.com/wiki/The_Twitter_Files) document an unprecedented attempt to manipulate public opinion using big tech. One of the most spectacular areas of manipulation was Covid 19. This has been dubbed: “The Censorship Industrial Complex” (see https://censorshipindustrialcomplex.org/?utm_source=substack&utm_medium=email). I do not trust wikipedia for any politically sensitive information. I always compare it to wikispooks.
Biden administration introduces major EV rule with relaxed timeline
This new rule slows the transition to BEVs and PHEVs in the US. Now the car companies have to convince the average Joe to buy an EV.
In the wake of the criticism, the administration made some changes to the rule, which covers vehicle model years 2027 through 2032 — slowing down the transition to EVs with less stringent requirements for some of the rule’s the earlier years.
For model year 2029 under the proposed rule, for example, 55 percent of vehicles were expected to be electric, and 45 percent were expected to be gas-powered, while the new rule has gas-powered cars making up 49 percent of sales that year.
https://thehill.com/newsletters/energy-environment/4545523-biden-administration-introduces-major-ev-rule-with-relaxed-timeline/
Ovi, overall this is a good change, allowing for more flexibility which will include PHEVs and efficiency gains in ICE vehicles. Battery tech and oil prices will likely be a bigger determinant of the speed of the EV transition than government policy. Once cost parity is reached 2026-28 there will a tipping point.
EVs are in a strange spot at the moment. There are only a handful of models available that qualify for the tax credit. Also most models don’t have the new standard plug, which is Tesla’s NACS plug. So, besides Tesla, right now that means you would be paying much more for an “outdated” model that has the wrong plug. Not many people are willing to pay a premium for something that is outdated especially at $40-50K.
Also the cheaper models like the Bolt and the Leaf have been discontinued. So essentially the only EV available for purchase right now is the model Y. I know because my Leaf got totaled and I had to go car shopping, limiting myself to EVs. Starting in fall this year the 2025 models will be coming out from most brands with the NACS plug and hopefully more will qualify for the tax credit. Because at $7500 you literally can’t pass it up.
Stephen
I agree this will allow the manufacturers to make lower cost models and improve market penetration. At the same time the battery suppliers continue to do research to make them more efficiently and work on new chemistries.
I wonder how this will affect Tesla. I wonder if the penetration and growth of Tesla in the US is peaking. Also I have been reading where insurance on Tesla’s is skyrocketing. Apparently if a collision damages the battery pack, the car is scrapped.
Yes teslas moment has passed. The effort spent on the Cybertruck was a colossal error. If this had been spent on a smaller affordable vehicle and possibly a more standard smaller pickup truck, sales would be in the millions every quarter. Elon also alienated almost his entire customer base when he switched from a narrative of saving the world from climate change through cool fast cars to his new anti woke nonsense. Another colossal failure was attempting self-driving with limited hardware. One of these errors would have been survivable but all three it’s a sinking ship. Regardless, they did pry open the electric vehicle market and it’s unstoppable at this point in time. That may not seem obvious in North America but everywhere else with cheap Chinese EVs flooding in it is.
Adapter plug (CCS->NACS) costs $150 or is free in many cases…what does that have to do with anything?
Simply this – people are making one of the largest purchases of their lives believing it is the latest technology. They do not want to pay top dollar for an obsolete product. So they wait for the next model year when they can be sure the issue is resolved.
Also the CCS plug (and cable) is “massive” compared to the NACS plug. Wielding the CCS plug and cable in winter is more difficult. The NACS system uses less resources (copper).
PeterEV,
In the case of vehicles with CCS plugs using NACS such as Tesla Superchargers, the only difference is the adapter, which is pretty unweildy, but the cable is the usual Supercharger cable plugged into the adapter which is attached to the CCS outlet on the car. For those who have already purchased a vehicle with the CCS socket, the Superchargers and their high reliability and widespread availability will be a big bonus.
A thought provoking post here (will keep it oil related!):
In a nutshell, conventional oil may decline much much faster then people think…an exponential decline as follows:
2024 – 5%
2025 – 6.4%
2026 – 8.9%
2027 – 13.5%
2028 – 22.0%
2029 – 38.0%
2030 – 153%
I believe the argument is related to EROEI…
It doesn’t seem unreasonable to me, but then again that’s what I thought about the Wuhan Lab origin theory so who knows!
-I’m just Ken
[https://skogslars.blogg.se/2024/march/modelling-the-accelerated-decline-of-global-conventional-crude-oil-minus-condensate-production-with-data-from-steve-st-angelo-2.html](https://skogslars.blogg.se/2024/march/modelling-the-accelerated-decline-of-global-conventional-crude-oil-minus-condensate-production-with-data-from-steve-st-angelo-2.html)
Continuing that note of back to posting oil related here…
I got my first Eagleford refrac… or possibly the beneficiary of multiple offset fracs…
I’m under an Eagleford Unit in north Live Oak County…. The Unit has a 2013 vintage Conoco Eagleford short lateral well on it that IP’d at 560 BOPD and 1,800 MCFGPD, that well has made 385,000 BO/liquids and 1.8 BCF. The well produced about 20 BOPD and 150 MCFGPD over the last couple of years at the clear end of its terminal decline.
Conoco then comes along last fall and drills and completes to sales 8 Eagleford offsets that each make an average of 900 BOPD and 3,500 MCFGPD… now that old and almost dead 2013 original Eagleford well has averaged 550 BOPD and 1,600 MCFGPD the last couple of months. Back to the original IP… will be interesting to compare the decline curves over time.
Just a small data point, but what happens if refracs or other secondary stimulation works on a wide scale?
Gungagalonga,
Then more oil gets extracted. Doubtful that it does more than extend the current plateau in Eagle Ford Output. Likewise we could see a plateau extended in Permian, Bakken, and Niobrara, if your optimism proves correct. I would be surprised if we see an increase in US tight oil output of more than 500 kb/d from current level, I expect the peak for US Tight oil output will fall between December 2023 and December 2028.
Dennis, this is a real world and real time example vs. hypothetical. A 10-year-old EFS well was stimulated to return to at or above its original IP.
Recompletions like this are often done stealth without leading indicators like permits, so they’re hard to track broadly. If only 50% of the legacy shale wells out there are hit with secondary stimulation, it could blow your models up. If the secondary trend broadens and accelerates it certainly puts a floor under production and perhaps even extends shale production growth out beyond your model predictions. Oil price cooperation being a certainty, of course!
Gungagalonga,
So far the models hold up pretty well, if this anecdotal example were widespread we would see a mismatch between model and data, so far not so much. Perhaps that will change, I remain a skeptic. I appreciate the data point and it may be that my models will need to be revised. I adjust my thinking based on the data I see.
Dennis, I agree that new production from these secondary shale recompletions are not at a point to provide much of an impact. It’s more of a thing to watch and maybe incorporate into modeling as the scale potentially increases. I was just amazed at the response that 10-year-old EFS well had to offset fracing. I will continue to observe.
Thanks for your efforts, your Permian model correlates very well! Congrats.
Gungalonga,
I appreciate the information and will watch the data to see if this becomes important over time. It is surprising that the impact is as large as you have observed. My guess is that these sorts of increases are hidden in the data as they are not recognized as new completions, but we see the impact in the overall production data and results in a slightly higher productivity for the average well for any given year. The data gets revised monthly, though I only see it in the occasional updates at Novilabs in the various basins (though to be honest I focus more on the Permian than the Eagle Ford, Bakken or Niobrara basins.)
Here are 3 scenarios I did in Dec 2018 based on USGS low medium and high TRR scenarios (F95, mean and F5 TRR estimates) assuming AEO reference case for oil prices and using DCF analysis based on costs at that time (annual discount rate assumed at 10%) to estimate ERR. So far the output is between the F95 and mean ERR scenarios, very doubtful we reach the high ERR scenario (98 Gb) or even the mean ERR scenario of 60 Gb seems a stretch. We might see 50 Gb if oil and natural gas prices rise.
An updated model for Permian below based on updated well profiles and more recent completion data. The correlation coefficient from Jan 2010 to Dec 2023 is 0.9986.
I am always a bit amazed that such a simple model actually works pretty well.
Ken,
EROEI has to be considered for all forms of energy that society uses, not only for a single product such as oil. Those proposed decline rates are absurd. Here is a chart of the Absurd (or Very Unlikely) Model for Conventional Oil. The odds that this scenario is correct is zero.
Note that the Conventional URR for this model is 1558 Gb.
This is about 1440 Gb less than the USGS World Assessment from 2000 (where the mean estimate was 3000 Gb for conventional (or non-continuous) URR.) It is also about 940 Gb less than Jean Laherrere’s recent estimate for conventional oil URR (about 2500 Gb).
My expectation is that conventional oil will decline at less than 1% per year (as resources are continually developed) through 2035 and decline will be under 1.4% through 2040 and then will increase to around 4% per year as demand falls below supply and resources are developed more slowly due to lack of profits for more difficult to extract resources (higher costs). URR for my model is about 2500 Gb for conventional C plus C, with about 160 Gb of unconventional URR.
Chart of one possible scenario (this may be on the low side,) 70% probability IMO that World C plus C output may be higher from 2024 to 2031 than presented here.
Agree on not being very likely, but certainly there are scenarios where it could happen…
So far we are bouncing around and moving sideways with a downward angle:
Pre-Covid High 83.2 Mb/d centered December 2019
Covid Production 70-80 Mb/d centered July 2021
Post Covid Production 82.2 Mb/d centered December 2022
Current Production 81.4 Mb/d centered July 2023
Kengeo,
Can you provide such a scenario? WW3, asteroid strike, let us know what your thoughts are? A scenario matching the output you suggest is pretty far fetched. What is your assessment of the odds of such a scenario, my guess 1 in one billion.
The 12 month high was about 83 Mb/d in 2018, recently the 12 month average was about 81.8 Mb/d, so 5 years and straight line decline has an average rate of 0.29% per year from 2018 to 2023. This is the historical fact of the matter. The downward angle you see is not very steep, also note that the recent trend from 2020 to 2023 is a fairly steep increasing slope, which you ignore. I expect the increases in the future few years will be less steep, but decline begins after 2025.
Oil production worldwide is very dispersed among myriad countries and resource types. This will provide for a very stable supply. Declines of more than one or two percent annually seem very unlikely. An exponential decline doesn’t make sense.
Oil isn’t shipped around the world?
Oil isn’t traded in some type of currency?
Oil doesn’t need well-paid/well-fed humans to run rigs, transportation, materials, and many other aspects?
Oil production could miraculously survive WW3/nuclear fallout?
Between Iran, Russia, China and a myriad of other unstable countries there’s 0% chance of a large conflict breaking out?
Covid was simply the first stair step down, there are likely to be many similar events to come that will take a bite out of global supplies.
Food insecurity is the next big phase which is already underway…
Time to revise that model Dennis…
Ken,
I use all the data, not just a few points that fit a narrative. I think fitting a quadratic equation to the data is a very poor approach, but if one follows that approach using all data from 1973 to 2022, the chart below is what you would get. This is no better than your chart, it is a silly approach to the problem.
We could also use monthly data from Jan 1982 to Nov 2023 and fit a 2nd degree polynomial, also not likely to tell us much though.
Dennis Coyne:
Absurd? You forget the ongoing collapse of industrial civilization and what it does for the oil industry. You forget the exponentially declining EROEI (i.e. a decline at an accelerated rate). You forget the exponential nature of Global Heating, and all its self-reinforcing feedback loops. You forget the coming resource wars and WW3. You forget that the decline of oil is a self-reinforcing feedback loop. You forget almost everything in the real world, and just stare on data and models. This is not wise. It blinds you. You should account for the real world. And the real world is in fact collapsing. We could all be dead by 2030-2036, because the very soon approaching BOE (Blue Ocean Event in the Arctic Sea) and the release of the ticking methane time bomb (from the permafrost on the bottom of the Arctic Sea). This is a real, very real possibility, and my model reflects this, which almost no other Peak Oil model does. I’m somewhat like a Guy McPherson or a Sam Carana in the Peak Oil debate. These very learned climate scientists always say that the end of humanity could be just a few years away, because of the methane time bomb.
The exponential function is one of the most difficult things to believe in. It’s almost always ignored and almost never understood. It always catches us with BIG surprise. My calculations in the following blogpost just follows the trendline hitherto, nothing more, and the trendline is that the decline rate of conventional crude oil minus condensate has doubled 8,7 times every 8 year:
https://skogslars.blogg.se/2024/march/modelling-the-accelerated-decline-of-global-conventional-crude-oil-minus-condensate-production-with-data-from-steve-st-angelo-2.html
Lars,
Over time we will see whether your scenario or mine is closer to being correct, in my view the future cannot be known, I just think the odds of something close to my scenario ( plus or minus 20%) are far higher than your scenario, but any guess about the future is speculation.
Lars,
You take many low probability scenarios and add then together. Some basic statistics for you.
Lets say we have 4 scenarios with a probability of 5% for each one. Put them all together and we have 0.05^4=6.26E-6 for the probability that all 4 of the low probability scenarios occur.
Conventional C plus C peaked in 2016 at 73.6 Mb/d and then fell to 65.5 Mb/d in 2020 due to the pandemic and has recovered to 69 Mb/d by 2022 and is likely to reach 69.8 Mb/d by 2027. Unconventional output may peak in 2024 at about 12.9 Mb/d and may decline to about 12.3 Mb/d by 2028, World output of C plus C may be on a rough plateau of about 82.4 Mb/d from 2024 to 2027.
Also note that analyses that claim the EROEI of oil being low won’t allow oil to be profitable don’t take account of the fact that EROEI is only important society wide for all forms of energy. Within the oil industry nobody knows the EROEI of their oil or cares, what matters is the price at which the oil, NGL and natural gas is sold and the cost to produce the energy, the difference is profit and is the aim of an oil company (any company in fact).
Claims that low EROEI will stop oil production are incorrect.
What happened in 2020? Anything unusual? Do you expect 100 year events to happen every year for the next 5 years?
Assuming the decline that occurred from 2016 to 2022 to repeat or become worse, has a probability of very close to zero over the 2024 to 2030 period, maybe in the 2035 to 2045 period this is a possibility, even then I am not that optimistic. I doubt we reach under 10 million barrels per day of oil output before 2060.
Lars,
So you really believe that World conventional C plus C URR will be about 1560 Gb? That is what your scenario implies, do you stand by that estimate? World Conventional cumulative production through Dec 2022 was about 1420 Gb, so your scenario implies only another 140 Gb of conventional C plus C will be extracted after 2022. Seems you may need to rethink, Jean Laherrere is typically pretty conservative, his estimate is around 2500 Gb for conventional C plus C URR.
Lars,
On Methane see renowned climate scientist David Archer in following piece at Real Climate.
https://www.realclimate.org/index.php/archives/2012/01/much-ado-about-methane/
On your claim that China and India will see large growth in their consumption of oil in the future look at recent trends of real GDP in 2017 international $ (using PPP method from World Bank) for China plus India and compare with the growth in consumption of oil in MBOE using tonnes from Statistical Review of World Energy and converting at 7.33 barrels per tonne.
We find the long term average annual rate of growth from 1990 to 2019 was 8.1% for real GDP and was 5.9% for oil consumption in China plus India. For 2013 to 2017 the average annual rate of growth was 6.99% for real GDP and 5.37% for oil consumption, from 2018 to 2022 the average annual rate of growth of real GDP was 4.3% and for oil consumption was 0.78%. We would expect the growth rate would have fallen due to the pandemic in 2020, what is unexpected is the large (over a factor of 4) change in the ratio of growth in GDP to growth in oil consumption between these two periods. In the 2013 to 2017 period the ratio was 1.3 (just slightly less than the long term average) and in the 2018 to 2022 period the ratio was 5.5.
In the past you have made the assumption that such changes would continue so that we would see an acceleration of such trends. So in this case the ratio of GDP growth to oil consumption growth increased by a factor of 4.24 over 5 year periods so you might assume another factor of 4.24 in the next 5 year period etc. This would imply very low growth rates of oil consumption in the future for China and India. (0.002% per year in next 5 years and 0.0004% in the following 5 years.) This makes some of of the assumptions about Available Net Exports in Jeffrey Brown’s Export Land Model Scenarios seem incorrect, it may be in need of an update to reflect World data.
Also note that a focus on conventional oil only is a mistake, better to focus on World C plus C output.
Sometimes people ask about World Net Exports of C plus C, chart below uses EIA data to find World net exports of crude plus condensate, data only available through 2018.
The totals are from only nations that have positive net exports of C plus C and is Exports minus imports for each of those nations with positive net exports of C plus C.
Note that over the 1980 to 2018 period there is on average 980 kb/d more C plus C imported than exported based on EIA data each year. I don’t know how to resolve this data discrepency, but it is possible that net exports are about 980 kb/d higher on average than in my chart, which I now realize was labelled incorrectly, it should be kb/d not Mb/d.
Dennis I hope you understand how useless this graph is for attempting to find the real situation..
“The totals are from only nations that have positive net exports of C plus C and is Exports minus imports for each of those nations with positive net exports of C plus C.”
Of far more meaning would be a graph of all net exporters in 1980, including newer exporters that may have been added, and kept the same group of countries..
Your graph, as it is, suffers from “survivorship bias”.
Adding back all the former exporters, that are now importers while continuing to show their net imports would be a totally different graph, but more realistic of the actual situation of the world.
I have read Lars Larsen’s recent work, just on crude exports, love to see that graph and forward projections displayed here (please Lars)..
Hideaway,
Net exports is the metric that was used by Jeff brown, simply following that.
Post the charts you like.
Find the data here
https://www.eia.gov/international/data/world
Or find the data you prefer.
If net exports is what matters, that is what is shown, current net exports in the World.
Perhaps you could provide your definition of net exports?
Or present a useful chart?
Hideaway,
Think this may be what you are looking for, but not my understanding of what net exports means.
Perhaps from the perspective of the export land model this is roughly correct. I take the net exporters in 1996 (about a decade before the export land model was first presented), there were 44 nations that were net exporters at that time, we could call this export land. I keep those 44 nations in the data set throughout (for some of the 44 nations they change to net importers but those negative numbers are added to the total) and then we add other nations (outside of the group of 44) that have positive net exports of C plus C for all other years.
Dennis:
I have made a thorough research on the internet on the same subject, and my results differs greatly from yours (I have checked every country if it is a net oil exporter):
https://skogslars.blogg.se/2024/march/countries-that-during-the-last-twenty-years-has-become-net-oil-importers-from-being-net-oil-exporters.html
Lars,
Not all that different from what I have for the EIA chart. Seems quite unlikely that oil output decreases as fast as you speculate. I found this post by Euan Mearns with a comment by Jeffrey Brown where he said he followed the top net exporters in 2005.
https://euanmearns.com/peak-oil-exports/
The chart below has the top 49 net C plus C exporters in 2005, I don’t add any “new” net exporters after that date the group is the same 49 nations over the entire period (FSU is included before 1992). I believe the prediction in 2007 at the Oil Drum was for a sharp drop in net oil exports from 2007 to 2016.
So far I am not seeing it at the World level.
Note that in 2018 there were 68 nations that were net importers of C plus C and 46 nations that were net exporters of C plus C based on EIA data.
Dennis:
I write in my blogpost linked to above: “we have only 35 oil exporting countries in the world right now. ” You said we have 49. It’s not the same as 35. The amount of oil exporting countries has decreased by about one every year for a long time now. So 2018 we had perhaps about 41.
In 2018 we had at least 155 oil importing nations (this was the number for 2005 according to Jeffrey J. Brown), probably closer to 160, now we have about 160. A far cry from your 68 nations.
Lars,
Just using the data for crude plus condensate, there are many nations that do not import or export crude oil, they likely import refined oil as gasoline, diesel, jet fuel etc. The EIA does not have up to date data on total liquids consumption in their international database. In any case the number of nations is less important than the total volumes in my view. I focus less on the number of nations that import and export crude and products and the crude is the key IMHO as there are no refined products without a crude oil input to the refinery.
Also note the there were 49 nations that were net exporters of crude plus condensate in 2005 (this accounted for 100% of C plus C net exports in 2005 according to EIA data). In 2018 there were 46 nations that were net exporters (11 of the 49 in 2005 became net importers and 8 nations became net exporters over the intervening 13 years).
Nations that import crude and or products in 2018 were about 173 (includes all nations with crude net imports of zero or more in 2018). This is a net increase of 3 nations over a 13 year period.
Lars,
When we look at total liquids production (by volume, which is a poor measure as different liquids have different energy densities) and subtract total liquids consumption (using EIA data) the peak was in 2005. The OLS trend from 2005 to 2022 for an exponential function is an annual rate of decline of 0.64% per year for net exports of petroleum and other liquids from 2005 to 2022. Much of this was due to high US net imports around 2002-2008, without the US the World saw increasing net exports. In 2005 the US had net imports of 12500 kb/d and in 2022 it had net exports of 290 kb/d, so a net change of roughly 12800 kb/d less net imports by the US in 2022 vs 2005.
Thanks Dennis, I did start to work on this myself from your EIA link, but ran into a stumbling block with the Australian numbers. You seem to have understood what I was looking for by including all the exporters from the past, that have now become importers, rather than just current exporters.
For crude and condensate exports and imports, the data misses ‘products’. Over the last couple of decades Australia has closed down most refineries and imports mostly products instead of crude and condensate, so the numbers end up being not realistic, unless we then add all the products imports and exports for all those countries which is not in that set of data. I assume the same would have happened a lot elsewhere as well..
One aspect I’ve noticed is how exporting countries, with Norway being the best example, have come to realise that C&C exports are their bread and butter, so have really tried to reduce internal consumption of C&C to maximise exports, often of products as well as C&C. Things like subsidising EVs, reducing subsidies on petrol and diesel internally, building/importing fleets of LPG/LNG/hydrogen busses etc.
Hideaway,
You’re welcome.
Note that the chart in the comment linked below
https://peakoilbarrel.com/opec-update-march-2024/#comment-772403
uses liquids consumption minus liquids production to evaluate net exports, this would include both products and crude. The problem is that the EIA data is only in barrels and the BP data (in tonnes) is difficult to evaluate for net exports because of the way they group nations differently for production and consumption, so for BP data we cannot get a complete list due to these varying “other nations” groupings in Africa, South America, Europe and Asia.
Data for EIA at
https://www.eia.gov/international/data/world/petroleum-and-other-liquids/annual-refined-petroleum-products-consumption?pd=5&p=0000001&u=0&f=A&v=mapbubble&a=-&i=none&vo=value&&t=C&g=none&l=249–249&s=94694400000&e=1672531200000
and
https://www.eia.gov/international/data/world/petroleum-and-other-liquids/annual-petroleum-and-other-liquids-production?pd=5&p=0000000000000000000000000000000000g&u=0&f=A&v=mapbubble&a=-&i=none&vo=value&&t=C&g=none&l=249–249&s=94694400000&e=1672531200000
Note that the huge change in US net imports ( a decrease of nearly 13000 kb/d from 2005 to 2022) is the main reason for the decrease since 2005 for the World net exports of liquids.
Question for the experts, does anyone know if the CTL (coal to liquids) that has started to happen in China with the help of SASOL from South Africa, is counted in China’s oil production numbers??
yes, there are several large coal to liquid plants with total plate capacity of 9million tons of liquid (mainly diesel) per year. But need over ~$80 oil price to make profit.
These does not include liquid like 70million tons of methanol or recent ~1million ton per year ethanol also from coal.
Hi Sheng Wu,
Thanks, I know there are several CTL plants in China, my question relates to whether this production is included in China’s oil production numbers, and/or ‘all liquids numbers’?
no, the crude oil production is count from the major 3, and the liquid produced from refinery is a different account.
Hideaway,
The input is coal so not on the crude oil balance. The output, mainly middle distillates, is on the refined output balance. There are two processes, diect hydrogenation (Bergius Process) and indirect ( FT). The EROEI is terrible. Roughly 5 tonnes of coal for one tonne of products.
FT was proposed for US shale gas. No project got off the ground due to high cost ( Shell and Sasol). I worked on a MTO project( similar process as FT) and much higher value products. A financial disaster. It woud never have paid out and it is no surprise we were not the only ones who bailed out at the concept stage.
Methanol is shown as “other” by EIA, don’t know the feedstock though.
Also see https://www.sciencedirect.com/science/article/abs/pii/S0098135415000782#:~:text=The%20present%20feedstock%20of%20methanol,coal%20based%20methanol%20in%202011.
Worth a read
https://oilprice.com/Energy/Crude-Oil/Is-US-Shale-Production-Finally-Nearing-Its-Peak.html
The shale oil industry seems to believe its own hype of stable supply for decades. Doesn’t jibe with the resource being at halfway point as discussed in the article.
Big Tech’s Latest Obsession Is Finding Enough Energy
Tech companies roamed the hotel’s halls in search of utility executives and other power providers. More than 20 executives from Amazon and Microsoft spoke on panels. The inescapable topic—and the cause of equal parts anxiety and excitement—was AI’s insatiable appetite for electricity.
It isn’t clear just how much electricity will be required to power an exponential increase in data centers worldwide. But most everyone agreed the data centers needed to advance AI will require so much power they could strain the power grid and stymie the transition to cleaner energy sources.
https://finance.yahoo.com/news/big-tech-latest-obsession-finding-110000070.html
A November update on World Oil Production has been posted.
https://peakoilbarrel.com/november-world-non-opec-oil-production/
A new Open Tread Non-Petroleum has been posted
https://peakoilbarrel.com/open-thread-non-petroleum-march-25-2024/