By Ovi
All of the Crude plus Condensate (C + C) production data for the US state charts comes from the EIAʼs Petroleum Supply monthly PSM which provides updated information up to August 2023.
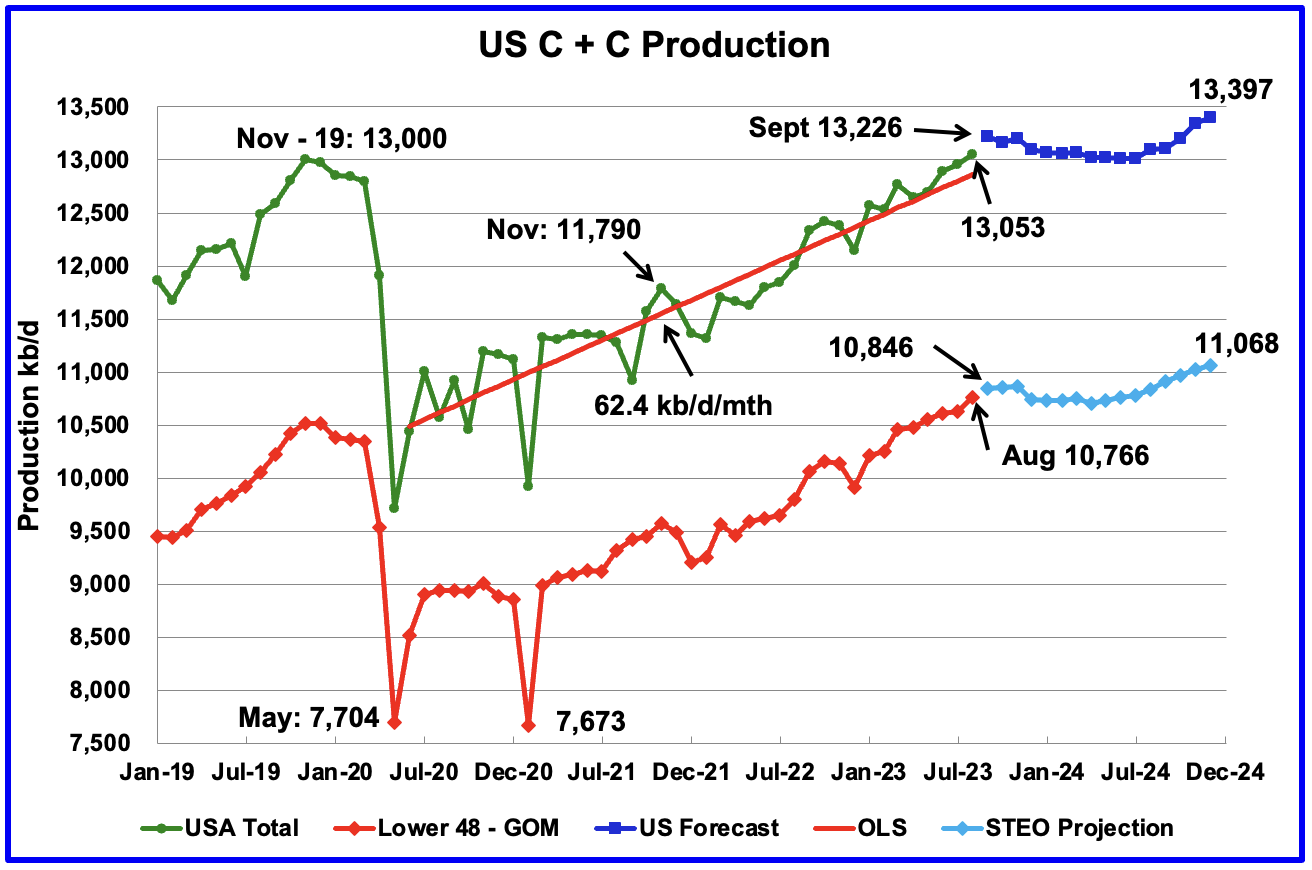
U.S. August oil production increased by 94 kb/d to 13,053kb/d, a new record high by 53 kb/d over November 2019. The increase was primarily due to increases in Texas, New Mexico and North Dakota. Note that July production was revised down from 12,991 kb/d to 12,959 kb/d, which accounts for 32 kb/d of the 94 kb/d August increase.
The dark blue graph, taken from the October 2023 STEO, is the forecast for U.S. oil production from September 2023 to December 2024. Output for December 2024 is expected to be 13,397 kb/d which is 60 kb/d lower than forecast last month.
The red OLS line from June 2020 to August 2023 indicates a monthly production growth rate of 62.4 kb/d/mth or 749 kb/d/yr. Clearly the growth rate going forward into the rest of 2023 and 2024, shown by the dark blue graph, is lower than seen in the previous July 2020 to June 2023 time period. From September 2023 to December 2024, production is expected to grow by 171 kb/d. Production is expected to fall from September 2023 to July 2024 before beginning to rise.
While overall US oil production increased by 94 kb/d, the Onshore L48 had a production increase of 137 kb/d to 10,766 kb/d in August.
The light blue graph is the STEO projection for output to December 2024 for the Onshore L48. From September 2023, to December 2024, production is expected to increase by 222 kb/d to 11,068 kb/d.
Oil Production Ranked by State
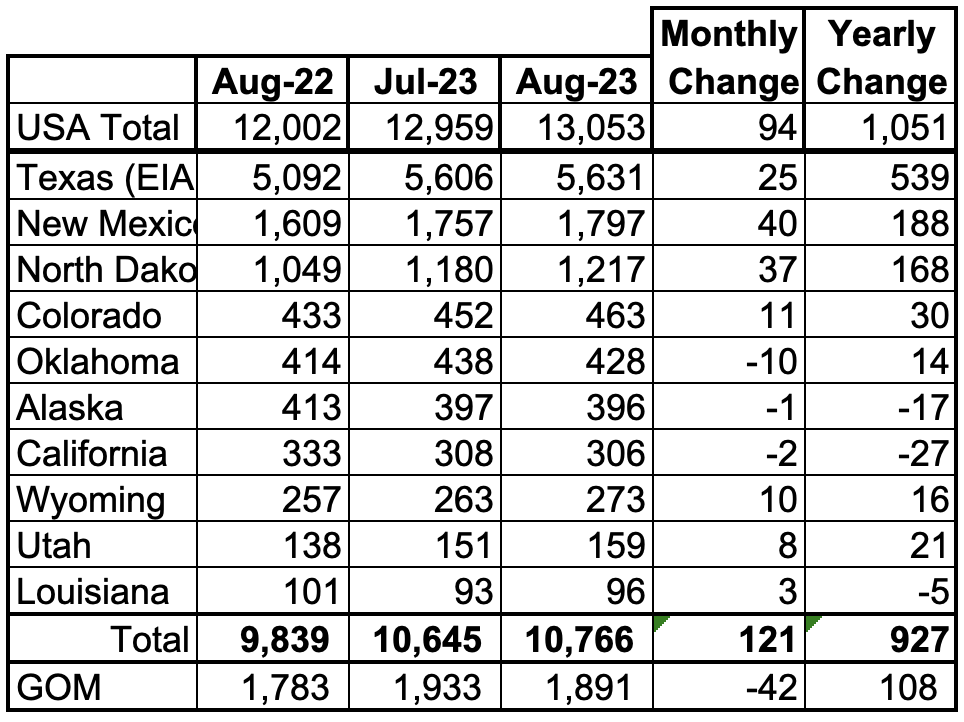
Listed above are the 10 states with the largest US oil production along with the Gulf of Mexico. These 10 states accounted for 82.5% of all U.S. oil production out of a total production of 13,053 kb/d in August 2023.
Here is an overview of the where oil production growth is occurring in the onshore L48 which had an overall increase of 137 kb/d, Big Two 65 kb/d, North Dakota 37 kb/d and the Rest 35 kb/d. Oklahoma was the state with the largest production drop in August.
On a YoY basis, US production increased by 1,051 kb/d with the majority, 895 kb/d coming from Texas, New Mexico and North Dakota. GOM was down 42 kb/d MoM but up 108 kb/d YoY.
State Oil Production Charts
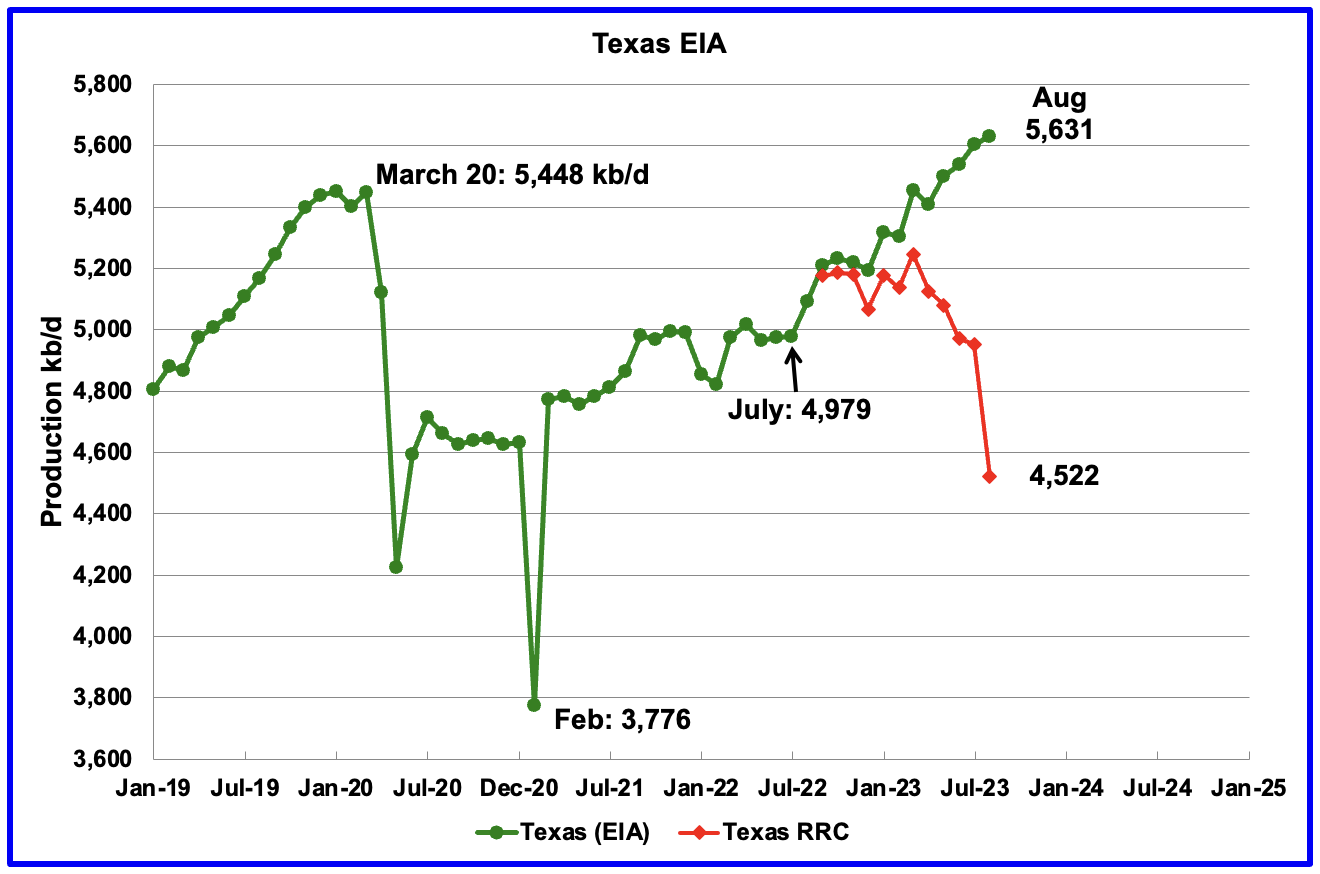
Texas production increased by 25 kb/d in August to 5,631 kb/d. However, relative to July production reported last month, 5,628 kb/d, August output is only up 3 kb/d. In the EIA’s August report, June was revised down by 18 kb/d and July was revised down by 22 kb/d, from 5,628 kb/d to 5,606 kb/d.
The Texas RRC August production report has been added to this chart to compare it with the EIA data. While the first three red markers, September, October and November 2022 are reasonably close to the EIA’s production, the August 2023 gap of 1,109 kb/d is big and appears to be typical. Revisions to the Texas first month production will continue for about 18 months.
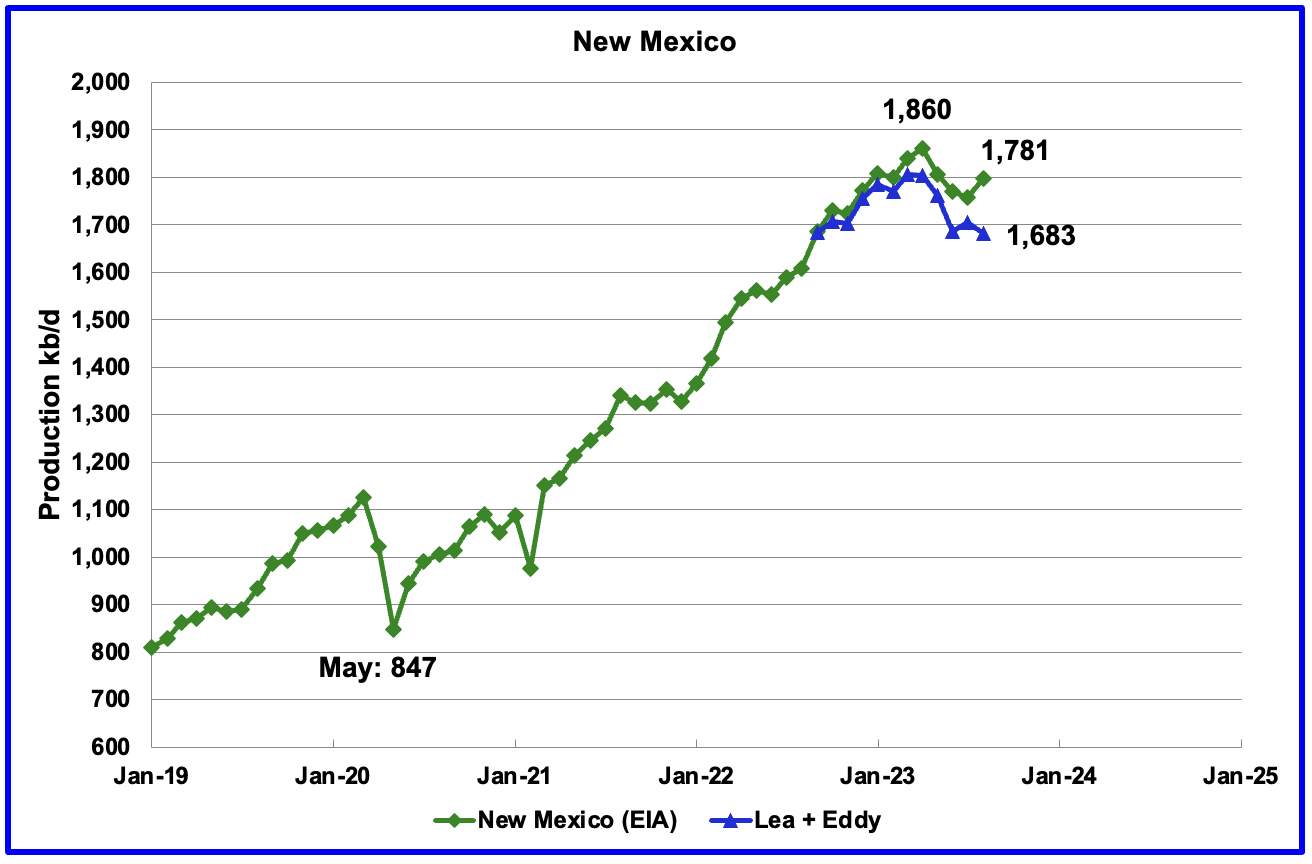
New Mexico’s August production rose by 40 kb/d to 1,781 kb/d. Lea + Eddy counties dropped by 23 kb/d. Interesting that the L + E trends have been in the opposite direction to those from the EIA for the last two months. Prior to that the trends were the same.
Of the EIA’s 1,781 kb/d output from New Mexico, 1,683 kb/d (95%) came from the Lea and Eddy counties. The Lea and Eddy county production data for August is not complete and will be updated over the next three months. The first blue marker is September’s total production from NM’s Lea and Eddy counties. Their combined output was 1,683 kb/d compared with 1,686 kb/d reported by the EIA for all of New Mexico, a difference 3 kb/d.
More production information from these two counties is reviewed in the special Permian section further down.
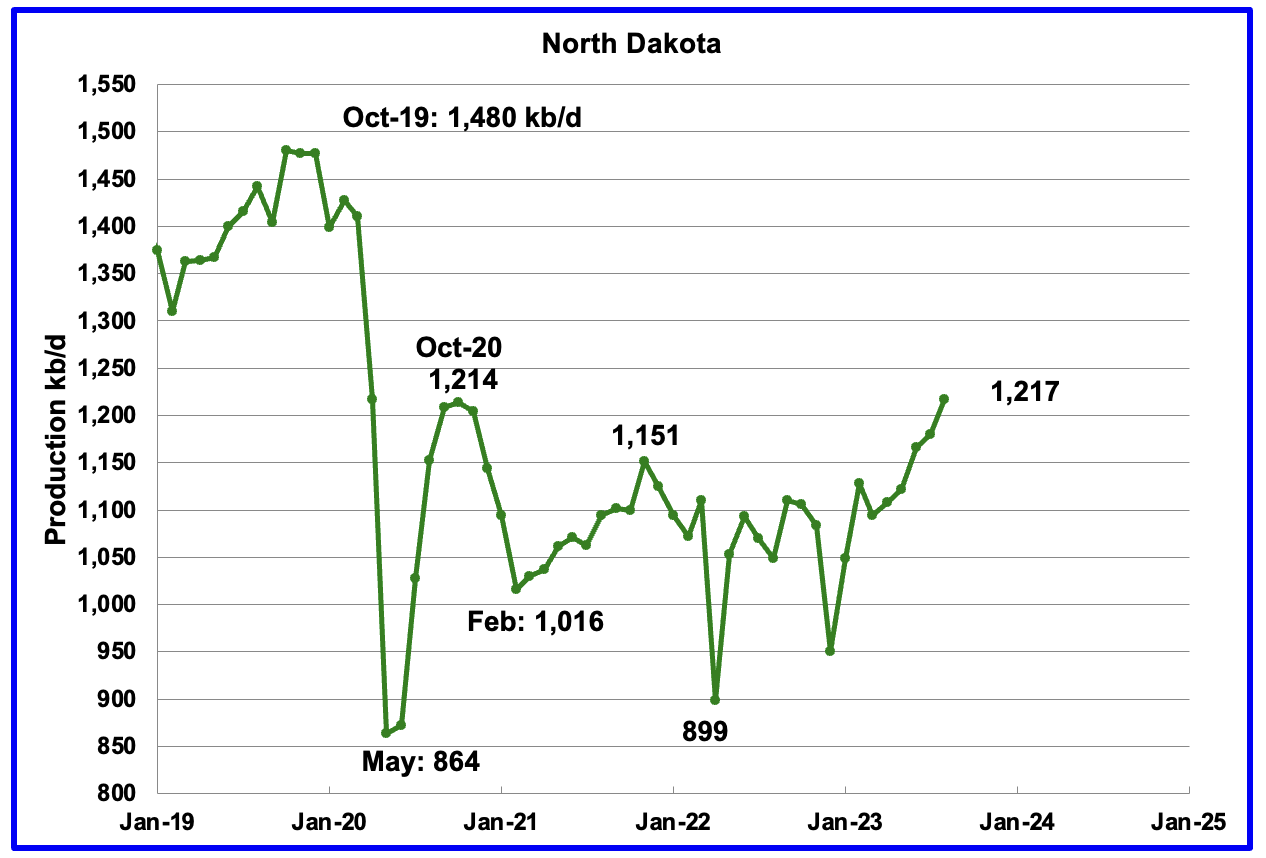
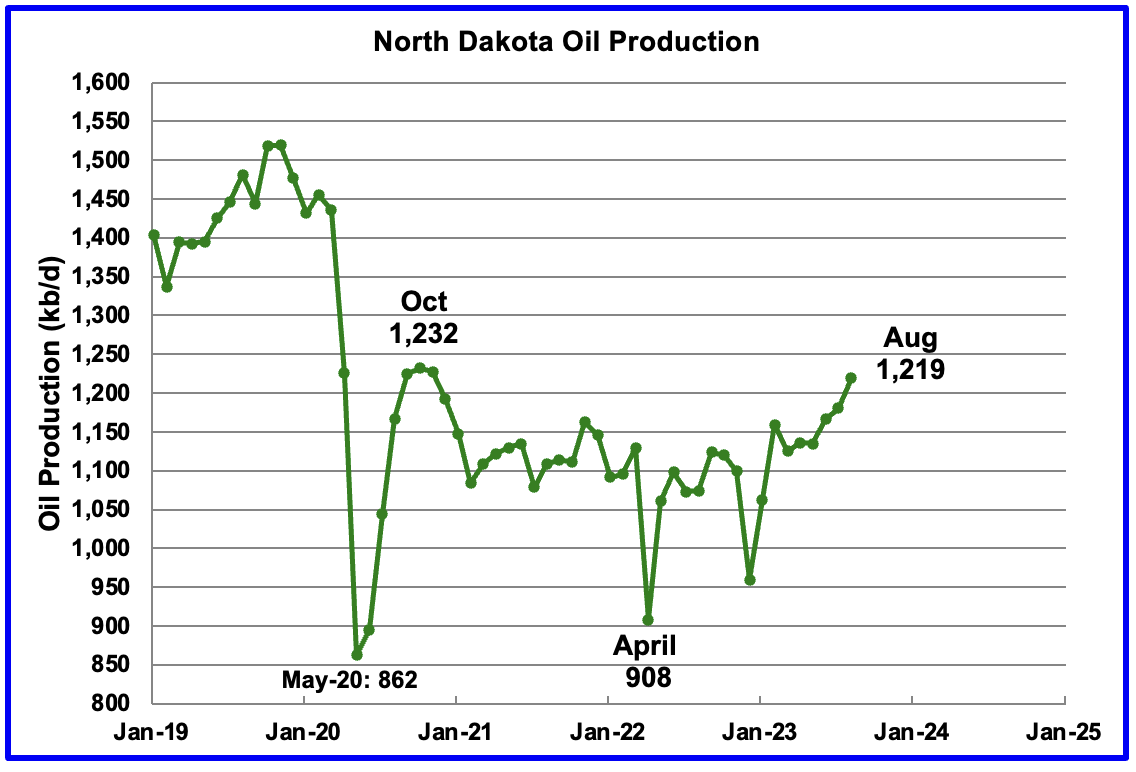
August’s output increased by 37 kb/d to 1,217 kb/d. This is the first post pandemic month in which North Dakota’s output exceeded the October 20 rebound production of 1,214 kb/d. Output over the next few months may slow as the rig count stays relatively unchanged close to 30 rigs.
According to this source, production growth going forward will be smaller.
“But Helms said this may be the last time for a while where there would be this kind of increase.
“When we look at the number of completions, and we look at the number of wells waiting on completion, we can see that we don’t have a large inventory of wells waiting,” Helms said. “And we’re just going to be completing wells as they’re drilled.”
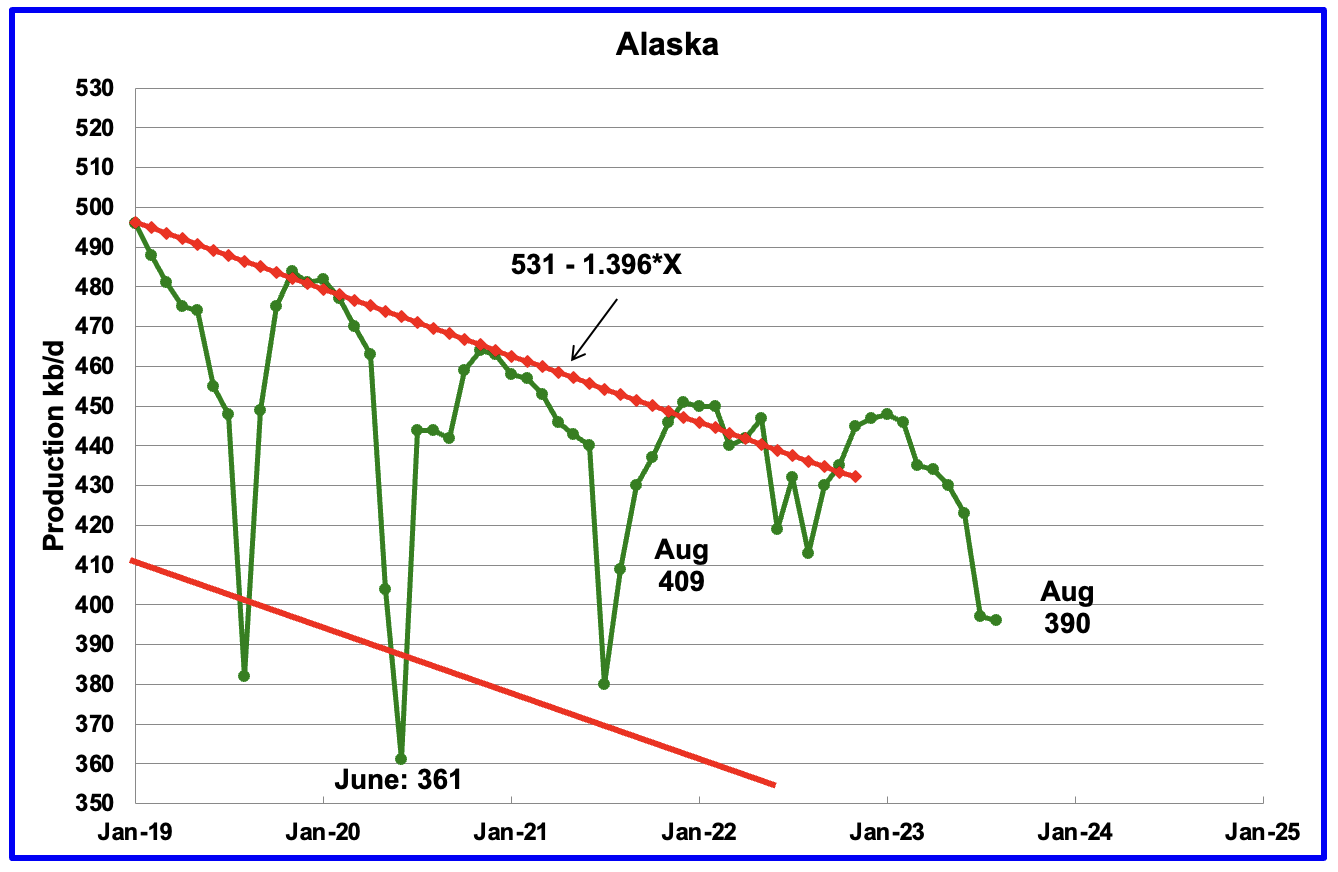
Alaskaʼs August output decreased by 1 kb/d to 396 kb/d. Production YoY is down by 17 kb/d and down 19 kb/d from two years ago.
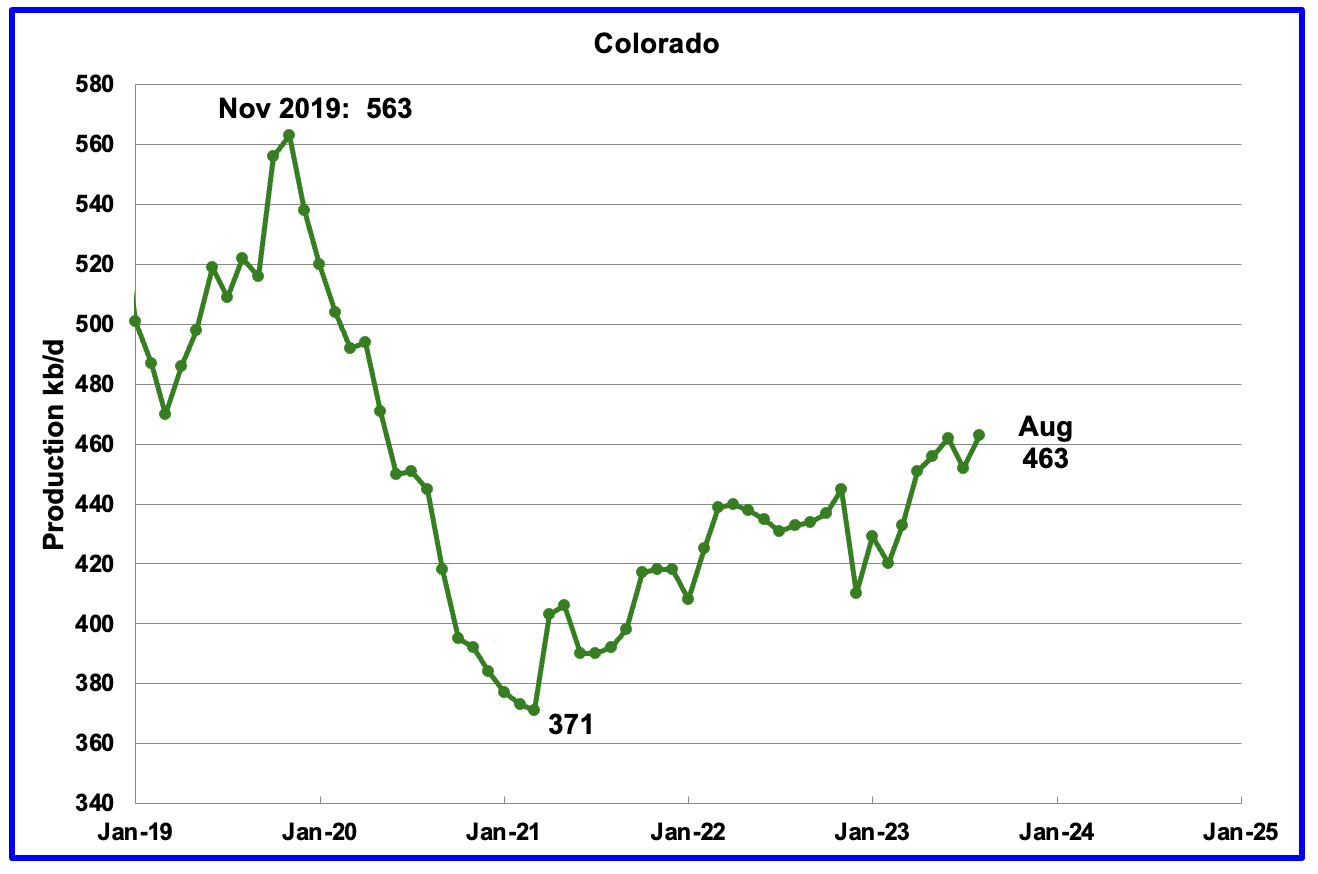
Coloradoʼs August production increased by 11 kb/d to 463 kb/d.
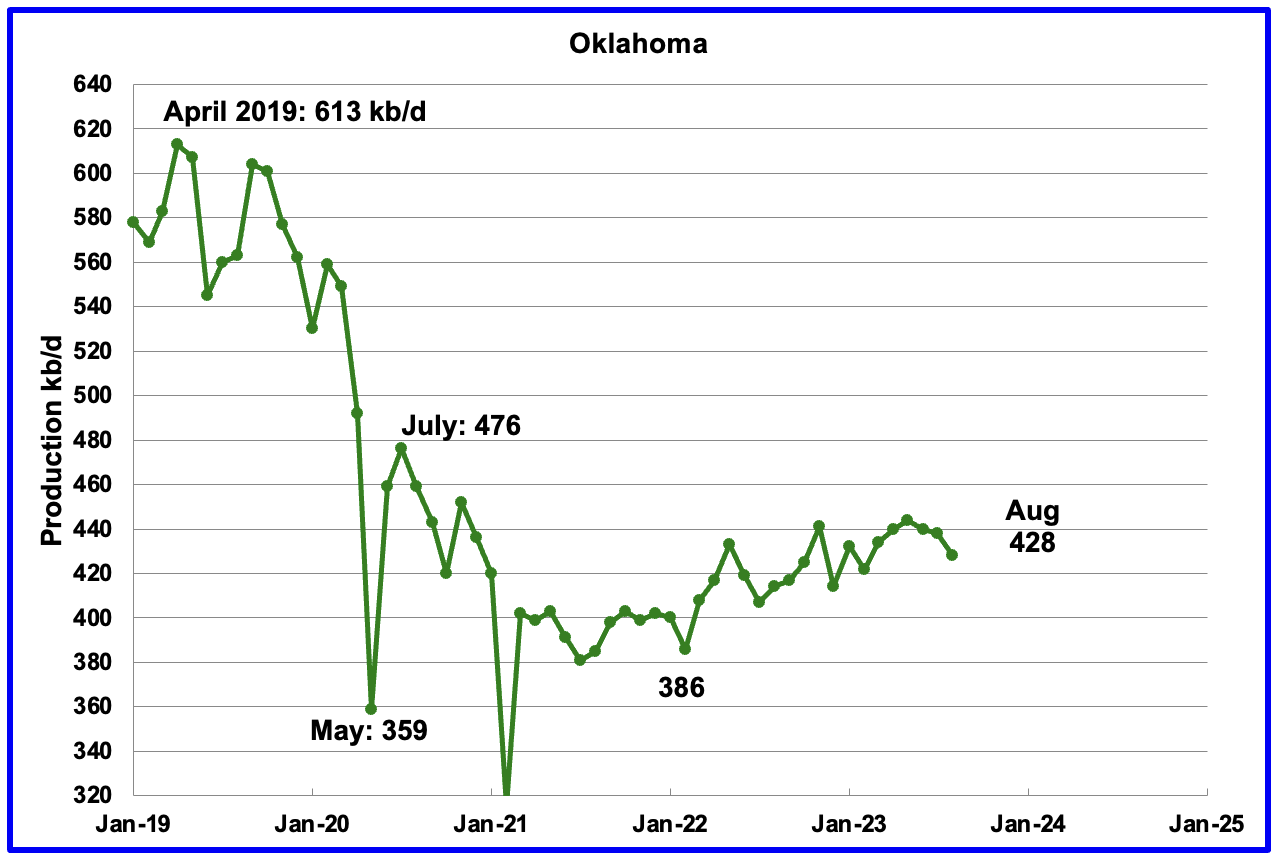
Oklahoma’s output in August decreased by 10 kb/d to 428 kb/d. Production remains 48 kb/d below the post pandemic July 2020 high of 476 kb/d and output may be in a plateau phase.
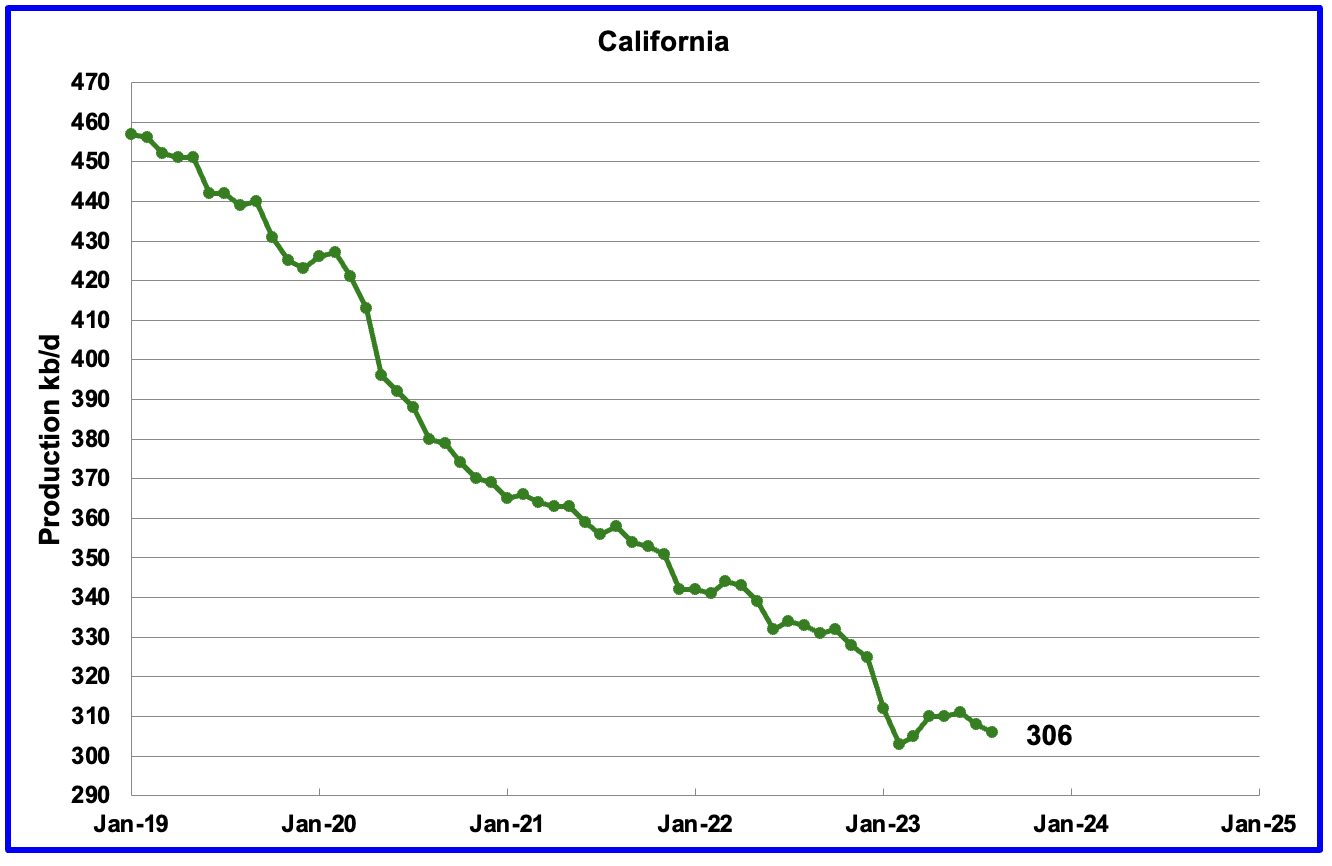
Californiaʼs overall slow output decline trend has resumed. August production dropped by 2 kb/d to 306 kb/d.
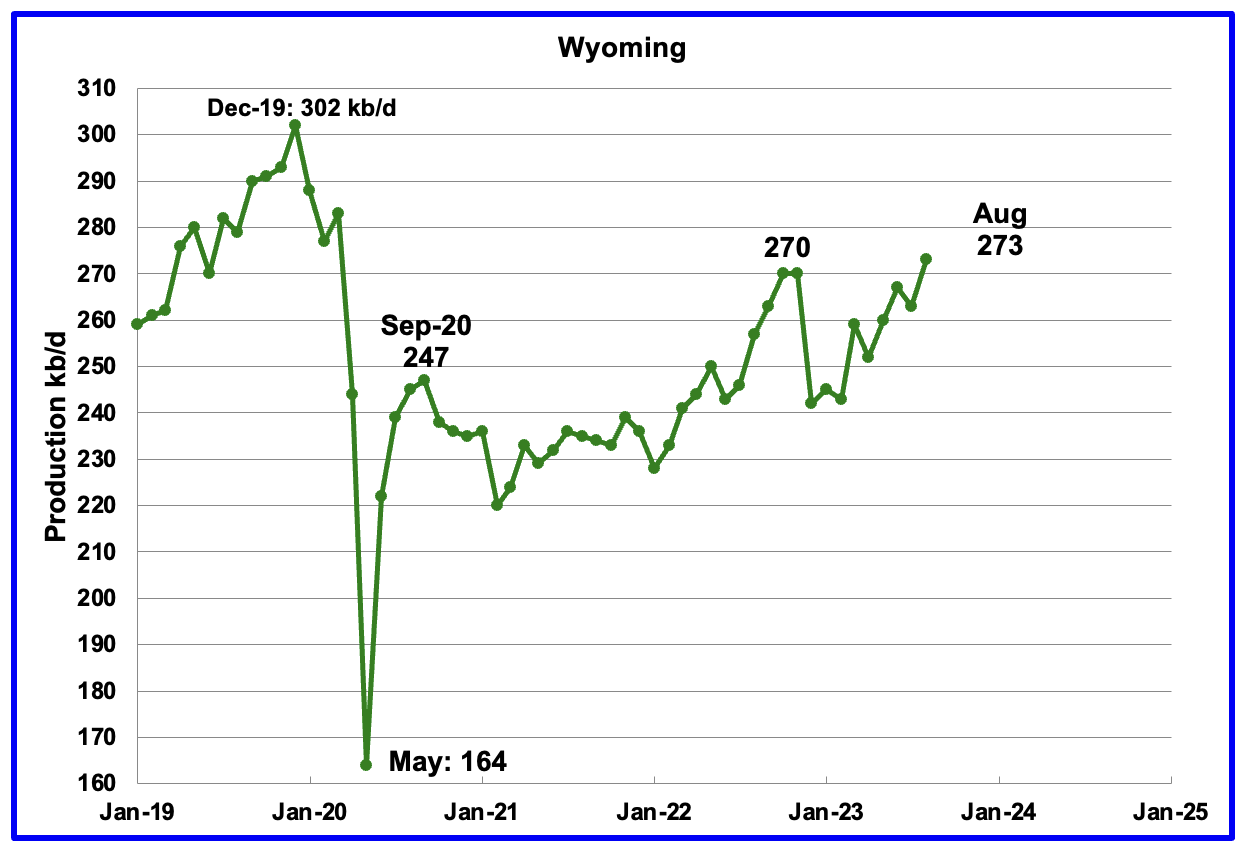
Wyoming’s oil production in October and November 2022 reached a post pandemic high of 270 kb/d. Wyomings production has been rebounding since February 2023 and August’s oil production added 10 kb/d to 273kb/d, 3 kb/d higher than November 2022.
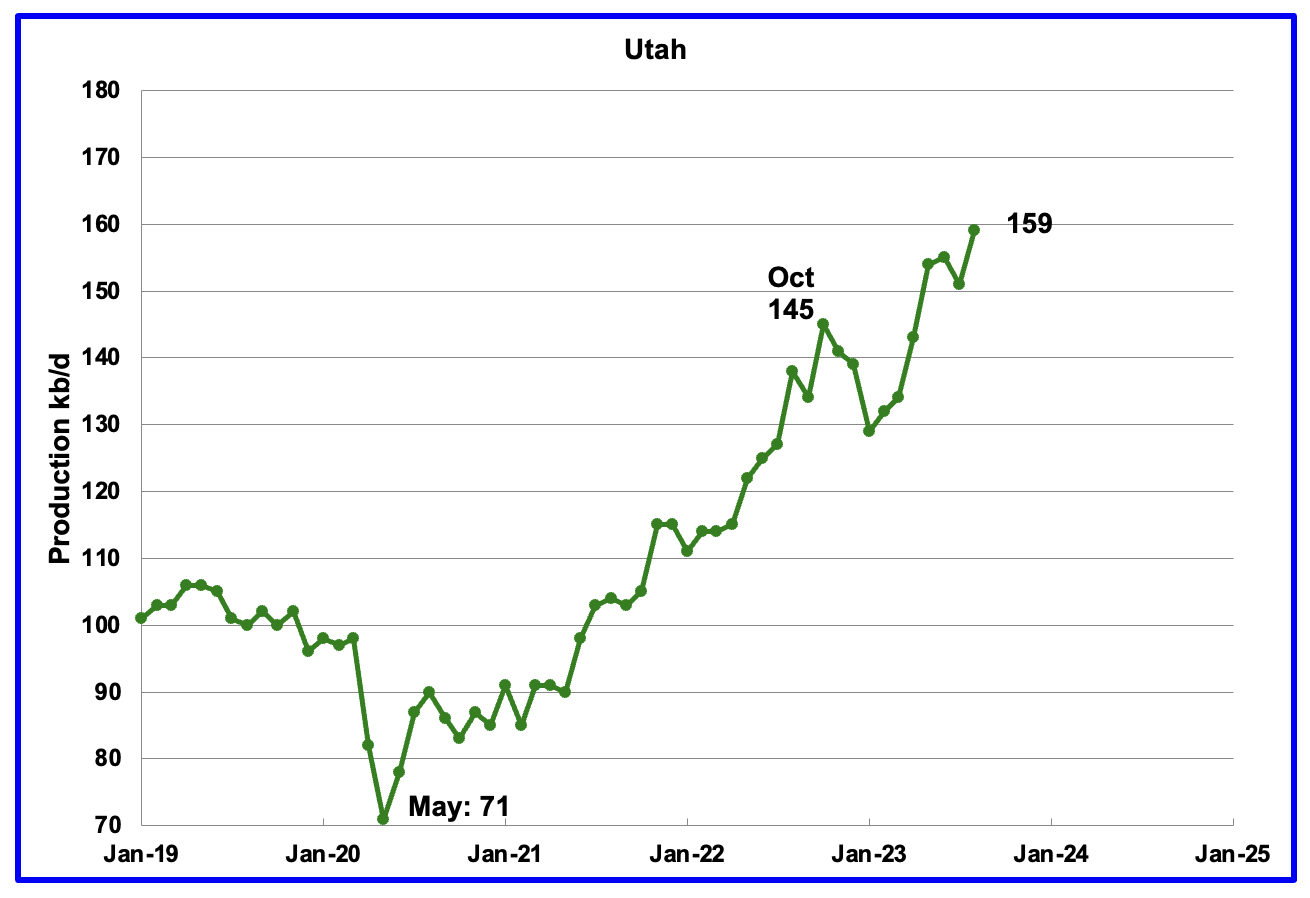
August’s production increased by 8 kb/d to 159 kb/d to another record high. For the first 4 months of 2023, Utah had 7 rigs operating. Since May the number of operational rigs has bounced between 8 and 9, which may account for the increased production.
The increased production since February has come from the Uinta basin.
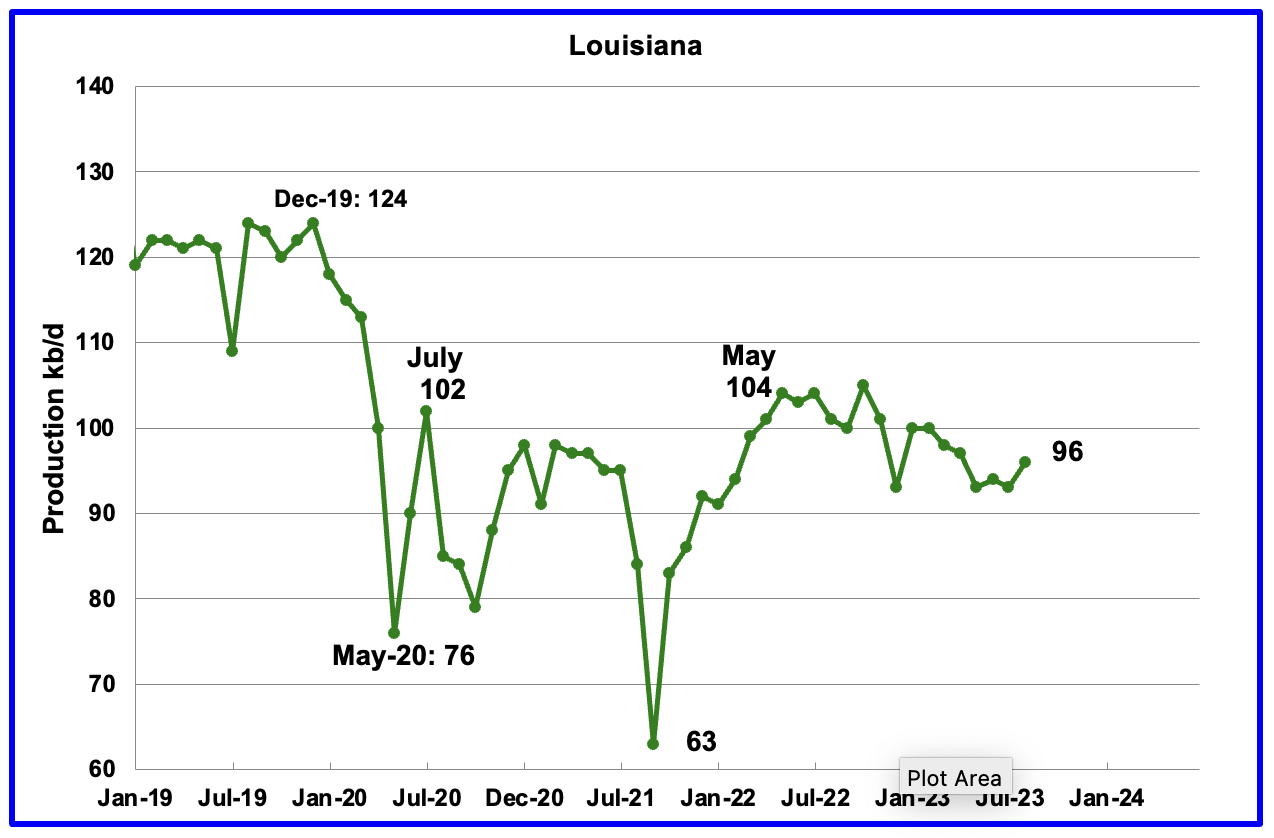
Louisiana’s output entered a slow decline phase in November 2022. August’s production increased by 3 kb/d to 96 kb/d and is 8 kb/d lower than May 2022.
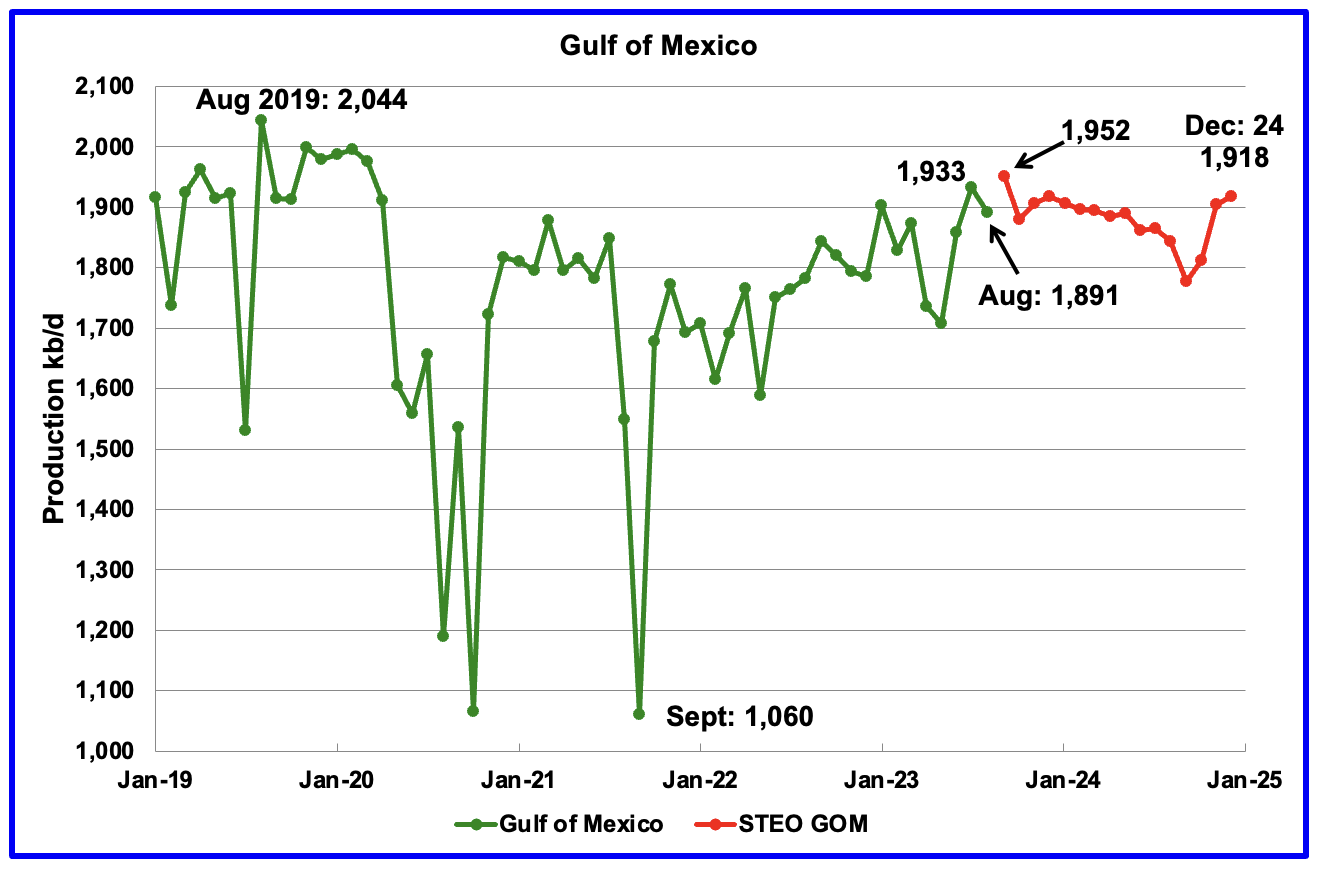
GOM production decreased by 42 kb/d in August to 1,891 kb/d. Over the two months, June and July, GOM output grew by 225 kb/d to 1,933 kb/d and is close to its peak for the next 16 months.
The October 2023 STEO projection for the GOM output has been added to this chart and it projects that output in September 2024 will drop to 1,777 kb/d before rebounding to 1,918 kb/d in December 2024.
The output rise from June to September to 1,952 kb/d is a combination of the Vito platform and Mad Dog 2 field coming online.
It is not known if the GOM decline shown after September 2023 is related to a combination of extensive maintenance and general depletion of wells.
A Different Perspective on US Oil Production
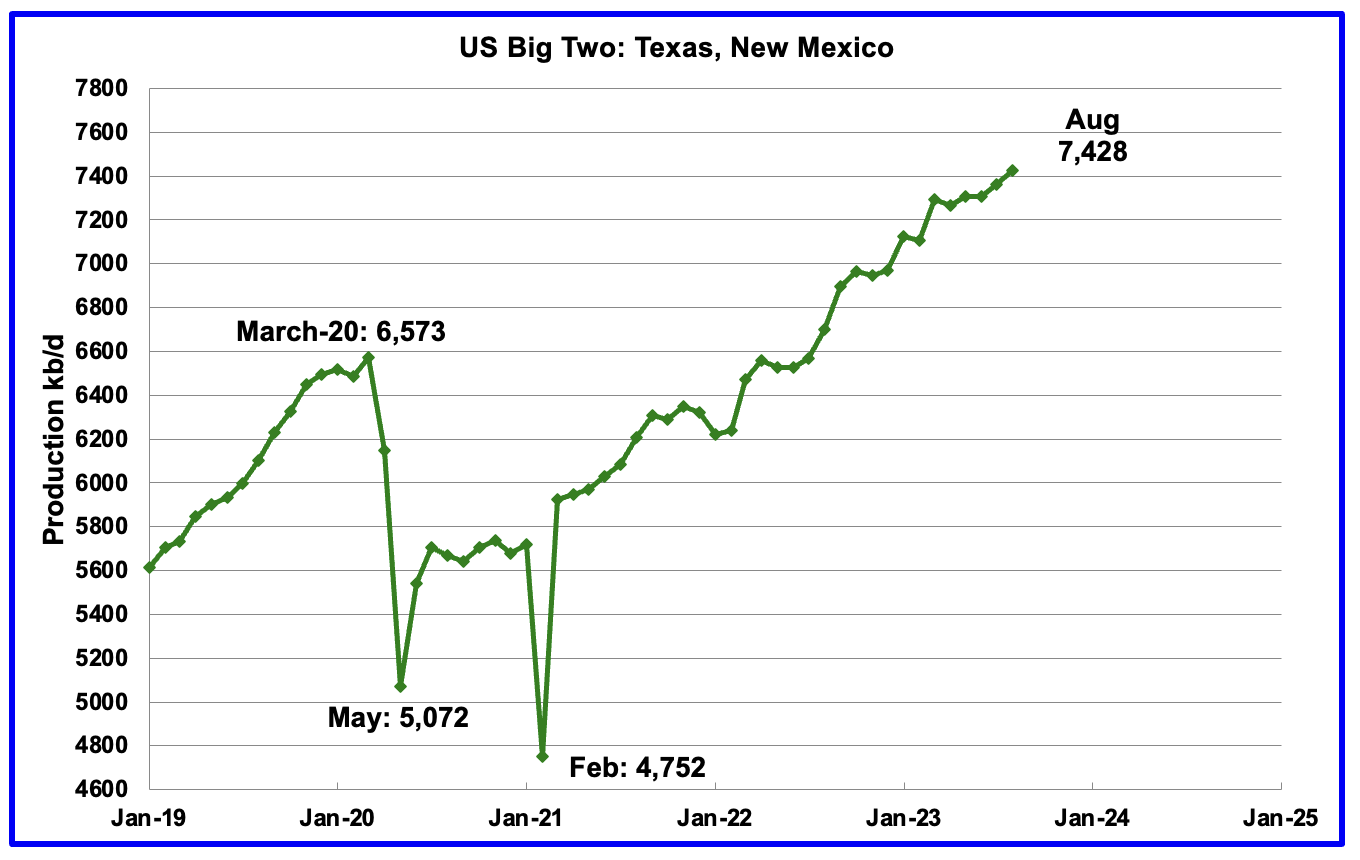
The Big Two states’ combined oil output for Texas and New Mexico.
August’s production in the Big Two states increased by a combined 65 kb/d to 7,428 kb/d with Texas adding 25 kb/d while New Mexico added 40 kb/d. Part of the increase is due to a downward revision to July’s production.
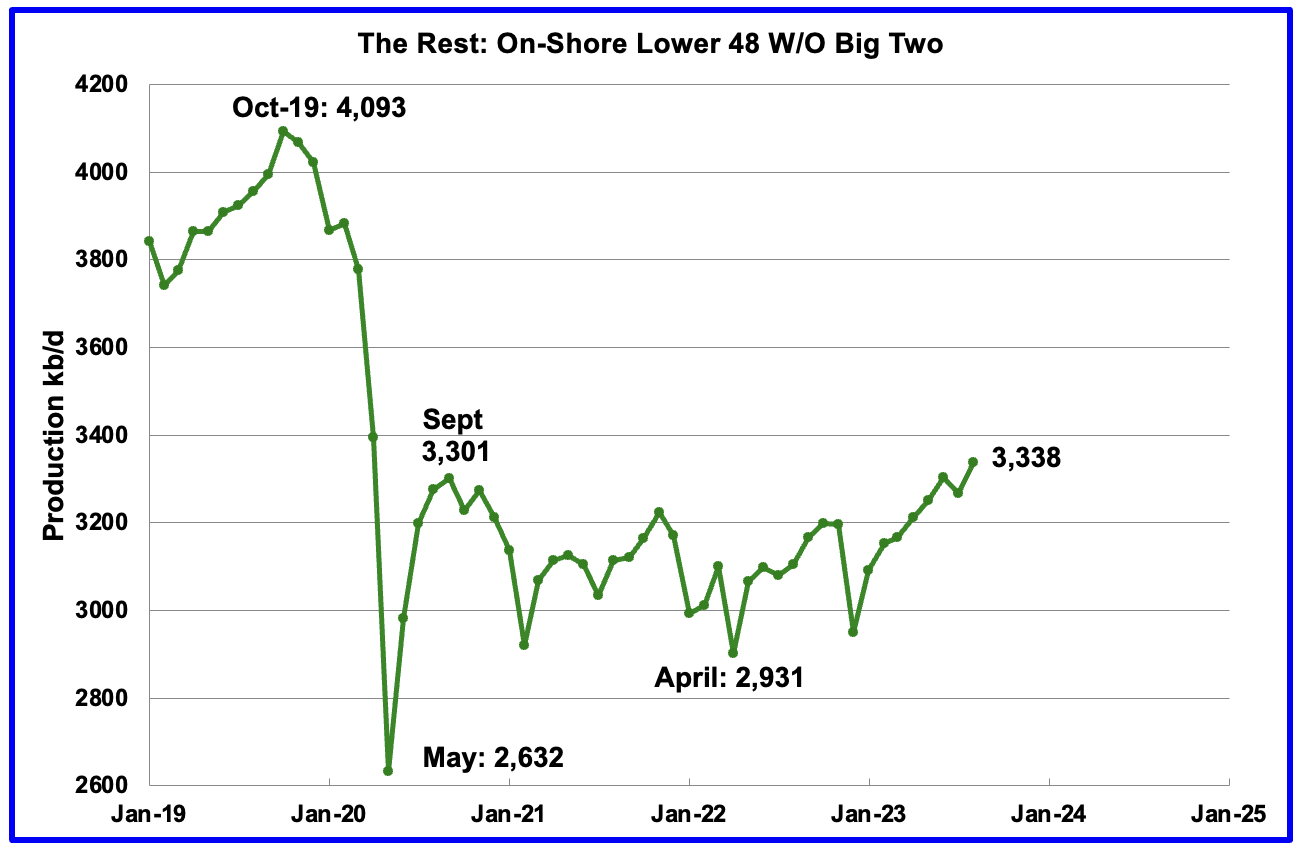
Oil production by The Rest
August’s production in The Rest increased by 72 kb/d to 3,338 kb/d. This is a new high relative to the September 2020 high of 3,301 kb/d. More importantly, production increases in the rest are becoming significant and it should be noted that the August increase was greater than the increase in the Big Two.
The main takeaway from The Rest chart is that current production is 755 kb/d below the high of October 2019 and this appears to be a permanent loss that will never be recovered.
Permian Basin Report by Main Counties
This monthly Permian section has being added to the US report because of a range of views on whether Permian production will continue to grow or will peak over the next year or two. The issue was brought into focus recently by the Goehring and Rozencwajg Report which indicated that a few of the biggest Permian oil producing counties were close to peaking or past peak. Also comments by posters on this site have similar beliefs from hands on experience.
This section will focus on the four largest oil producing counties in the Permian, Lea, Eddy, Midland and Martin. It will track the oil and natural gas production and the associated Gas Oil Ratio (GOR) on a monthly basis. The data is taken from the state’s government agencies for Texas and New Mexico. Typically the data for the latest two or three months is not complete and is revised upward as companies submit their updated information. Note that the natural gas production shown in the charts that is used to calculate the GOR is solely the gas coming from the oil wells.
Of particular interest will be the charts which plot oil production vs GOR for a county to see if a particular characteristic develops that indicates the field is close to entering the bubble point phase. While the GOR metric is best suited for characterizing individual wells, counties with closely spaced horizontal wells may display a behaviour similar to individual wells due to pressure cross talking . For further information on the bubble point and GOR, there are a few good thoughts on the intricacies of the GOR in an earlier POB comment. Also check this EIA topic on GOR.
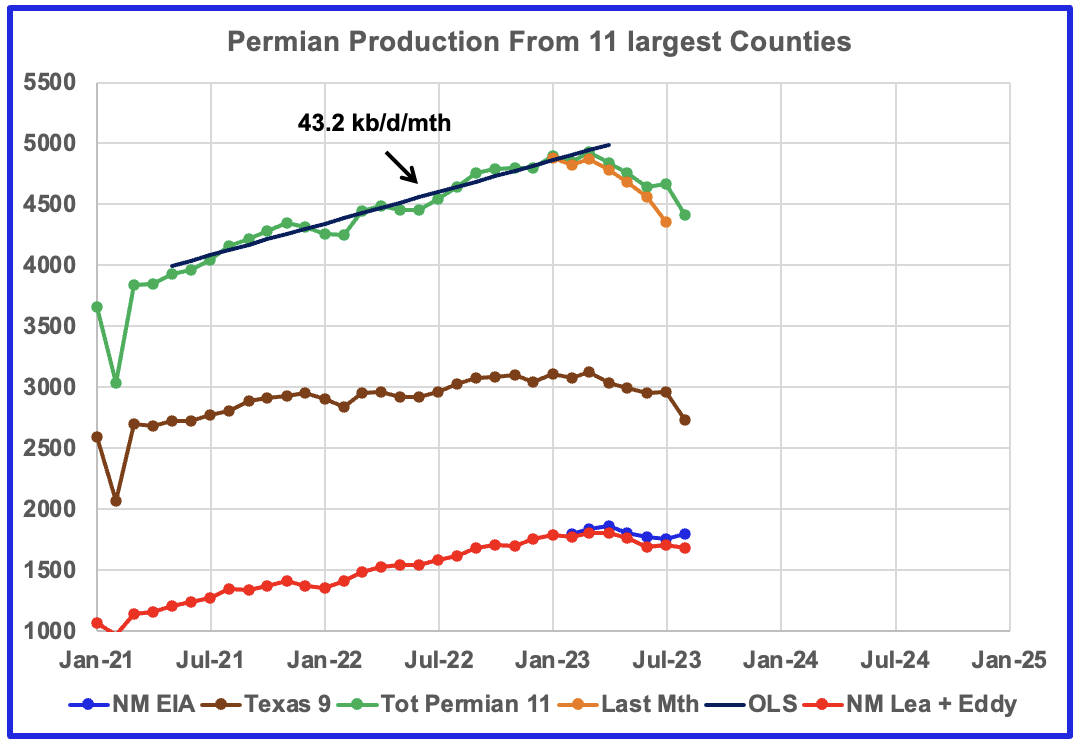
This chart shows oil production from the 11 largest counties in the Permian. In the New Mexico Permian, there are the two main counties, Lea and Eddy. The remaining nine are in Texas; Midland, Martin, Reeves, Andrews, Loving, Howard, Reagan, Glasscock and Upton . The graphs are updated to August.
The red markers show production from the two NM counties while the blue markers show total production for NM from the EIA monthly report. The EIA must have some correction factors to increase NM’s output from NM’s official site. The brown markers show output from the 9 biggest Permian counties in Texas.
The orange markers are production as reported last month for the Permian 11. The biggest change occurred with July, an increase of 357 kb/d due to updated reporting.
The OLS line for the Permian 11 was calculated over the range July 21 to January 2023. After January 2023, we should begin to see production breaking away from that line, possibly starting in July if production is peaking. It will take another 4 to 5 months of production data to see if July production is relatively flat compared with January 2023. We are essentially looking for lower production growth after January 2023 to confirm that peaking is near.
New Mexico Permian
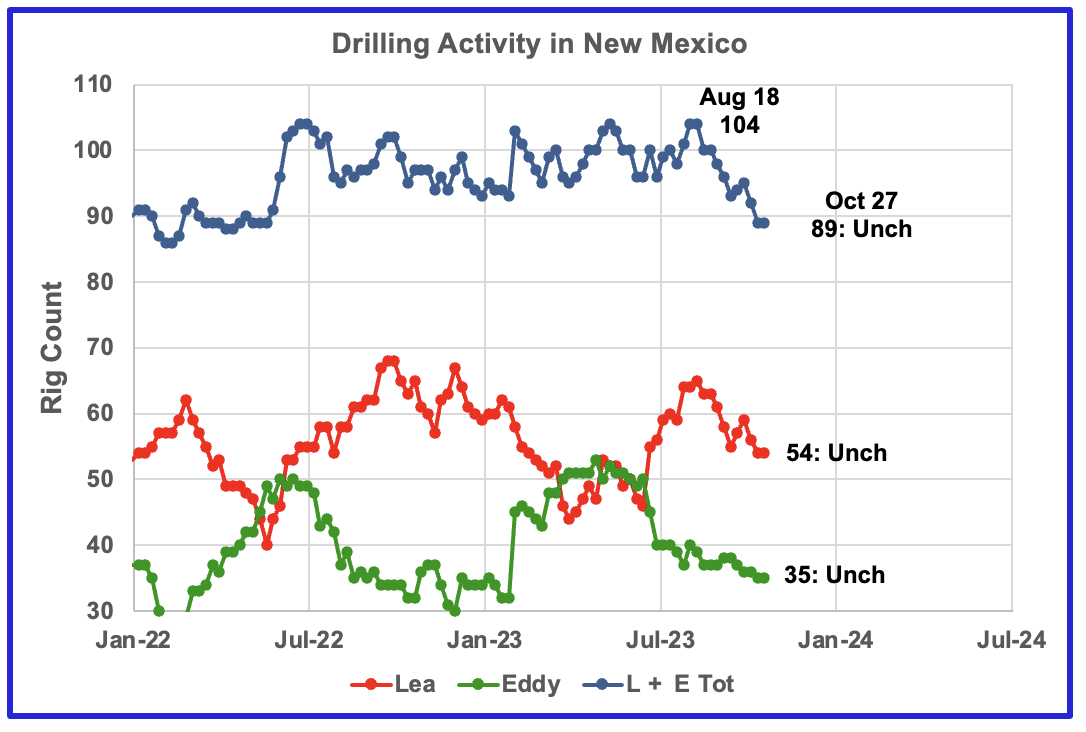
Over the past 6 weeks drilling activity in Lea and Eddy county has been dropping. The rig count is down by 15 from a high of 104 in August. Rigs are leaving New Mexico.
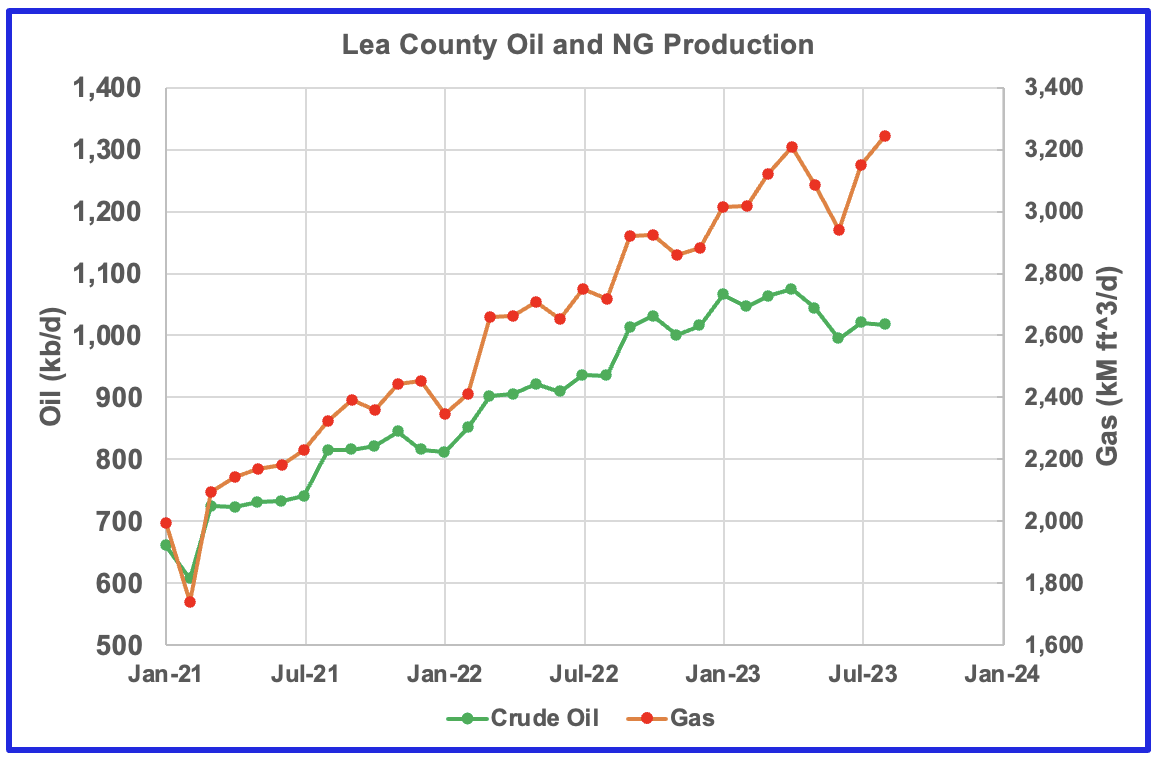
Over the last three months, gas production has risen faster than oil production in Lea county. July oil production saw an increase of 7 kb/d to 1,020 kb/d because Lea county production was updated in the August.
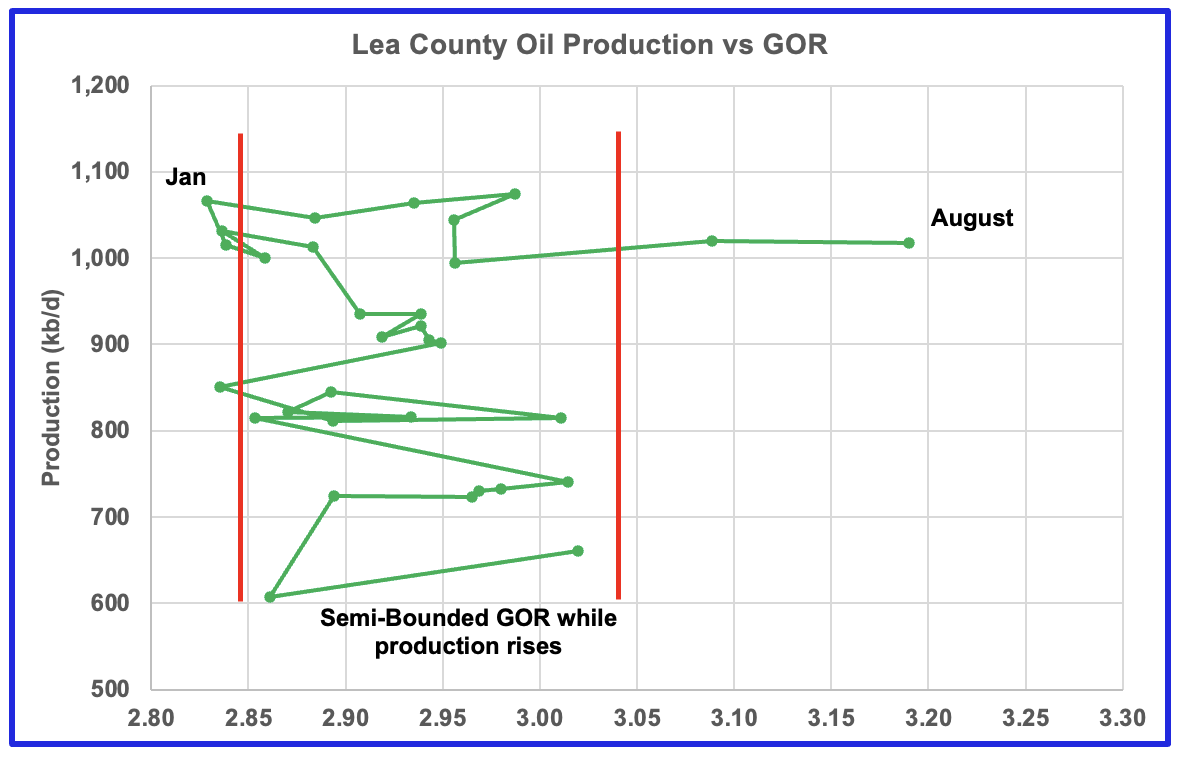
After much zigging and zagging, oil production in Lea county stabilized above 1,000 kb/d while the GOR started to increase in February and exceeded the semi-bounded GOR in July while production slowed and possibly has begun to decline. The data for the last two months, July and August, is incomplete.
This pattern of a zigging and zagging GOR within a semi-bounded GOR while oil production increases to some stable level and then moves out to a higher GOR to the right has shown up in a number of counties. See an additional three cases below. This is the second month in which Lea county has registered a GOR outside the semi-bounded GOR range.
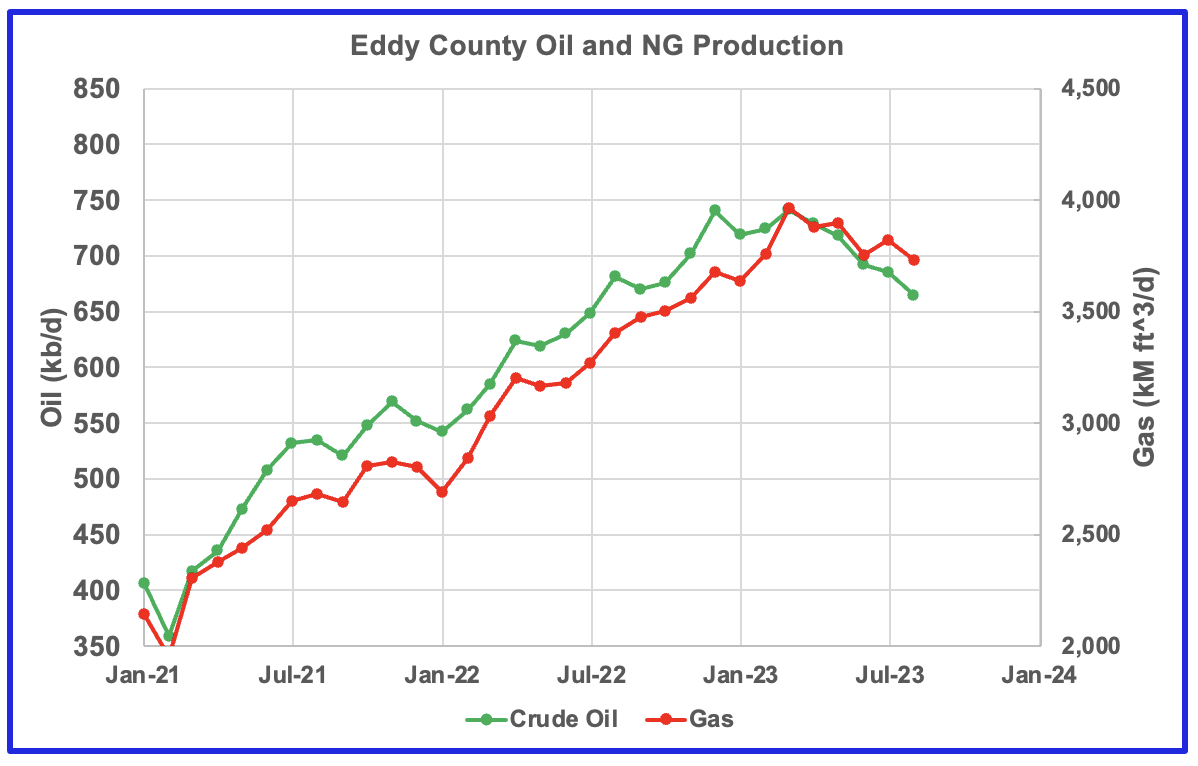
Eddy county oil production is showing early signs that is has peaked.
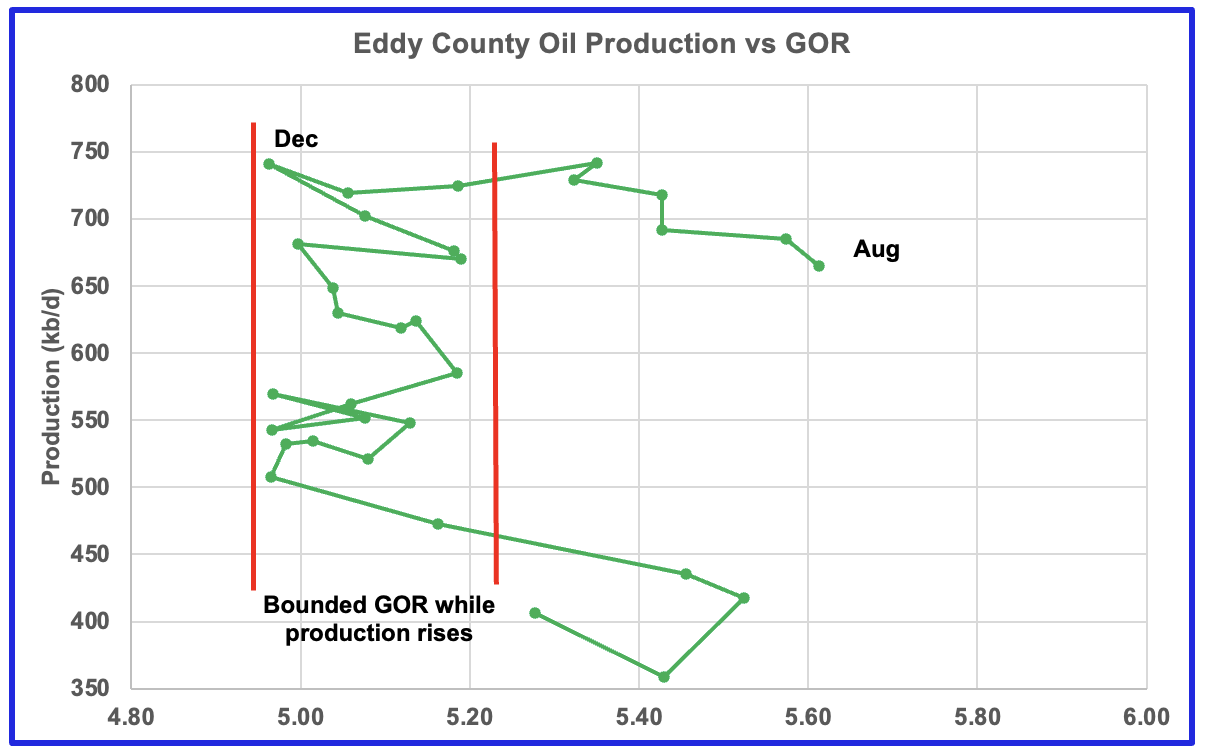
The Eddy county GOR pattern is similar to Lea county except that Eddy has broken out from the semi bounded range for a longer period. Does the breakout indicate that most of the wells in this county have entered the bubble point phase?
Texas Permian
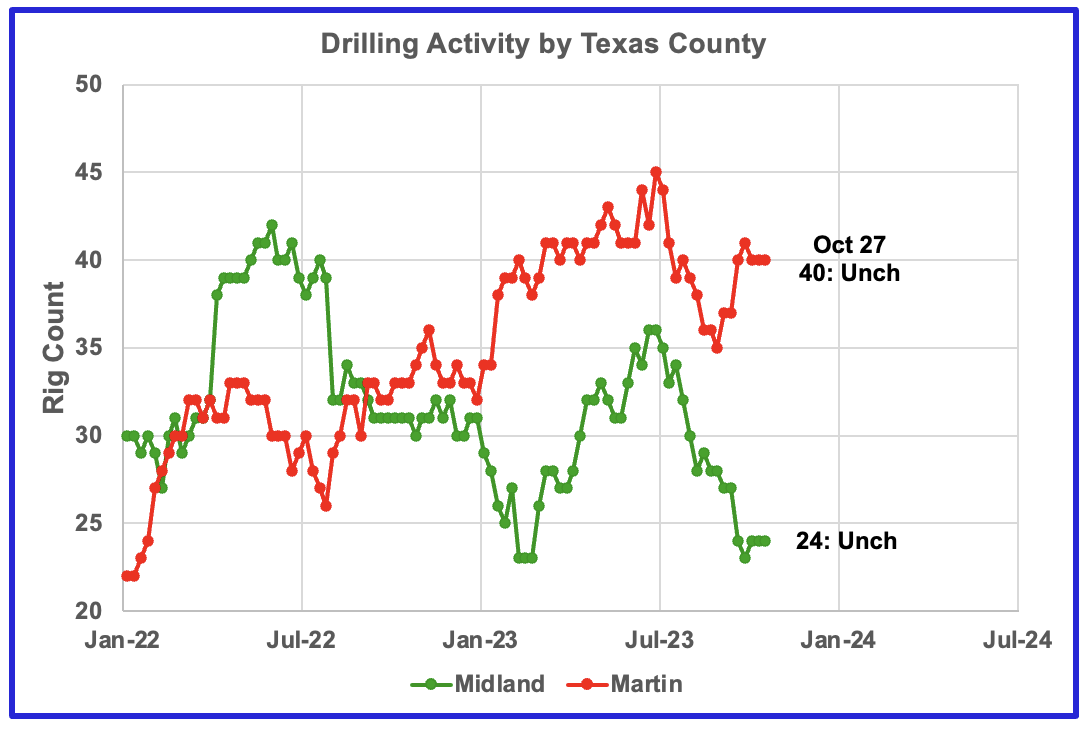
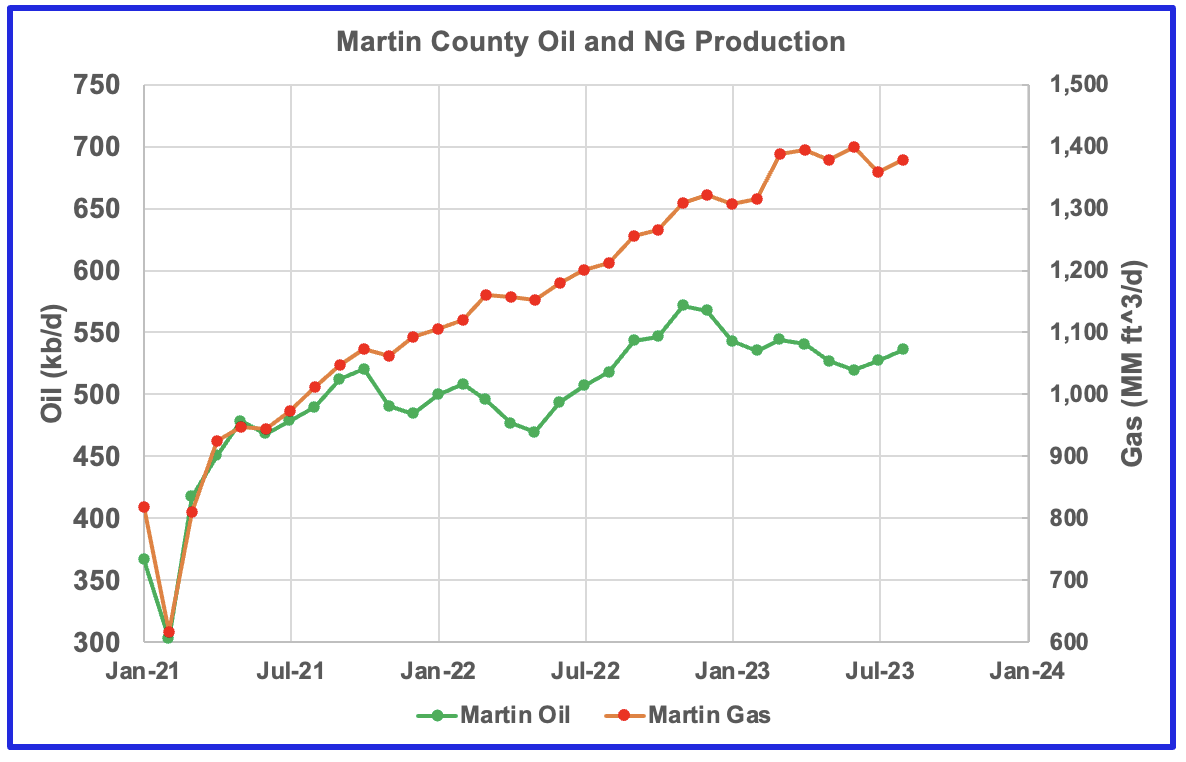
During October, drilling activity has been increasing in Martin county while it has been dropping in Midland county. Since these two counties are adjacent, could these rigs just be moving between counties?
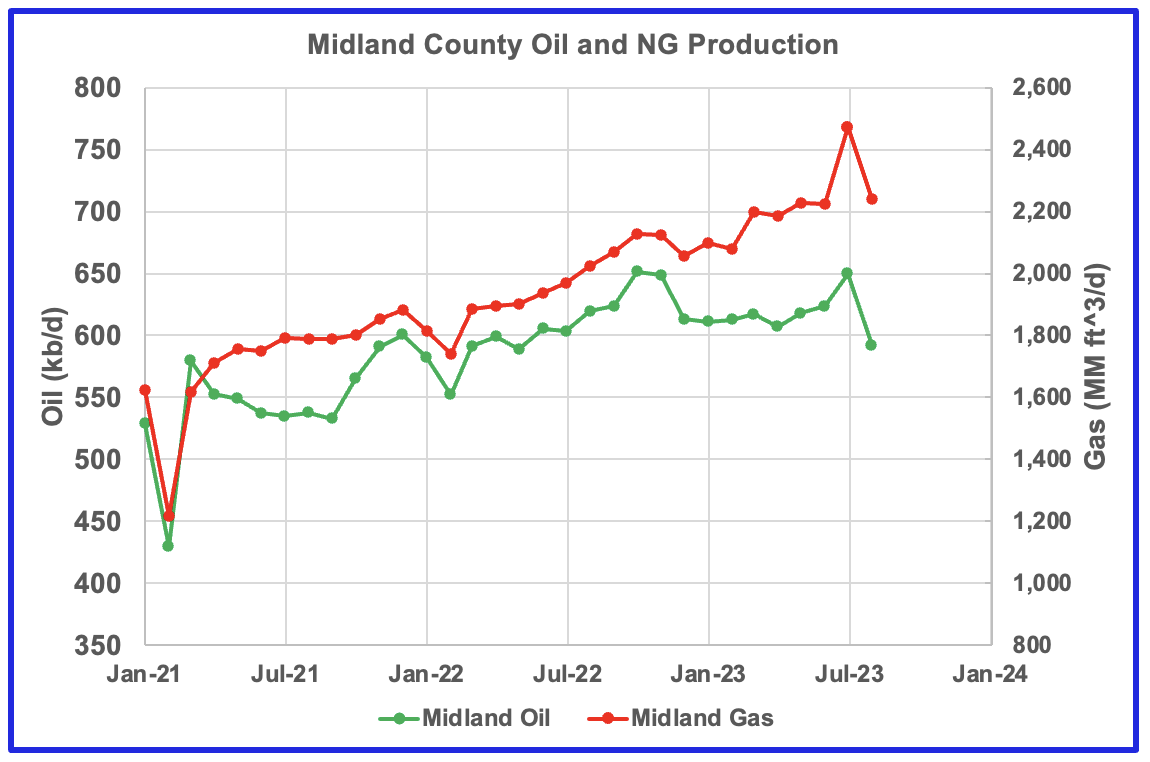
Natural Gas production is increasing while oil production drops in Midland county. Cannot find any explanation for the July spike in oil and gas production.
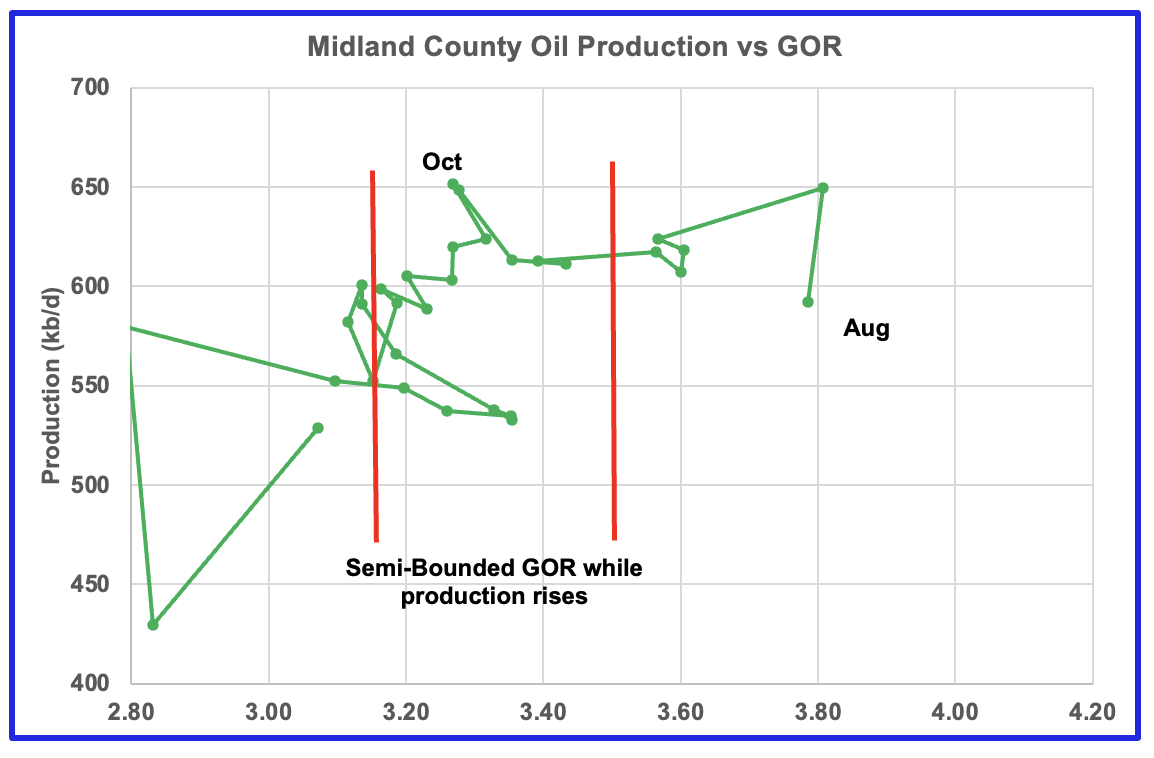
Oil production dropping and GOR staying constant. Has Midland entered the bubble phase?
Natural Gas production is increasing while oil production drops.
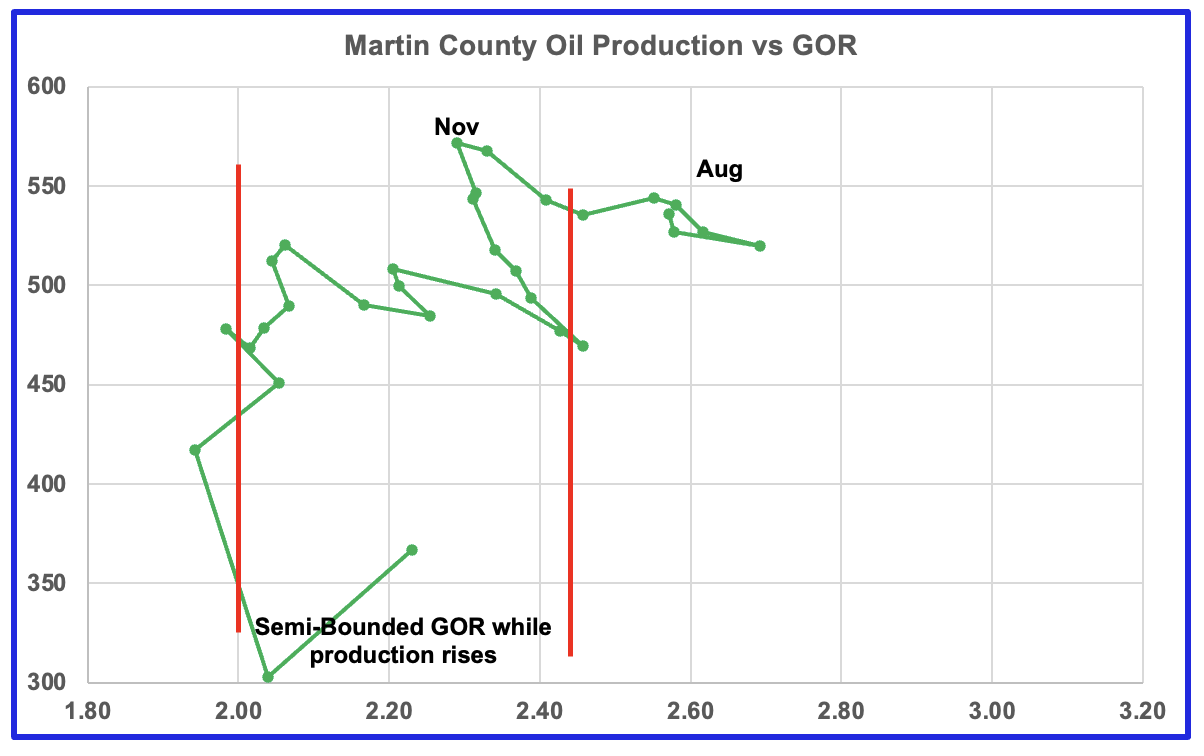
A slight rise in oil production and a small change in the GOR outside of the semi bounded range. Note that Midland county is adjacent to Martin county and the pressure could be dropping in both fields.
All of the oil production vs GOR charts above are exhibiting characteristics indicating that the four largest oil producing counties in the Permian are in the bubble point phase and are close to or past their peak?
Eagle Ford’s Biggest Oil producing County
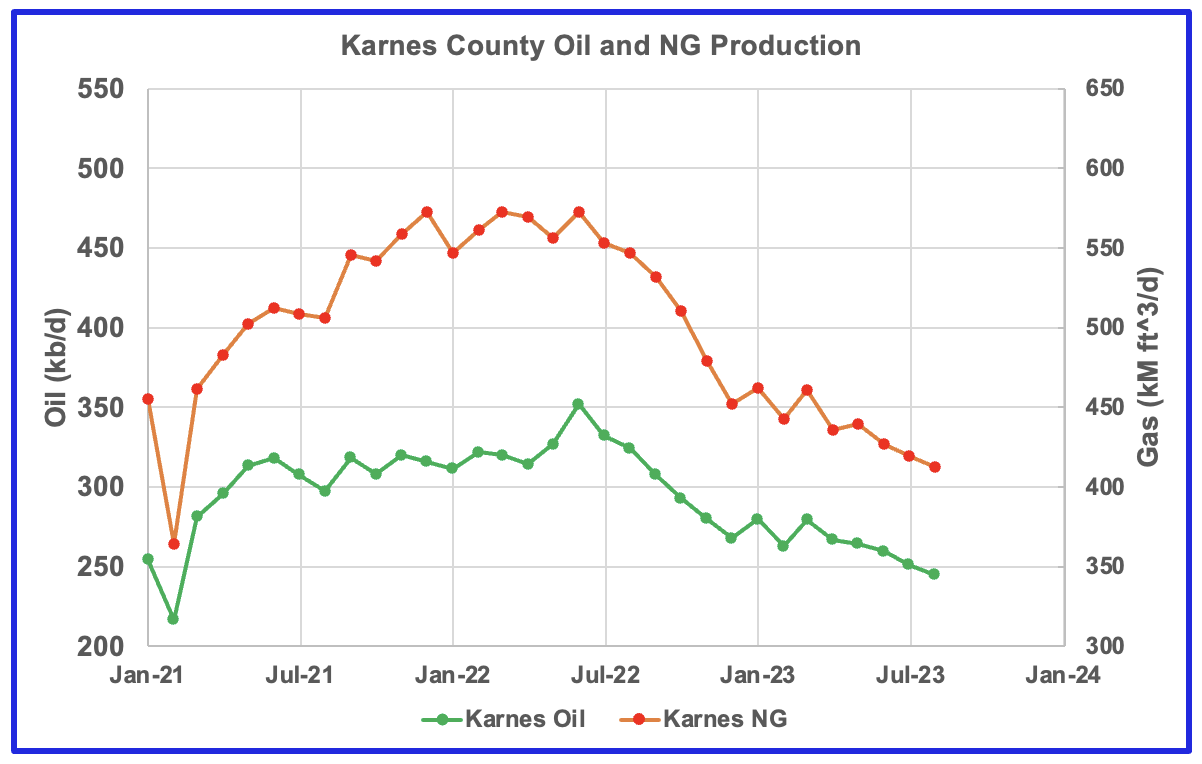
Both oil and gas production are falling in Karnes county and both are down close to 30% from the peak.
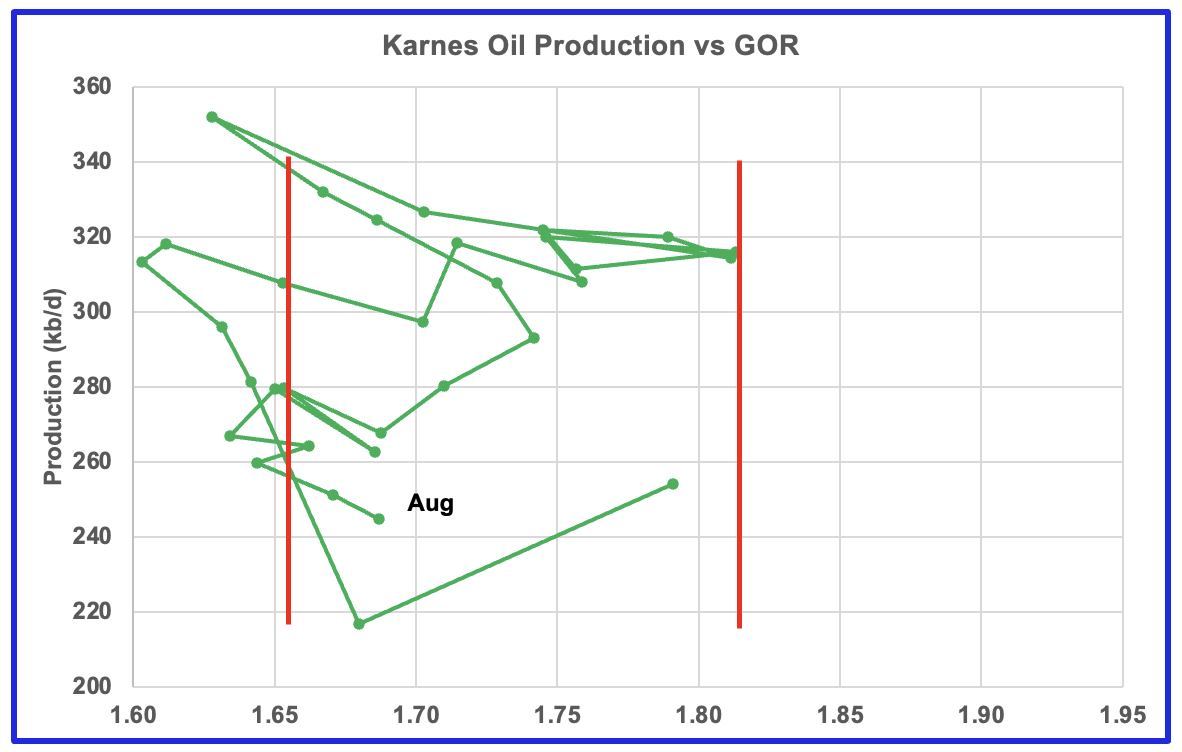
This is the GOR vs oil production for Karnes county but the GOR is still within its typical range while production is dropping. This may indicate that Karnes county wells have not entered the bubble point phase or weren’t very gassy to start with..
Drilling Productivity Report
The Drilling Productivity Report (DPR) uses recent data on the total number of drilling rigs in operation along with estimates of drilling productivity and estimated changes in production from existing oil wells to provide estimated changes in oil production for the principal tight oil regions. The October DPR report forecasts production to November 2023 and the following charts are updated to November 2023. The DUC charts and Drilled Wells charts are updated to September 2023.
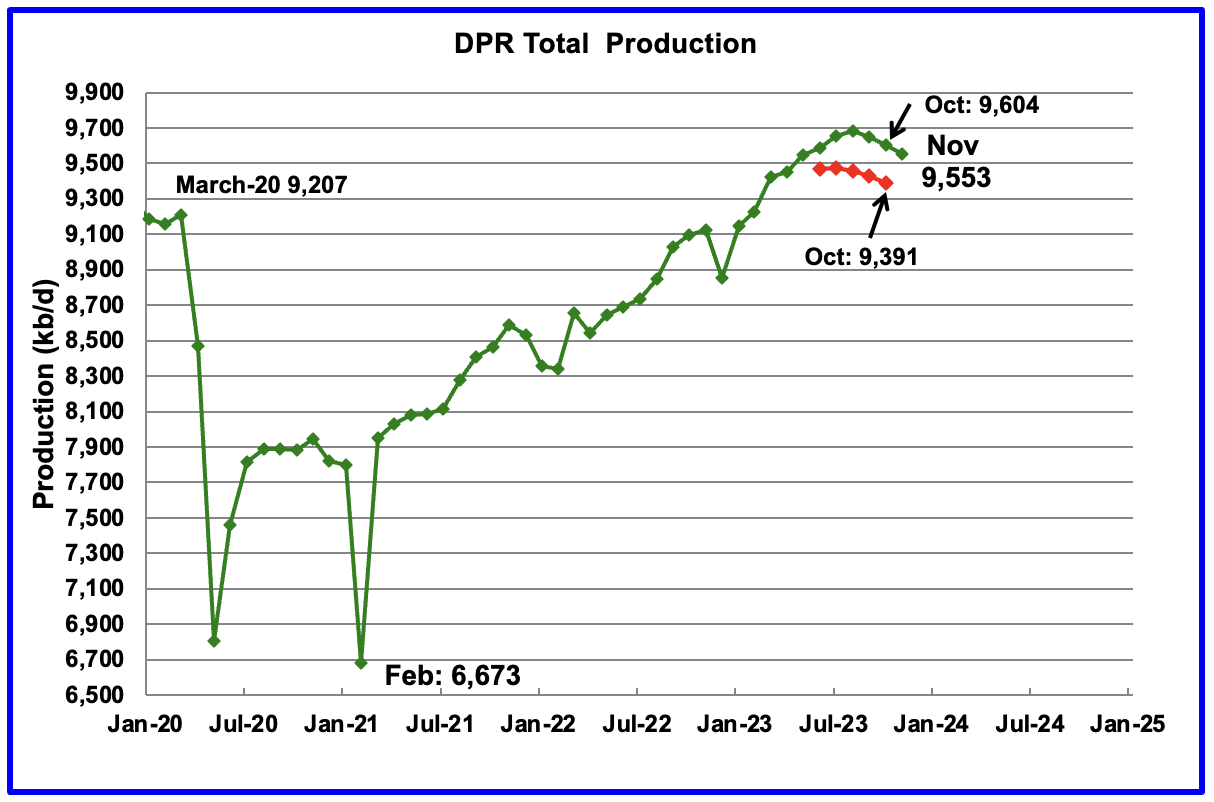
Above is the total oil production projected to November 2023 for the 7 DPR basins that the EIA tracks. Note that DPR production includes both LTO oil and oil from conventional wells.
The DPR is projecting that oil output for November 2023 will decrease by 51 kb/d to 9,553 kb/d. This is the third drop in a row since the August peak of 9,684 kb/d. The drop is due to the reduced drilling and completions that began earlier this year.
While the green graph shows DPR production dropping since August, it also had a significant upward revision to production since the last report, red graph. For October, total DPR production has been revised up by 213 kb/d, from 9,391 kb/d to 9,604 kb/d with the biggest increase occurring in the Permian basin.
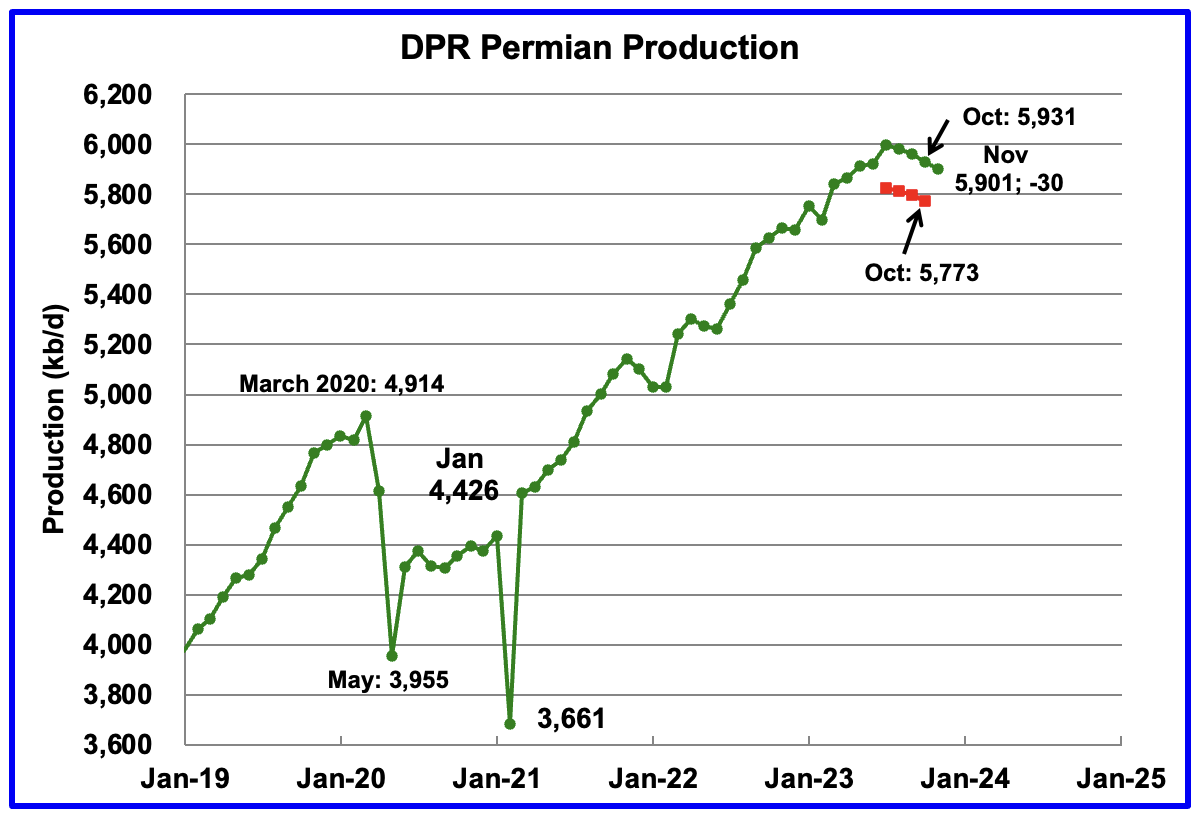
According to the EIA’s DPR report, Permian output continued to drop in November. It is expected to decrease by 30 kb/d to 5,901 kb/d. The last four months of production data clearly shows a dropping trend in monthly production.
However, while there is a projected drop for November, Permian production has been revised up. October production in the previous report has been revised from 5,773 kb/d to 5,931 kb/d, an increase of 142 kb/d.
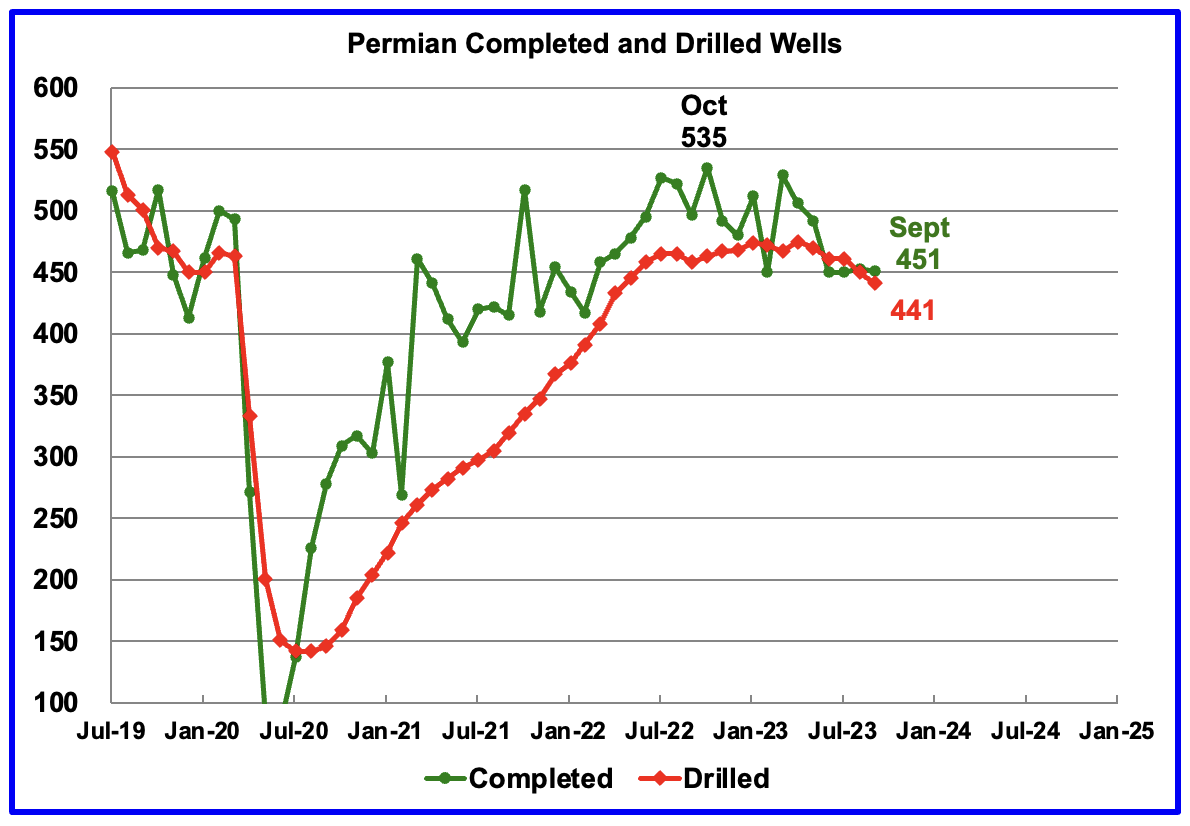
During September, 441 wells were drilled and 451 were completed in the Permian. (Note that September is the latest month for DUC information). The completed wells added 369 kb/d to September’s output for an average of 819 b/d/well. The overall decline was 391 kb/d which resulted in a net decrease for Permian output in September of 21 kb/d. Of the 451 completed wells in Sep477 would have been required to offset the decline, 26 fewer than than the 451 completed.
Even though WTI has been over $80/b for most of August through October, drilling activity continues to decline. Is this spending prudence or fewer Tier 1 locations or both?
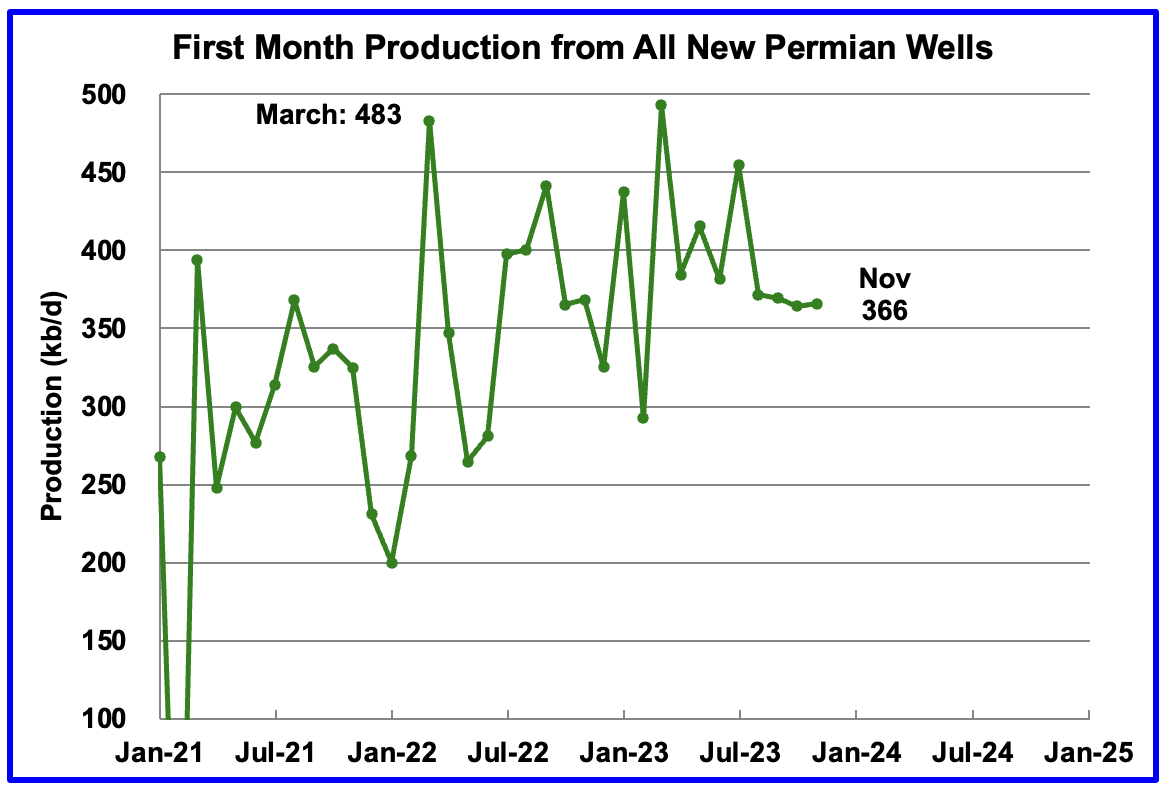
This chart shows the average first month total production from Permian wells tracked on a monthly basis. The total monthly production from the newest Permian wells in November is expected to be 366 kb/d. Recall that this production of 366 kb/d is offset by a decline of 396 kb/d for a net decline of 30 kb/d.
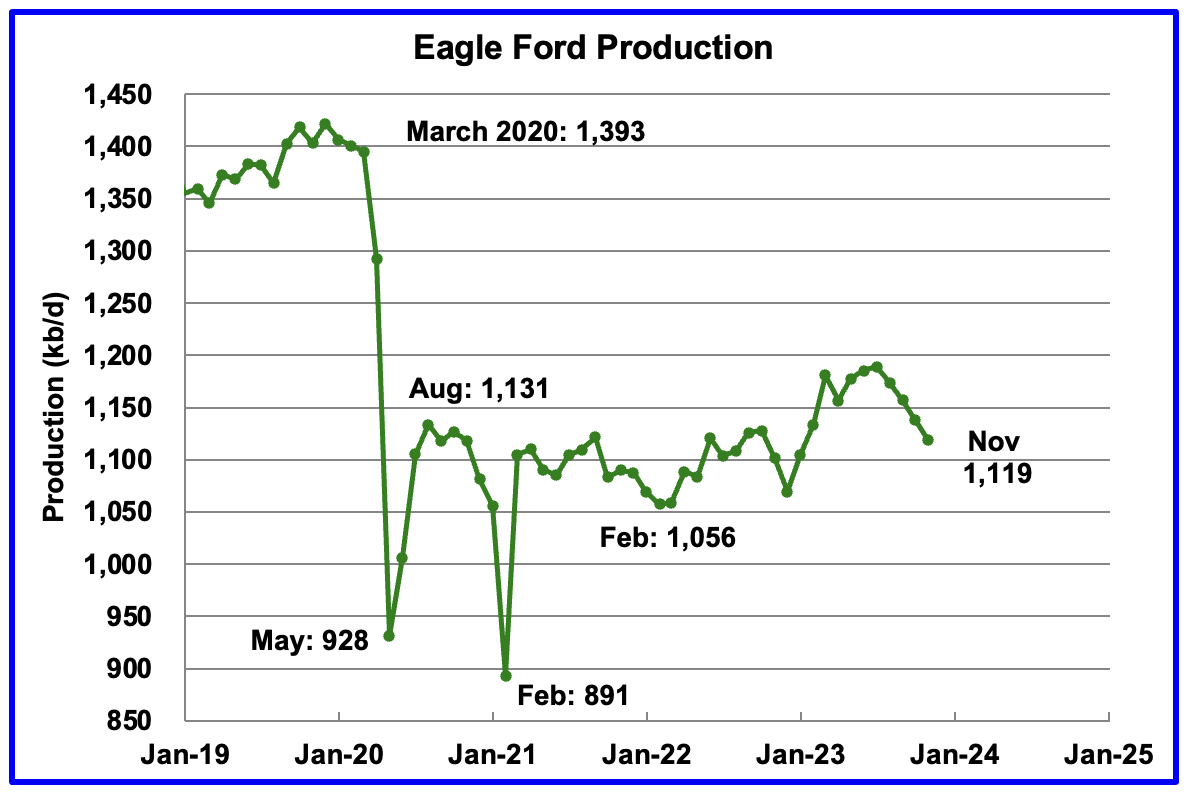
Output in the Eagle Ford basin has been in a downtrend since August. November’s forecast projects output is expected to decrease by 19 kb/d to 1,119 kb/d. The Eagle Ford output was also revised up from the previous report.
At the beginning of the year 2023, 68 rigs were operating in the Eagle Ford basin. The rig count began to drop in mid March to 60 and slowly dropped further to 47 in October.
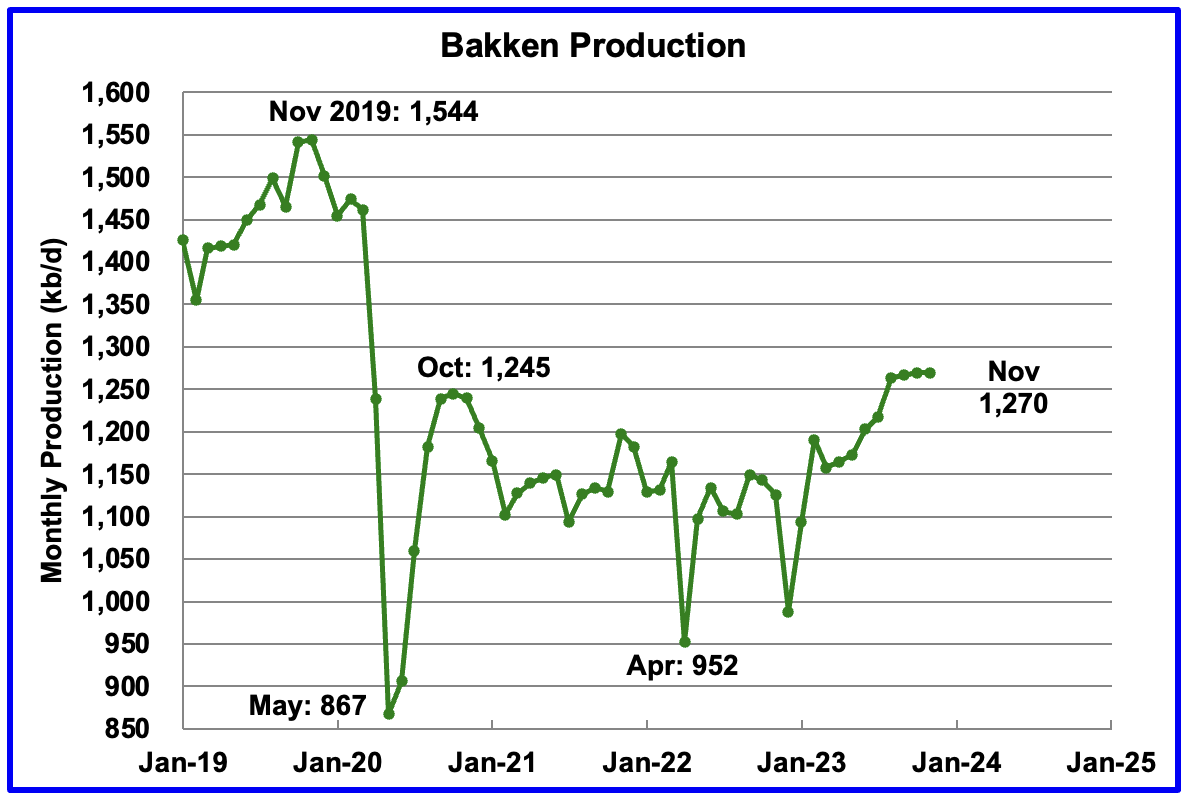
The DPR forecasts Bakken output in November will be 1,270 kb/d unchanged from October. November production is now projected to be 25 kb/d higher than the post pandemic peak of 1,245 kb/d in October 2020.
The North Dakota government reported that August production increased by 38 kb/d to 1,219 kb/d. Note that in the Bakken chart above, August production shows a similar spike in production, 46 kb/d.
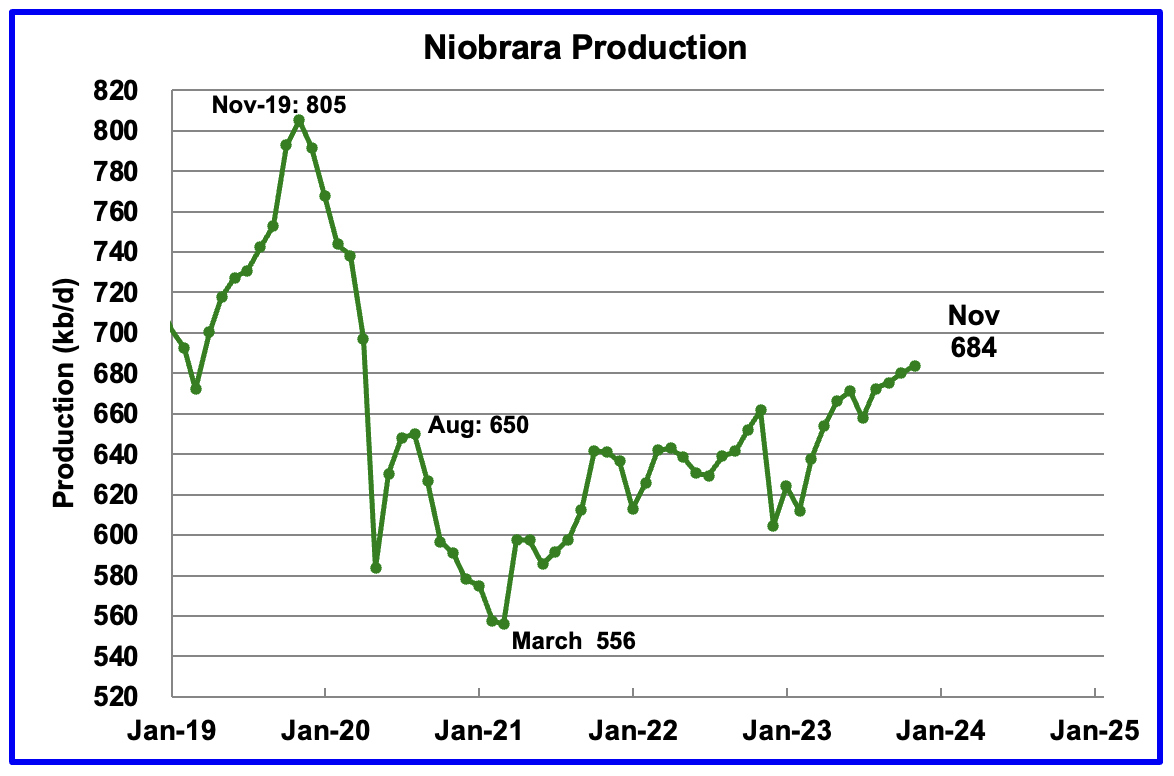
Output in the Niobrara continues to increase slowly. November’s output increased by 4 kb/d to 684 kb/d.
Production increased due to the addition of rigs into the basin but stabilized at 16 ± 1 rigs in March and April. However from August to October, the rig count dropped to 14.
DUCs and Drilled Wells
The number of DUCs available for completion in the Permian and the four major DPR oil basins has fallen every month since July 2020 and continued to decrease in September. September DUCs decreased by 46 to 2,472. Of the 46 DUCs decrease, 14 came from the Bakken and 15 from the Niobrara.
In these 4 basins, 742 wells were drilled while 696 were completed. Both drilled wells and completions are down from higher levels in late 2022 and early 2023.

In the Permian, the monthly completion rate has been showing signs of slowing since the October 2022 high of 535.
In September 2023, 451 wells were completed while 441 new wells were drilled. The gap between completed and drilled wells in the Permian is now very small compared to late 2022 and early 2023.
The Permian, as of September, had 839 DUCs remaining and the completion rate was 451 wells/mth. This means the current cycle time between drilling and completions is 1.86 months or 57 days
156 responses to “US August Oil Production at Record High”
Essentially all that Mike has warned about is coming to pass.
Lightsout,
Mr Shellman has not made any specific predictions as far as I know. I do get the same impression as you that he expects either flat or falling output from the Permian in the future, but it is not very clear when.
It’s gassing out and that is the only prediction I am aware of.
I believe he said Qtr 1 2024 will be an OMG moment.
Andre,
After saying that at his blog he took the post down, so perhaps he changed his mind.
Dennis,
Mr Shellman can speak for himself.
If I had all the answers I would write my own blog.
Thanks for hosting this site. I have learned A LOT from it.
Thx. Yes he can speak for himself, he may think 2024 Q1 or by March 2024 we will see Permian decline, but not clear he has said that, at least to me.
As far as I understood him, yes, the work for this “peak” was done 6 months ago…
Lightsout,
I am more interested in tight oil output, GOR tends to go up over time and some areas are more gas prone than others (Eddy more gas than Lea, Reeves more than Loving, Midland more than Martin, etc).
Svaya,
I don’t see any peak in the real data, the DPR is a model based on rig counts which constantly gets revised as they correct the model month by month, I think we have heard that we will know better in 4 or 5 months for about 6 months or more. But hey maybe the next 5 months will resolve the issue, I do expect slower growth going forward, but I have been claiming that for at least 6 months, through August 2023 I am not seeing it.
I don’t know, models are worse than maps…
My mental model makes me think of 2020 slope but without COVID, maybe other issue…
Svaya,
I do not expect we will see the kind of growth seen in 2017 to 2019 in US oil output in the future. I also do not expect the growth we have seen from March 2021 to August 2023 to continue, but have been saying that for at least 6 months, eventually I may be right. Don’t hold your breath while waiting …
The EIA 914 survey data can be found at the link below
https://www.eia.gov/petroleum/production/
specifically the spreadsheet linked below gives detailed state by state data
https://www.eia.gov/petroleum/production/xls/comp-stat-oil.xlsx
The EIA uses this data for Texas and New Mexico and other large producing states and the GOM (covering about 99% of US crude output). The 914 survey for Texas and New Mexico has the largest producers from those 2 states report their oil and gas data to the EIA each month, this survey covers about 90% of Texas and New Mexico’s C plus C production over the March 2021 to March 2023 period.
The methodology used by the EIA to arrive at their estimates is explained clearly in the document linked below
https://www.eia.gov/petroleum/production/pdf/eia914methodology.pdf
In the comp-stat spreadsheet, data from the 914 survey, the EIA estimate, State level data, and data from Enverus are reported. Note that Enverus uses state pending file data to give more up to date estimates, but even this data remains incomplete beyond March 2023. The Enverus data ends at the 7259 data point called out on chart below, beyond that the EIA 914 estimate is reported for April 2023 to August 2023.
The slope of the 914 survey data from March 2021 to Aug 2023 using OLS is 538 kb/d per year. This suggests the smaller producers have been growing at a faster rate(about 12% per year) than the large producers (about 9% per year.)
In the future we may see the smaller producers reduce their rate of increase ( to perhaps the large producer rate of 9% per year) and as mergers occur we may see a smaller proportion of output from small producers (maybe falling from 10% currently to 5% in the future).
It is also possible that all producers will reduce their rate of output increase in the future, especially if oil prices and natural gas prices fall as some predict.
On state vs EIA PSM data see
https://www.eia.gov/todayinenergy/detail.php?id=22012
Ovi,
You mentioned that you only include the gas from oil wells in your GOR, do you also ignore the condensate from the gas wells for consistency? Often what is classified as an oil or gas well is based on GOR so as GOR goes up the well could be reclassified as a gas well and gas from that well would drop out the data if you only include the gas from the oil wells.
It seems better to include all oil and gas produced in the county when figuring the GOR. I do this in the charts below.
Below is a chart from Reeves county in Texas using data from
https://webapps.rrc.texas.gov/PDQ/generalReportAction.do
The data after March 2023 is likely not very reliable, gas data is more complete earlier than oil data and pushes up GOR for recent months.
Another chart also using RRC data for Loving County, these are the largest producing counties on the Texas side of the Delaware sub-basin of the Permian Bain(these are just south of Lea and Eddy counties in New Mexico in West Texas.)
Dennis
You are fast. As soon as I posted the chart, I realized it was wrong and immediately deleted it within a minute. You will notice the original comment is not there any more and our readers will be wondering why your comment is there.
I started looking into the Oil vs GOR plot and other variations using data for Martin county. By fluke it had a very insignificant amount of condensate and Gas from Natural gas wells. I then looked at Midland and it had bit of NG from NG wells (<1%) but not enough to change the results. So for both Martin and Midland, there is no gas from NG wells.
More recently, looking into more Texas counties, I noticed that a number of them had significant amounts of condensate and NG. So for those, which I have not published, they include all NG and Condensate. I will go back and tweek the Martin and Midland charts so that I can post a few more Texas counties to see if they exhibit the same characteristics as Lea, Eddy, Martin and Midland.
Attached is a chart for Loving starting from January 2021. Looks the same as yours.
It has decling oil production and the GOR is within a semi limited range. I wonder if this means that Loving is well into the bubble point phase and oil production is dropping because the overall pressure in the county is dropping.
Ovi,
Here is Reeves from March 2021 to April 2023.
Dennis
Will the GOR for August fall back in to the 6.5 range or stay above 6.8?
Ovi,
That won’t be known for until a year from now when the data is close to complete.
Ovi,
If we use March 2021 to April 2023 data for Reeves County and take the 2 standard deviation range as the “normal” range for GOR, it suggests about 5.9 to 6.7 for GOR. We will see what happens over the next 6 to 12 months, I think by next June 2024 we will see the August 2023 GOR for Reeves fall back to that normal range.
Ovi, I am glad to hear from you. I responded.
Gas to oil ratios in the manner you were plotting is important; do not be dissuaded from that. Ignore actual natural gas production from Permian HZ wells in various known, productive benches. Nobody is intentionally drilling gas wells in the Wolfcamp, for instance. Some wells can have such high initial GOR that can be reclassified from oil to gas for TRRC proration purposes, thus gaining tight gas status and receiving severance tax exemptions. Its an operator trick. Stay the course you are on; gas to oil ratios is a important metric in saturated sweet spots of core counties. When those core counties are almost entirely saturated, like Lea and Martin, then GOR in the county matters. Basin wide GOR is dumb and meaningless. The Permian IS getting gassier. Why shouldn’t it?
A word on August TRRC Permian production: it is as high as it is (September may be even a little higher) because of operational undertakings from 6-7 months ago when rig counts were 356 /- in the Permian and the de-duc’ing of over 500 wells was underway. Lag time between the spudding of a well, setting pipe, eventually frac’ing it and actually seeing the publicized production data from that well in Texas can take 6-8 months. That is exactly what we are seeing now, production from March, April and May and peak 2023 operational activity.
In May rigs started down… now down 38 in just 5 months. There are few viable DUC’s left at this price level to mask over fewer completions that are now occurring from fewer rigs running. Gassy oil wells are turning into oily gas wells and liquids productivity is declining. The “rig efficiency” thing is dog dookey, particularly as there appears to be sorted effort to drill longer laterals wherever there is room to squeeze them in. All of the above will not come into fruition, the ramifications not actually seen until six months from now, late 1Q2024. Its a good idea NOT to forget that because of front loading well designs, however, great production looks right now…in six months it will be half of what it is because of decline. Some longer laterals and super fracs are declining 70-80% the first 12 months !!
There is nothing magical about any of this, nobody should be “surprised” August is so high; lots of people want, or need to believe all this jerking oil out of the ground is happening in real time…its not. What we see today happened six months ago. Unless 50 rigs come out of the barn, quickly, Permian HZ production is going down.
Which is good !! That means less oil exports in a time of great global uncertainty. America Needs America’s Oil…to stay in North America and/or Great Britain. And Israel.
If I understand correctly, Mike expects lower Permian output by March. I think we might see a slower rate of growth perhaps 300 kb/d annual rate rather than recent 600 kb/d, over the Aug 2023 to Aug 2024 period. Beyond that output might be flat to 2027 and then down due to limited drilling inventory.
Probably Mike will be right.
This is a Bloomberg Youtube audio presentation not behind a paywall:
The Beginning Of The End Of The US Oil Boom | The Big Take
https://www.youtube.com/watch?v=0_bc1wOW9ps
“The shale revolution has powered the US economy, shaken up oil markets, and shaped America’s foreign policy. That may soon begin to change as the growth in shale oil productions slows. Bloomberg Opinion columnist Javier Blas (https://www.bloomberg.com/opinion/aut…) joins this episode to talk about how important the shale bonanza has been for the US, and what–if anything–can ultimately replace it.”
It has more of a geopolitical/finance/government theme.
Great comment by Mike under the post linked below which clarifies the GOR stuff.
https://www.oilystuff.com/forumstuff/forum-stuff/matters-regarding-gor
Comment in response to a comment by Ovi.
It seems GOR is expected to increase up to a point and then slowly decrease after reaching some peak. The chart is unscaled, but based on the Comment by Reaservegrowthrulz, it may be that GOR increases by a factor of 8 to 10 from 6 months output to bubble point, after that perhaps GOR declines. The diagram seems to be based on a conventional reservoir, not sure if a tight oil play sees different behavior due to the low permeability of the geology. Or perhaps the fra
GOR is a diagnostic tool for individual wells but when those wells are closely spaced together in sweet spots, GOR can often be used to judge the health of a sweet spot…and an entire county, yes. Because high grading continues rampantly, sweet spots in core counties matters. Even at $80/2.75, nobody is drilling all that vast USGS “fluff.” As core areas go, so goes counties, so goes sub-basins. As goes New Mexico, so goes the Delaware, so goes the Permian and so goes US tight oil production.
The Schlumberger chart I used was for gas depletion (oil expansion) environments like shalely carbonate resource beds in the Permian. I don’t know what the ratios of increase are, it does not matter to me and it should not matter to anybody else. When liquids productivity is declining it is almost always related to liquids-phase transition and rising GOR. I cannot emphasize enough that matters of Mother Nature do not happen overnight, often take long periods of time and the reason to follow GOR is core areas is what that means for the future.
Are wells on the flanks (T3/4) going to get magically better? Are EUR’s going up, not down, will economics improve, will we have enough oil in America to get us to a reasonably affordable transition to renewable transportation fuels? You decide but I say no. Hell no.
I don’t think it takes a great deal of “courage” to make predictions about the future. I do believe because of lag time, falling rig counts, and declining DUC’s, Permian production will fall late in 2023. It will take 6 months to see that.
I do not pretest to know anything, much less everything; I write a blog to vent and keep me from dealing with dumb people on social media. I also write other things about the industry, including something dear to my heart… the history of well control and my experiences in that. I don’t make money from writing a blog; it is a release and of some historic importance. It’s not important to me that you read my stuff; I am likely going to do anyway as long as I can stand the constant criticism.
Lets not focus on GOR in the Permian Basin and instead focus on why liquids productivity is falling, in ALL benches, and how densely populated these sweet spots truly are and why that is vitally important to the future. “Not yet” is an excuse for lack of insight into what is actually happening.
Thanks.
Thanks Mike.
On the chart you posted on bubble point, is the bubble point reached around the time that GOR is near its peak on that chart? You mention that you believe Eddy county is past bubble point, and a GOR peak does not seem to be apparent.
Data in chart below from New Mexico’s state agency
https://www.emnrd.nm.gov/ocd/ocd-data/statistics/
The 4 core counties of Permian Basin (Lea, Eddy, Midland, and Martin) had about 1360 DUCs in June 2019, the number increased to 1847 in June 2020 and decreased to 1393 by March 2023 based on the most recent Novilabs Permian update. Even with fewer operating rigs, if this DUC number is accurate there may enough DUC inventory to keep the completion rate at 430 to 450 per month for a while which may be enough to keep production rising slowly as the scenario below proposes. EUR for average well is about 432 kbo for this scenario with cumulative at 24 months at about 236 kbo similar to average 2020 Permian basin well based on data at Novilabs. Note that average well productivity (not normalized for lateral length) increased in 2021 then fell back to the 2020 level in 2022 (when not adjusting for lateral length).
Ovi,
For Loving the dropping production after April 2023 may simply be due to incomplete data. One approach might be to take the percentage of state data for each month relative to the EIA PSM estimate for both oil and gas. Then use that as a correction factor for individual counties. Doing this for Loving county I get the following.
A chart for Reeves that does the same type of estimate as in the Loving chart above.
It would be interesting to hear what Reservegrowthrulz thinks about the bubble point issue as I recall him knowing a bit of Petroleum Engineering. These charts don’t tell me much, but I may be missing something, looks like a random walk to me.
Dennis
It’s the breakout to the right that is significant, I think. Check the four charts in the post. Let’s see what happens with Reeves. Will the GOR keep moving out of the random walk range?
Ovi,
Eventually the Permian basin will run out of room for new wells, completion rate will decrease and GOR will rise, that is inevitable. For a well that has reached bubble point the natural gas output first spikes and then plummets, I don’t see this behavior for any of the higher producing counties so far in the Permian basin.
Dennis
My recollection of studying physical chemistry around 60 years ago does not agree with your statement “For a well that has reached bubble point the natural gas output first spikes and then plummets”
What happens is a small amount of gas comes out initially. In other words the single phase mixture transitions to a two phase mixture of say, 99.5% oil and 0.5% gas. As the the pressure drops further there is less liquid and more gas.
That is why you don’s see the spike and then the plummet. What you see is the GOR slowly moving to the right as the pressure drops which is the trend seen in Lea, Eddy, Martin and Midland. See attached article.
Maybe someone who is more current with wells going from a single phase to a two phase solution can way in. It’s lucky that I could still remember the name of the course, let alone its content.
https://topdogengineer.com/lesson/types-of-reservoir-fluids/
Ovi,
That’s a nice web page, thanks.
It is not clear which diagram applies to a typical tight oil well, in the post you linked, it may be that the volatile or even the gas condensate diagram is more appropriate. A petroleum engineer who works in the tight oil industry would likely know. A comment that Mike Shellman had made earlier (or my recollection of what he said) seems to fit the gas condensate diagram better than the black oil diagram.
I never studied this and perhaps you are correct. It has been a long time since I took a chemistry, physics, or engineering course, I have forgotten much of it.
Note that it is natural gas output that spikes and then plummets and not necessarily the GOR.
There is some research suggesting that the behavior of tight oil reservoirs may be different from conventional oil and gas reservoirs because of the nano scale structures of the geology.
Unfortunately I have only read a few abstracts and do not have access to detailed information.
Dennis
I don’t think this is correct “Note that it is natural gas output that spikes and then plummets and not necessarily the GOR”
The course was called Physical Chemistry because it only involved physics, PVT and mole fractions. There are no chemical reactions.
What is being addressed here is the ability of the oil to absorb natural gas. At point 1 in the chart, the oil could absorb more natural gas. What I am saying is if NG were pumped into the well at that pressure, the well would initially have two phases. However over a period of time that gas would slowly be absorbed by the oil and the well would return to a one phase solution. Note that point 1 is defined as being under saturated. It in under saturated of NG.
Slightly below the bubble point some gas starts to come out of the solution/mixture. At that point all of the oil is still there. However what changes is that let’s say for example, 99% of the dissolved gas is still inside the oil phase and 1% has come out and is in the gaseous phase. As more oil and gas come out of the well and the pressure drops, the percentage of NG dissolved in the oil drops and more is in the gaseous phase.
Another way of thinking of this without removing oil think of a tall very strong cylindrical glass with oil at the bottom and NG on top. Insert a piston and push it slowly down to the oil. Provided there is the right ratio of NG and oil, all of the NG would dissolve into the oil. Reversing the process slowly would return the filled glass to its original state.
Ovi,
I understand more gas remains in solution at higher pressure. As oil is removed from the rock pressure will decrease to the point that eventually bubble point will be reached, probably the volatile oil diagram is more descriptive of tight oil plays, the lower pressure results in both lower oil flow and higher gas output as bubble point is reached which increases GOR. The chart Mike presented at his blog suggests GOR eventually peaks and then slowly declines. I would think that rising GOR indicates a well has entered bubble point, but this is more evident when looking at wells from month 1 as in a well profile.
For Lea County average 2020 wells we have the chart below based on Novilabs data. The data is the average of 468 horizontal wells completed in 2020 in Lea County, New Mexico.
Lea County GOR for average 2017 horizontal well, data from Novilabs
Lea County average 2017 horizontal well GOR vs cumulative oil.
Gas is a lot less viscous than oil so it flows faster. When the bubbles join up it doesn’t drag the oil molecules along with it. And as the pressure drops, more gas comes out of solution and the process speeds up.But I haven’t seen examples of individual wells and there should be plenty.
Please see 2 videos I prepared
https://www.youtube.com/watch?v=2wwoUOT4rGE&t=11s
https://www.youtube.com/watch?v=Y06Ix5YuZn0
I only dip into this PVT phase diagram and started to understand its implications better 4 months ago, and before my knowledge is not more than what Scott Lapierre has been teaching about bubble point death.
Basically, most US shale tight oil are light tight oil with GOR close or over 1MCF/bbl, and this put the bubble point above 2800psi, or ~200Bar, and that means not only bottom hole pressure but also all the way up the well bore to the Separator above will suffer PVT bubble point if pressure drop below 200Bar in the casing pressure.
There is a new breed of shale oil now, and Vaca Muerta is one of them, and they showed that the coventional wisdom, i.e. “HG-LTO=ShaleTightOil” is not the only and more superior shale oil. The new breed of shale oil, i.e., Low GOR Black Shale Oil, LGBSO, will outperform HGLTO due to the PVT phase diagram above, because of 2 unconventional facts:
1. LGBSO has much lower bubble point pressure, i.e., 100Bar or even less
2. LGBSO has much lower oil shrinkage after bubble point, this even more dominating in oil recovery, basically not only the gas separated will outrun oil, but oil will shrink and like Scott used toothpaste tube.
Based on the videos above by Sheng Wu, the US tight oil would be best described by the volatile oil phase diagram. Supposedly black oil would have a GOR of less than 0.5 MCF per barrel. The Permian basin tends to be in the range of 2 to 7 MCF per barrel of oil depending on County.
I also just got enlightened again after reading Topdogengineer.com blog about Bo, the formation volume factor for oil. i.e. the rB/stB, or the volume of a barrel of oil at the stock tank on the surface under reservoir condition.
https://topdogengineer.com/lesson/formation-volume-factor-bo/
one immediately recognize that for the same porosity in the reservoir, LGBSO, low GOR black oil actually has almost twice as much oil as HGLTO, high GOR light tight oil! truly unequal when in the reservoir. I made a video based on this Bo number.
https://youtu.be/1wVnCQJ7m4o
When doing company reserves at the well level, the profile tends to be easy to spot, at least in a good example, steady production, consistent care by the welltender, etc etc. The profile tends to be oil and gas decline with a constant GOR. Within a relatively short period of time, the decline for oil steepens, gas increases production even quicker than oil is decreasing (gas ultimately hits 3-4X of original rate), and about 6 months later everything settles down, oil goes back to a consistent and usually shallower decline than during the transition, gas becomes stable at the new rate and begins to decline, and GOR ends at 8-10X the rate it was prior to the reservoir reaching bubble point. .
It was always interesting discussing those wells with the reserve auditors. When they noticed the first one, they began asking when all the rest would do the same, and how did we plan on factoring that in to the other shale wells. These were Devonian shale wells primarily.
Interestingly, shale wells of this same type, in the same geologic formation, didn’t all show this reaching the bubble point profile. I check in on my wells on occasion, for fun, and am amazed that while one might have been a great example of reservoir dropping below bubble point 5 years after completion, others that I did in the same county, same formation, same completion, same production philosophy, are still oil wells 30-35 years after I completed them, and have shown no sign of hitting the bubble point profile.
“Interestingly, shale wells of this same type, in the same geologic formation, didn’t all show this reaching the bubble point profile. I check in on my wells on occasion, for fun, and am amazed that while one might have been a great example of reservoir dropping below bubble point 5 years after completion, others that I did in the same county, same formation, same completion, same production philosophy, are still oil wells 30-35 years after I completed them, and have shown no sign of hitting the bubble point profile.”
How do you explain this?
Gerry
What happens when the oil reaches the surface? If there is no NG to flair, that means there was very little gas in that oil well. If small amounts of NG need to be flaired, it means there is still very high pressure, above the bubble point in the well and there is a low percentage of NG dissolved in the oil. Conditions at formation were more favourable to oil than NG.
I don’t. Oh, I can speculate at length from a reservoir engineering perspective of course, and be generally right, but one thing you learn studying all of this across decades is that the results derived from geology where an order of magnitude change in permeability is lurking in the next foot of rock…and then back again to the original value a foot later, is that just because something happens once in rock here, it won’t necessarily happen in rock over there.
So learn as much about statistics as you can, never forget that only if your get lucky will the assumptions of the Central Limit Theorem apply, and then you pays your money and takes your chances.
This is esseentially applying maximum entropy to the statistics of diffusion coefficients, as described in our book Mathematical Geoenergy. Geophysicists have so much to learn.
To Paul:
Geophysicists knew that your model couldn’t predict global peak oil when you built it and told you so. Have you managed to figure out how to predict the future yet so it won’t fall under the broken clock analogy? Again? 🙂
Reservegrowthrulz,
The future is unknown and any scenario of the future is likely to be wrong.
If we pull up EIA predictions from 2006 or so, we find a total world liquids forecast of 118 Mbpd in 2030, currently they forecast about 117 Mbpd in 2045. Crude plus condensate output for ref scenario for World expected to be 89 Mbpd for EIA IEO 2023.
Reservegrowthrulz,
Thanks. If I understand your comment correctly we should see a relatively rapid rise in GOR to about 9 times higher than before over a short period, maybe less than 12 months.
So far for Permian core counties we are not seeing that behavior.
Correction,
reading Reservegrowthrulz comment more carefully I got it wrong. There may be some wells that exhibit the bubble point behavior and others that do not. Predicting county wide behavior may not be possible or at best may be highly speculative.
Reservegrowthrulz,
Does the black oil phase diagram apply to most tight oil wells or is the volatile oil diagram more appropriate?
See
https://topdogengineer.com/lesson/types-of-reservoir-fluids/
It is not clear which of the first 3 cases covered on that web page is appropriate for tight oil wells (it is probably different from well to well).
Doing the reservoir PVT for each well/block is not easy, so most of the time people use the engineering rule of thumb.
Black verus Volatile oil is defined by rule of a thumb in US oil industry when judging by GOR and API density, i.e. GOR<1.5MCF and or API <45deg on the lighter side, and GOR<1MCF and or API<40deg on the heavier side. By this 2 rules of a thumb, most LTO in US are at the volatile side of the boundary.
This rule of a thumb might not work in other oil and gas system, i.e. the Vaca Muerta, Presalt Brazil and Guyana, where the heavier oil components are obviously more than US marine sourced crude. There, the black oil definition with API and GOR are probably API<35, and GOR<0.7MCF. However, the boundary part of VM oil still have shrinage better than US black oil below bubble point, but then somewhere in betwee got just as bad, and even worse when in the condensate/wet gas window? — that's my reading of the PVT diagram there.
The more detailed dominating parameters for black and volatile oil production are the expansion of oil before and shrinkage after bubble point.
In the vein of folks paying attention to GOR, did you notice this?
https://www.eia.gov/naturalgas/weekly/
Play specific, and a noticeable fluctuation at a point in time a few years ago. I found that interesting, but as with all things, the devils are hidden in the details so now I’ve got to run the same numbers to see if there is an elephant hidden in there, either in one or more of the three, or some subset inside any of them.
Mike S has pointed out that these basin wide looks at GOR are not very useful, I would think that Reservegrowthrulz would agree. In any case I agree with Mike and Ovi that looking at core counties is better, but changes in completion rate over time tends to confound the analysis from my perspective.
Thank you Ovi.
“The main takeaway from The Rest chart is that current production is 755 kb/d below the high of October 2019 and this appears to be a permanent loss that will never be recovered.”
A slightly different take on this- the rate of production from ‘The Rest’ may very well never reach the prior rate, however the cumulative production (recovery) of oil is not necessarily changed at all…just extended further into the future.
Hickory,
It may be that output in those other states never recovers to previous peak, but we may see some level of increase perhaps 400 kb/d over several years if oil prices rise to over $90/b (for Brent, maybe about $85/b for WTI) and remain at that level for higher for a few years. The rest of the US L48 onshore excluding TX and NM has been gradually rising at about 100 kb/d per year since Jan 2022, if that trend continues for a few more years we might see a 400 kb/d increase over 4 years.
Hickory
I think you are correct in your assessment. If you check out the state charts above, you will see who the main contributors are in the Rest: ND, Colorado and Oklahoma. These three account for 548 kb/d of the current 755 kb/d drop. Production is coming back in these three.
A slower rate of production that was extended over a longer timeframe would be a good thing.
Applies to Permian as well.
In Azerbaijan, oil production with condensate will decrease by 6.7% in 2023
03 November / 15:16
Baku. Oil production with condensate in Azerbaijan in 2023 compared to 2022 will decrease by 6.7% – to 30.5 million tons. This assessment is indicated in the conclusion of the Accounting Chamber on the country’s draft state budget for 2024.
In 2024, as noted by Interfax-Azerbaijan, oil production in the country will decrease by 1 million tons or 3.2% compared to 2023, and will amount to 29.5 million tons.
In 2022, oil production with gas condensate in Azerbaijan amounted to 32 million 667.7 thousand tons (a decline of 5.5%).
In Azerbaijan, oil production will exceed 34 million tons in 2022-2024
December 21, 2021/ 13:12
Baku. It is predicted that in 2022-2024 more than 34 million tons of oil will be produced in Azerbaijan. This was announced by the Minister of Energy of Azerbaijan Parviz Shahbazov.
“Following the dynamics of gas production growth, it is expected that in 2024 it will reach 50 billion cubic meters. m,” Trend quotes Shahbazov.
According to him, by the end of November 2021, about 7.3 billion cubic meters. m of natural gas were transported to Europe under long-term contracts and short-term spot operations.
“Thus, this contributed to the supply of natural gas to European consumers on more favorable terms and ensured energy and environmental security. In addition, Azerbaijan has the potential to increase supplies to Europe. If European consumers have additional demand for gas, appropriate steps will be taken in this direction, and in the future the geography of our supplies may be expanded. Gas supplies may begin to the Western Balkans region and to a number of other countries in Eastern Europe,” Shakhbazov said.
——–
________
In April, Azerbaijan lagged behind the OPEC+ quota by 172 thousand barrels. per day
May 12 / 16:08
Baku. Oil production in Azerbaijan in April 2023 amounted to 512 thousand b/d compared to the March 2023 figure of 515 thousand b/d. The country’s Ministry of Energy reported this.
Daily oil production with condensate amounted to 626 thousand barrels, of which oil production accounted for 512 thousand barrels, condensate – 114 thousand barrels.
As of April, Azerbaijan’s oil production quota under the OPEC+ deal was 684 thousand bpd, Interfax-Azerbaijan reports. Thus, in April, Azerbaijan fulfilled the OPEC+ deal by 133.6% (lagged behind the OPEC+ quota by 172 thousand bpd).
US L48 Onshore C plus C, about 88% of the average annual increase in C plus C output over this period from Texas and New Mexico (619 kb/d of 702 kb/d.) Based on this chart and an earlier chart, the US L48 onshore minus TX and NM has been increasing at about 83 kb/d on average over the March 2021 to Aug 2023 period, earlier I estimated by eye that the increase was about 100 kb/d (I over estimated).
Rig and Frac Report for November 3
Rigs Down. Fracs Down
– US Hz Rigs were down 8 to 443
– Permian rigs were down 4 to 292. Texas dropped 6 while NM added 2 to 91. Of the 2, 1 went to Lea county and the other to Eddy. In Texas, Reeves lost 3 and Howard 2. Martin added 2.
– Eagle Ford was unchanged at 47
– NG was down 1 to 105 (not shown)
Fracs down 5 to 270
Can anyone explain this to me? The United States consumes 20 million barrels of oil every day and produces 12 million barrels. But the United States has become a net exporter of oil since 2019. How did it do this?
Yes, that is easily explained. The 20 million barrels per day is total liquids. That includes NGLs, biofuels, refinery process gain, and any other type of liquid fuel that might be produced. The 12 million barrels per day is crude plus condensate only.
Some of that 20 million must come from somewhere else? Meaning, the US exports oil because the US imports oil as well…?
Mike B,
The US produced about 19.5 Mb/d of C plus C plus NGL in August 2023. There is also refinery gain and biofuel production. About 1000 kb/d of biofuel was produced in Aug 2023. Total inputs to refineries was under 20 Mb/d and refinery gain was roughly 1000 kb/d.
The net exports of the US are mainly in the form of LPG. For the stuff that matters such as crude, diesel, jet fuel, gasoline and residual fuel the US remains a net importer.
“Meaning, the US exports oil because the US imports oil as well…?”
Yes, this is the creative book-keeping that TPTB don’t want to admit to doing. Unrefined IMPORTED crude oil is relabeled as DOMESTIC USA product after being refined. Hard to pin it down exactly but it is likely several million barrels/day.
Overall, it is an essential factor to consider when interpreting the 12 million barrel extraction versus 19.5 million barrel consumption disparity.
Paul,
The main discrepancy is NGL, biofuels, and refinery gain, the consumption number is total liquids including LPG, not really a useful number.
Here are the figures up to August.
https://www.eia.gov/petroleum/imports/companylevel/
The US exports oil because it imports oil.
MikeB,
Better page at link below
https://www.eia.gov/petroleum/data.php#imports
At page below we have imports
https://www.eia.gov/dnav/pet/pet_move_imp_dc_NUS-Z00_mbblpd_m.htm
at page below we have exports
https://www.eia.gov/dnav/pet/pet_move_exp_dc_NUS-Z00_mbblpd_m.htm
For Aug 2023 total exports were 9998 kb/d and total imports were 8968 kb/d, the difference is net exports (exports minus imports) which was 1030 kb/d in August 2023, this is the number we focus on. The total number includes C plus C, NGL, and petroleum products including LPG (propane, ethane, and butane). The US net export of NGL is 2396 kb/d, so if we assume as I do these products are of less importance (these are used mostly for petrochemical industry and heating and not very much of these are used for transportation) then the net exports are an illusion. For the stuff that matters (crude oil, diesel, gasoline, jet fuel, and residual fuel) the US is a net importer at about 1400 kb/d in August 2023.
Must make a Sankey diagram of this import/export apportionment showing how all the flows split up.
https://pbs.twimg.com/media/Fi1PerYWIAAYGLb
Oil produced from the sands in Alberta is so very different from the oil produced in the Permian basin. A refinery will buy the type of crude that it requires from wherever it has too. The gulf refineries cannot refine the volume of oil the Permian produces so the excess is exported.
I think markets made a turning point last week. Yields on the 10 year Treasury peaked out in inter day trade at 5% only to pullback hard by end of week. As jobs data was soft.
Likely trend through year end is lower bond yields, higher stock prices and lower oil prices all on softer data that continues to confirm economy is cooling fast.
I think the Saudi’s likely will have to cut production again within 6 months or prices are really going to tank.
Any short term price spike due to war will just cool the economy faster than it’s already cooling.
Think we will likely see some dollar weakness here as oil prices and bond yields rollover lower.
As asset prices or maybe better stated would be as collateral values go up. Dollars available will increase. But will likely only benefit stocks and bonds. Because the real economy is slowing.
So it would appear that Peak Oil is NOT here (again)- in the US.
Peak Oil forecasters make the same mistakes over and over; they base their predictions and models on two completely false assumptions:
1. We know how much oil is underground- even though there is NO way to prove this
2. We know the limits of future technological advances in extracting this oil – even though there is NO way anyone can predict the limits of science
How many times do the models have to fail before folks can finally admit they have know idea when Peak Oil will occur? When do people finally bow to cold logic and accept that these two assumptions are completely unscientific?
CB, get a life. No one has ever stated that peak oil depended on when the USA would peak. Peak oil, so far, was five years ago this month, November 2018.
Of course, we do not know for certain when peak oil will occur or did occur. We can only speculate. Today, we are still about four million barrels per day below the peak in November 2018. I am doubtful that that peak will ever be surpassed. But it might be. But if it is it will be only by a minor amount, and only for a short while. It is obvious that we are currently on the peak plateau and have been for almost a decade.
Your post is obviously bullshit, attempting to sound profound. Stop posting bullshit in an attempt to imply that you really know what is going on. Obviously, you haven’t a clue.
Lots of anger there Ron. I haven’t seen you this angry since you were laughed off the Oil Drum for your failed predictions
C8,
We have not heard any predictions from you. Would you care to offer one, or do you want to hide like a coward?
What a stupid thing to say, Kate.
I love it when someone infers a writers emotional state after reading a comment. “Anger”; really Kate? What about Ron’s comment is “Angry”; he’s just pointing out bullshit.
Not exactly captain of the debate club, are you? Maybe stick to chatting on the socials with the dumb fucks; Twitter, or X, or whatever numb nuts is calling it these days.
For conventional oil, the forecasts of oil peak have been quite good as in 1956, Hubbert predicted an oil peak production in 2000 while it occured in 2006 according Fatih Birol. About oil production in USA, the fact that most of the most productive counties of Permian are past the bubble point phase should humble you.
Yes, the next world peak is imminent, each drill rig has gotten 10 times more efficient, so even though only 2 out of 3 drill rigs are still drilling when compared to 5 years ago, magic happens.
Covid confiscated the visibility of the peak, EVs further create the illusion that demand is not high enough to stimulate a future peak…all this while 1P oil reserves are only ~250 Gb (less than 10 years supply)…
How stupid does one have to be to think a future peak is in the cards…out of world wide oil produced to date (1,500 Gb) only 150 Gb of the good stuff remains. If the oil age started in 1950/1960, then it’s 70 years old, and only another 7 years remain…don’t need science for any of this, just common sense…
Kengeo,
1P reserves don’t tell us a lot, 2P are more useful, but only if we account for reserve growth. USGS estimated about 3000 Gb for total conventional C plus C resources about 23 years ago (with reserve growth accounted for). Unconventional resources will add some more, at least 200 Gb. My expectation is that conventional resources may be less than 3000 Gb due to peak demand by 2030 to 2035, but my estimate of World C plus C URR of 2800 Gb (conventional plus unconventional) is conservative and may prove to be too low.
Dennis –
While any of those amounts MIGHT be possible 2,500 to 3,500, or even 4,000…you can’t ignore the reality of the 2018-2019 peak. You assume far too many variables remain unchanged for URR of 3,000 Gb to be achieved. For the next 25 years, average production will be 40 mb/d plus or minus 15 mb/d (200 to 600 Gb).
Worldwide production would need to be increasing annually for another peak (it is not), worse, the underlying conventional oil has been in decline for 15-20 years or more, with 75% to 80% of worlds cheap oil used up, a future peak seems like a most unlikely scenario.
I’m impressed that oil prices are as low as they are right now, can’t imagine that can last much longer…
Kengeo,
Many have been convinced in the past that the lower URR estimates must be correct, they have mostly been proven wrong. As I have pointed out before, cumulative World C plus C output at the end of 2018 was 1358 Gb, what URR does that suggest?
From 2020 to 2022 World C plus C annual average output was 76, 77.2, and 80.7 Mb/d, an average increase of roughly 2350 kb/d over those years. I expect slower increases in the future of about 767 kb/d each year over the 2022 to 2025 period, then flat output for 3 years followed by decline.
If you are right and Dennis is wrong then Palestinian uprising issues and broader middle east conflict will end arab oil when there is no left so cover up false advertising…
OPEC oil output rises for third month, Reuters survey finds
– OPEC output rises 180,000 bpd from Sept. – survey
– Iranian production hits new 2018 high of 3.17 million bpd
– Quota-bound members undershoot implied target by 560,000 bpd
LONDON, Oct 31 (Reuters) – OPEC oil output has risen for a third straight month in October, a Reuters survey found on Tuesday, led by increases in Nigeria and Angola and despite ongoing cuts by Saudi Arabia and other members of the wider OPEC alliance to support the market.
The Organization of the Petroleum Exporting Countries has pumped 27.90 million barrels per day (bpd), the survey found, up by 180,000 bpd from September. Production in August had risen for the first time since February.
Clearly Iran is taking advantage of the SA and Russia cuts as it increases production. Also looking at the price action of WTI over the past week, it indicates that supply may be closer to demand than what was indicated in last months OPEC MOMR. Q3, according to the MOMR, indicates a draw of close to 130 Mb and the daily shortfall Q4 was close to a daily shortage of 3 Mb/d. The current WTI/Brent price action would indicate otherwise.
https://www.reuters.com/business/energy/opec-oil-output-rises-third-month-reuters-survey-finds-2023-10-31/
Ovi, … “Iranian production hits new 2018 high of 3.17 million bpd”
I thought it was 2023, must be dreaming… Yes I know you quoted the article. I think this is what happens when people allow AI to write the story… At least later they clarify to highest since sanctions in 2018…
Hideaway
AI is just a baby, maybe one or two years old. It doesn’t have enough memory yet. 🤣 🤣 🤣
The price action acts to other laws.
For the traders the deficit is old news, so it doesn’t bother them. As I always said, as long as there is enough oil on the market to fill any order (commercial stock is round about 1.2 billion barrel, falling at the moment) they can game the prices wherever they want and they have money.
Money is enough in the market, perhaps now it fuels mainly a huge stock and bond short squeeze. But going from oil prices to stock of oil or supply isn’t a valid method – most oil trade is done with chart technique and KI supported trading desks, they see their lines and charts and stuff. News only bothers them as one day input. It’s the same with stock trading.
True prices are only seen when the tanks are full or empty – full we have seen at the COVID bottom when WTI went negative. With empty tanks we’ll have to see, but it will be high. Apple stock alone is as much worth as a year of oil sale – so there is a lot of money to push prices up.
And for HHH, there is enough collateral in form of US bonds. The treasury sold 1.5 trillion in additional new bonds last 2 quarters (and will sell 800 billion in the 4th), so everyone who needs the stuff can buy enough of it since there is no more QE. With the usual money creation ratio of 1:10 in banking system you can create 15 trillion new $ from this collateral alone – more than enough to drive oil over 200$ if the gulf explodes.
Central banks are selling treasuries to get dollars. Because it’s cheaper than trying to borrow those dollars through REPO.
Dollar shortage is real and it’s huge. And no FED can’t provide dollar liquidity in Eurodollar market. Which is why we will continue seeing dollar denominated reserves disappear. Globally!
A lot of these newly issued treasuries are getting locked up by money market funds and just aren’t going to be available for use.
Just because they issued a massive amount of new collateral doesn’t mean it available and available to those who need it most to rollover debts.
Inflation and excessive money creation isn’t The problem. Lack of collateral and cost to borrow collateral and cost of using collateral to borrow dollars is the problem.
My $25 oil call has always been based on the potential and likelihood of the REPO market having an absolute meltdown and interest rates blowing out in REPO due to collateral. It’s hard to nail down exact timing. But I think we are a whole lot closer than we were say 2 months ago.
It’s going to become prohibitively expensive to borrow dollars via collateral via REPO.
New Permian update from Novilabs
https://novilabs.com/blog/permian-update-through-july-2023/
Nice data to look at.
At a first check:
Overall permian well quality goes down. But checking Exxon, they are still at their top quality, and Pioneer is also only down a very small bit.
So the big still have good acres, and the rest starts pumping air (so the overall numbers are getting bad).
Nah. A 20% decline in IP180 for Pioneer wells in the past 3 years is a big deal (Novi), as is a 25% decline under the same parameters for EOG, Chevron and Oxy (Mike). Exxon has to be that high, I will check. XOM and PXD both ate the heart of their watermelons plumb out and Exxon bought little but rind from PXD in the Midland Basin, period. Prices are going down and costs are going up.
Those sort of short well life declines equate to declines in EURS of 30-40%. That hurts well economics, badly, reduces operational cash flow, reduces dividends to folks still believing in this stuff and reduces CAPEX for new wells.
Nobody has any “good” acreage left in the Permian. I wish people got that.
I did only a fast look and it didn’t look that bad at pioneer on the first glance.
But the more severe thing is: When the center companies have slightly worse results, the outer companies have much worse results, resulting in the all average falling well quality we can see.
And with dropping oil prices now (traders assume we are in a surplus state again, and US growth will out produce any cut from the OPEC), these marginal producers need a lot of OPM now to continue drilling their 2nd quality wells now.
Together with rising interest rates this is a poisonous mix. I think we will see further dropping rig counts, and lot’s of bs in financial magazines that oil companies are more efficient now and don’t need rigs anymore to increase production. Which causes more oil price droppings since price is determined by the future traders and auto trading news scanning KIs – as long as there is enough oil in the market to keep refineries going.
Prices are falling due to demand issues. Might look like over supply. But it’s really just the economy cooling fast.
With OPEC cuts and war premium in place and prices are still falling tells you demand just isn’t there.
Really?
I read they think the demand in China COULD be falling 2024. Otherwise, for a cratering of more than 2mbpd over 4 months we need to be in a severe depression right now.
Last numbers where China demand still higher than 2022:
https://www.iranoilgas.com/news/details.aspx?id=25861
Not exactly a demand collapse, but a solid growth. China is the most important source of additional oil demand.
You can forget the US storage report – ordering a few tankers late or early manipulates these numbers and does nothing to world wide storage.
I think it’s with this oil price fall as with stocks: The price makes the story. The price moves, and then the reporters make a story out of it.
Mike,
If we look at data from recent Novilabs post on Permian and pull up Pioneer wells from 2019 and 2020 at 6 months the 2020 well has cumulative output (oil only) that is 6.5% less than the 2019 well, at 32 months the 2020 well has 5.4% less cumulative oil output than the 2019 well, so it is not clear that the EUR will be much lower than the IP180 decrease indicates.
From 2019 to 2022 (not accounting for increased lateral length which will tend to decrease normalized productivity in barrels per foot of lateral) the average annual decrease in cumulative output at 8 months for Pioneer Natural Resources wells was about 2.7% per year. For the limited data we have for 2023 wells (about 3 months of incomplete data) for Pioneer the average 2023 well has cumulative output at 3 months that is about 1% less than the average 2019 well.
In its latest report Novi is quoted directly as saying PXD’s initial well productivity has declined 20% in three years, in spite of longer laterals and dramatic increases in proppant loading. PXD’s new longer lateral well design comprised 22% of total wells drilled in 2022. Those front loaded wells decline upwards of 70% the first 14 months of production life. Start a DCA at month 14, with 14% annualized decline rates, that are accelerating, take into account increasing GOR, WOR and OPEX… EUR’s are headed way down.
It’s just common sense. Try it sometime, you might be less confusing to people who seek simplification. We might avoid all this pettiness if I agree that you are always right and I am always wrong; how dat?
Mike,
Yes normalized well productivity has decreased more. I don’t have access to lateral length data, only what is available at the Novilabs blog.
As you have pointed out in the past, longer lateral lengths will result in lower productivity when normalized for lateral length. So if we take a 20% decline over 3 years that is about 7.2% decline per year for normalized productivity per foot of lateral. When not accounting for the increased lateral length the productivity decreases by about 2.7% per year, the difference is 4.5% and some of this may be explained by the increased lateral length, though potentially higher proppant use might also play a role and perhaps other changes such as closer spacing of wells or other changes in well design and also poorer quality locations may be part of the explanation.
I use the data to estimate EUR. For the average 2020 Permian well it is about 432 kbo, 2022 wells may be similar based on first 8 months of 2022 data.
If PXD is using a higher proportion of longer lateral wells in 2022 compared to 2021, it may explain the lower productivity, though based on a paper by Novilabs lower productivity due to longer laterals is more of an issue in the Delaware basin than the Midland basin where PXD operates.
Chart for Permian basin 2020, 2021 and 2022 average well profile from
https://novilabs.com/blog/permian-update-through-july-2023/
At 8 months cumulative output for average 2022 well is about 3% higher than the average 2020 well, but note that this does not account for the longer average lateral length in 2022 compared to 2020. When we account for the roughly 10% increase in lateral length over this period, the normalized productivity (output per foot of lateral) is about 7% lower in 2022 compared to 2020 (an annual rate of decrease of about 3.6% per year over 2 years).
If you can’t afford to get the correct data, why selectively use the wrong data? You are confusing people. Intentionally, I suspect. Attached, 2023 initial productivity from the Permian with a few additional clicks.
to dramatize the difference in decline of the Permian curves versus Vaca Muerta volatile and Vaca Muerta low GOR black shale oil, I made this video
https://youtu.be/ykF-5MeYP54
Mike,
To look at 2023 vs 2020 we get this chart below. At 3 months cumulative in 2020 was 59152 barrels, in 2023 at 3 months cumulative was 57711 and that data may be incomplete (not all wells have reported their output in the RRC database). I chose not to show it because the data is likely to be revised higher in the future. I don’t have a subscription to the Novilabs database as it is an expensive proposition, so I do not have lateral length data for 2023. Average output may be lower in 2023, I think it is too early to tell. The annual rate of decrease over 3 years is less than 1% per year for total productivity at 3 months IP the decrease in normalized productivity would be larger. If we guess that average lateral length was about 9000 feet in 2020 and about 10500 feet in 2023 (I do not have the data this is a guess). then normalized productivity decreased by 16% over 3 years, an average annual rate of decrease of about 5.8% per year.
This is total Permian Basin all operators for wells with first flow in 2020 and 2023.
A wise oil man pointed out in the past that longer laterals will result in lower productivity per foot of lateral. Operators balance this against lower capital costs per foot for a longer lateral well, the operator decides which length lateral is most profitable.
It is not just the IP 30,60 or 90, it is the decline rate after IP90, 1a, 2a, 3a that is really worrying.
Sheng Wu,
For the Permian Basin the change in well profile shape has not been very significant since 2016. Not clear what 1a, 2a, 3a means.
I have a long standing relationship with the founder of SPC, now Novi; they actually have one of the better data presentation formats in the industry, better than Enverus, IHS and WDB, which I also use sometimes.
I recommend that people click on the link above and go straight to Novi’s Permian Update for July. It’s easy and fun to use. Think of it as buying an actual Rolex and not all the selective, “knockoffs” you are being sold here. Read what Novi says about well productivity, Pioneer, particularly, and Exxon, and decide for yourself.
Remember, just like here, Novi is selling good news. It can be bias in its interpretations of its own data. If it were to say the tight oil phenomena looked like it was going to hell in a handbasket, that would not be good for business. Sort of like models predicting the future.
You have to know what it is you are looking at and what it means. Here sometimes you are told to ignore the trees and focus on the forest, until its handy to focus on a few trees. It’s confusing, I know. Confusion can often be the goal.
Mike,
I select specific data to try to clarify, same as you. You may find it confusing, I apologize, I try to be clear, but anyone can try to muddy the water.
I agree anyone can go to Novilabs and get the full story. Link below.
https://novilabs.com/shale-oil-and-gas-insights-blog/
Well profile for Average 2020 Permian well below based on data from the June 2023 Novi Permian update (at that point we had data out to 28 months for 2020 average wells.)
People can also select the top 5 producers (I got this from the top 10 producers tab at the Permian post at Novilabs.) I stated clearly that the data is not normalized for lateral length as the data is not available. Anyone can go to the Novilabs page and create the same chart.
Here is a link to the chart for the top 5 Permian producers well profiles.
https://public.tableau.com/shared/5TF82M3YM?:toolbar=n&:display_count=n&:origin=viz_share_link&:embed=y
Just double checked top 10 chart and I mistakenly left EOG out of top 5 group of producers, here is top 6 with EOG added to 5 operators included before, sorry for the mistake (previous charts were top 6 minus EOG). Chart linked below is Conoco Philips, Diamondback, EOG, Exxon Mobil, Occidental, and Pioneer from 2017 to 2023 well profiles are not normalized for lateral length.
https://public.tableau.com/shared/FGNWG7NG8?:toolbar=n&:display_count=n&:origin=viz_share_link&:embed=y
Link below to chart for Top 10 producers (Top Operators tab gives top 15 producers not top 10) This adds Chevron, Devon, Endeavor, and Mewbourne to previous list of 6 Operators, again well profiles are not normalized for lateral length.
https://public.tableau.com/shared/6Z49SJGJ6?:toolbar=n&:display_count=n&:origin=viz_share_link&:embed=y
https://mishtalk.com/economics/record-number-of-supertankers-heads-to-the-gulf-to-export-us-oil/
“Forty-eight vessels are bound for the country in the coming three months, according to data gathered Friday by Bloomberg. That’s the most in at least six years.
US producers are increasingly sending low-sulfur “light-sweet” oil overseas, while many domestic refiners prefer to fill their slates with heavier grades that yield more diesel-type fuels.”
Eagle Ford Well Productivity Heading Into The Toilet…
No Comment Necessary.
steve
Permian Well Productivity Rolling Over…
No Comment necessary.
steve
Permian Well Productivity Rolling Over Regardless Of 3-3.5 Mile Lateral Turds…
No comment necessary.
steve
ExxonMobil Completes (7) 3.5 Mile Lateral Turds & Can’t Outperform Permian Average
No comment necessary.
steve
Novi labs has a good paper on decreased normalized productivity as lateral length increases, this is expected.
See chart below from link below where full paper can be downloaded.
https://novilabs.com/resources/urtec-2022-the-diminishing-returns-of-lateral-length-across-different-basins-id-3723784/
For some basins an increase in lateral length from 5000 to 10000 feet results in a 15 % drop in productivity per foot. For the Midland basin it is only about a 4% drop for the high proppant intensity case, in the Delaware Basin it is much higher about a 17% drop in normalized productivity for the high proppant case.
One very specific technical parameter in longer lateral fracing design that is often overlooked by NOVI AI tools is the stage length, and cluster numbers. The longer the lateral probably translate into longer stage length, more clusters per stage along with the absolute number of stages, and according to JPT below, the number of clusters will reduce the fracing uniformity, pumping speed which is the most important issue.
https://jpt.spe.org/after-years-of-ever-longer-fracturing-stages-some-engineers-say-shorter-can-be-better
Sheng Wu,
No reason to assume longer stage length, but we don’t have that info, or I don’t. I assume if an optimal stage length has been determined an operator will stick with that design. That’s how I would do it if it were my well.
Interesting article thank you. It seems based on this that the optimum design is still a moving target. Much of this information is likely proprietary and not available to Novilabs in public databases.
I actually dug further in the “stage length” issue and found that the stage numbers really make up a huge portion of the time for frac crews, it often takes longer to run the down-hole wireline to put in bridge plug, perf the next stage clusters, and then pull out the gun before next pumping. Often, it could run 1-2 hours, close to or longer than pumping. That’s why simultaneous or zipper frac of two or 3 well might make up some of the time.
Obvious, the deeper the well the longer the time for wireline up and down, and obviously it is my guess that Marcellus has been actively or agressively adding the number of stages and shorten the stage lengths, and it might explain that they see obvious improvement in well performances, more than Permain. In shallower WV Marcellus, the stage number almost doubled while stage length dropped by 30~50%, and the resulting IP 1-2year increased 25~55%! since 2020.
you could find the stage info from WV Marcellus here, below are 2 wells TIL in 2020 (11Kft) and 2016(9kft)
https://www.wvgs.wvnet.edu/oginfo/pipeline/pipeline2.asp?txtsearchapi=4705101779
https://www.wvgs.wvnet.edu/oginfo/pipeline/pipeline2.asp?txtsearchapi=4705102075
Post below looks at economics of longer lateral wells 10k vs 15k lateral length and assuming reduced capital cost of 15% per lateral foot for the longer lateral well.
https://www.tgs.com/weekly-spotlight/10-13-2023
Bottom line for Midland Basin is that despite reduced productivity per foot of lateral (Novilabs estimates only a 2% decrease in normalized productivity for Midland basin when lateral length increases from 10k to 15k lateral length in a 2021 paper), if capital cost decreases by 15% the IRR increases. The post I looked at may not have accounted for potential increases in operating cost with the longer lateral well, we also don’t have long term data on the longer lateral wells so long term EUR for 15k lateral lengths may be unknown (the post used data for only the first 18 months for 15k wells and used a model for future months that may be inaccurate). My models suffer from the same problem, for a 2020 well for example I have data out to 32 months, beyond that I can assume a hyperbolic profile fit to the first 32 months of data with terminal decline at 12.5% per year, but that guess could be wrong.
D COYNE,
Regardless… a TURD is a TURD, even if it is a 1 Foot TURD or a 3 Foot TURD.
steve
Dennis
I think this is the critical statement in the article.
“In contrast, well economics benefit from producing additional barrels sooner, translating into extra free cash flow, especially at current oil prices of around $80/bbl (our base case scenario)”
They get their invested capital back sooner.
Steve,
Comment: Hardly would call these “Turds”. Two of the most recent John Brauns have outstanding economics…
After less than five months of production, oil cums are impressive:
-John Braun A Unit 4 #2509BH – 390,475 Bbls and still making ~2,000 BOPD
-John Braun A Unit 4 #2520SH – 144,174 Bbls and still making ~1,000 BOPD
Not sure what’s not to like here, they are both likely at or past payout after only 4 full and 1 partial month of production.
Some of the older attempts aren’t quite, as good, I grant you…. but Exxon appears to have now scienced it up.
Gungagalonga,
For these 8 wells at RRC over first 8 months average output per well is about 287 kbo cumulative, if we downsize these wells to a typical 10k lateral from their 3.5 mile length that would be 155 kbo per ten thousand feet of lateral over first 8 months. An average 2021 well in Martin county (2021 was the high point) had an average output of 139k. So if we assume the average well in 2021 was about 9000 feet, that would normalize to about 154 kbo for a 10k lateral, roughly the same as these Braun Units. So basically they are average wells as a group when normalized for lateral length in this core area of the Midland Basin.
Thanks Dennis, good point. It’s interesting that indirectly… an average well by those metrics appears to be paying out in months in the core.
I need to search for the above average examples to get a relative feel!
Gungagalonga,
For the average Permian well at a well cost of 14 million and WTI at $75/bo and NG at $3/MCF, payout is at about 52 months. Discounted net cash flow over the life of the well (assumed to be shut in at 15 bopd) is about $15 million in 2023$ with a nominal discount rate of 10% per year and price assumptions above. NGL assumed to sell at 30% of crude price. The average well at this set of prices barely makes money. The net cash flow over the life of the well (not discounted) is about 18 million on a 14 million dollar investment over 171 months (14.25 years). So an ROI of only 28% or an annual rate of return of 1.8%. There are better ways to invest money with much lower risk. It is amazing that they continue to do this at these prices.
If we assume WTI increases to $95/b over life of the well with NGL at 30% of crude price and NG at $3/MCF and all other costs the same as previous example. Then over the life of the well net revenue (not discounted) is $25 million so ROI is 78.6% over 14.25 years an annualized return of 4% per year. The well pays out in about 25 months in this case. At 6 years net revenue is 20.9 million, ROI is 49.2% and annualized return is 6.9% over those first 6 years. A large operator may choose to sell off the lower producing wells at this point if a buyer can be found. Oil output is about 47 bo/d for the average Permian well with first flow in 2020 at the end of 6 years. Note that the average 2022 Permian well looks to have a well profile similar to the average 2020 well (when neither is normalized by lateral length.)
THIS is actually pretty good stuff, Dennis.
It’s always amazing to me how many people in the the US, particularly those that rely on the tight oil facade for money, will take $80 oil prices, multiply that x 1000 BOEPD and tout amazing well economics. Those people desperately need for you to believe in their miracle. “Every well being drilled today is a ‘cash cow,’ an ‘ATM machine for profit;’ 4 months to payout ?!! Whoa Nellie !! They know that is not correct they are just hoping we are too stupid to know.
I agree with your economics, pretty much. At $80 I can make a case for $45 net back, incld. gas and gas liquids, and on a $14 MM, 15K ft. long well that requires 300,000 BO to reach payout.
With decline rates on these so called, “monster wells” approaching 70% the first 14 months of production, how do you replace this decline rate with wells that only make 180-200% ROI over 12 years? How do you keep drilling wells from cash flow, pay dividends and in many cases still service and deleverage debt? Answer: you can’t.
Its partially why rig counts are going down. With no outside capital to keep it all rolling, the tight oil sector can only do what it’s doing. It cannot stand on its own financial legs without outside money, without more debt. Folks will see what that means soon enough.
https://mishtalk.com/economics/why-are-americans-in-such-a-rotten-mood-biden-blames-the-media/
Mr. Shellman, I drank a bottle of wine and then said “F it”
And posted links to your blog on the above site.
Mish used to talk about Peak Oil….but I think he has been deluded that USA is energy independent.
Anyway, I think he will listen to u and he has a BIG audience.
From a maintenance issue, there has to be a big discrepancy in maintaining those longer laterals to get 10 years or more of production. Not an oil guy, but I can only imagine trying to fix a collapsed or damaged pipe 3 miles down is fraught with challenges that could easily lead to early abandonment of the longer lateral wells?
Mike,
Thank you. Maybe I am starting to get it. Thanks for all you have taught me, I still have much to learn.
I was thinking $14 million for a 10k well, but my OPEX estimates may be too low and there is much I do not know so no doubt I am probably missing stuff in my analysis.
Glad to know it is at least roughly in the ballpark.
Things do not look good at $80/bo, it is amazing that output has continued to increase, I don’t understand it.
A few people on this thread had recently expressed hopes for SMR’s (small modular nuclear reactors), so I’ll give this update here.
The one design that had obtained approval by the NRC after about 20 years of work has had their prototype project canceled. The economics were just too unfavorable and utility partners dropped out. If they do get revived at some point the prototype project won’t be live until sometime in the 2030’s, rather than late this decade.
https://arstechnica.com/science/2023/11/first-planned-small-nuclear-reactor-plant-in-the-us-has-been-canceled/
https://www.nuscalepower.com/en (down 28% in after hours trading)
There are a few other companies working on designs as well, none having achieved final design approval yet.
Hickory,
Those poor folks who are taking lots of SMR Hopium Pills, need to understand that the hundreds of thousands of parts that go into manufacturing any possible future commercially viable SMRs comes from a Massively Complex Global Supply chain that is fueled by DIESEL.
Thus, LOGIC suggests when DIESEL supplies begin to decline, so will the breakdown in the Complex Global Supply chain and the ability to make those hundreds of thousands of parts to manufacture a commercial viable SMR.
Maybe one day, someone realizes these PARTS won’t be made by the ENERGY TOOTH FAIRY.
steve
“How many nukes are made using only nuclear power?” Therefore nuclear energy is completely non-viable, goes the argument here.
That isn’t the argument. The argument is that nuclear power, just like solar and wind, is an accessory of a fossil fuel powered economy. Which is true.
Hickory
Can you provide any background on the GE Hitchi SMR? I assumed that this SMR had some type of certification.
Clarington, ON – Today, Ontario Power Generation (OPG) is announcing it will work together with GE Hitachi Nuclear Energy to deploy a Small Modular Reactor (SMR) at the Darlington new nuclear site, the only site in Canada currently licensed for a new nuclear build. Leveraging a strong Ontario-based supply chain, this clean energy project will create jobs across the province and cement Durham Region’s position as the clean energy capital of Ontario.
OPG and GE Hitachi will collaborate on the SMR engineering, design, planning, preparing the licencing and permitting materials, and performing site preparation activities, with the mutual goal of constructing Canada’s first commercial, grid-scale SMR, projected to be completed as early as 2028.
I see that it is in the pre-application process…don’t know how long that will take. Terra Power and X-energy are two others that are making headway, but I don’t know the status of their application progress. And there are others. Its a long process to get through design, approval, permitting, funding, prototype construction. No guarantee that any of these will eventually make good priced electricity. Prototype funding and proof of operating viability first.
Also, as far as I know all of the designs plan to use fuel that is currently made only in Russia- high assay low enriched uranium (HALEU) fuel. A western source will need to be developed. That is expensive to ramp up- it looks like X-energy recently got selected by DOE for the task-
https://www.power-eng.com/nuclear/x-energy-to-produce-haleu-fuel-for-advanced-nuclear-reactors/
Hickory
Any idea of why Russia would be making this special fuel. Do they use it for some specific function or is it a by product of some other process?
I don’t know.
Ovi, Russia just about owns the international nuclear space, including the SMR’s that are so vigorously debated. Sometime after Chernobyl, they established Rosatom, which is their iteration of an atomic energy commission, except it exercises plenty of muscle building nuclear plants for other countries and supplies a great deal of the feedstock to the U.S.
Go to Rosatomnewsletter.com for a day-to-day. I’m no fan of Russia, but they operate this like a giant corporation, a one-stop shop, which it most definitely is. I believe Rosatom is state-owned, like Gazprom. It’s hard not to be impressed by them.
If we’re all suspicious that Russian oil and gas is on the wane, you can be sure that they are aware–Russia is nothing without energy sales. In that vein, they’re very rapidly becoming the world’s leader in nuclear build-out jobs, clean-up and disposal.
I’ve been told that there are several U.S. companies that are trying to get licensed or up and going in the production of SMR’s–it’s not a colloquial concept discussed at cocktail parties but is bantered about in energy circles–but it’s a tough row to hoe. Russia has always had a cavalier attitude toward nuclear so it’s no big puzzle to them. As for the HALEU, the rumor is that they are using materials from Chernobyl, along with low-energy feedstock. Whatever, you can bet it’s Machiavellian and very profitable.
Nuclear is sort of like fertilizer–it’s dirty and dangerous and easy to farm out if you’re a white-shoes country. So, Russia pretty well controls much of the fertilizer market and also the nuclear. To put it mildly, the world went to sleep.
Gerry
Thanks. Not happy to hear we will get out fuel from Russia if the Ontario plant is built.
What about the Megatons to Megawatts program, is it still running?
(I would guess not, and don´t know, but one would hope since it´s the lesser of two evils in my view)
TRISO fuel is crap. No one is knowing how to reprocess it and during operations it evolves badly (the uranium core pierces the layers of the envelope and the fission products end up contaminating the graphite matrix enclosing the triso fuel micorbeads). All the experimental reactors that have used it have reached dead ends. What is done with x-energy is just an x-th attempt to use this fuel and will end in the same dead end as before. It would be more useful to put uranium in a metalic medium and to enclose the metalic rods such obtained in fuel rods made of silicon carbide composites to avoid the classical chemical interactions of the fission products with the zirconium oxide alloys.
Permian average well profiles from 2017 to 2023 for the top 5 Permian producers (Conoco Philips, Diamondback, Exxon Mobil, Occidental, and Pioneer Natural Resources). These are not normalized for lateral length, I do not have access to the data to do that chart.
As a group these 5 companies produced about 36% of Permian output in March 2023 and operated about 15 thousand of 43 thousand wells in Permian Basin. About 32 thousand wells were completed from Jan 2017 to July 2023 by all operating companies in the Permian basin, with about 11 thousand of these wells completed by the top 5 producers.
although the initial 12 to 24 months are getting better each year, the bending after 24 months are certainly pointing to a roof at~400K BO?
Sheng wu,
Yes my estimate for the average Permian well in 2020 is about 430 kbo over roughly 14 years with cumulative output at 10 years at about 400 kbo and daily output at the end of 10 years at about 26 bopd.
Does anyone know what proportion of the production of all those 43000 wells leaves on site storage by pipeline and what gets picked up by trucks? I’m amusing myself thinking of the fleet of electric trucks running around texas picking up stripper well production in the future 🙂 cheers phil
From OilPrice:
Small Nuclear Reactor Pioneers Give Up the Ghost. The first US company with an approved design for a small-scale nuclear reactor NuScale Power (NYSE:SMR) has cancelled its Carbon Free Power Project in Idaho due to cost overruns and generation breakeven levels surging to almost $90 per MWh.
***Again, these look exceptionally promising–if you can believe Rosatom, which is a state-owned Russian company. And they literally own this space so far. It was appear that they are lightyears ahead of anyone else in the SMR’s. Maybe I’m biased, but these seem like the cat’s meow if they can be done for reasonable cost of electricity. They are small enough that an accident wouldn’t be catastrophic and large enough to power a small city.
90 $ per Mwh doesn’t sound that expensive compared with wind and solar.
If you need a 100 MW plant with wind and solar, you need to build
– A 100 MW solar installation (often not much wind when there is sun)
– A 100 MW wind installation (often not much sun when there is wind, and at night)
and a 100 MW backup (both can be near 0 the same time). Cheapest is a natural gas power plant, more expensive are battery and hydrogen backup storage (you’ll need both most likely). When going this way you need the in the installation to ensure filling these backups.
All together it won’t come cheap, too. And the hydrogen storage is at the same state as the modular nuclear reactor – planned but not build in reality yet.
Here in Europe many wind projects are busting at the moment, too, or getting huge state money injections because of runaway costs. Why should nuclear plants be better here. Everything complex is getting expensive at the moment. Only oil gets cheap.
PS: I’m paying 400 Euros per Mwh as an enduser at the moment, flat basic fee. So 90 doesn’t sound expensive for me.
Eulen
You so clearly explained why the emperor has no clothes. Well done.
“if they can be done for reasonable cost of electricity.”
That is a big question at this point. The NuScale project was just too expensive for utilities to partner with, even with the Fed government reportedly putting up over 1/2 of the cost. The initial prototype unit deployment is a huge financial hurdle, not necessarily indicative of the ultimate performance and financial viability.
I’ve been watching NuScales progress for 20 years now. Its been quite a lesson to see how long the process has taken, and now to see the roadblock despite being the first with approval and permits. Don’t be surprised if they find a new location/partners for initial deployment.
You may find this other development to be of interest, re-posted from the other thread-
Geothermal energy production looks like it may be on the verge of big growth (courtesy of oil and gas industry drilling technology).
Excellent interview with one of the guys pioneering this new phase…worth the listen
https://podcasts.apple.com/us/podcast/columbia-energy-exchange/id1081481629?i=1000634032650
https://fervoenergy.com/
Perhaps the wrong thread, but what about the use of ground source or rock source heatpumps in the US/Canada?
Ground source, 3 feet deep collector tube in the lawn is quite efficient even here at 66N at the old house so should work in Minnesota, Alberta etc. So why haven´t such systems caught wind over there? (No pun intended)
For beginners, there´s three main types of heat collection for a heatpump, Air, Ground or Rock. Actually it´s four, also Sea but that´s heavily regulated in Europe for some reason…
So in essence, since everyone is having an AC, why don´t you use it for heating when it´s cold?
To keep it somewhat on topic, you could get 2-4x the home warmth energy for each natgas cubic feet from the CHP or oz. of U235 at the nuclear plant. (District heating is also a good thing, hence CHP)
And insulate!
Absolutely.
Laplander
Even if it could well be the wrong thread, it is well worth paying attention to ground heat pumps and air to air heat pumps. If you could justify the investment in circulating water through a pipe to create a 3-4 degrees temperature differential, the heat pump will do the rest for you. I have examples of people with very limited maintenance needs 40 years after installing a ground based heat pump. The question is when to shift the heat pump, but the pipe in the ground is holding up very well it seems. A big difference is if you have to drill 20-50 meters or 150-200 meters for the 3-4 degree temperature diffential. Heat pumps works well now to up to -20 degrees. Even if the longevity is not quite like ground based heat pumps some places I would argue, it is promoted as the best choice overall. Electricity driven heat pumps solves a lot of the heating issues in the Nordic region together with proper insulation. So your question if this applies to Canada and North US as well is warranted I guess.
Rig and Frac Report for November 10
Rigs Up. Fracs Down
– US Hz Rigs were up 3 to 446
– Permian rigs were up 2 to 294. Texas Permian was flat while NM added 2 to 93. Of the 2 in NM, 3 went to Eddy county while Lea dropped 1 to 54. In Texas, Midland added 1 and Martin dropped 1
– Eagle Ford was unchanged at 47
– NG was down 1 to 104 (not shown)
Fracs Down 2 to 268
One year ago, 295 Fracs were operating, 27 more than this week.
Exxon exits Iraq.
https://www.iraqoilreport.com/news/exxonmobil-finalizes-deal-to-exit-west-qurna-1-46158/
New posts are up
https://peakoilbarrel.com/eia-short-term-energy-outlook-and-tight-oil-update-november-2023/
and
https://peakoilbarrel.com/open-thread-non-petroleum-november-11-2023/